A Supervised Machine Learning Approach to Detect the On/Off State in Parkinson’s Disease Using Wearable Based Gait Signals

 ,
,  , , and
Abstract
:1. Introduction
2. Related Work
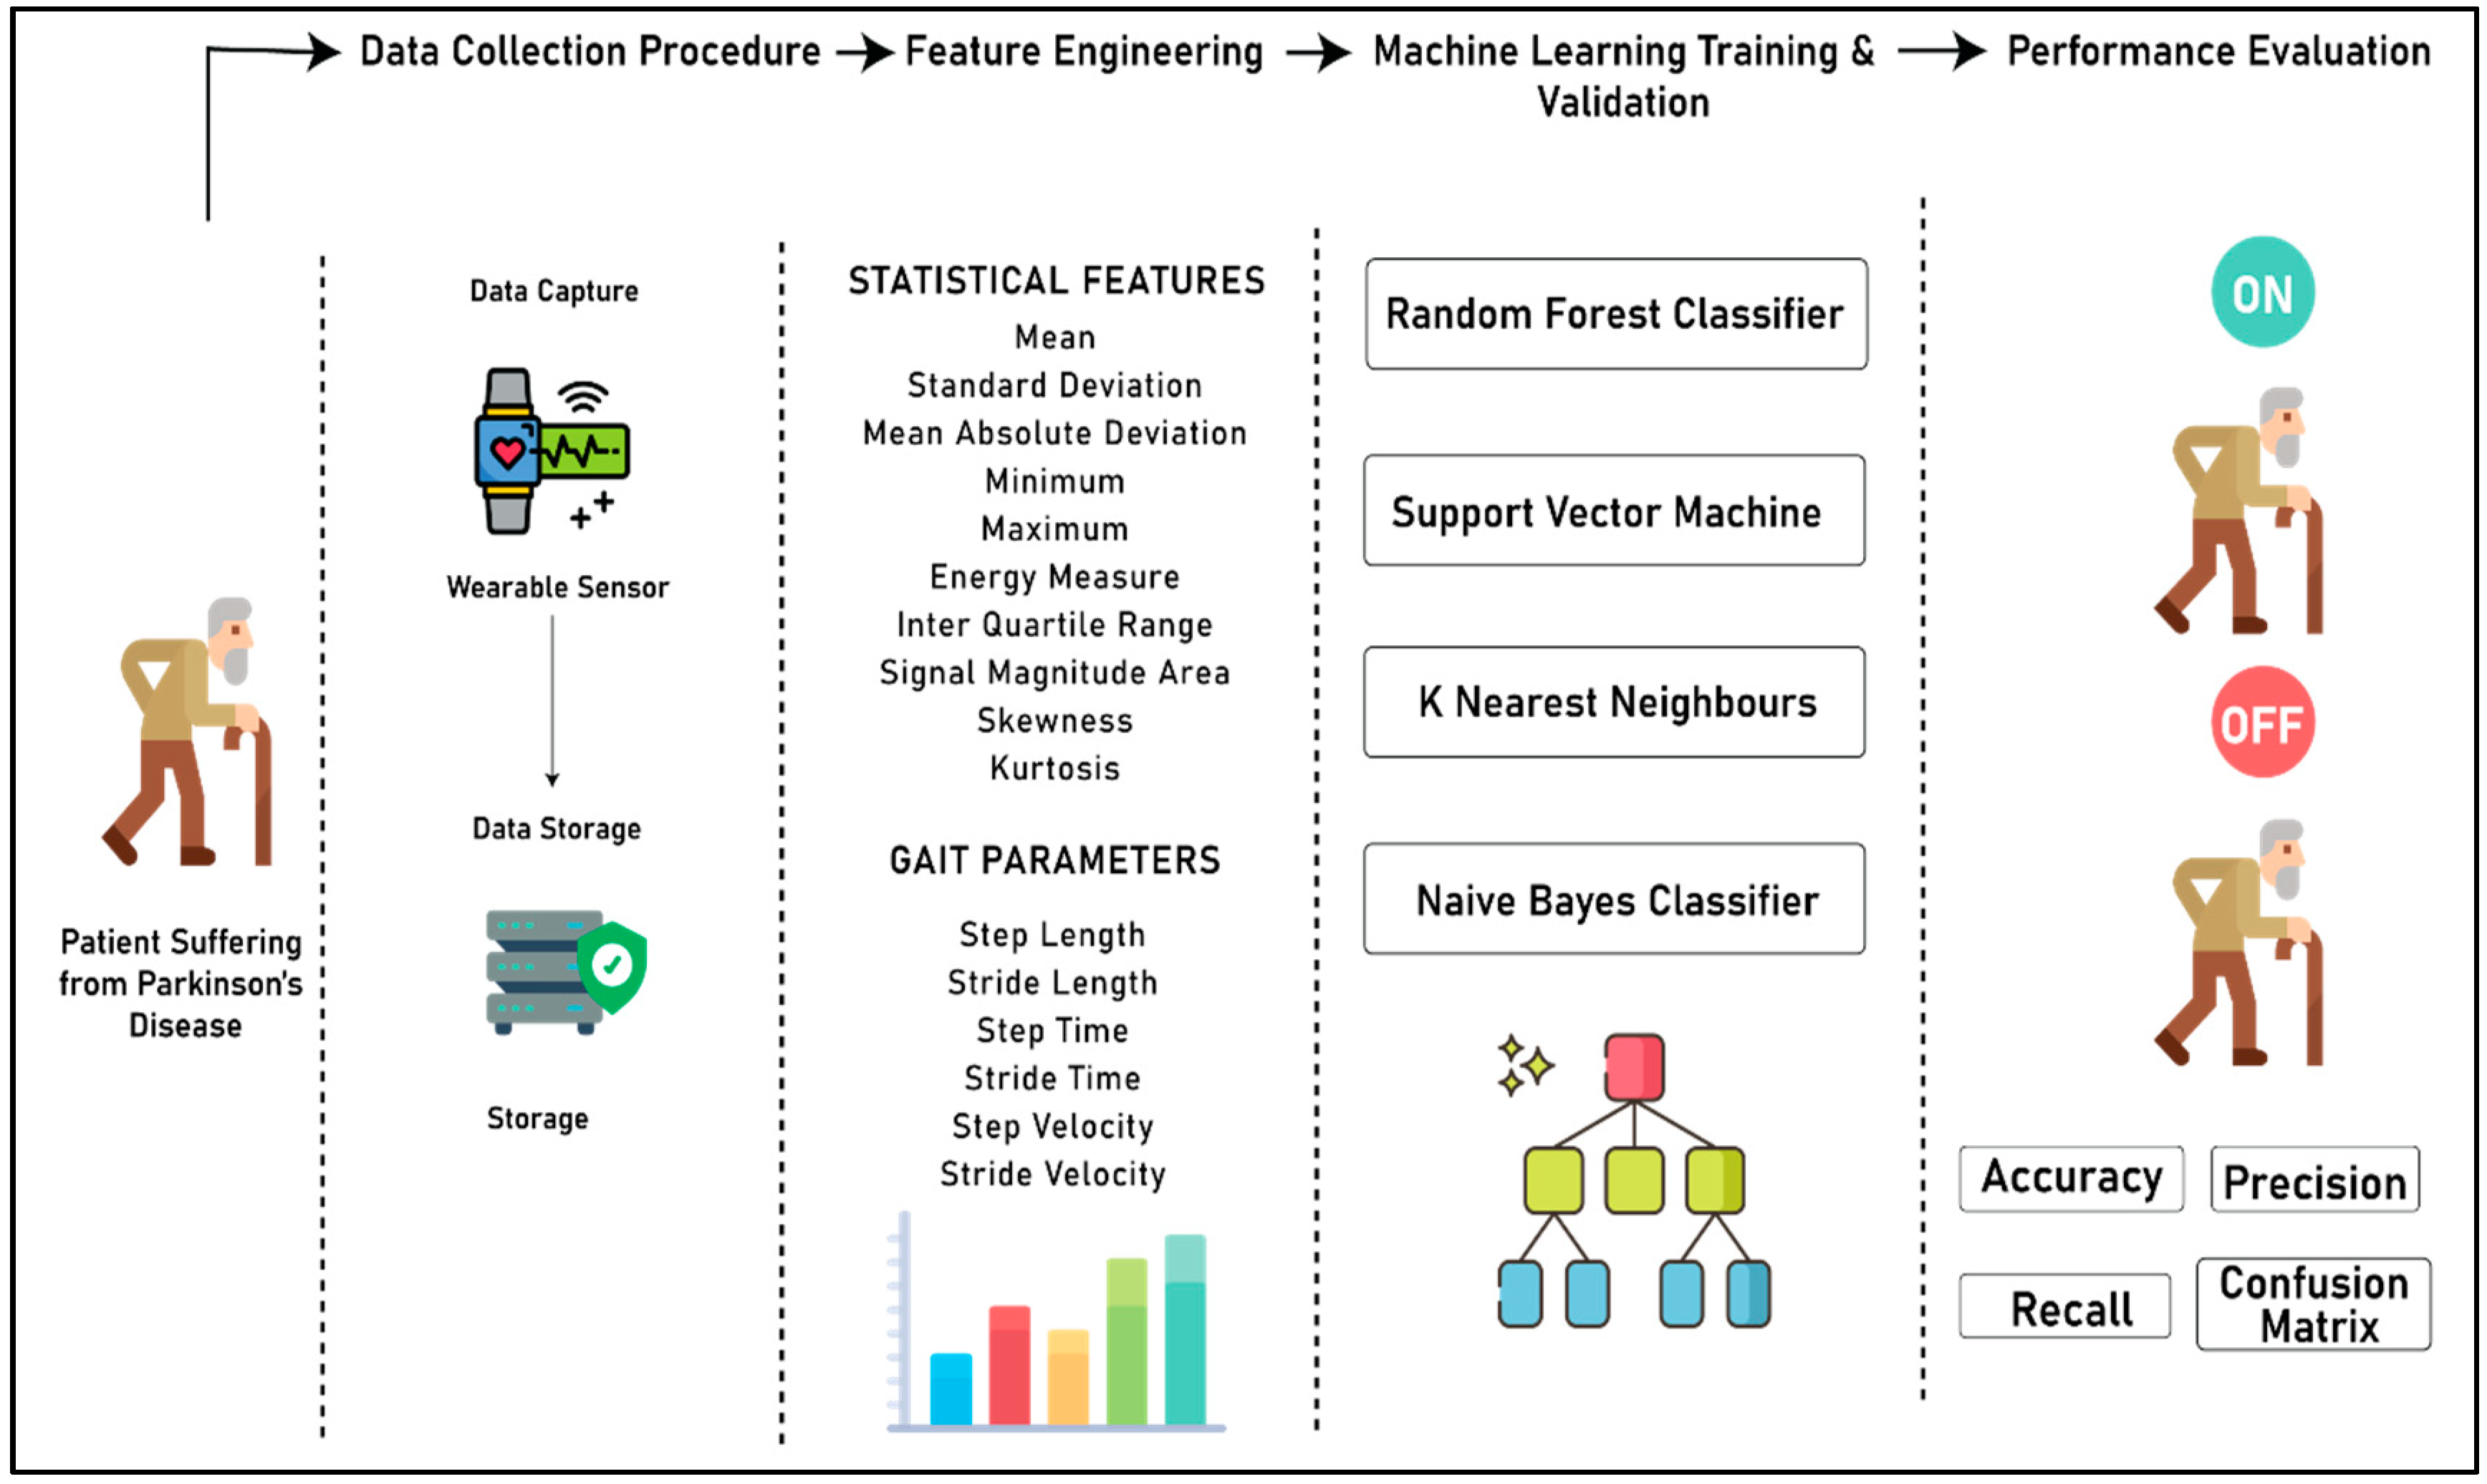
3. Materials and Methods
3.1. Study Design and Subjects
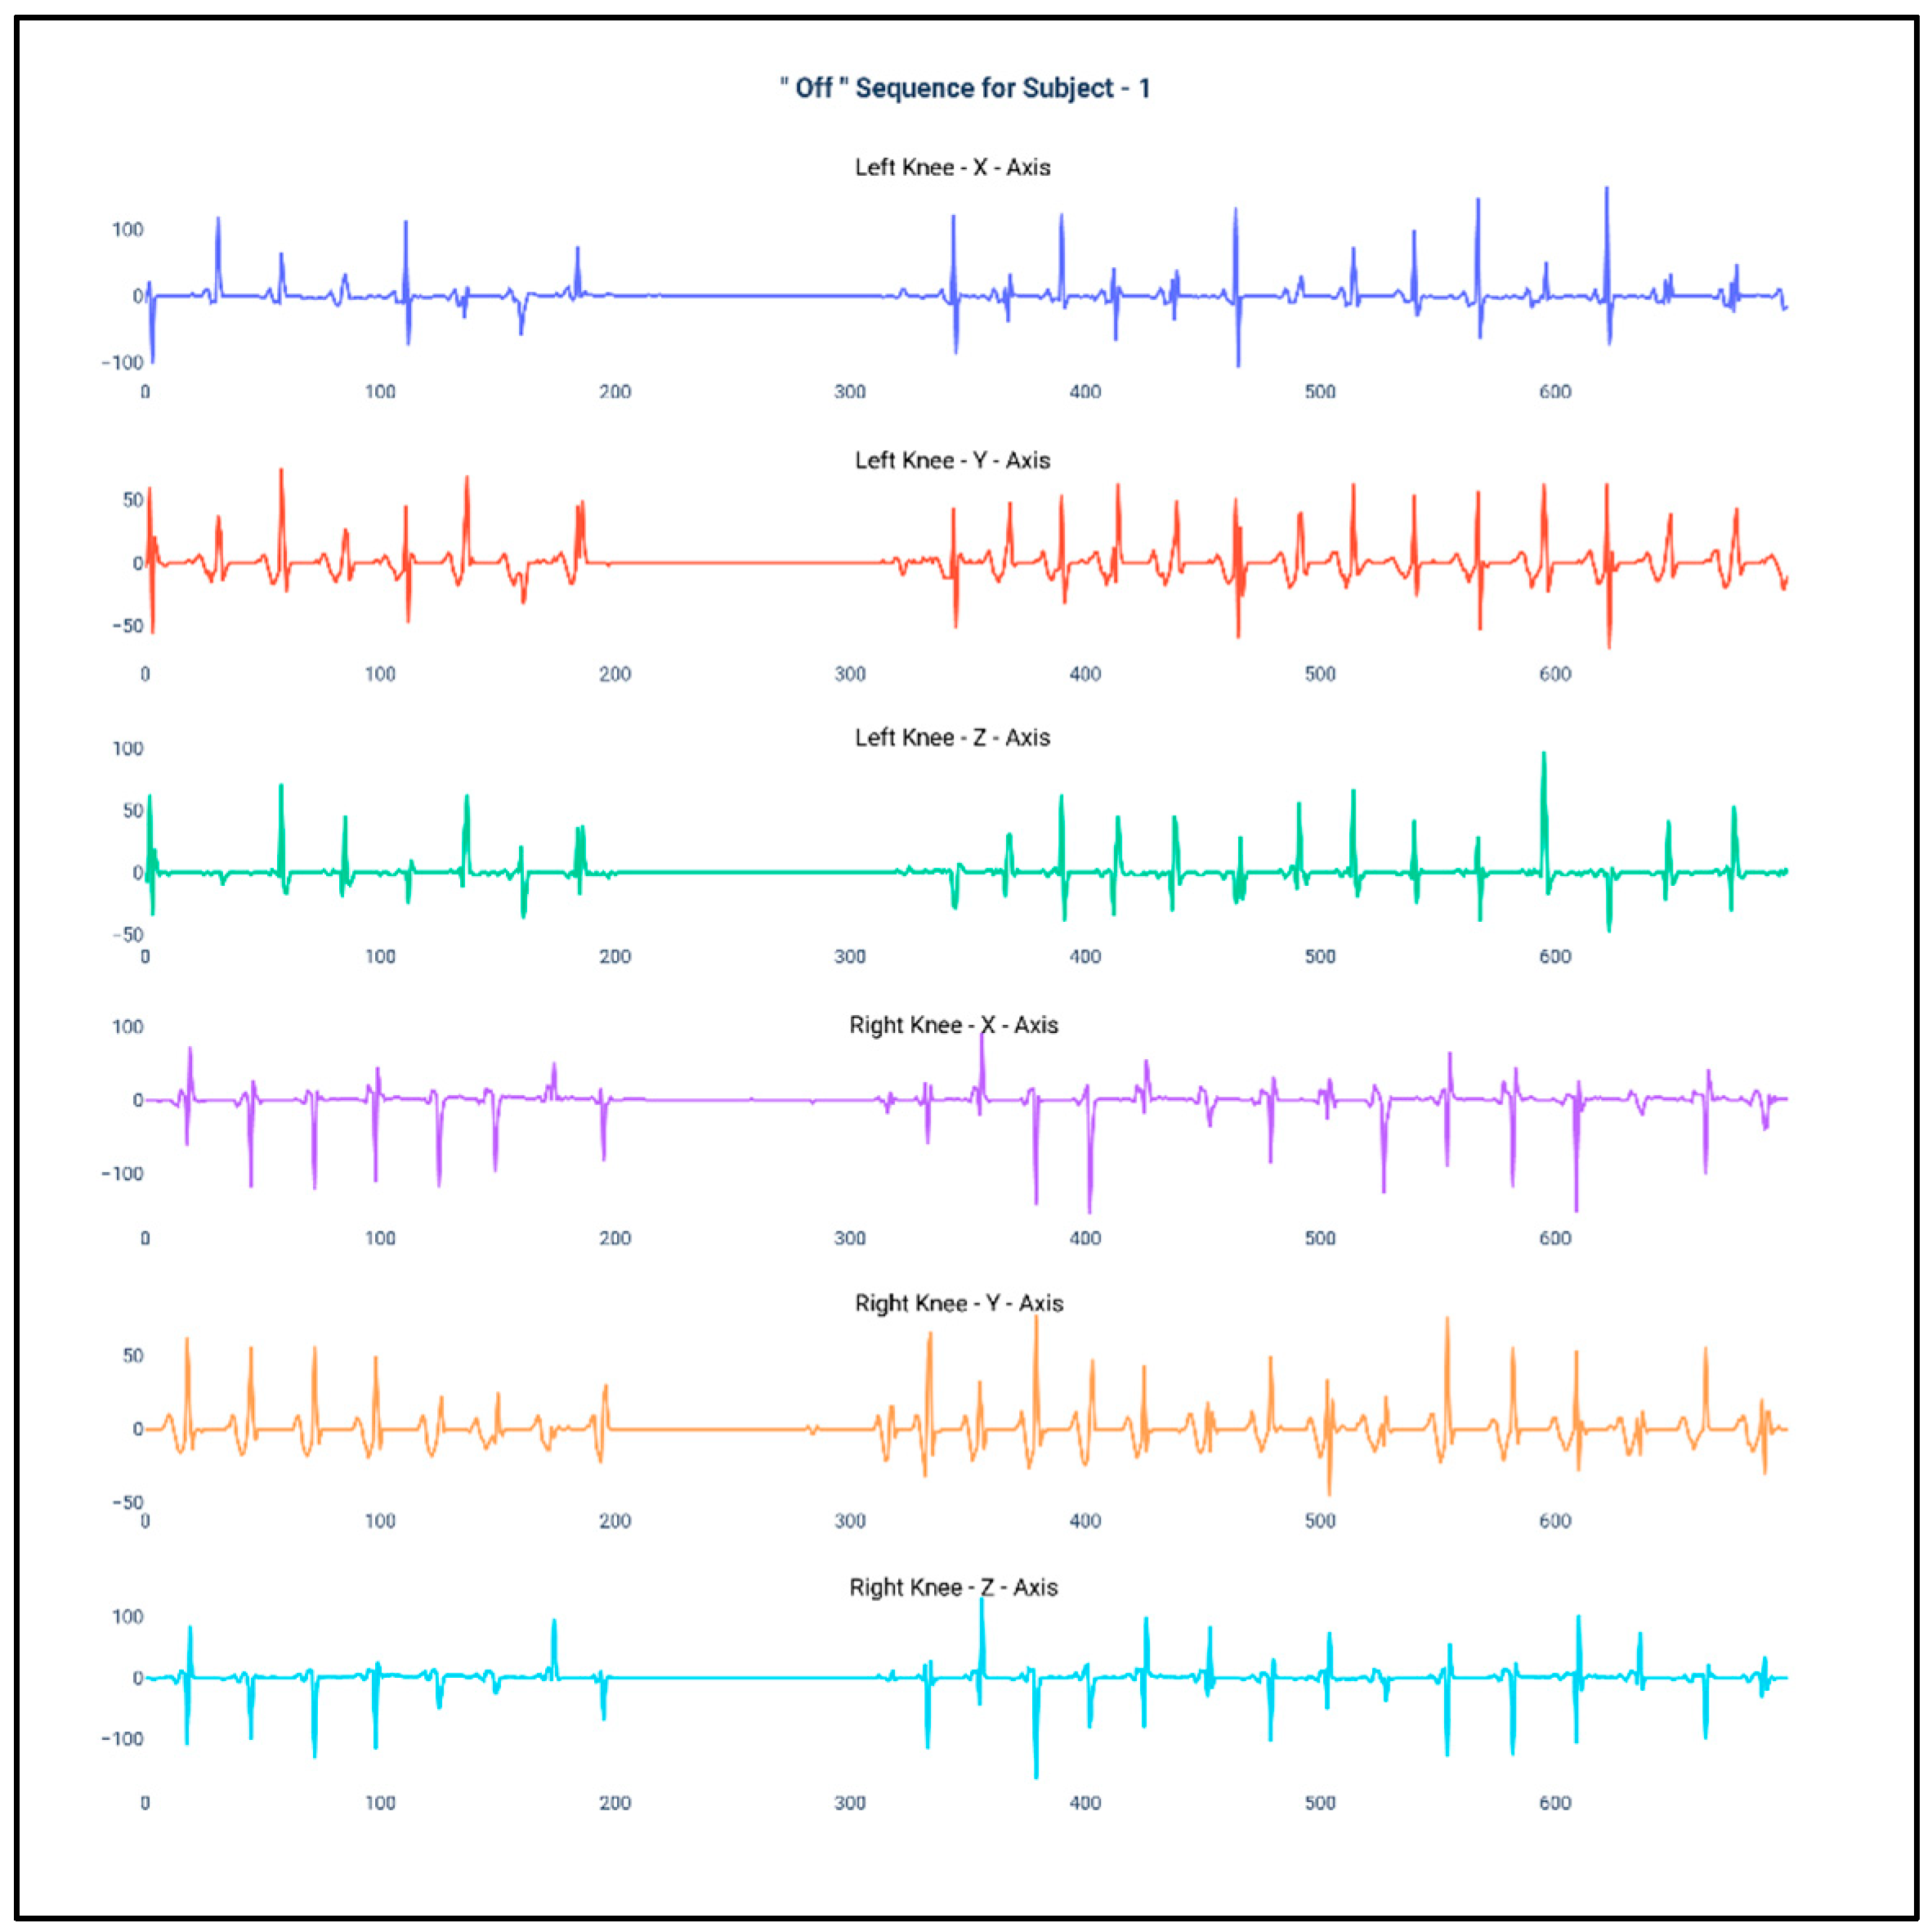
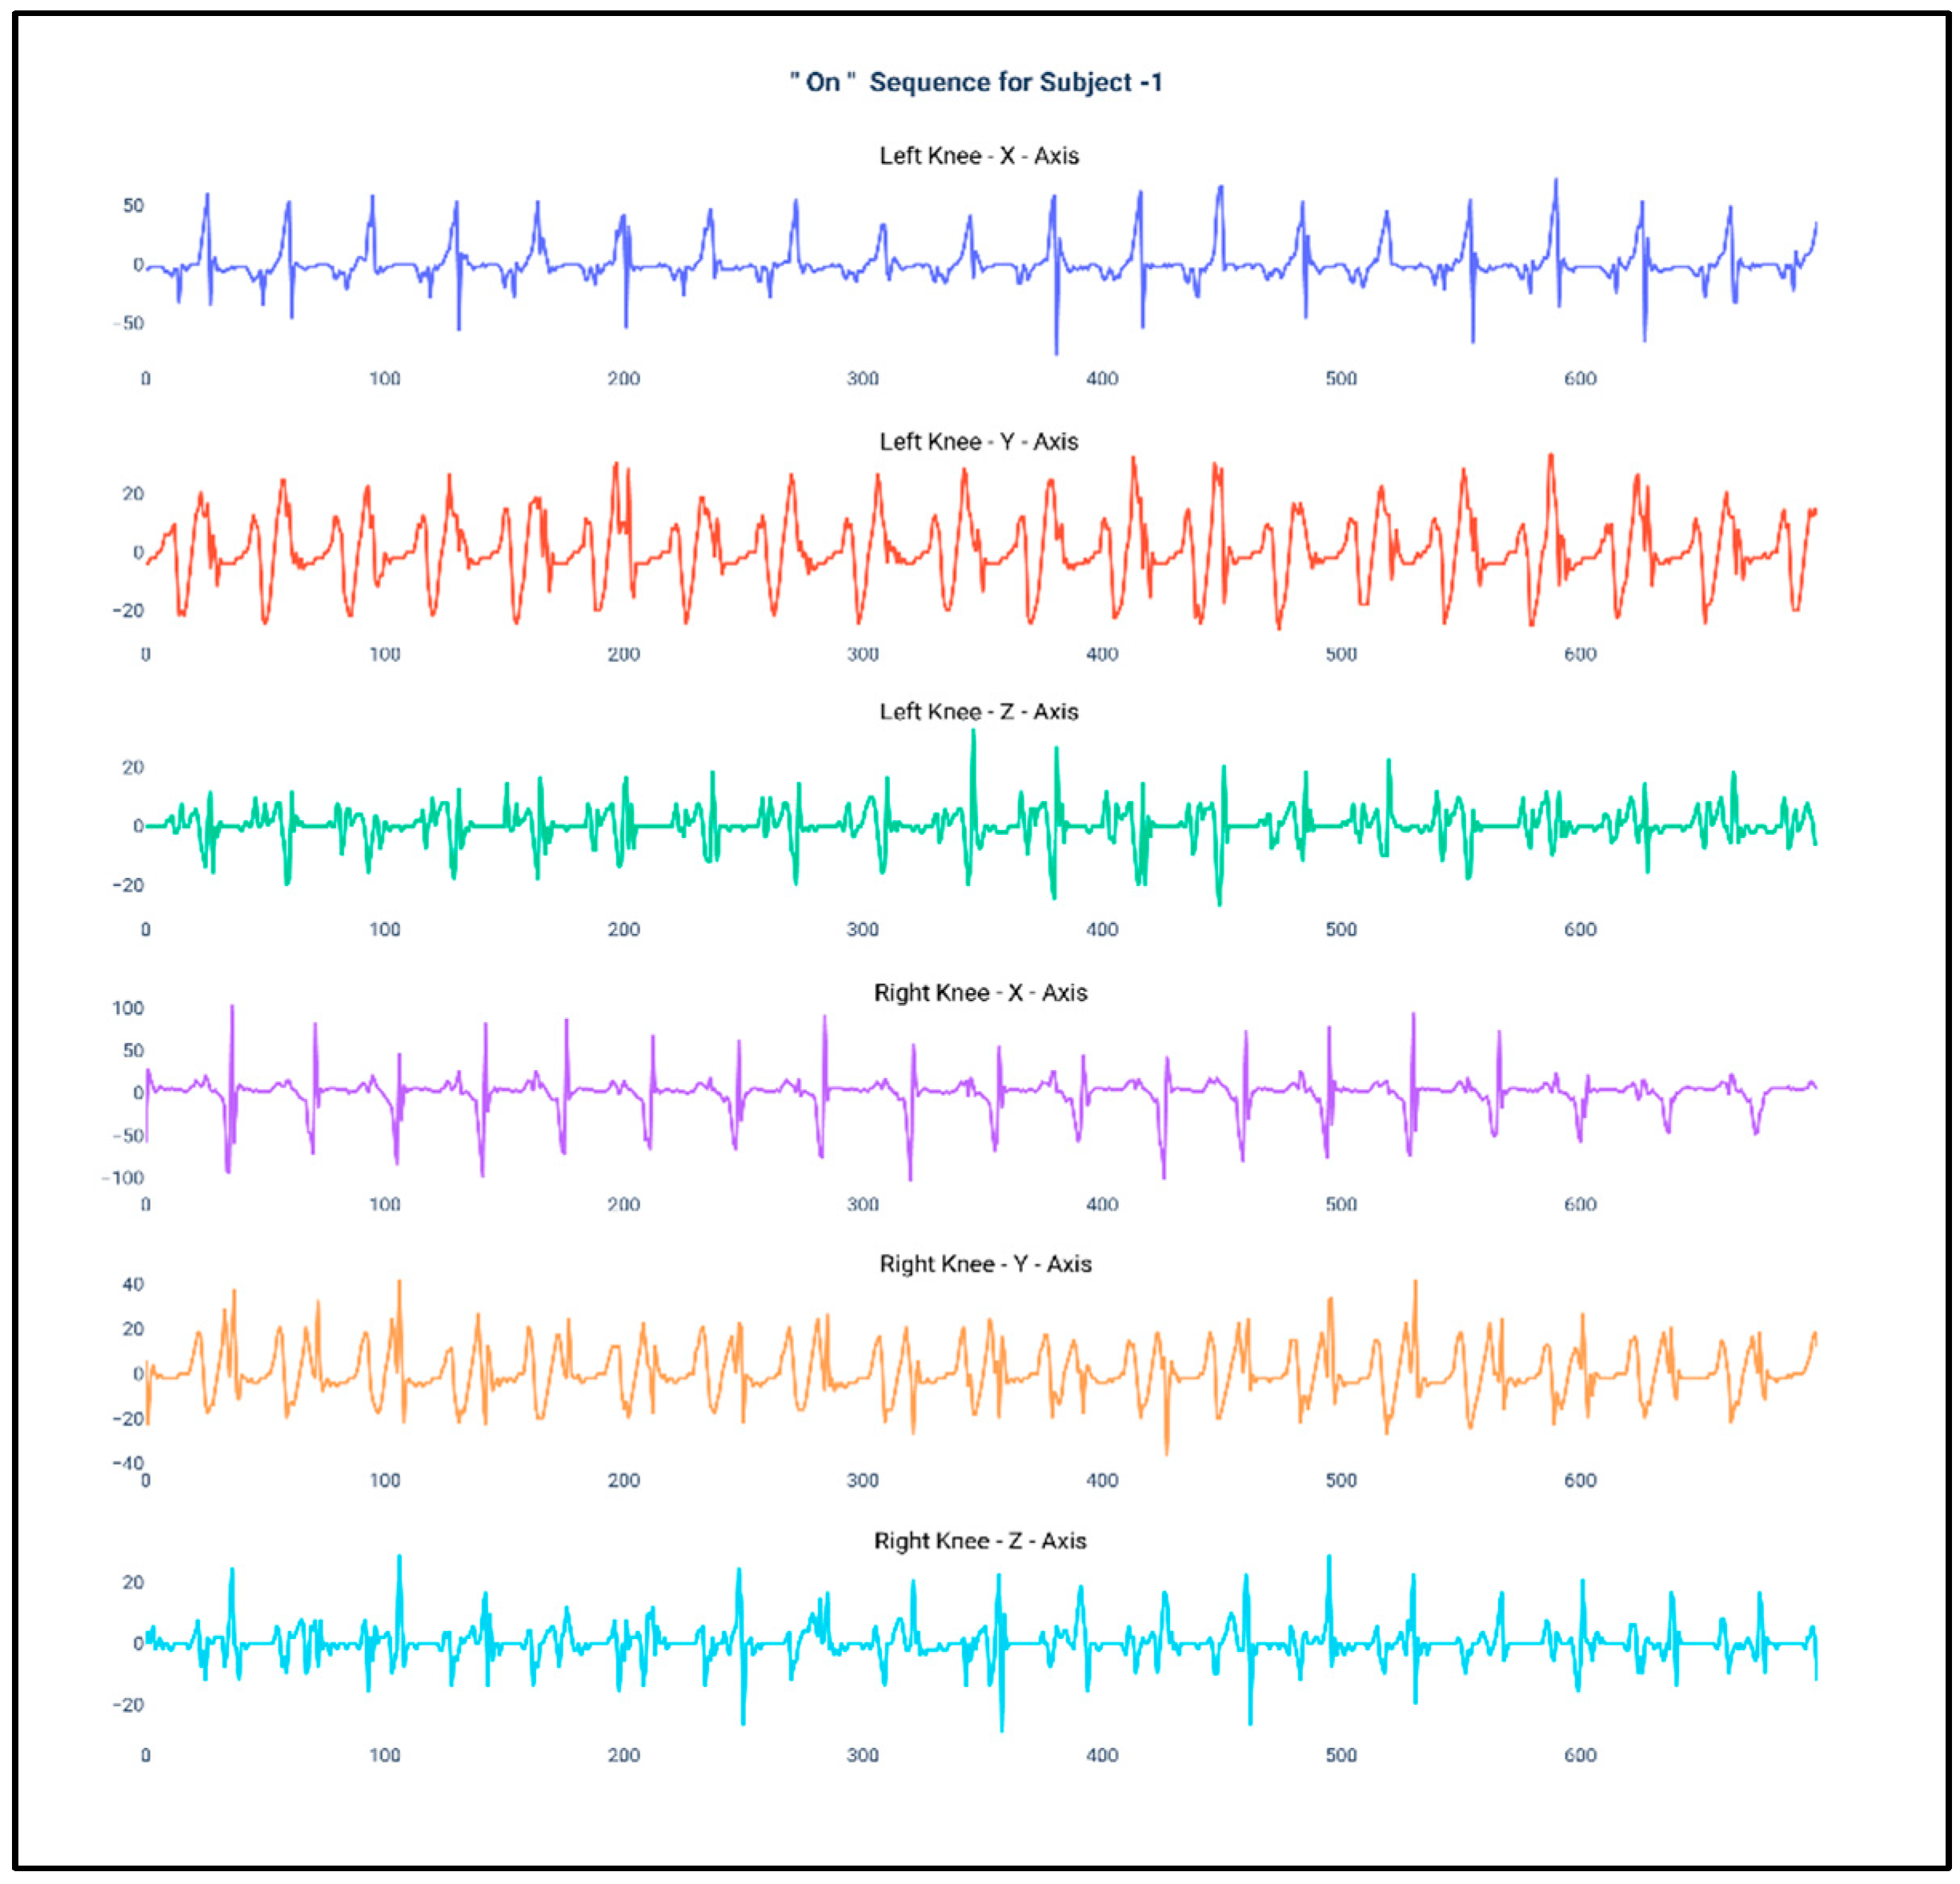
3.2. Data Collection and Experimental Procedure
3.3. Feature Engineering
3.4. Machine Learning Algorithm and Evaluation Metrics
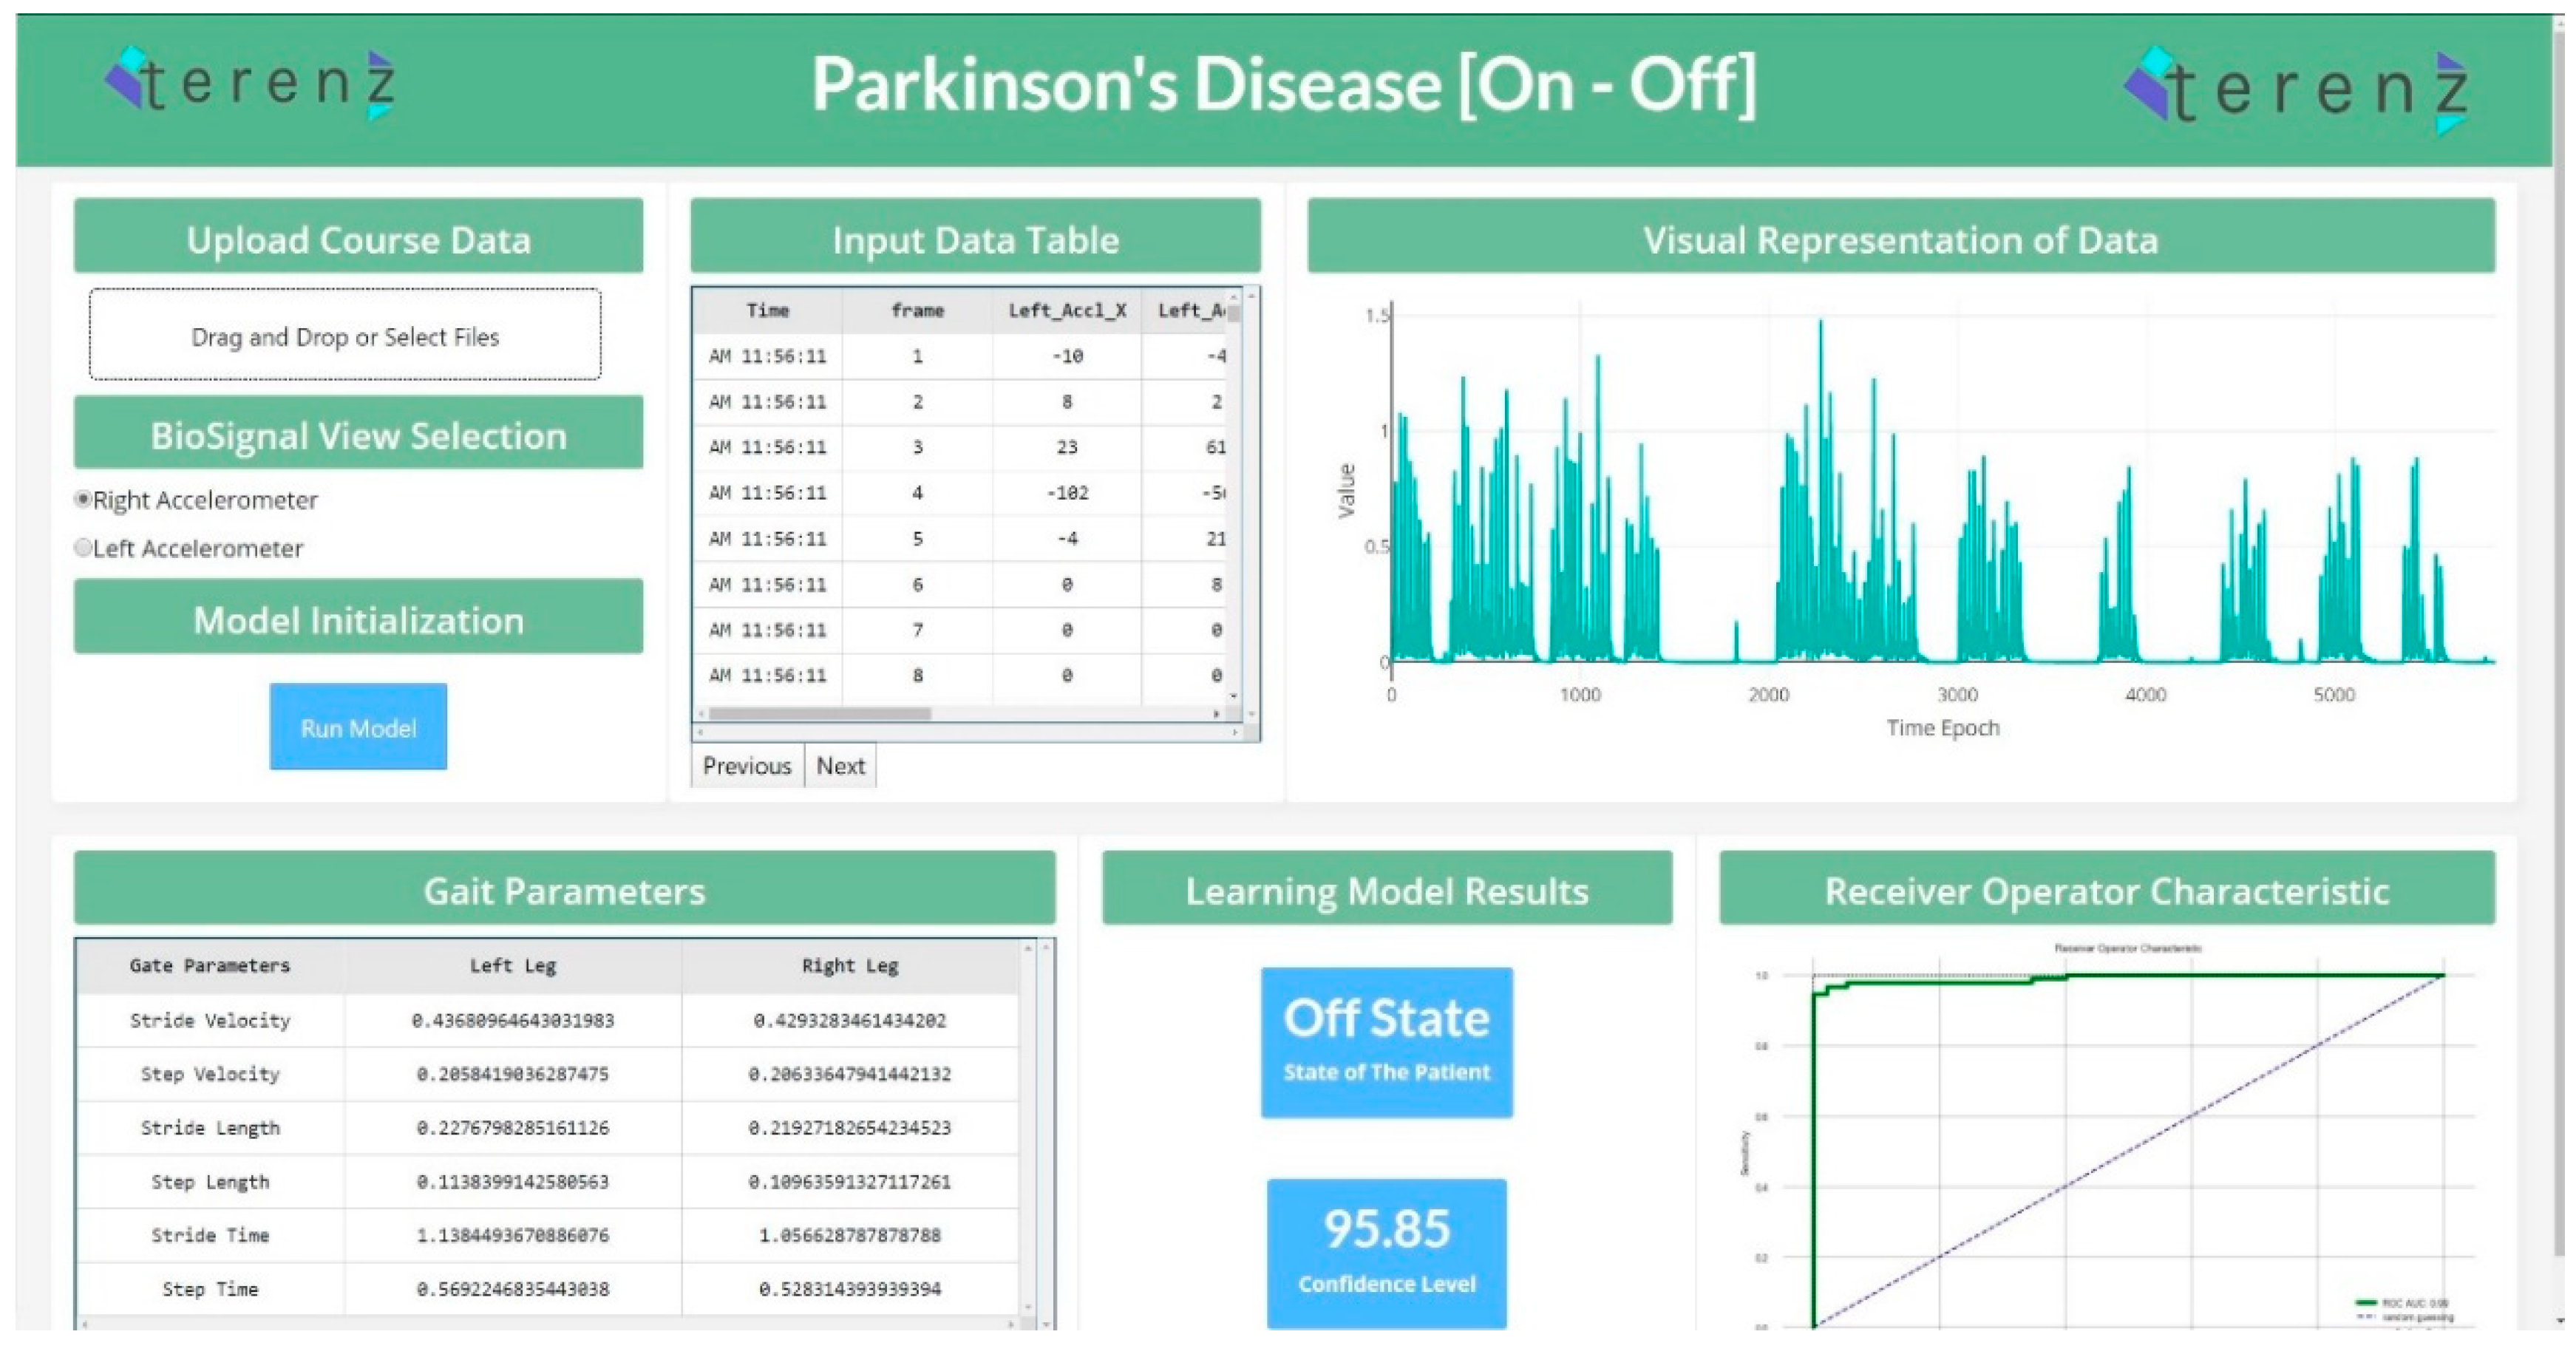
3.5. Web Application for the “On”/“Off” State Detection System
4. Results
5. Discussion
- If the patient is in the “On” state but the model predicts it as the “Off” state (Type I error), then the doctor might conclude that the patient is in the “Off” state and his gait paramters are fine, and it might result in wrongly reducing the medicinal dosage.
- If the patient is in the “Off” state but the model predicts it as the “On” state (Type II error), then the doctor might conclude that the patients is in the “On” state and his gait parameters are still very low, and it might result in wrongly increasing the medicinal dosage.
6. Conclusions
Author Contributions
Funding
Conflicts of Interest
References
- Magrinelli, F.; Picelli, A.; Tocco, P.; Federico, A.; Roncari, L.; Smania, N.; Zanette, G.; Tamburin, S. Pathophysiology of motor dysfunction in Parkinson’s disease as the rationale for drug treatment and rehabilitation. Parkinson’s Dis. 2016, 2016. [Google Scholar] [CrossRef] [PubMed] [Green Version]
- Tugwell, C. Parkinson’s Disease in Focus; Pharmaceutical Press: London, UK, 2008; p. 237. [Google Scholar]
- Lonini, L.; Dai, A.; Shawen, N.; Simuni, T.; Poon, C.; Shimanovich, L.; Daeschler, M.; Ghaffari, R.; Rogers, J.A.; Jayaraman, A. Wearable sensors for Parkinson’s disease: Which data are worth collecting for training symptom detection models. NPJ Digit. Med. 2018, 1, 1–8. [Google Scholar] [CrossRef] [PubMed]
- Titova, N.; Martinez-Martin, P.; Katunina, E.; Chaudhuri, K.R. Advanced Parkinson’s or “complex phase” Parkinson’s disease? Re-evaluation is needed. J. Neural Transm. 2017, 124, 1529–1537. [Google Scholar] [CrossRef] [PubMed] [Green Version]
- Ouma, S.; Fukae, J.; Fujioka, S.; Yamamoto, S.; Hatano, T.; Yoritaka, A.; Okuma, Y.; Kashihara, K.I.; Hattori, N.; Tsuboi, Y. The Risk Factors for the Wearing-off Phenomenon in Parkinson’s Disease in Japan: A Cross-sectional, Multicenter Study. Intern. Med. 2017, 56, 1961–1966. [Google Scholar] [CrossRef] [PubMed] [Green Version]
- Kovosi, S.; Freeman, M. Administering medications for Parkinson disease on time. Nursing2019 2011, 41, 66. [Google Scholar] [CrossRef]
- Freitas, M.E.; Hess, C.W.; Fox, S.H. Motor complications of dopaminergic medications in Parkinson’s disease. In Seminars in Neurology; Thieme Medical Publishers: New York, NY, USA, 2017; Volume 37, pp. 147–157. [Google Scholar]
- Xie, C.L.; Wang, W.W.; Zhang, S.F.; Gan, J.; Liu, Z.G. Continuous dopaminergic stimulation (CDS)-based treatment in Parkinson’s disease patients with motor complications: A systematic review and meta-analysis. Sci. Rep. 2014, 4, 6027. [Google Scholar] [CrossRef] [Green Version]
- Pistacchi, M.; Gioulis, M.; Sanson, F.; Marsala, S.Z. Wearing off: A complex phenomenon often poorly recognized in Parkinson’s disease. A study with the WOQ-19 questionnaire. Neurol. India 2017, 65, 1271. [Google Scholar] [CrossRef]
- Mantese, C.E.; Schumacher-Schuh, A.; Rieder, C.R. Clinimetrics of the 9-and 19-Item Wearing-Off Questionnaire: A systematic review. Parkinson’s Dis. 2018, 2018. [Google Scholar] [CrossRef] [Green Version]
- Ossig, C.; Antonini, A.; Buhmann, C.; Classen, J.; Csoti, I.; Falkenburger, B.; Schwarz, M.; Winkler, J.; Storch, A. Wearable sensor-based objective assessment of motor symptoms in Parkinson’s disease. J. Neural Transm. 2016, 123, 57–64. [Google Scholar] [CrossRef]
- Beck, Y.; Herman, T.; Brozgol, M.; Giladi, N.; Mirelman, A.; Hausdorff, J.M. SPARC: A new approach to quantifying gait smoothness in patients with Parkinson’s disease. J. Neuroeng. Rehabil. 2018, 15, 49. [Google Scholar] [CrossRef]
- Hssayeni, M.D.; Jimenez-Shahed, J.; Burack, M.A.; Ghoraani, B. Wearable Sensors for Estimation of Parkinsonian Tremor Severity during Free Body Movements. Sensors 2019, 19, 4215. [Google Scholar] [CrossRef] [PubMed] [Green Version]
- Aich, S.; Pradhan, P.M.; Park, J.; Kim, H.C. A machine learning approach to distinguish Parkinson’s disease (PD) patient’s with shuffling gait from older adults based on gait signals using 3D motion analysis. Int. J. Eng. Technol. 2018, 7, 153–156. [Google Scholar] [CrossRef]
- Aich, S.; Joo, M.I.; Kim, H.C.; Park, J. Improvisation of classification performance based on feature optimization for differentiation of Parkinson’s disease from other neurological diseases using gait characteristics. Int. J. Electr. Comput. Eng. 2019, 9. [Google Scholar] [CrossRef]
- Aich, S.; Choi, K.W.; Pradhan, P.M.; Park, J.; Kim, H.C. A Performance Comparison Based on Machine Learning Approaches to Distinguish Parkinson’s Disease from Alzheimer Disease Using Spatiotemporal Gait signals. Adv. Sci. Lett. 2018, 24, 2058–2062. [Google Scholar] [CrossRef]
- Khodakarami, H.; Ricciardi, L.; Contarino, M.F.; Pahwa, R.; Lyons, K.E.; Geraedts, V.J.; Morgante, F.; Leake, A.; Paviour, D.; De Angelis, A.; et al. Prediction of the Levodopa Challenge Test in Parkinson’s Disease Using Data from a Wrist-Worn Sensor. Sensors 2019, 19, 5153. [Google Scholar] [CrossRef] [PubMed] [Green Version]
- Rehman, R.Z.U.; Del Din, S.; Shi, J.Q.; Galna, B.; Lord, S.; Yarnall, A.J.; Guan, Y.; Rochester, L. Comparison of Walking Protocols and Gait Assessment Systems for Machine Learning-Based Classification of Parkinson’s Disease. Sensors 2019, 19, 5363. [Google Scholar] [CrossRef] [Green Version]
- Keijsers, N.L.; Horstink, M.W.; Gielen, S.C. Ambulatory motor assessment in Parkinson’s disease. Mov. Disord. Off. J. Mov. Disord. Soc. 2006, 21, 34–44. [Google Scholar] [CrossRef] [Green Version]
- Jeon, H.; Lee, W.; Park, H.; Lee, H.J.; Kim, S.K.; Kim, H.B.; Jeon, B.; Park, K.S. Automatic classification of tremor severity in Parkinson’s disease using a wearable device. Sensors 2017, 17, 2067. [Google Scholar] [CrossRef] [Green Version]
- Samà, A.; Pérez-López, C.; Rodríguez-Martín, D.; Català, A.; Moreno-Aróstegui, J.M.; Cabestany, J.; de Mingo, E.; Rodríguez-Molinero, A. Estimating bradykinesia severity in Parkinson’s disease by analysing gait through a waist-worn sensor. Comput. Biol. Med. 2017, 84, 114–123. [Google Scholar]
- Aich, S.; Pradhan, P.M.; Park, J.; Sethi, N.; Vathsa, V.S.S.; Kim, H.C. A validation study of freezing of gait (FoG) detection and machine-learning-based FoG prediction using estimated gait characteristics with a wearable accelerometer. Sensors 2018, 18, 3287. [Google Scholar] [CrossRef] [Green Version]
- Steinmetzer, T.; Maasch, M.; Bönninger, I.; Travieso, C.M. Analysis and Classification of Motor Dysfunctions in Arm Swing in Parkinson’s Disease. Electronics 2019, 8, 1471. [Google Scholar] [CrossRef] [Green Version]
- Naghavi, N.; Miller, A.; Wade, E. Towards Real-Time Prediction of Freezing of Gait in Patients With Parkinson’s Disease: Addressing the Class Imbalance Problem. Sensors 2019, 19, 3898. [Google Scholar] [CrossRef] [PubMed] [Green Version]
- Baraka, A.; Shaban, H.; Abou El-Nasr, M.; Attallah, O. Wearable Accelerometer and sEMG-Based Upper Limb BSN for Tele-Rehabilitation. Appl. Sci. 2019, 9, 2795. [Google Scholar] [CrossRef] [Green Version]
- De Vos, M.; Prince, J.; Buchanan, T.; FitzGerald, J.J.; Antoniades, C.A. Discriminating progressive supranuclear palsy from Parkinson’s disease using wearable technology and machine learning. Gait Posture 2020, 77, 257–263. [Google Scholar] [CrossRef]
- Ashour, A.S.; El-Attar, A.; Dey, N.; El-Kader, H.A.; El-Naby, M.M.A. Long short term memory based patient-dependent model for FOG detection in Parkinson’s disease. Pattern Recognit. Lett. 2020, 131, 23–29. [Google Scholar] [CrossRef]
- Senturk, Z.K. Early diagnosis of Parkinson’s disease using machine learning algorithms. Med Hypotheses 2020, 138, 109603. [Google Scholar] [CrossRef]
- Patel, S.; Lorincz, K.; Hughes, R.; Huggins, N.; Growdon, J.; Standaert, D.; Akay, M.; Dy, J.; Welsh, M.; Bonato, P. Monitoring motor fluctuations in patients with Parkinson’s disease using wearable sensors. IEEE Trans. Inf. Technol. Biomed. 2009, 13, 864–873. [Google Scholar] [CrossRef] [Green Version]
- Hoff, J.I.; Van Der Meer, V.; Van Hilten, J.J. Accuracy of objective ambulatory accelerometry in detecting motor complications in patients with Parkinson disease. Clin. Neuropharmacol. 2004, 27, 53–57. [Google Scholar] [CrossRef]
- Rodríguez-Molinero, A.; Samà, A.; Pérez-Martínez, D.A.; López, C.P.; Romagosa, J.; Bayés, À.; Sanz, P.; Calopa, M.; Gálvez-Barrón, C.; de Mingo, E.; et al. Validation of a portable device for mapping motor and gait disturbances in Parkinson’s disease. JMIR Mhealth Uhealth 2015, 3, e9. [Google Scholar]
- Pedregosa, F.; Varoquaux, G.; Gramfort, A.; Michel, V.; Thirion, B.; Grisel, O.; Blondel, M.; Prettenhofer, P.; Weiss, R.; Dubourg, V.; et al. Scikit-learn: Machine learning in Python. J. Mach. Learn. Res. 2011, 12, 2825–2830. [Google Scholar]
- Frazier, P.I. A Tutorial on Bayesian Optimization. 2018. Available online: https://arxiv.org/abs/1807.02811 (accessed on 25 April 2020).
- Osborne, M.A. Bayesian Gaussian Processes for Sequential Prediction, Optimisation and Quadrature. Ph.D. Thesis, Oxford University, Oxford, UK, 2010. [Google Scholar]
- Rovini, E.; Maremmani, C.; Cavallo, F. How wearable sensors can support Parkinson’s disease diagnosis and treatment: A systematic review. Front. Neurosci. 2017, 11, 555. [Google Scholar] [CrossRef] [PubMed]
- Hollman, J.H.; McDade, E.M.; Petersen, R.C. Normative spatiotemporal gait parameters in older adults. Gait Posture 2011, 34, 111–118. [Google Scholar] [CrossRef] [PubMed] [Green Version]
- Azevedo Coste, C.; Sijobert, B.; Pissard-Gibollet, R.; Pasquier, M.; Espiau, B.; Geny, C. Detection of freezing of gait in Parkinson disease: Preliminary results. Sensors 2014, 14, 6819–6827. [Google Scholar] [CrossRef] [PubMed]
- Alcock, L.; Galna, B.; Perkins, R.; Lord, S.; Rochester, L. Step length determines minimum toe clearance in older adults and people with Parkinson’s disease. J. Biomech. 2018, 71, 30–36. [Google Scholar] [CrossRef]
- Schlachetzki, J.C.; Barth, J.; Marxreiter, F.; Gossler, J.; Kohl, Z.; Reinfelder, S.; Gassner, H.; Aminian, K.; Eskofier, B.M.; Winkler, J.; et al. Wearable sensors objectively measure gait parameters in Parkinson’s disease. PLoS ONE 2017, 12. [Google Scholar] [CrossRef]
- Del Din, S.; Godfrey, A.; Rochester, L. Validation of an accelerometer to quantify a comprehensive battery of gait characteristics in healthy older adults and Parkinson’s disease: Toward clinical and at home use. IEEE J. Biomed. Health Inform. 2015, 20, 838–847. [Google Scholar] [CrossRef]
- Aich, S.; Pradhan, P.M.; Chakraborty, S.; Kim, H.C.; Kim, H.T.; Lee, H.G.; Kim, I.H.; Joo, M.I.; Jong Seong, S.; Park, J. Design of a Machine Learning-Assisted Wearable Accelerometer-Based Automated System for Studying the Effect of Dopaminergic Medicine on Gait Characteristics of Parkinson’s Patients. J. Healthc. Eng. 2020, 2020. [Google Scholar] [CrossRef]
- Hssayeni, M.D.; Burack, M.A.; Jimenez-Shahed, J.; Ghoraani, B. Assessment of response to medication in individuals with Parkinson’s disease. Med. Eng. Phys. 2019, 67, 33–43. [Google Scholar] [CrossRef]


| Reference | Input Signals | Features | Classifiers | Outcomes | Performance Indices |
|---|---|---|---|---|---|
| [20] | Accelerometer, gyroscope | Temporal, Spectral features | DT,SVM,DA, RF,k-NN | Accuracy 85.5% | Accuracy, Precision, Recall |
| [21] | Accelerometer | Spatiotemporal features | Support Vector Regression | Accurcay 90% | Accuracy |
| [22] | Accelerometer | Spatiotemporal features | SVM,NB,k-NN,DT | Accuracy 88% | Accuracy |
| [23] | Accelerometer, Gyroscope, Magnetometer | One Dimensional CNN features | CNN | Accuracy 93.4% | Accuracy |
| [24] | Accelerometer | Statistical Features | SVM,k-NN,NLP | Accuracy 97.4% | Accuracy |
| [25] | Accelerometer, Electromyography | Time Domain Features | DT,k-NN,LDA,SVM, Boosted tree Classifier, Bagged Tree Classifier | Accuracy 99.6% | Accuracy |
| [26] | Accelerometer, Gyroscope, Magnetometer | Spatiotemporal features | Logistic Regression and RF | Sensitivity 86% Specificity 90% | Sensitivity, Specificity |
| [27] | Accelerometer | Frequency Domain Features | LSTM,SVM | Accuracy 83.38% | Accuracy |
| [28] | Speech Signals | Voice features | SVM,ANN,CART | Accuracy 93.84% | Accuracy |
| Parameter | Value |
|---|---|
| Age | 60.25 ± 9.54 |
| M/F | 12/8 |
| Disease duration (month) | 144.91 ± 166.71 |
| BMI | 22.87 ± 3.04 |
| Levodopa Equivalent Doses(LEDD) | 985.69 ± 457.49 |
| H&Y stage “On” State | 1.70 ± 0.66 |
| H&Y stage “Off” State | 2.65 ± 0.71 |
| UPDRS part III “On” State | 15.80 ± 10.13 |
| UPDRS part III “Off” State | 36.20 ± 15.06 |
| Feature | Equation | Description |
|---|---|---|
| Mean | The mean of the feature was calculated for each subject for all the samples in each fold, i.e., 320 samples. | |
| Standard Deviation | The standard deviation of the signal is calculated for each subject for all the samples in each fold, i.e., 320 samples. | |
| Median Absolute Deviation | where, is the median of X | The median absolute deviation was calculated each subject for all the samples in each fold, i.e., 320 samples. |
| Minimum | min(X) | The minimum of the signal was for calculated each subject for all the samples in each fold, i.e., 320 samples. |
| Maximum | max(X) | The maximum of the signal was for calculated each subject for all the samples in each fold, i.e., 320 samples. |
| Energy Measure | The energy measure of the signal was calculated for each subject based on all the samples in each fold, i.e., 320 samples. | |
| Inter Quartile Range | The interquartile range was calculated on each subject by considering each fold that is 320 samples of data as the complete set. | |
| Signal Magnitude Area | The signal magnitude area is been calculated by considering all the axis of the accelerometer and gyroscope and is calculated for each subject by considering the samples in each fold. | |
| Skewness | The skewness for all the samples of a fold for a particular subject was calculated based on the Fisher-Pearson standardized moment coefficient | |
| Kurtosis | The kurtosis (peakedness) is calculated for individual signals. |
| Feature | Description |
|---|---|
| Step Length | The distance between the heel of one foot to the heel of the other foot. |
| Stride Length | The distance covered between two steps, one with each foot |
| Step Time | The time taken by a person for completing one step |
| Stride Time | The time taken by a person to complete one stride length |
| Step Velocity | The speed at which a step length is covered. |
| Stride Velocity | The speed at which a stride length is covered. |
| Classifier | Specifications |
|---|---|
| Random Forest | n_estimators: 500, criterion = ‘gini’, max_depth:8, min_samples_split = 8, min_samples_leaf = 10 |
| Support Vector Machine | kernel = ‘rbf’, degree = 3, gamma = ‘auto_deprecated’, C = 1.0, tol = 0.001, cache_size = 200 |
| K–Nearest Neighbors | n_neighbors = 50, weights = ‘uniform’, algorithm = ‘auto’, leaf_size = 40, p = 2, metric = ‘minkowski’ |
| Naïve Bayes | Gaussian |
| Features | RFC | SVM | KNN | NB |
|---|---|---|---|---|
| Mean (Left Knee) | Used | Removed | Removed | Used |
| Standard Deviation (Left Knee) | Used | Used | Removed | Used |
| Median Absolute Deviation (Left Knee) | Removed | Used | Used | Used |
| Minimum (Left Knee) | Used | Used | Used | Used |
| Maximum (Left Knee) | Used | Removed | Used | Removed |
| Energy Measure (Left Knee) | Used | Used | Used | Used |
| Inter Quartile Range (Left Knee) | Used | Used | Used | Removed |
| Signal Magnitude Area (Left Knee) | Used | Used | Removed | Removed |
| Skewness (Left Knee) | Removed | Removed | Used | Used |
| Kurtosis (Left Knee) | Used | Used | Used | Removed |
| Step Length (Left Knee) | Used | Used | Removed | Used |
| Stride Length (Left Knee) | Removed | Removed | Used | Used |
| Step Time (Left Knee) | Used | Removed | Removed | Used |
| Stride Time (Left Knee) | Removed | Used | Used | Used |
| Step Velocity (Left Knee) | Used | Used | Removed | Used |
| Stride Velocity (Left Knee) | Used | Removed | Used | Used |
| Mean (Right Knee) | Used | Used | Removed | Removed |
| Standard Deviation (Right Knee) | Used | Used | Used | Used |
| Median Absolute Deviation (Right Knee) | Used | Used | Used | Used |
| Minimum (Right Knee) | Removed | Removed | Used | Used |
| Maximum (Right Knee) | Used | Used | Used | Removed |
| Energy Measure (Right Knee) | Used | Removed | Used | Used |
| Inter Quartile Range (Right Knee) | Removed | Used | Removed | Removed |
| Signal Magnitude Area (Right Knee) | Used | Removed | Used | Used |
| Skewness (Right Knee) | Used | Used | Used | Used |
| Kurtosis (Right Knee) | Removed | Used | Used | Used |
| Step Length (Right Knee) | Used | Used | Removed | Removed |
| Stride Length (Right Knee) | Removed | Used | Used | Used |
| Step Time (Right Knee) | Used | Removed | Removed | Removed |
| Stride Time (Right Knee) | Removed | Used | Used | Removed |
| Step Velocity (Right Knee) | Used | Removed | Removed | Used |
| Stride Velocity (Right Knee) | Removed | Used | Used | Removed |
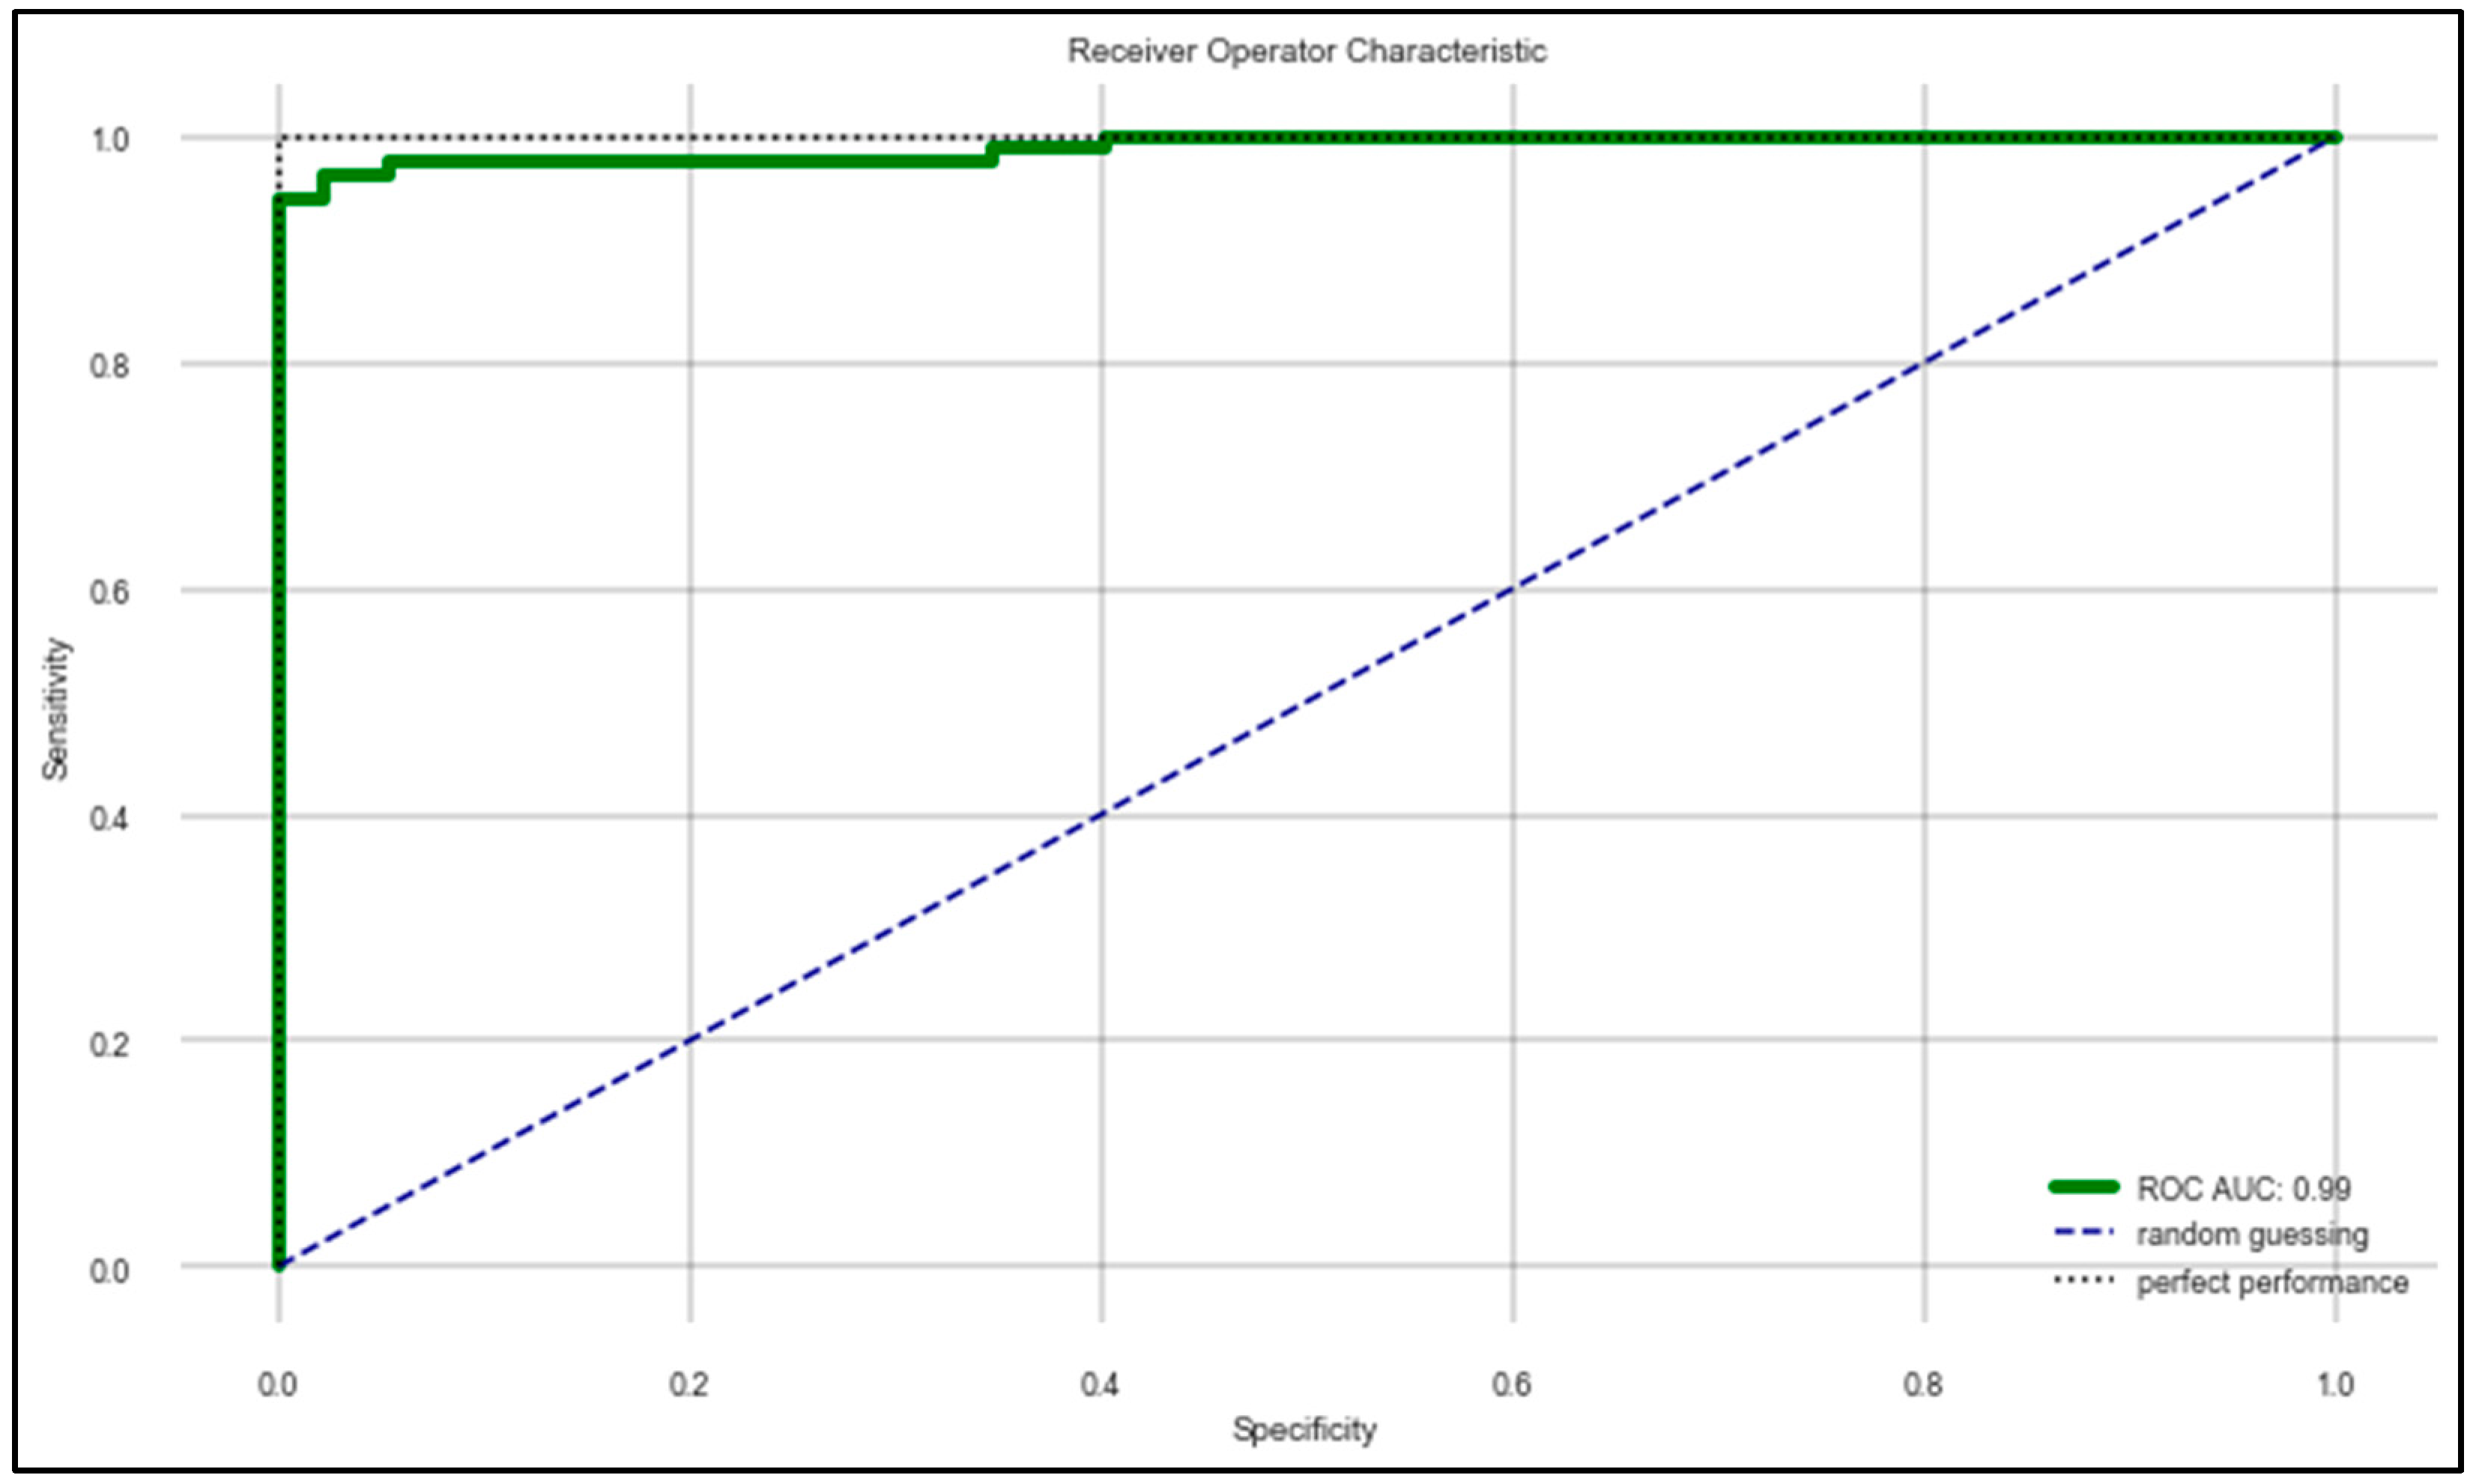
| Classifier | Accuracy | Average Recall | Average Precision | Average F1 Score | ROC–AUC Score | 95% CI Lower Limit | 95% CI Upper Limit | Average Training Time |
|---|---|---|---|---|---|---|---|---|
| RF | 0.96 | 0.97 | 0.96 | 0.97 | 0.99 | 0.95 | 1.0 | 5.46 s |
| SVM | 0.93 | 0.92 | 0.93 | 0.93 | 0.94 | 0.92 | 0.98 | 7.14 s |
| KNN | 0.86 | 0.84 | 0.85 | 0.85 | 0.87 | 0.81 | 0.89 | 0.21 s |
| Naïve Bayes | 0.88 | 0.86 | 0.85 | 0.86 | 0.87 | 0.82 | 0.91 | 0.15 s |
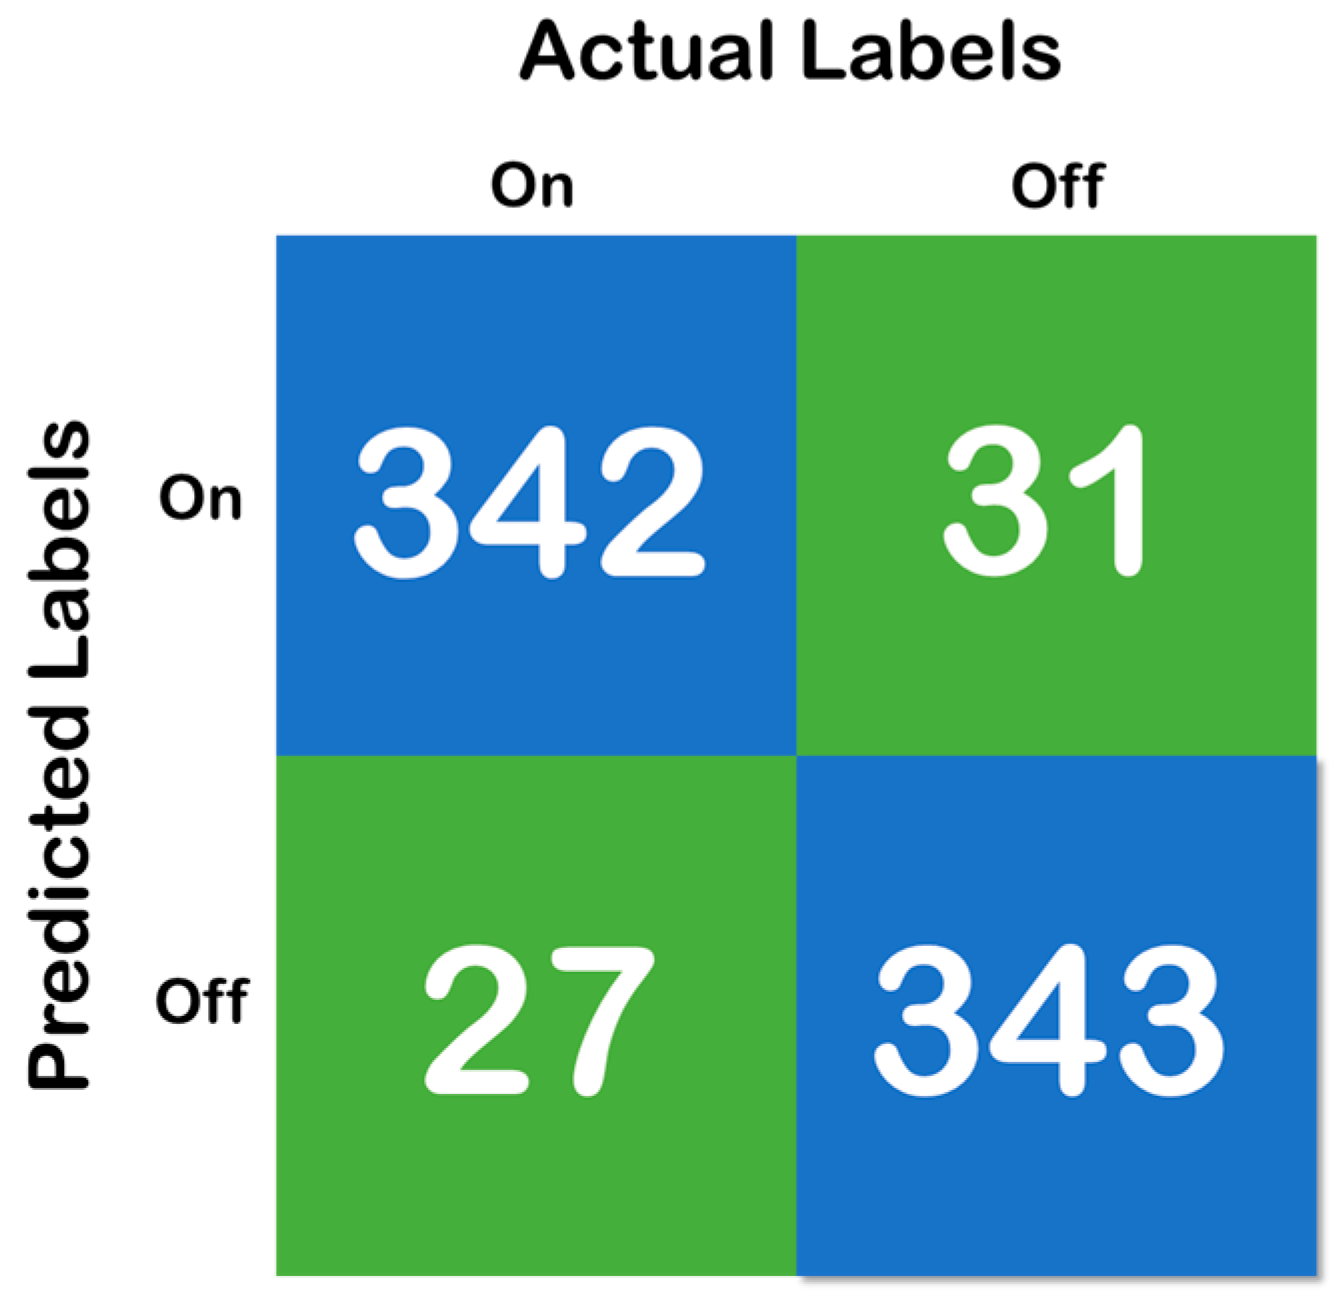
| Test Set | True Positive “On”-“On” | False Positive “On”-“Off” | False Negative “Off”-“On” | True Negative “Off”-“Off” | Total Samples “On”/”Off” | Aggregated Samples (10 s) “On”/“Off” |
|---|---|---|---|---|---|---|
| Subject 1 | 15 | 2 | 1 | 15 | 5370/5217 | 17/16 |
| Subject 2 | 17 | 1 | 1 | 16 | 5774/5471 | 18/17 |
| Subject 3 | 14 | 2 | 1 | 17 | 5138/5883 | 16/18 |
| Subject 4 | 17 | 3 | 2 | 17 | 6264/6214 | 20/19 |
| Subject 5 | 15 | 2 | 2 | 19 | 5508/6749 | 17/21 |
| Subject 6 | 16 | 1 | 1 | 21 | 5438/6883 | 17/22 |
| Subject 7 | 19 | 1 | 2 | 17 | 6282/5972 | 20/19 |
| Subject 8 | 17 | 4 | 1 | 16 | 6640/5347 | 21/17 |
| Subject 9 | 17 | 1 | 2 | 17 | 5845/5987 | 18/19 |
| Subject 10 | 19 | 1 | 2 | 15 | 6321/5465 | 20/17 |
| Subject 11 | 18 | 0 | 1 | 19 | 5792/6321 | 18/20 |
| Subject 12 | 17 | 1 | 2 | 19 | 5795/6784 | 18/21 |
| Subject 13 | 19 | 2 | 1 | 15 | 6795/5039 | 21/16 |
| Subject 14 | 13 | 1 | 2 | 19 | 4499/6742 | 14/21 |
| Subject 15 | 19 | 1 | 0 | 17 | 6461/5398 | 20/17 |
| Subject 16 | 21 | 2 | 0 | 17 | 7293/5418 | 23/17 |
| Subject 17 | 14 | 2 | 2 | 18 | 5007/6472 | 16/20 |
| Subject 18 | 20 | 1 | 1 | 18 | 6608/6128 | 21/19 |
| Subject 19 | 16 | 1 | 2 | 16 | 5510/5890 | 17/18 |
| Subject 20 | 20 | 2 | 1 | 15 | 6912/5128 | 22/16 |
| Total | 342 | 31 | 27 | 343 | 119,252/118,508 | 373/370 |
| Author | Objective | Location of Sensors | Accuracy (%) |
|---|---|---|---|
| Our Work | “On”/“Off” detection | Knee | 96.72 |
| Aich et al. [22] | “FoG”/“No FoG” detection | Knee | 88.00 |
| Aich et al. [41] | PD/HOG classification | Knee | 88.46 |
| Hssayeni et al. [42] | “On”/“Off” detection | Wrist and Ankle | 90.50 |
| Rehman et al. [18] | PD/HC classification | Lower back | 87.83 |
© 2020 by the authors. Licensee MDPI, Basel, Switzerland. This article is an open access article distributed under the terms and conditions of the Creative Commons Attribution (CC BY) license (http://creativecommons.org/licenses/by/4.0/).
Share and Cite
Aich, S.; Youn, J.; Chakraborty, S.; Pradhan, P.M.; Park, J.-h.; Park, S.; Park, J. A Supervised Machine Learning Approach to Detect the On/Off State in Parkinson’s Disease Using Wearable Based Gait Signals. Diagnostics 2020, 10, 421. https://doi.org/10.3390/diagnostics10060421
Aich S, Youn J, Chakraborty S, Pradhan PM, Park J-h, Park S, Park J. A Supervised Machine Learning Approach to Detect the On/Off State in Parkinson’s Disease Using Wearable Based Gait Signals. Diagnostics. 2020; 10(6):421. https://doi.org/10.3390/diagnostics10060421
Chicago/Turabian StyleAich, Satyabrata, Jinyoung Youn, Sabyasachi Chakraborty, Pyari Mohan Pradhan, Jin-han Park, Seongho Park, and Jinse Park. 2020. "A Supervised Machine Learning Approach to Detect the On/Off State in Parkinson’s Disease Using Wearable Based Gait Signals" Diagnostics 10, no. 6: 421. https://doi.org/10.3390/diagnostics10060421