The Application of Structural Retinal Biomarkers to Evaluate the Effect of Intravitreal Ranibizumab and Dexamethasone Intravitreal Implant on Treatment of Diabetic Macular Edema

 ,
,  and
and
Abstract
:1. Introduction
2. Materials and Methods
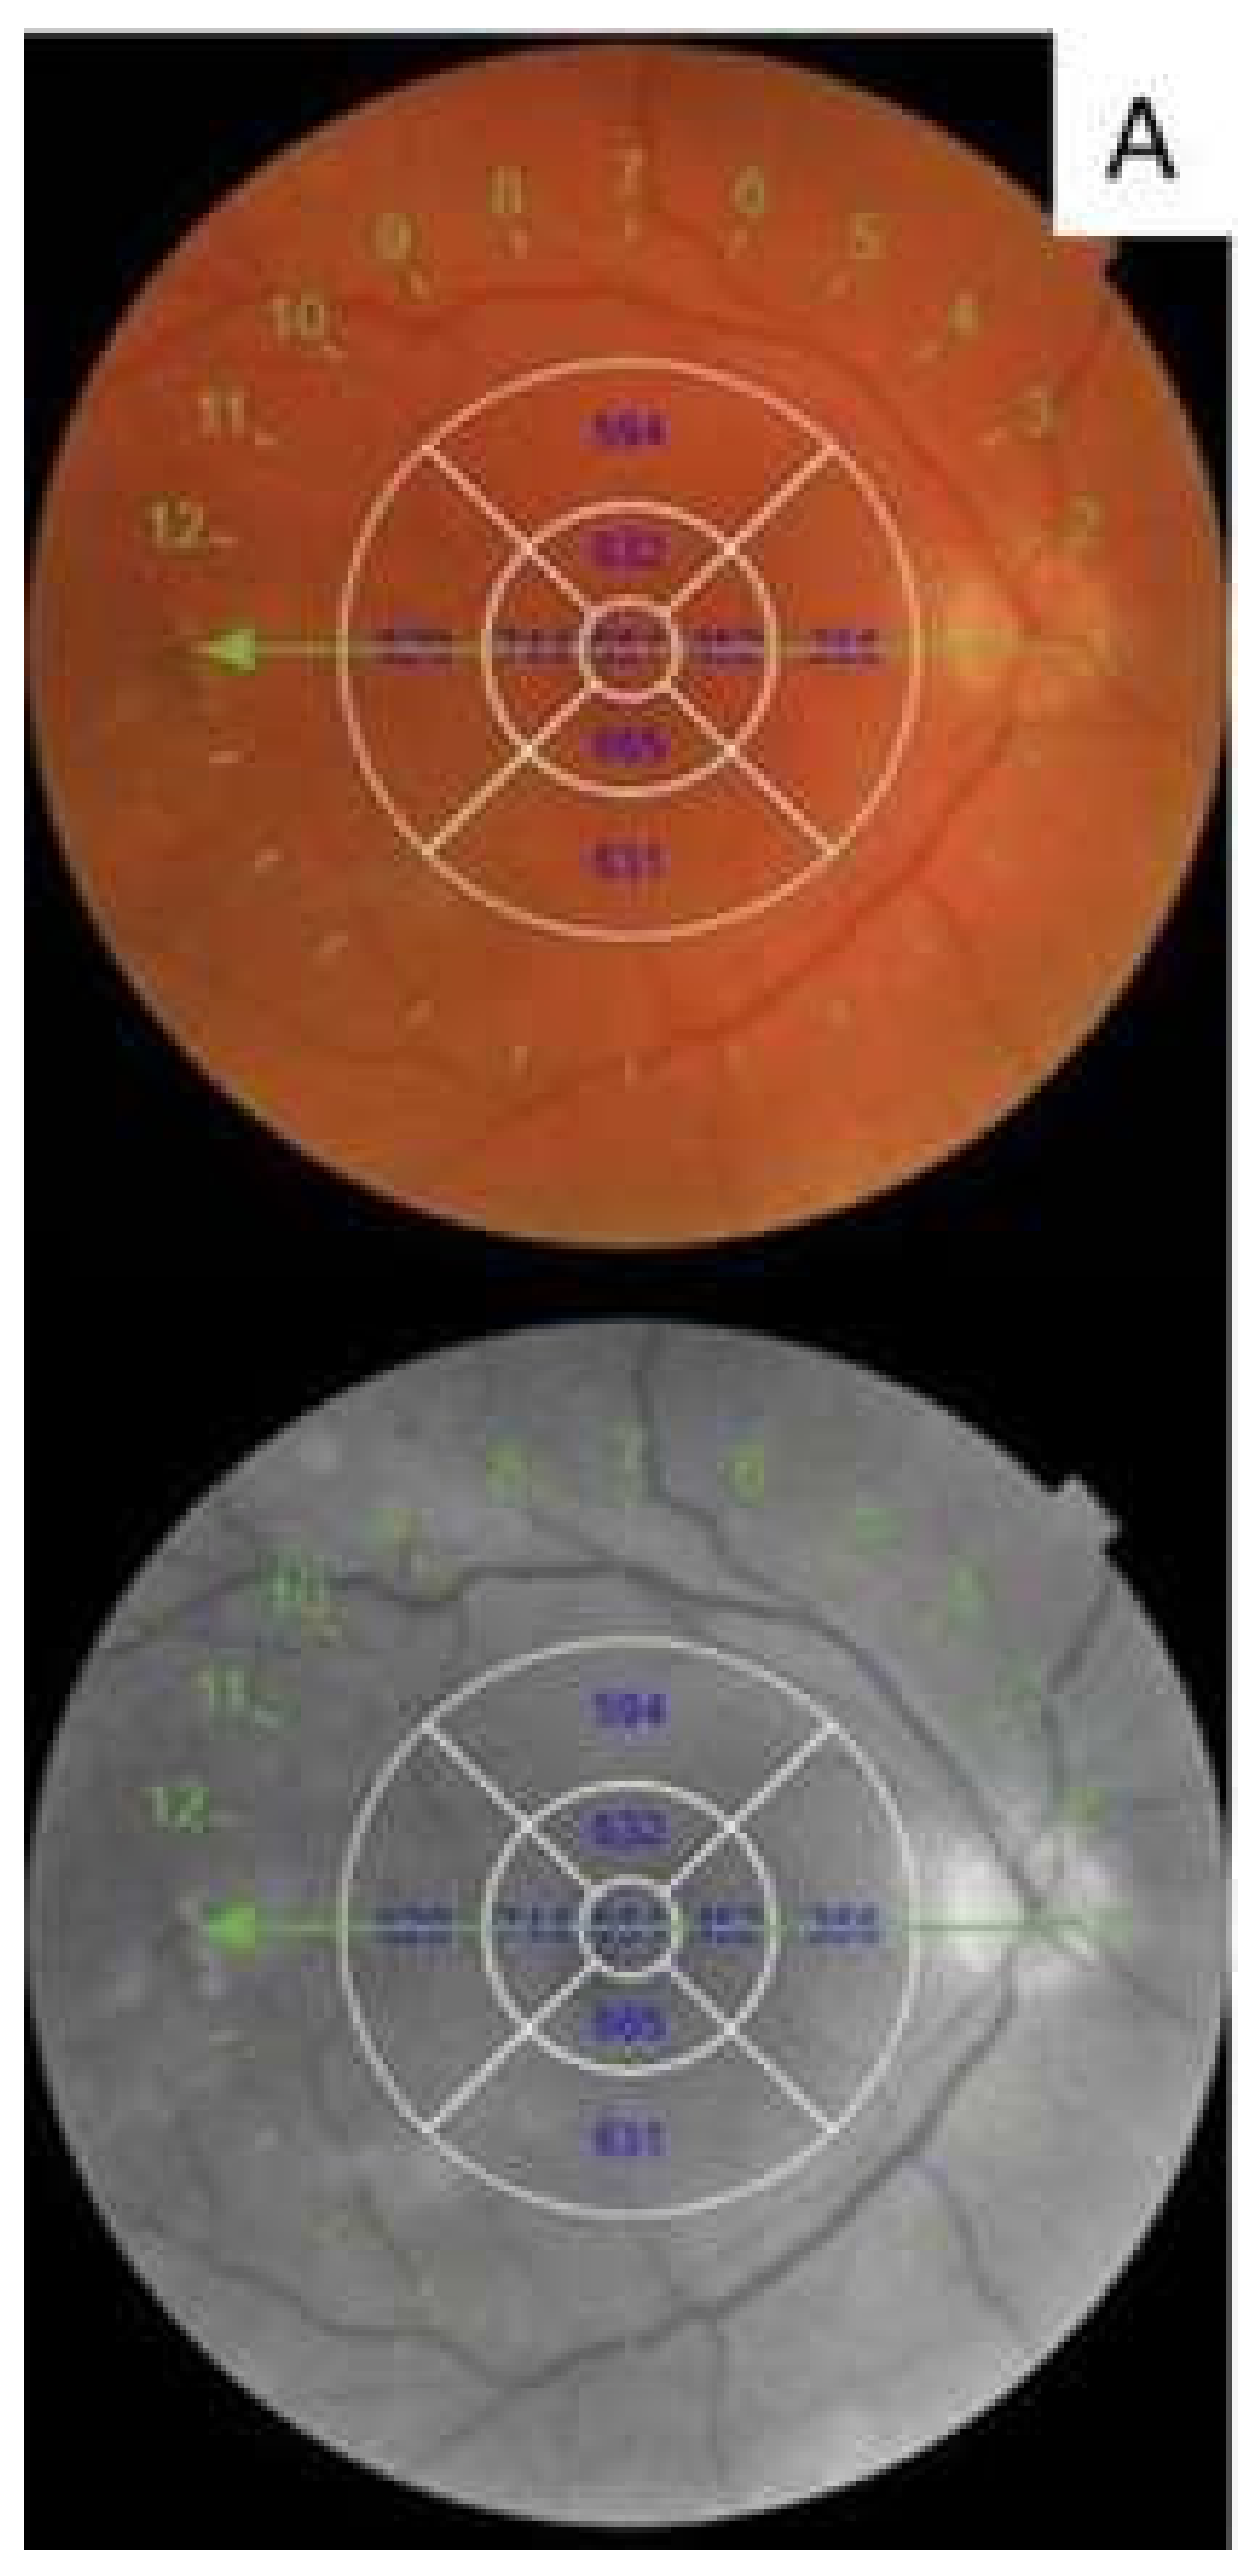
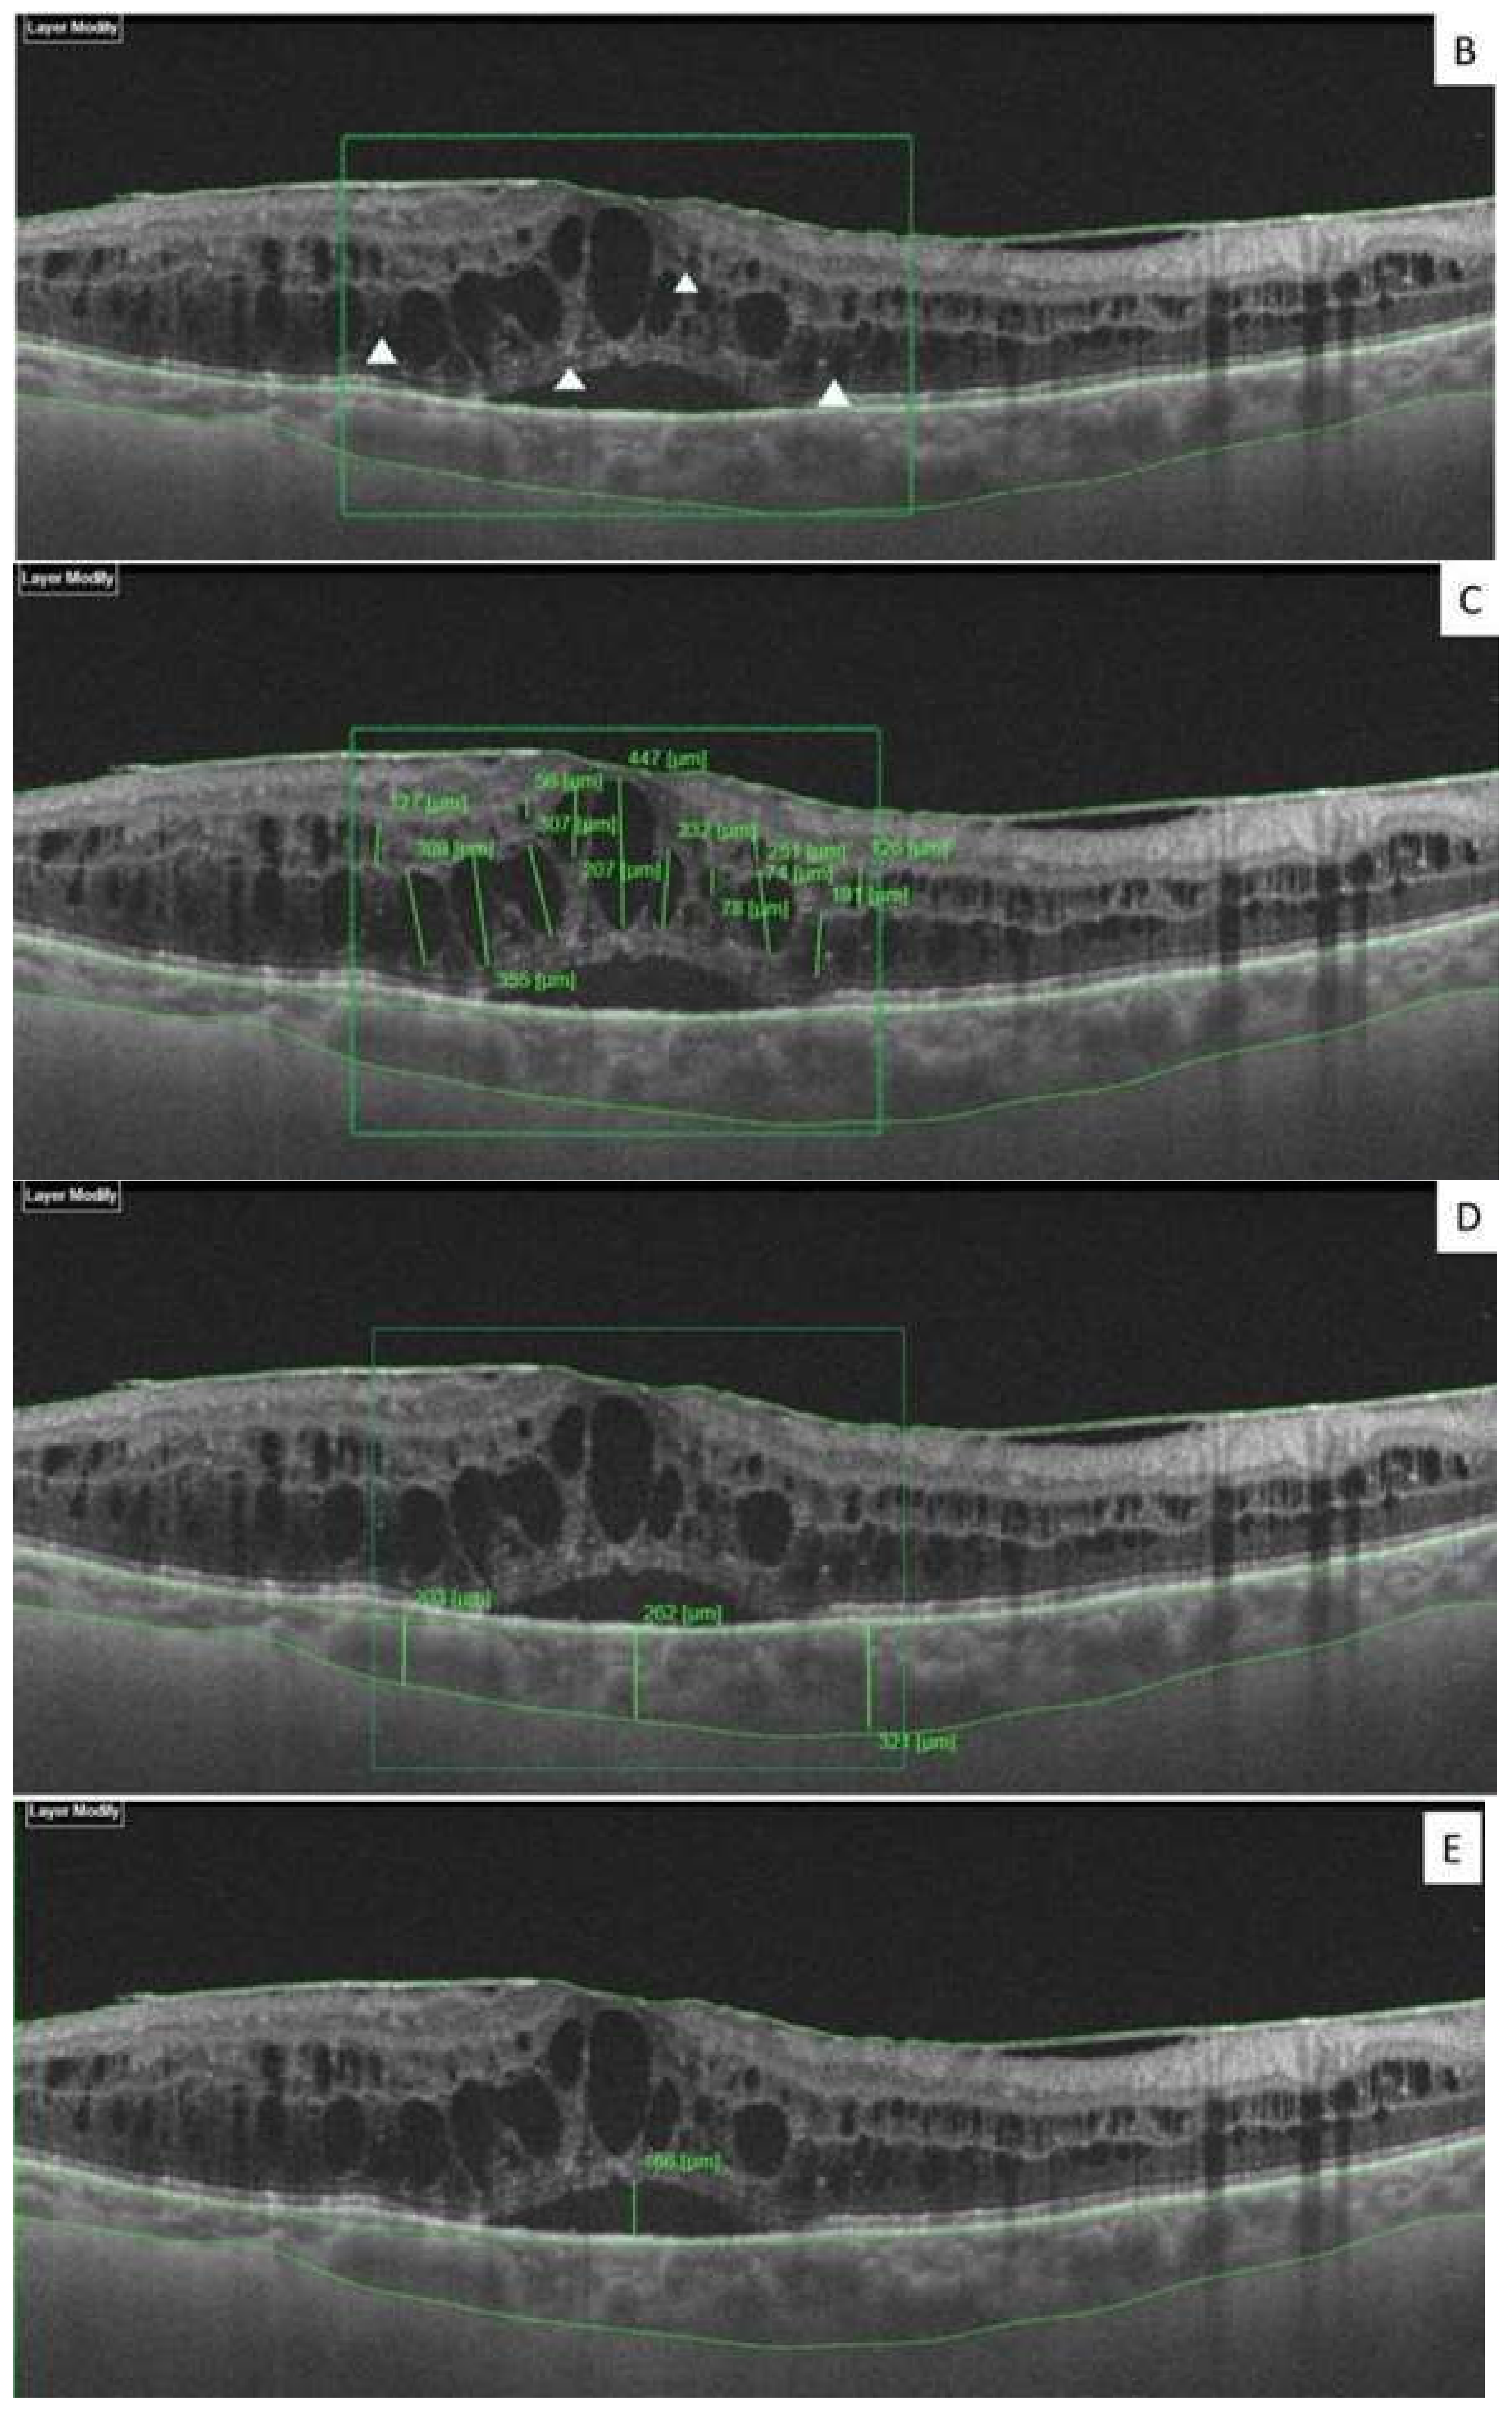
2.1. Retinal Images
2.2. Statistical Analysis
3. Results
4. Discussion
5. Conclusions
Author Contributions
Funding
Acknowledgments
Conflicts of Interest
References
- Cheung, N.; Mitchell, P.; Wong, T.Y. Diabetic retinopathy. Lancet 2010, 376, 124–136. [Google Scholar] [CrossRef]
- Yau, J.W.; Rogers, S.L.; Kawasaki, R.; Lamoureux, E.L.; Kowalski, J.W.; Bek, T.; Chen, S.J.; Dekker, J.M.; Fletcher, A.; Grauslund, J. Global prevalence and major risk factors of diabetic retinopathy. Diabetes Care 2012, 35, 556–564. [Google Scholar] [CrossRef] [PubMed] [Green Version]
- Parodi Battaglia, M.; Iacono, P.; Cascavilla, M.; Zucchiatti, I.; Bandello, F. A Pathogenetic classification of diabetic macular edema. Ophthalmic Res. 2018, 60, 23–28. [Google Scholar] [CrossRef] [PubMed]
- Browning, D.J.; Altaweel, M.M.; Bressler, N.M.; Bressler, S.B.; Scott, I.U.; Diabetic Retinopathy Clinical Research Network. Diabetic retinopathy clinical research Network. Diabetic macular edema: What is focal and what is diffuse? Am. J. Ophthalmol. 2008, 146, 649–655. [Google Scholar] [CrossRef] [Green Version]
- Panozzo, G.; Cicinelli, M.V.; Augustin, A.J.; Battaglia Parodi, M.; Cunha-Vaz, J.; Guarnaccia, G.; Kodjikian, L.; Jampol, L.M.; Jünemann, A.; Lanzetta, P.; et al. An optical coherence tomography-based grading of diabetic maculopathy proposed by an international expert panel: The European School for Advanced Studies in Ophthalmology classification. Eur. J. Ophthalmol. 2020, 30, 8–18. [Google Scholar] [CrossRef] [Green Version]
- Laíns, I.; Talcott, K.E.; Santos, A.R.; Marques, J.H.; Gil, P.; Gil, J.; Figueira, J.; Husain, D.; Kim, I.K.; Miller, J.W. Choroidal thickness in diabetic retinopathy assessed with swept-source optical coherence tomography. Retina 2018, 38, 173–182. [Google Scholar] [CrossRef]
- Otani, T.; Kishi, S.; Maruyama, Y. Patterns of diabetic macular edema with optical coherence tomography. Am. J. Ophthalmol. 1999, 127, 688–693. [Google Scholar] [CrossRef]
- Browning, D.J.; Glassman, A.R.; Aiello, L.P.; Bressler, N.M.; Bressler, S.B.; Danis, R.P.; Davis, M.D.; Ferris, F.L.; Huang, S.S.; Kaiser, P.K.; et al. Optical coherence tomography measurements and analysis methods in optical coherence tomography studies of diabetic macular edema. Ophthalmology 2008, 115, 1366–1371. [Google Scholar] [CrossRef] [Green Version]
- Das, A.; McGuire, P.G.; Rangasamy, S. Diabetic Macular Edema: Pathophysiology and Novel Therapeutic Targets. Ophthalmology 2015, 122, 1375–1394. [Google Scholar] [CrossRef]
- Tang, J.; Kern, T.S. Inflammation in diabetic retinopathy. Prog. Retin. Eye Res. 2011, 30, 343–358. [Google Scholar] [CrossRef] [Green Version]
- Vujosevic, S.; Torresin, T.; Berton, M.; Bini, S.; Convento, E.; Midena, E. Diabetic macular edema with and without subfoveal neuroretinal detachment: Two different morphologic and functional entities. Am. J. Ophthalmol. 2017, 181, 149–155. [Google Scholar] [CrossRef] [PubMed]
- Schmidt-Erfurth, U.; Garcia-Arumi, J.; Bandello, F.; Berg, K.; Chakravarthy, U.; Gerendas, B.S.; Jonas, J.; Larsen, M.; Tadayoni, R.; Loewenstein, A. Guidelines for the Management of Diabetic Macular Edema by the European Society of Retina Specialists (EURETINA). Ophthalmologica 2017, 237, 185–222. [Google Scholar] [CrossRef] [PubMed]
- Nagaradh, K.; Gokarn, P. Short term comparison results between two eyes of same individual treated with Dexamethasone implant and Ranibizumab in the management of naive Diabetic Macular Edema (DME). J. Clin. Ophthalmol. 2020, 4, 215–221. [Google Scholar]
- Rishi, P.; Kuniyal, L.; Mathur, G.; Rishi, E. Short-term results of intravitreal dexamethasone implant (OZURDEX®) in treatment of recalcitrant diabetic macular edema: A case series. Oman J. Ophthalmol. 2012, 5, 79. [Google Scholar] [CrossRef]
- Vujosevic, S.; Torresin, T.; Bini, S.; Convento, E.; Pilotto, E.; Parrozzani, R.; Midena, E. Imaging retinal inflammatory biomarkers after intravitreal steroid and anti-VEGF treatment in diabetic macular oedema. Acta Ophthalmol. 2017, 95, 464–471. [Google Scholar] [CrossRef]
- Scott, I.U.; Danis, R.P.; Bressler, S.B.; Bressler, N.M.; Browning, D.J.; Qin, H.; Diabetic Retinopathy Clinical Research Network. Effect of focal/grid photocoagulation on visual acuity and retinal thickeningin eyes with non-center-involved diabetic macular edema. Retina 2009, 29, 613–617. [Google Scholar] [CrossRef] [Green Version]
- Moon, B.G.; Lee, J.Y.; Yu, H.G.; Song, J.H.; Park, Y.H.; Kim, H.W.; Ji, Y.S.; Chang, W.; Lee, J.E.; Oh, J.; et al. Efficacy and Safety of a Dexamethasone Implant in Patients with Diabetic Macular Edema at Tertiary Centers in Korea. J. Ophthalmol. 2016, 2016, 9810270. [Google Scholar] [CrossRef] [Green Version]
- Bolukbasi, S.; Cakir, A.; Erden, B.; Karaca, G. Comparison of the short-term effect of aflibercept and dexamethasone implant on serous retinal detachment in the treatment of naive diabetic macular edema. Cutan Ocul. Toxicol. 2019, 38, 401–405. [Google Scholar] [CrossRef]
- Spaide, R.; Yannuzzi, L. Manifestations and pathophysiology of serous detachment of the retinal pigment epithelium and retina. In The Retinal Pigment Epithelium: Function and Disease; Marmor, M., Wolfensberger, T., Eds.; Oxford University Press: New York, NY, USA, 1998; pp. 439–455. [Google Scholar]
- Weinberger, D.; Fink-Cohen, S.; Gaton, D.D.; Priel, E.; Yassur, Y. Non-retinovascular leakage in diabetic maculopathy. Br. J. Ophthalmol. 1995, 79, 728–731. [Google Scholar] [CrossRef] [Green Version]
- Zhang, X.; Zeng, H.; Bao, S.; Wang, N.; Gillies, M.C. Diabetic macular edema: New concepts in patho-physiology and treatment. Cell Biosci. 2014, 4, 27. [Google Scholar] [CrossRef] [Green Version]
- Sonoda, S.; Sakamoto, T.; Yamashita, T.; Shirasawa, M.; Otsuka, H.; Sonoda, Y. Retinal morphologic changes and concentrations of cytokines in eyes with diabetic macular edema. Retina 2014, 34, 741–748. [Google Scholar] [CrossRef] [PubMed]
- Ozdemir, H.; Karacorlu, M.; Karacorlu, S. Serous macular detachment in diabetic cystoid macular oedema. Acta Ophthalmol. Scand. 2005, 83, 63–66. [Google Scholar] [CrossRef] [PubMed]
- Seo, K.H.; Yu, S.Y.; Kim, M.; Kwak, H.W. Visual and morphologic outcomes of intravitreal ranibizumab for diabetic macular edema based on optical coherence tomography patterns. Retina 2016, 36, 588–595. [Google Scholar] [CrossRef]
- Lupo, G.; Motta, C.; Giurdanella, G.; Anfuso, C.D.; Alberghina, M.; Drago, F.; Salomone, S.; Bucolo, C. Role of phospholipases A2 in diabetic retinopathy: In vitro and in vivo studies. Biochem. Pharmacol. 2013, 86, 1603–1613. [Google Scholar] [CrossRef] [PubMed]
- Zhao, M.; Bousquet, E.; Valamanesh, F.; Farman, N.; Jeanny, J.C.; Jaisser, F.; Behar-Cohen, F.F. Differential regulations of AQP4 and Kir4.1 by triamcinolone acetonide and dexamethasone in the healthy and inflamed retina. Investig. Ophthalmol. Vis. Sci. 2011, 52, 6340–6347. [Google Scholar] [CrossRef] [PubMed]
- Uji, A.; Murakami, T.; Nishijima, K.; Akagi, T.; Horii, T.; Arakawa, N.; Muraoka, Y.; Ellabban, A.A.; Yoshimura, N. Association between hyperreflective foci in the outer retina, status of photoreceptor layer, and visual acuity in diabetic macular edema. Am. J. Ophthalmol. 2012, 153, 710–717. [Google Scholar] [CrossRef] [Green Version]
- Framme, C.; Schweizer, P.; Imesch, M.; Wolf, S.; Wolf-Schnurrbusch, U. Behavior of SD OCTdetected hyperreflective foci in the retina of anti-VEGFtreated patients with diabetic macular edema. Investig. Ophthalmol. Vis Sci. 2012, 53, 5814–5818. [Google Scholar] [CrossRef] [Green Version]
- Schreur, V.; de Breuk, A.; Venhuizen, F.G.; Sánchez, C.I.; Tack, C.J.; Klevering, B.J.; de Jong, E.K.; Hoyng, C.B. Retinal hyperreflective foci in type 1 diabetes mellitus. Retina 2019. [Google Scholar] [CrossRef]
- Lee, S.H.; Kim, J.; Chung, H.; Kim, H.C. Changes of choroidal thickness after treatment for diabetic retinopathy. Curr. Eye Res. 2014, 39, 736–744. [Google Scholar] [CrossRef]
- Zhang, Z.; Meng, X.; Wu, Z.; Zou, W.; Zhang, J.; Zhu, D.; Chen, T.; Zhang, Q. Changes in Choroidal Thickness after Panretinal Photocoagulation for Diabetic Retinopathy: A 12-Week Longitudinal Study. Investig. Ophthalmol. Vis. Sci. 2015, 56, 2631–2638. [Google Scholar] [CrossRef] [Green Version]
- Agemy, S.A.; Scripsema, N.K.; Shah, C.M.; Chui, T.; Garcia, P.M.; Lee, J.G.; Gentile, R.C.; Hsiao, Y.S.; Zhou, Q.; Ko, T.; et al. Retinal vascular perfusion density mapping using optical coherence tomography angiography in normals and diabetic retinopathy patients. Retina 2015, 35, 2353–2363. [Google Scholar] [CrossRef] [PubMed]
- Nunes, S.; Pires, I.; Rosa, A.; Duarte, L.; Bernardes, R.; Cunha-Vaz, J.E. Microaneurysm turnover is a biomarker for diabetic retinopathy progression to clinically significant macular edema: Findings for type 2 diabetics with nonproliferative retinopathy. Ophthalmologica 2009, 223, 292–297. [Google Scholar] [CrossRef] [PubMed]
- Haritoglou, C.; Kernt, M.; Neubauer, A.; Gerss, J.; Oliveira, C.M.; Kampik, A.; Ulbig, M. Microaneurysm formation rate as a predictive marker for progression to clinically significant macular edema in nonproliferative diabetic retinopathy. Retina 2014, 34, 157–164. [Google Scholar] [CrossRef]
- Leicht, S.F.; Kernt, M.; Neubauer, A.; Wolf, A.; Oliveira, C.M.; Ulbig, M.; Haritoglou, C. Microaneurysm turnover in diabetic retinopathy assessed by automated RetmarkerDR image analysis—Potential role as biomarker of response to ranibizumab treatment. Ophthalmologica 2014, 231, 198–203. [Google Scholar] [CrossRef] [PubMed] [Green Version]
- Demircan, A.; Ozkaya, A.; Alkin, Z.; Kemer, B.; Yesilkaya, C.; Demir, G. Comparison of the effect of ranibizumab and dexamethasone implant on serous retinal detachment in diabetic macular edema. J. Fr. Ophtalmol. 2018, 41, 733–738. [Google Scholar] [CrossRef]
- Vujosevic, S.; Toma, C.; Villani, E.; Muraca, A.; Torti, E.; Florimbi, G.; Leporati, F.; Brambilla, M.; Nucci, P.; De Cilla’, S. Diabetic macular edema with neuroretinal detachment: OCT and OCT-angiography biomarkers of treatment response to anti-VEGF and steroids. Acta Diabetol. 2020, 57, 287–296. [Google Scholar] [CrossRef] [PubMed]


| Variables | Ranibizumab n = 75 | Dexamethasone n = 81 | p-Value |
|---|---|---|---|
| Age (years) | 56.8 ± 7.6 | 59.9 ± 10.6 | 0.92 a |
| Gender (male/female) | 38/37 | 46/35 | 0.79 b |
| Duration of diabetes (years) | 13.9 ± 4.1 | 12.8 ± 4.3 | 0.85 a |
| HbA1c (%) | 8.47 ± 1.05 | 8.8 ± 1.06 | 0.81 a |
| BCVA ETDRS | 51.6 ± 17.1 | 47.8 ± 16.8 | 0.18 a |
| CRT (µm) | 511.1 ± 113.2 | 587.8 ± 177.9 | 0.20 a |
| IRC (µm) | 1467.2 ± 973.4 | 1719.2 ± 931.3 | 0.08 a |
| CT | 261.1 ± 33.1 | 271.5 ± 64.7 | 0.30 a |
| SDN | |||
| Number of patients (%) | 18 (24.0%) | 18 (22.2%) | 0.78 b |
| Height of SDN (µm) | 100.5 ± 59.58 | 108.7 ± 47.4 | 0.38 a |
| HRS | 68.08 ± 19.8 | 66.41 ± 18.6 | 0.71 a |
| Red Dots | 19.24 ± 8.29 | 18.08 ± 7.6 | 0.45 a |
| Parameters | Baseline | V2 | p-Value a |
|---|---|---|---|
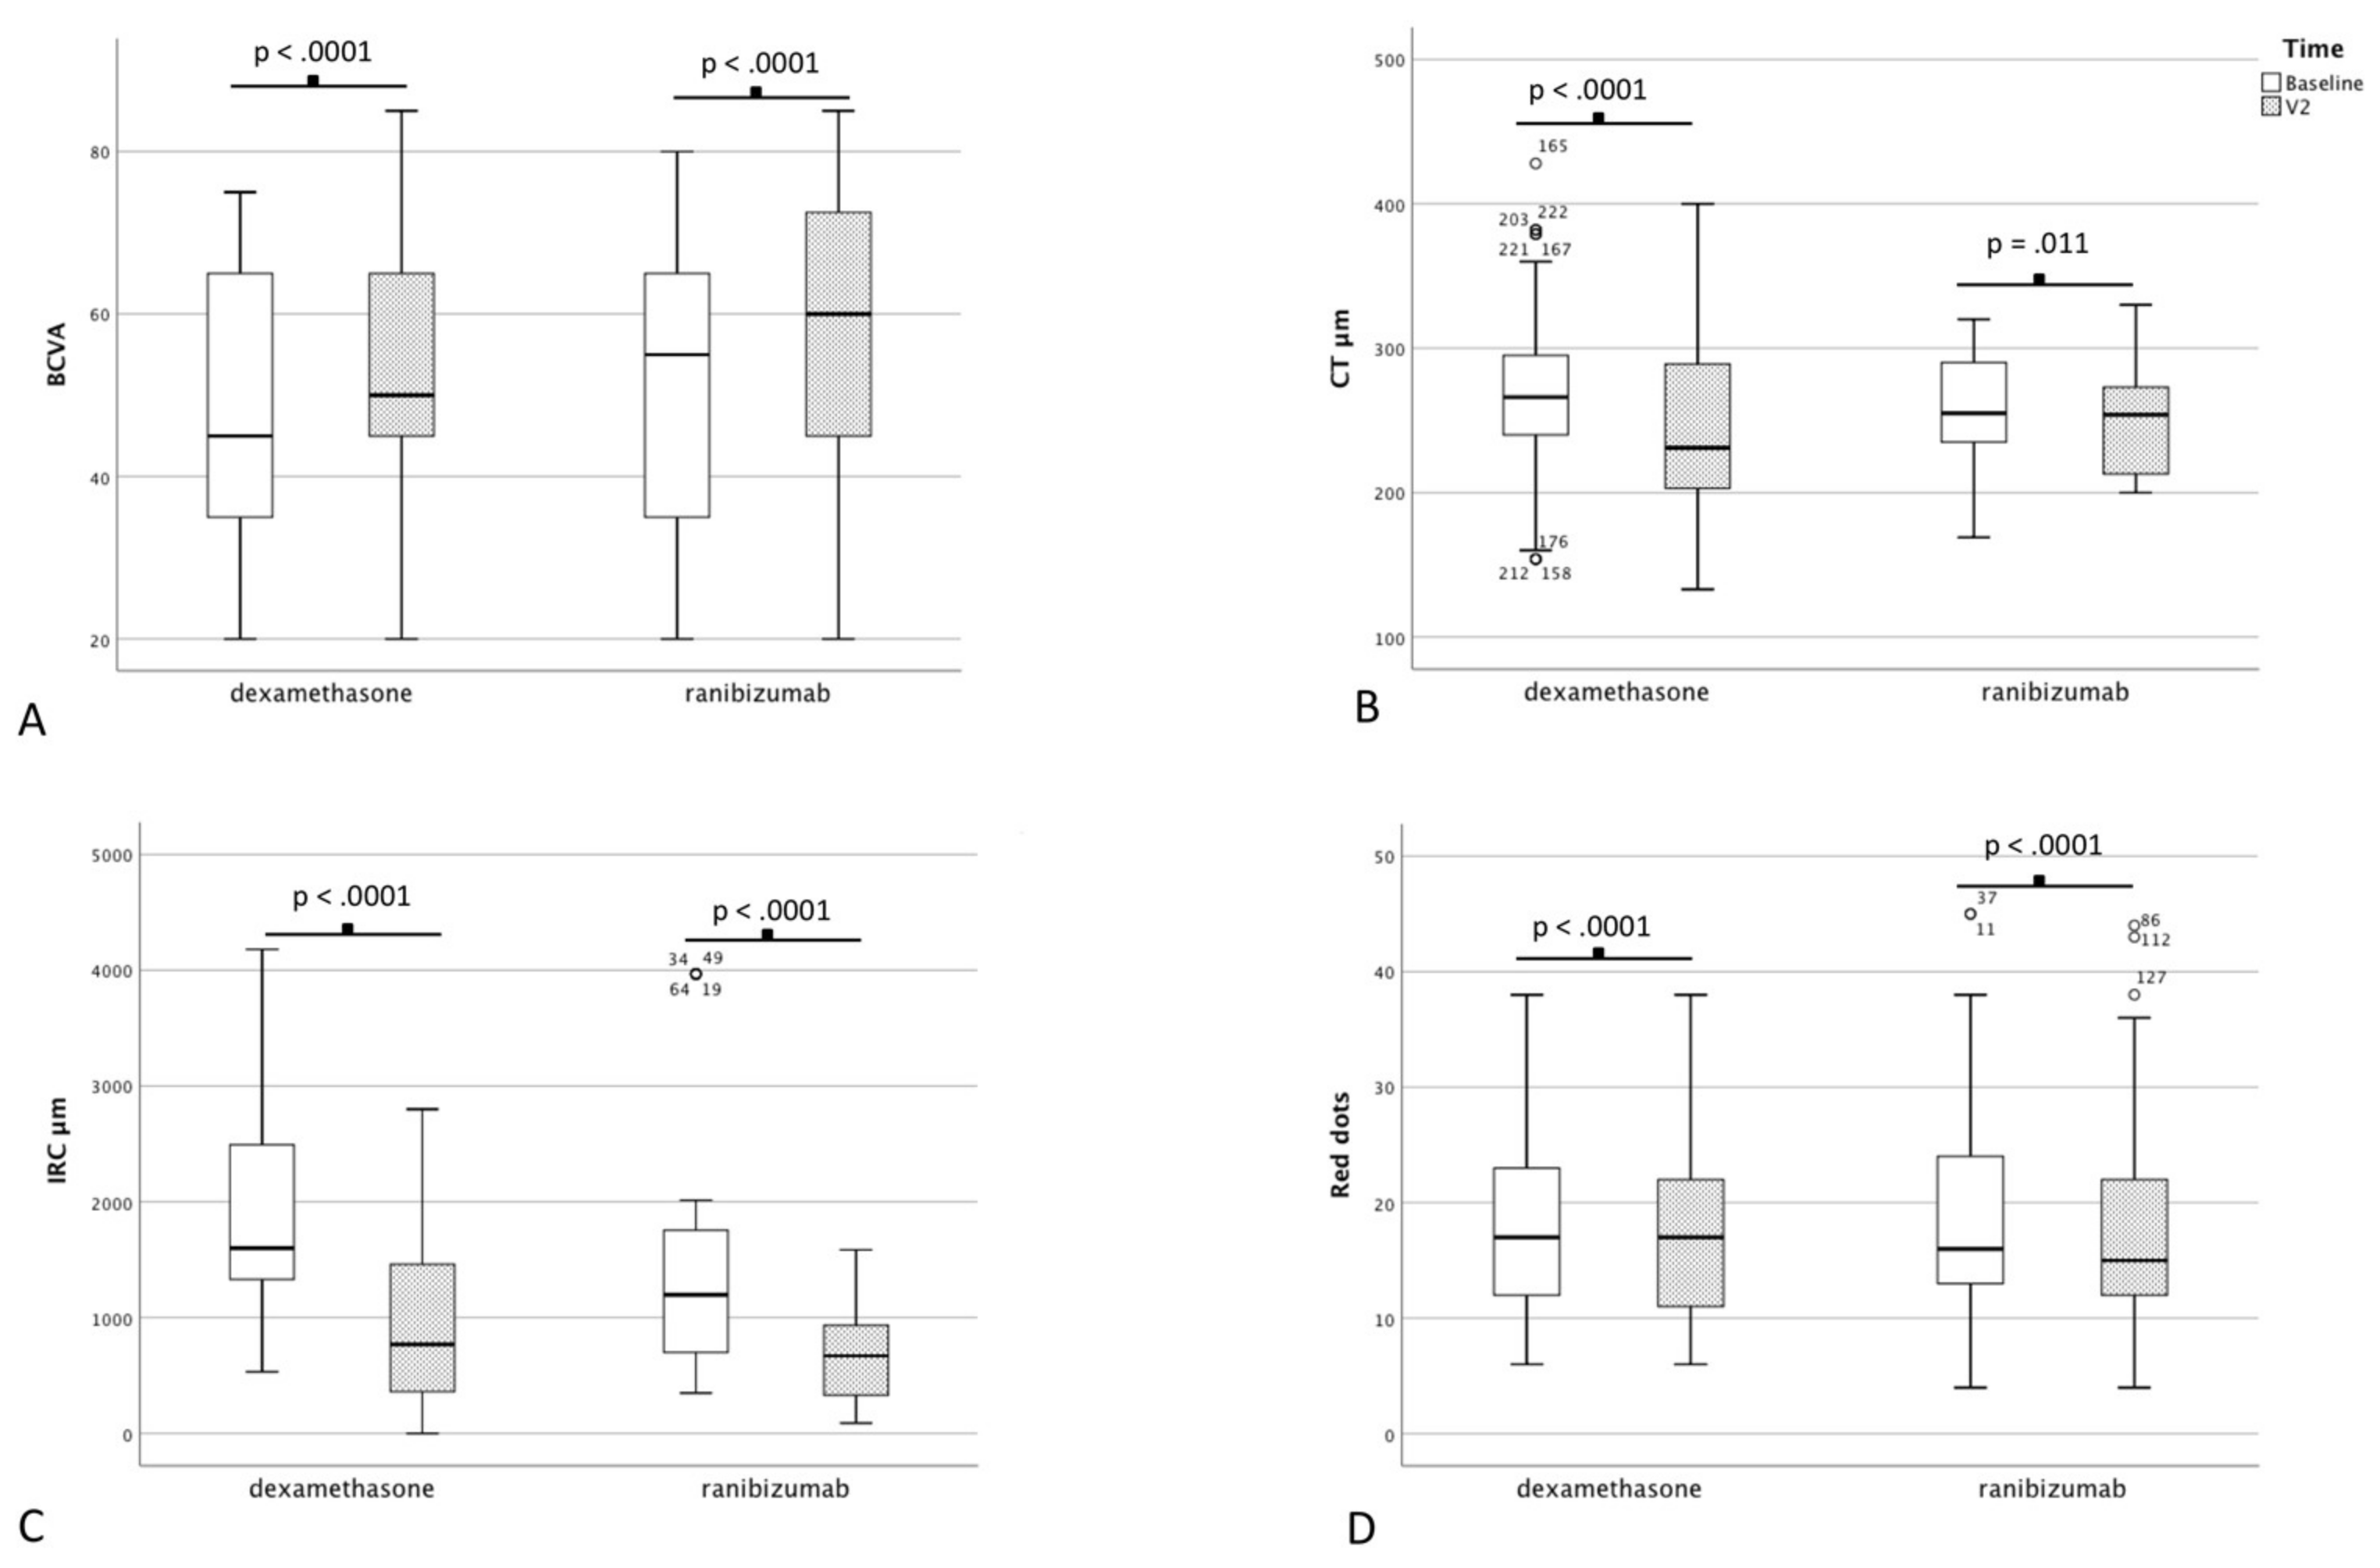
| BCVA ETDRS | 51.6 ± 17.1 | 56.9 ± 17.3 | <0.0001 |
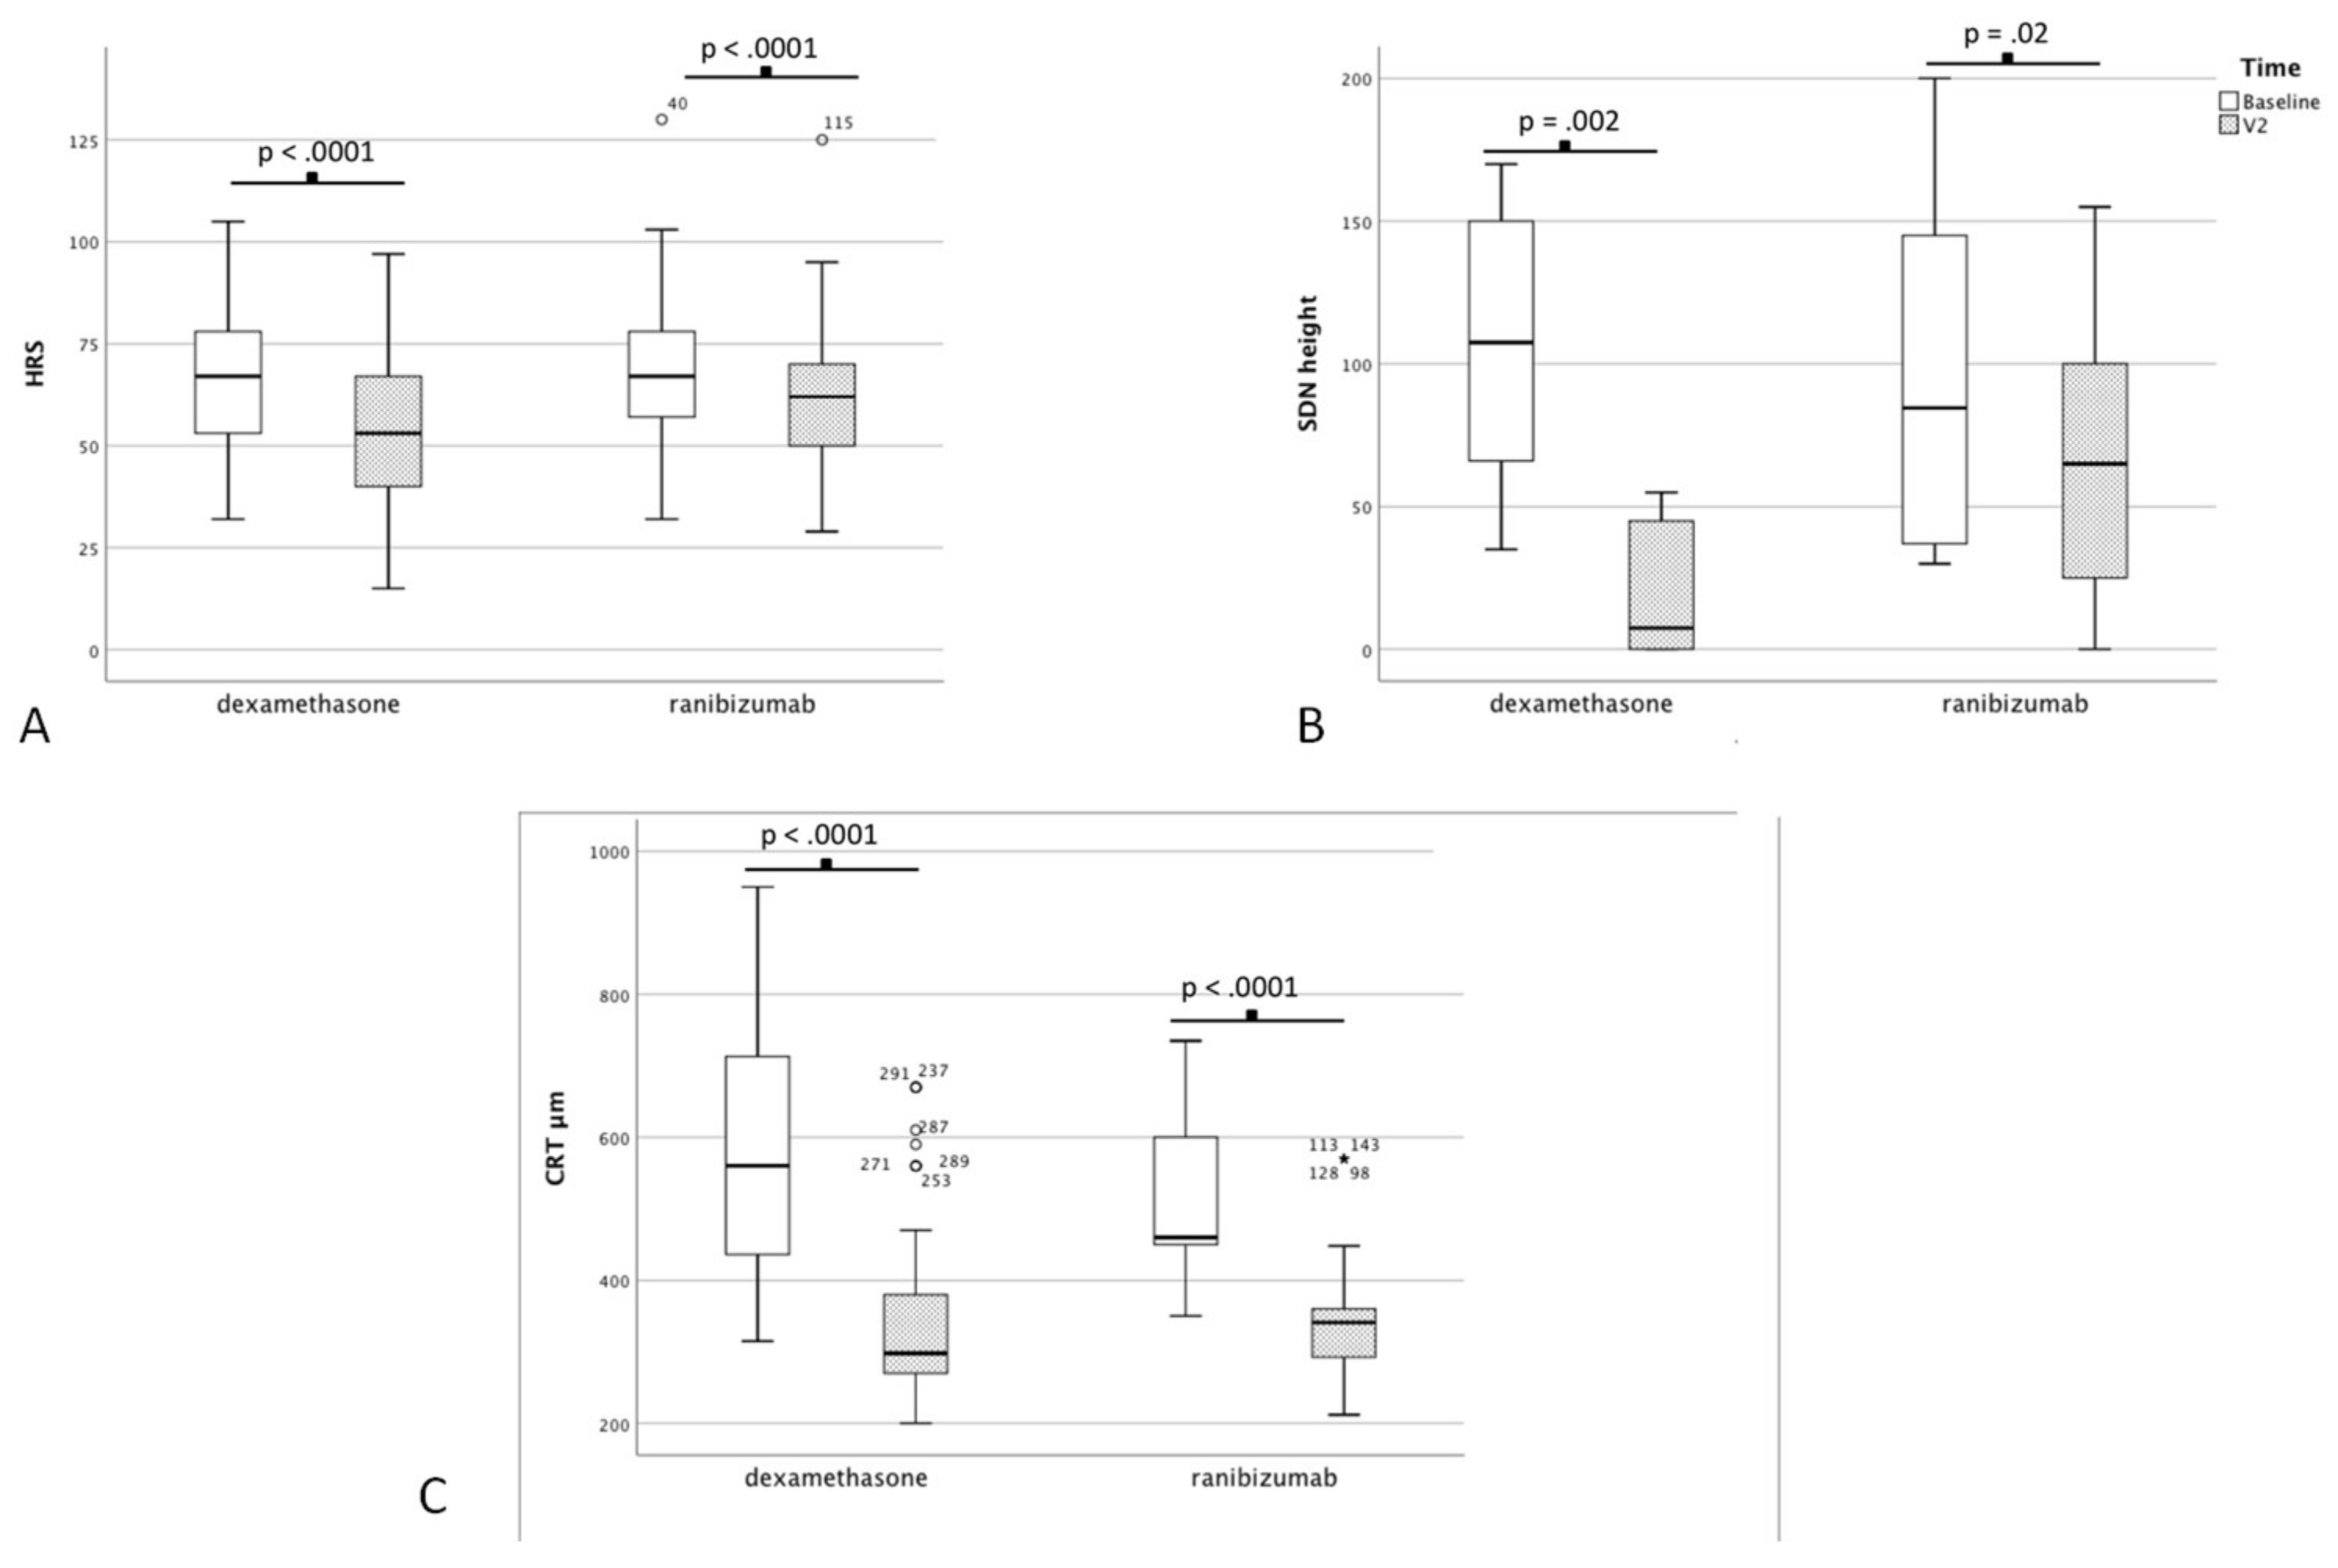
| CRT (µm) | 511.1 ± 113.2 | 342.4 ± 86.1 | <0.0001 |
| IRC (µm) | 1467.2 ± 973.4 | 754.93 ± 447.2 | <0.0001 |
| CT | 261.1 ± 33.1 | 259.2 ± 33.3 | 0.11 |
| SDN height (µm) | 100.5 ± 59.5 | 63.1 ± 46.8 | 0.02 |
| HRS | 68.1 ± 19.8 | 61.4 ± 17.9 | <0.0001 |
| Red Dots | 19.24 ± 8.29 | 17.5 ± 8.5 | <0.0001 |
| Parameters | Baseline | V2 | p-Value a |
|---|---|---|---|
| BCVA ETDRS | 47.8 ± 16.8 | 55.4 ± 16.8 | <0.0001 |
| CRT (µm) | 587.8 ± 177.9 | 338.9 ± 116.7 | <0.0001 |
| IRC (µm) | 1719.2 ± 931.3 | 896.89 ± 715.6 | <0.0001 |
| CT | 271.5 ± 64.7 | 242.9 ± 60.7 | <0.0001 |
| SDN height (µm) | 108.7 ± 47.4 | 19.4 ± 23.5 | 0.0002 |
| HRS | 66.41 ± 18.6 | 53.1.9 ± 18.7 | <0.0001 |
| Red Dots | 18.08 ± 7.6 | 17.2 ± 7.1 | <0.0001 |
| Parameters | Ranibizumab | Dexamethasone | p-Value |
|---|---|---|---|
| BCVA | 56.9 ± 17.3 | 55.4 ± 16.8 | 0.4 a |
| CRT (µm) | 342.4 ± 86.1 | 338.9 ± 116.7 | 0.06 a |
| IRC (µm) | 754.9 ± 447.2 | 896.9 ± 715.6 | 0.4 a |
| CT (µm) | 259.2 ± 33.3 | 242.9 ± 60.7 | 0.22 a |
| SDN height (µm) | 63.1 ± 46.8 | 19.4 ± 23.5 | 0.03 a |
| SDN disappear, n | 4 (22.2%) | 16 (88.8%) | 0.0002 b |
| HRS | 61.4 ± 17.9 | 53.1.9 ± 18.7 | 0.01 a |
| Red Dots | 17.5 ± 8.5 | 17.2 ± 7.1 | 0.78 a |
| Parameters | Coefficient | p-Value |
|---|---|---|
| CRT | −0.735 | 0.0001 |
| IRC | −0.178 | 0.179 |
| CT | −0.142 | 0.324 |
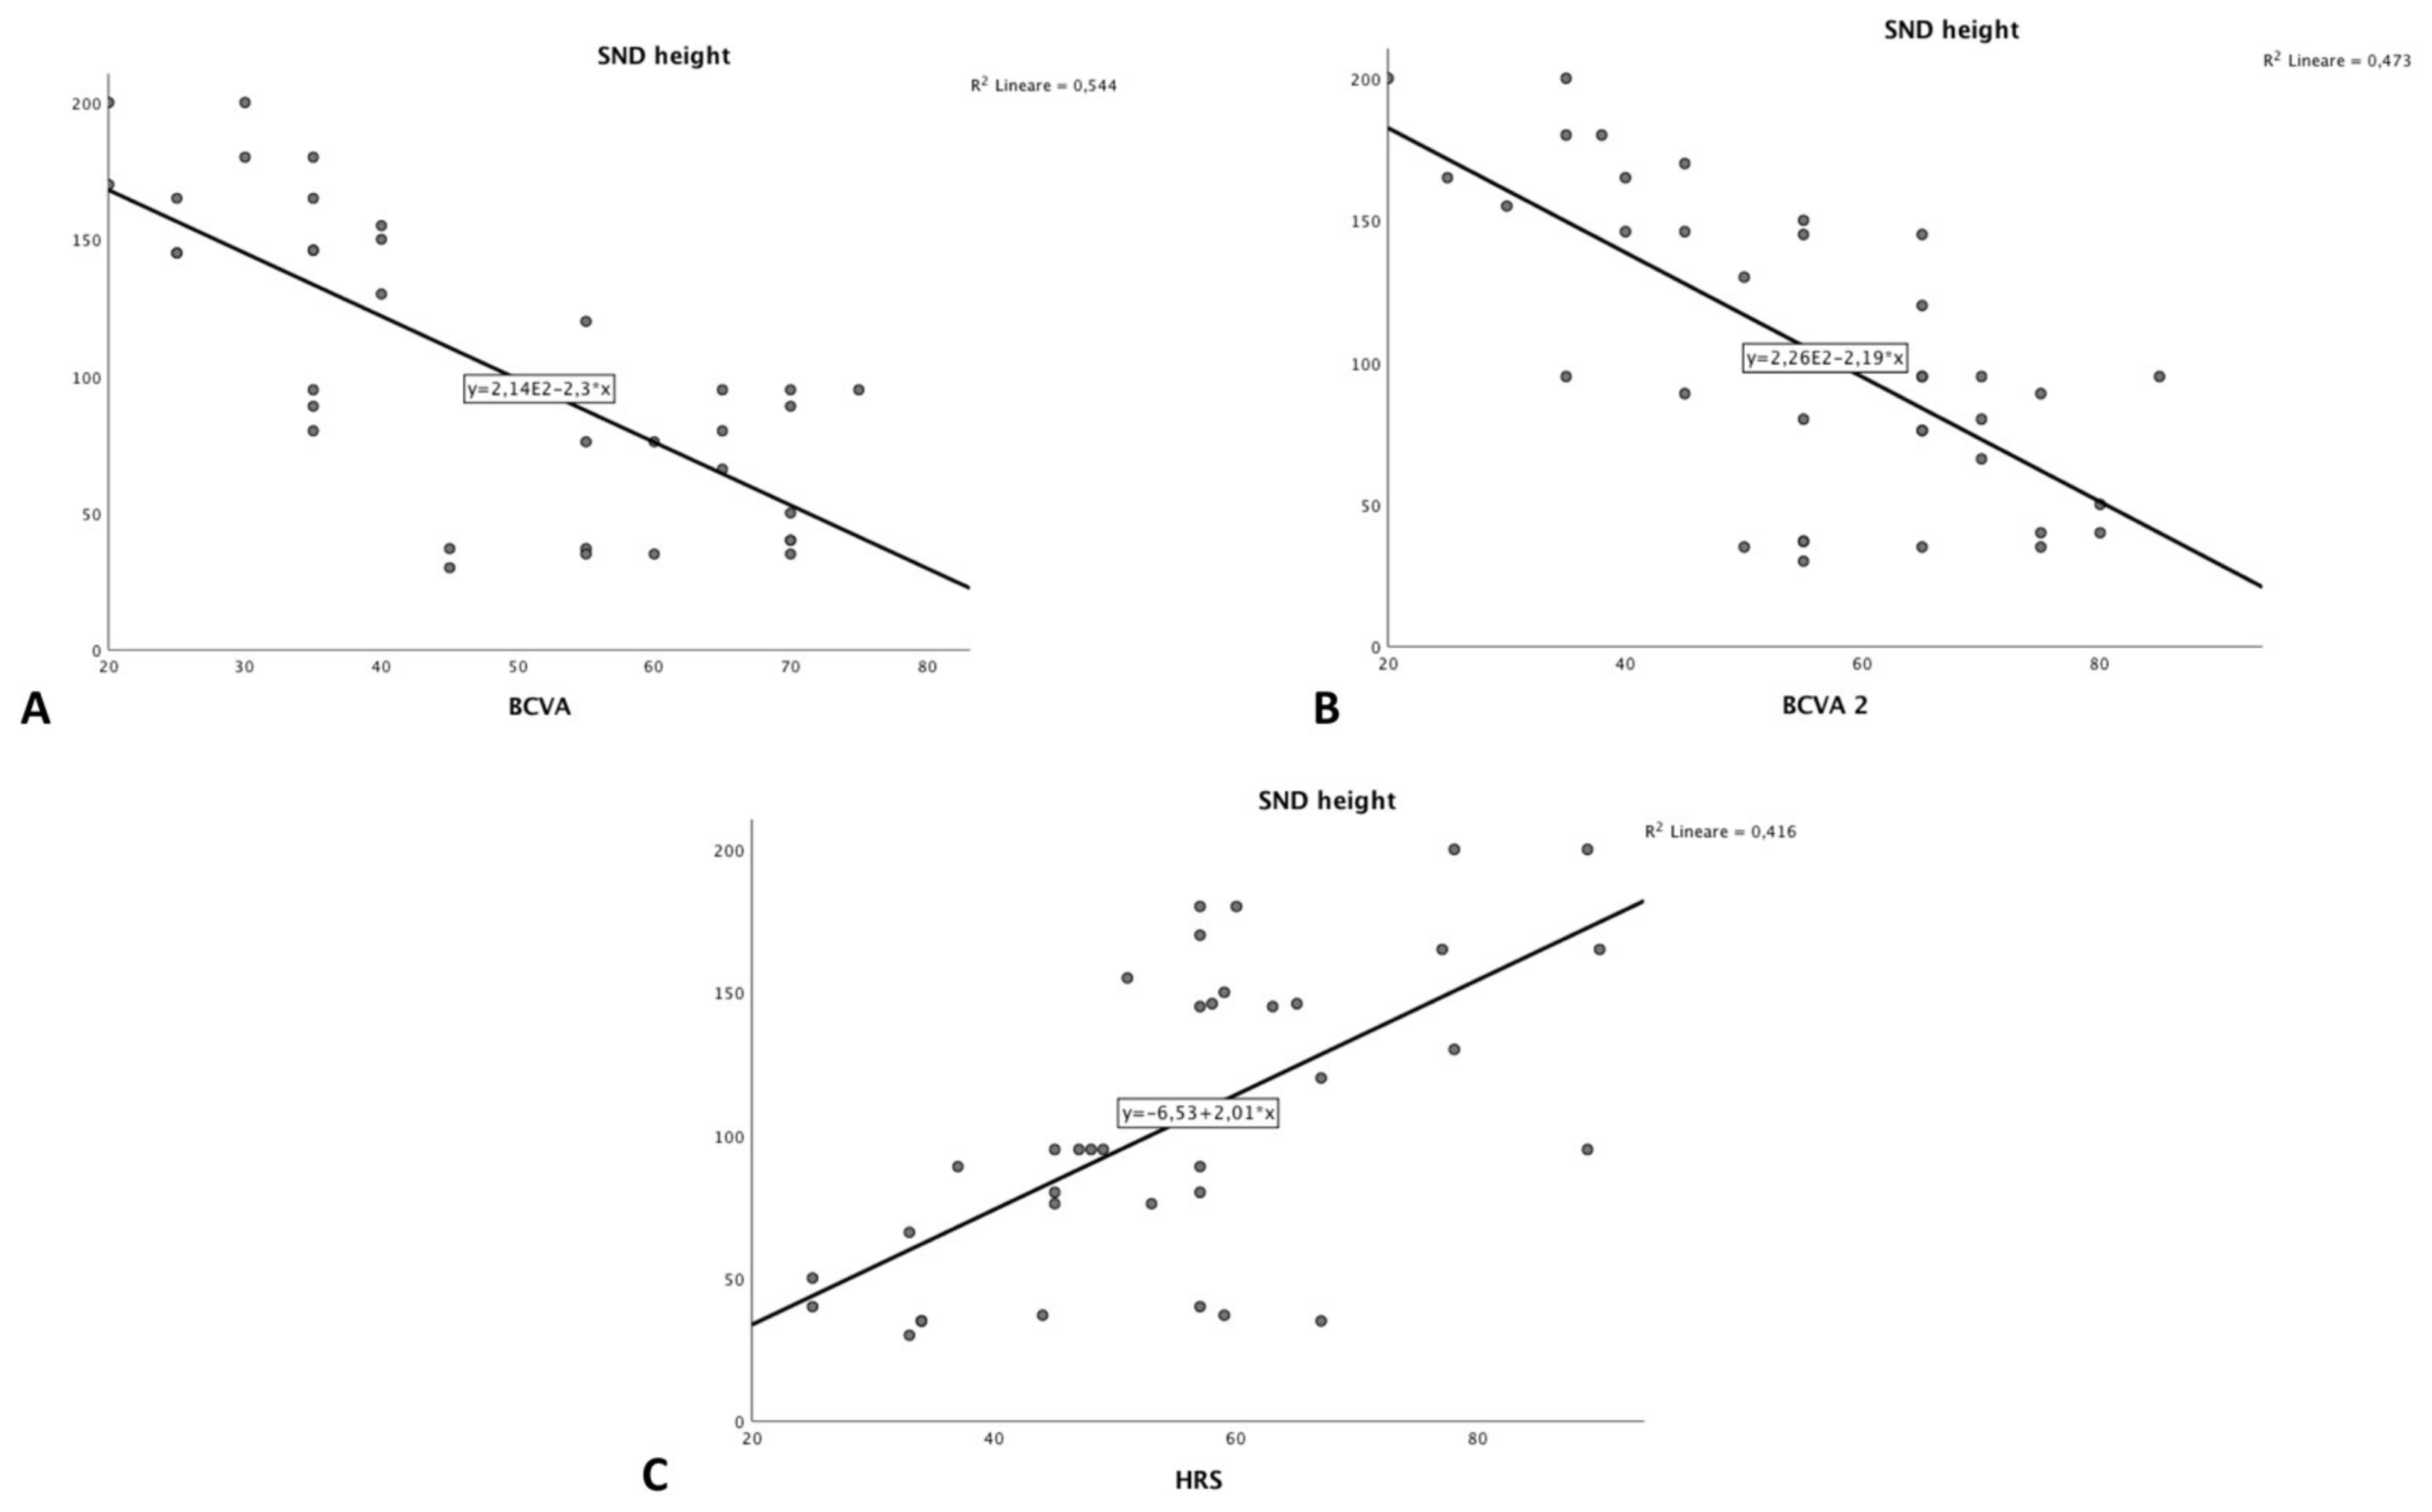
| SND height | 0.273 | 0.032 |
| HRS | 0.067 | 0.590 |
© 2020 by the authors. Licensee MDPI, Basel, Switzerland. This article is an open access article distributed under the terms and conditions of the Creative Commons Attribution (CC BY) license (http://creativecommons.org/licenses/by/4.0/).
Share and Cite
Ceravolo, I.; Oliverio, G.W.; Alibrandi, A.; Bhatti, A.; Trombetta, L.; Rejdak, R.; Toro, M.D.; Trombetta, C.J. The Application of Structural Retinal Biomarkers to Evaluate the Effect of Intravitreal Ranibizumab and Dexamethasone Intravitreal Implant on Treatment of Diabetic Macular Edema. Diagnostics 2020, 10, 413. https://doi.org/10.3390/diagnostics10060413
Ceravolo I, Oliverio GW, Alibrandi A, Bhatti A, Trombetta L, Rejdak R, Toro MD, Trombetta CJ. The Application of Structural Retinal Biomarkers to Evaluate the Effect of Intravitreal Ranibizumab and Dexamethasone Intravitreal Implant on Treatment of Diabetic Macular Edema. Diagnostics. 2020; 10(6):413. https://doi.org/10.3390/diagnostics10060413
Chicago/Turabian StyleCeravolo, Ida, Giovanni William Oliverio, Angela Alibrandi, Ahsan Bhatti, Luigi Trombetta, Robert Rejdak, Mario Damiano Toro, and Costantino John Trombetta. 2020. "The Application of Structural Retinal Biomarkers to Evaluate the Effect of Intravitreal Ranibizumab and Dexamethasone Intravitreal Implant on Treatment of Diabetic Macular Edema" Diagnostics 10, no. 6: 413. https://doi.org/10.3390/diagnostics10060413