Postmortem Determination of Short-Term Markers of Hyperglycemia for the Purposes of Medicolegal Opinions


Abstract
:1. Introduction
2. Experimental
2.1. Study Design, Samples Collection, and Storage
2.2. Chemicals and Reagents
2.3. Sample Preparation
2.3.1. Glucose and Lactate
2.3.2. Acetone
2.3.3. β-hydroxybutyric Acid
2.3.4. 1,5-anhydroglucitol
2.4. Instrumentation
2.4.1. Glucose and Lactate
2.4.2. Acetone
2.4.3. β-hydroxybutyric Acid
2.4.4. 1,5-anhydroglucitol
2.5. Method Development and Validation
2.5.1. Glucose and Lactate
2.5.2. Acetone
2.5.3. β-hydroxybutyric Acid
2.5.4. 1,5-anhydroglucitol
2.6. Statistics
3. Results
3.1. Glucose and Lactate
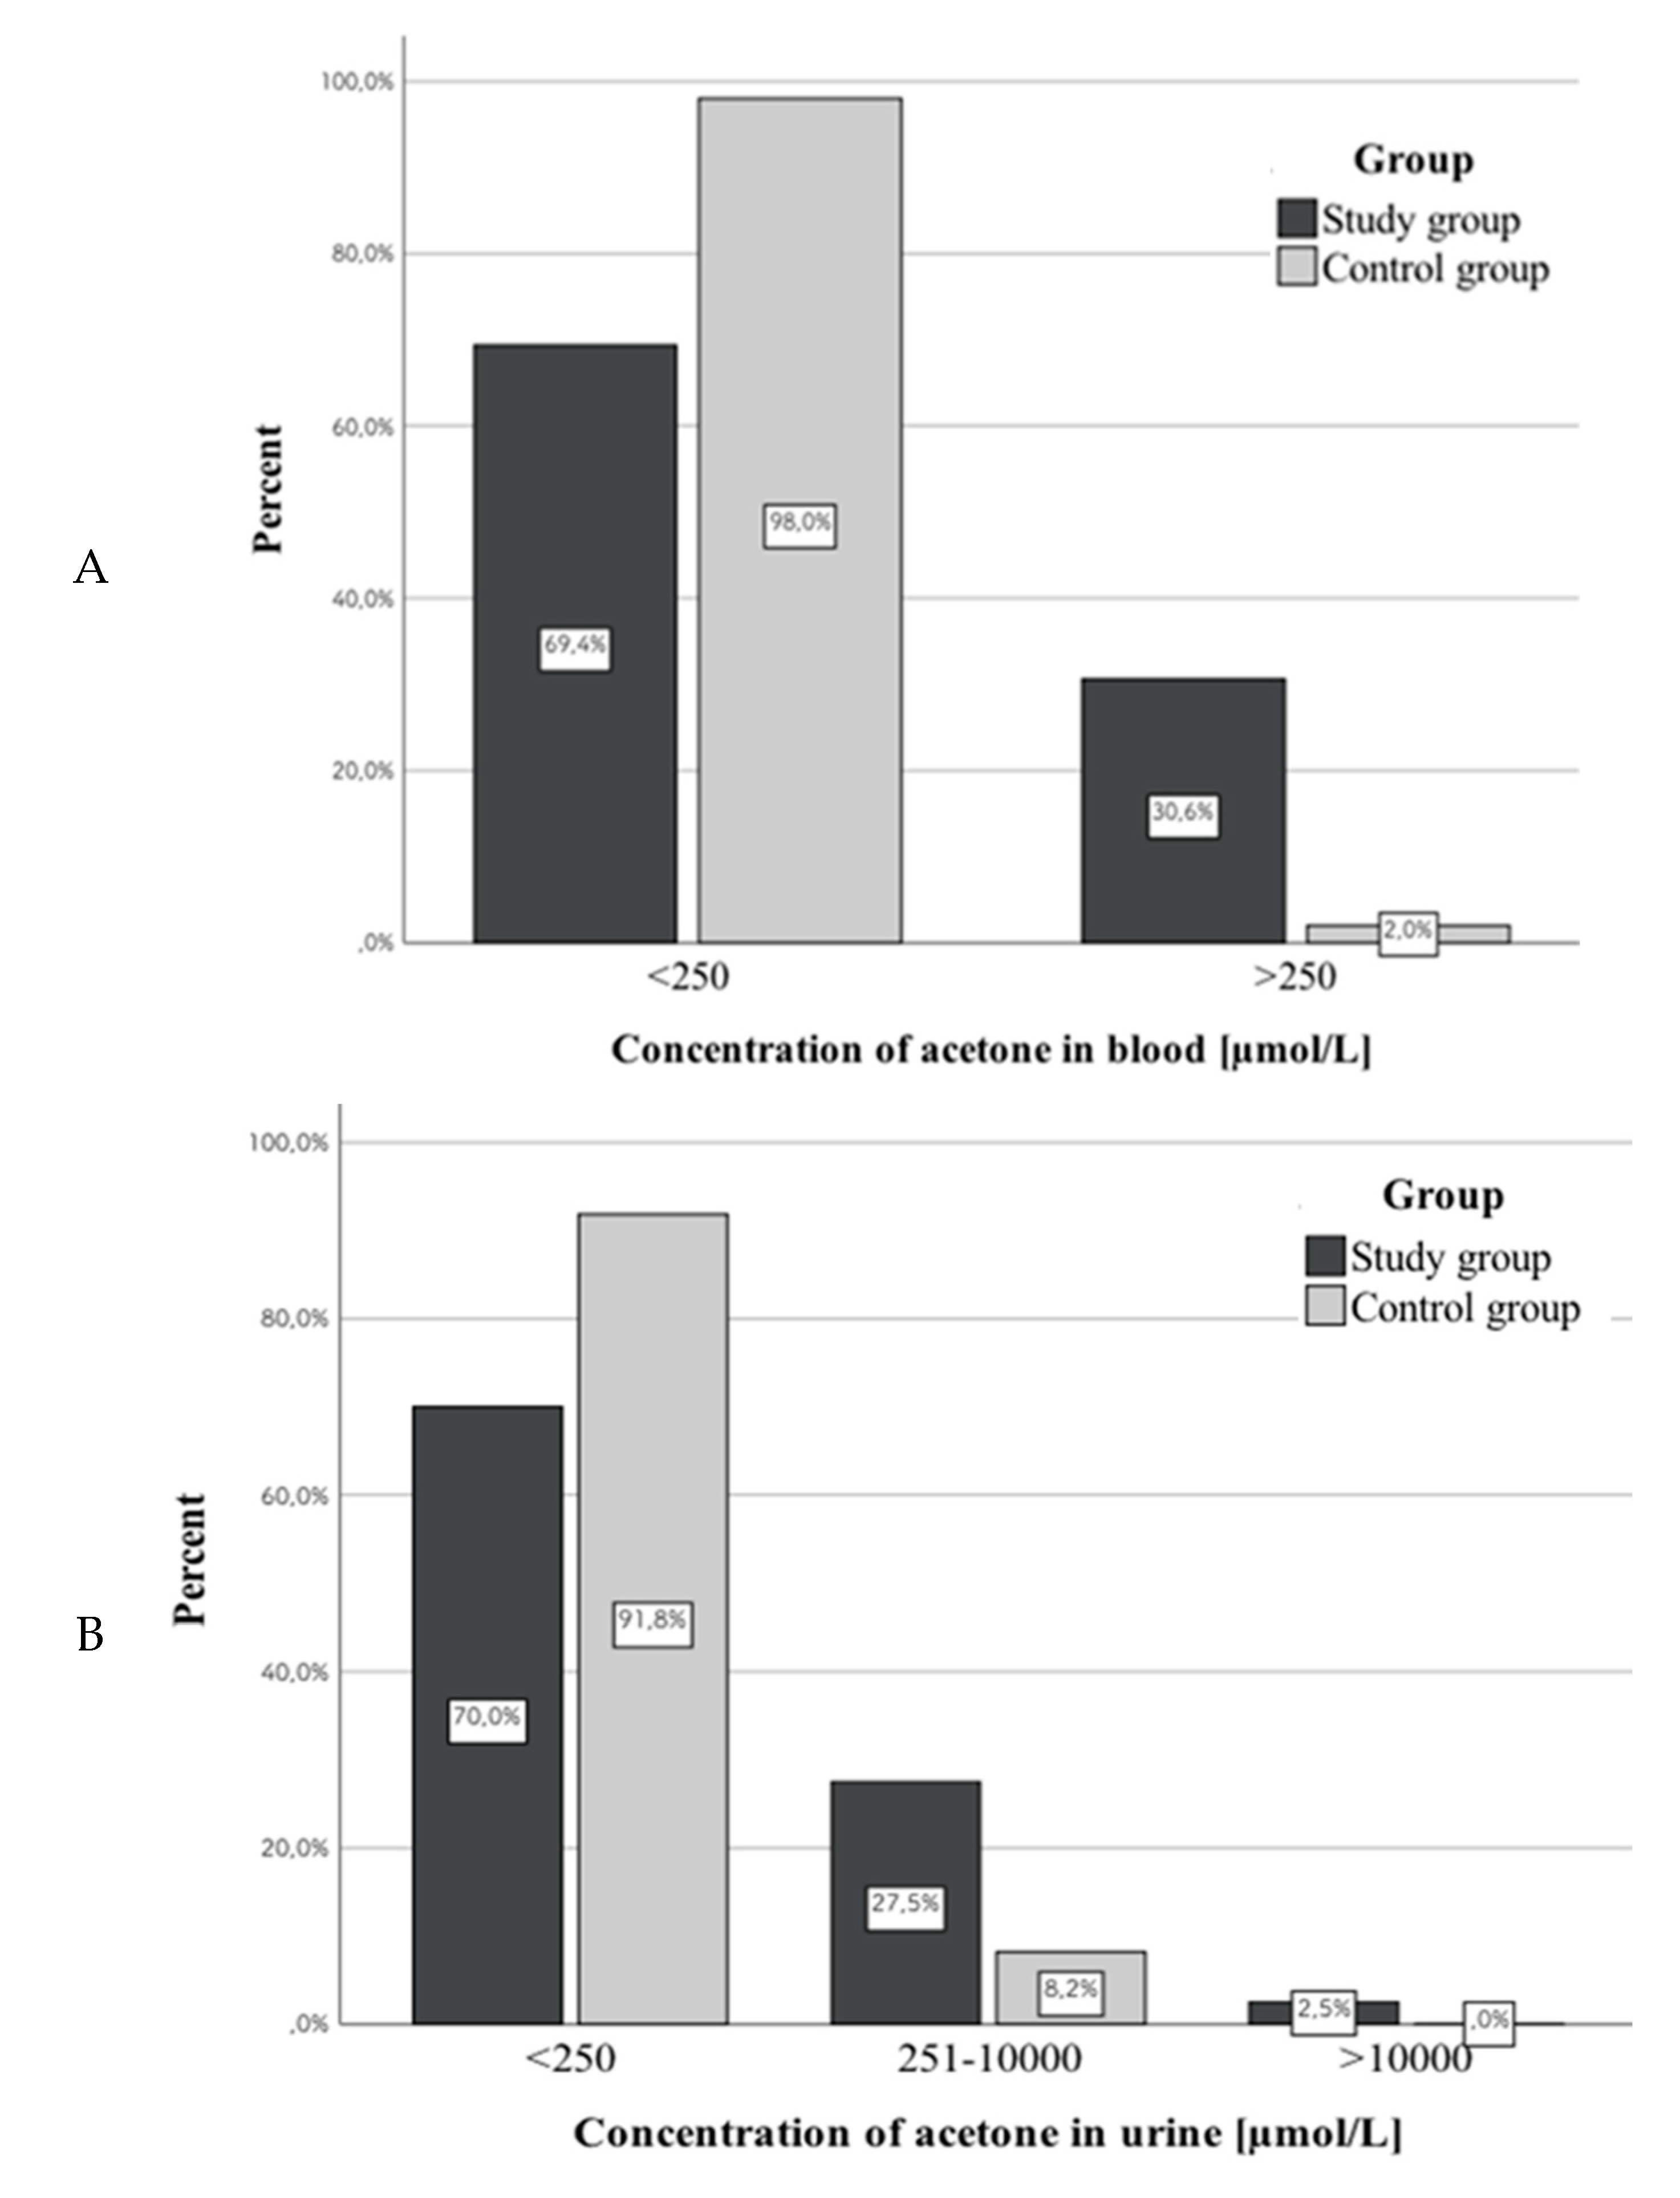
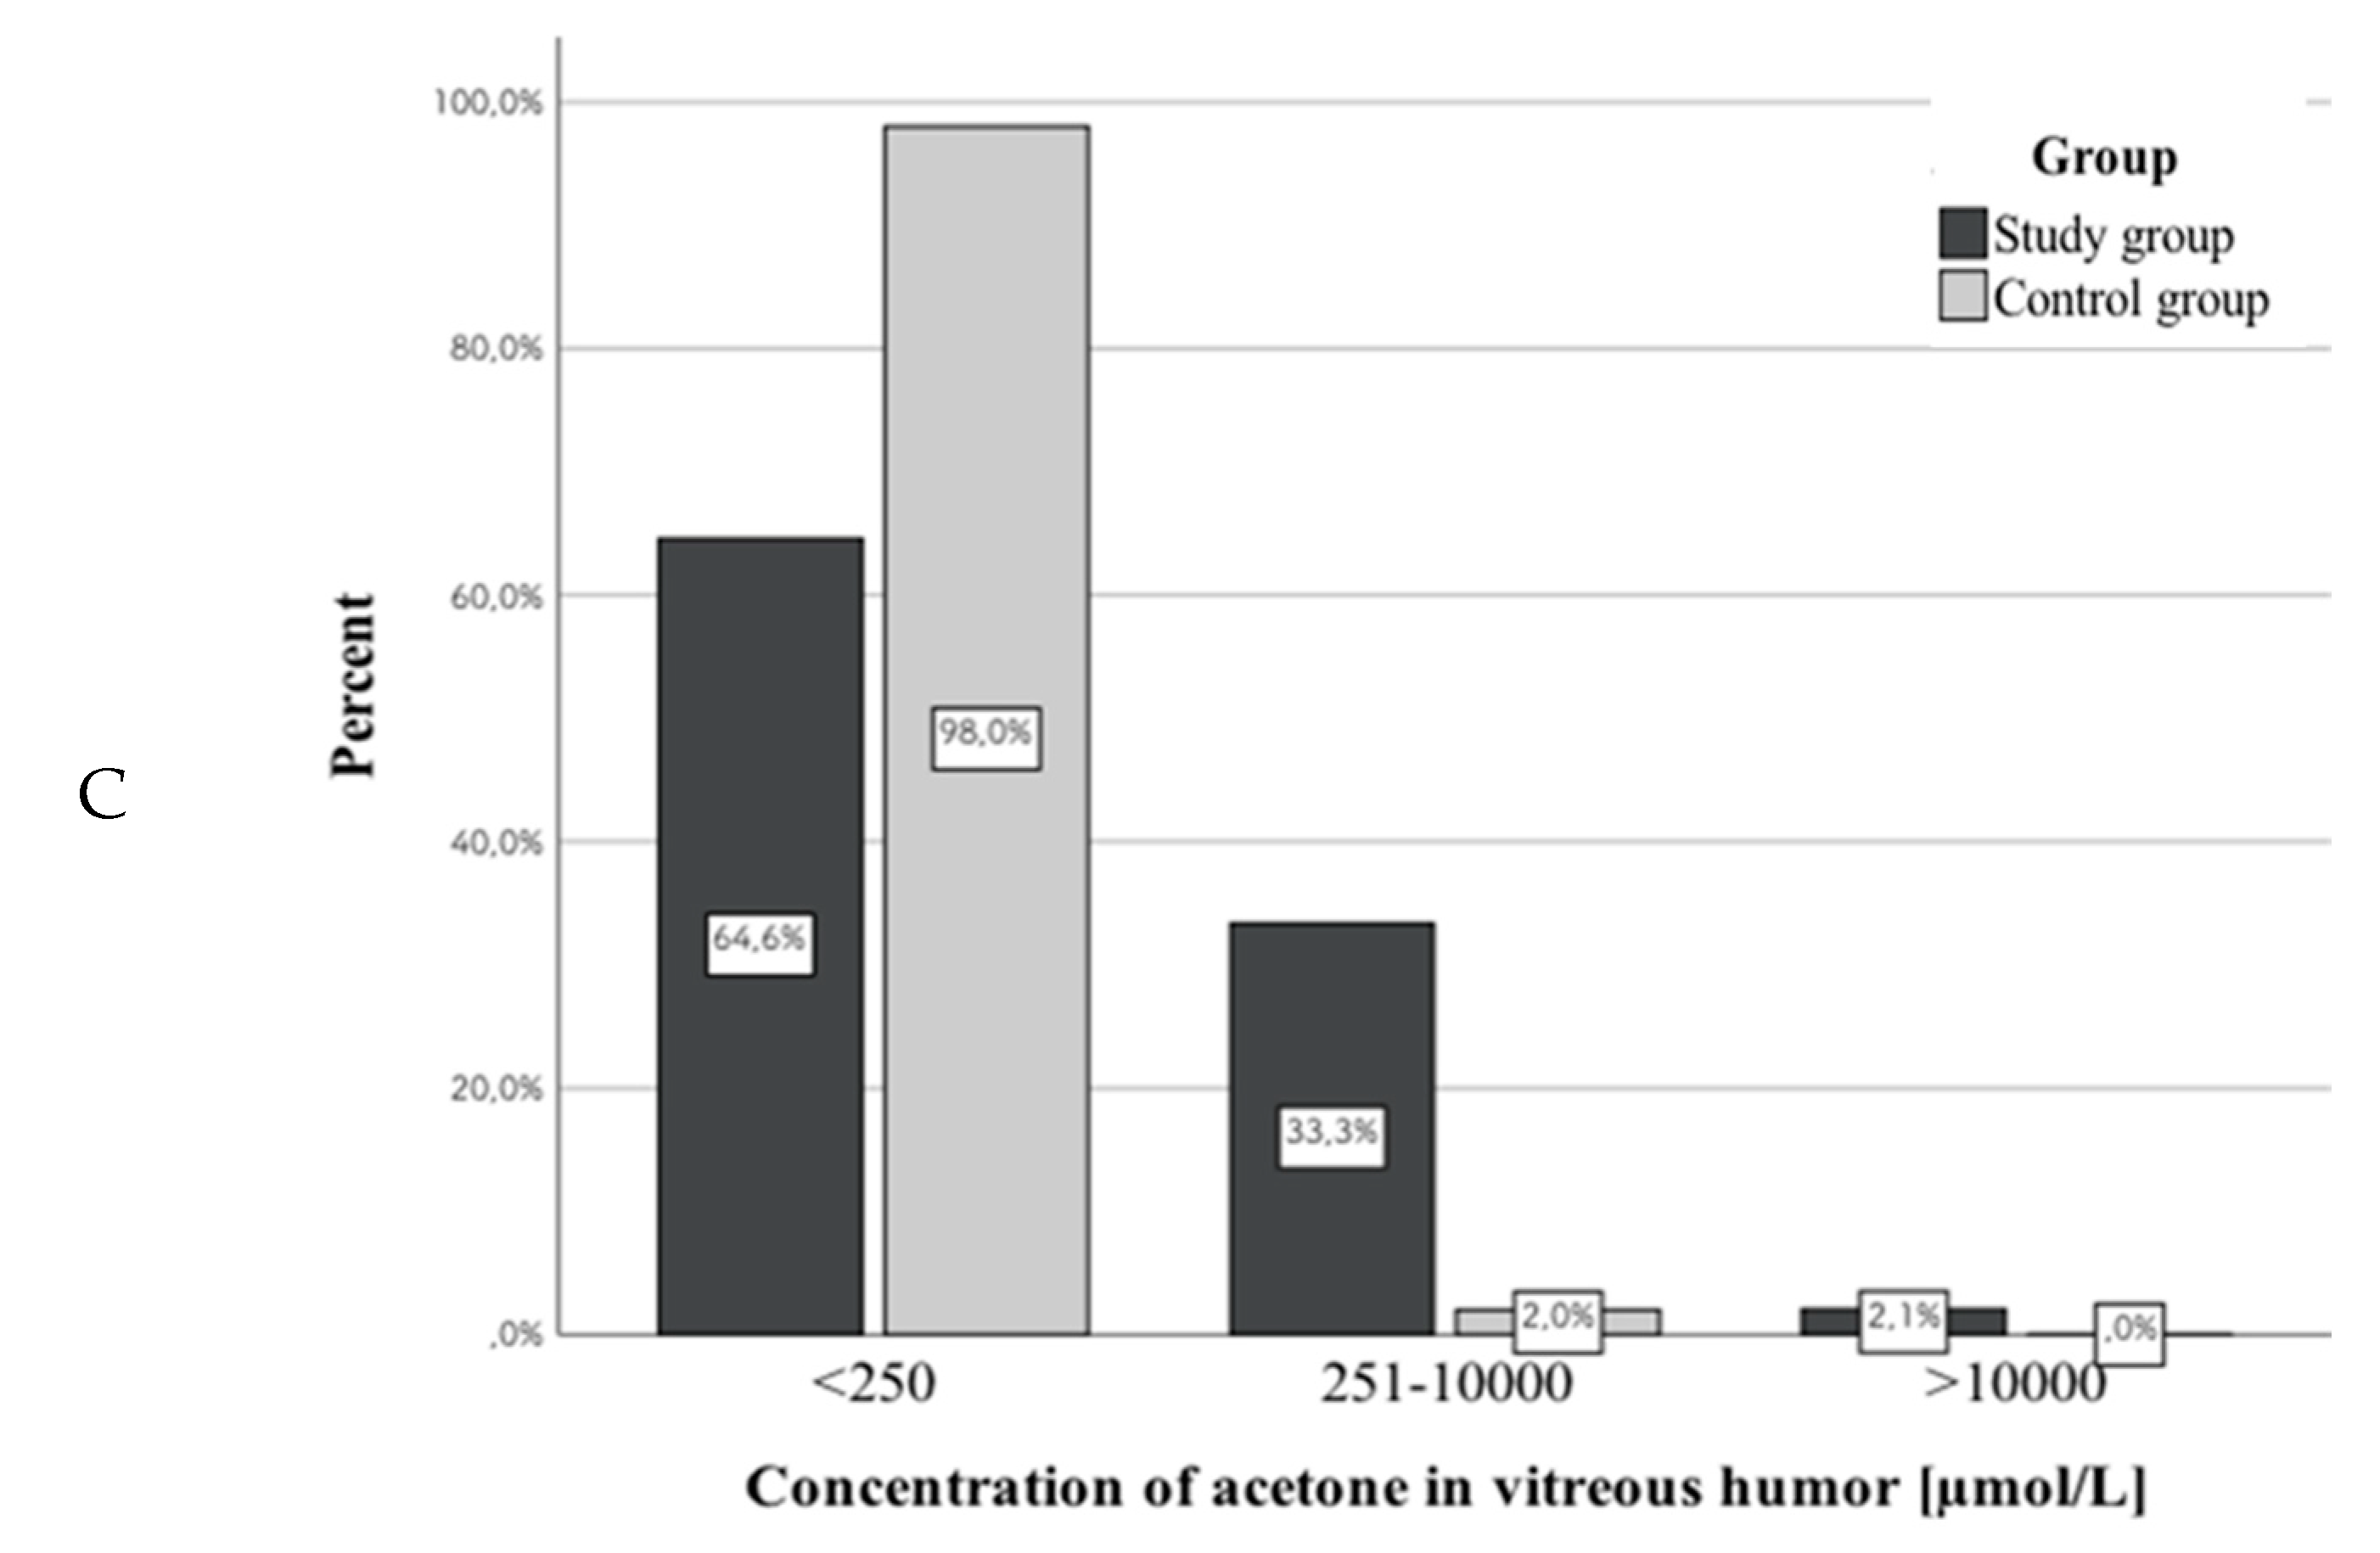
3.2. Acetone
3.3. β-hydroxybutyric Acid
3.4. 1,5-anhydroglucitol
3.5. PMI and Concentrations of Studied Markers
3.6. Assessment of the Correlation between Concentrations of the Same Marker in Different Biological Matrices
3.6.1. Glucose
3.6.2. Lactate
3.6.3. β-hydroxybutyric Acid
3.6.4. 1,5-anhydroglucitol
3.7. Assessment of the Correlation between Concentrations of the Analyzed Markers in Different Study Groups
4. Discussion
5. Limitations
6. Conclusions
Author Contributions
Funding
Conflicts of Interest
References
- IDF Diabetes Atlas Ninth Edition 2019. Available online: https://www.idf.org/e-library/epidemiology-research/diabetes-atlas/159-idf-diabetes-atlas-ninth-edition-2019.html (accessed on 20 March 2020).
- Palmiere, C. Postmortem diagnosis of diabetes mellitus and its complications. Croat. Med. J. 2015, 56, 181–193. [Google Scholar] [CrossRef] [Green Version]
- Musshoff, F.; Hess, C.; Madea, B. Disorders of glucose metabolism: Post mortem analyses in forensic cases-part II. Int. J. Leg. Med. 2011, 125, 171–180. [Google Scholar] [CrossRef] [PubMed]
- Szadkowska, A. Acute complications of diabetes mellitus. Fam. Med. Prim. Care Rev. 2012, 14, 286–290. (In Polish) [Google Scholar]
- Solnica, B. Laboratory diagnosis of metabolic diseases. In Laboratory Diagnostics, 1st ed.; Solnica, B., Ed.; PZWL: Warsaw, Poland, 2014; pp. 169–170. (In Polish) [Google Scholar]
- Winecker, R.E.; Hammett-Stabler, C.A.; Chapman, J.F.; Ropero-Miller, J.D. HbA1c as a postmortem tool to identify glycemic control. J. Forensic Sci. 2002, 47, 1373–1379. [Google Scholar] [CrossRef]
- Ergönen, A.T.; Can, I.Ö.; Özdemir, H.M.; Sonmez, E.; Kume, T.; Salacin, S.; Ergönen, F.; Önvural, B.; Sen, F. Evaluation of glycosylated hemoglobin and glycosylated albumin levels in forensic autopsies. Rom. J. Leg. Med. 2010, 18, 63–68. [Google Scholar] [CrossRef] [Green Version]
- Yang, C.; Li, H.; Wang, Z.; Zhang, W.; Zhou, K.; Meng, J.; Technician, C.; Zhao, Y.; Technician, C.; Pan, J.; et al. Glycated albumin is a potential diagnostic tool for diabetes mellitus. Clin. Med. 2012, 12, 568–571. [Google Scholar] [CrossRef] [PubMed]
- Hess, C.; Musshoff, F.; Madea, B. 1, 5-anhydroglucitol- a marker for ante mortem hyperglycemia? Toxichem Krimtech. 2011, 78, 363–366. [Google Scholar]
- Nowak, K.; Zawadzki, M.; Jurek, T. Postmortem determination of HbA1c and glycated albumin concentrations using the UHPLC-QqQ-MS/MS method for the purposes of medicolegal opinions. Microchem. J. 2020, 155, 104733. [Google Scholar] [CrossRef]
- Hess, C.; Stratmann, B.; Quester, W.; Madea, B.; Musshoff, F.; Tschoepe, D. Clinical and forensic examination of glycemic marker 1,5-anhydroglucitol by means of high performance liquid chromatography tandem mass spectrometry. Forensic Sci. Int. 2012, 222, 132–136. [Google Scholar] [CrossRef]
- Matuszewski, B.K.; Constanzer, M.L.; Chavez-Eng, C.M. Strategies for the assessment of matrix effect in quantitative bioanalytical methods based on HPLC–MS/MS. Anal. Chem. 2003, 75, 3019–3030. [Google Scholar] [CrossRef]
- Karlovsek, M.Z. Diagnostic values of combined glucose and lactate values in cerebrospinal fluid and vitreous humour- our experience. Forensic Sci. Int. 2004, 146, S19–S23. [Google Scholar] [CrossRef] [PubMed]
- Hess, C.; Mushoff, F.; Medea, B. Disorders of glucose metabolism- post mortem analyses in forensic cases: Part I. Int. J. Leg. Med. 2011, 125, 163–170. [Google Scholar] [CrossRef] [PubMed]
- Goulle, J.-P.; Lacroix, C.; Bouige, D. Glycated haemoglobin: A useful post-mortem reference marker in determining diabetes. Forensic Sci. Int. 2002, 128, 44–49. [Google Scholar] [CrossRef]
- Zilg, B.; Alkass, K.; Berg, S.; Druid, H. Postmortem identification of hyperglycemia. Forensic Sci. Int. 2009, 185, 89–95. [Google Scholar] [CrossRef]
- Cobas® Glucose HK Gen.3 Reagent Package Insert. Available online: http://info.fda.gov.tw/MLMS/ShowFile.aspx?LicId=06021676&Seq=002&Type=9 (accessed on 20 March 2020).
- Cobas® Lactate Gen.2 Reagent Package Insert. Available online: http://labogids.sintmaria.be/sites/default/files/files/lact2_2018-11_v12.pdf (accessed on 20 March 2020).
- Heimer, J.; Gascho, D.; Chatzaraki, V.; Kanute, D.F.; Sterzik, V.; Martinez, R.M.; Thali, M.J.; Zoelch, N. Postmortem 1H-MRS-detection of ketone bodies and glucose in diabetic ketoacidosis. Int. J. Leg. Med. 2018, 132, 593–598. [Google Scholar] [CrossRef] [PubMed]
- Boulagnon, C.; Garnotel, R.; Fornes, P.; Gillery, P. Post-mortem biochemistry of vitreous humor and glucose metabolism: An update. Clin. Chem. Lab. Med. 2011, 49, 1265–1270. [Google Scholar] [CrossRef]
- Madea, B. Is there recent progress in the estimation of the postmortem interval by means of tanatochemistry? Forensic Sci. Int. 2005, 151, 139–149. [Google Scholar] [CrossRef]
- Blana, S.A.; Musshoff, F.; Hoeller, T.; Fimmers, R.; Madea, B. Variations in vitreous humor chemical values as a result of pre-analytical treatment. Forensic Sci. Int. 2011, 210, 263–270. [Google Scholar] [CrossRef]
- Vivero, G.; Vivero-Salmerón, G.; Pérez Cárceles, M.D.; Bedate, A.; Luna, A.; Osuna, E. Combined determination of glucose and fructosamine in vitreous humor as a post-mortem tool to identify antemortem hyperglycemia. Rev. Diabet. Stud. 2008, 5, 220–224. [Google Scholar] [CrossRef] [Green Version]
- Keltanen, T.; Neonen, T.; Ketola, R.A.; Ojanperä, I.; Sajantila, A.; Lindroos, K. Post-mortem analysis of lactate concentration in diabetics and metformin poisonings. Int. J. Leg. Med. 2015, 129, 1225–1231. [Google Scholar] [CrossRef]
- Teresiński, G.; Buszewicz, G.; Mądro, R. Usefulness of ß-hydroxybutyric acid, acetoacetic acid and acetone determinations in blood, urine and vitreous humour for necrochemical diagnosis of premortal metabolic disorders. Probl. Forens. Sci. 2000, 44, 57–75. [Google Scholar]
- Keltanen, T.; Sajantila, A.; Palo, J.U.; Partnen, T.; Valonen, T.; Lindroos, K. Assessment of Traub formula and ketone bodies in cause of deathinvestigations. Int. J. Leg. Med. 2013, 127, 1131–1137. [Google Scholar] [CrossRef] [PubMed]
- Brinkmann, B.; Fechner, G.; Karger, B.; DuChesne, A. Ketoacidosis and lactic acidosis–frequent causes of death in chronic alcoholics? Int. J. Legal. Med. 1998, 111, 115–119. [Google Scholar] [CrossRef] [PubMed]
- Heninger, M. Postmortem vitreous beta-hydroxybutyrate: Interpretation in a forensic setting. J. Forensic Sci. 2012, 57, 1234–1240. [Google Scholar] [CrossRef]
- Elliot, S.; Smith, C.; Cassidy, D. The post-mortem relationship between beta-hydroxybutyrate (BHB), acetone and ethanol in ketoacidosis. Forensic Sci. Int. 2010, 198, 53–57. [Google Scholar] [CrossRef]
- Iten, P.X.; Meier, M. Beta-hydroxybutyric acid—an indicator for an alcoholic ketoacidosis as cause of death in deceased alcohol abusers. J. Forensic Sci. 2000, 45, 624–632. [Google Scholar] [CrossRef]
- Nowak, N. Evaluation of 1, 5-Anhydroglucitol as a Marker of Metabolic Control in Pregnant Women with Type I Diabetes. Ph.D. Thesis, Jagiellonian University, Kraków, Poland, 2012. [Google Scholar]
- Dąbrowska, A.M.; Tarach, J.S.; Kurowska, M. 1, 5-anhydroglucitol (1,5-AG) and its usefulness in clinical practice. Med. Biol. Sci. 2012, 26, 11–17. [Google Scholar] [CrossRef] [Green Version]
- Takata, T.; Yamasaki, Y.; Kitao, T.; Miyaishi, S. Measurement of postmortem 1, 5-anhydroglucitol in vitreous humor for forensic diagnosis. J. Forensic Sci. 2016, 61, 150–153. [Google Scholar] [CrossRef]
- Sydow, K.; Kueting, T.; Musshoff, F.; Madea, B.; Hess, C. 1,5-Anhydro-D-glucitol in vitreous humor and cerebrospinal fluid—A helpful tool for identification of diabetes coma post mortem. Forensic Sci. Int. 2018, 289, 397–407. [Google Scholar] [CrossRef] [PubMed]
- Sydow, K.; Wiedfeld, C.; Musshoff, F.; Madea, B.; Tschoepe, D.; Stratmann, B.; Hess, C. Evaluation of 1,5-anhydro-D-glucitol in clinical and forensic urine samples. Forensic Sci. Int. 2018, 287, 88–97. [Google Scholar] [CrossRef] [PubMed]
- Belsey, S.I.; Flangan, R.J. Post-mortem biochemistry: Current applications. J. Forensic Leg. Med. 2016, 41, 49–57. [Google Scholar] [CrossRef] [PubMed] [Green Version]
- Holstein, A.; Titzle, U.; Hess, C. Postmortem analysis of vitreous humor for determination of antemortem disorders in glucose metabolism. An old method revisited. Exp. Clin. Endocrinol. Diabetes 2018. [Google Scholar] [CrossRef]
- Garland, J.; Olds, K.; Rousseau, G.; Palmiere, C.; Ondruschka, B.; Kesha, K.; Glenn, C.; Morrow, P.; Stables, S.; Tse, R. Using vitreous humour and cerebrospinal fluid electrolytes in estimating post-mortem interval—An exploratory study. Aust. J. Forensic Sci. 2019. [Google Scholar] [CrossRef]
- Garland, J.; Philcox, W.; McCarthy, S.; Kesha, K.; Lam, L.; Spark, A.; Palmiere, C.; Elstub, H.; Cala, A.D.; Stables, S.; et al. Post-mortem biochemistry differences between vitreous humour and cerebrospinal fluid. Aust. J. Forensic Sci. 2019. [Google Scholar] [CrossRef]
- Pérez-Martínez, C.; Bonete, G.P.; Pérez-Cárceles, M.D.; Luna, A. Influence of the nature of death in biochemical analysis of the vitreous humour for the estimation of post-mortem interval. Aust. J. Forensic Sci. 2019. [Google Scholar] [CrossRef]
- Felby, S.; Nielsen, E.; Thomsen, J.L. The postmortem distribution of ketone bodies between blood, vitreous humor, spinal fluid and urine. Forensic Sci. Med. Pathol. 2008, 4, 100–107. [Google Scholar] [CrossRef]
- Gagajewski, A.; Murakami, M.M.; Kloss, J.; Edstrom, M.; Hillyer, M.; Peterson, G.F.; Amatuzio, J.; Apple, F.S. Measurement of chemical analytes in vitreous humor: Stability and precision studies. J. Forensic Sci. 2004, 49, 371–374. [Google Scholar] [CrossRef]


| Compound | Transition (m/z) | CE (V) | Event Time (s) | Retention Time (min) |
|---|---|---|---|---|
| BHB derivate | 275.0 > 159.2 * 275.0 > 147.2 233.0 > 147.1 | 9 21 12 | 0.075 | 9.385 |
| BHB-d4 derivate | 279.0 > 163.2 * 279.0 > 147.5 237.0 > 146.9 | 6 30 33 | 0.075 | 9.375 |
| Compound | Precursor Ion (m/z) | Product Ion [m/z] | Dwell Time (msec) | Q1 Pre-Bias (V) | Collision Energy (V) | Q3 Pre-Bias (V) | Retention Time (min) |
|---|---|---|---|---|---|---|---|
| 1,5-Anhydro-D-glucitol | 163.2 | 101.0 * 112.9 58.9 | 81.0 | 12 12 12 | 12 15 24 | 19 21 23 | 0.73 |
| 1,5-Anhydro-D-glucitol-13C6 | 169.2 | 105.1 * 118.1 61.0 | 81.0 | 17 12 17 | 13 16 22 | 17 16 22 | 0.72 |
| Marker | Concentration of QC | Intra-Day Precision (%) | Intra-Day Accuracy (%) | Inter-Day Precision (%) | Inter-Day Accuracy (%) |
|---|---|---|---|---|---|
| Glucose | 103 mg/dL | 1.0 | 0.1 | 1.0 | 1.7 |
| 243 mg/dL | 0.3 | 0.0 | 0.8 | 0.3 | |
| Lactate | 15 mg/dL | 0.3 | 1.9 | 1.7 | 0.9 |
| 34.3 mg/dL | 0.5 | −1.8 | 1.0 | −0.5 |
| Parameter | Acetone | β-hydroxybutyric Acid | ||
|---|---|---|---|---|
| The linear concentration range (µmol/L) | 250–10,000 | 250–10,000 | ||
| The coefficient of determination (R2) | 0.9997 | 0.9968 | ||
| The calibration line equation | y = 4.7468x + 0 * | y = 0.0945x − 0.1593 ** | ||
| Intra-day precision (%) | 258 µmol/L | 5.2 | 250 µmol/L | 2.7 |
| 1075 µmol/L | 5.9 | 1000 µmol/L | 3.4 | |
| 8600 µmol/L | 2.0 | 9615 µmol/L | 4.0 | |
| Intra-day accuracy (%) | 258 µmol/L | 9.7 | 250 µmol/L | 3.0 |
| 1075 µmol/L | −2.3 | 1000 µmol/L | −3.1 | |
| 8600 µmol/L | 3.1 | 9615 µmol/L | −3.1 | |
| Inter-day precision (%) | 258 µmol/L | 7.0 | 250 µmol/L | 9.7 |
| 1075 µmol/L | 2.7 | 1000 µmol/L | 5.4 | |
| 8600 µmol/L | 2.7 | 9615 µmol/L | 3.2 | |
| Inter-day accuracy (%) | 258 µmol/L | 9.7 | 250 µmol/L | −6.9 |
| 1075 µmol/L | 3.5 | 1000 µmol/L | −10.8 | |
| 8600 µmol/L | 3.8 | 9615 µmol/L | −4.1 | |
| Parameter | Serum | Whole Blood | |
|---|---|---|---|
| The linear concentration range (µg/mL) | 0.25–50 | 0.50–50 | |
| LOD (limit of detection; µg/mL) | 0.10 | 0.10 | |
| LLOQ (lower limit of quantification; µg/mL) | 0.25 | 0.50 | |
| The coefficient of determination (R2) | 0.9998 | 0.9999 | |
| The calibration line equation | y = 0.335x + 0 | y = 0.0484x + 0.0464 | |
| Recovery (%) | 0.5 µg/mL | 93.1 | 90.4 |
| 5.0 µg/mL | 98.3 | 115.0 | |
| 50 µg/mL | 108.3 | 103.3 | |
| Matrix effect (%) | 0.5 µg/mL | 102.4 | 112.8 |
| 5.0 µg/mL | 92.9 | 87.8 | |
| 50 µg/mL | 93.4 | 86.2 | |
| Process efficiency (%) | 0.5 µg/mL | 95.3 | 102.0 |
| 5.0 µg/mL | 91.3 | 100.9 | |
| 50 µg/mL | 101.2 | 89.1 | |
| Intra-day precision (%) | 0.5 µg/mL | 5.7 | 2.3 |
| 5.0 µg/mL | 4.1 | 4.2 | |
| 50 µg/mL | 0.8 | 5.2 | |
| Intra-day accuracy (%) | 0.5 µg/mL | −0.3 | 6.6 |
| 5.0 µg/mL | 9.1 | 6.9 | |
| 50 µg/mL | 11.9 | −0.6 | |
| Inter-day precision (%) | 0.5 µg/mL | 3.3 | 6.4 |
| 5.0 µg/mL | 7.0 | 3.8 | |
| 50 µg/mL | 2.9 | 7.4 | |
| Inter-day accuracy (%) | 0.5 µg/mL | −2.4 | 2.6 |
| 5.0 µg/mL | 8.2 | 5.8 | |
| 50 µg/mL | 10.2 | 0.1 | |
| Marker | Group | Descriptive Statistics | ||||||
|---|---|---|---|---|---|---|---|---|
| M | SD | Me | Lower Quartile | Upper Quartile | The Result of the Statistical Test | |||
| Glucose | Concentration in serum (mg/dL) | Study group | 209 | 222 | 151 | 46 | 302 | t(89.82) = 2.51; p < 0.05 |
| Control group | 344 | 303 | 291 | 83 | 579.5 | |||
| Concentration in urine (mg/dL) | Study group | 382 | 846 | 21 | 9 | 226 | t(41.59) = 2.28; p < 0.05 | |
| Control group | 65 | 203 | 13 | 6.5 | 23.5 | |||
| Concentration in vitreous humor (mg/dL) | Study group | 119 | 216 | 9 | 5 | 154 | t(50.45) = 2.98; p < 0.05 | |
| Control group | 23 | 48 | 7 | 4.5 | 14 | |||
| Lactate | Concentration in serum (mg/dL) | Study group | 374 | 115 | 360 | 306 | 461 | t(96) = 0.89; p > 0.05 |
| Control group | 420 | 121 | 437.5 | 348 | 517 | |||
| Concentration in urine (mg/dL) | Study group | 208 | 138 | 208.5 | 72 | 310 | t(91) = 0.19; p > 0.05 | |
| Control group | 207 | 202 | 148.5 | 98 | 253.5 | |||
| Concentration in vitreous humor (mg/dL) | Study group | 359 | 137 | 357 | 282 | 460 | t(96) = 0.15; p > 0.05 | |
| Control group | 314 | 124 | 304 | 221.5 | 409 | |||
| Group | Descriptive Statistics | ||||||
|---|---|---|---|---|---|---|---|
| M | SD | Me | Lower Quartile | Upper Quartile | The Result of the Statistical Test | ||
| Concentration in whole blood | Study group | 1260 | 1602 | 582 | 414 | 1042 | t(90) = 1.29; p > 0.05 |
| Control group | 850 | 1436 | 352 | 297.5 | 936 | ||
| Concentration in urine | Study group | 1970 | 2161 | 1658 | 415 | 2253 | t(35.15) = 2.76; p < 0.01 |
| Control group | 792 | 688 | 670 | 463 | 824 | ||
| Concentration in vitreous humor | Study group | 1752 | 2327 | 868 | 419 | 1590 | t(50.63) = 2.23; p < 0.05 |
| Control group | 826 | 837 | 565 | 275 | 1274 | ||
| Group | Descriptive Statistics | ||||||
|---|---|---|---|---|---|---|---|
| M | SD | Me | Lower Quartile | Upper Quartile | The Result of the Statistical Test | ||
| Concentration in whole blood | Study group | 12.7 | 12.3 | 7.8 | 2.9 | 20.8 | t(98) = 5.61; p < 0.001 |
| Control group | 26.5 | 12.3 | 24.2 | 18.7 | 31.8 | ||
| Concentration in serum | Study group | 18.6 | 17.8 | 12.4 | 5.9 | 26.7 | t(80.92) = 8.78; p < 0.001 |
| Control group | 45.4 | 11.7 | 44.2 | 33.8 | 52.2 | ||
| Concentration in vitreous humor | Study group | 17.5 | 16.9 | 9.1 | 4.7 | 27.3 | t(94) = 7.83; p < 0.001 |
| Control group | 43.3 | 15.4 | 44.5 | 31.6 | 53.3 | ||
| Marker | PMI | |||||
|---|---|---|---|---|---|---|
| Study Group | Control Group | |||||
| Serum | Urine | Vitreous Humor | Serum | Urine | Vitreous Humor | |
| Glucose | −0.18 | 0.002 | 0.18 | 0.06 | 0.01 | 0.14 |
| Lactate | 0.15 | 0.23 | 0.45 | −0.09 | 0.02 | 0.13 |
| 1,5-anhydroglucitol | −0.16 (blood) | −0.05 (serum) | −0.06 | 0.18 (blood) | 0.04 (serum) | 0.29 |
| BHB | −0.27 | −0.31 | −0.44 | 0.15 | 0.21 | 0.01 |
| Glucose | ||||
|---|---|---|---|---|
| Biological Material | Serum | Urine | Vitreous Humor | |
| Serum | Study group | - | 0.25 | 0.39 |
| Control group | - | 0.04 | −0.09 | |
| Urine | Study group | 0.25 | - | 0.61 |
| Control group | 0.04 | - | 0.26 | |
| Vitreous humor | Study group | 0.39 | 0.61 | - |
| Control group | −0.09 | 0.26 | - | |
| Lactate | ||||
|---|---|---|---|---|
| Biological Material | Serum | Urine | Vitreous Humor | |
| Serum | Study group | - | 0.4 | 0.61 |
| Control group | - | −0.07 | 0.54 | |
| Urine | Study group | 0.4 | - | 0.51 |
| Control group | −0.07 | - | 0.04 | |
| Vitreous humor | Study group | 0.61 | 0.51 | - |
| Control group | 0.54 | 0.04 | - | |
| β-hydroxybutyric Acid | ||||
|---|---|---|---|---|
| Biological Material | Blood | Urine | Vitreous Humor | |
| Blood | Study group | - | 0.46 | 0.77 |
| Control group | - | 0.002 | 0.63 | |
| Urine | Study group | 0.46 | - | 0.33 |
| Control group | 0.001 | - | 0.4 | |
| Vitreous humor | Study group | 0.77 | 0.33 | - |
| Control group | 0.63 | 0.41 | - | |
| 1,5-anhydroglucitol | ||||
|---|---|---|---|---|
| Biological Material | Blood | Serum | Vitreous Humor | |
| Blood | Study group | - | 0.77 | 0.66 |
| Control group | - | 0.59 | 0.56 | |
| Serum | Study group | 0.77 | - | 0.7 |
| Control group | 0.59 | - | 0.81 | |
| Vitreous humor | Study group | 0.66 | 0.7 | - |
| Control group | 0.56 | 0.81 | - | |
| Study Group | Control Group | |
|---|---|---|
| Positive Correlation | Serum glucose concentration versus serum lactate concentration, r = 0.31; p < 0.05 Urine glucose concentration versus HbA1c levels, r = 0.48; p < 0.01 VH glucose concentration versus VH lactate levels, r = 0.3; p < 0.05 VH glucose concentration versus HbA1c levels, r = 0.38; p < 0.05 Serum lactate concentration versus HbA1c levels, r = 0.34; p < 0.05 | Serum glucose concentration versus serum lactate concentration, r = 0.31; p < 0.05 Urine glucose concentration versus urine lactate concentration, r = 0.32; p < 0.05 |
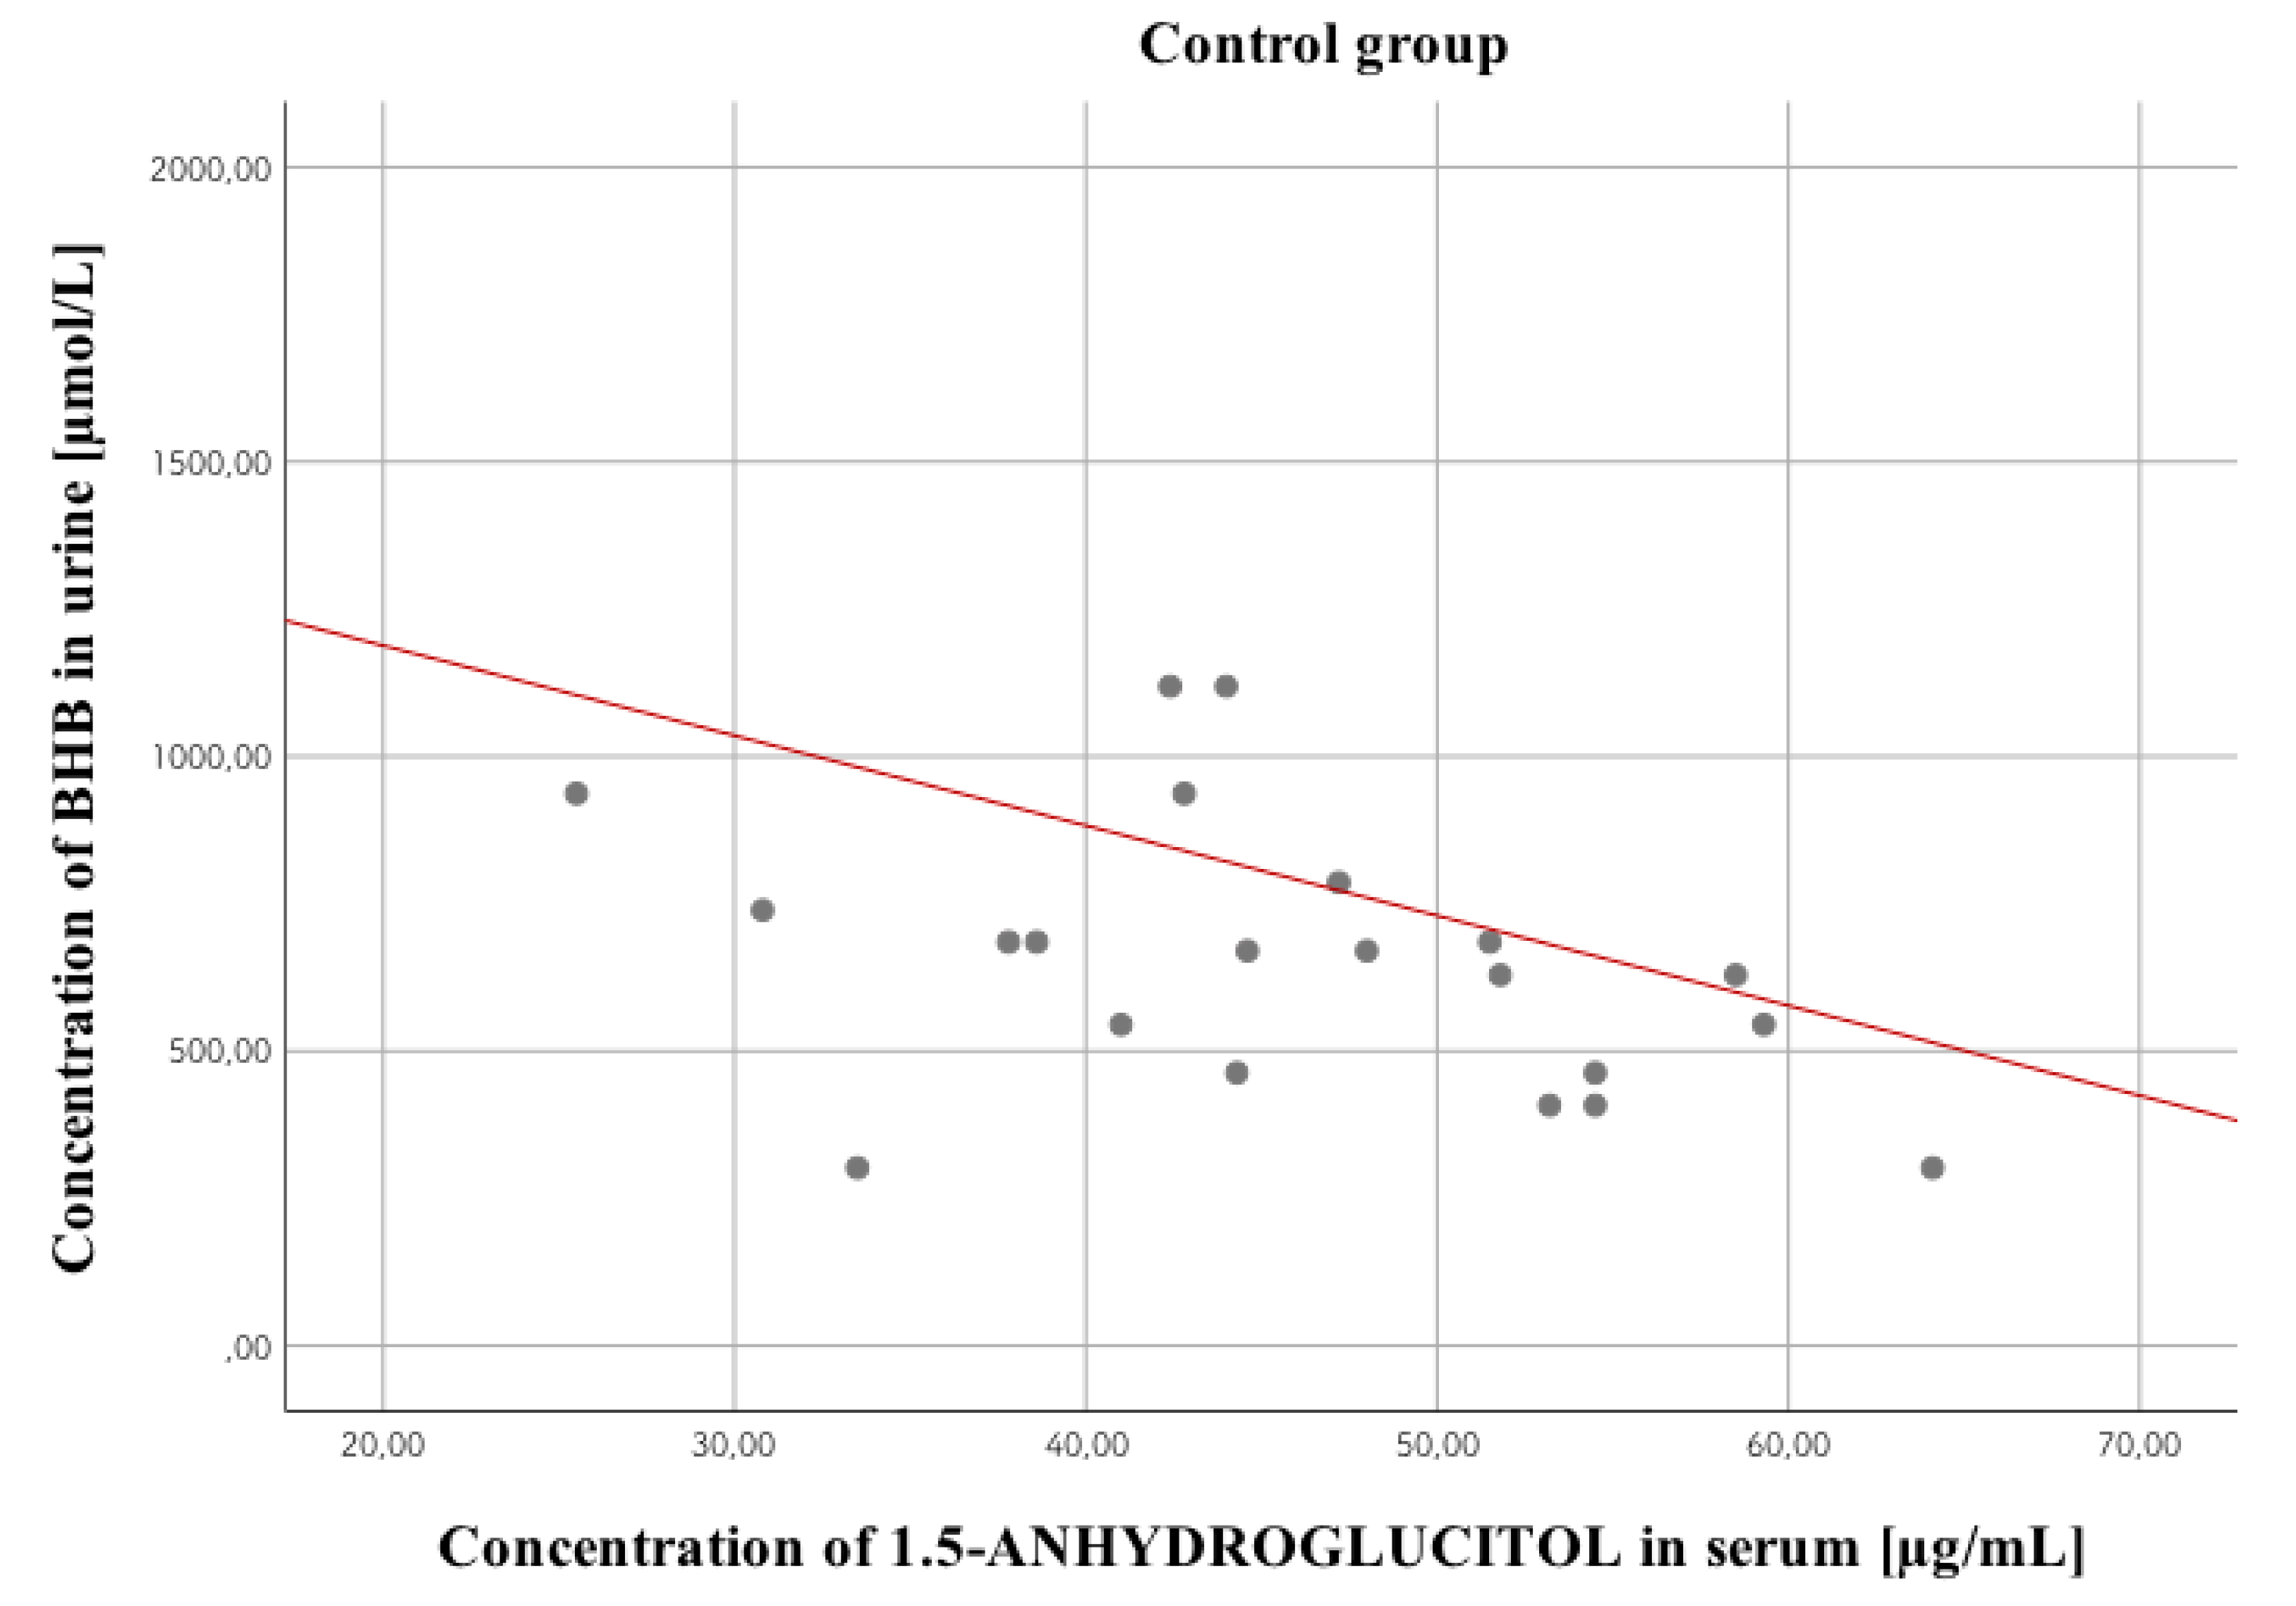
| Negative Correlation | VH 1,5-AG concentration versus HbA1c concentration, r = –0.38; p < 0.01 VH glucose concentration versus VH 1,5-AG concentration, r = –0.38; p < 0.01 | VH glucose concentration versus VH 1,5-AG concentration, r = –0.3; p < 0.05 Urine glucose concentration versus VH 1,5-AG concentration, r = –0.31; p < 0.05 Urine lactate concentration versus VH 1,5-AG concentration, r = –0.35; p < 0.05 VH lactate concentration versus VH 1,5-AG concentration, r = –0.31; p < 0.05 Serum 1,5-AG concentration versus urine BHB concentration, r = –0.5; p < 0.05 |
© 2020 by the authors. Licensee MDPI, Basel, Switzerland. This article is an open access article distributed under the terms and conditions of the Creative Commons Attribution (CC BY) license (http://creativecommons.org/licenses/by/4.0/).
Share and Cite
Nowak, K.; Jurek, T.; Zawadzki, M. Postmortem Determination of Short-Term Markers of Hyperglycemia for the Purposes of Medicolegal Opinions. Diagnostics 2020, 10, 236. https://doi.org/10.3390/diagnostics10040236
Nowak K, Jurek T, Zawadzki M. Postmortem Determination of Short-Term Markers of Hyperglycemia for the Purposes of Medicolegal Opinions. Diagnostics. 2020; 10(4):236. https://doi.org/10.3390/diagnostics10040236
Chicago/Turabian StyleNowak, Karolina, Tomasz Jurek, and Marcin Zawadzki. 2020. "Postmortem Determination of Short-Term Markers of Hyperglycemia for the Purposes of Medicolegal Opinions" Diagnostics 10, no. 4: 236. https://doi.org/10.3390/diagnostics10040236