Detection of Bacterial and Viral Pathogens Using Photonic Point-of-Care Devices


Abstract
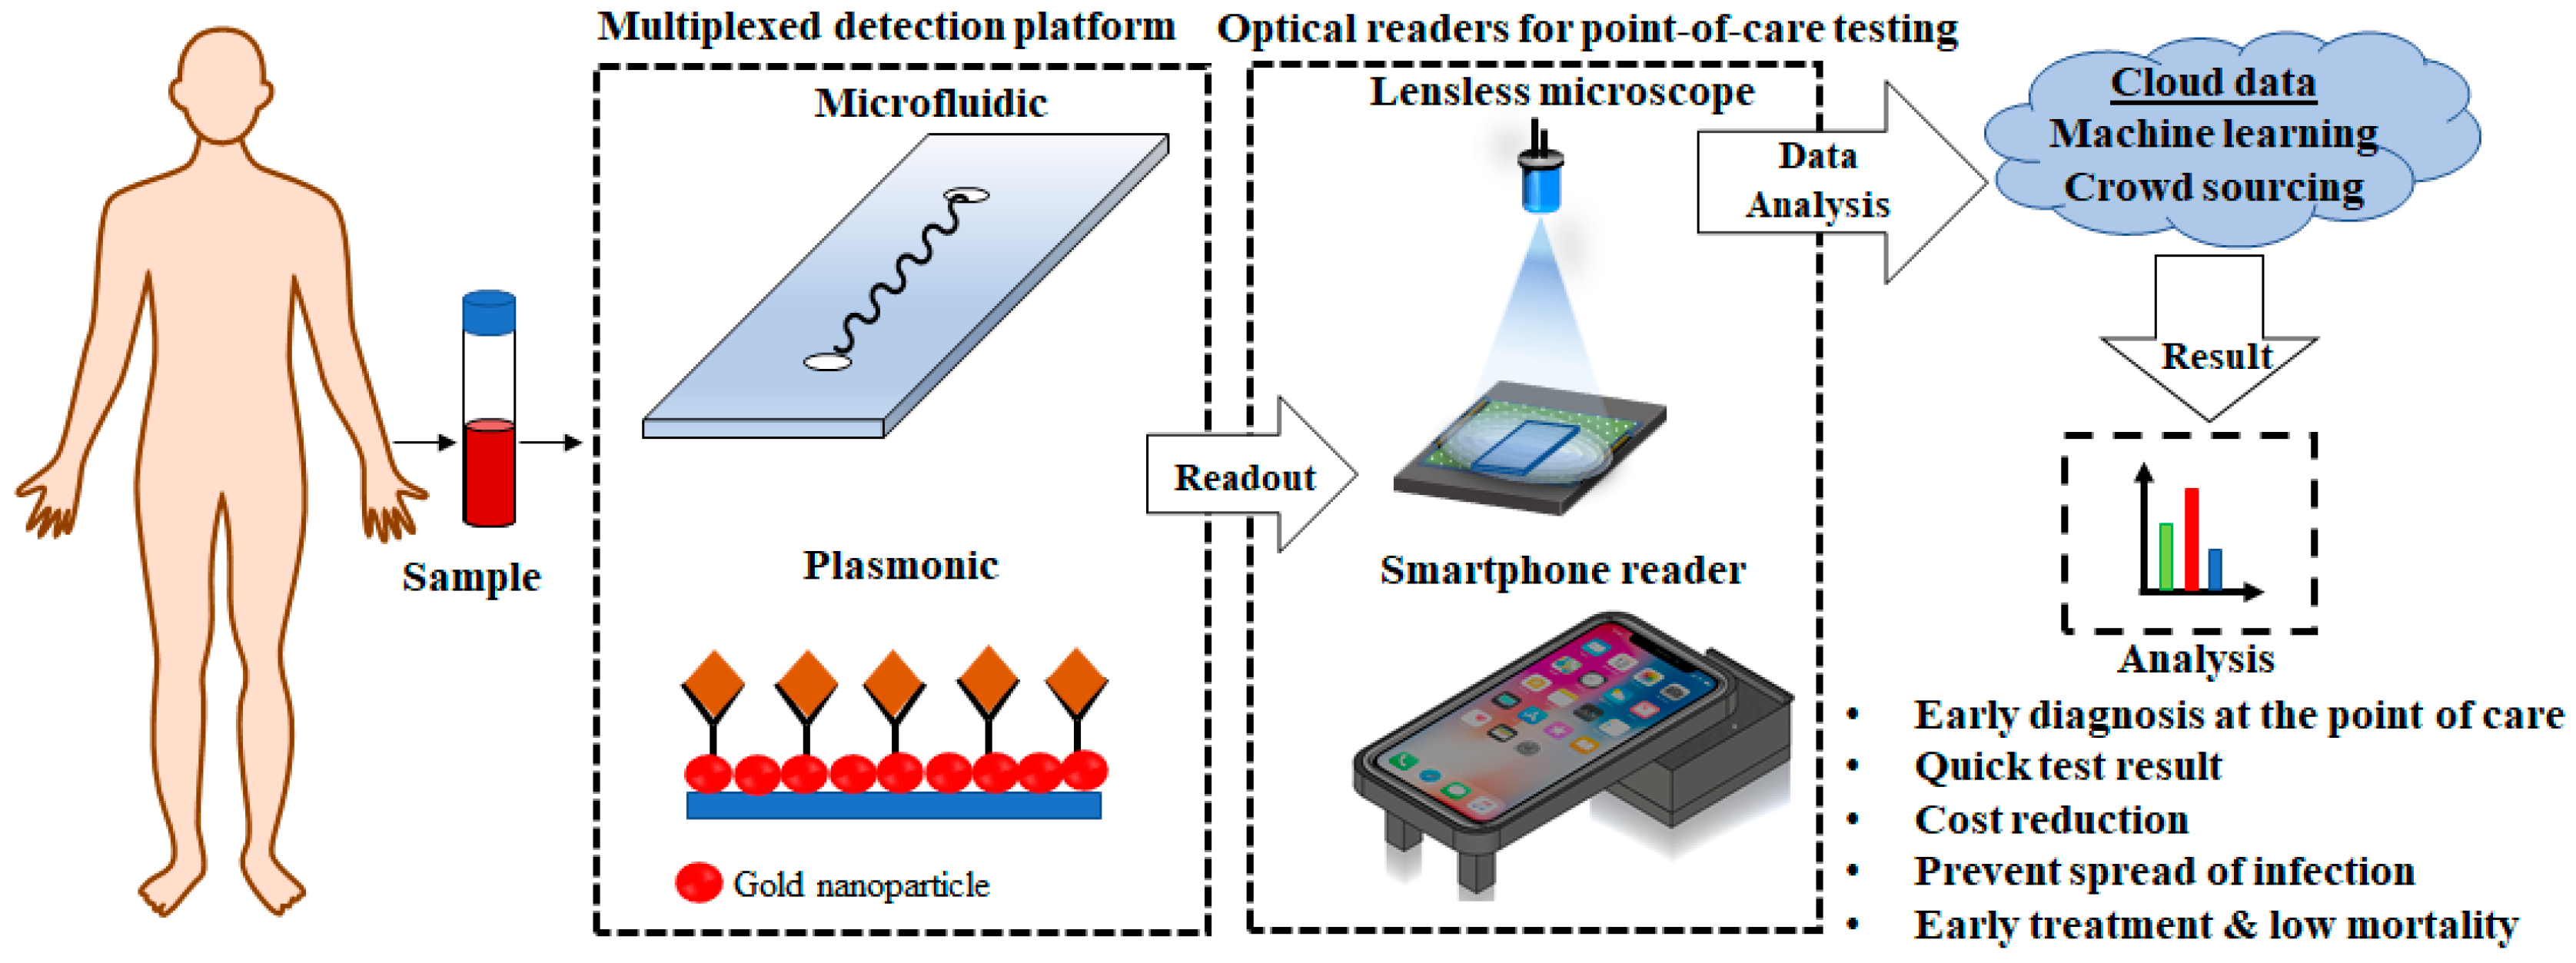
:1. Introduction
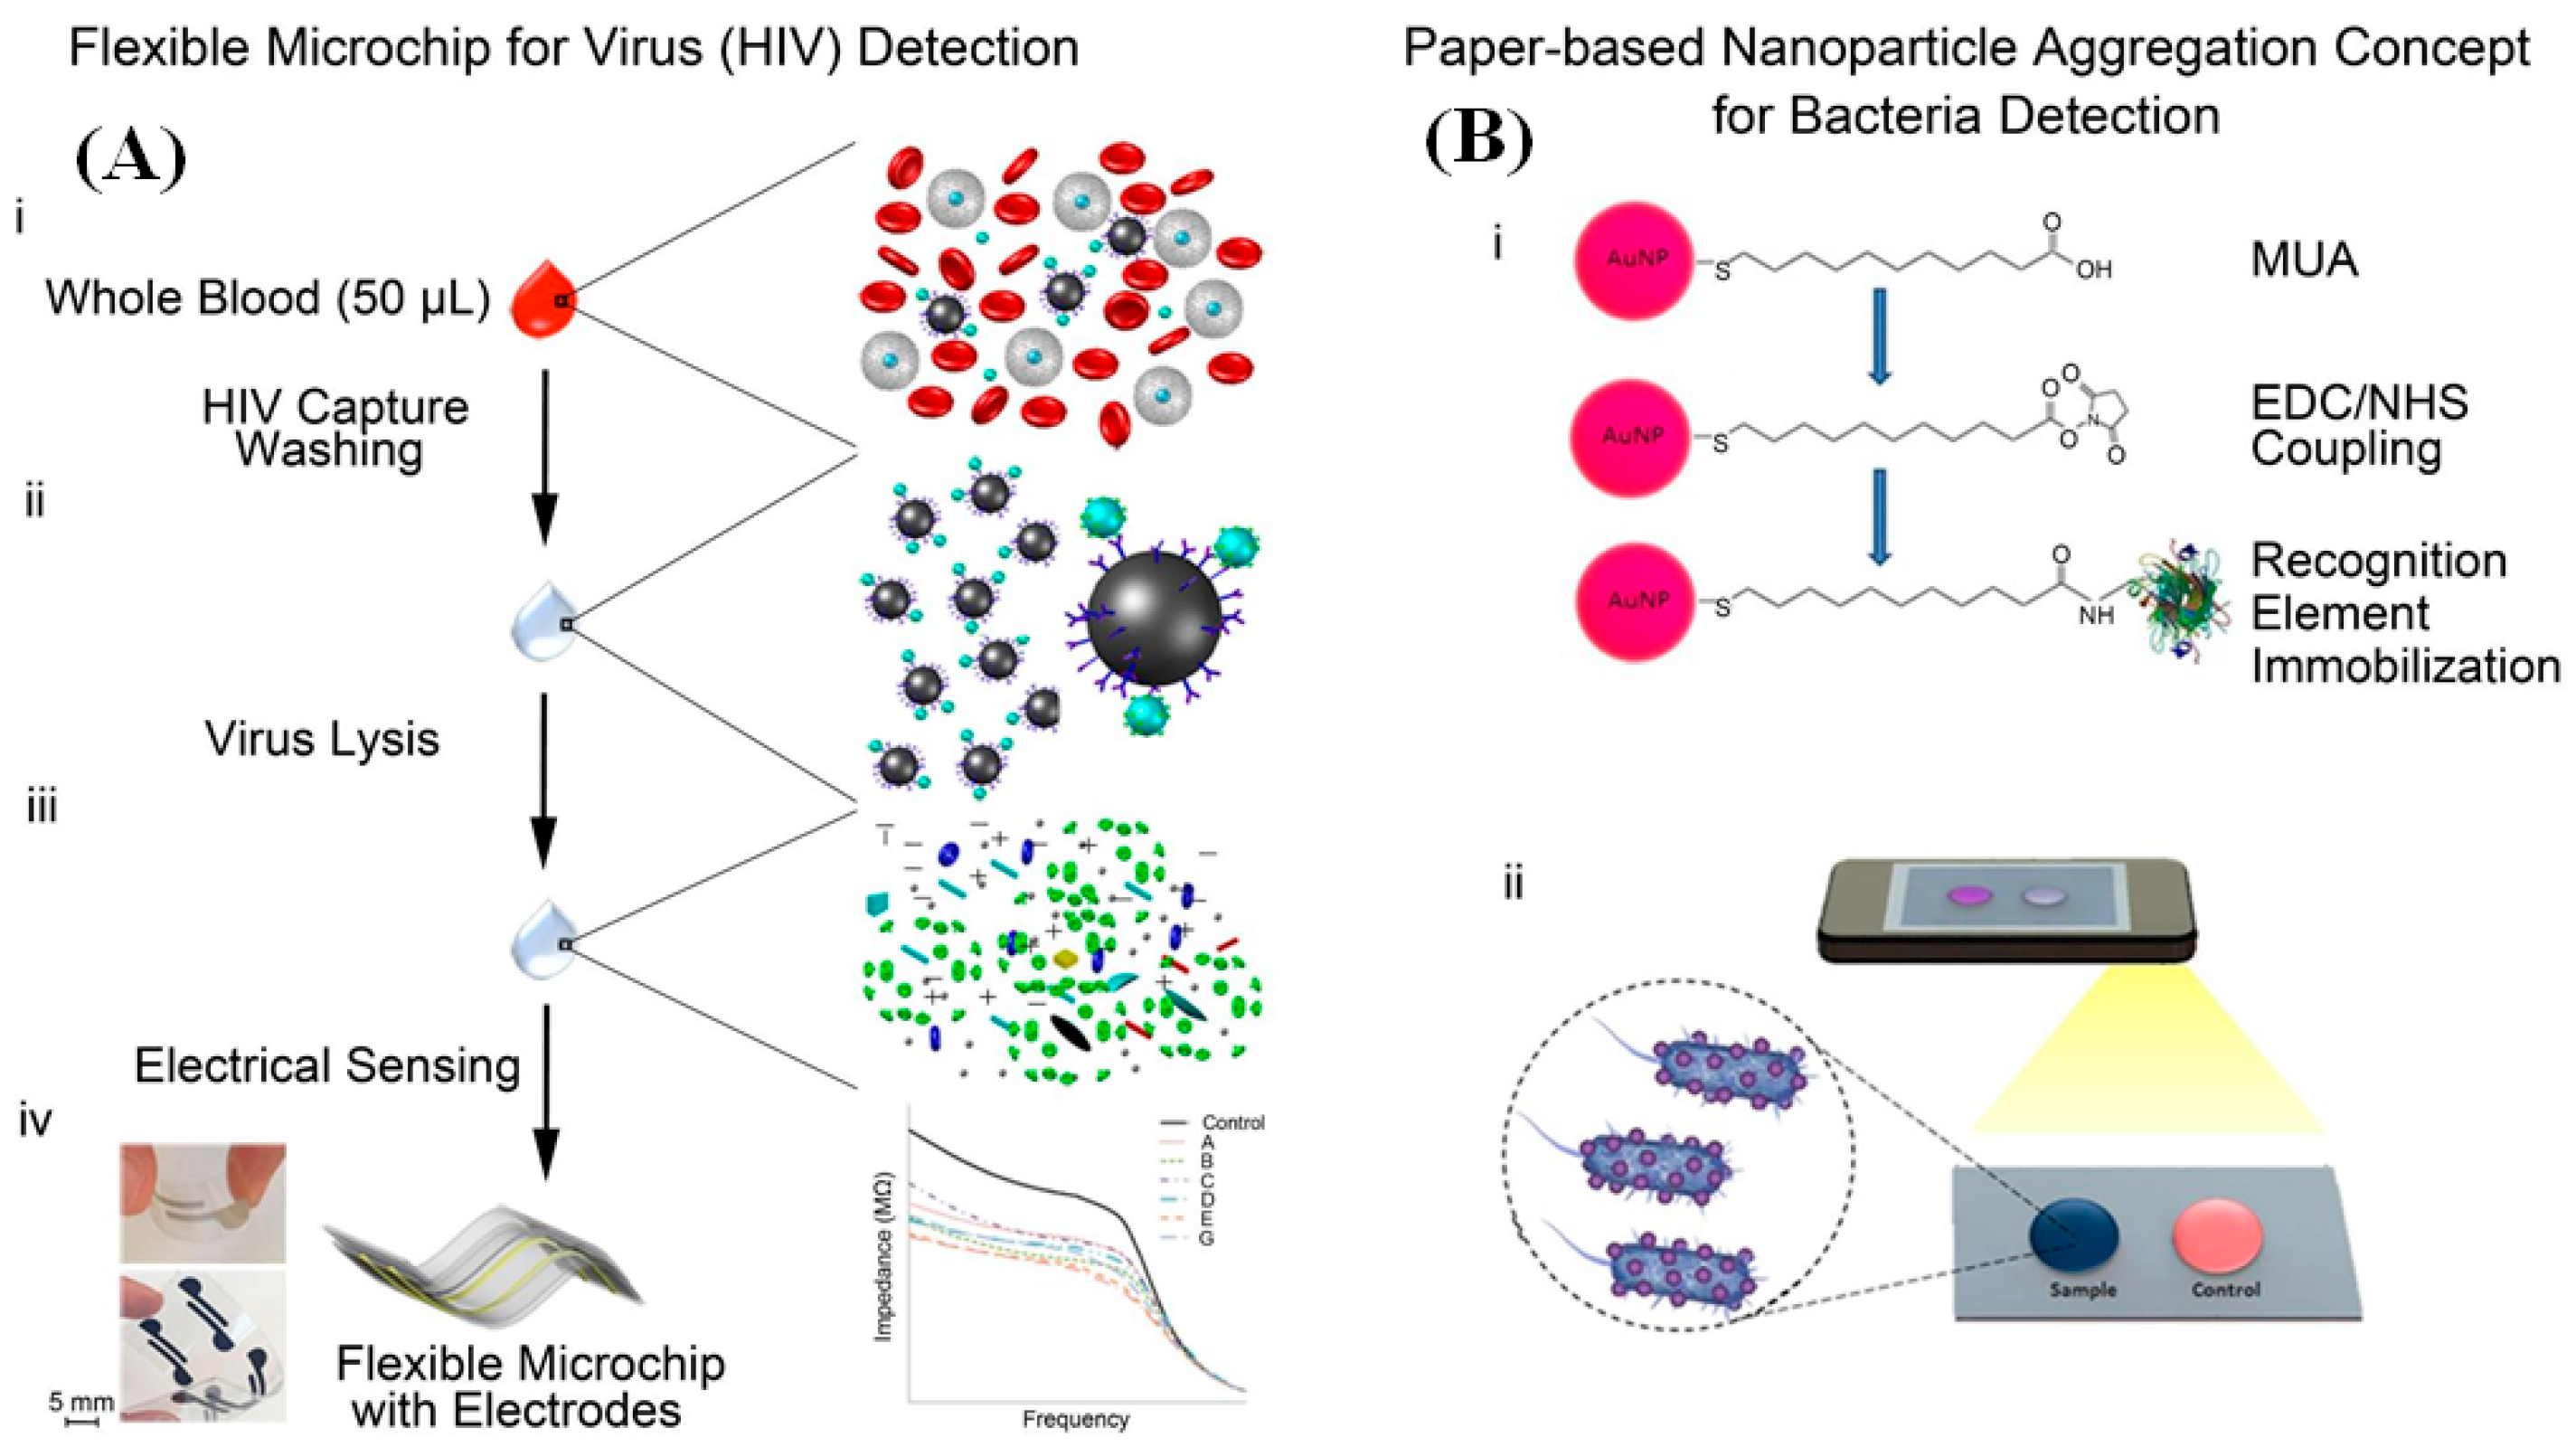
2. Microfluidics-Based Platforms
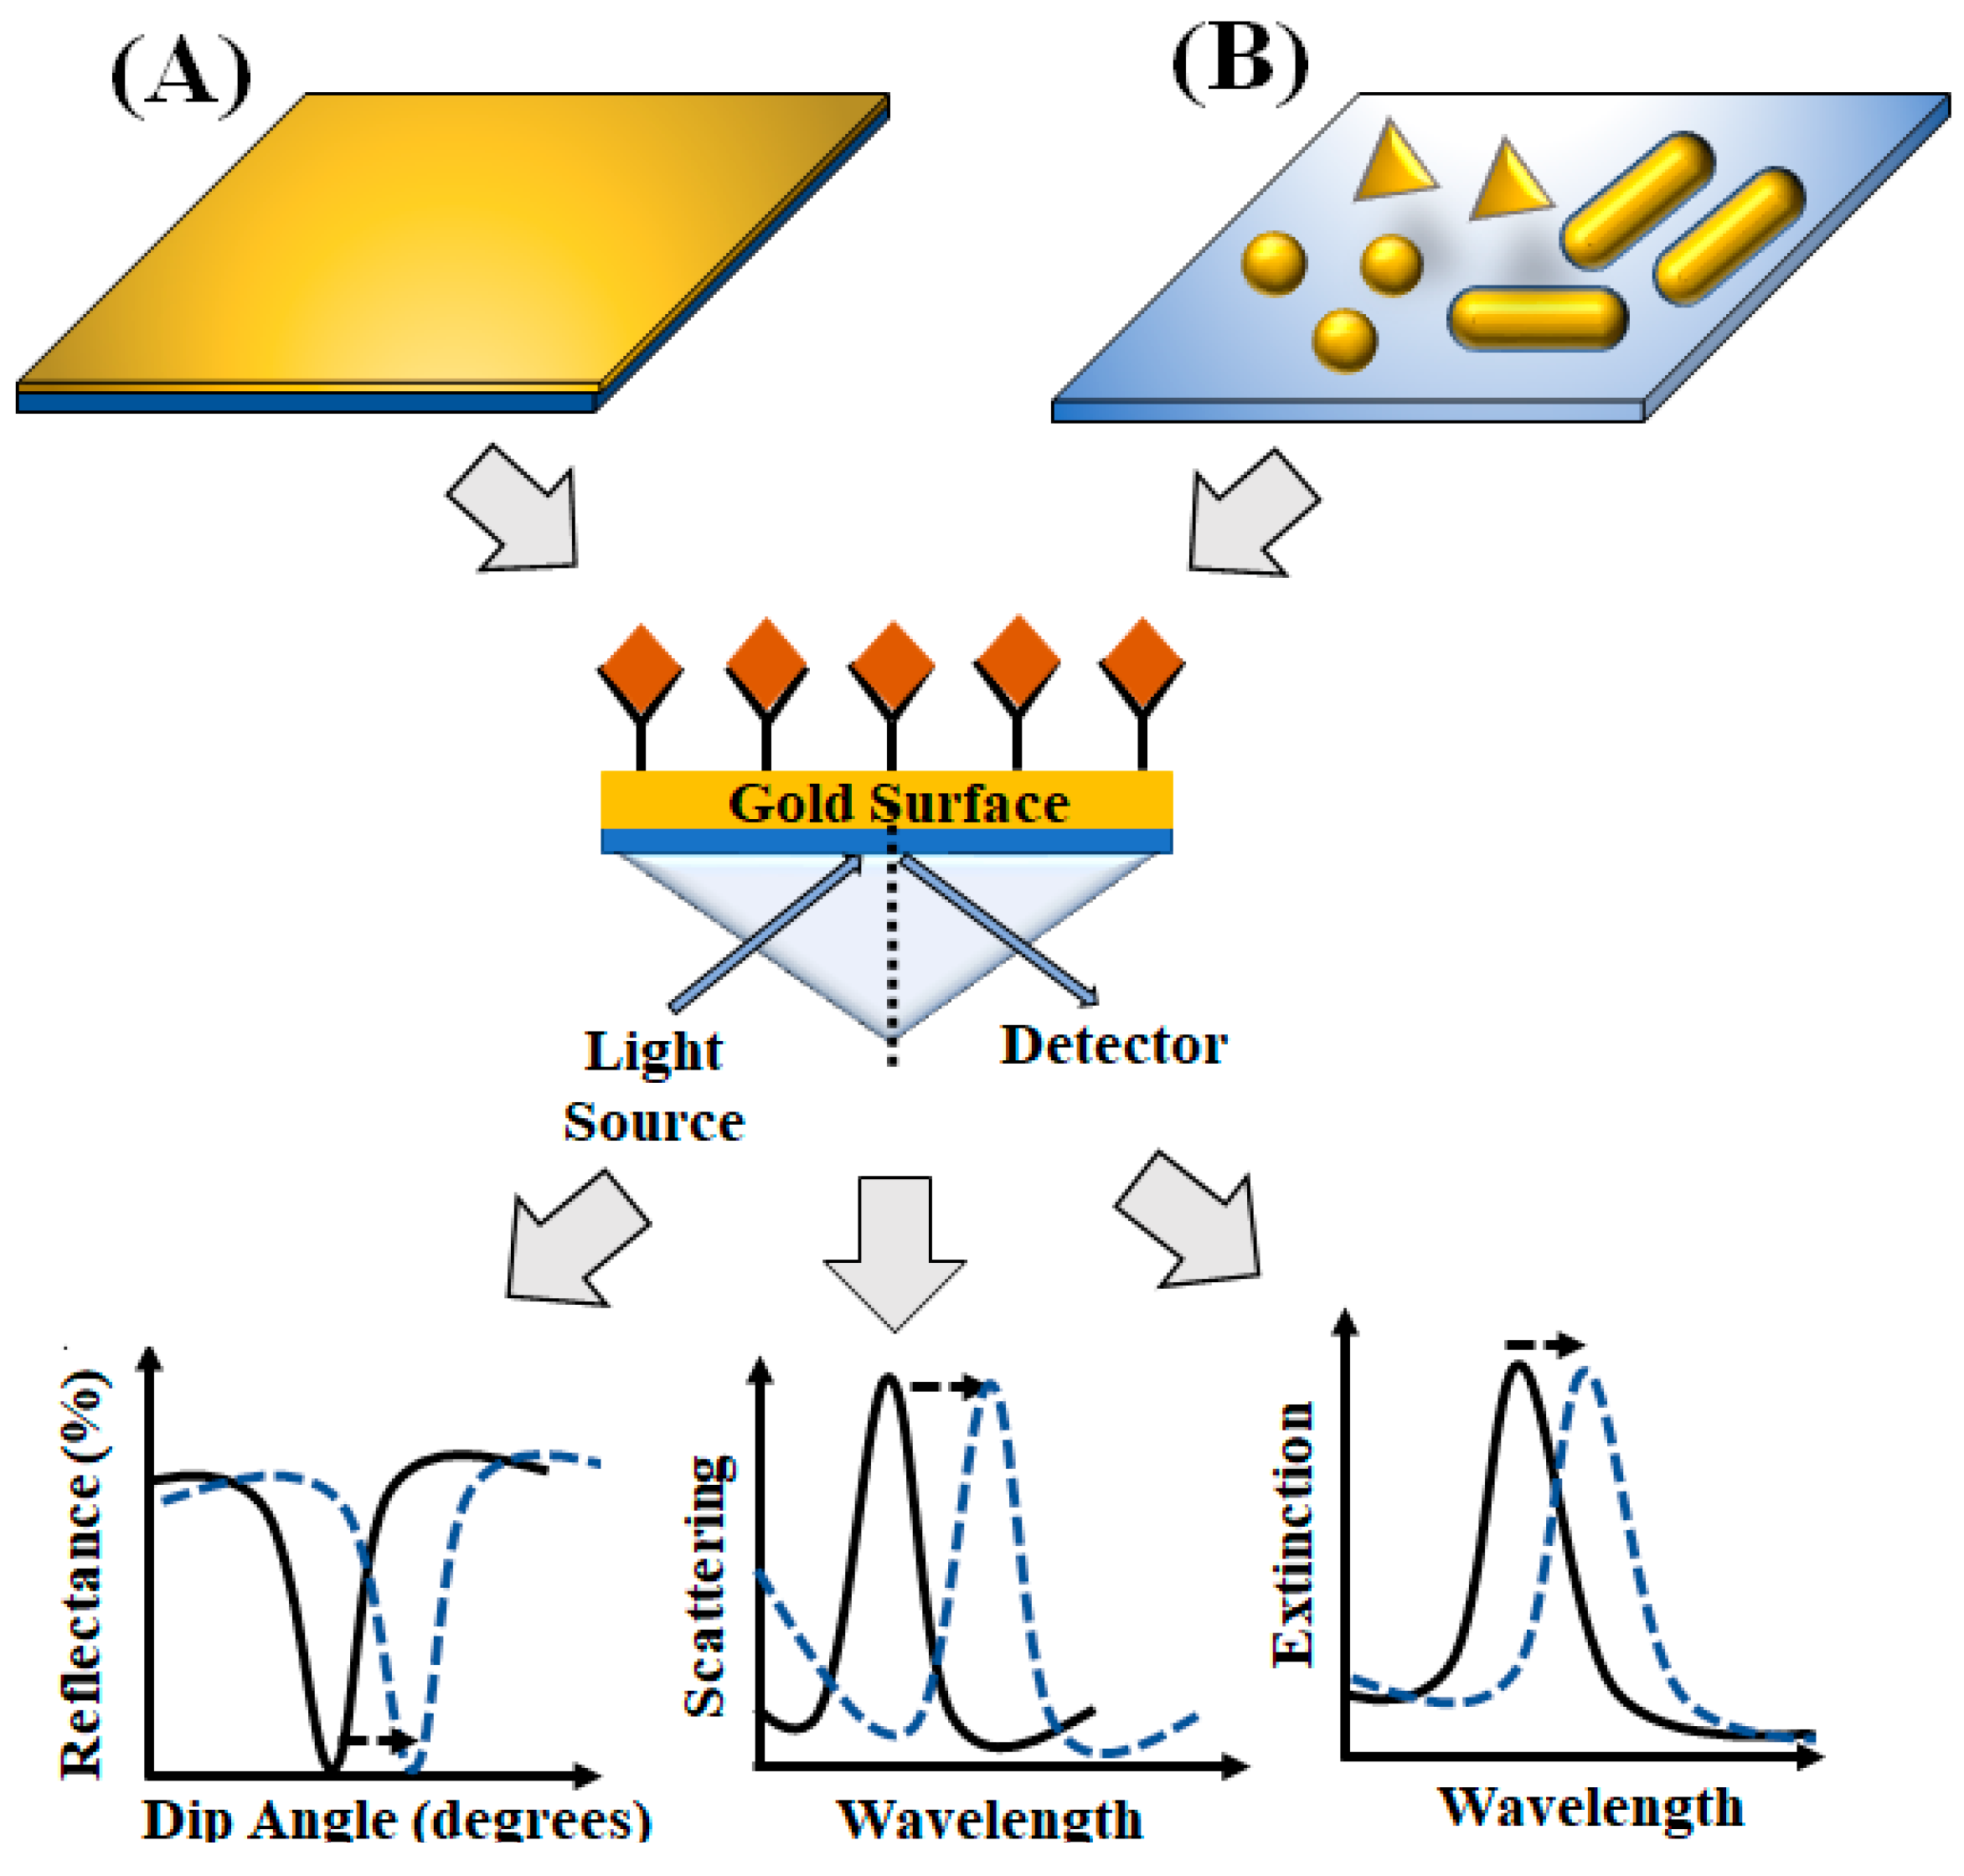
3. Surface-Plasmon-Resonance-Based Platforms
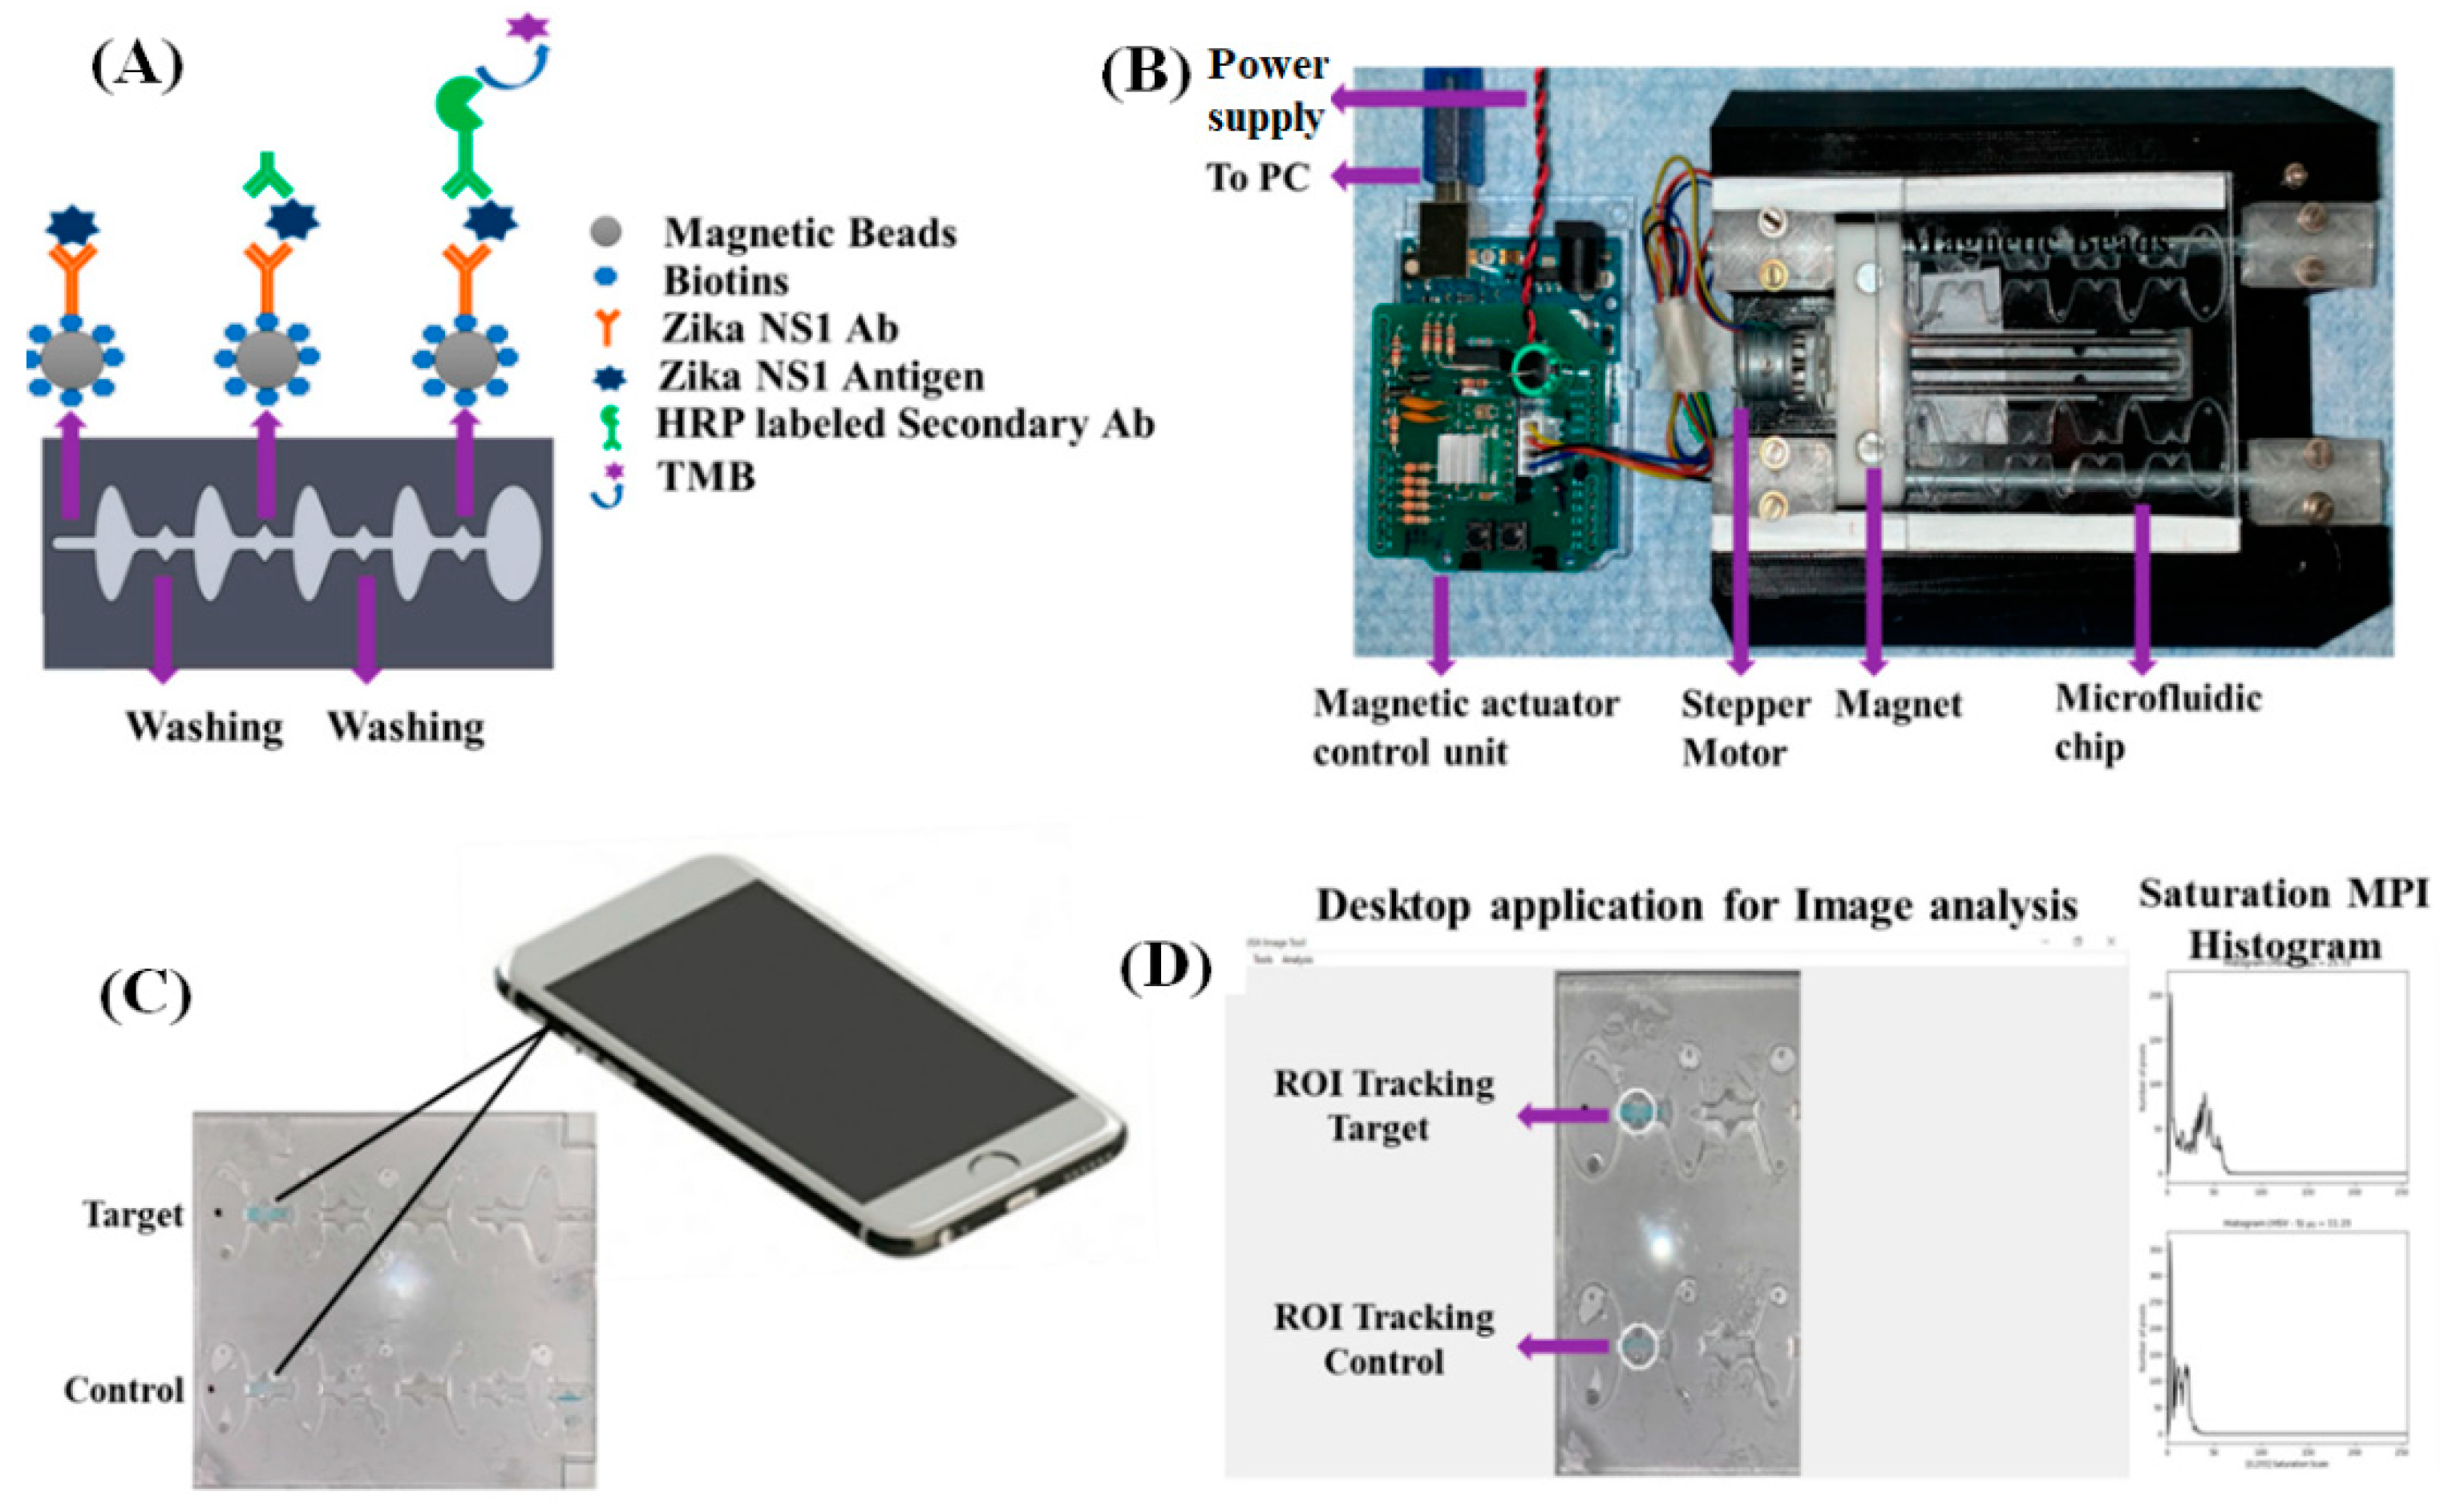
4. Smartphone-Based Detection System
5. Lensless Digital Holographic Imaging
6. Conclusions
Author Contributions
Funding
Acknowledgments
Conflicts of Interest
References
- Cook, A.H.; Cohen, D.B. Pandemic Disease: A Past and Future Challenge to Governance in the United States. Rev. Policy Res. 2008, 25, 449–471. [Google Scholar] [CrossRef]
- Balkhair, A.A. COVID-19 Pandemic: A New Chapter in the History of Infectious Diseases. Oman Med. J. 2020, e123. [Google Scholar] [CrossRef] [PubMed]
- National Academies of Sciences, Engineering, and Medicine. Global Health and the Future Role of the United States; National Academies Press: Washington, DC, USA, 2017. [Google Scholar] [CrossRef]
- Huremović, D. Brief History of Pandemics (Pandemics Throughout History). In Psychiatry of Pandemics; Springer: Cham, Switzerland, 2019; pp. 7–35. [Google Scholar] [CrossRef]
- van Seventer, J.M.; Hochberg, N.S. Principles of Infectious Diseases: Transmission, Diagnosis, Prevention, and Control. Int. Encycl. Public Health 2017, 22–39. [Google Scholar] [CrossRef]
- Fauci, A.S.; Touchette, N.A.; Folkers, G.K. Emerging Infectious Diseases: A 10-Year Perspective from the National Institute of Allergy and Infectious Diseases. Emerg. Infect. Dis. 2005, 11, 519–525. [Google Scholar] [CrossRef]
- Lemon, S.M.; Hamburg, M.A.; Sparling, P.F.; Choffnes, E.R.; Mack, A.; Rapporteurs Institute of Medicine (US) Forum on Microbial Threats. Global Infectious Disease Surveillance and Detection: Assessing the Challenges—Finding Solutions, Workshop Summary; National Academies Press (US): Washington, DC, USA, 2007. [CrossRef]
- Tran, B.X.; Phan, H.T.; Latkin, C.A.; Nguyen, H.L.T.; Hoang, C.L.; Ho, C.S.H.; Ho, R.C.M. Understanding Global HIV Stigma and Discrimination: Are Contextual Factors Sufficiently Studied? (GAP(RESEARCH)). Int. J. Environ. Res. Public Health 2019, 16, 1899. [Google Scholar] [CrossRef] [PubMed] [Green Version]
- Taubenberger, J.K.; Morens, D.M. The Pathology of Influenza Virus Infections. Annu. Rev. Pathol. 2008, 3, 499–522. [Google Scholar] [CrossRef] [PubMed]
- Morens, D.M.; Taubenberger, J.K.; Harvey, H.A.; Memoli, M.J. The 1918 Influenza Pandemic: Lessons for 2009 and the Future. Crit. Care Med. 2010, 38 (Suppl. S4), e10–e20. [Google Scholar] [CrossRef] [PubMed]
- Palacios Cruz, M.; Santos, E.; Velázquez Cervantes, M.A.; León Juárez, M. COVID-19, a Worldwide Public Health Emergency TT—COVID-19, Una Emergencia de Salud Pública Mundial. Rev. Clin. Esp. 2020. [Google Scholar] [CrossRef]
- CDC COVID Data Tracker. Available online: https://covid.cdc.gov/covid-data-tracker/ (accessed on 20 August 2020).
- Gharehgozli, O.; Nayebvali, P.; Gharehgozli, A.; Zamanian, Z. Impact of COVID-19 on the Economic Output of the US Outbreak’s Epicenter. Econ. Disasters Clim. Chang. 2020, 4, 561–573. [Google Scholar] [CrossRef]
- Global Tuberculosis Report; WHO: Geneva, Switzerland, 2019; ISBN 978-92-4-156571-4.
- Al-Humadi, H.W.; Al-Saigh, R.J.; Al-Humadi, A.W. Addressing the Challenges of Tuberculosis: A Brief Historical Account. Front. Pharmacol. 2017, 8, 689. [Google Scholar] [CrossRef] [Green Version]
- Blumberg, H.M.; Ernst, J.D. The Challenge of Latent TB Infection. JAMA 2016, 316, 931–933. [Google Scholar] [CrossRef]
- Sudre, P.; ten Dam, G.; Kochi, A. Tuberculosis: A Global Overview of the Situation Today. Bull. World Health Organ. 1992, 70, 149–159. [Google Scholar]
- Harries, A.D.; Kumar, A.M.V. Challenges and Progress with Diagnosing Pulmonary Tuberculosis in Low- and Middle-Income Countries. Diagnostics 2018, 8, 78. [Google Scholar] [CrossRef] [PubMed] [Green Version]
- Fenwick, A. Waterborne Infectious Diseases—Could They Be Consigned to History? Science 2006, 313, 1077–1081. [Google Scholar] [CrossRef] [Green Version]
- Shannon, M.A.; Bohn, P.W.; Elimelech, M.; Georgiadis, J.G.; Mariñas, B.J.; Mayes, A.M. Science and Technology for Water Purification in the Coming Decades. Nature 2008, 452, 301–310. [Google Scholar] [CrossRef] [PubMed]
- Bintsis, T. Foodborne Pathogens. AIMS Microbiol. 2017, 3, 529–563. [Google Scholar] [CrossRef]
- Michaud, C.M. Global Burden of Infectious Diseases. Encycl. Microbiol. 2009, 444–454. [Google Scholar] [CrossRef]
- Srivastava, S.; Singh, P.K.; Vatsalya, V.; Karch, R.C. Developments in the Diagnostic Techniques of Infectious Diseases: Rural and Urban Prospective. Adv. Infect. Dis. 2018, 8, 121–138. [Google Scholar] [CrossRef] [Green Version]
- Desselberger, U.; Collingham, K. Molecular Techniques in the Diagnosis of Human Infectious Diseases. Genitourin. Med. 1990, 66, 313–323. [Google Scholar] [CrossRef] [Green Version]
- Murray, P.R.; Masur, H. Current Approaches to the Diagnosis of Bacterial and Fungal Bloodstream Infections in the Intensive Care Unit. Crit. Care Med. 2012, 40, 3277–3282. [Google Scholar] [CrossRef] [Green Version]
- Tang, Y.-W.; Schmitz, J.E.; Persing, D.H.; Stratton, C.W. Laboratory Diagnosis of COVID-19: Current Issues and Challenges. J. Clin. Microbiol. 2020, 58, e00512-20. [Google Scholar] [CrossRef] [PubMed] [Green Version]
- Bloom, D.E.; Cadarette, D. Infectious Disease Threats in the Twenty-First Century: Strengthening the Global Response. Front. Immunol. 2019, 10, 549. [Google Scholar] [CrossRef] [PubMed] [Green Version]
- St John, A.; Price, C.P. Existing and Emerging Technologies for Point-of-Care Testing. Clin. Biochem. Rev. 2014, 35, 155–167. [Google Scholar]
- Christodouleas, D.C.; Kaur, B.; Chorti, P. From Point-of-Care Testing to EHealth Diagnostic Devices (EDiagnostics). ACS Cent. Sci. 2018, 4, 1600–1616. [Google Scholar] [CrossRef] [PubMed]
- Vashist, S.K. Point-of-Care Diagnostics: Recent Advances and Trends. Biosensors 2017, 7, 62. [Google Scholar] [CrossRef] [PubMed] [Green Version]
- Alawsi, T.; Al-Bawi, Z. A Review of Smartphone Point-of-Care Adapter Design. Eng. Rep. 2019, 1, e12039. [Google Scholar] [CrossRef]
- Moon, S.; Keles, H.O.; Kim, Y.-G.; Kuritzkes, D.; Demirci, U. Lensless Imaging for Point-of-Care Testing. In Proceedings of the Annual International Conference of the IEEE Engineering in Medicine and Biology Society, Minneapolis, MN, USA, 3–6 September 2009; pp. 6376–6379. [Google Scholar] [CrossRef] [Green Version]
- Tokel, O.; Inci, F.; Demirci, U. Advances in Plasmonic Technologies for Point of Care Applications. Chem. Rev. 2014, 114, 5728–5752. [Google Scholar] [CrossRef] [Green Version]
- Mejía-Salazar, J.R.; Cruz, K.R.; Vásques, E.M.M.; de Oliveira, O.N. Microfluidic Point-of-Care Devices: New Trends and Future Prospects for Ehealth Diagnostics. Sensors 2020, 20, 1951. [Google Scholar] [CrossRef] [Green Version]
- Chin, C.D.; Laksanasopin, T.; Cheung, Y.K.; Steinmiller, D.; Linder, V.; Parsa, H.; Wang, J.; Moore, H.; Rouse, R.; Umviligihozo, G.; et al. Microfluidics-Based Diagnostics of Infectious Diseases in the Developing World. Nat. Med. 2011, 17, 1015–1019. [Google Scholar] [CrossRef]
- Gale, B.K.; Jafek, A.R.; Lambert, C.J.; Goenner, B.L.; Moghimifam, H.; Nze, U.C.; Kamarapu, S.K. A Review of Current Methods in Microfluidic Device Fabrication and Future Commercialization Prospects. Inventions 2018, 3, 60. [Google Scholar] [CrossRef] [Green Version]
- Pandey, C.M.; Augustine, S.; Kumar, S.; Kumar, S.; Nara, S.; Srivastava, S.; Malhotra, B.D. Microfluidics Based Point-of-Care Diagnostics. Biotechnol. J. 2018, 13, 1700047. [Google Scholar] [CrossRef] [PubMed]
- Sia, S.K.; Kricka, L.J. Microfluidics and Point-of-Care Testing. Lab Chip 2008, 8, 1982–1983. [Google Scholar] [CrossRef] [PubMed]
- Sher, M.; Zhuang, R.; Demirci, U.; Asghar, W. Paper-Based Analytical Devices for Clinical Diagnosis: Recent Advances in the Fabrication Techniques and Sensing Mechanisms. Expert Rev. Mol. Diagn. 2017, 17, 351–366. [Google Scholar] [CrossRef] [PubMed]
- Nilghaz, A.; Liu, X.; Ma, L.; Huang, Q.; Lu, X. Development of Fabric-Based Microfluidic Devices by Wax Printing. Cellulose 2019, 26, 3589–3599. [Google Scholar] [CrossRef]
- Ren, K.; Zhou, J.; Wu, H. Materials for Microfluidic Chip Fabrication. Acc. Chem. Res. 2013, 46, 2396–2406. [Google Scholar] [CrossRef]
- Becker, H.; Locascio, L.E. Polymer Microfluidic Devices. Talanta 2002, 56, 267–287. [Google Scholar] [CrossRef]
- Hristov, D.R.; Rodriguez-Quijada, C.; Gomez-Marquez, J.; Hamad-Schifferli, K. Designing Paper-Based Immunoassays for Biomedical Applications. Sensors 2019, 19, 554. [Google Scholar] [CrossRef] [Green Version]
- Kasetsirikul, S.; Shiddiky, M.J.A.; Nguyen, N.-T. Challenges and Perspectives in the Development of Paper-Based Lateral Flow Assays. Microfluid. Nanofluid. 2020, 24, 17. [Google Scholar] [CrossRef]
- Joung, H.-A.; Ballard, Z.S.; Ma, A.; Tseng, D.K.; Teshome, H.; Burakowski, S.; Garner, O.B.; Di Carlo, D.; Ozcan, A. Paper-Based Multiplexed Vertical Flow Assay for Point-of-Care Testing. Lab Chip 2019, 19, 1027–1034. [Google Scholar] [CrossRef]
- Ariffin, N.; Yusof, N.A.; Abdullah, J.; Abd Rahman, S.F.; Ahmad Raston, N.H.; Kusnin, N.; Suraiya, S. Lateral Flow Immunoassay for Naked Eye Detection of Mycobacterium tuberculosis. J. Sens. 2020, 2020. [Google Scholar] [CrossRef] [Green Version]
- Zhu, H.; Fohlerová, Z.; Pekárek, J.; Basova, E.; Neužil, P. Recent Advances in Lab-on-a-Chip Technologies for Viral Diagnosis. Biosens. Bioelectron. 2020, 153, 112041. [Google Scholar] [CrossRef] [PubMed]
- Nguyen, T.; Chidambara, V.A.; Andreasen, S.Z.; Golabi, M.; Huynh, V.N.; Linh, Q.T.; Bang, D.D.; Wolff, A. Point-of-Care Devices for Pathogen Detections: The Three Most Important Factors to Realise towards Commercialization. TrAC Trends Anal. Chem. 2020, 131, 116004. [Google Scholar] [CrossRef]
- Tsao, C.-W. Polymer Microfluidics: Simple, Low-Cost Fabrication Process Bridging Academic Lab Research to Commercialized Production. Micromachines 2016, 7, 225. [Google Scholar] [CrossRef] [PubMed] [Green Version]
- Cao, Q.; Mahalanabis, M.; Chang, J.; Carey, B.; Hsieh, C.; Stanley, A.; Odell, C.A.; Mitchell, P.; Feldman, J.; Pollock, N.R.; et al. Microfluidic Chip for Molecular Amplification of Influenza A RNA in Human Respiratory Specimens. PLoS ONE 2012, 7, e33176. [Google Scholar] [CrossRef] [PubMed]
- Qin, P.; Park, M.; Alfson, K.J.; Tamhankar, M.; Carrion, R.; Patterson, J.L.; Griffiths, A.; He, Q.; Yildiz, A.; Mathies, R.; et al. Rapid and Fully Microfluidic Ebola Virus Detection with CRISPR-Cas13a. ACS Sens. 2019, 4, 1048–1054. [Google Scholar] [CrossRef]
- Zhao, C.; Liu, X. A Portable Paper-Based Microfluidic Platform for Multiplexed Electrochemical Detection of Human Immunodeficiency Virus and Hepatitis C Virus Antibodies in Serum. Biomicrofluidics 2016, 10, 24119. [Google Scholar] [CrossRef] [PubMed]
- Zhao, X.; Li, M.; Liu, Y. Microfluidic-Based Approaches for Foodborne Pathogen Detection. Microorganisms 2019, 7, 381. [Google Scholar] [CrossRef] [PubMed] [Green Version]
- Mauk, M.; Song, J.; Bau, H.H.; Gross, R.; Bushman, F.D.; Collman, R.G.; Liu, C. Miniaturized Devices for Point of Care Molecular Detection of HIV. Lab Chip 2017, 17, 382–394. [Google Scholar] [CrossRef] [PubMed] [Green Version]
- Kaarj, K.; Akarapipad, P.; Yoon, J.-Y. Simpler, Faster, and Sensitive Zika Virus Assay Using Smartphone Detection of Loop-Mediated Isothermal Amplification on Paper Microfluidic Chips. Sci. Rep. 2018, 8, 12438. [Google Scholar] [CrossRef]
- Wang, S.; Inci, F.; De Libero, G.; Singhal, A.; Demirci, U. Point-of-Care Assays for Tuberculosis: Role of Nanotechnology/Microfluidics. Biotechnol. Adv. 2013, 31, 438–449. [Google Scholar] [CrossRef] [Green Version]
- Nasseri, B.; Soleimani, N.; Rabiee, N.; Kalbasi, A.; Karimi, M.; Hamblin, M.R. Point-of-Care Microfluidic Devices for Pathogen Detection. Biosens. Bioelectron. 2018, 117, 112–128. [Google Scholar] [CrossRef] [PubMed]
- NIH Delivering New COVID-19 Testing Technologies to Meet U.S. Demand. Available online: https://www.nih.gov/news-events/news-releases/nih-delivering-new-covid-19-testing-technologies-meet-us-demand (accessed on 31 July 2020).
- Joung, J.; Ladha, A.; Saito, M.; Segel, M.; Bruneau, R.; Huang, M.W.; Kim, N.G.; Yu, X.; Li, J.; Walker, B.D.; et al. Point-of-Care Testing for COVID-19 Using SHERLOCK Diagnostics. medRxiv Prep. Serv. Health Sci. 2020, 20091231. [Google Scholar] [CrossRef]
- Singh, R.; Hong, S.; Jang, J. Label-Free Detection of Influenza Viruses Using a Reduced Graphene Oxide-Based Electrochemical Immunosensor Integrated with a Microfluidic Platform. Sci. Rep. 2017, 7, 42771. [Google Scholar] [CrossRef] [Green Version]
- Rong, Z.; Wang, Q.; Sun, N.; Jia, X.; Wang, K.; Xiao, R.; Wang, S. Smartphone-Based Fluorescent Lateral Flow Immunoassay Platform for Highly Sensitive Point-of-Care Detection of Zika Virus Nonstructural Protein 1. Anal. Chim. Acta 2019, 1055, 140–147. [Google Scholar] [CrossRef] [PubMed]
- Kabir, M.A.; Zilouchian, H.; Sher, M.; Asghar, W. Development of a Flow-Free Automated Colorimetric Detection Assay Integrated with Smartphone for Zika NS1. Diagnostics 2020, 10, 42. [Google Scholar] [CrossRef] [Green Version]
- Da Silva, S.J.R.; Pardee, K.; Pena, L. Loop-Mediated Isothermal Amplification (LAMP) for the Diagnosis of Zika Virus: A Review. Viruses 2019, 12, 19. [Google Scholar] [CrossRef] [PubMed] [Green Version]
- Da Silva, S.J.R.; Paiva, M.H.S.; Guedes, D.R.D.; Krokovsky, L.; de Melo, F.L.; da Silva, M.A.L.; da Silva, A.; Ayres, C.F.J.; Pena, L.J. Development and Validation of Reverse Transcription Loop-Mediated Isothermal Amplification (RT-LAMP) for Rapid Detection of ZIKV in Mosquito Samples from Brazil. Sci. Rep. 2019, 9, 4494. [Google Scholar] [CrossRef] [PubMed] [Green Version]
- Martin, C.A.; Keren, D.F. Comparison of Murex Single-Use Diagnostic System with Traditional Enzyme Immunoassay for Detection of Exposure to Human Immunodeficiency Virus. Clin. Diagn. Lab. Immunol. 2002, 9, 187–189. [Google Scholar] [CrossRef] [Green Version]
- Nandi, S.; Maity, S.; Bhunia, S.C.; Saha, M.K. Comparative Assessment of Commercial ELISA Kits for Detection of HIV in India. BMC Res. Notes 2014, 7, 436. [Google Scholar] [CrossRef] [Green Version]
- US Foods. OraQuick In-Home HIV Test; US Foods: Rosemont, IL, USA, 2020. [Google Scholar]
- Gueudin, M.; Leoz, M.; Lemée, V.; De Oliveira, F.; Vessière, A.; Kfutwah, A.; Plantier, J.-C. A New Real-Time Quantitative PCR for Diagnosis and Monitoring of HIV-1 Group O Infection. J. Clin. Microbiol. 2012, 50, 831–836. [Google Scholar] [CrossRef] [Green Version]
- Phillips, E.A.; Moehling, T.J.; Ejendal, K.; Hoilett, O.S.; Byers, K.M.; Basing, L.A.; Jankowski, L.A.; Bennett, J.B.; Lin, L.K.; Stanciu, L.A.; et al. Microfluidic Rapid and Autonomous Analytical Device (MicroRAAD) to Detect HIV from Whole Blood Samples. Lab Chip 2019, 19, 3375–3386. [Google Scholar] [CrossRef] [Green Version]
- Pilcher, C.D.; Joaki, G.; Hoffman, I.F.; Martinson, F.E.; Mapanje, C.; Stewart, P.W.; Powers, K.A.; Galvin, S.; Chilongozi, D.; Gama, S.; et al. Amplified Transmission of HIV-1: Comparison of HIV-1 Concentrations in Semen and Blood during Acute and Chronic Infection. AIDS 2007, 21, 1723–1730. [Google Scholar] [CrossRef] [PubMed] [Green Version]
- Shafiee, H.; Asghar, W.; Inci, F.; Yuksekkaya, M.; Jahangir, M.; Zhang, M.H.; Durmus, N.G.; Gurkan, U.A.; Kuritzkes, D.R.; Demirci, U. Paper and Flexible Substrates as Materials for Biosensing Platforms to Detect Multiple Biotargets. Sci. Rep. 2015, 5, 8719. [Google Scholar] [CrossRef] [PubMed]
- Pai, M.; Denkinger, C.M.; Kik, S.V.; Rangaka, M.X.; Zwerling, A.; Oxlade, O.; Metcalfe, J.Z.; Cattamanchi, A.; Dowdy, D.W.; Dheda, K.; et al. Gamma Interferon Release Assays for Detection of Mycobacterium tuberculosis Infection. Clin. Microbiol. Rev. 2014, 27, 3–20. [Google Scholar] [CrossRef] [Green Version]
- Lalvani, A.; Pareek, M. Interferon Gamma Release Assays: Principles and Practice. Enferm. Infecc. Microbiol. Clin. 2010, 28, 245–252. [Google Scholar] [CrossRef] [PubMed]
- Evans, D.; Papadimitriou, K.I.; Greathead, L.; Vasilakis, N.; Pantelidis, P.; Kelleher, P.; Morgan, H.; Prodromakis, T. An Assay System for Point-of-Care Diagnosis of Tuberculosis Using Commercially Manufactured PCB Technology. Sci. Rep. 2017, 7, 685. [Google Scholar] [CrossRef]
- Wang, S.; Shan, X.; Patel, U.; Huang, X.; Lu, J.; Li, J.; Tao, N. Label-Free Imaging, Detection, and Mass Measurement of Single Viruses by Surface Plasmon Resonance. Proc. Natl. Acad. Sci. USA 2010, 107, 16028–16032. [Google Scholar] [CrossRef] [Green Version]
- Singh, P. Surface Plasmon Resonance: A Boon for Viral Diagnostics. Ref. Modul. Life Sci. 2017. [Google Scholar] [CrossRef]
- Piliarik, M.; Vaisocherová, H.; Homola, J. Surface Plasmon Resonance Biosensing. Methods Mol. Biol. 2009, 503, 65–88. [Google Scholar] [CrossRef]
- Nguyen, H.H.; Park, J.; Kang, S.; Kim, M. Surface Plasmon Resonance: A Versatile Technique for Biosensor Applications. Sensors 2015, 15, 10481–10510. [Google Scholar] [CrossRef] [Green Version]
- Choi, I.; Choi, Y. Plasmonic Nanosensors: Review and Prospect. IEEE J. Sel. Top. Quantum Electron. 2012, 18, 1110–1121. [Google Scholar] [CrossRef]
- Soler, M.; Huertas, C.S.; Lechuga, L.M. Label-Free Plasmonic Biosensors for Point-of-Care Diagnostics: A Review. Expert Rev. Mol. Diagn. 2019, 19, 71–81. [Google Scholar] [CrossRef]
- Pilot, R.; Signorini, R.; Durante, C.; Orian, L.; Bhamidipati, M.; Fabris, L. A Review on Surface-Enhanced Raman Scattering. Biosensors 2019, 9, 57. [Google Scholar] [CrossRef] [PubMed] [Green Version]
- Langer, J.; Jimenez de Aberasturi, D.; Aizpurua, J.; Alvarez-Puebla, R.A.; Auguié, B.; Baumberg, J.J.; Bazan, G.C.; Bell, S.E.J.; Boisen, A.; Brolo, A.G.; et al. Present and Future of Surface-Enhanced Raman Scattering. ACS Nano 2020, 14, 28–117. [Google Scholar] [CrossRef] [PubMed] [Green Version]
- Li, Z.; Leustean, L.; Inci, F.; Zheng, M.; Demirci, U.; Wang, S. Plasmonic-Based Platforms for Diagnosis of Infectious Diseases at the Point-of-Care. Biotechnol. Adv. 2019, 37, 107440. [Google Scholar] [CrossRef]
- Granger, J.H.; Schlotter, N.E.; Crawford, A.C.; Porter, M.D. Prospects for Point-of-Care Pathogen Diagnostics Using Surface-Enhanced Raman Scattering (SERS). Chem. Soc. Rev. 2016, 45, 3865–3882. [Google Scholar] [CrossRef]
- Marks, H.; Schechinger, M.; Garza, J.; Locke, A.; Coté, G. Surface Enhanced Raman Spectroscopy (SERS) for in Vitro Diagnostic Testing at the Point of Care. Nanophotonics 2017, 6, 681–701. [Google Scholar] [CrossRef]
- Li, B.; Singer, N.G.; Yeni, Y.N.; Haggins, D.G.; Barnboym, E.; Oravec, D.; Lewis, S.; Akkus, O. A Point-of-Care Raman Spectroscopy-Based Device for the Diagnosis of Gout and Pseudogout: Comparison With the Clinical Standard Microscopy. Arthritis Rheumatol. 2016, 68, 1751–1757. [Google Scholar] [CrossRef] [PubMed]
- Xu, K.; Zhou, R.; Takei, K.; Hong, M. Toward Flexible Surface-Enhanced Raman Scattering (SERS) Sensors for Point-of-Care Diagnostics. Adv. Sci. 2019, 6, 1900925. [Google Scholar] [CrossRef]
- Masson, J.-F. Portable and Field-Deployed Surface Plasmon Resonance and Plasmonic Sensors. Analyst 2020, 145, 3776–3800. [Google Scholar] [CrossRef]
- Tokel, O.; Yildiz, U.H.; Inci, F.; Durmus, N.G.; Ekiz, O.O.; Turker, B.; Cetin, C.; Rao, S.; Sridhar, K.; Natarajan, N.; et al. Portable Microfluidic Integrated Plasmonic Platform for Pathogen Detection. Sci. Rep. 2015, 5, 9152. [Google Scholar] [CrossRef] [PubMed] [Green Version]
- Wang, D.-S.; Fan, S.-K. Microfluidic Surface Plasmon Resonance Sensors: From Principles to Point-of-Care Applications. Sensors 2016, 16, 1175. [Google Scholar] [CrossRef] [PubMed] [Green Version]
- Tabassum, S.; Kumar, R. Advances in Fiber-Optic Technology for Point-of-Care Diagnosis and In Vivo Biosensing. Adv. Mater. Technol. 2020, 5, 1900792. [Google Scholar] [CrossRef]
- Vaisocherová, H.; Faca, V.M.; Taylor, A.D.; Hanash, S.; Jiang, S. Comparative Study of SPR and ELISA Methods Based on Analysis of CD166/ALCAM Levels in Cancer and Control Human Sera. Biosens. Bioelectron. 2009, 24, 2143–2148. [Google Scholar] [CrossRef] [PubMed]
- Coskun, A.F.; Cetin, A.E.; Galarreta, B.C.; Alvarez, D.A.; Altug, H.; Ozcan, A. Lensfree Optofluidic Plasmonic Sensor for Real-Time and Label-Free Monitoring of Molecular Binding Events over a Wide Field-of-View. Sci. Rep. 2014, 4, 6789. [Google Scholar] [CrossRef] [PubMed]
- Harpaz, D.; Koh, B.; Marks, R.S.; Seet, R.C.S.; Abdulhalim, I.; Tok, A.I.Y. Point-of-Care Surface Plasmon Resonance Biosensor for Stroke Biomarkers NT-ProBNP and S100β Using a Functionalized Gold Chip with Specific Antibody. Sensors 2019, 19, 2533. [Google Scholar] [CrossRef] [Green Version]
- Lobry, M.; Loyez, M.; Chah, K.; Hassan, E.M.; Goormaghtigh, E.; DeRosa, M.C.; Wattiez, R.; Caucheteur, C. HER2 Biosensing through SPR-Envelope Tracking in Plasmonic Optical Fiber Gratings. Biomed. Opt. Express 2020, 11, 4862–4871. [Google Scholar] [CrossRef]
- Zeni, L.; Perri, C.; Cennamo, N.; Arcadio, F.; D’Agostino, G.; Salmona, M.; Beeg, M.; Gobbi, M. A Portable Optical-Fibre-Based Surface Plasmon Resonance Biosensor for the Detection of Therapeutic Antibodies in Human Serum. Sci. Rep. 2020, 10, 11154. [Google Scholar] [CrossRef]
- Aruna Gandhi, M.S.; Chu, S.; Senthilnathan, K.; Babu, P.R.; Nakkeeran, K.; Li, Q. Recent Advances in Plasmonic Sensor-Based Fiber Optic Probes for Biological Applications. Appl. Sci. 2019, 9, 949. [Google Scholar] [CrossRef] [Green Version]
- Sharma, P.K.; Kumar, J.S.; Singh, V.V.; Biswas, U.; Sarkar, S.S.; Alam, S.I.; Dash, P.K.; Boopathi, M.; Ganesan, K.; Jain, R. Surface Plasmon Resonance Sensing of Ebola Virus: A Biological Threat. Anal. Bioanal. Chem. 2020, 412, 4101–4112. [Google Scholar] [CrossRef]
- Diao, W.; Tang, M.; Ding, S.; Li, X.; Cheng, W.; Mo, F.; Yan, X.; Ma, H.; Yan, Y. Highly Sensitive Surface Plasmon Resonance Biosensor for the Detection of HIV-Related DNA Based on Dynamic and Structural DNA Nanodevices. Biosens. Bioelectron. 2018, 100, 228–234. [Google Scholar] [CrossRef]
- Takemura, K.; Adegoke, O.; Suzuki, T.; Park, E.Y. A Localized Surface Plasmon Resonance-Amplified Immunofluorescence Biosensor for Ultrasensitive and Rapid Detection of Nonstructural Protein 1 of Zika Virus. PLoS ONE 2019, 14, e0211517. [Google Scholar] [CrossRef] [PubMed]
- Usachev, E.V.; Usacheva, O.V.; Agranovski, I.E. Surface Plasmon Resonance-Based Bacterial Aerosol Detection. J. Appl. Microbiol. 2014, 117, 1655–1662. [Google Scholar] [CrossRef] [PubMed]
- Prabowo, B.A.; Chang, Y.-F.; Lai, H.-C.; Alom, A.; Pal, P.; Lee, Y.-Y.; Chiu, N.-F.; Hatanaka, K.; Su, L.-C.; Liu, K.-C. Rapid Screening of Mycobacterium tuberculosis Complex (MTBC) in Clinical Samples by a Modular Portable Biosensor. Sens. Actuators B Chem. 2018, 254, 742–748. [Google Scholar] [CrossRef]
- Koubová, V.; Brynda, E.; Karasová, L.; Škvor, J.; Homola, J.; Dostálek, J.; Tobiška, P.; Rošický, J. Detection of Foodborne Pathogens Using Surface Plasmon Resonance Biosensors. Sens. Actuators B Chem. 2001, 74, 100–105. [Google Scholar] [CrossRef]
- Chang, Y.F.; Wang, W.H.; Hong, Y.W.; Yuan, R.Y.; Chen, K.H.; Huang, Y.W.; Lu, P.L.; Chen, Y.H.; Chen, Y.A.; Su, L.C.; et al. Simple Strategy for Rapid and Sensitive Detection of Avian Influenza A H7N9 Virus Based on Intensity-Modulated SPR Biosensor and New Generated Antibody. Anal. Chem. 2018, 90, 1861–1869. [Google Scholar] [CrossRef]
- Whang, K.; Lee, J.-H.; Shin, Y.; Lee, W.; Kim, Y.W.; Kim, D.; Lee, L.P.; Kang, T. Plasmonic Bacteria on a Nanoporous Mirror via Hydrodynamic Trapping for Rapid Identification of Waterborne Pathogens. Light Sci. Appl. 2018, 7, 68. [Google Scholar] [CrossRef]
- Inci, F.; Tokel, O.; Wang, S.; Gurkan, U.A.; Tasoglu, S.; Kuritzkes, D.R.; Demirci, U. Nanoplasmonic Quantitative Detection of Intact Viruses from Unprocessed Whole Blood. ACS Nano 2013, 7, 4733–4745. [Google Scholar] [CrossRef]
- Jiang, Q.; Chandar, Y.J.; Cao, S.; Kharasch, E.D.; Singamaneni, S.; Morrissey, J.J. Rapid, Point-of-Care, Paper-Based Plasmonic Biosensor for Zika Virus Diagnosis. Adv. Biosyst. 2017, 1, e1700096. [Google Scholar] [CrossRef] [Green Version]
- Wang, S.; Xie, J.; Jiang, M.; Chang, K.; Chen, R.; Ma, L.; Zhu, J.; Guo, Q.; Sun, H.; Hu, J. The Development of a Portable SPR Bioanalyzer for Sensitive Detection of Escherichia coli O157:H7. Sensors 2016, 16, 1856. [Google Scholar] [CrossRef] [Green Version]
- Trzaskowski, M.; Ciach, T. Corrigendum for SPR System for On-Site Detection of Biological Warfare. Curr. Anal. Chem. 2018, 14, 292. [Google Scholar] [CrossRef]
- Qiu, G.; Gai, Z.; Tao, Y.; Schmitt, J.; Kullak-Ublick, G.A.; Wang, J. Dual-Functional Plasmonic Photothermal Biosensors for Highly Accurate Severe Acute Respiratory Syndrome Coronavirus 2 Detection. ACS Nano 2020, 14, 5268–5277. [Google Scholar] [CrossRef] [PubMed] [Green Version]
- Ray, A.; Esparza, S.; Wu, D.; Hanudel, M.R.; Joung, H.-A.; Gales, B.; Tseng, D.; Salusky, I.B.; Ozcan, A. Measurement of Serum Phosphate Levels Using a Mobile Sensor. Analyst 2020, 145, 1841–1848. [Google Scholar] [CrossRef] [PubMed]
- Smith, Z.J.; Chu, K.; Espenson, A.R.; Rahimzadeh, M.; Gryshuk, A.; Molinaro, M.; Dwyre, D.M.; Lane, S.; Matthews, D.; Wachsmann-Hogiu, S. Cell-Phone-Based Platform for Biomedical Device Development and Education Applications. PLoS ONE 2011, 6, e17150. [Google Scholar] [CrossRef]
- Hergemöller, T.; Laumann, D. Smartphone Magnification Attachment: Microscope or Magnifying Glass. Phys. Teach. 2017, 55, 361–364. [Google Scholar] [CrossRef]
- Skandarajah, A.; Reber, C.D.; Switz, N.A.; Fletcher, D.A. Quantitative Imaging with a Mobile Phone Microscope. PLoS ONE 2014, 9, e96906. [Google Scholar] [CrossRef] [Green Version]
- Sung, Y.-L.; Jeang, J.; Lee, C.-H.; Shih, W.-C. Fabricating Optical Lenses by Inkjet Printing and Heat-Assisted in Situ Curing of Polydimethylsiloxane for Smartphone Microscopy. J. Biomed. Opt. 2015, 20, 47005. [Google Scholar] [CrossRef] [Green Version]
- Yang, Z.; Zhan, Q. Single-Shot Smartphone-Based Quantitative Phase Imaging Using a Distorted Grating. PLoS ONE 2016, 11, e0159596. [Google Scholar] [CrossRef]
- Mudanyali, O.; Dimitrov, S.; Sikora, U.; Padmanabhan, S.; Navruz, I.; Ozcan, A. Integrated Rapid-Diagnostic-Test Reader Platform on a Cellphone. Lab Chip 2012, 12, 2678–2686. [Google Scholar] [CrossRef] [Green Version]
- Tseng, D.; Mudanyali, O.; Oztoprak, C.; Isikman, S.O.; Sencan, I.; Yaglidere, O.; Ozcan, A. Lensfree Microscopy on a Cellphone. Lab Chip 2010, 10, 1787–1792. [Google Scholar] [CrossRef]
- Hossain, M.A.; Canning, J.; Cook, K.; Jamalipour, A. Optical Fiber Smartphone Spectrometer. Opt. Lett. 2016, 41, 2237–2240. [Google Scholar] [CrossRef] [PubMed]
- Ma, Y.-D.; Li, K.-H.; Chen, Y.-H.; Lee, Y.-M.; Chou, S.-T.; Lai, Y.-Y.; Huang, P.-C.; Ma, H.-P.; Lee, G.-B. A Sample-to-Answer, Portable Platform for Rapid Detection of Pathogens with a Smartphone Interface. Lab Chip 2019, 19, 3804–3814. [Google Scholar] [CrossRef] [PubMed]
- Shrivastava, S.; Lee, W.-I.; Lee, N.-E. Culture-Free, Highly Sensitive, Quantitative Detection of Bacteria from Minimally Processed Samples Using Fluorescence Imaging by Smartphone. Biosens. Bioelectron. 2018, 109, 90–97. [Google Scholar] [CrossRef] [PubMed]
- Rajendran, V.K.; Bakthavathsalam, P.; Jaffar Ali, B.M. Smartphone Based Bacterial Detection Using Biofunctionalized Fluorescent Nanoparticles. Microchim. Acta 2014, 181, 1815–1821. [Google Scholar] [CrossRef]
- Cheng, N.; Song, Y.; Zeinhom, M.; Chang, Y.C.; Sheng, L.; Li, H.; Du, D.; Li, L.; Zhu, M.J.; Luo, Y.; et al. Nanozyme-Mediated Dual Immunoassay Integrated with Smartphone for Use in Simultaneous Detection of Pathogens. ACS Appl. Mater. Interfaces 2017, 9, 40671–40680. [Google Scholar] [CrossRef]
- Wei, Q.; Qi, H.; Luo, W.; Tseng, D.; Ki, S.J.; Wan, Z.; Göröcs, Z.; Bentolila, L.A.; Wu, T.T.; Sun, R.; et al. Fluorescent Imaging of Single Nanoparticles and Viruses on a Smart Phone. ACS Nano 2013, 7, 9147–9155. [Google Scholar] [CrossRef] [Green Version]
- Gopinath, S.C.B.; Tang, T.-H.; Chen, Y.; Citartan, M.; Lakshmipriya, T. Bacterial Detection: From Microscope to Smartphone. Biosens. Bioelectron. 2014, 60, 332–342. [Google Scholar] [CrossRef]
- Hui, J.; Gu, Y.; Zhu, Y.; Chen, Y.; Guo, S.-J.; Tao, S.-C.; Zhang, Y.; Liu, P. Multiplex Sample-to-Answer Detection of Bacteria Using a Pipette-Actuated Capillary Array Comb with Integrated DNA Extraction, Isothermal Amplification, and Smartphone Detection. Lab Chip 2018, 18, 2854–2864. [Google Scholar] [CrossRef]
- Sajid, M.; Osman, A.; Siddiqui, G.U.; Kim, H.B.; Kim, S.W.; Ko, J.B.; Lim, Y.K.; Choi, K.H. All-Printed Highly Sensitive 2D MoS2 Based Multi-Reagent Immunosensor for Smartphone Based Point-of-Care Diagnosis. Sci. Rep. 2017, 7, 5802. [Google Scholar] [CrossRef] [Green Version]
- Aronoff-Spencer, E.; Venkatesh, A.G.; Sun, A.; Brickner, H.; Looney, D.; Hall, D.A. Detection of Hepatitis C Core Antibody by Dual-Affinity Yeast Chimera and Smartphone-Based Electrochemical Sensing. Biosens. Bioelectron. 2016, 86, 690–696. [Google Scholar] [CrossRef] [PubMed]
- Barnes, L.; Heithoff, D.M.; Mahan, S.P.; Fox, G.N.; Zambrano, A.; Choe, J.; Fitzgibbons, L.N.; Marth, J.D.; Fried, J.C.; Soh, H.T.; et al. Smartphone-Based Pathogen Diagnosis in Urinary Sepsis Patients. EBioMedicine 2018, 36, 73–82. [Google Scholar] [CrossRef] [PubMed] [Green Version]
- Ding, X.; Mauk, M.G.; Yin, K.; Kadimisetty, K.; Liu, C. Interfacing Pathogen Detection with Smartphones for Point-of-Care Applications. Anal. Chem. 2019, 91, 655–672. [Google Scholar] [CrossRef]
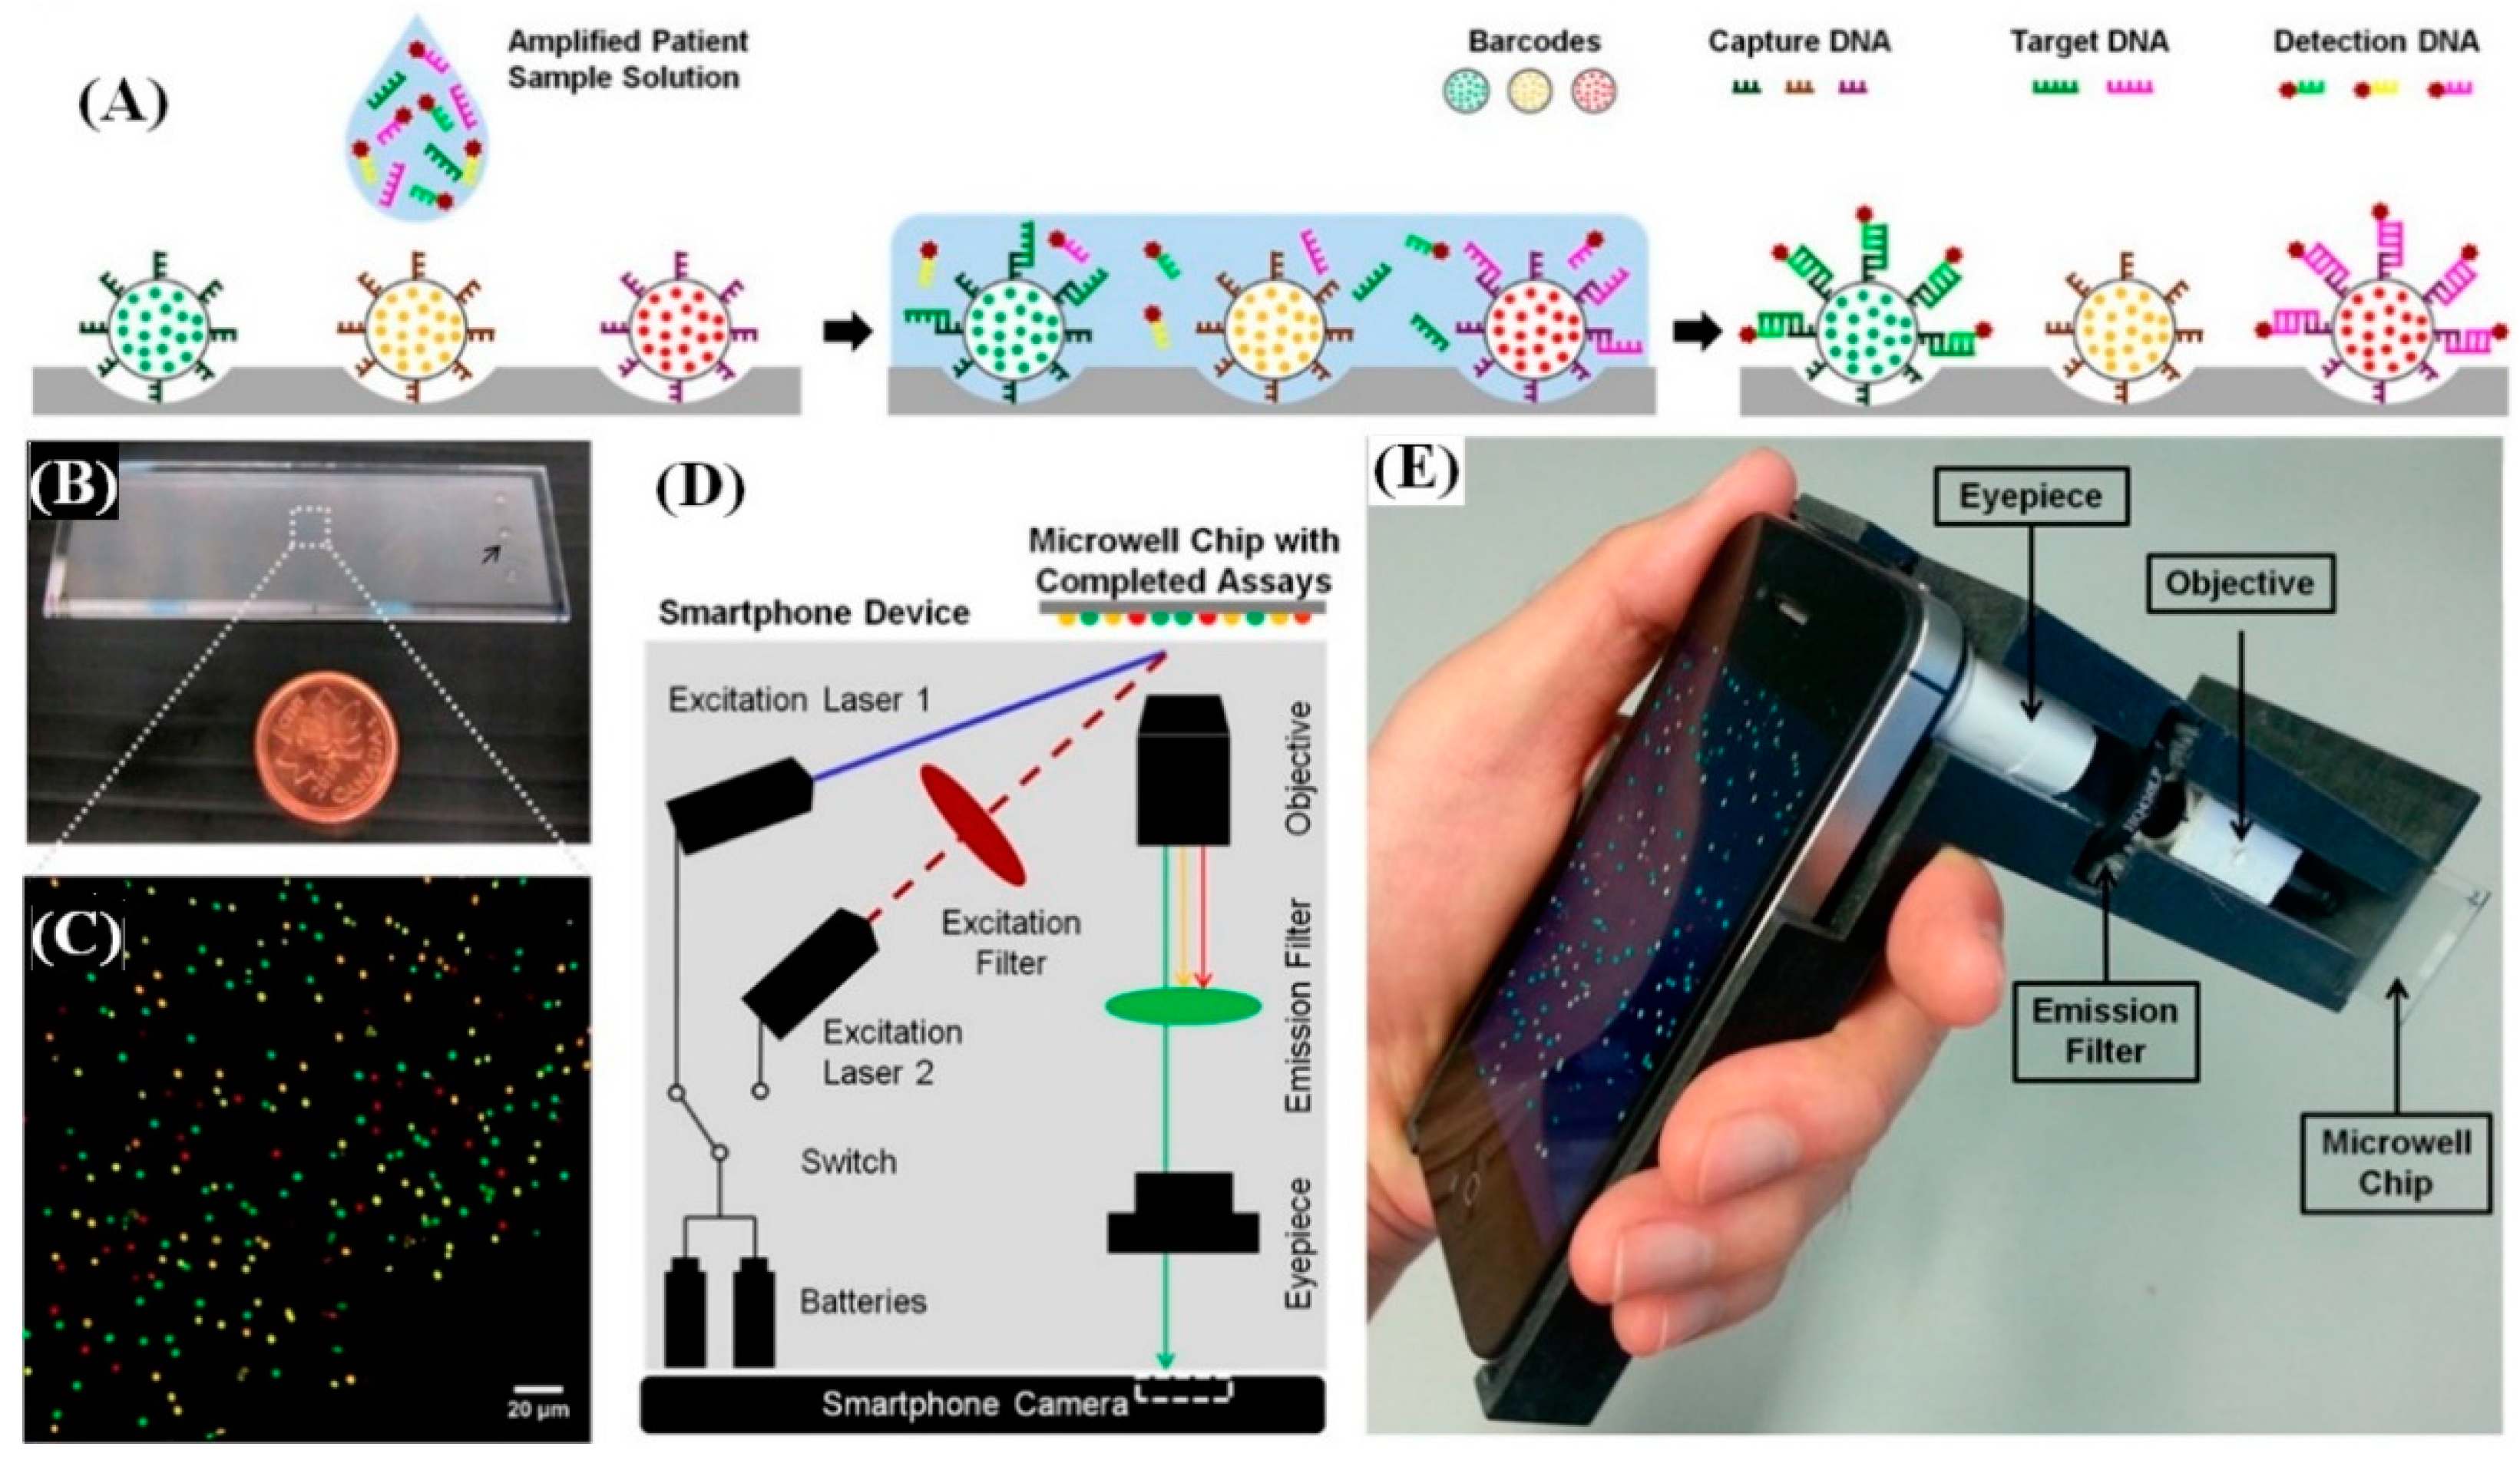
- Ming, K.; Kim, J.; Biondi, M.J.; Syed, A.; Chen, K.; Lam, A.; Ostrowski, M.; Rebbapragada, A.; Feld, J.J.; Chan, W.C.W. Integrated Quantum Dot Barcode Smartphone Optical Device for Wireless Multiplexed Diagnosis of Infected Patients. ACS Nano 2015, 9, 3060–3074. [Google Scholar] [CrossRef] [PubMed] [Green Version]
- Priye, A.; Bird, S.W.; Light, Y.K.; Ball, C.S.; Negrete, O.A.; Meagher, R.J. A Smartphone-Based Diagnostic Platform for Rapid Detection of Zika, Chikungunya, and Dengue Viruses. Sci. Rep. 2017, 7, 44778. [Google Scholar] [CrossRef]
- Mancuso, M.; Cesarman, E.; Erickson, D. Detection of Kaposi’s Sarcoma Associated Herpesvirus Nucleic Acids Using a Smartphone Accessory. Lab Chip 2014, 14, 3809–3816. [Google Scholar] [CrossRef] [PubMed] [Green Version]
- Veigas, B.; Jacob, J.M.; Costa, M.N.; Santos, D.S.; Viveiros, M.; Inácio, J.; Martins, R.; Barquinha, P.; Fortunato, E.; Baptista, P.V. Gold on Paper–Paper Platform for Au-Nanoprobe TB Detection. Lab Chip 2012, 12, 4802–4808. [Google Scholar] [CrossRef] [PubMed]
- Baptista, P.V.; Koziol-Montewka, M.; Paluch-Oles, J.; Doria, G.; Franco, R. Gold-Nanoparticle-Probe-Based Assay for Rapid and Direct Detection of Mycobacterium tuberculosis DNA in Clinical Samples. Clin. Chem. Engl. 2006, 1433–1434. [Google Scholar] [CrossRef]
- Zhu, H.; Sikora, U.; Ozcan, A. Quantum Dot Enabled Detection of Escherichia coli Using a Cell-Phone. Analyst 2012, 137, 2541–2544. [Google Scholar] [CrossRef] [Green Version]
- Daloglu, M.U.; Ray, A.; Collazo, M.J.; Brown, C.; Tseng, D.; Chocarro-Ruiz, B.; Lechuga, L.M.; Cascio, D.; Ozcan, A. Low-Cost and Portable UV Holographic Microscope for High-Contrast Protein Crystal Imaging. APL Photonics 2019, 4, 30804. [Google Scholar] [CrossRef] [Green Version]
- McLeod, E.; Wei, Q.; Ozcan, A. Democratization of Nanoscale Imaging and Sensing Tools Using Photonics. Anal. Chem. 2015, 87, 6434–6445. [Google Scholar] [CrossRef] [Green Version]
- Ray, A.; Li, S.; Segura, T.; Ozcan, A. High-Throughput Quantification of Nanoparticle Degradation Using Computational Microscopy and Its Application to Drug Delivery Nanocapsules. ACS Photonics 2017, 4, 1216–1224. [Google Scholar] [CrossRef]
- Zhang, Y.; Ouyang, M.; Ray, A.; Liu, T.; Kong, J.; Bai, B.; Kim, D.; Guziak, A.; Luo, Y.; Feizi, A.; et al. Computational Cytometer Based on Magnetically Modulated Coherent Imaging and Deep Learning. Light Sci. Appl. 2019, 8, 91. [Google Scholar] [CrossRef] [PubMed] [Green Version]
- Khalid, M.A.; Ray, A.; Cohen, S.; Tassieri, M.; Demčenko, A.; Tseng, D.; Reboud, J.; Ozcan, A.; Cooper, J.M. Computational Image Analysis of Guided Acoustic Waves Enables Rheological Assessment of Sub-Nanoliter Volumes. ACS Nano 2019, 13, 11062–11069. [Google Scholar] [CrossRef] [PubMed] [Green Version]
- Greenbaum, A.; Luo, W.; Su, T.-W.; Göröcs, Z.; Xue, L.; Isikman, S.O.; Coskun, A.F.; Mudanyali, O.; Ozcan, A. Imaging without Lenses: Achievements and Remaining Challenges of Wide-Field on-Chip Microscopy. Nat. Methods 2012, 9, 889–895. [Google Scholar] [CrossRef]
- Daloglu, M.U.; Ray, A.; Gorocs, Z.; Xiong, M.; Malik, R.; Bitan, G.; McLeod, E.; Ozcan, A. Computational On-Chip Imaging of Nanoparticles and Biomolecules Using Ultraviolet Light. Sci. Rep. 2017, 7, 44157. [Google Scholar] [CrossRef] [Green Version]
- Ozcan, A.; McLeod, E. Lensless Imaging and Sensing. Annu. Rev. Biomed. Eng. 2016, 18, 77–102. [Google Scholar] [CrossRef] [Green Version]
- McLeod, E.; Ozcan, A. Unconventional Methods of Imaging: Computational Microscopy and Compact Implementations. Rep. Prog. Phys. 2016, 79, 76001. [Google Scholar] [CrossRef] [Green Version]
- Luo, W.; Greenbaum, A.; Zhang, Y.; Ozcan, A. Synthetic Aperture-Based on-Chip Microscopy. Light Sci. Appl. 2015, 4, e261. [Google Scholar] [CrossRef]
- Hennequin, Y.; Allier, C.P.; McLeod, E.; Mudanyali, O.; Migliozzi, D.; Ozcan, A.; Dinten, J.-M. Optical Detection and Sizing of Single Nanoparticles Using Continuous Wetting Films. ACS Nano 2013, 7, 7601–7609. [Google Scholar] [CrossRef] [Green Version]
- McLeod, E.; Dincer, T.U.; Veli, M.; Ertas, Y.N.; Nguyen, C.; Luo, W.; Greenbaum, A.; Feizi, A.; Ozcan, A. High-Throughput and Label-Free Single Nanoparticle Sizing Based on Time-Resolved On-Chip Microscopy. ACS Nano 2015, 9, 3265–3273. [Google Scholar] [CrossRef] [Green Version]
- Mudanyali, O.; McLeod, E.; Luo, W.; Greenbaum, A.; Coskun, A.F.; Hennequin, Y.; Allier, C.P.; Ozcan, A. Wide-Field Optical Detection of Nanoparticles Using on-Chip Microscopy and Self-Assembled Nanolenses. Nat. Photonics 2013, 7, 247–254. [Google Scholar] [CrossRef] [Green Version]
- McLeod, E.; Nguyen, C.; Huang, P.; Luo, W.; Veli, M.; Ozcan, A. Tunable Vapor-Condensed Nanolenses. ACS Nano 2014, 8, 7340–7349. [Google Scholar] [CrossRef] [PubMed] [Green Version]
- Wu, Y.; Ray, A.; Wei, Q.; Feizi, A.; Tong, X.; Chen, E.; Luo, Y.; Ozcan, A. Deep Learning Enables High-Throughput Analysis of Particle-Aggregation-Based Biosensors Imaged Using Holography. ACS Photonics 2019, 6, 294–301. [Google Scholar] [CrossRef] [Green Version]
- Ray, A.; Daloglu, M.U.; Ho, J.; Torres, A.; Mcleod, E.; Ozcan, A. Computational Sensing of Herpes Simplex Virus Using a Cost-Effective on-Chip Microscope. Sci. Rep. 2017, 7, 4856. [Google Scholar] [CrossRef]
- Ray, A.; Khalid, M.A.; Demčenko, A.; Daloglu, M.; Tseng, D.; Reboud, J.; Cooper, J.M.; Ozcan, A. Holographic Detection of Nanoparticles Using Acoustically Actuated Nanolenses. Nat. Commun. 2020, 11, 171. [Google Scholar] [CrossRef]
- Veli, M.; Ozcan, A. Computational Sensing of Staphylococcus aureus on Contact Lenses Using 3D Imaging of Curved Surfaces and Machine Learning. ACS Nano 2018, 12, 2554–2559. [Google Scholar] [CrossRef] [PubMed]
Publisher’s Note: MDPI stays neutral with regard to jurisdictional claims in published maps and institutional affiliations. |


| Pathogens | Detection Platform | Detection Device | Type of Assay Used | References |
|---|---|---|---|---|
| SARS-CoV-2 | LFIA | Visual read | RT-LAMP and CRISPR | [59] |
| H1N1 | Microfluidics | Amperometry | Electrochemical | [60] |
| Zika virus Zika, Dengue and Chikungunya | LFIA Microfluidics Microfluidics (Paper) Plasmonics Reaction tubes | Smartphone Smartphone Smartphone Spectral shift Smartphone | Fluorescent Immunoassay ELISA RT-LAMP Immunoassay LAMP | [61] [62] [55] [107] [132] |
| HIV HIV and Hep. B | LFIA Microfluidics Plasmonic Barcoded chip | Smartphone Electric sensing Spectral shift Smartphone | RT-LAMP Immunoassay Immunoassay Isothermal amplification | [69] [71] [106] [131] |
| H7N9 | Plasmonics | Immunoassay | [104] | |
| Kaposi sarcoma herpesvirus 8 | Microfluidics | Smartphone | Nanoparticle aggregation | [133] |
| HSV1 | Glass Chip Surface functionalized glass Chip | Lensless Holographic microscope Lensless Holographic microscope | Microparticle clustering Size-based Immunoassay | [151] [152] |
| S. aureus | Contact Lens | Holographic microscope | Immunoassay | [154] |
| E. coli | Paper microfluidic Plasmonics Glass capillaries | Smartphone CCD Smartphone | Nanoparticle aggregation Immunoassay Sandwich Immunoassay | [71] [108] [136] |
| M. tuberculosis | Microfluidic Plasmonics Paper/plasmonics | Amperometry Optical Sensor Array Smartphone | Electrochemical ELISA Immunoassay Nanoparticle aggregation | [74] [109] [134] |
© 2020 by the authors. Licensee MDPI, Basel, Switzerland. This article is an open access article distributed under the terms and conditions of the Creative Commons Attribution (CC BY) license (http://creativecommons.org/licenses/by/4.0/).
Share and Cite
Nath, P.; Kabir, A.; Khoubafarin Doust, S.; Kreais, Z.J.; Ray, A. Detection of Bacterial and Viral Pathogens Using Photonic Point-of-Care Devices. Diagnostics 2020, 10, 841. https://doi.org/10.3390/diagnostics10100841
Nath P, Kabir A, Khoubafarin Doust S, Kreais ZJ, Ray A. Detection of Bacterial and Viral Pathogens Using Photonic Point-of-Care Devices. Diagnostics. 2020; 10(10):841. https://doi.org/10.3390/diagnostics10100841
Chicago/Turabian StyleNath, Peuli, Alamgir Kabir, Somaiyeh Khoubafarin Doust, Zachary Joseph Kreais, and Aniruddha Ray. 2020. "Detection of Bacterial and Viral Pathogens Using Photonic Point-of-Care Devices" Diagnostics 10, no. 10: 841. https://doi.org/10.3390/diagnostics10100841