Article

In Vivo Endoscopic Optical Coherence Tomography of the Healthy Human Oral Mucosa: Qualitative and Quantitative Image Analysis

1
Department of Medical Physics and Biomedical Engineering, Technische Universitaet Dresden, Carl Gustav Carus Faculty of Medicine, Fetscherstraße 74, 01307 Dresden, Germany
2
Department of Anesthesiology and Intensive Care Medicine, Technische Universität Dresden, Clinical Sensoring and Monitoring, Carl Gustav Carus Faculty of Medicine, Fetscherstraße 74, 01307 Dresden, Germany
*
Author to whom correspondence should be addressed.
Diagnostics 2020, 10(10), 827; https://doi.org/10.3390/diagnostics10100827
Submission received: 14 September 2020 / Revised: 8 October 2020 / Accepted: 10 October 2020 / Published: 15 October 2020
(This article belongs to the Section Medical Imaging and Theranostics)

Abstract

:
To date, there is still a lack of reliable imaging modalities to improve the quality of consultation, diagnostic and medical examinations of the oral mucosa in dentistry. Even though, optical technologies have become an important element for the detection and treatment of different diseases of soft tissue, for the case of oral screenings the evidence of the benefit in comparison to conventional histopathology is mostly still pending. One promising optical technology for oral diagnostics is optical coherence tomography (OCT). To prove the potential of OCT, even the amount of freely accessible OCT data is not sufficient to describe the variance of healthy human oral soft tissue in vivo. In order to remedy this deficiency, the present study provides in vivo OCT cross sections of the human oral mucosa of the anterior and posterior oral cavity as well as the oropharynx of 47 adult volunteers. A collection of representative OCT cross sections forms the basis for a randomized blinded image analysis by means of seven criteria to assess the main features of the superficial layers of the human oral mucosa and to determine its correlation to regional features known from hematoxylin and eosin (HE) stained histology.

1. Introduction

According to the results of the global burden of disease study, diagnosis and treatment of oral cancer is still challenging because of at least >350,000 new cases and >170,000 deaths every year [1]. The most common type of oral cancer is the squamous cell carcinoma (SCC) (90% of all oral malignancies [2]) developing within the few ten microns thin epithelium, which is replaced by a neoplastic tissue associated with a progressive dysplasia [2,3]. The highest incidence is found between the ages of 55 and 75 years corresponding to a mean age of onset of about 63 years for male and 66 years for female patients [4]. With regard to demographic aging, the global incidence of oral cancer is predicted to increase of almost two thirds in 2035 [4]. Even though, treatment methods have been improved over the last decades and leading risk factors like smoking, excessive consumption of alcohol and HPV infection are well-known, the overall 5-year survival remains low of about 63% being significantly decreased in advanced stages [2,3,4,5,6]. The reason for this lies primarily in the high number of initial diagnoses at a late stage underlining the necessity for an improved early diagnosis [4].
With regard to the routine diagnostic process, the general anamnesis is complemented by a visual examination and a subsequent endoscopy for difficult-to-access regions of the posterior oral cavity as well as oropharynx [7]. Depending on the reported symptoms, that may include oral bleeding, persisting pain or progressive swelling, as well as existing visually suspect lesions, the indication for an invasive biopsy with histopathological evaluation is set by means of the medical opinion [7,8]. Although, incisional and excisional biopsies represent the current gold standard of an accurate and complete diagnosis [7,8,9], the procedure is painful and requires a surgical intervention leading to a reduced compliance of the patient [9,10]. Especially for the case of extensive and/or numerous lesions, the decision on the location and size of the tissue sample for a representative biopsy is challenging [9,10]. Moreover, missing out on recurrences and relapses (second primary cancer) or redundant biopsies is problematic [11].
In this context, the implementation of optical techniques provides the opportunity to examine the oral mucosa in a non-invasive and non-ionising way before the decision of starting the tissue extraction [12]. Optical coherence tomography (OCT) is such an emerging optical technology enabling cross-sectional sub-surface in vivo imaging of biological tissues with a common spatial resolution of about 5 20   μ m [13,14]. By the implementation of adapted rigid or fiber optics, endoscopic OCT can be used for the non-invasive examination of human oral soft tissue [15,16]. As tissue elements of the mucosal sublayers result in various scattering behaviour, information about the appearance and geometry of the epithelium and the underlying lamina propria becomes accessible [14,17]. Ongoing research has occasionally proposed perspective measurement parameters, such as the mean epithelial thickness, the occurrence of a keratinized layer and the course of the basement membrane, for the detection of (pre-)malignant changes of the oral epithelium by means of OCT [14,17]. Furthermore, OCT image scoring was performed using hamster cheek pouches, concentrating on the presence of irregular epithelial stratification in combination with broadened rete pegs and basal hyperplasia [18]. Beyond that, diagnostic scoring was done on human oral soft tissue in the context of preliminary studies [19]. Moreover, several ex vivo studies as well as an increasing amount of in vivo investigations have described key features of suspicious lesions and oral squamous cell carcinoma, such as the increase in epithelial thickness as well as the loss of the basement membrane during the progress of malignant transformation [17,20]. Regarding oral lesions alongside the upper aerodigestive tract, measurement of epithelial thickness provided large differences resulting in a moderate sensitivity and specificity in order to distinguish noninvasive from invasive proliferation [21]. Along with the process of epithelial thickening, changes in the standard deviation of the OCT signal have been reported offering the possibility to differentiate between the stages of oral dysplasia in a more reliably way [22,23,24]. However, the correct identification of early dysplasia by means of intensity-based OCT was stated to be difficult because of a similar appearance compared to benign lesions [20].
As requirement for the accurate evaluation of pathological changes of the human oral mucosa, healthy oral soft tissue was investigated by only a few studies mostly realized with small numbers of volunteers [25,26,27]. The majority of OCT images were obtained from examinations within the anterior parts of the oral cavity, like the labial, buccal and sublingual mucosa, whereas OCT cross sections of the posterior areas, such as the oropharynx and the palatine tonsils, likewise typical sites of oral cancer, have only been presented rarely. Ridgway et al. [26] showed a collection of OCT cross sections depicting the normal oral mucosa of fifteen different locations as well as a combination of benign and malign lesions. Image material was gained from measurements with a flexible handheld OCT probe including a total of forty-one patients. Within the examples, epithelium was described as hyporeflective layer followed by the basement membrane and the hyperreflective lamina propria consisting of connective tissue, minor salivary glands and blood vessels [26]. Prestin et al. [25] intended to determine reference values for the mean epithelial thickness by investigating 143 healthy test persons. A commercial fiber-based OCT device was used to conduct in vivo measurements at seven points, among them the buccal mucosa, the mouth floor, the palatine arch, the uvula and the hard palate. Further results were published by Stasio et al. [27] involving 28 healthy adult volunteers and six defined areas of the oral soft tissue, the labial mucosa, the buccal mucosa, the gingiva, the mouth floor as well as the ventral and dorsal tongue. Measurements were done by means of a commercial swept-source OCT system with a grip type probe.
Against this background, the demand for a comprehensive study with the aim of assessing the variance of appearance of the healthy oral mucosa, in dependence of the localization within the oral cavity, and with this the ground truth arises [17,26]. Moreover, systematic reviews suggest that the visual interpretation of OCT data sets is often strongly user-dependent due to a lack of established standards for the image analysis [17], which leads to the aim of defining qualitative and quantitative criteria for an improved optical biopsy by OCT. On the other hand, there are several studies dealing with an automatic evaluation of OCT images of oral pathologies [28,29]. Here, changes in the speckle pattern of the epithelium as well as in the signal intensity within the single A-scans offer the possibility to serve as indicators for the development of oral malignancy [28]. Besides, the measurement of the epithelial thickness and the determination of the basement membrane can be done by means of an automatic segmentation algorithm [29]. For this purpose, corresponding histopathological images are used to confirm the findings in the OCT cross sections reaching a solid base for software training in regards to the detection of malign lesions. However, in order to improve the current state of knowledge concerning healthy oral soft tissue, the aim of the presented study is the detection and analysis of in vivo OCT data sets representing characteristic and cancer-relevant parts of normal mucosa alongside the whole oral cavity, which forms the fundamental basis for further developments in functional and endoscopic OCT [26,27,30,31,32,33] as well as subsequent clinical research.

2. Materials and Methods

2.1. Study Population

Forty-seven healthy adult volunteers participated in the presented in vivo study. Before starting the measurement, volunteers were screened visually by an experienced physician for exclusion criteria including suspicious oral lesions (i.e., erythroplakia, leukoplakia and ulcers), chronic or recently occurred disorders (i.e., mucous membrane and connective tissue diseases) as well as alcohol- and smoking-induced tissue damage. In addition, common oral symptoms (i.e., dry mouth, recurrent pain, gingival bleeding, increased sensitivity) were registered within anamnesis. Reactive changes in the mucosa related to alcohol and tobacco were considered by quantifying alcohol intake (g/day) and smoking habits (cigarettes per day; pack years). According to a systematic review of Burger et al. [34], mucosa was classified as healthy, if the mean consumption did not exceed the tolerable upper alcohol intake level (TUAL; 10–12 g/day for healthy adult women; 20–24 g/day for healthy adult men). Concerning the use of tobacco, the tolerance level corresponds to a frequency of less than 10 cigarettes per day and a total amount of less than 10 pack years leading to a similar likelihood ratio for oral cancer compared to never smokers [35]. Finally, sex and age were noted and used to categorize groups (male/female; <25 years, 25–45 years and >45 years). All participants have declared their informed consent before the examination. The study was approved by the ethics commission of the Faculty of Medicine of the Technische Universitaet Dresden (EK 96032018; 2018-11-16).

2.2. Endoscopic OCT System

Acquisition of OCT image series was realized by the use of a customized optical probe (lateral resolution: 17.4 μ m , working distance: 7.5 mm) based on a commercial rigid endoscope (8711 AGA, Karl Storz GmbH & Co. KG, length: 200 mm, insertion diameter: 10 mm, angle of view: 0 ) [36] in combination with a self-built spectrometer-based OCT system using a fiber-coupled superluminescent diode (SLD-371-HP1, Superlumdiodes Ltd., center wavelength: λ = 840 nm, FWHM: λ = 45 nm) and a customized spectrometer [37], providing an axial resolution in air of 11.6 μ m . Cross-sectional OCT images (64 B-scans) consisting of 480 A-scans were detected with increments of δ x = 5 μ m (fast scanning axis) and δ y = 10 μ m (slow scanning axis) to cover a scanning field of 2.4 mm × 0.6 mm in about 2.5 s (fA-scan = 11.88 kHz). The whole endoscopic OCT system was in accordance with the requirements for a positive ethics committee vote concerning the aspect of disinfection and sterilization.

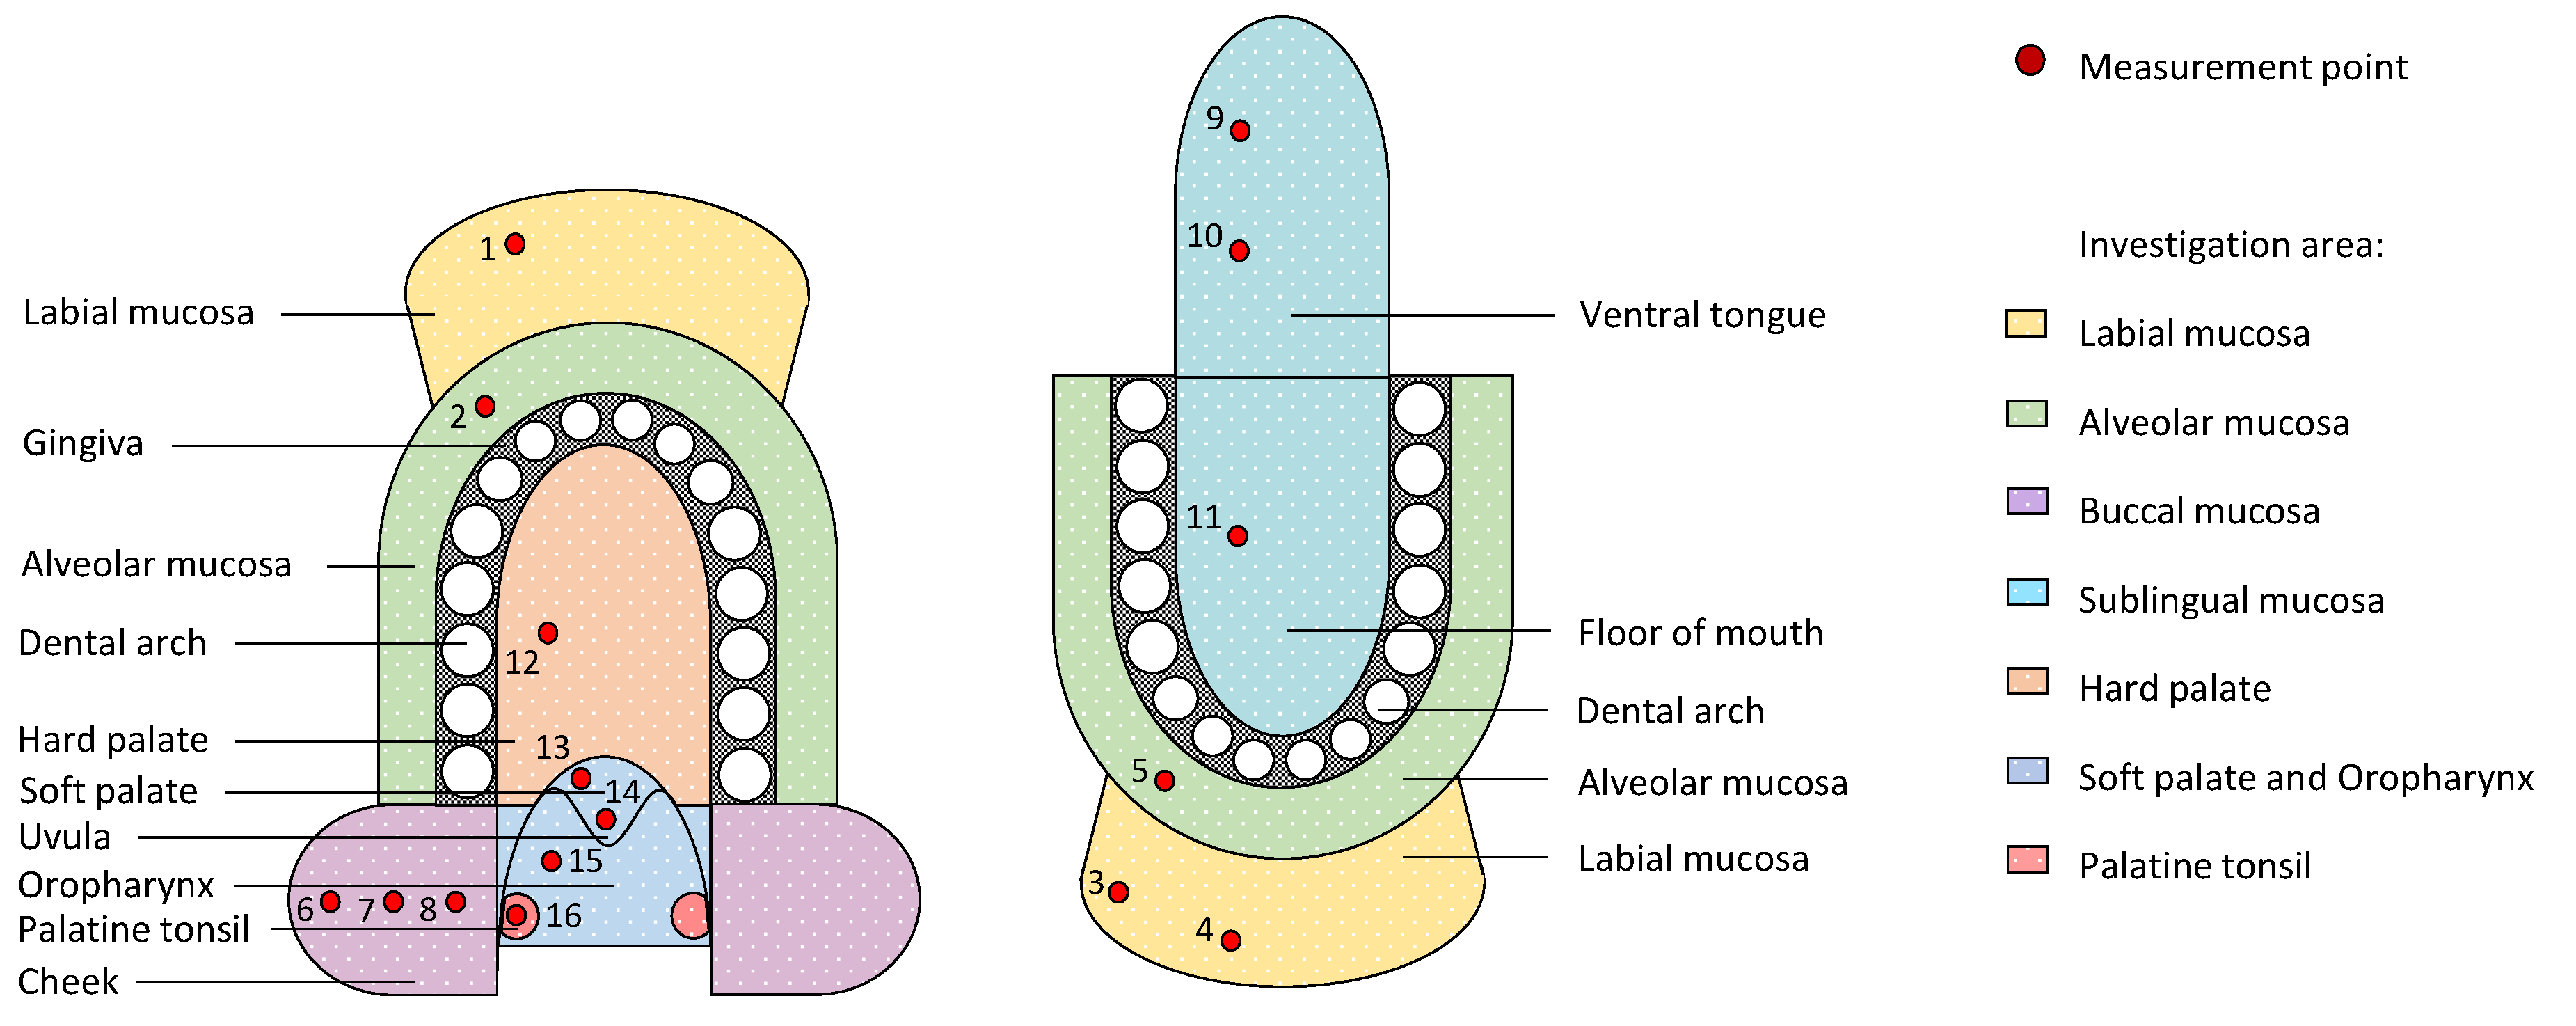
2.3. Measurement Protocol

Endoscopic OCT image series were detected at 16 measurement points within seven regions of the oral cavity in accordance to the measurement plan in Figure 1. Corresponding zones that are expected to be characterized by comparable structure and ratio of the mucosal layers are presented in the same color. The sequence of measurements was set from outer to inner oral cavity with additional points alongside the buccal and sublingual region enabling the comparison of anterior and posterior regions. Within the oral vestibule, measurement points were situated alongside the upper and lower part of the labial and alveolar mucosa. In this context the term “alveolar mucosa” defined the oral soft tissue that is located between the attached gingiva and the adjacent labial mucosa. In this study, lining oral mucosa was mainly recorded since deeper structures of the masticatory and specialized oral mucosa, such as strongly keratinized attached gingiva and dorsal tongue, are unreliably detected because of the limited penetration depth as a result of increased backscattering of the probing light. Thus, with the exception of the masticatory mucosa of the hard palate, the presented study particularly considers the measurement of the lining mucosa of the oral cavity and the oro-pharyngeal isthmus with respect to common sites of oral cancer.
The examination with the rigid handheld OCT endoscope was supported by a chin and head rest that ensures the reduction of patient movement and consequently motion artefacts. The entire examination was performed in sitting position whereby measurement points were scanned without direct contact to the local mucosa as well as unilateral on the subject’s right side to minimize measurement time. Recording two stacks of 64 B-scans in each case results in a total examination time of approximately 20 min. To reach all of the points to be investigated, common tools (i.e., tongue depressor, cotton cloth) were used including the minor active involvement of the volunteer (e.g., participants were instructed to turn down their lips for imaging the labial region).
The image processing contained the visual selection of a series of five B-scans for each measurement position being used for the subsequent image analysis. By means of defined criteria (see Section 2.4), each cross section was examined by a prospective physician well-versed in OCT in agreement with a skilled histologist. Quantitative and qualitative evaluation of the selected OCT cross sections has been done with ImageJ [38]. A random choice of 200 images served as training set before the analysis. Finally, a characterization of the anatomical regions by means of OCT was created, summarizing the results of corresponding measurement points and regions.

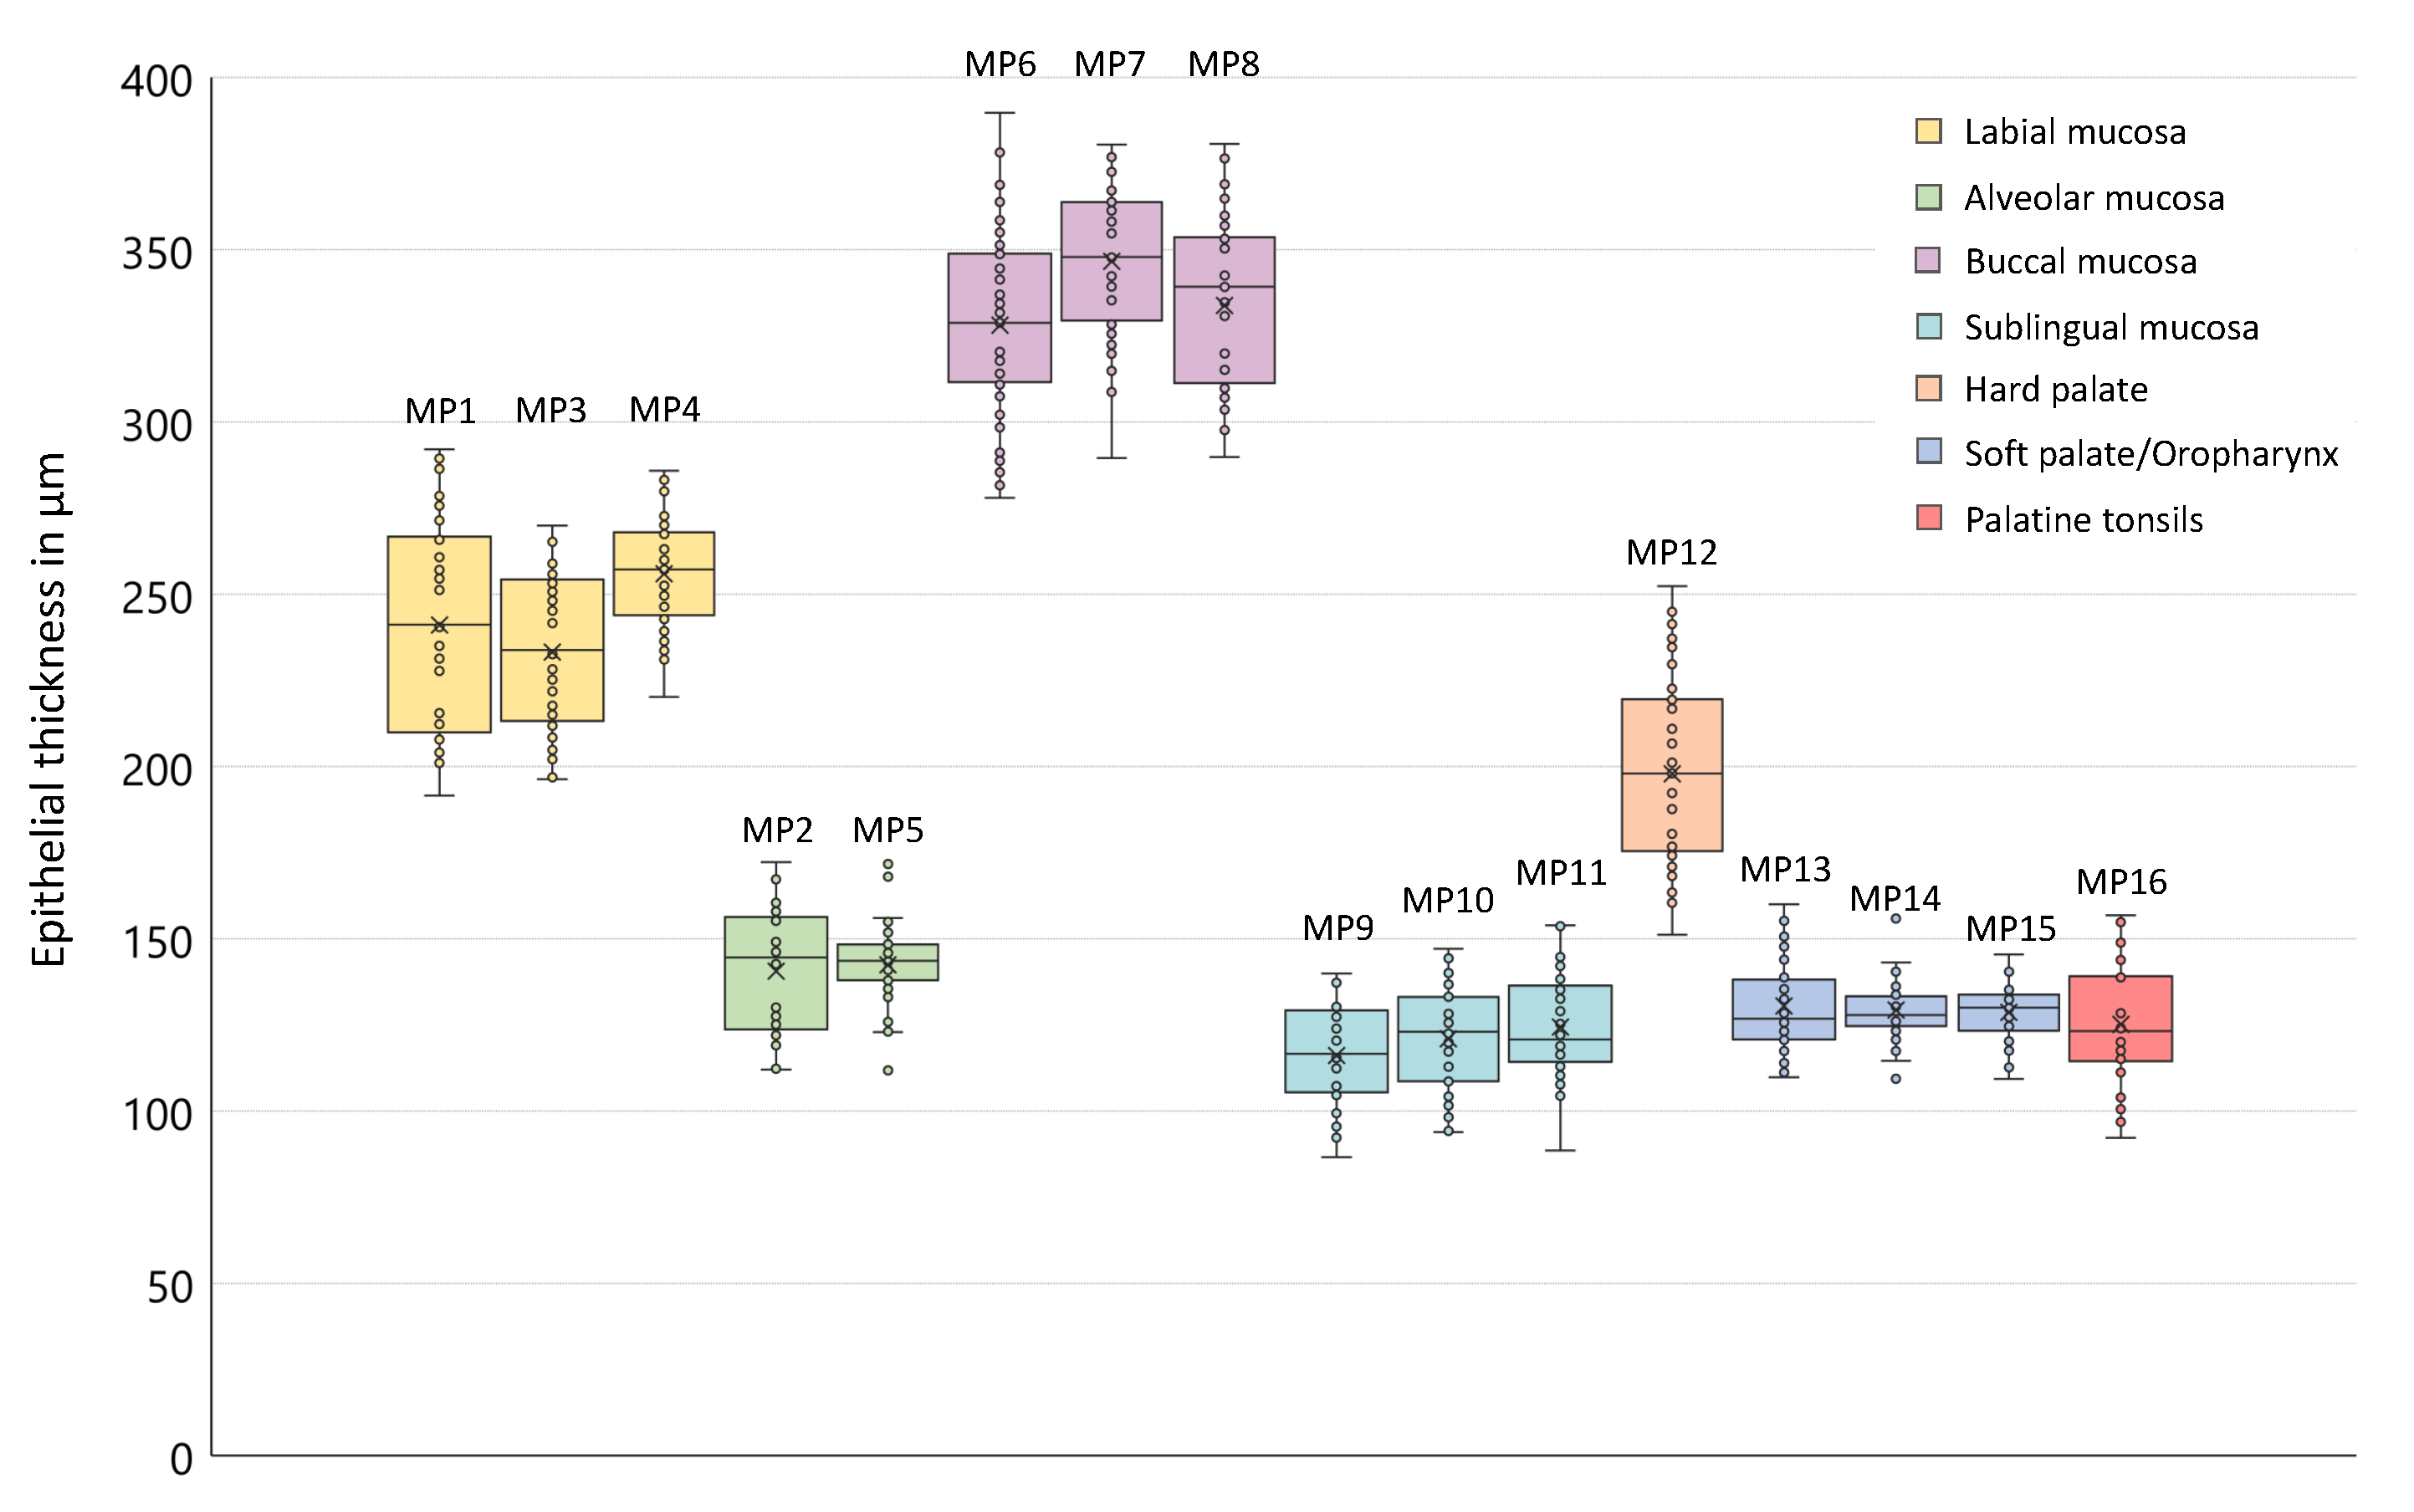
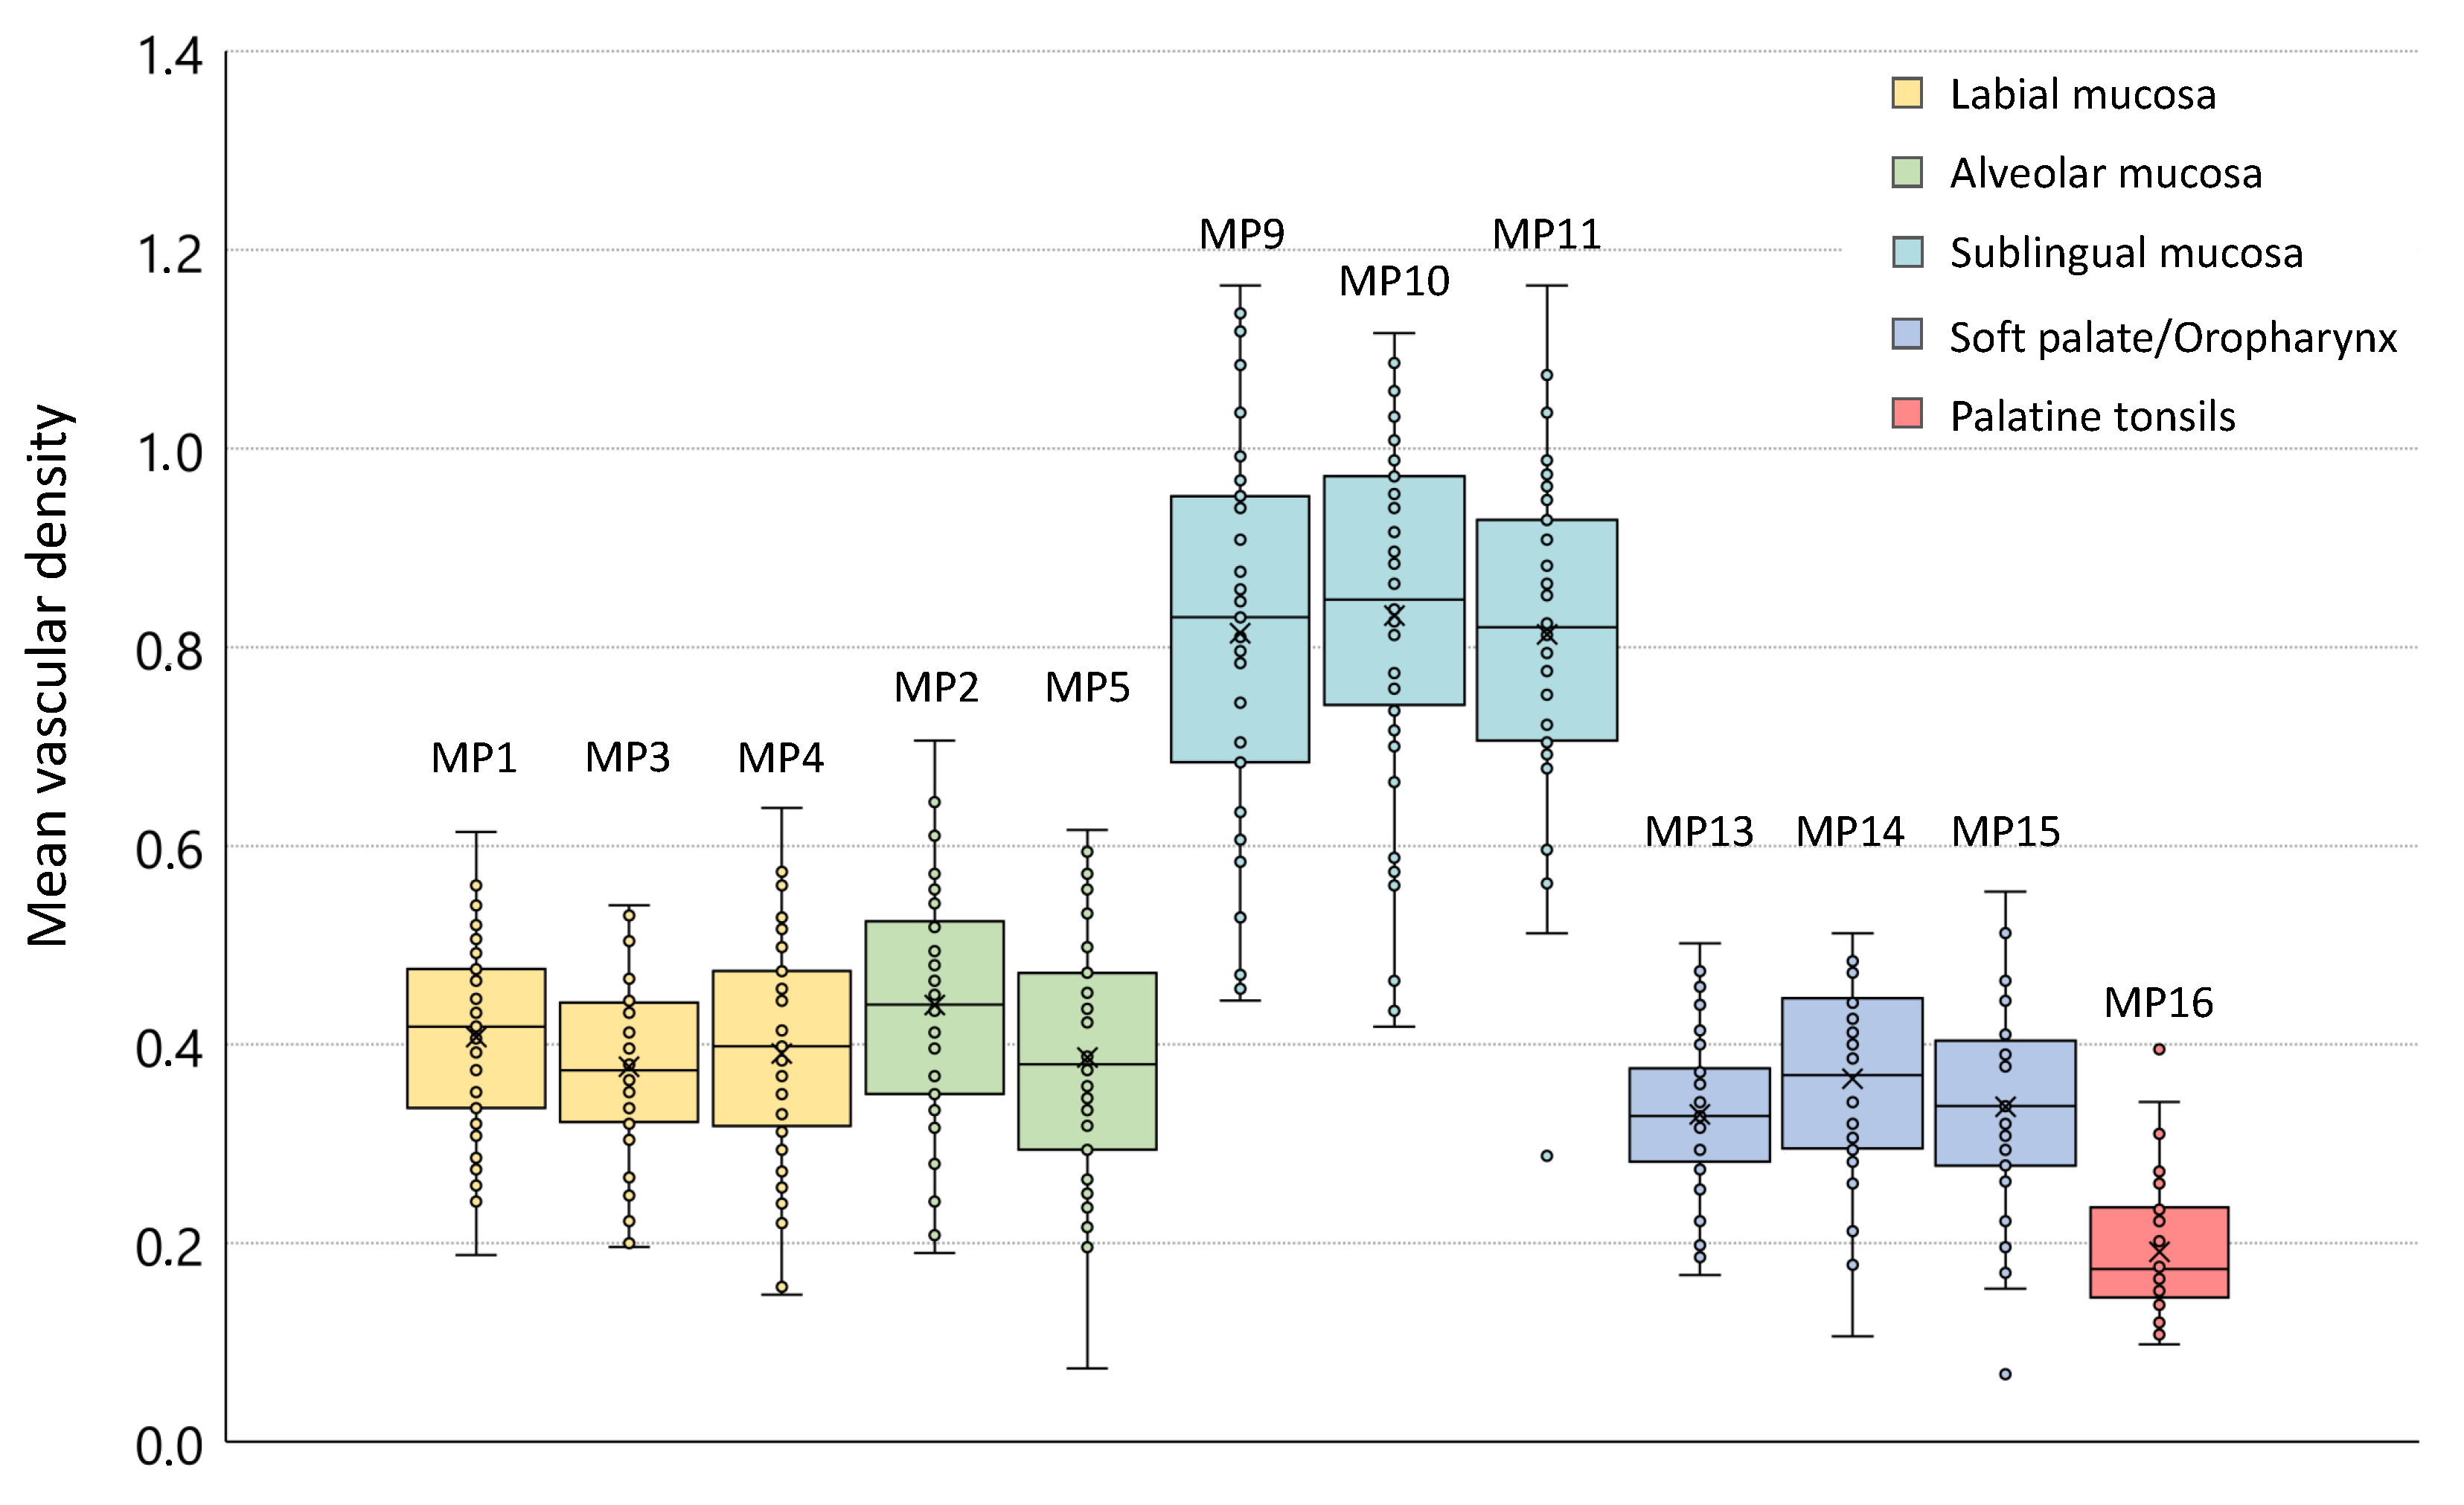
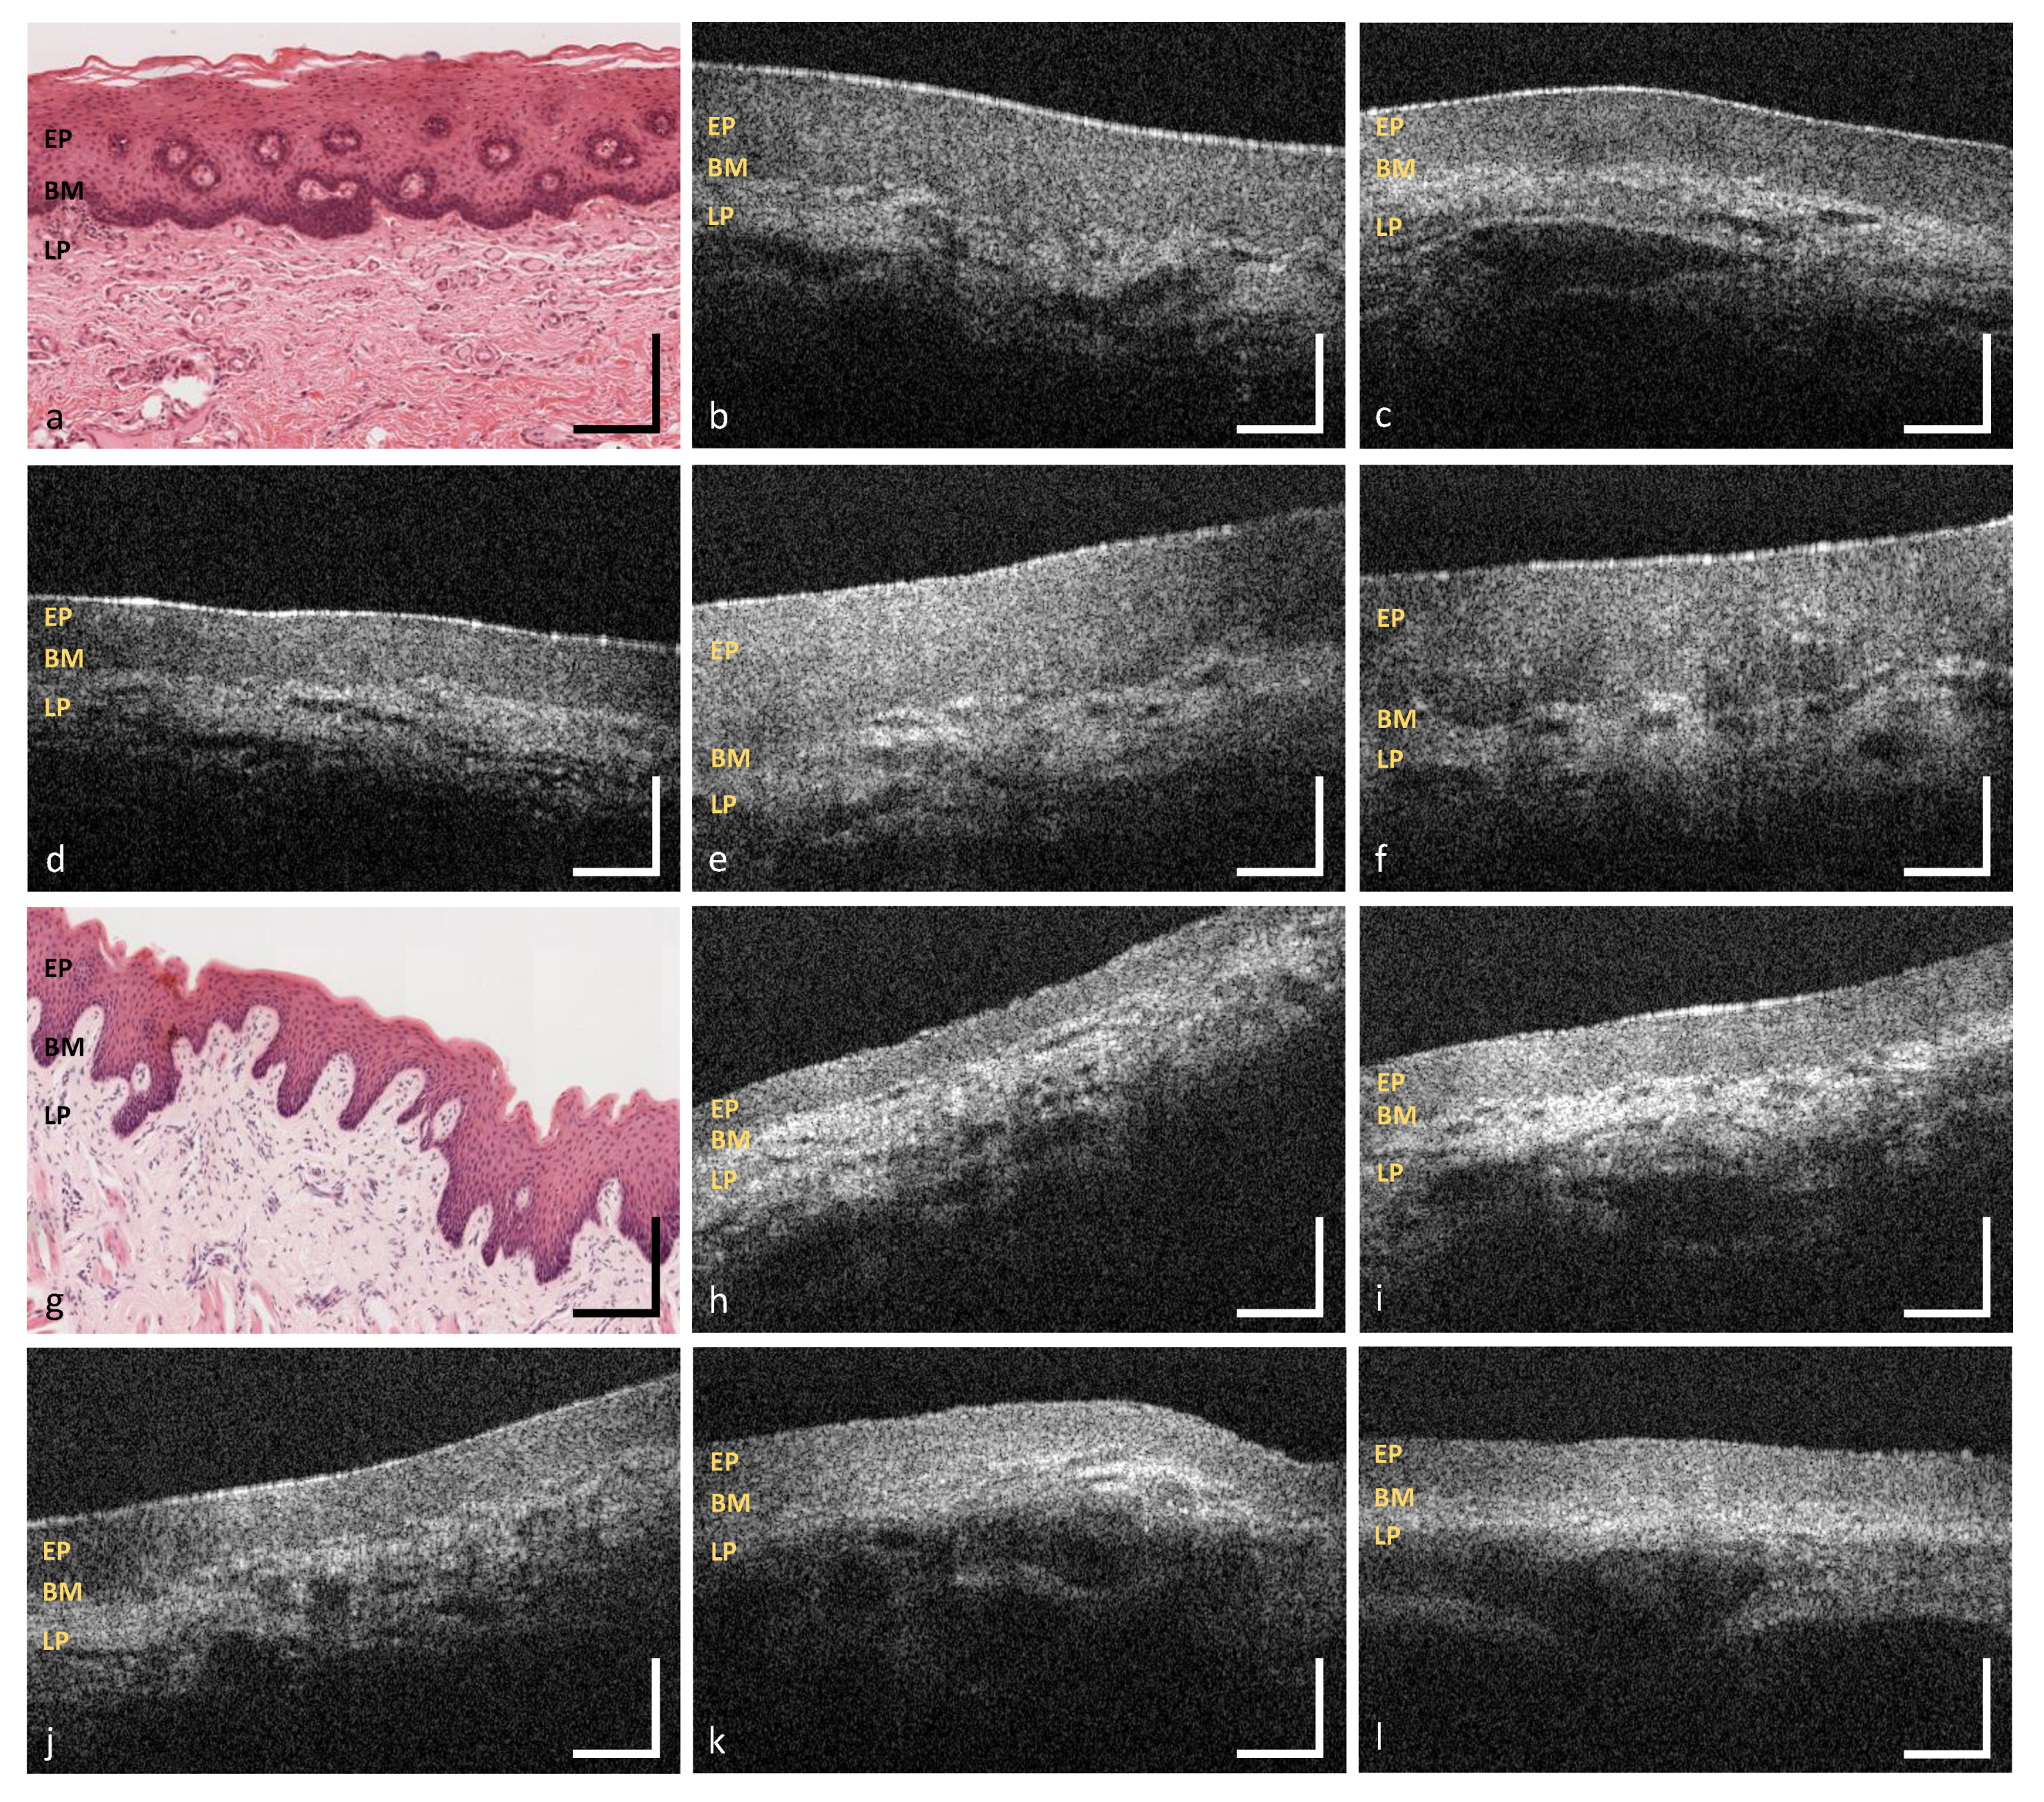
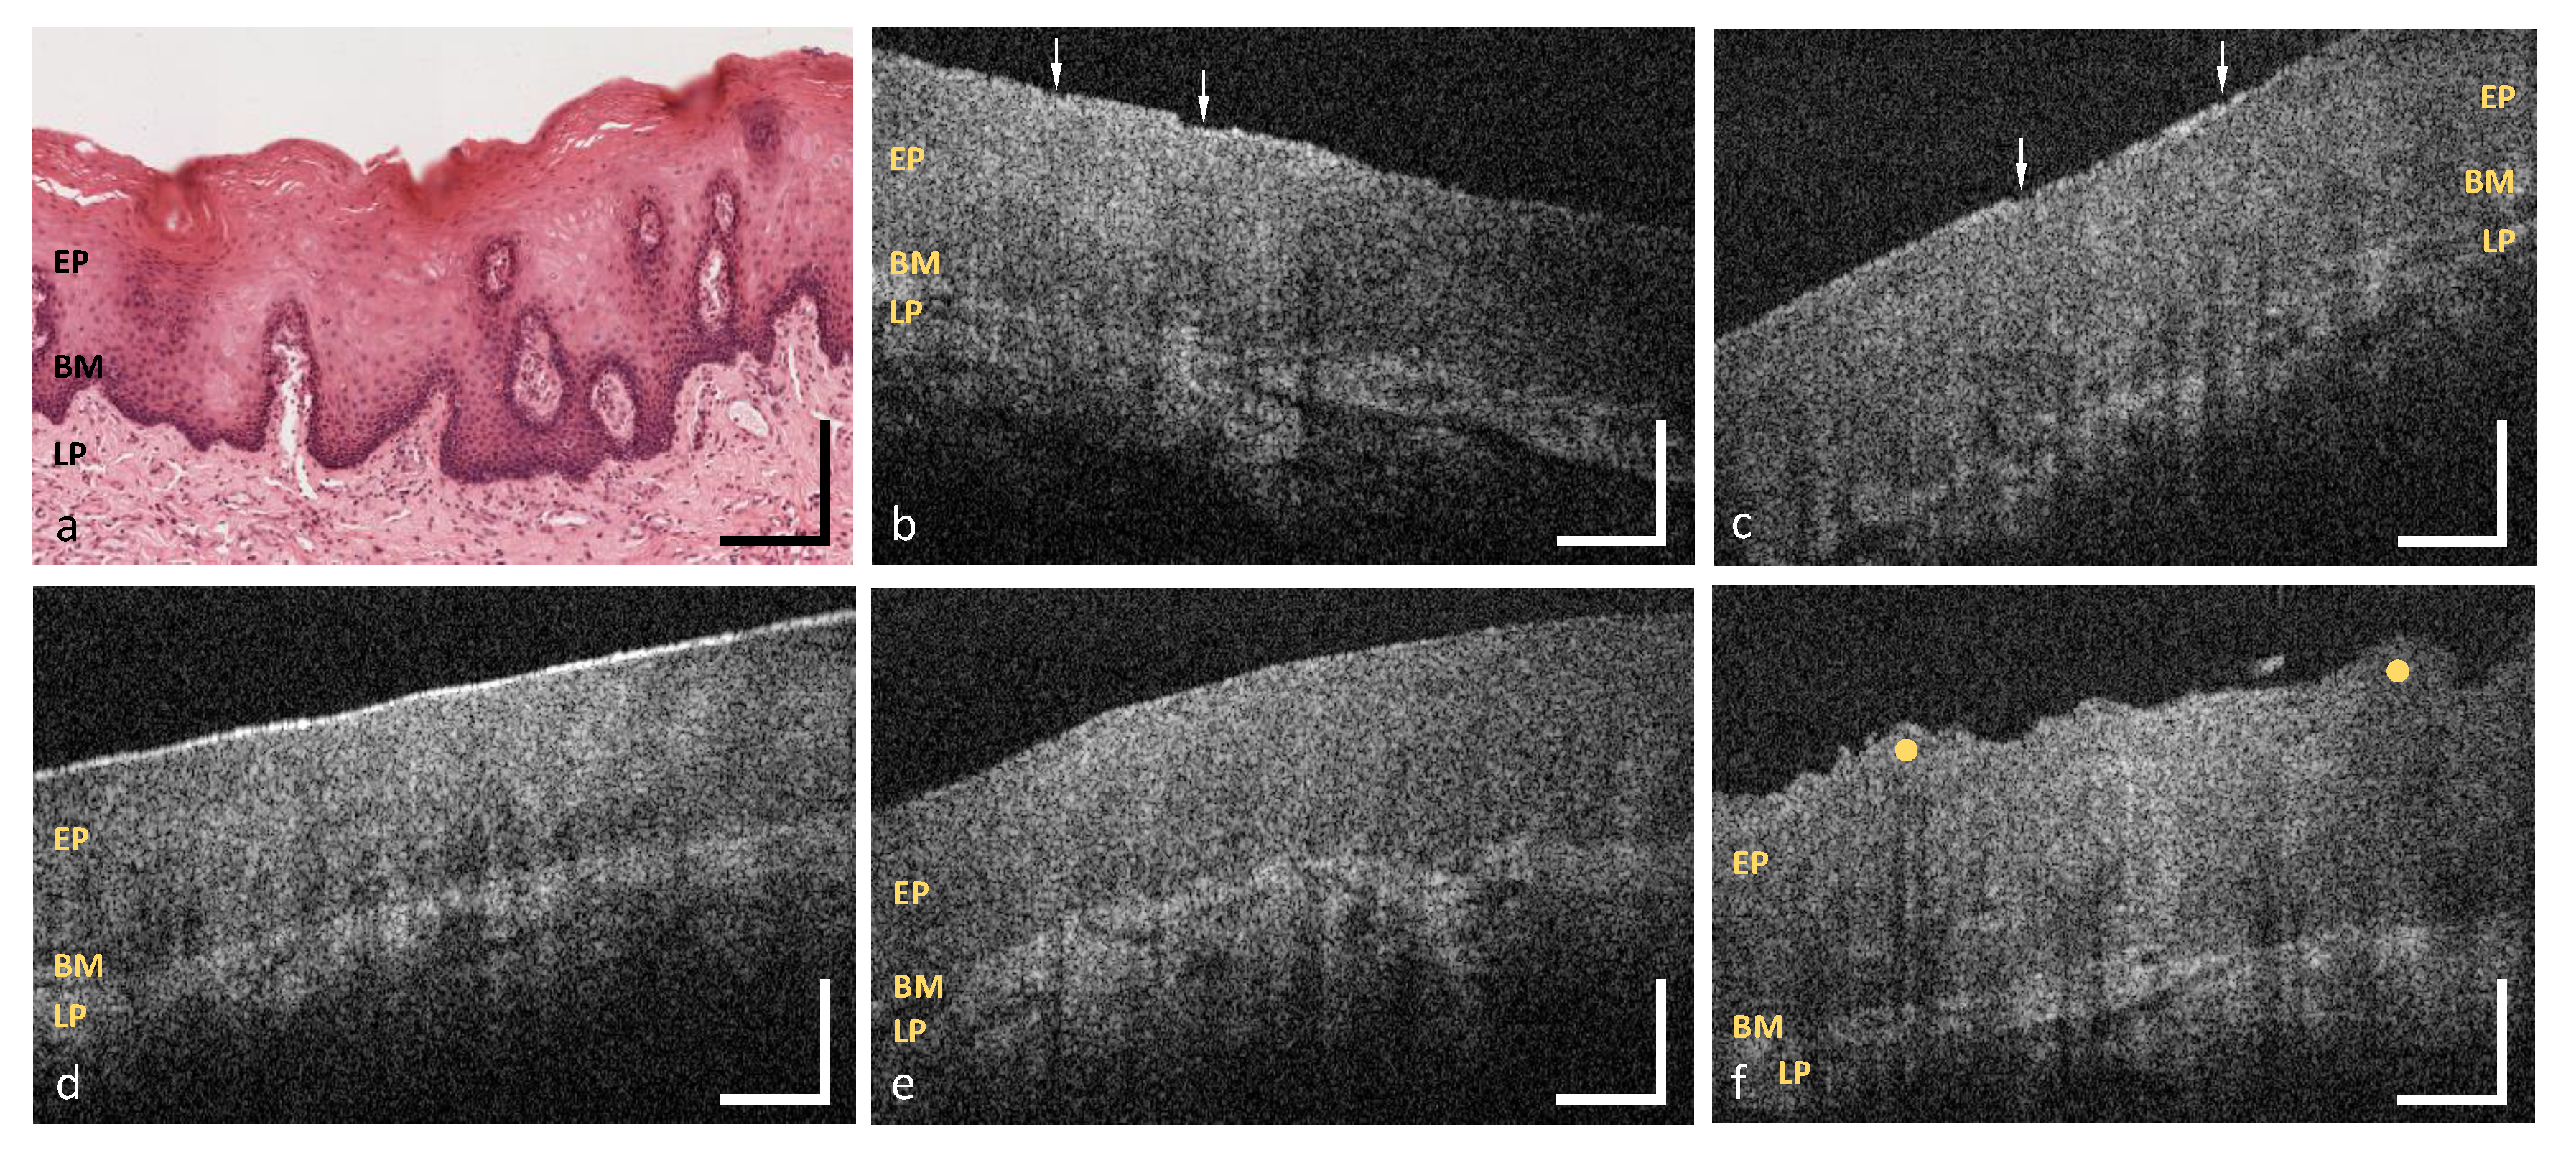
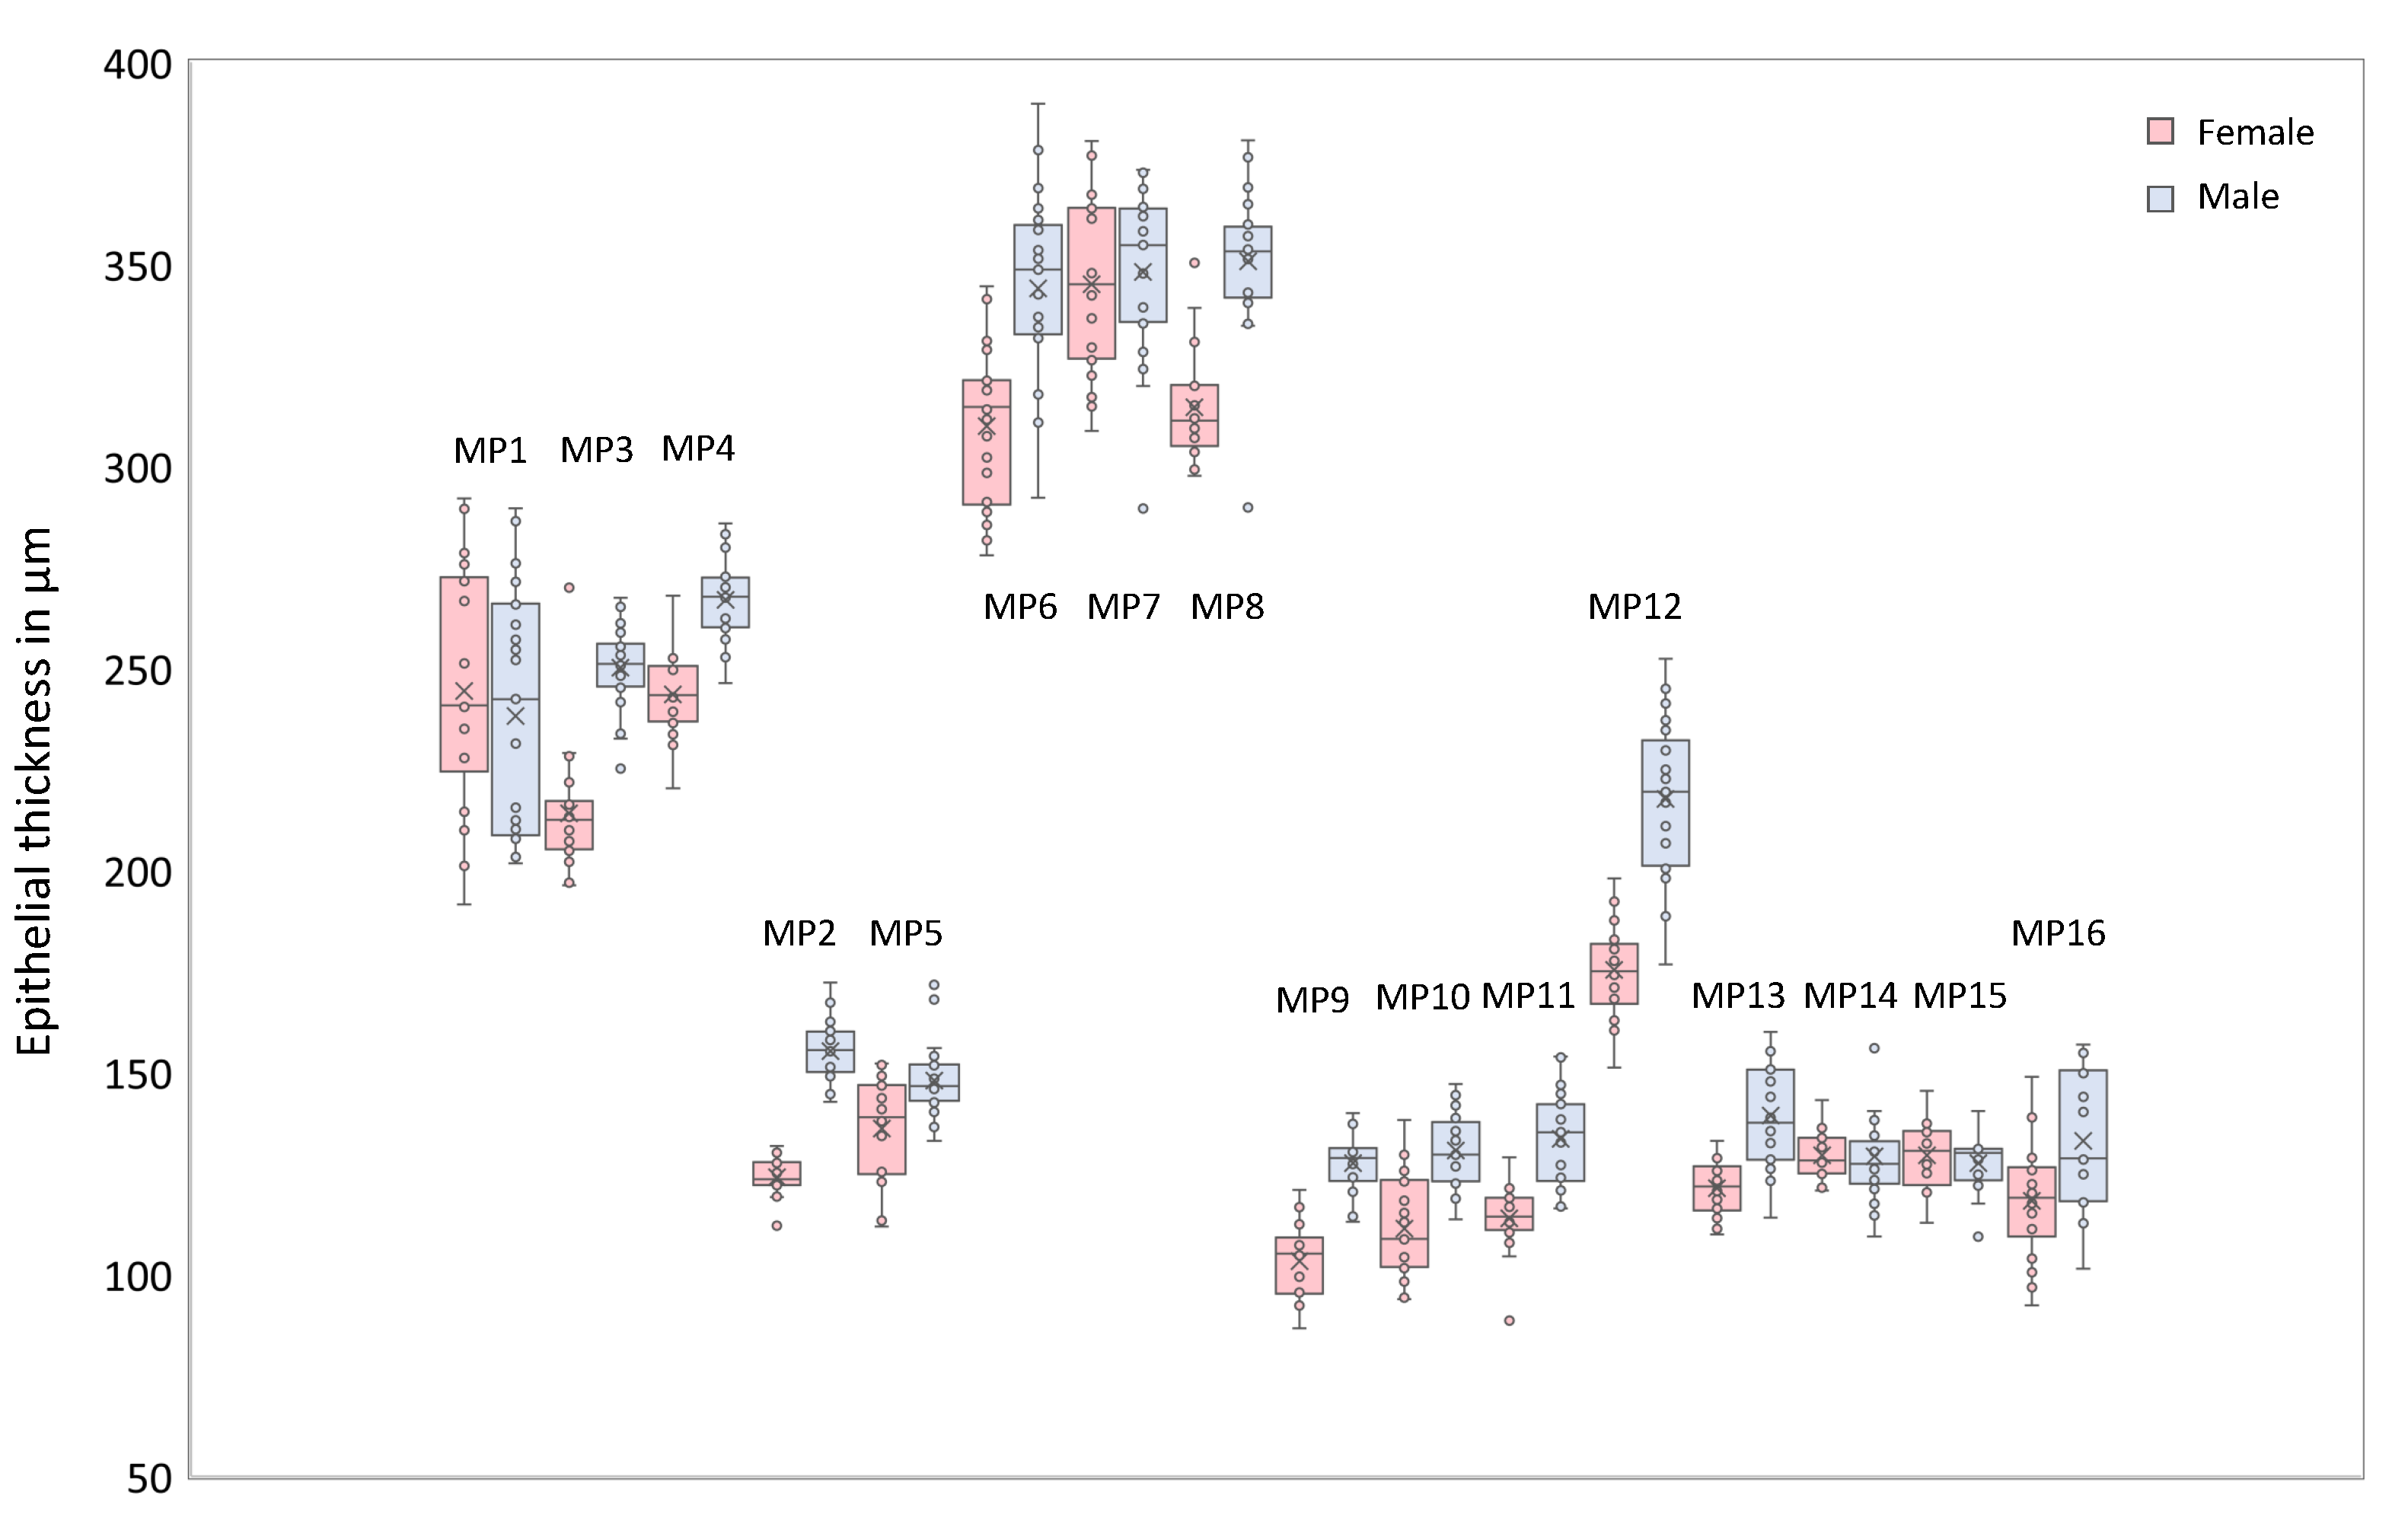
2.4. OCT Image Analysis

As illustrated in Table 1, the OCT image analysis was manually performed using a set of criteria concerning the epithelium (EP) and the adjacent lamina propria (LP) (Figure 2). Within this section, evaluation is methodically explained and exemplified by five sample images.
First of all, the integrity of the epithelial surface is assessed by searching for lesions. The surface is called “intact”, if the number of single lesions does not exceed one; otherwise the term “with alterations” is used. The sublingual mucosa depicted in Figure 2a shows an intact surface, whereas the mucosa of the hard palate in Figure 2b contains numerous epithelial surface alterations (arrows). Moreover, the surface profile is evaluated by differentiating between “even” and “uneven” course. The term “even” underlined that the epithelial surface is free from crypts (concave) and ridges (convex) larger than 200 μ m in diameter (cp. Figure 2a). Therefore, epithelium with an uneven surface is exemplarily presented by means of the plicae ridges of the hard palate (yellow dots in Figure 2b).
Additionally, the deep structure of the epithelium is categorized into “homogeneous” and “inhomogeneous” by regarding the local tissue reflectivity within a single B-scan. According to former studies that presented healthy oral mucosa [25,26,27], epithelium is expected to be less scattering than the highly reflecting collagen network within the lamina propria. If hypo- or hyperreflective areas are not identified, the epithelium is classified as homogeneous as shown in Figure 2a. In comparison, the masticatory mucosa of the hard palate in Figure 2b shows an inhomogeneous epithelium containing a hyperreflective surface of the ridges (yellow dots in Figure 2b).
Since OCT is an interferometric technique allowing the depth-resolved distance measurement, the optical path length (OPL) of the epithelium (EP, from the surface to the basement membrane BM, Figure 2) is measured at five evenly distributed positions throughout each cross section (red bars in Figure 2c). For this purpose, the OCT cross section was visualized with ImageJ using a 23”-screen. By drawing a vertical line with the straight line tool of Image J, the distance from the top of the epithelial surface to the visually undermost pixel of the hypointense epithelial layer was measured. Here, the position of the basement membrane was determined by eye. Considering the vertical length of the pixel of l = 5 μ m and the refractive index of the epithelium of n = 1.37 [25,39] at a center wavelength of λ = 840 nm, the corresponding mean value of the geometrical length is determined for each B-scan. Combining the results of each specific measurement point, sex- and age-specific reference values of healthy oral mucosa are obtained within the investigated regions (see Appendix A).
Furthermore, the basement membrane (BM), defined as junction between the epithelium (EP) and the underlying lamina propria (LP), is visually verified for integrity. The class “intact” is used to characterize a continuous basement membrane without any gaps (cp. Figure 2a). A reduced demarcation of the border is described as “unsharp”. The term “not assessable” is used for the case that the basement membrane could not be depicted due to the reduced penetration depth. Consequently, the evaluation of the lamina propria and the measurement of the epithelial thickness is not possible.
Corresponding to the approach of OCT angiography, the grade of tissue vascularization is estimated by measuring the luminal area of larger vessels and relating the result to the avascular epithelial layer (also referred to as mean vessel density) [40,41]. For this, single or multiple yellow-colored elliptic shapes mark regions of vascularization, as shown in Figure 2c. The sum of the segmented areas is divided by the total area of the detected epithelium determined by a polygonal shape. Depending on the ratio, the vascular supply by major vessels is classified as “low” (<0.10), “moderate“ (0.10–0.30) or “high” (>0.30).
Additional characteristic features of the lamina propria, such as minor salivary glands (SG in Figure 3a) or lymphoid follicles (LF in Figure 3b), are considered in the last criterion. Salivary glands, which consist of a few lobules and an excretory duct (cp. asterisk in Figure 2b), emerge as round hyporeflective elements [42], embedded within the hyperreflective connective tissue. Lymphoid follicles appear hyporeflective with an inner germinal centre [43].

2.5. Statistical Analysis

In order to compare the investigation areas (Figure 1), the percentage distribution of the results of the qualitative evaluation criteria (Table 1) is determined for each measurement point. Concerning the epithelial thickness, a mean value is calculated for each series of five B-scans representing the individual epithelial thickness of the volunteer at the corresponding measurement point. Subsequently, these individual values are used to determine the mean value and standard deviation for the final determination of the epithelial thickness at each measurement point (see Appendix A, Table A1). A similar approach is done for the sex- and age-related groups with the objective to generate an initial data set of reference values. The results for each measurement point and every investigation area are summarized in box plots. The grade of tissue vascularization is analyzed in the same way by calculating mean values for the series of five B-scans of each volunteer and presenting them in box plots depending on the location within the oral cavity.
Table 2 summarized details about the study population and the number of OCT cross sections. Altogether, 3560 OCT images of 47 healthy adult volunteers (Nmale = 25 and Nfemale = 22) form the basis for the described analysis. The whole sample consisted of fair-skinned participants without oral pigmentation in the visual examination. The mean age corresponds to 29.4 years (range: 20–56 years). Concerning the age groups, 30 subjects (63.8%) were assigned to the mean one (25–45 years). None of the volunteers showed suspicious lesions in the visual examination or described oral symptoms within the anamnesis. Moreover, there was no report of alcohol intake or smoking above the tolerance levels.
The measurement of the anterior oral cavity was feasible in all cases resulting in 235 OCT images for each measurement point (MP1-MP12). The soft palate (MP13) as well as the uvula (MP14) have been accessible in 45 (95.7%) and 40 (85.1%) volunteers, respectively. In addition, the oropharynx (MP15) and the palatine tonsil (MP16) have been able to detect in 29 (61.7%) and 34 (72.3%) volunteers. In 38.4% of the cases, the first of two image stacks (à 64 B-scans) provided visually appropriate B-scans for the OCT image analysis. Using OCT images out of the second stack was especially required for the analysis of the labial and alveolar mucosa due to the flexible soft tissue alongside these regions.

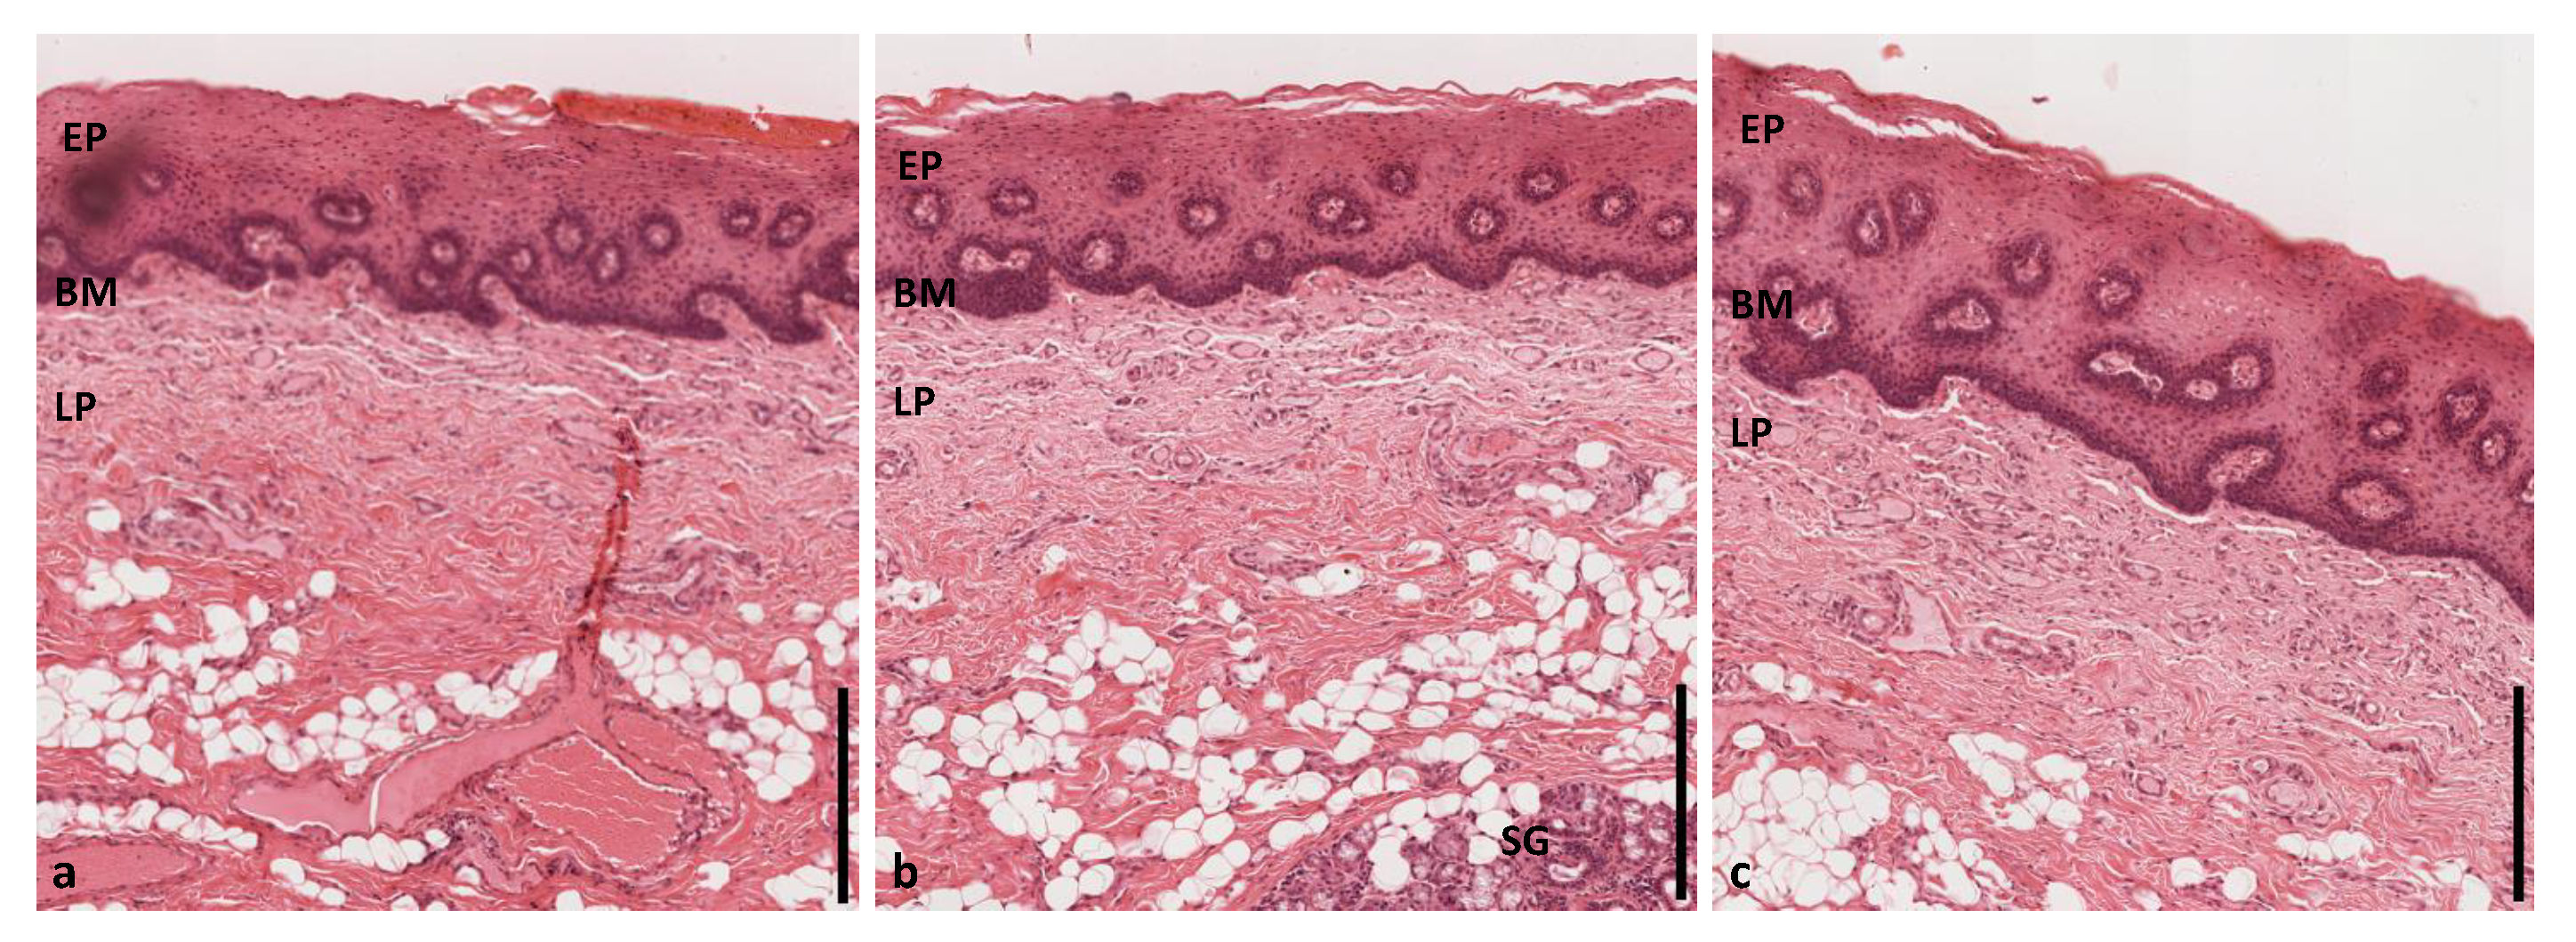
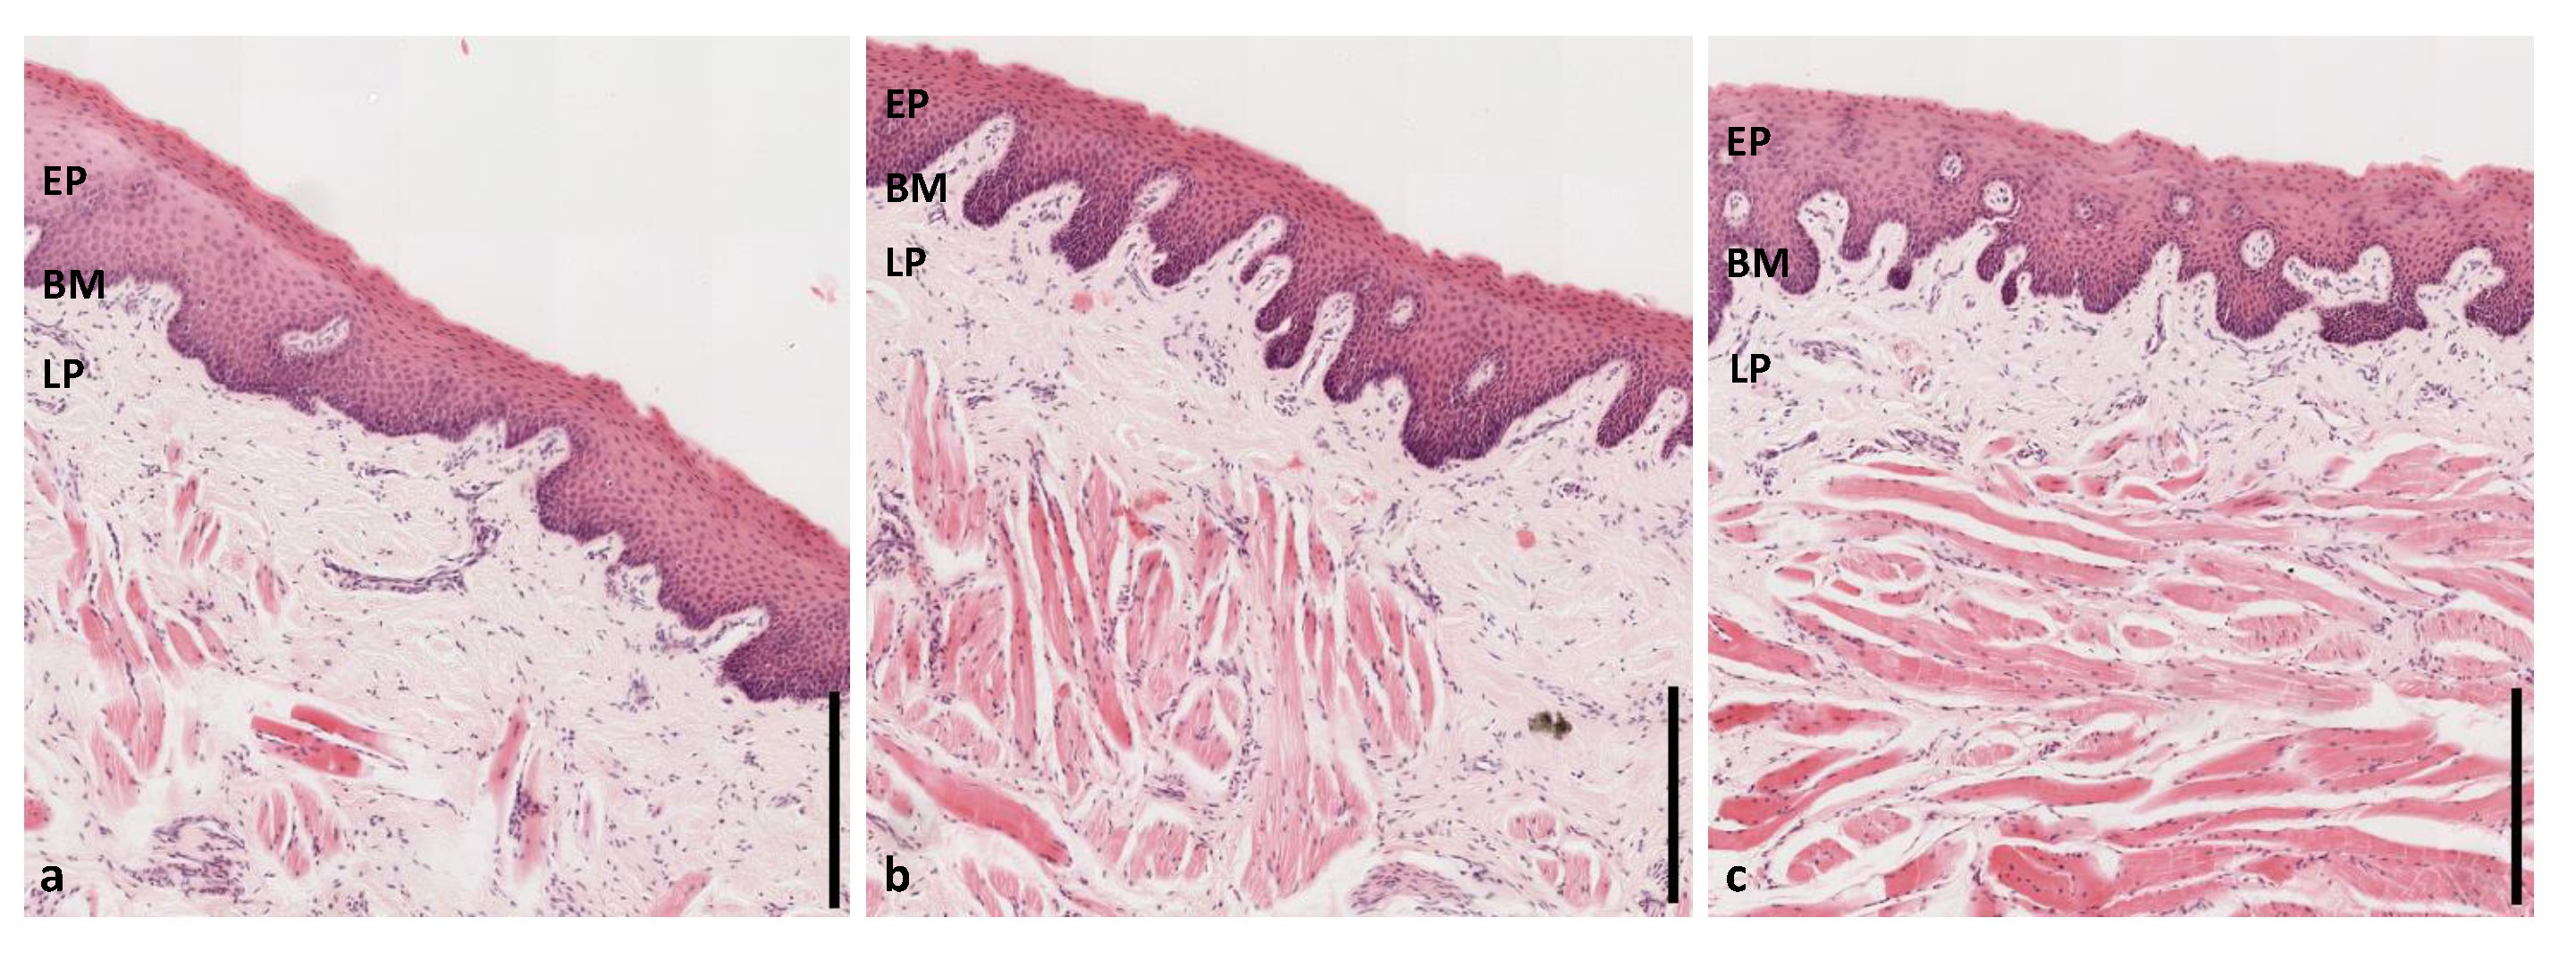
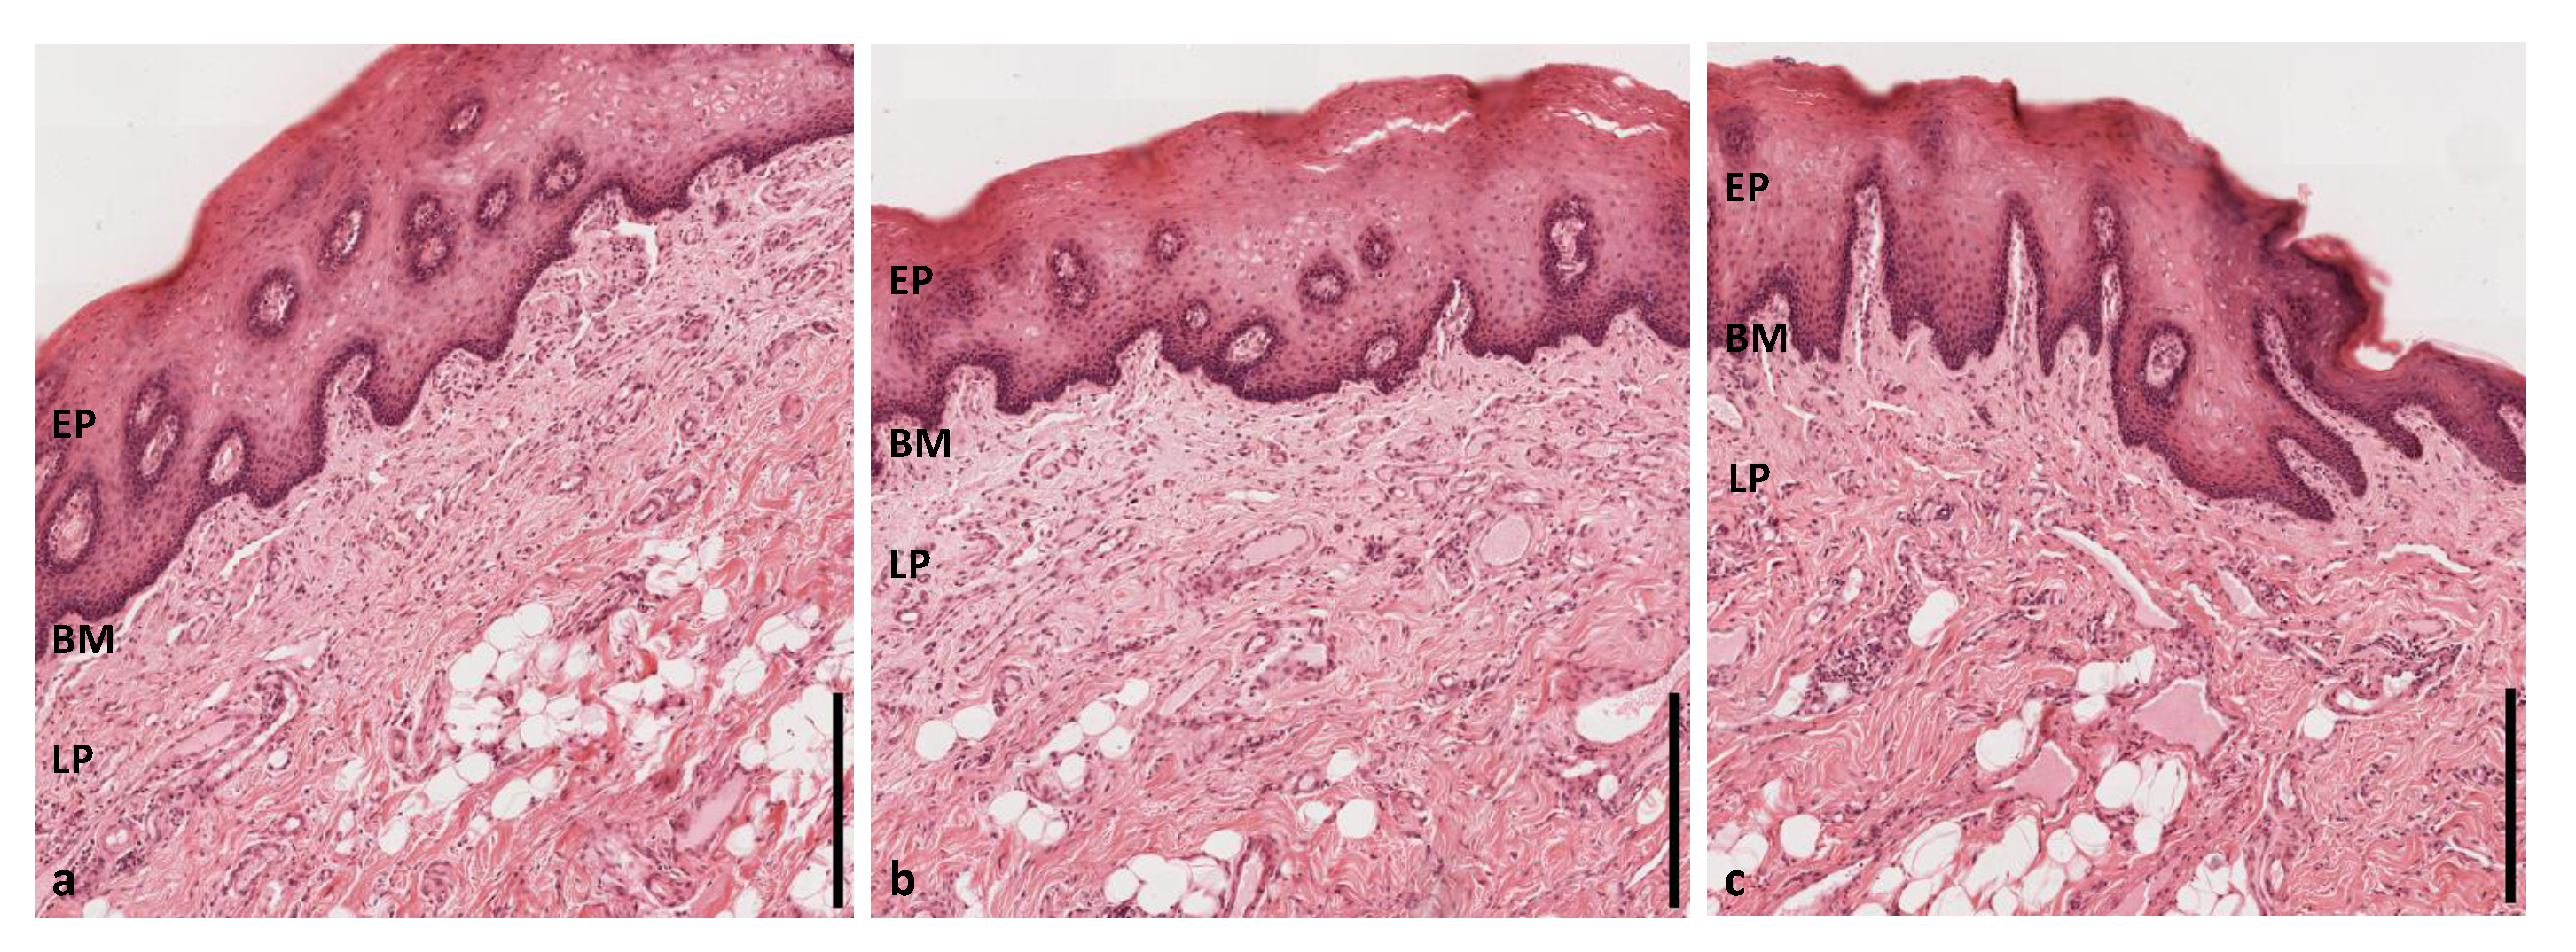
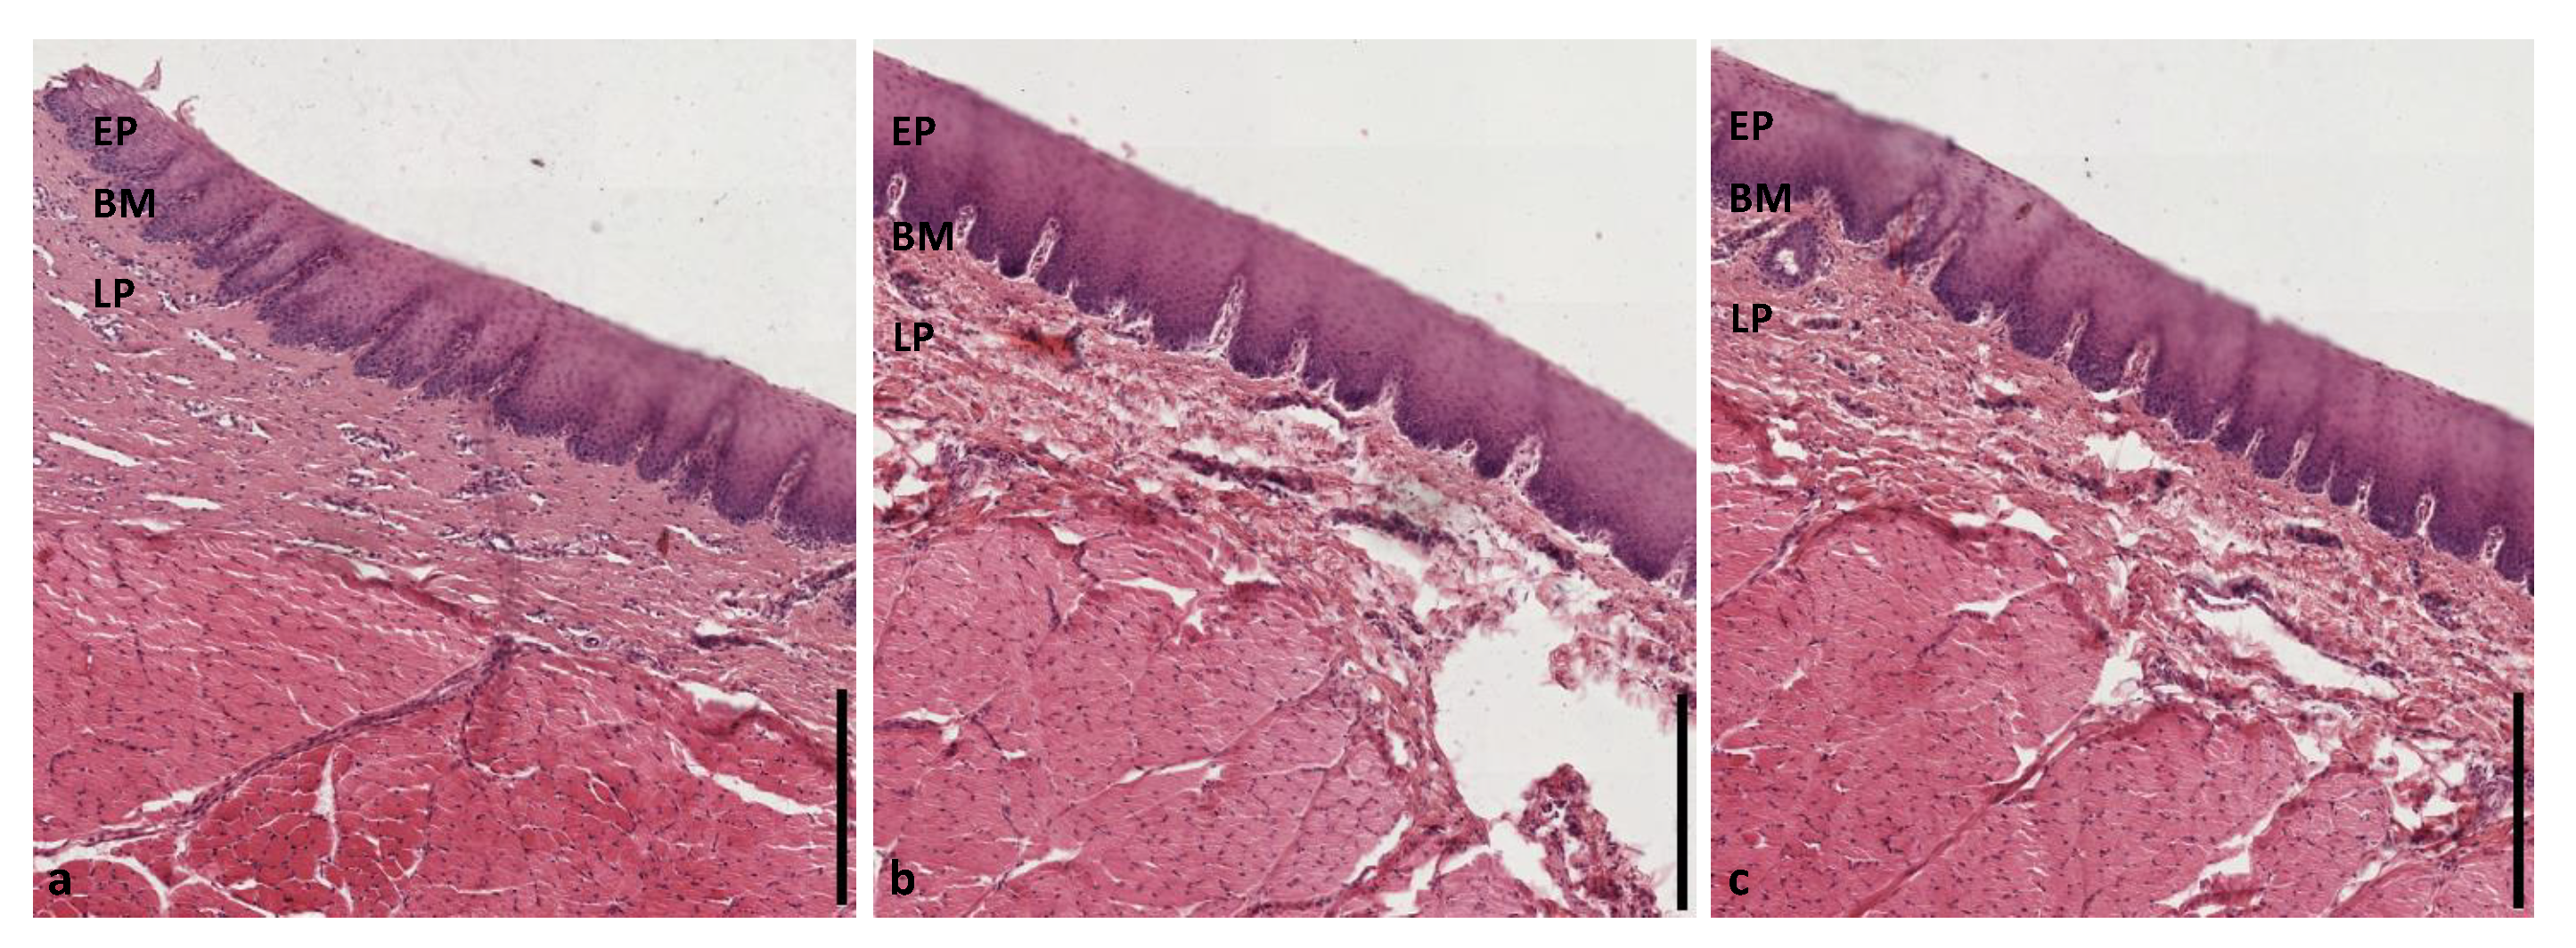
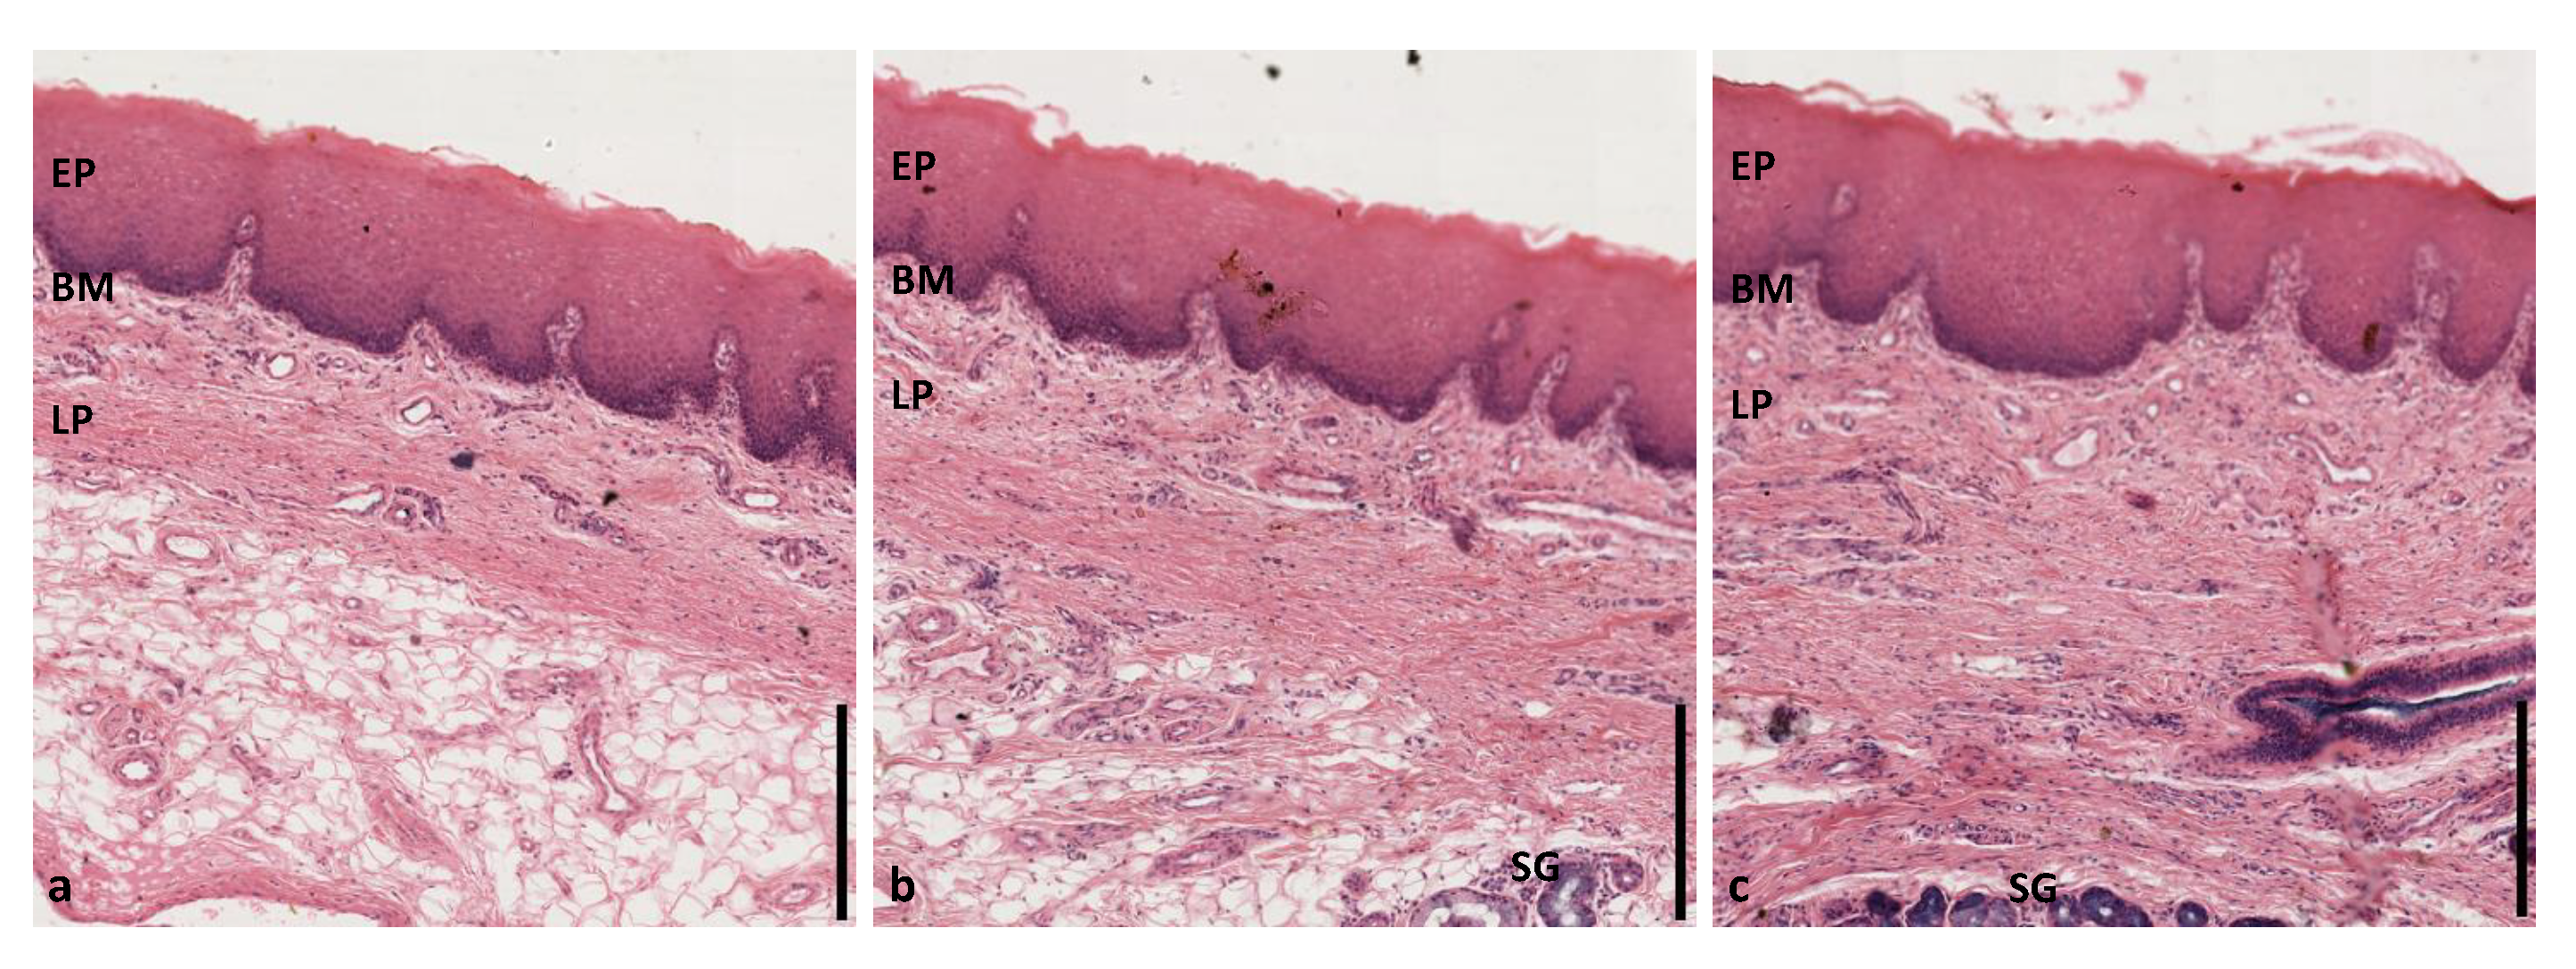
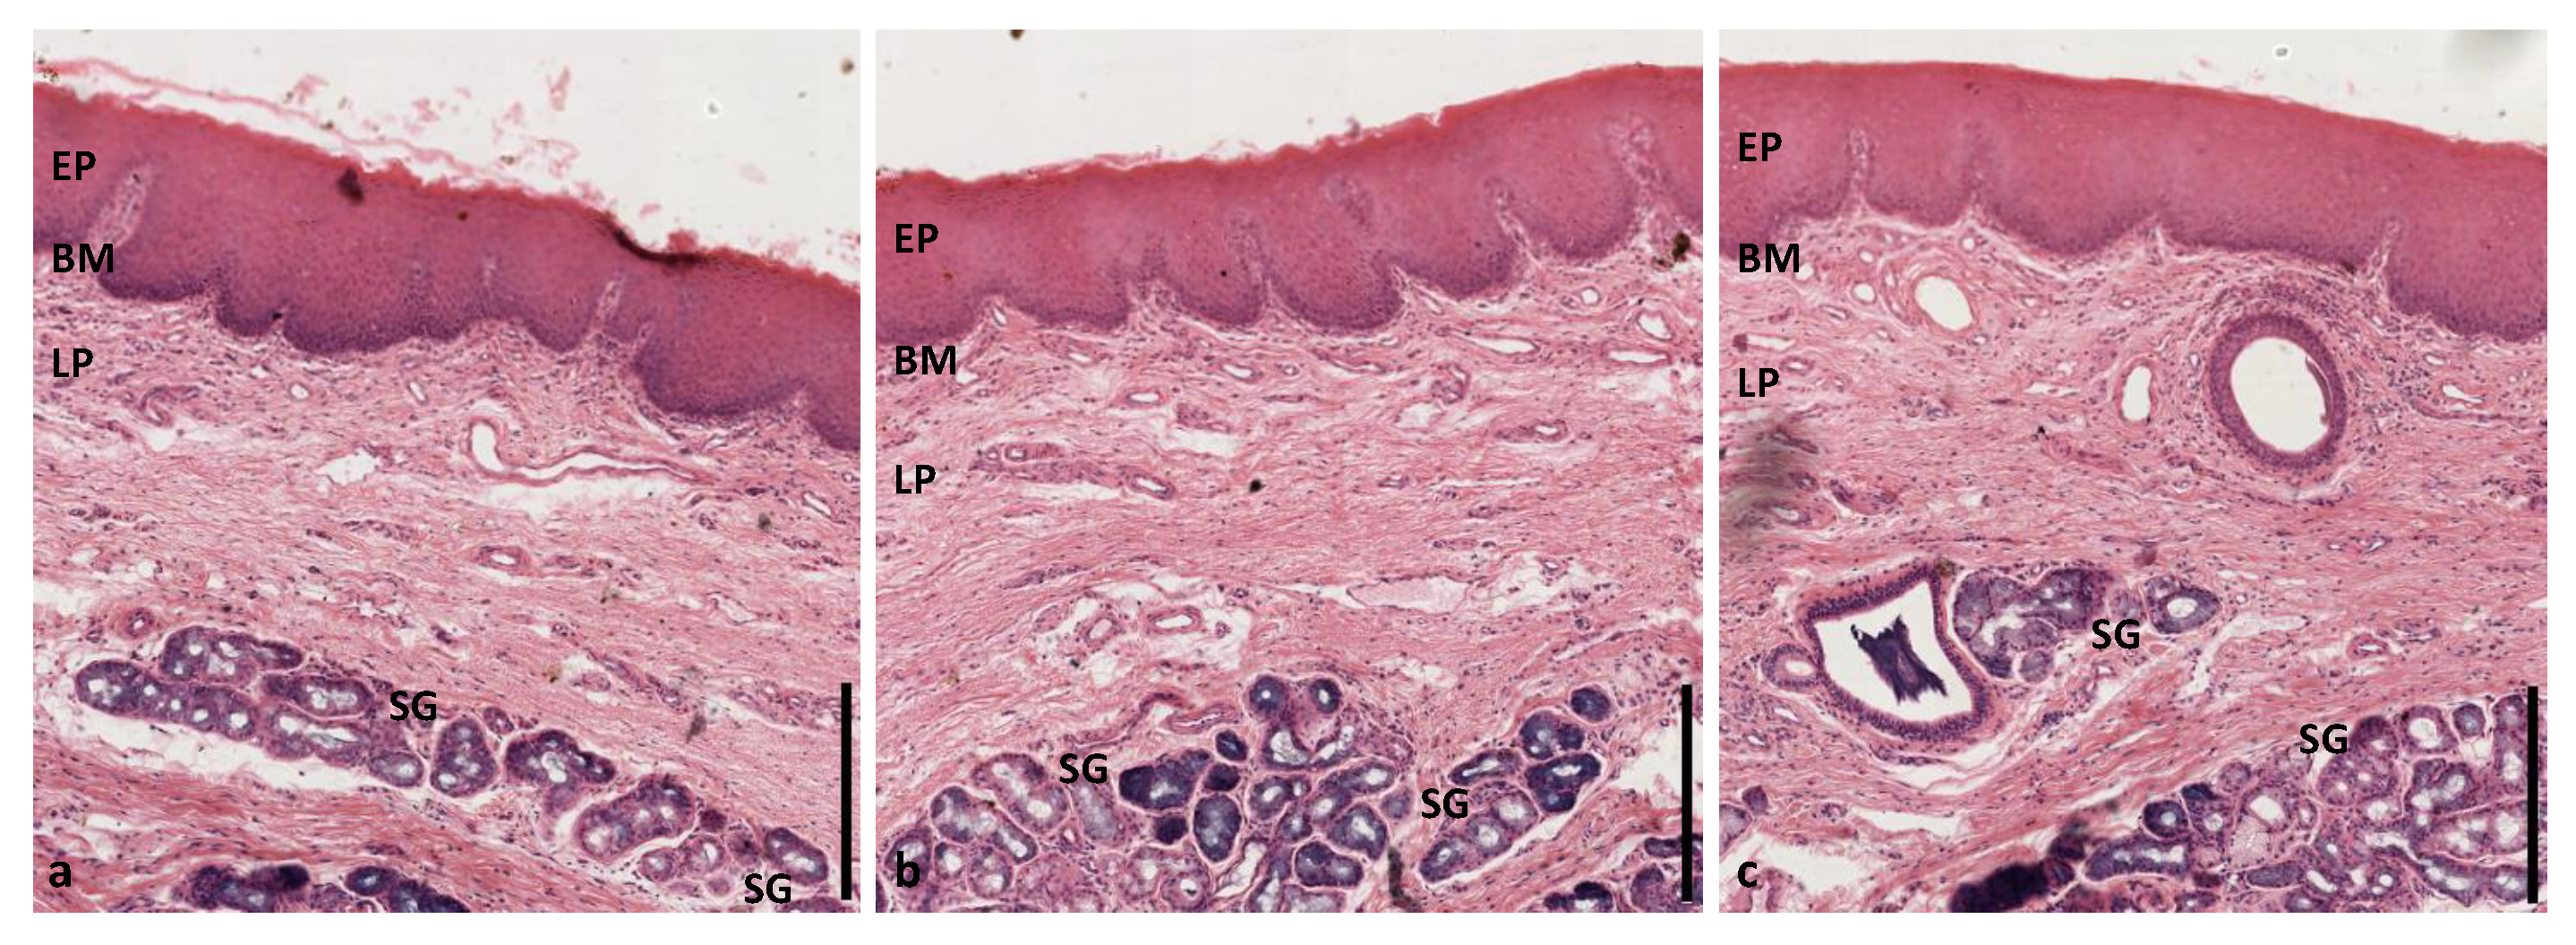
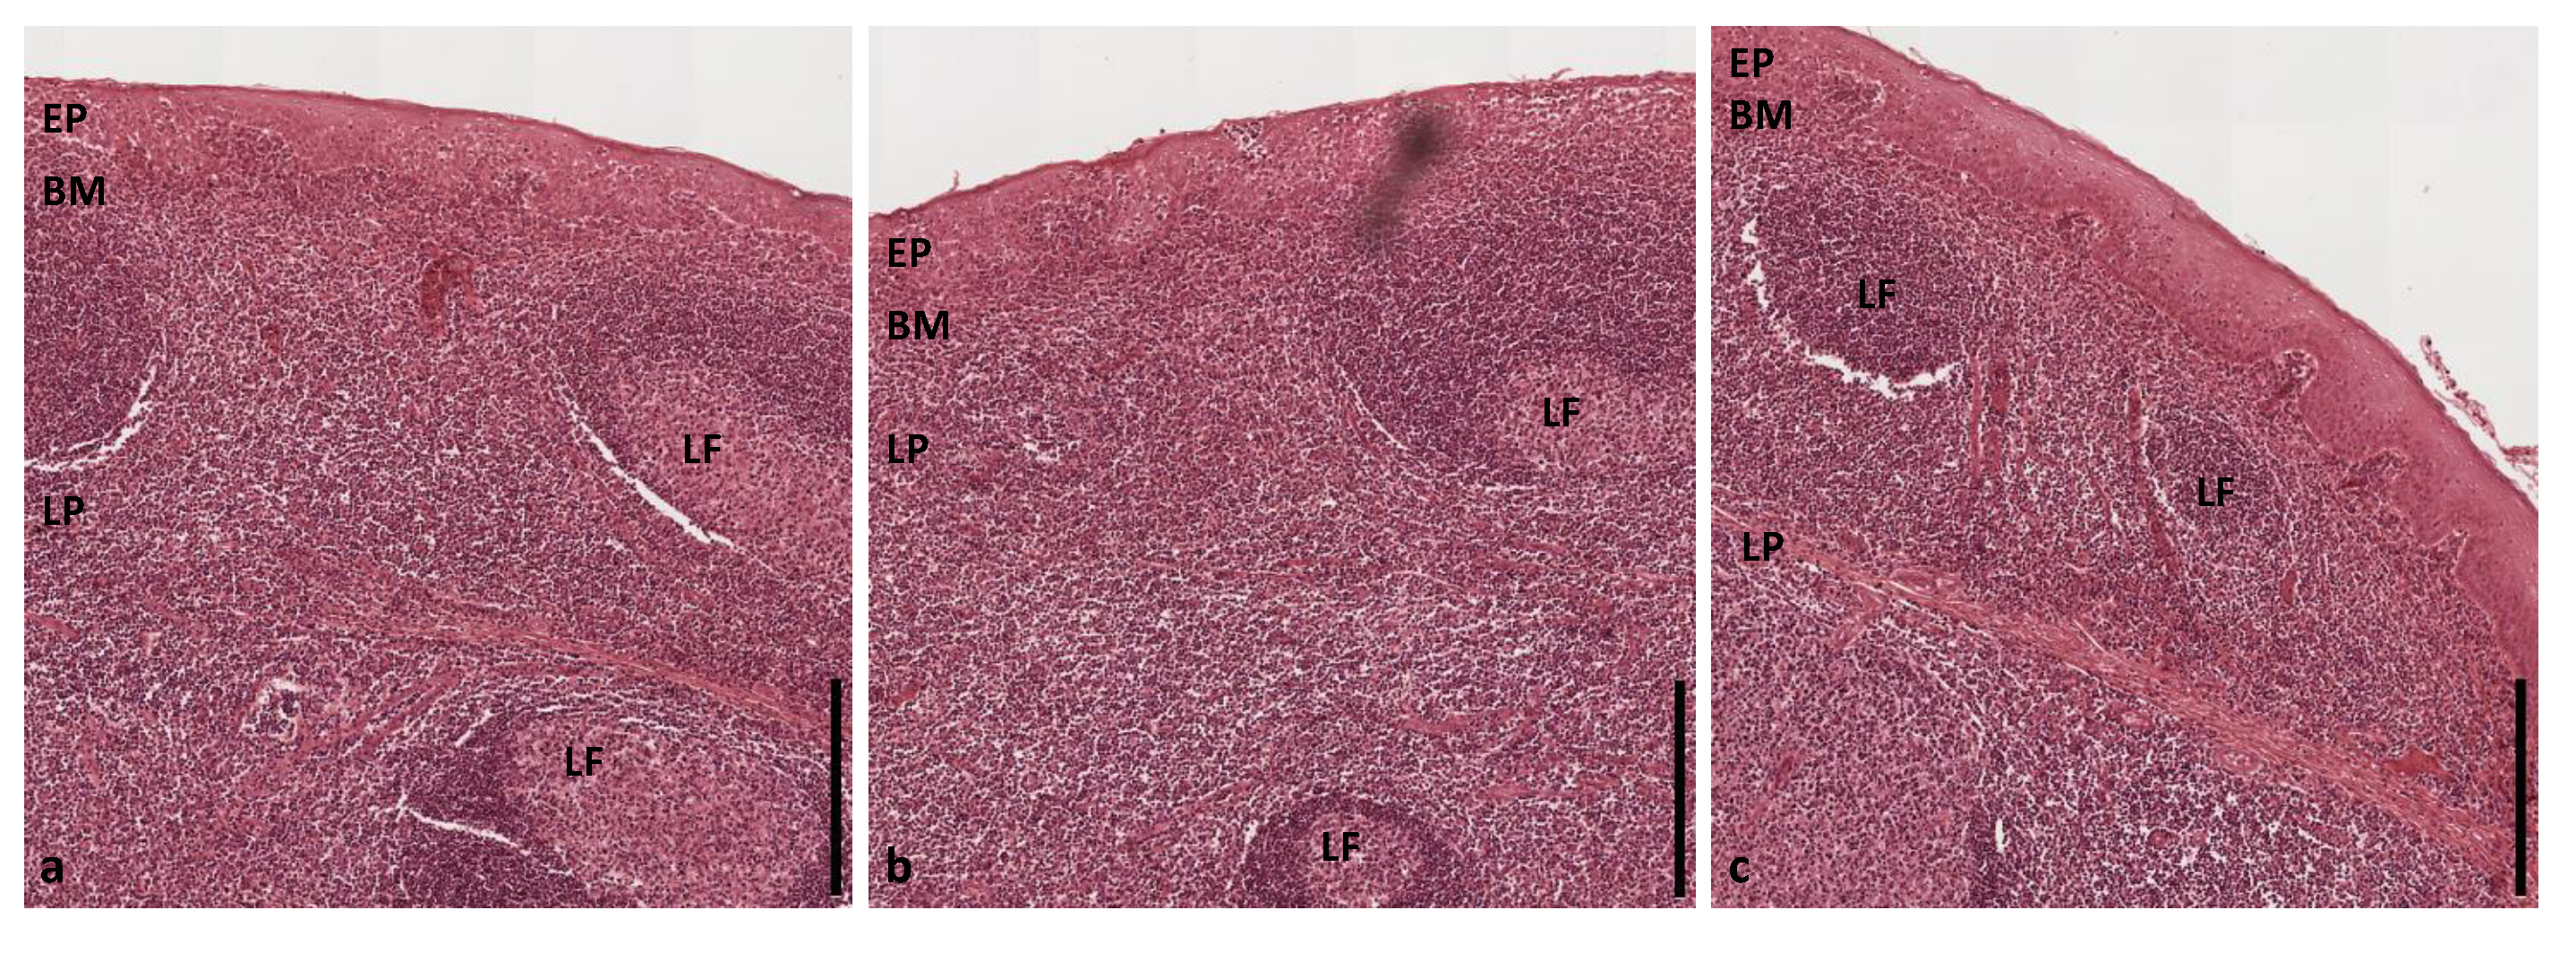
2.6. Histological Analysis

Histological correlation was implemented by means of hematoxylin and eosin (HE) stained cross sections [44] of human oral soft tissue, which have been provided by the Institute of Anatomy, Faculty of Medicine, Technische Universitaet Dresden, Germany. Consequently, histological images have not been collected from subjects recruited to the study. A total of seventy histological cross sections, including ten for each investigation area, have been used for the juxtaposition of OCT and histology. Exemplary slides were integrated within a collection of OCT cross sections for characteristic oral sites.

3. Results

In the following subsections, the results of the OCT image analysis of the defined investigation areas are described in detail based on the evaluation criteria presented in Section 2.4. A summary of the results concerning the qualitative criteria is depicted in the percentage bar chart in Figure 4.
The epithelial thickness at each measurement point is outlined by means of box plots in Figure 5 providing information about the age- and sex-independent mean value, the sample median and the interquartile range. The coloration of the boxes corresponds to the investigation areas according to the measurement plan (cp. Figure 1). Focusing on the grade of tissue vascularization by means of the calculated mean vessel density (see Section 2.4), a graphical representation is realized by box plots in Figure 6.

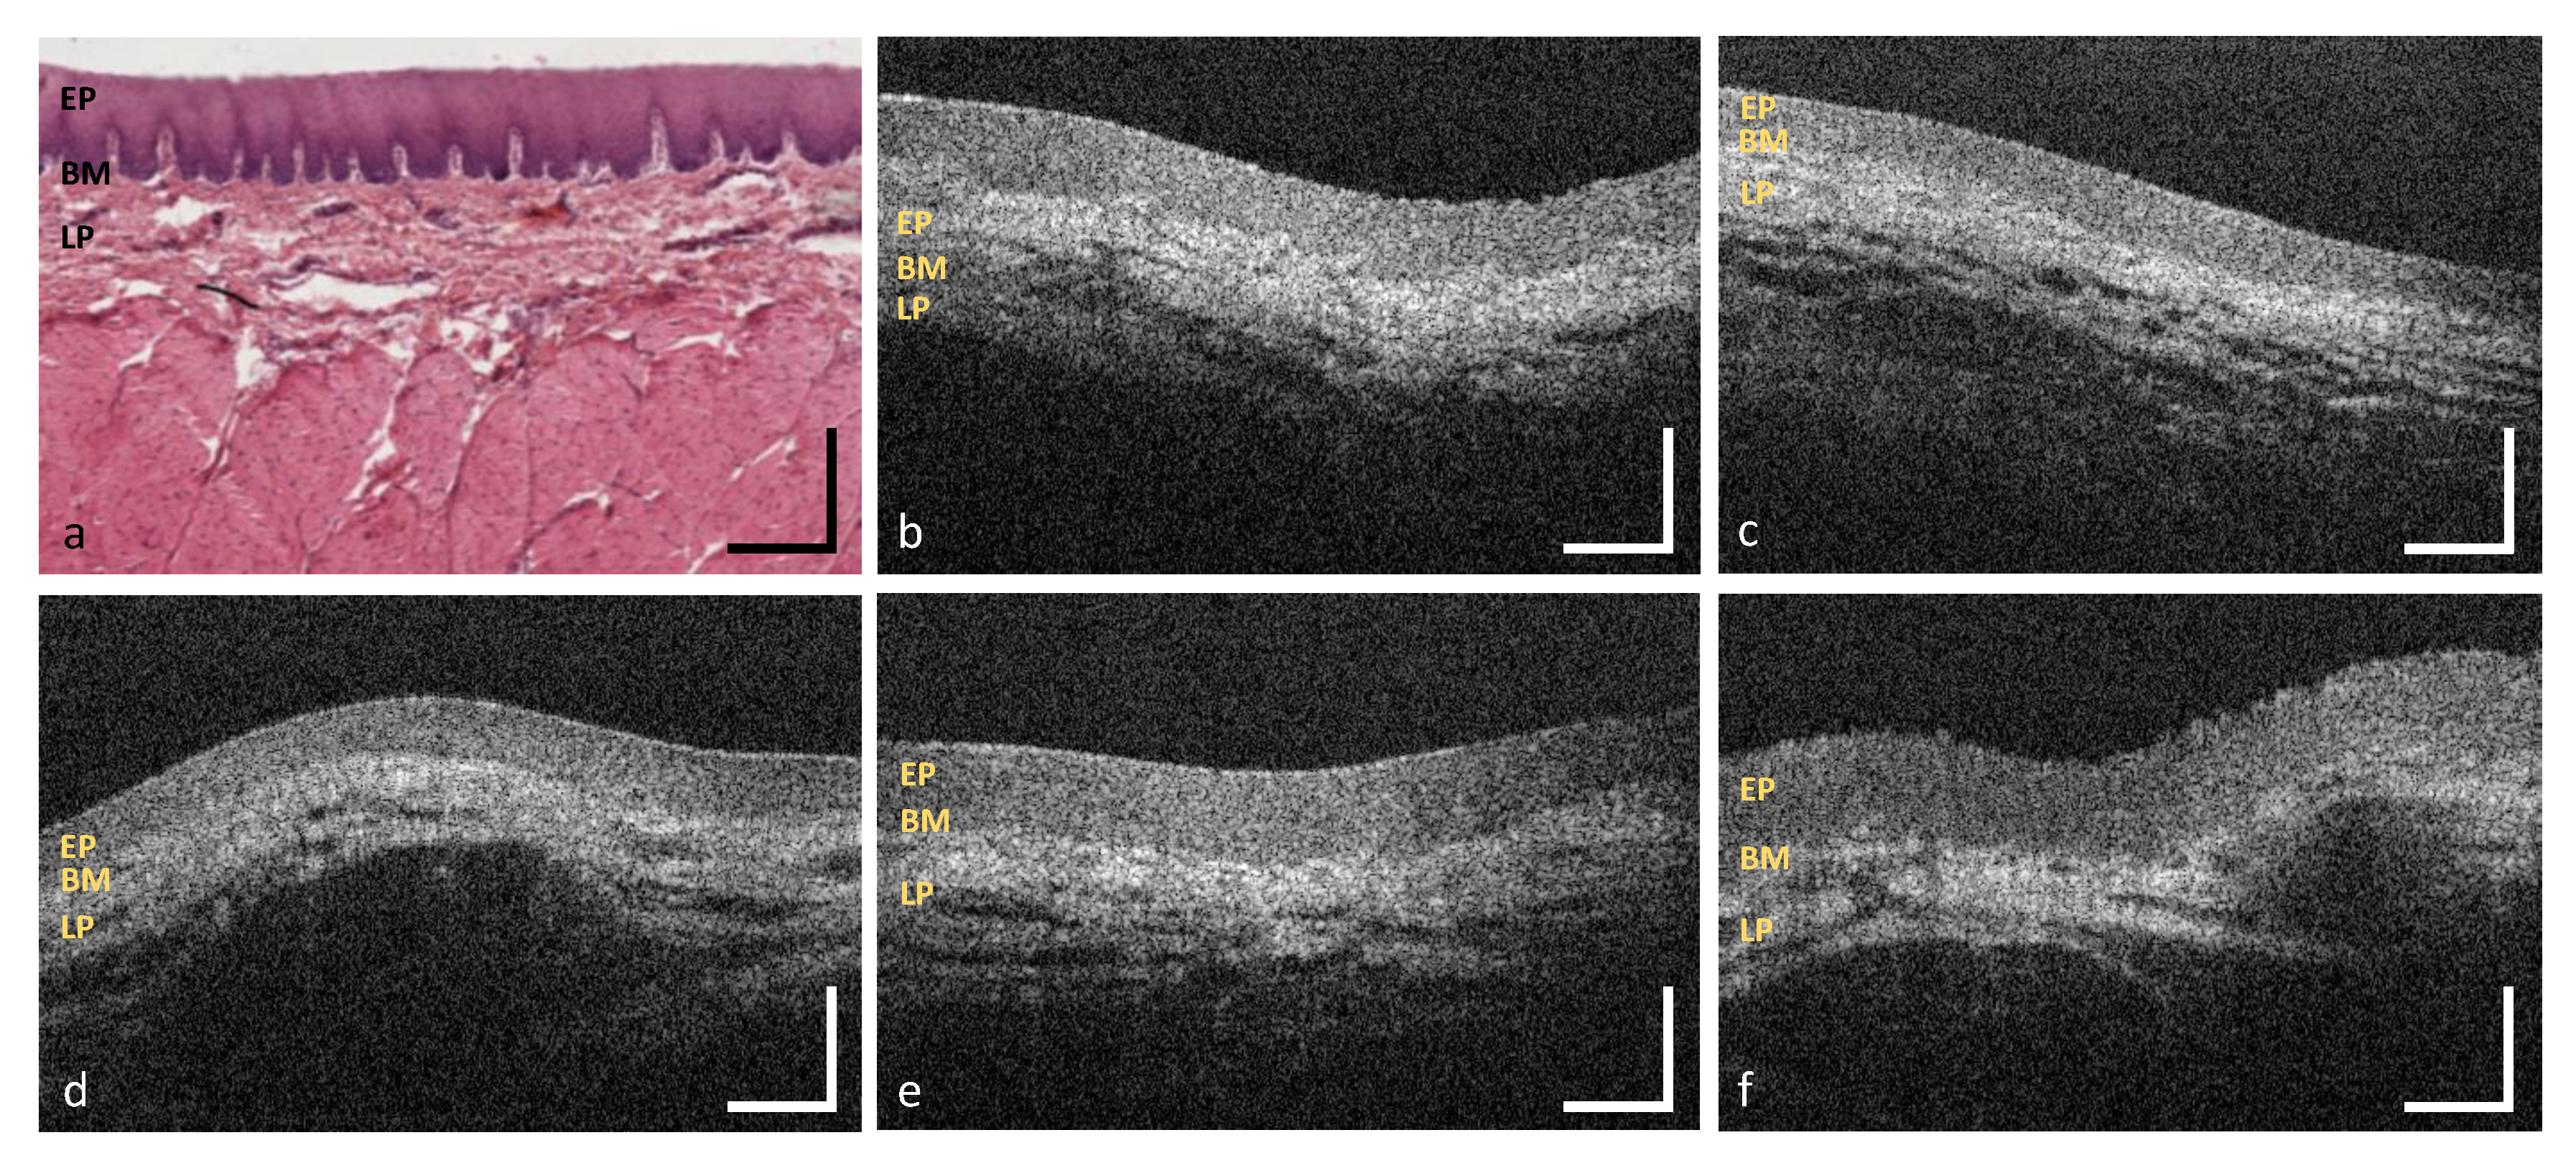
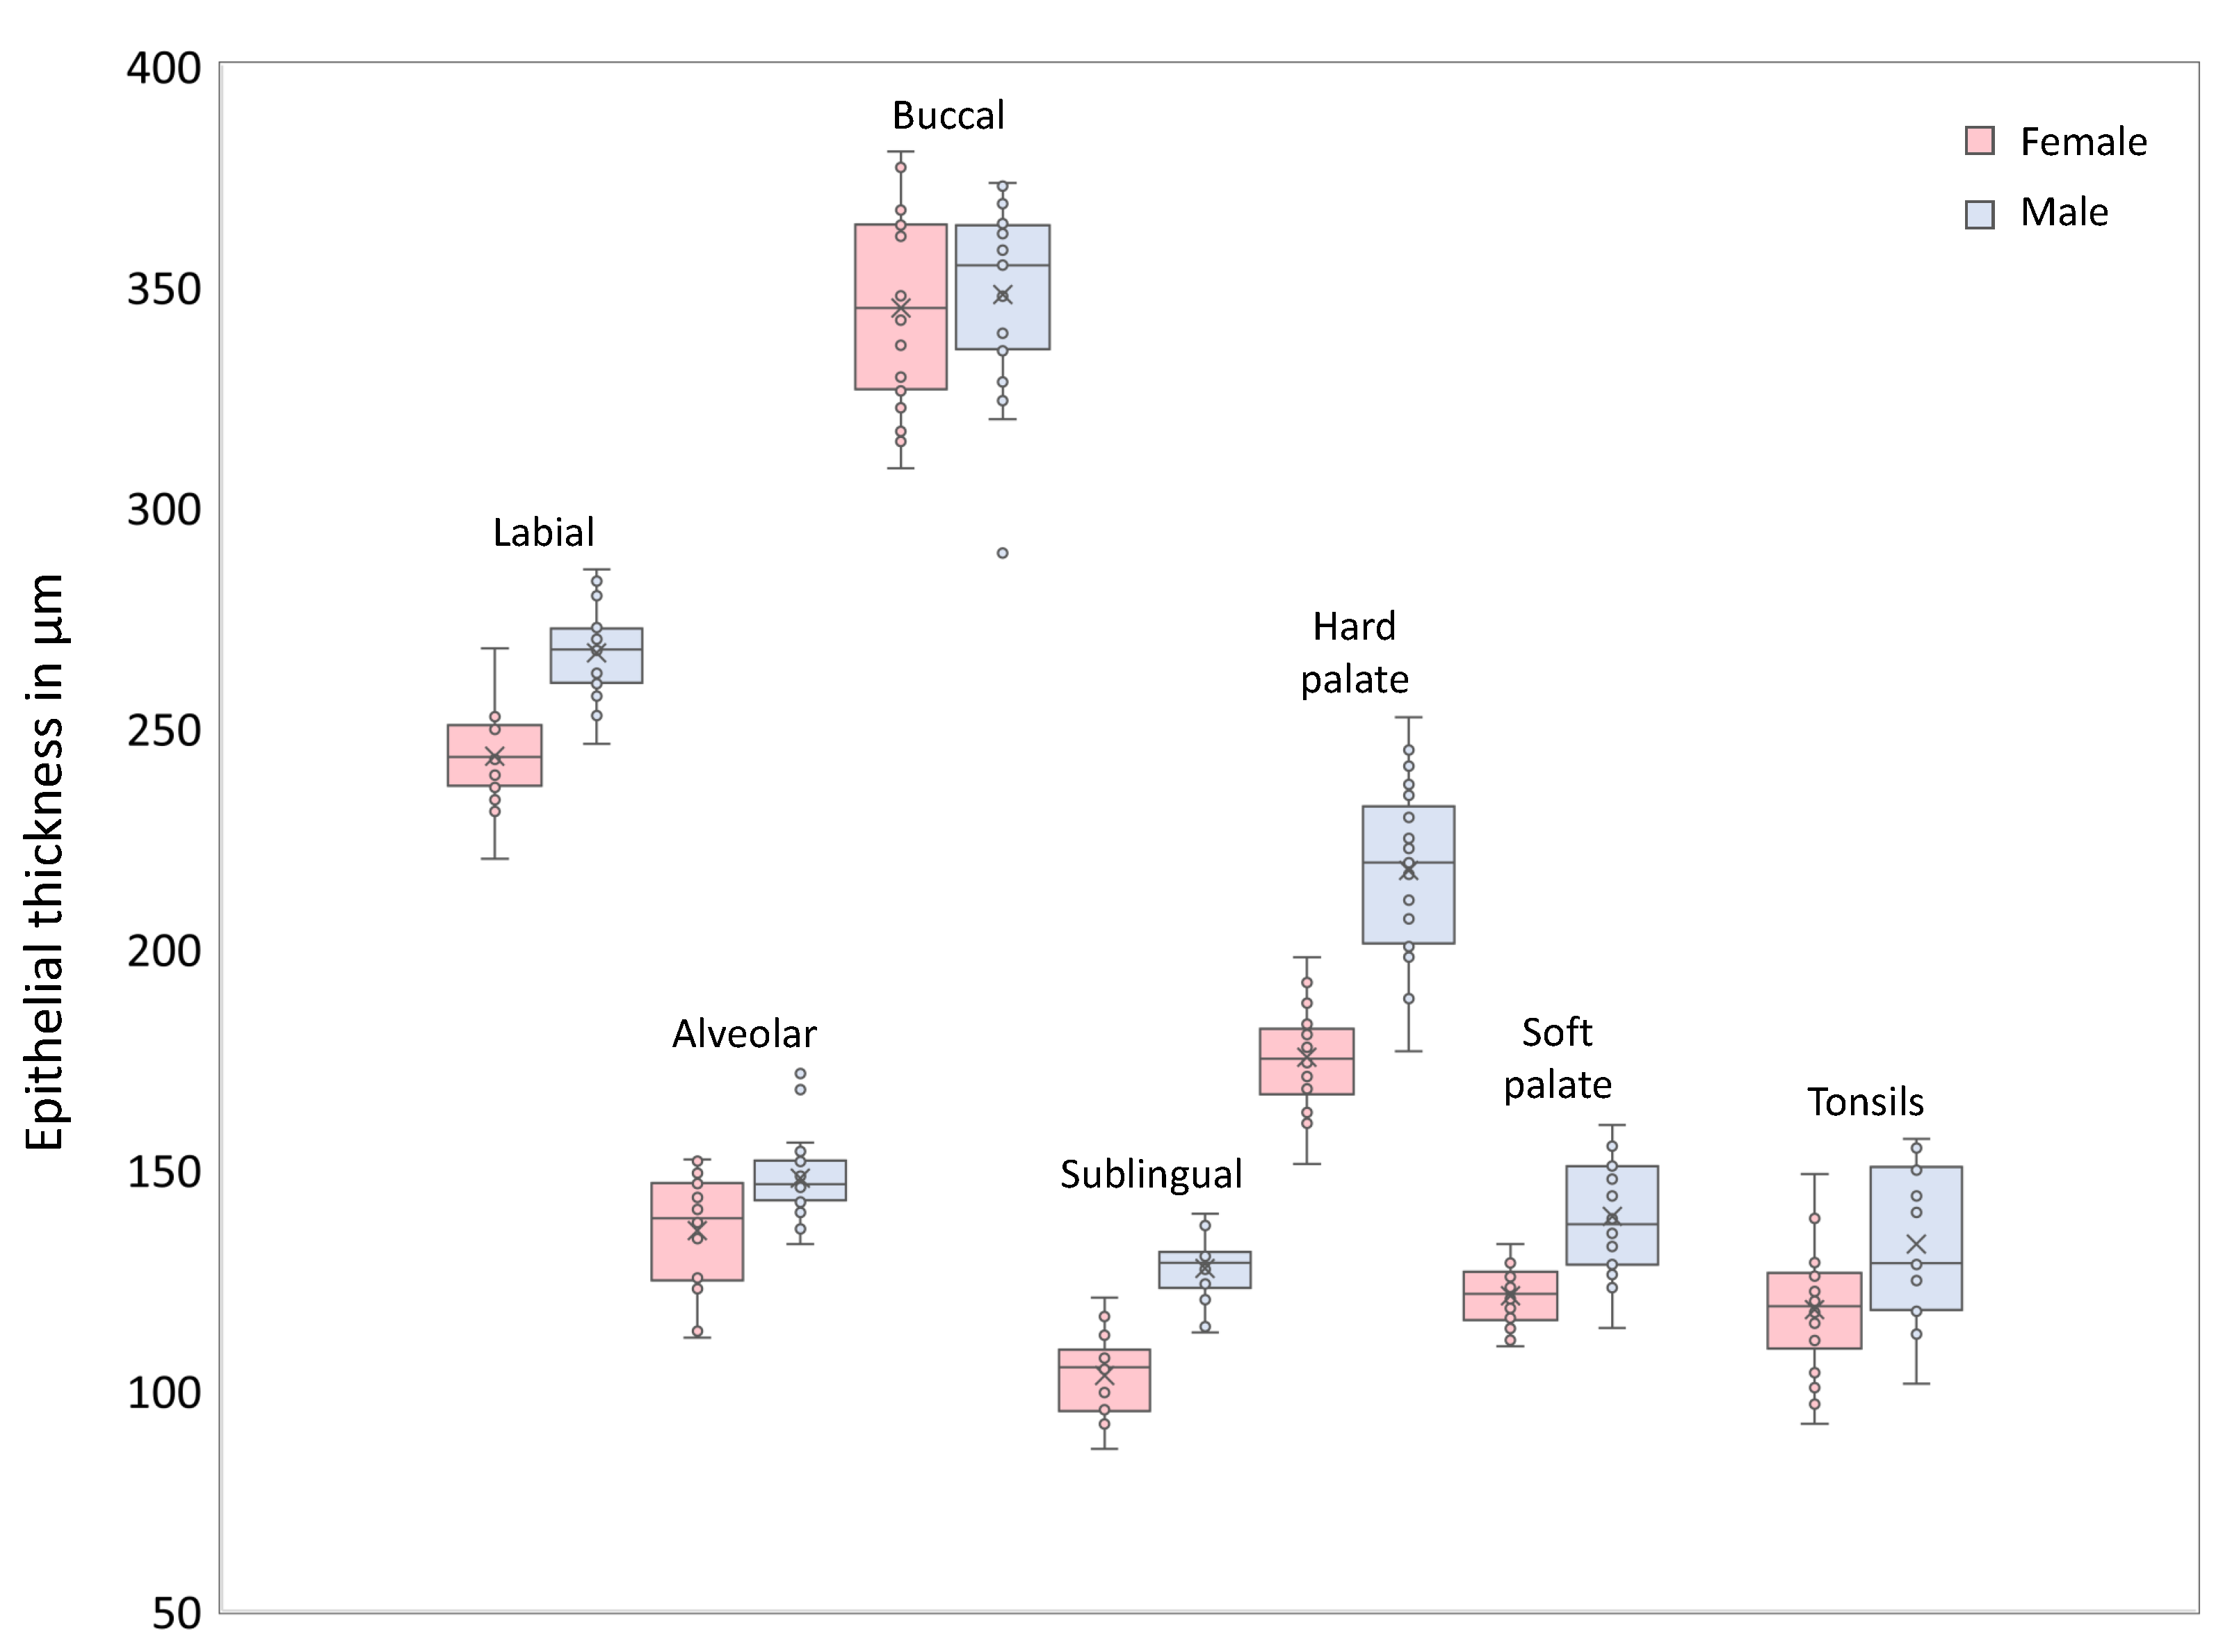
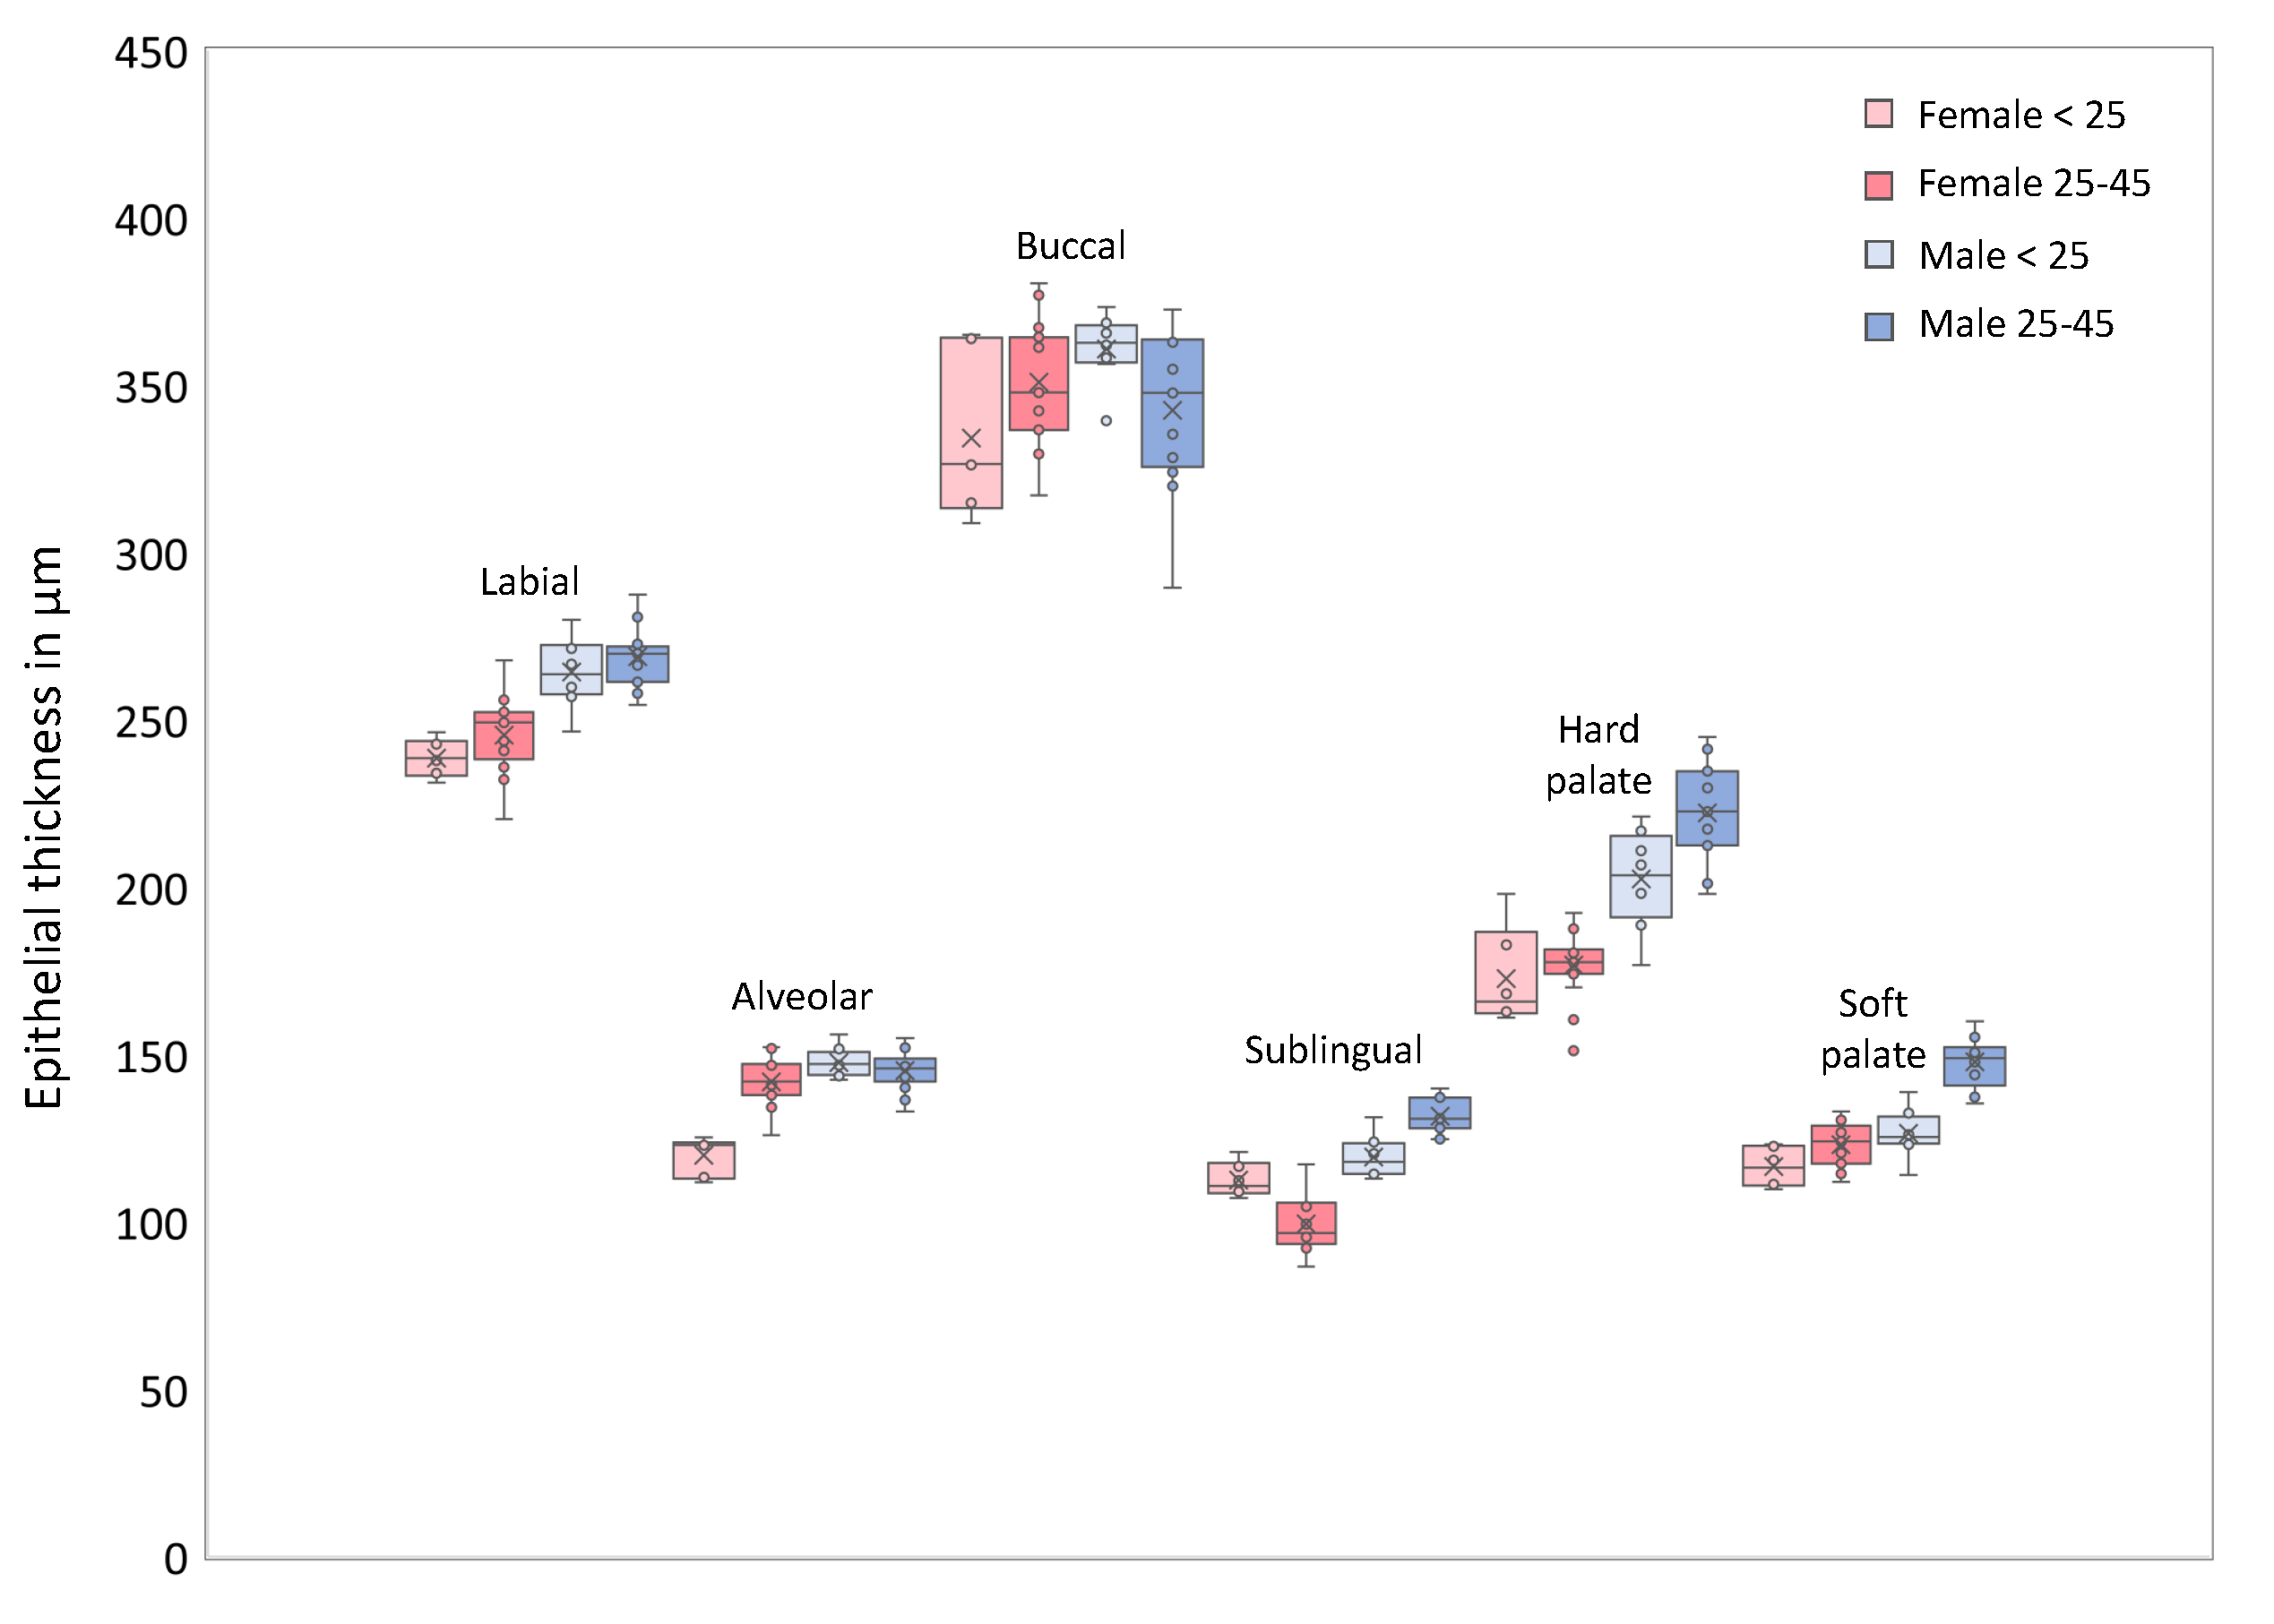
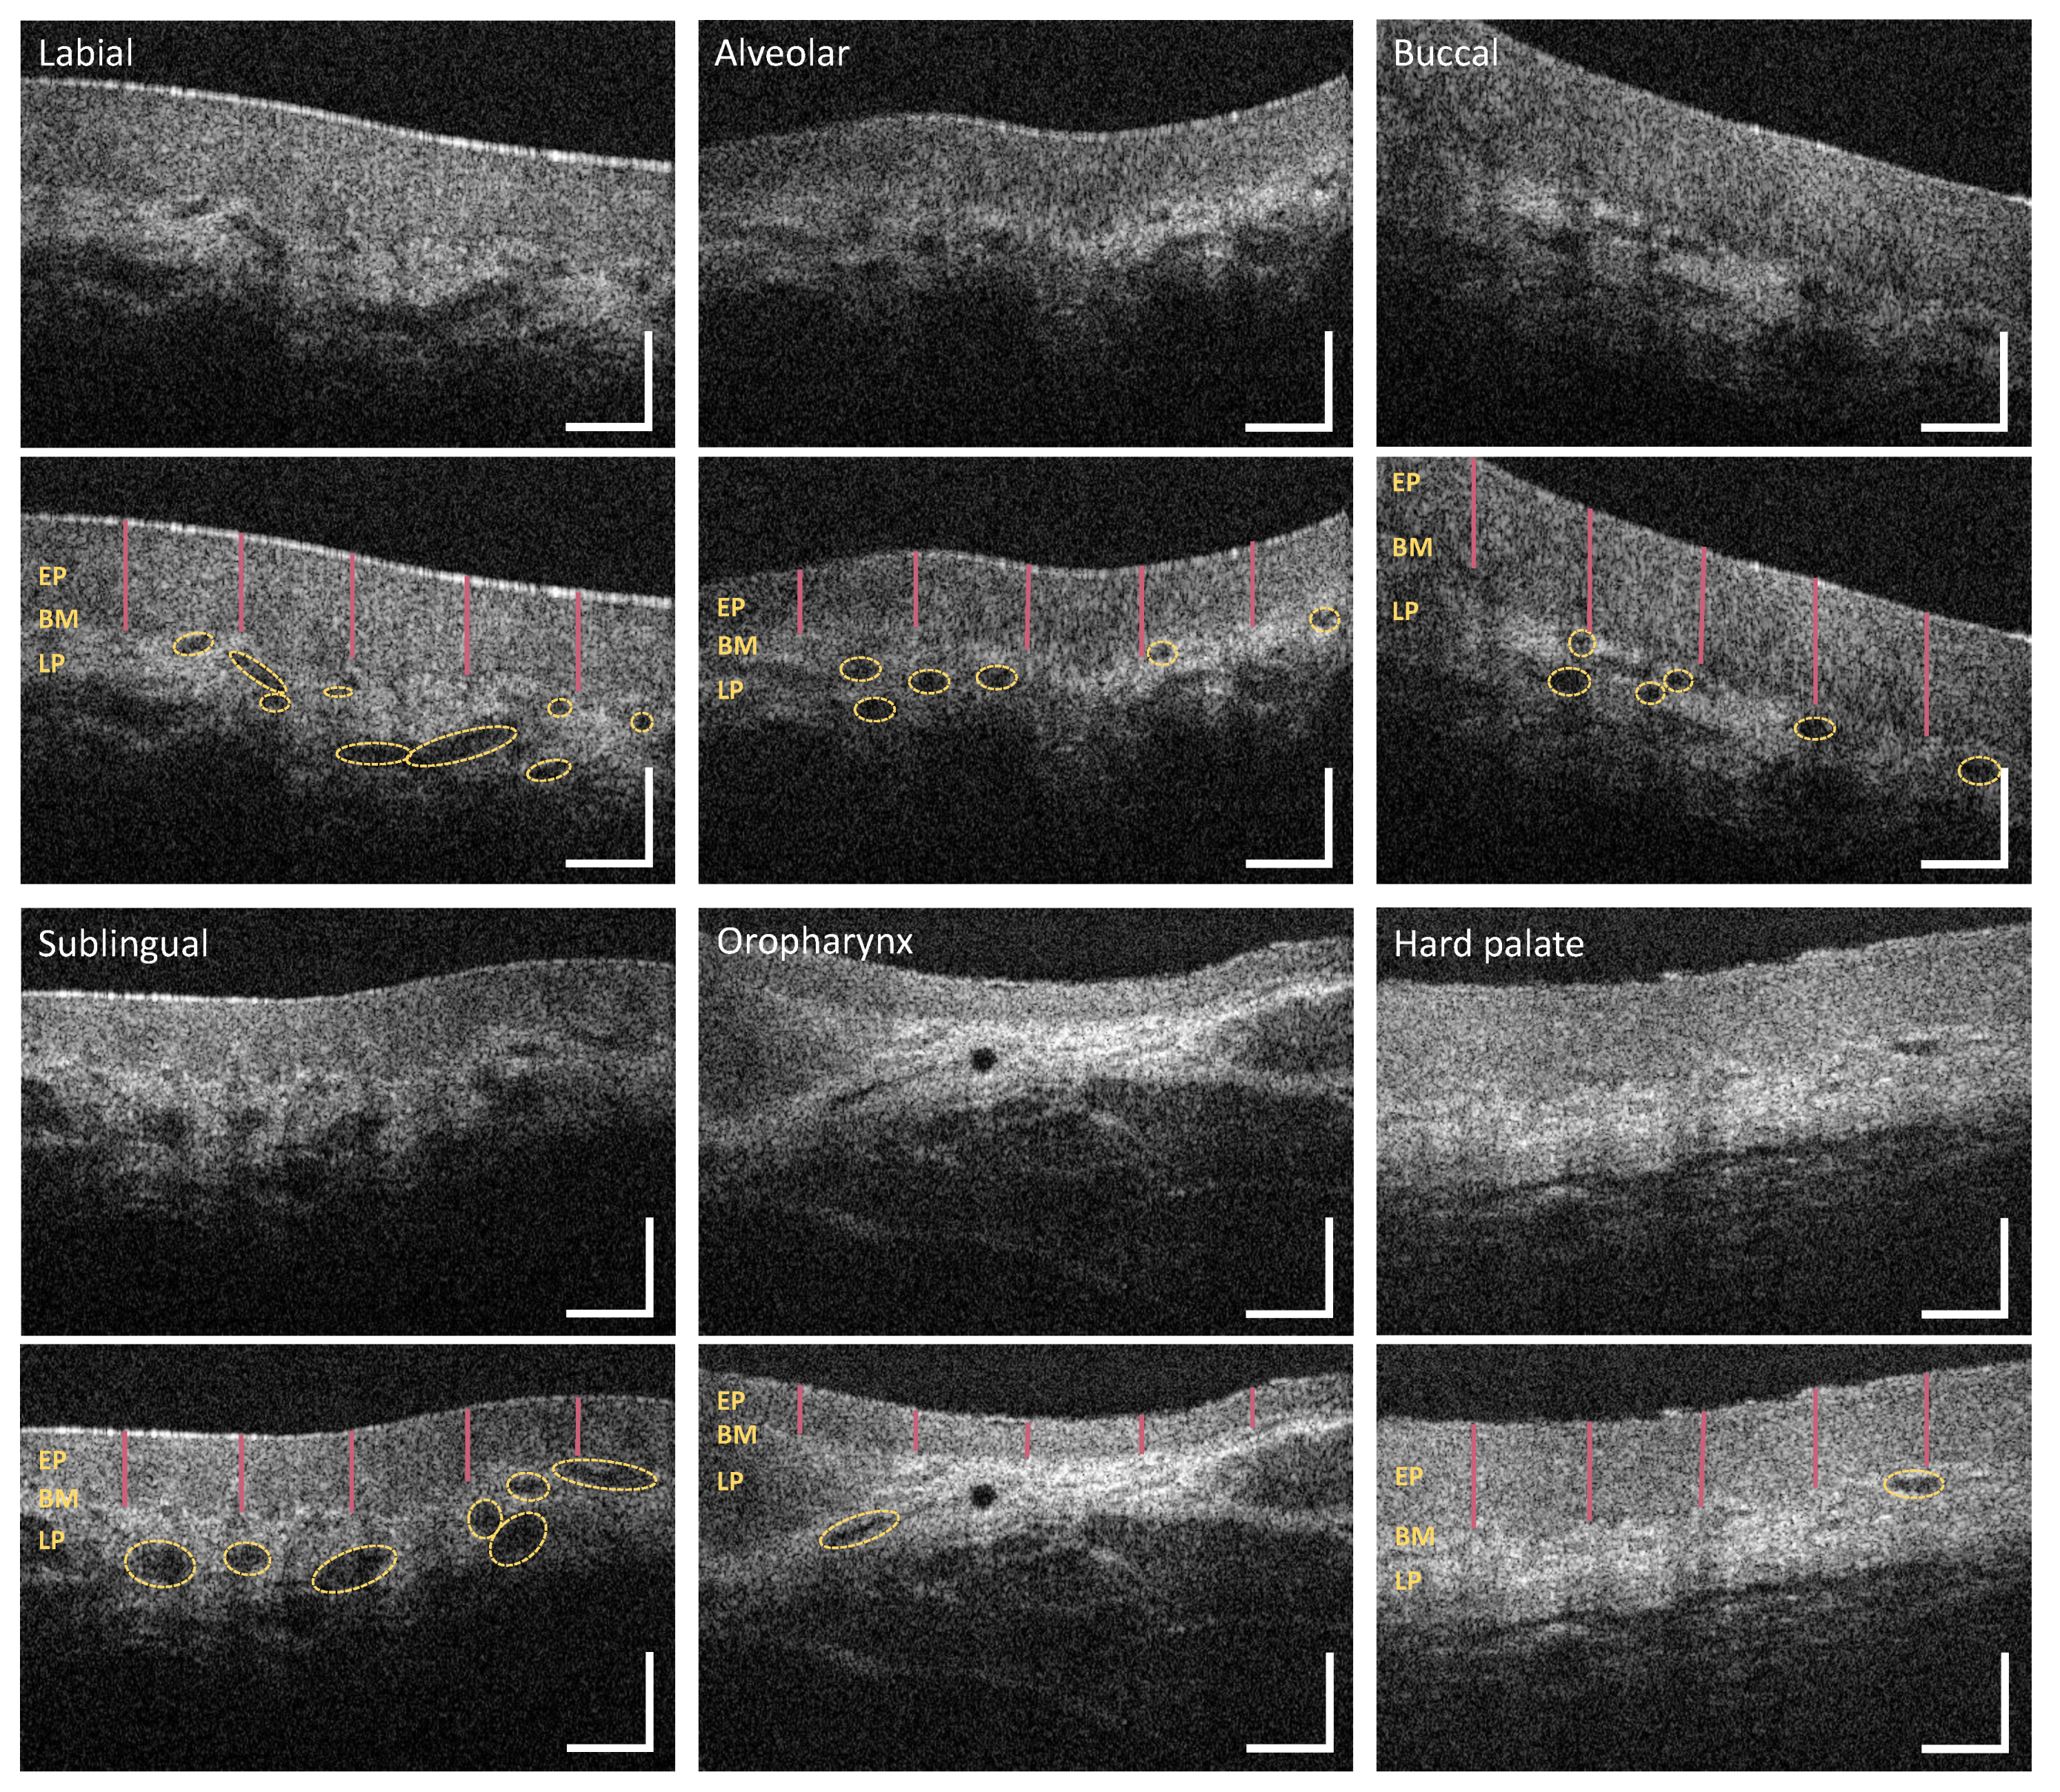
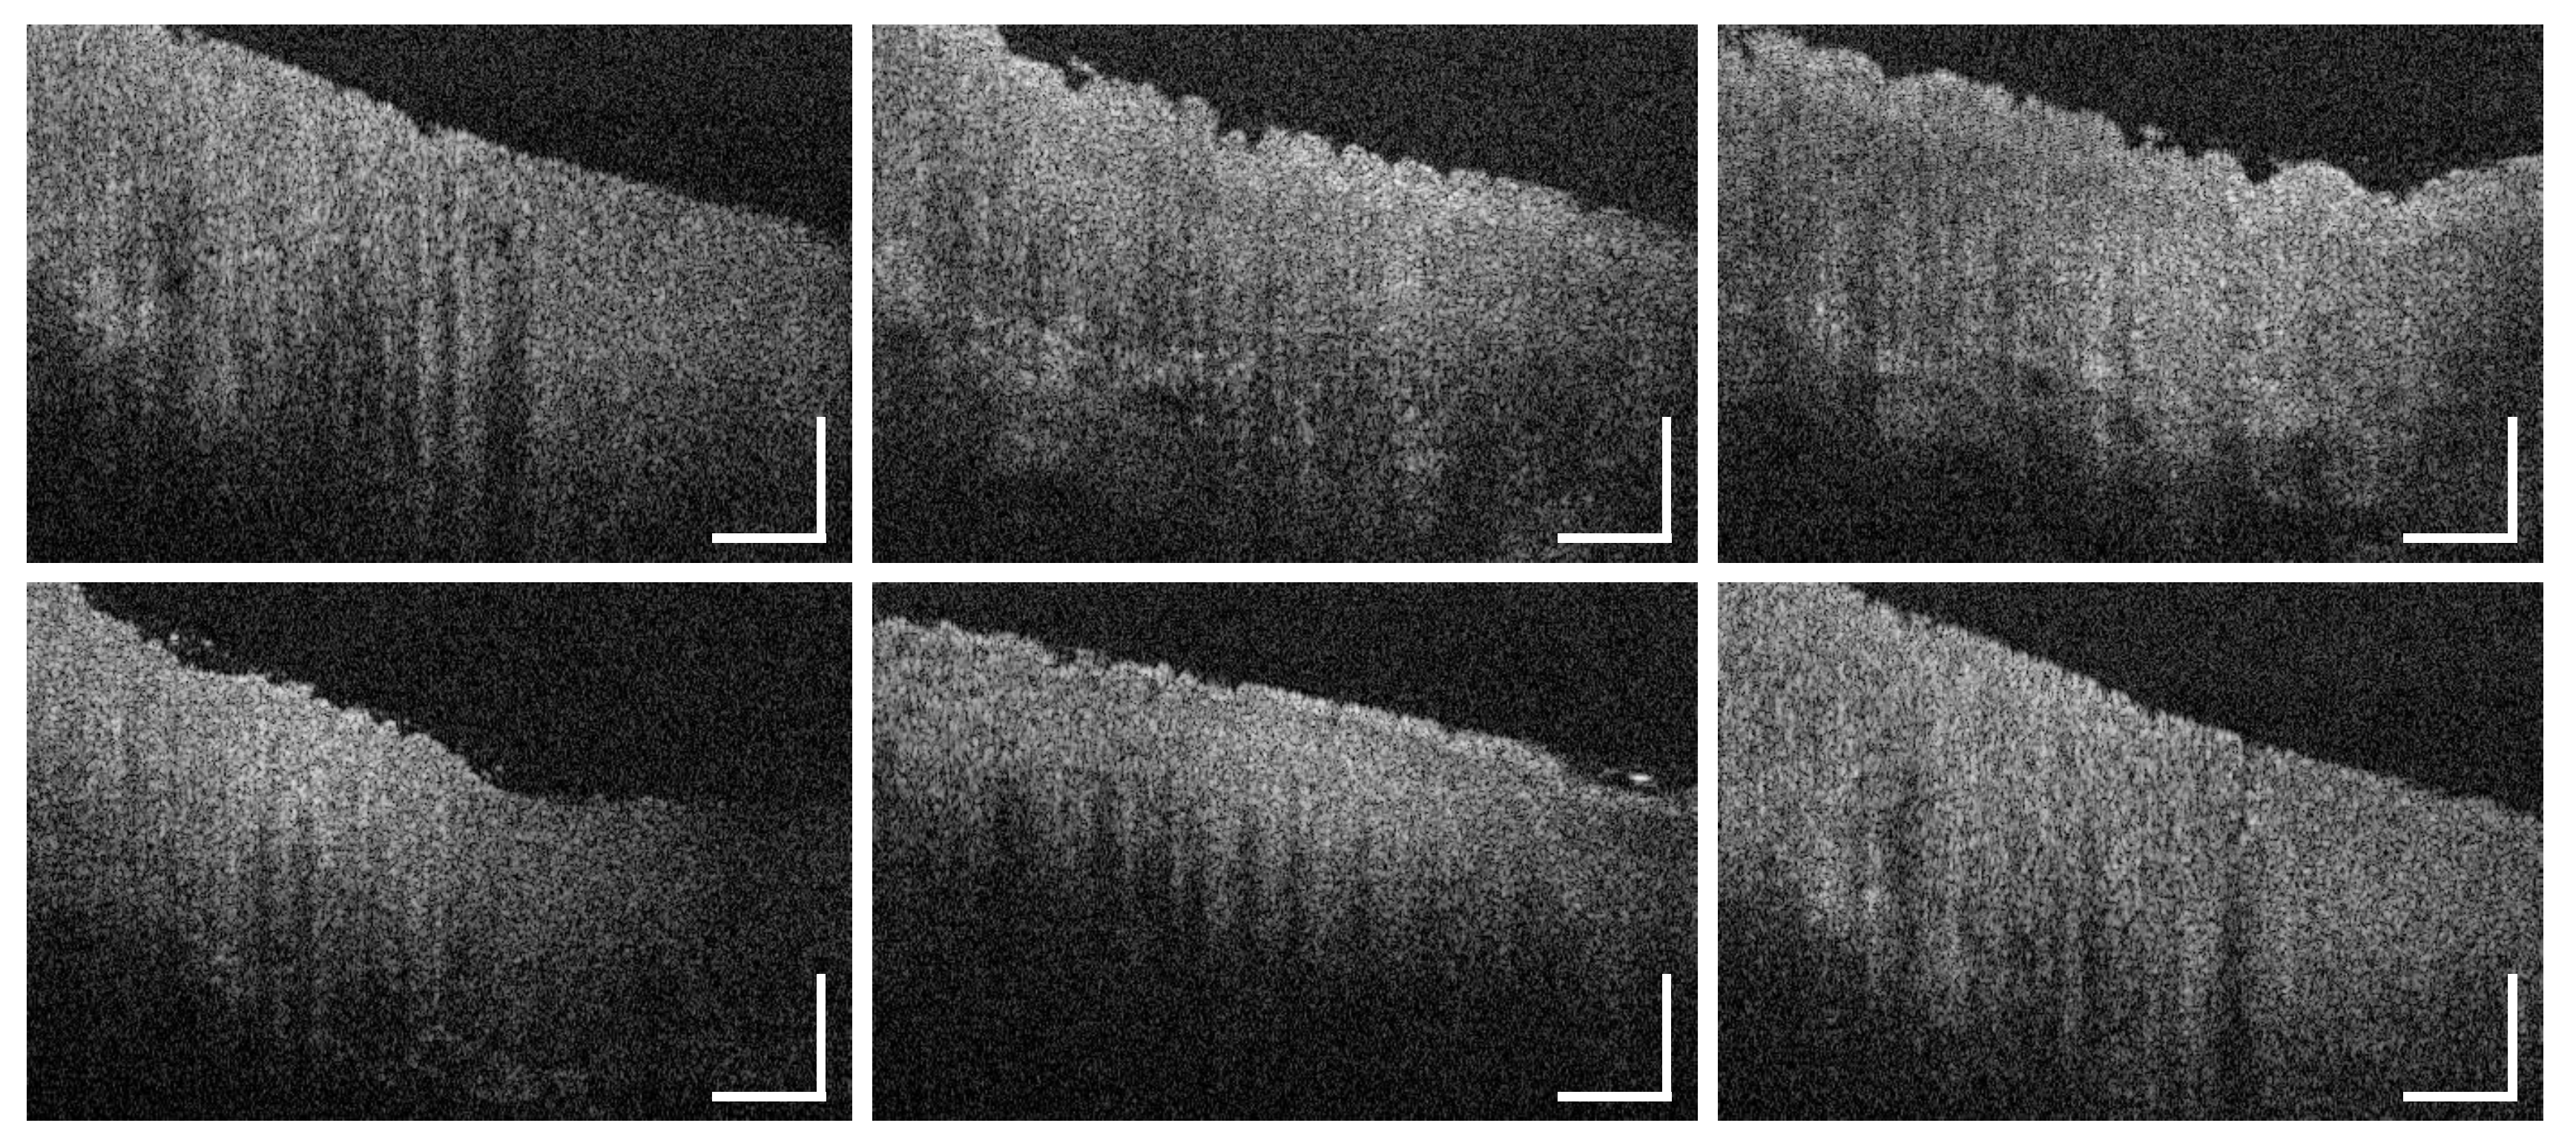
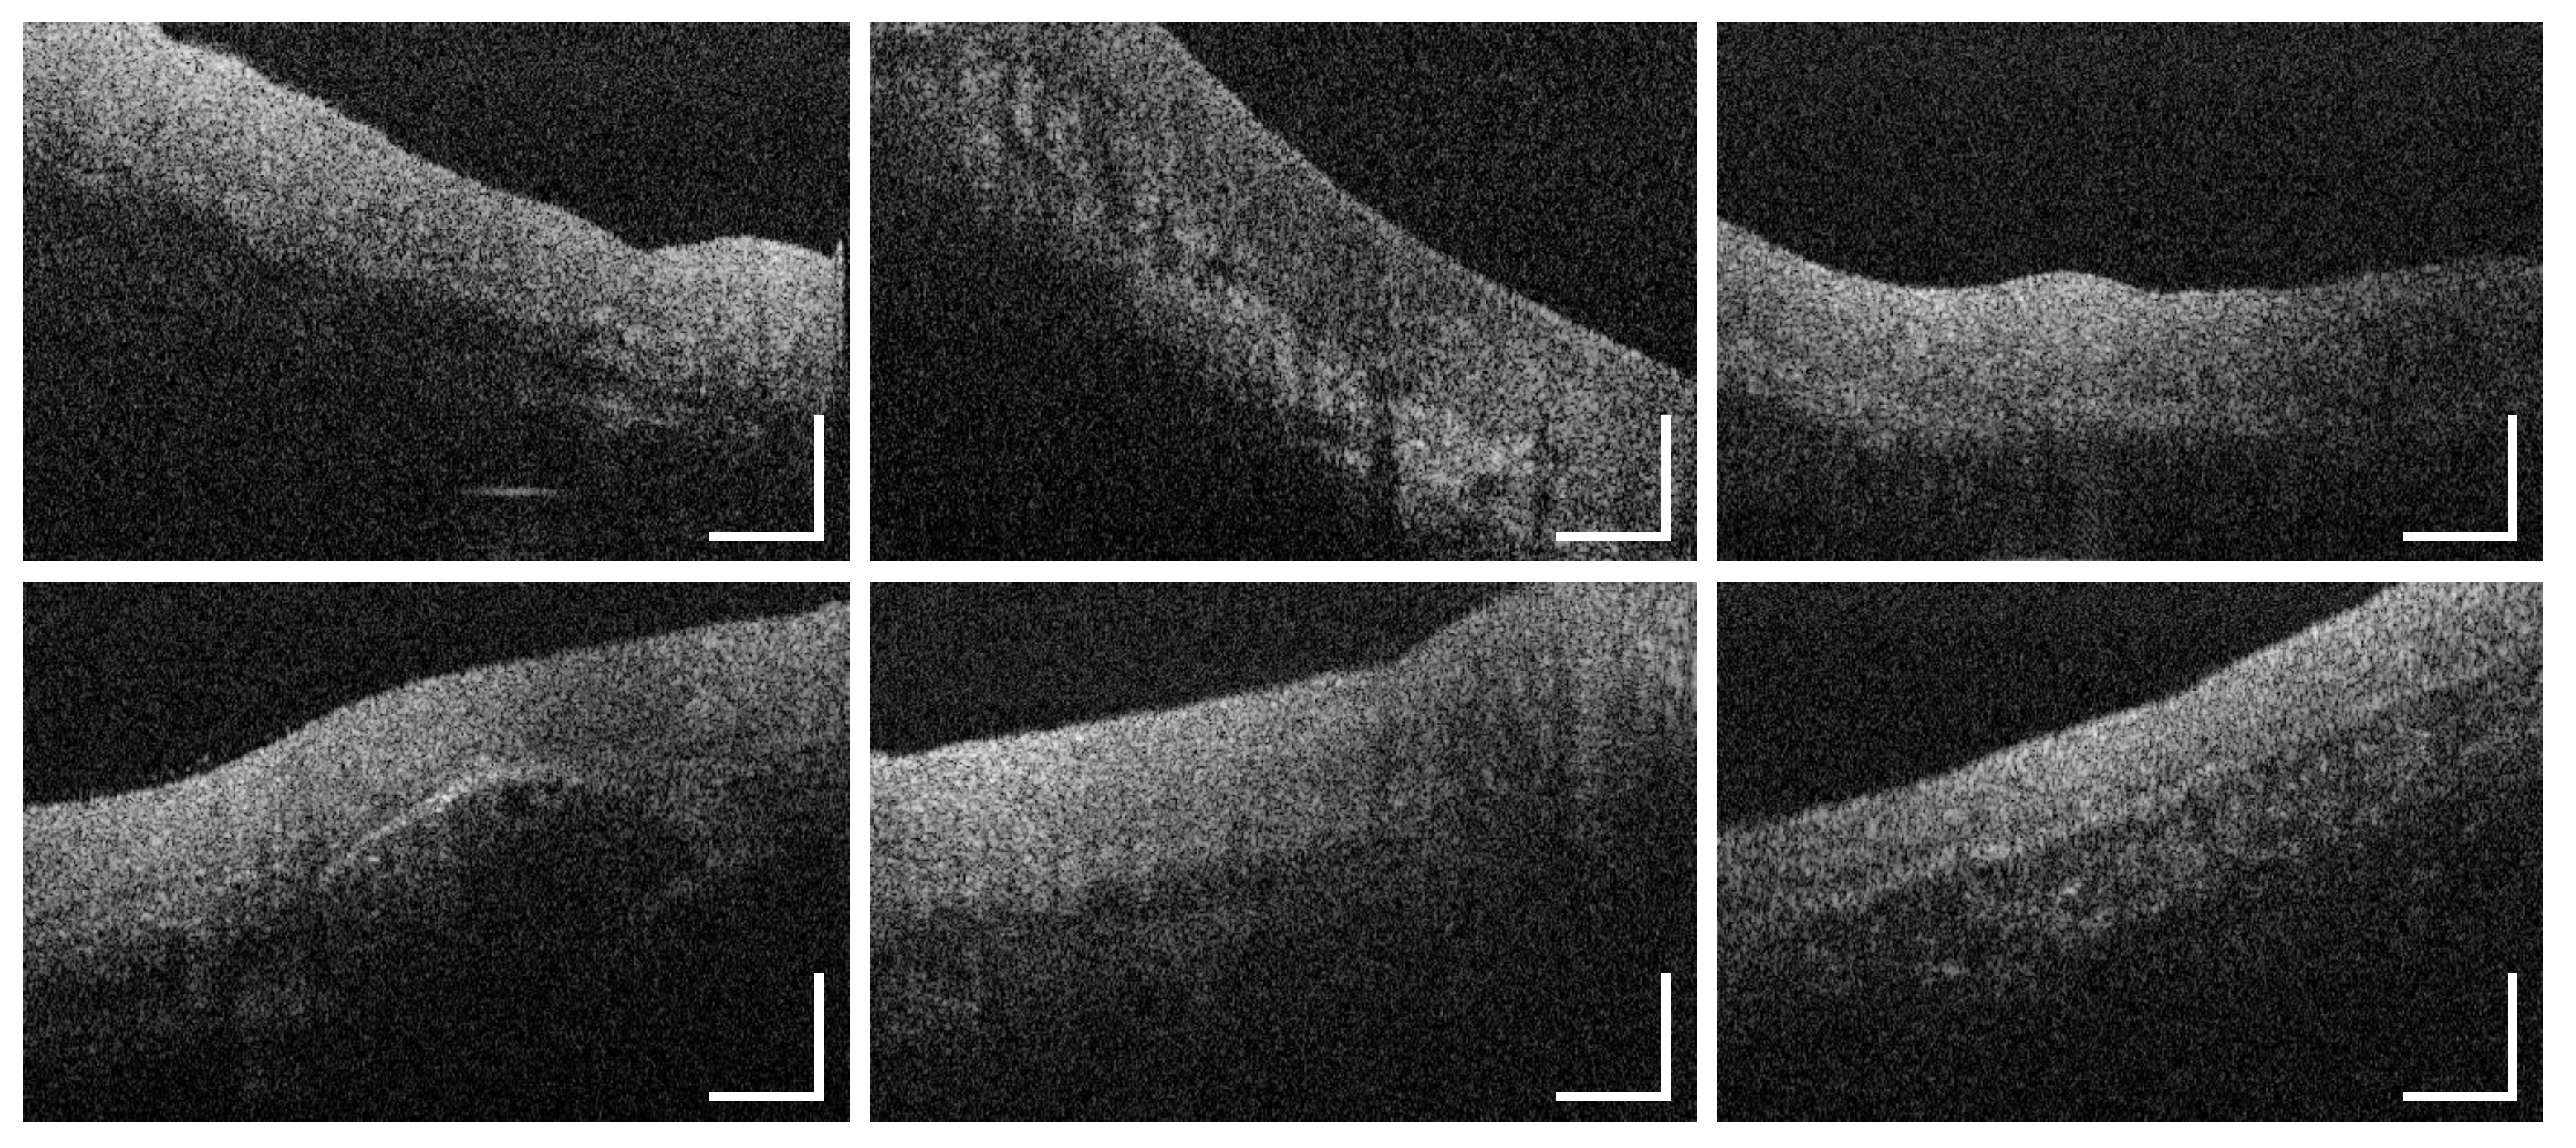
3.1. Labial and Alveolar Mucosa
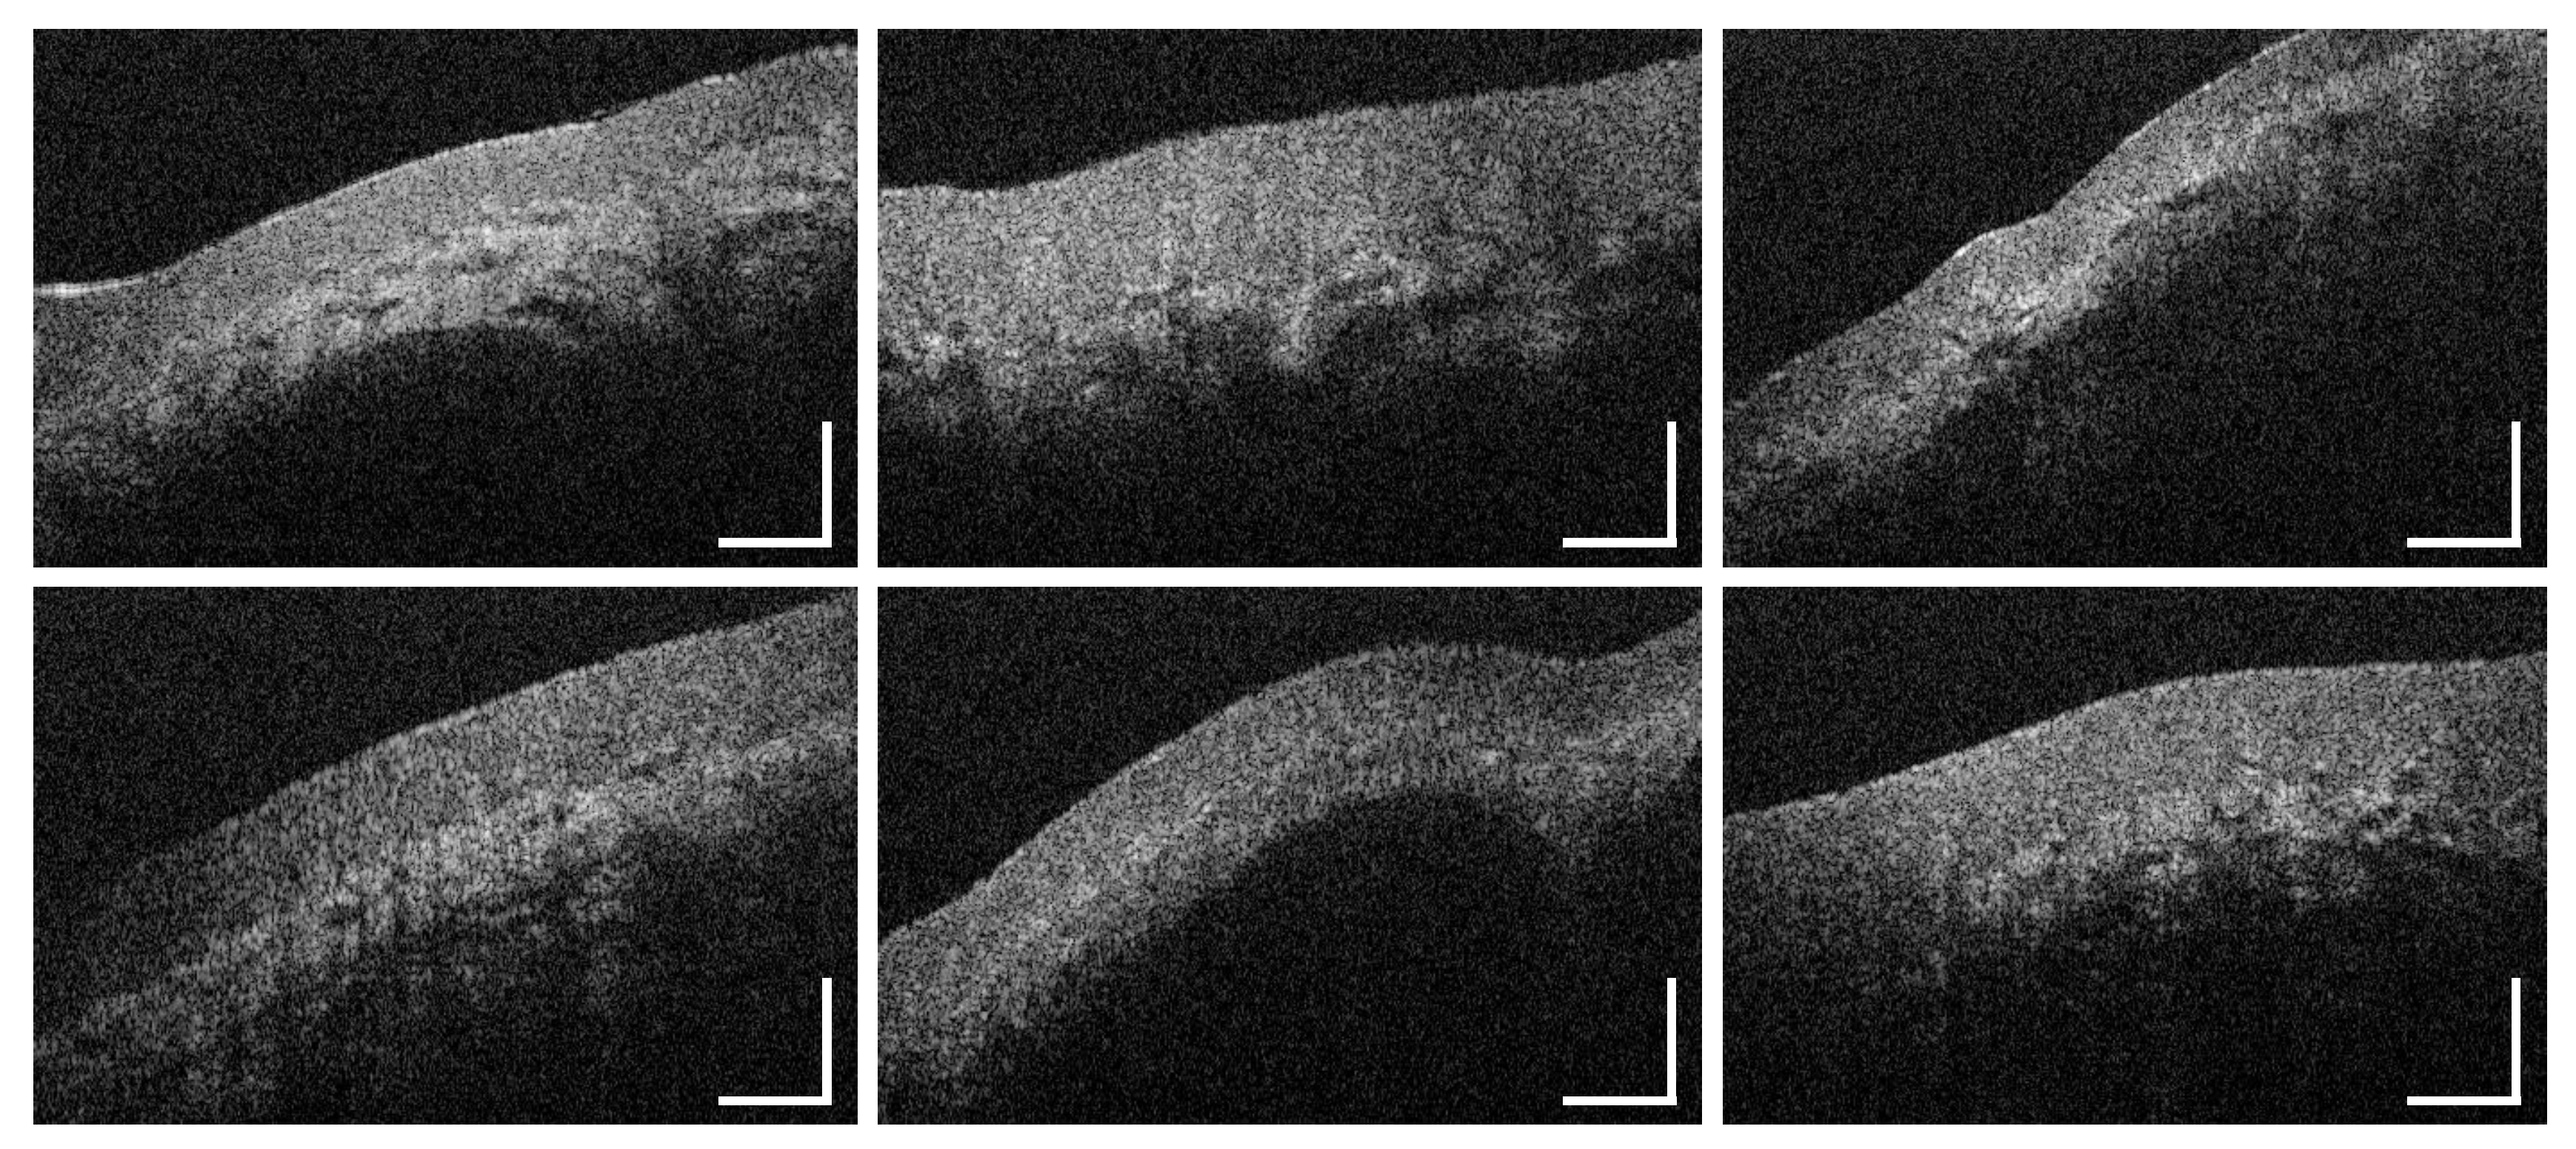
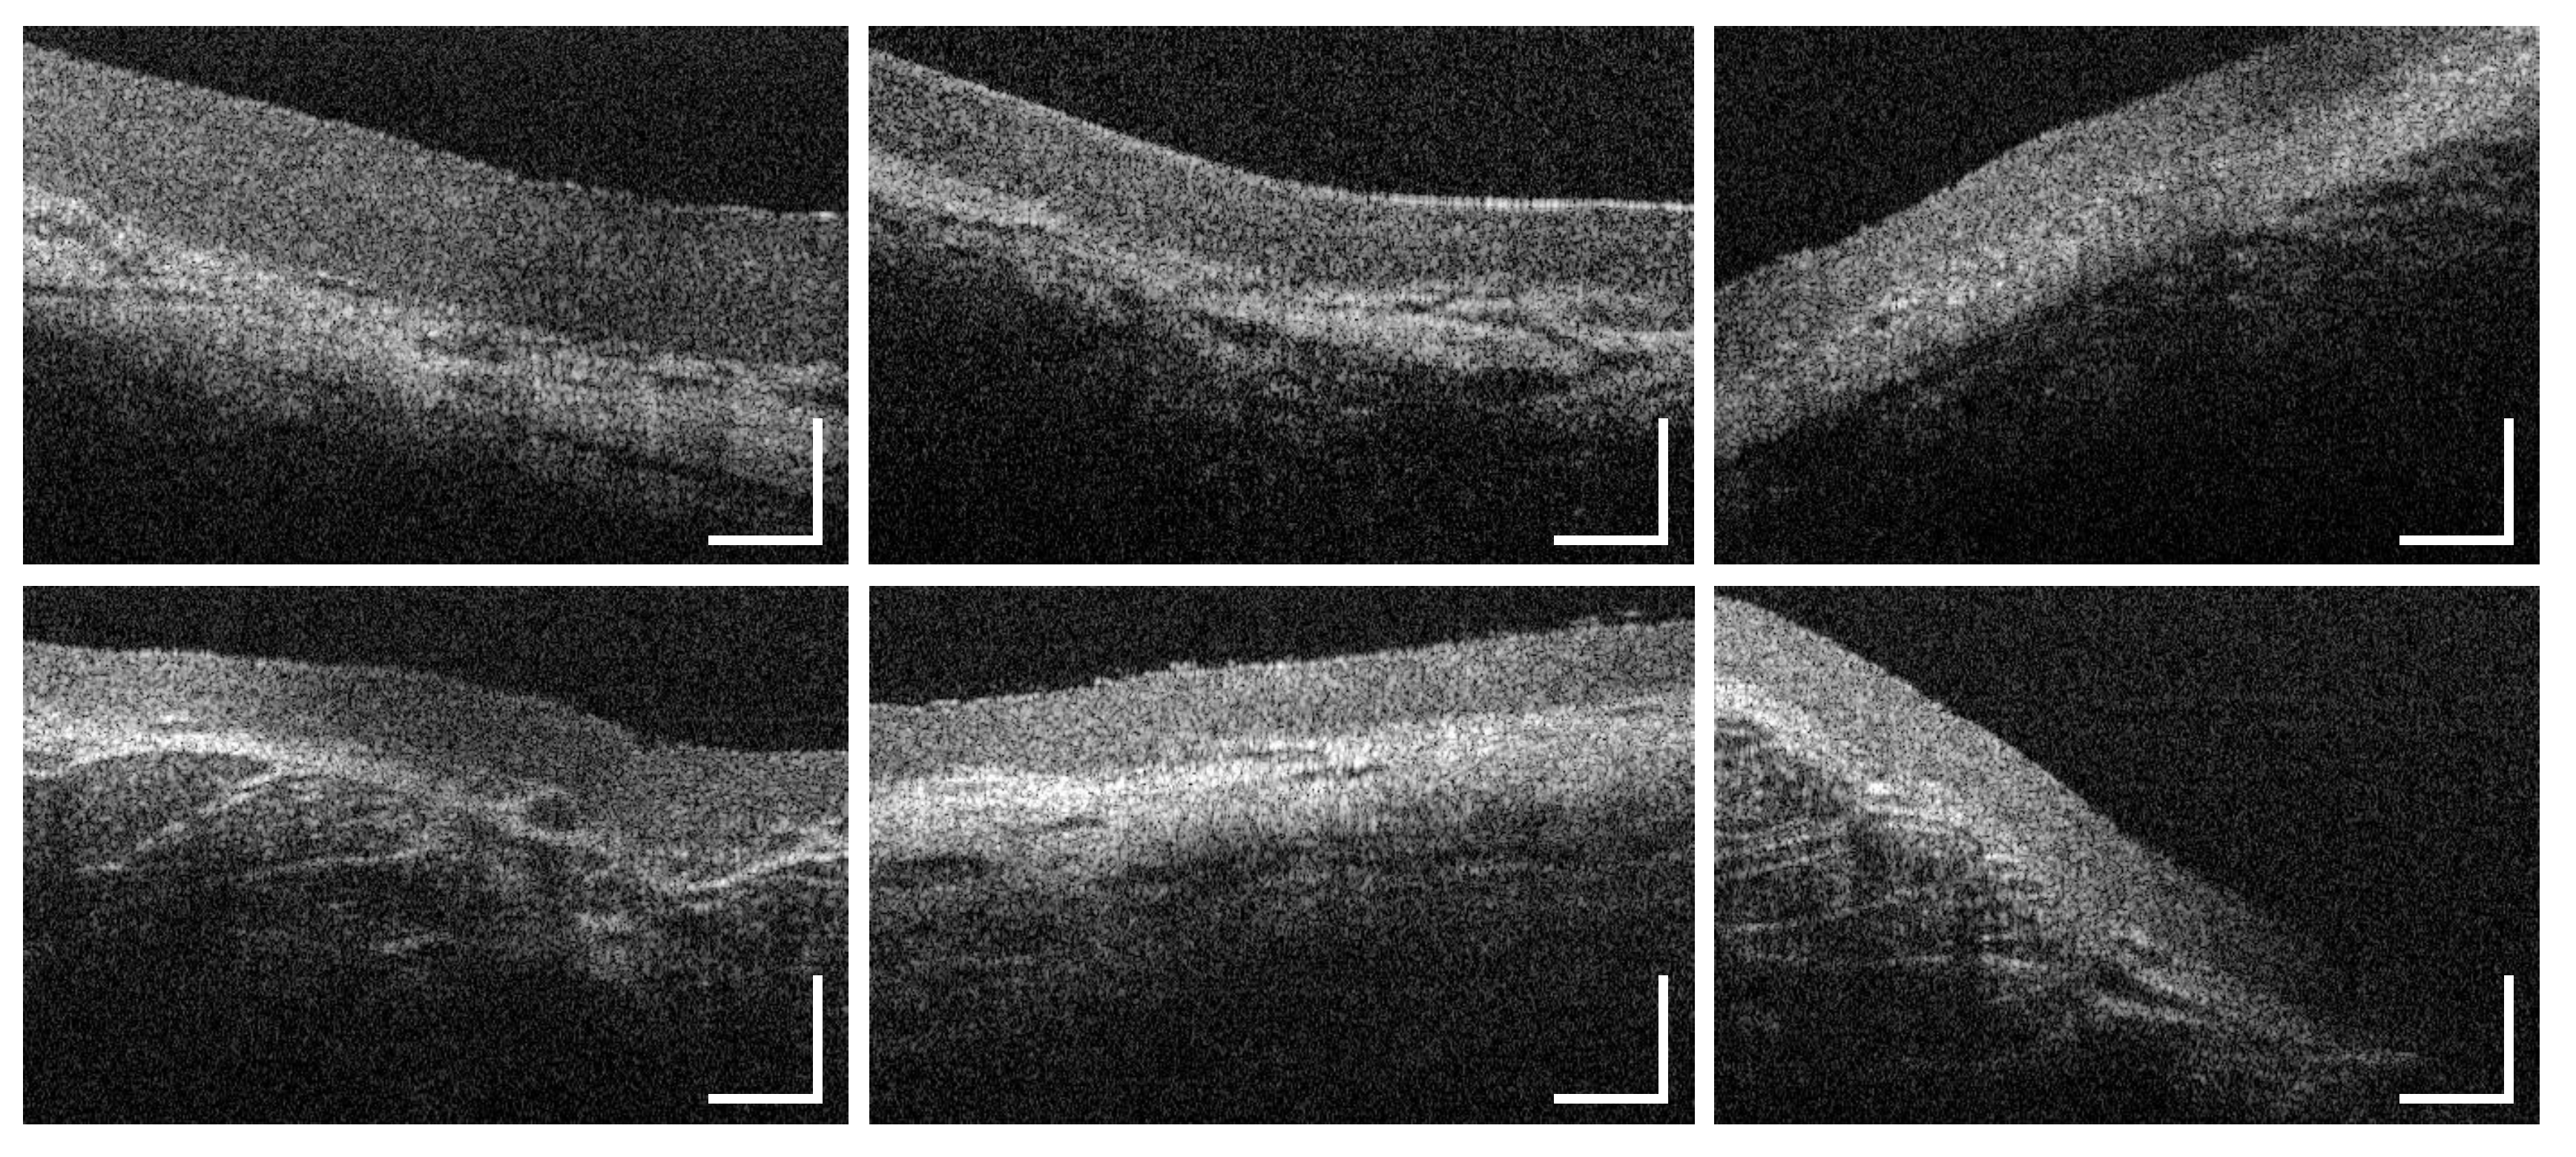
With regard to the surface integrity and profile, labial mucosa has been evaluated as intact in 96.4% and even in 98.0% of the OCT cross sections (Figure 7b–f, Figure 4). The epithelial layer has been classified as homogeneous (98.5%) correlating to a regular epithelial structure in accordance with exemplary histological images. The total value of the labial mucosa was measured to be 243 ± 25 μ m (Table A1). The basement membrane has been assessed as intact in all OCT cross sections and histological slides (e.g., Figure 7a), respectively (Figure 4). Tissue vascularization was mainly high (60.3%) with a mean ratio of 0.39 ± 0.10 (Figure 6) due to an existing network of larger vessels [45,46]. Looking at the additional components, minor salivary glands occurred within the lamina propria in 34.5%. Although, these glands are spread over the whole oral cavity, the highest density is found within the labial, buccal, palatal and sublingual areas [42,47].
Summarizing the results of two measurement points of the alveolar region (MP2 und MP5), epithelial surface of the alveolar mucosa has been defined as intact in 92.2% and even in 95.4% (Figure 7h–i, Figure 4). The epithelial layer has been classified as homogeneous in 96.6%. The mean thickness was 142 ± 15 μ m (Table A1) with no deviation between the upper and the lower alveolar area. A continuous decrease from the labial to the alveolar mucosa is already well described by histology [46] and previous OCT studies [27]. An intact basement membrane was noticed in all OCT images confirmed by exemplary histological slides (e.g., Figure 7g). The grade of tissue vascularization by means of major vessels was classified as high in 62.1% of the detected OCT cross sections with a mean ratio of 0.41 ± 0.13 (Figure 6) being highly correlated to the mean vessel density in the labial mucosa. Moreover, clusters of salivary glands were observed in 47.4% ensuring the moistening of the alveolar region as described in histology [46].

3.2. Buccal Mucosa

OCT image analysis of the buccal mucosa (Figure 8b–f) was realized by means of three measurement points depicting the anterior, the central and the posterior part. At these points, 30.6% of the OCT cross sections (Figure 8b,c arrows) showed a surface with alterations while surface profile was categorized as uneven due to a raised surface in about 14.2% (Figure 8f yellow dots). In 74.6%, the epithelium was classified as homogeneous with a mean thickness of 336 ± 25 μ m (Figure 5), being slightly thicker among the male volunteers (Table A1: MP6-8, Figure A2). Comparing the measurement points of the buccal side, epithelium was thickest at the central part. The basement membrane was intact in 60.8%, however, an amount of 22.4% was stated as not assessable due to the increased epithelial thickness and the limited imaging depth in biological tissue [36]. With regard to future studies, automated segmentation of the epithelium of the buccal mucosa could be challenging due to hyperkeratinization and a reduced visibility of the basement membrane. The grade of vascular supply by larger vessels was moderate (67.7%) with a mean ratio of 0.21 ± 0.14 (Figure 6). Further characteristic features were not able to be detected as salivary glands are beyond the imaging depth and surrounded by fat tissue in the submucosa [46].

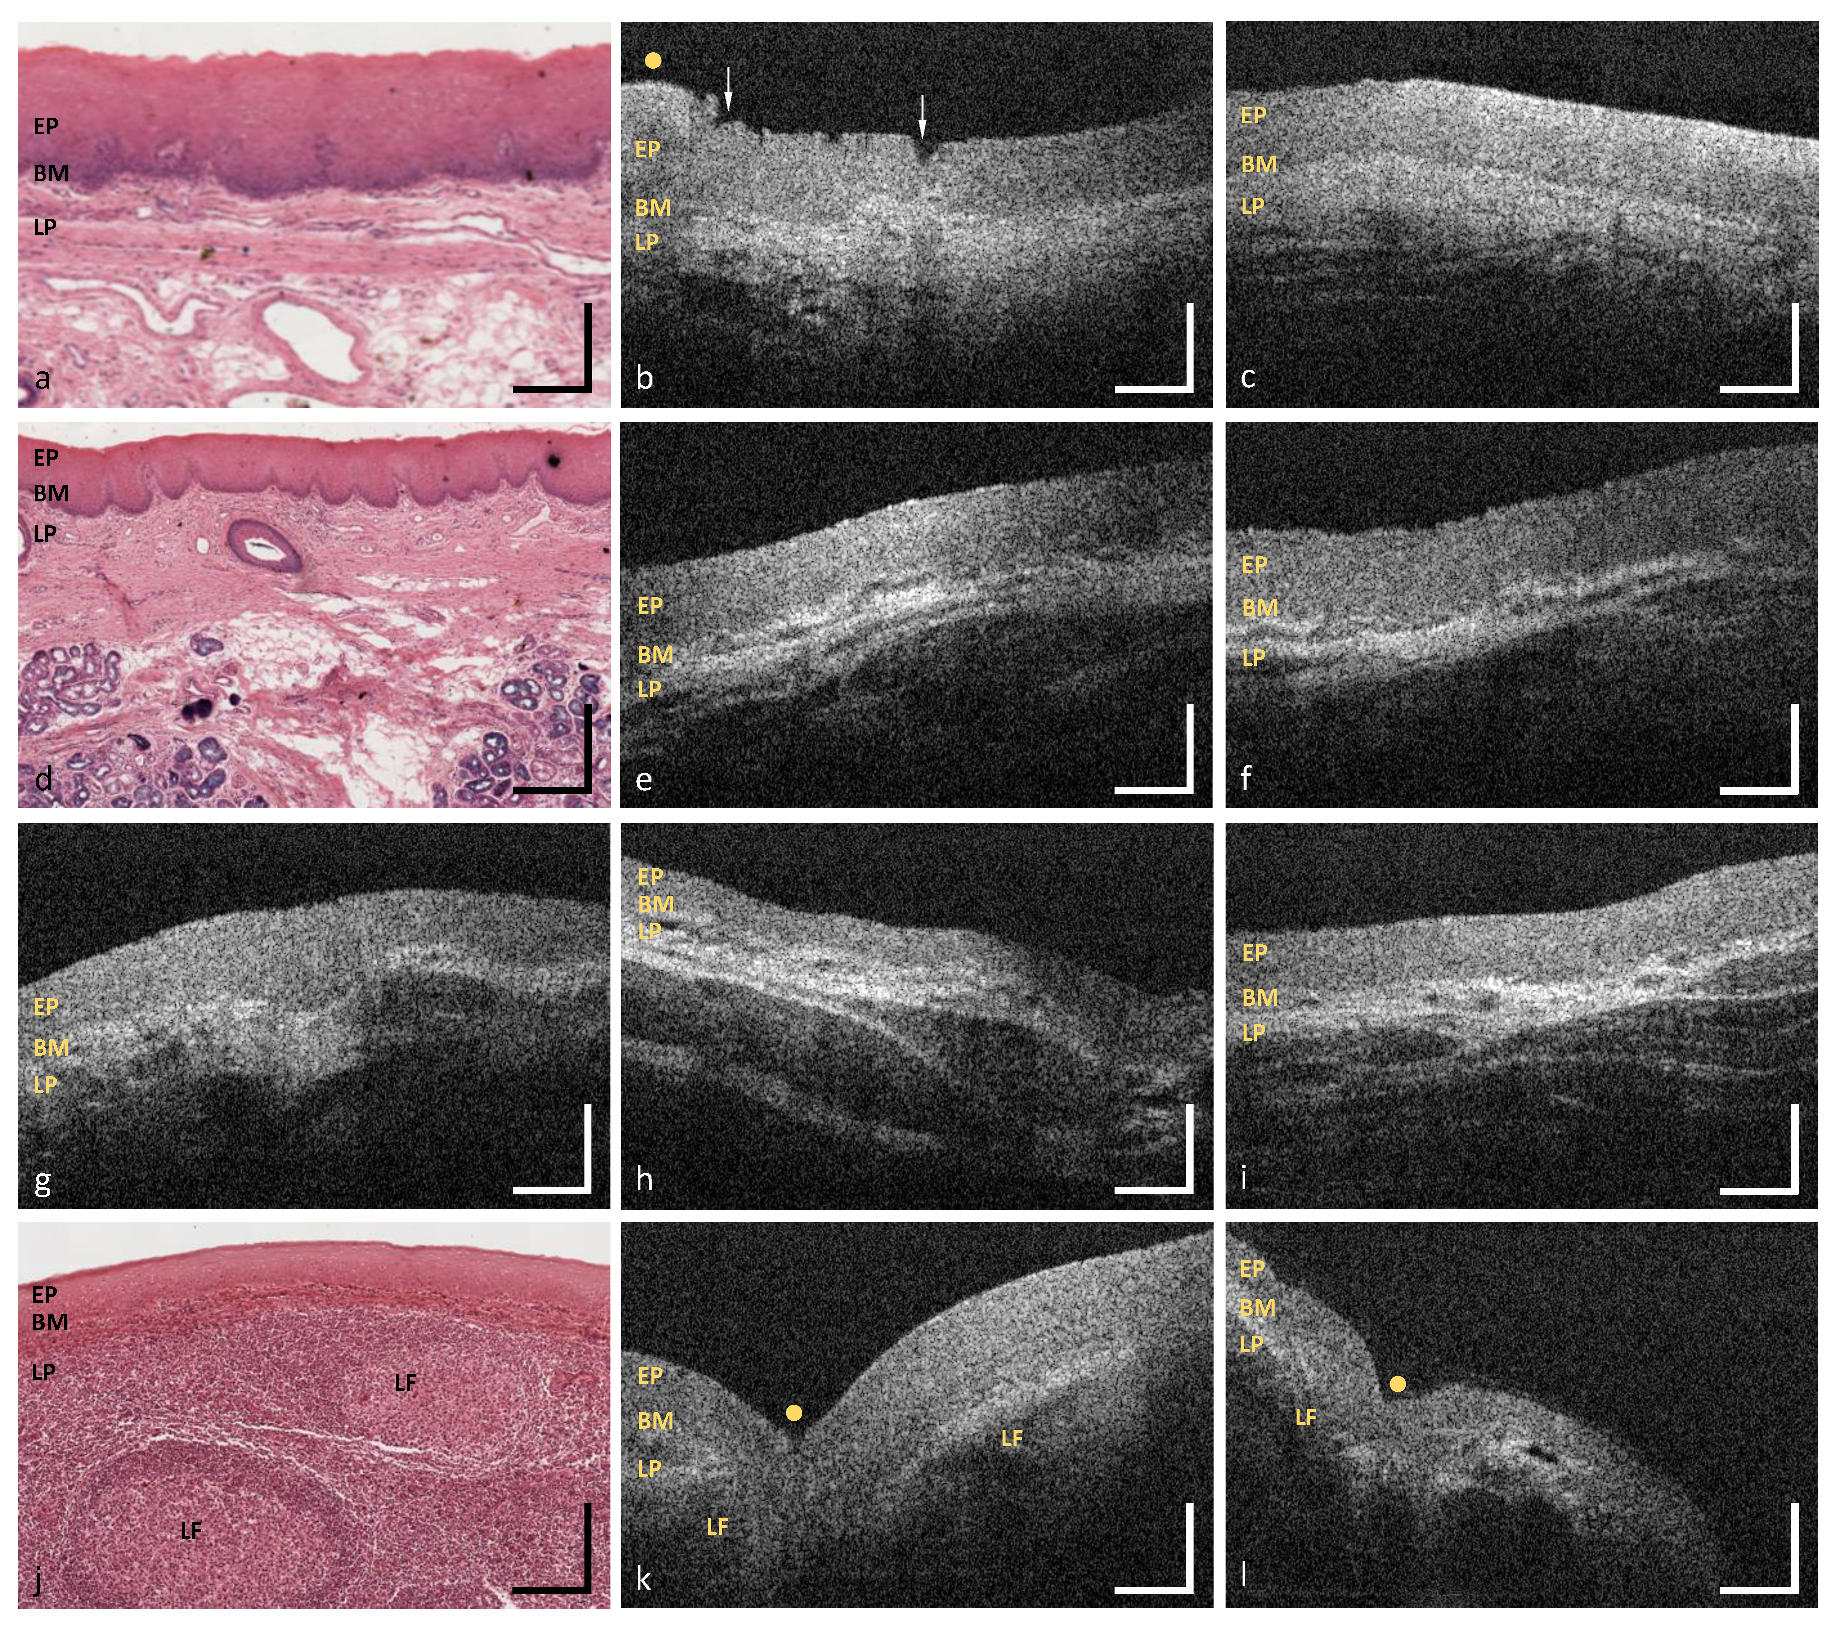
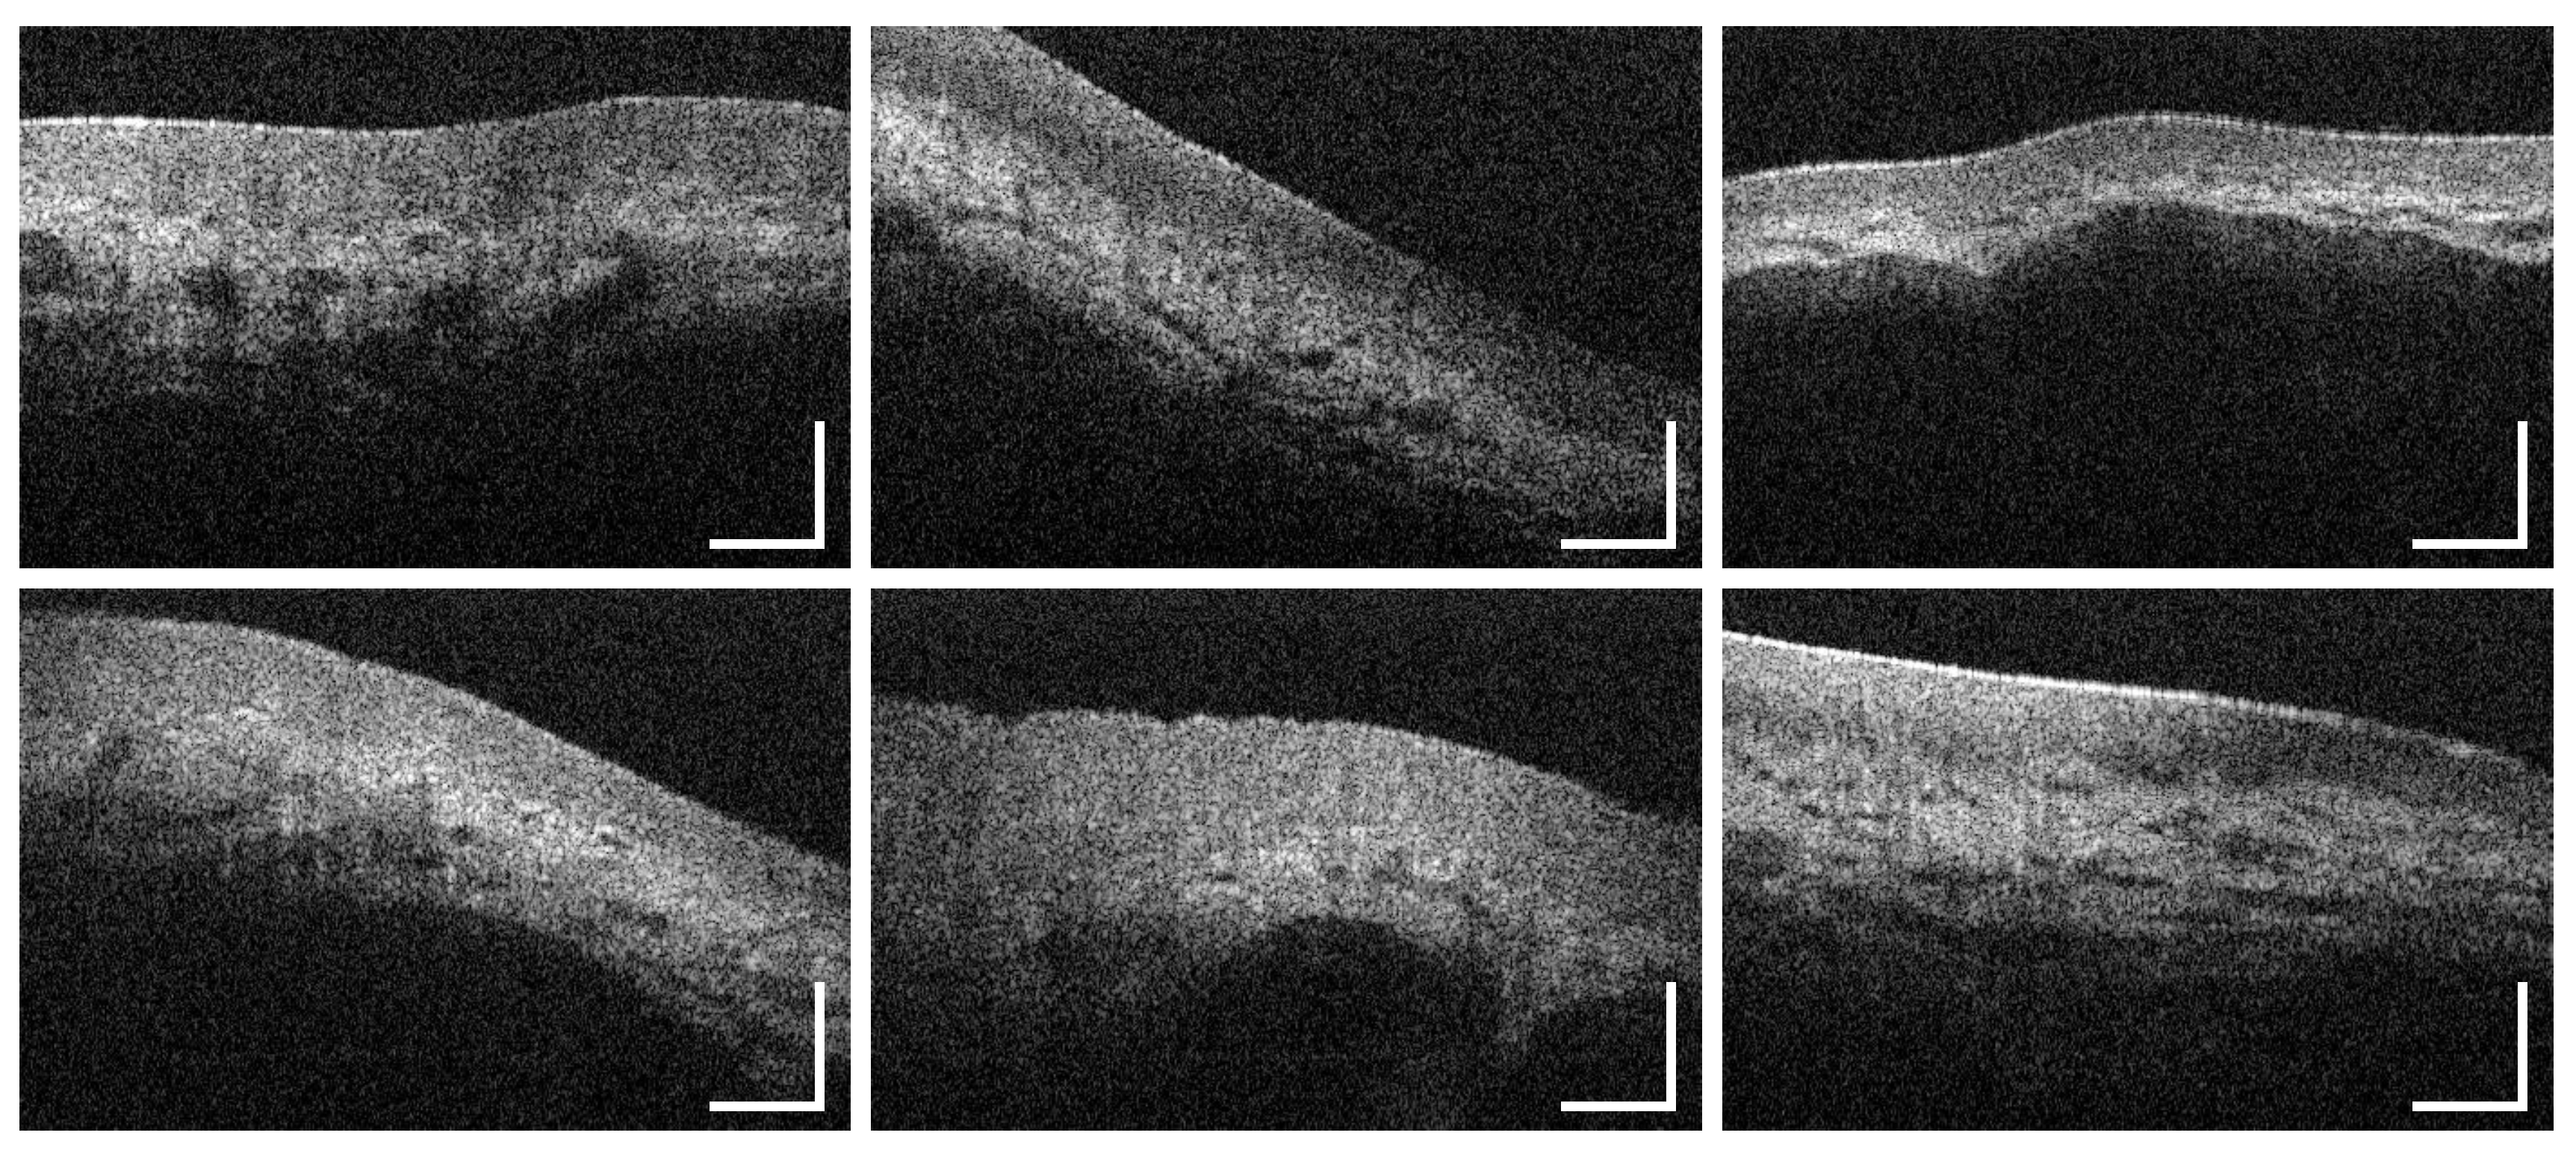
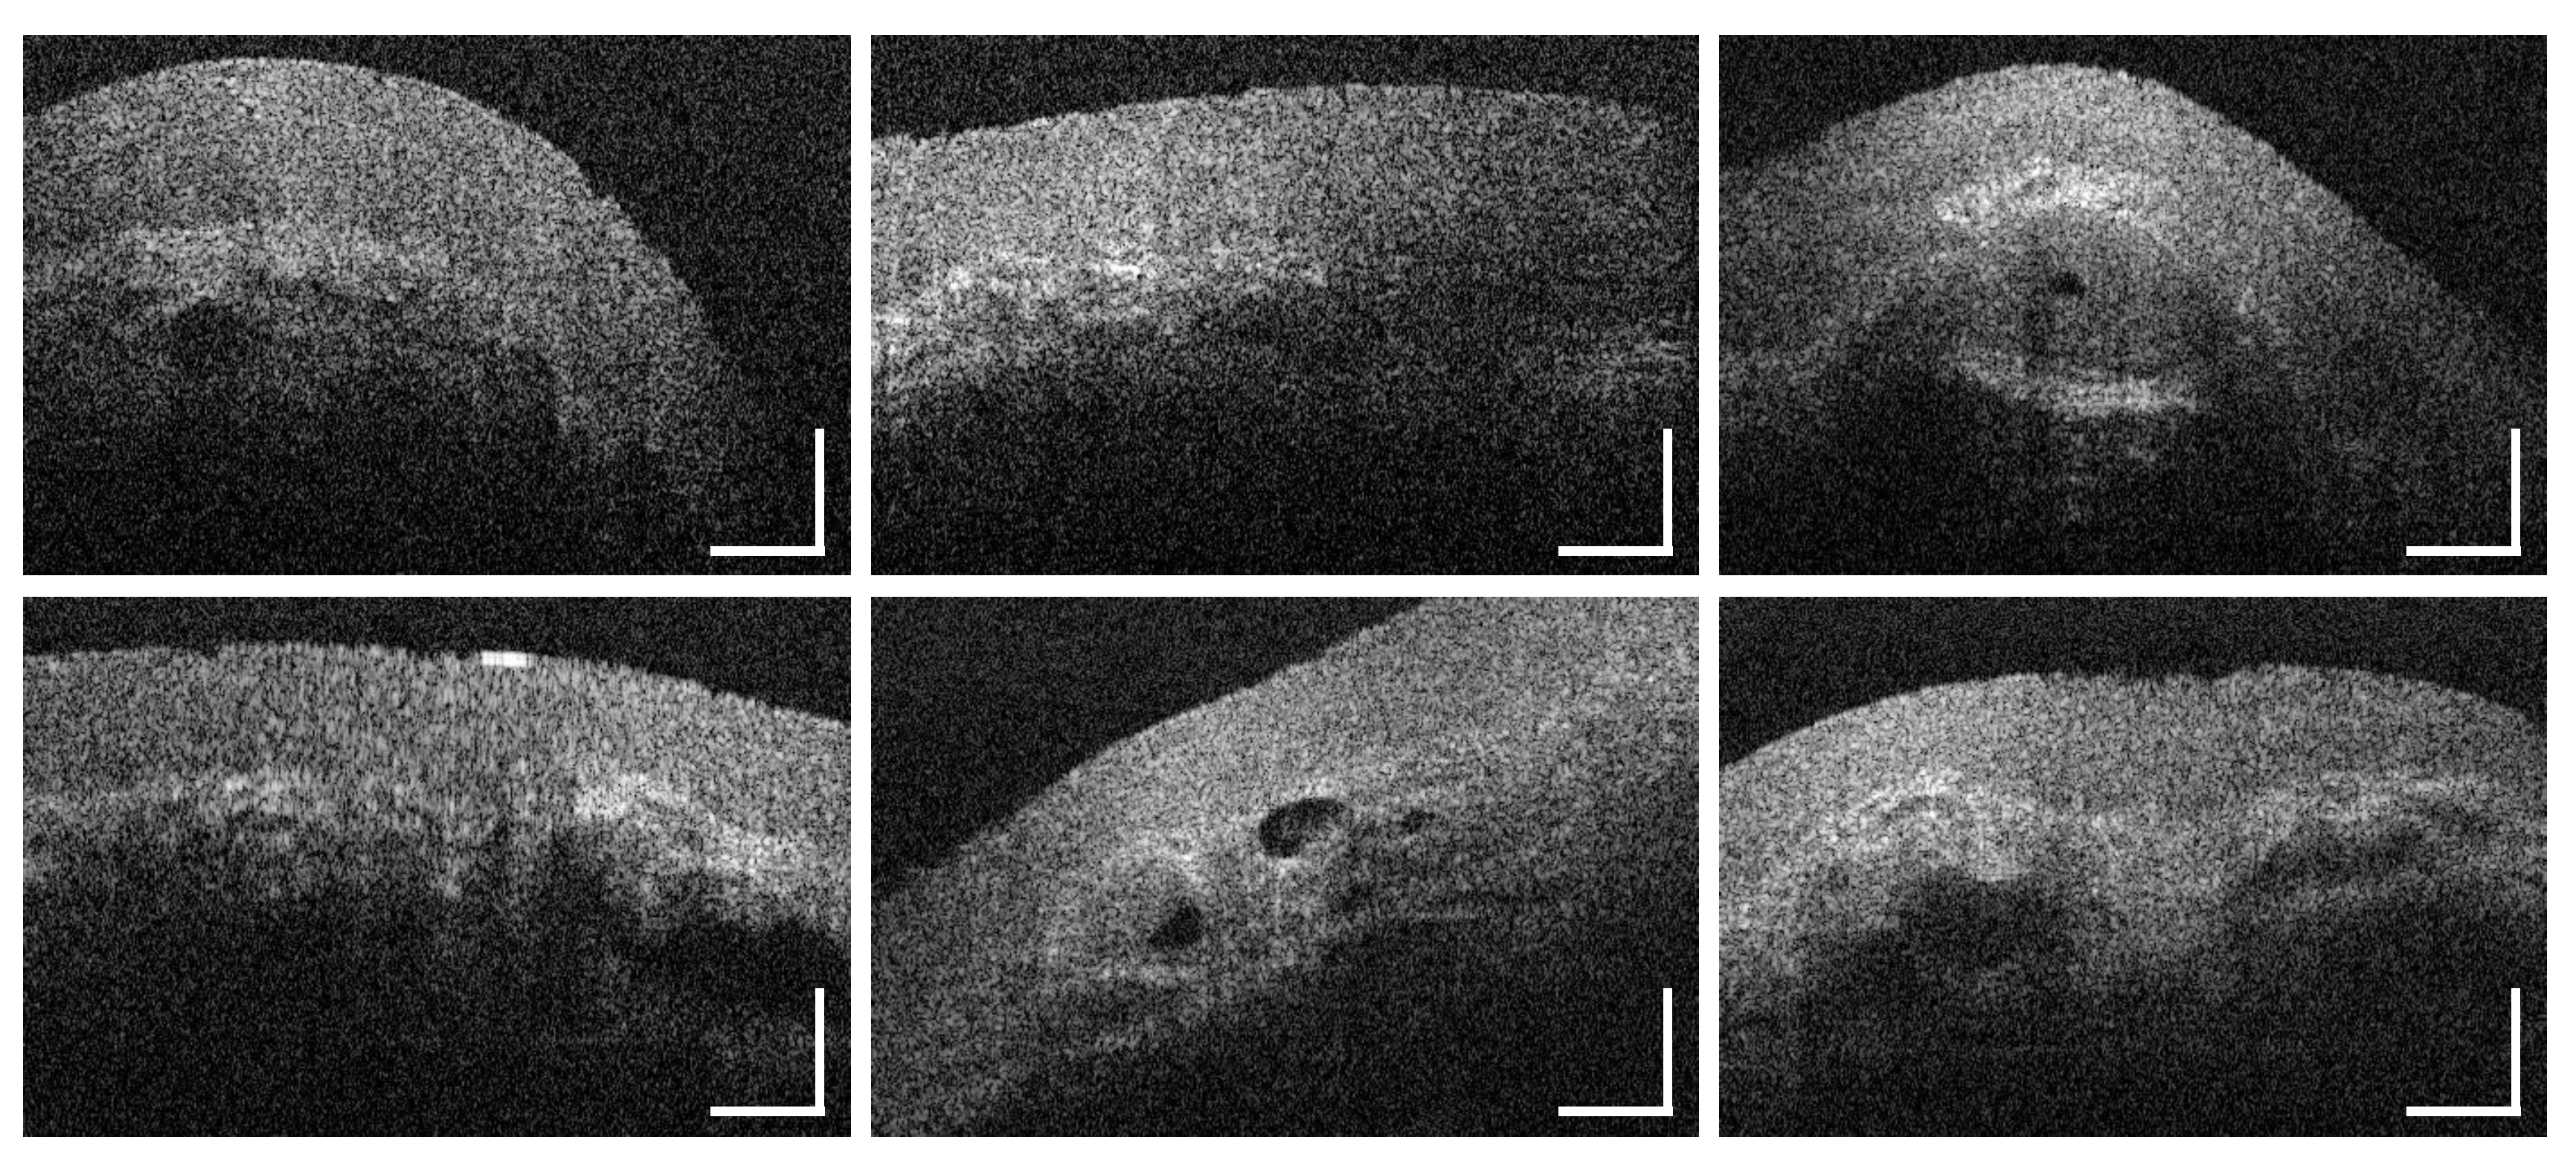
3.3. Sublingual Mucosa
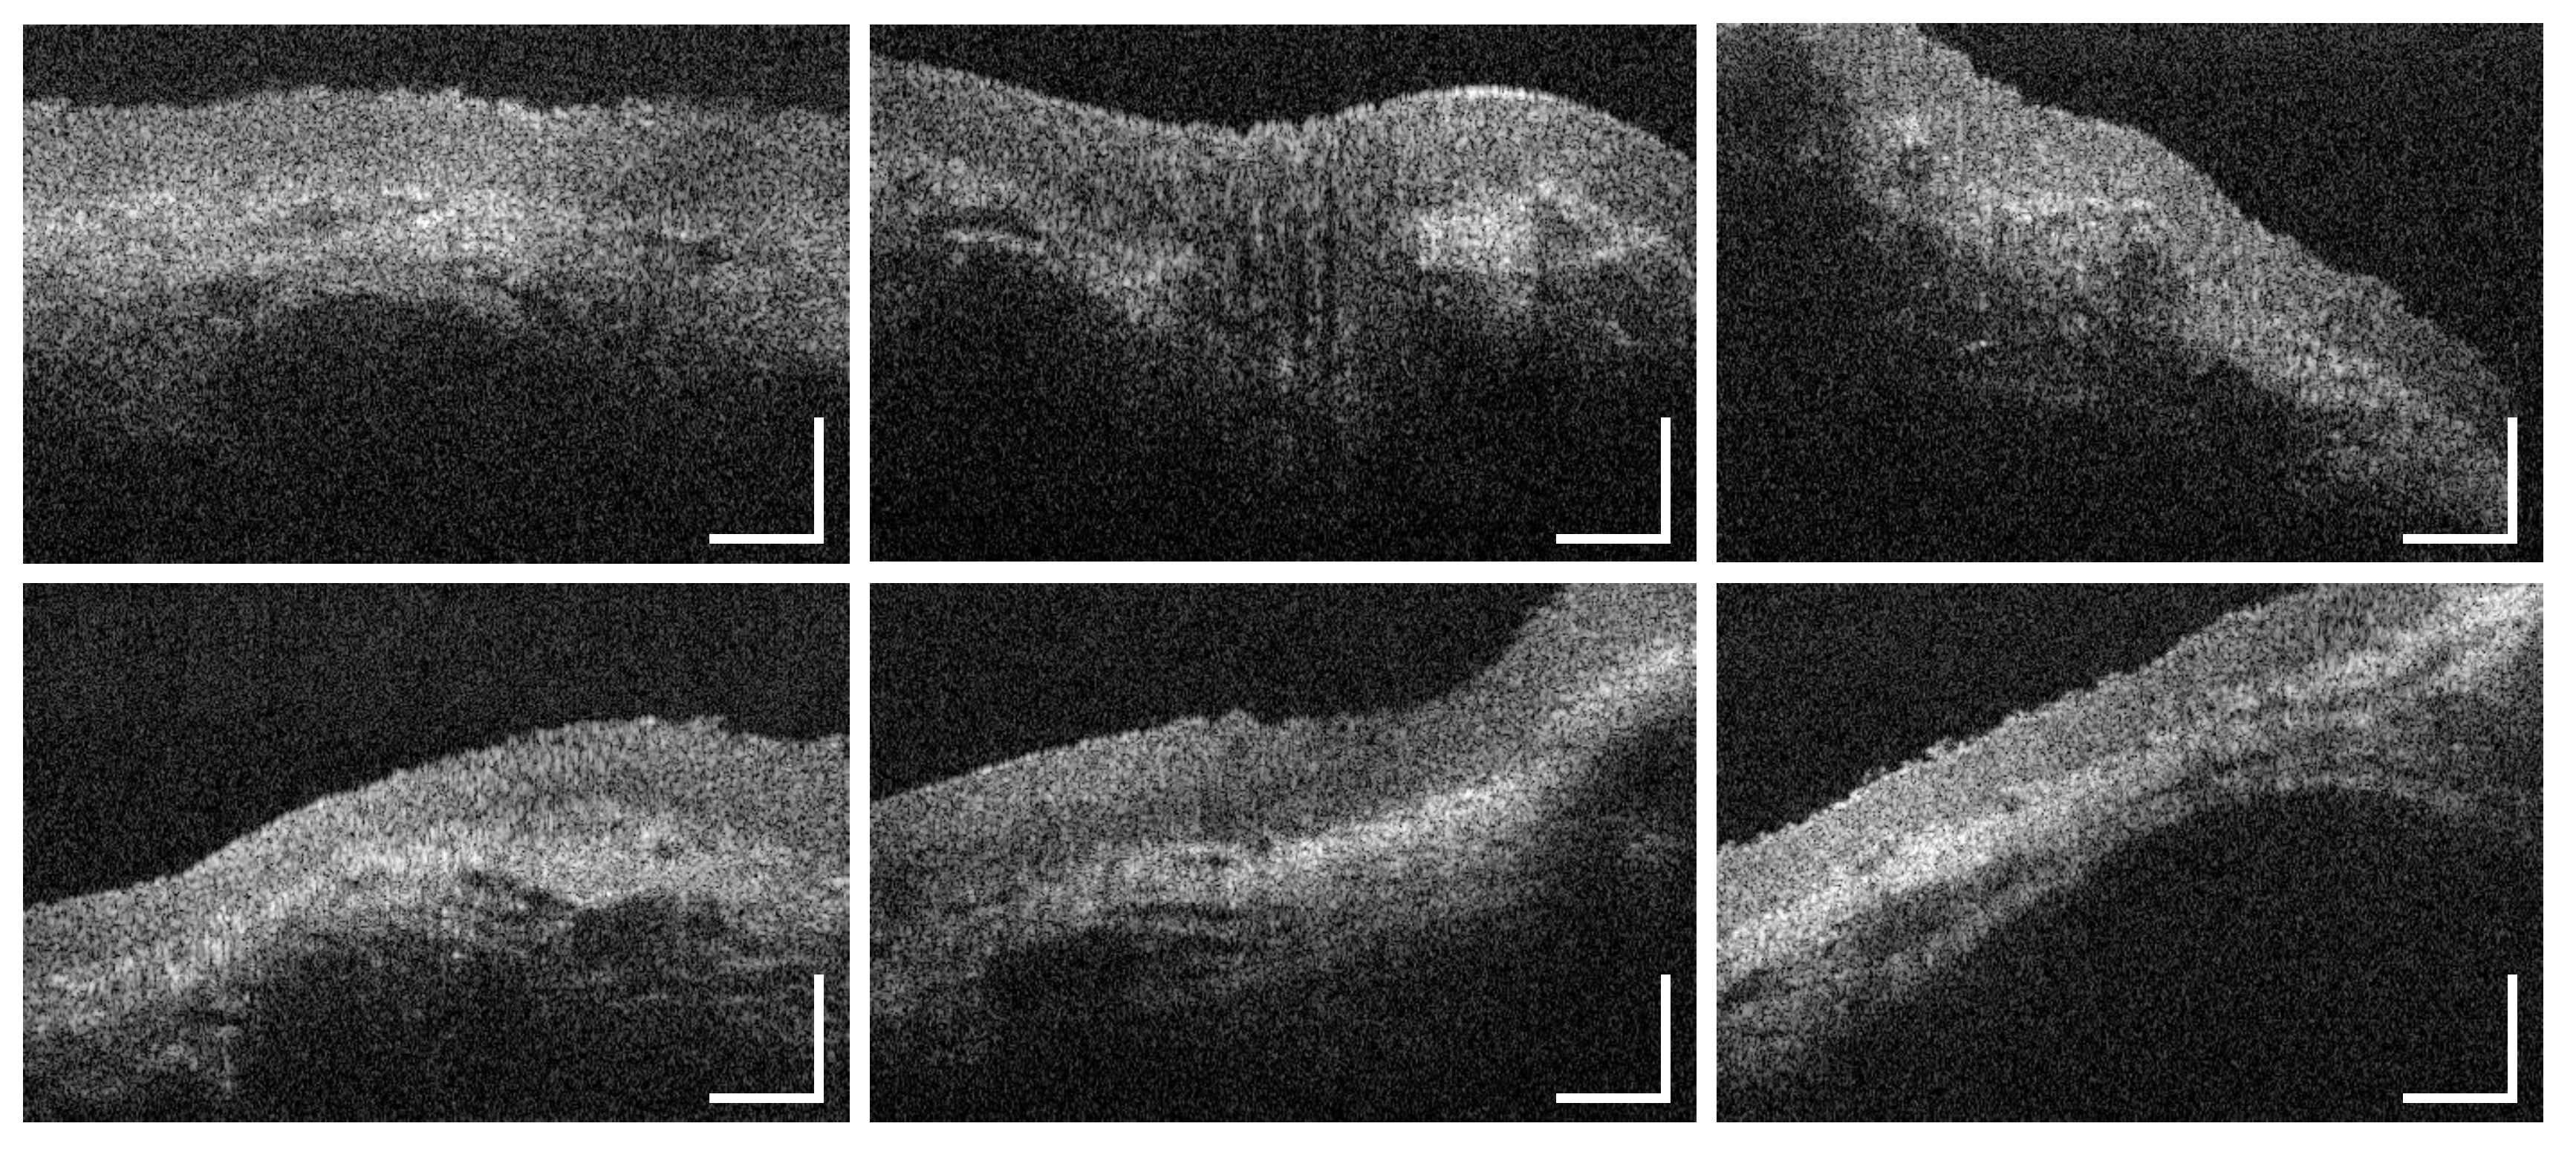
Regarding the sublingual mucosa, OCT images (Figure 9b–f) were taken from the ventral tongue (MP9, MP10) and the neighboring mouth floor (MP11), respectively. The epithelial surface appeared intact (98.9%) and even (98.2%) in agreement with all of the histological slides (e.g., Figure 9a). The epithelial structure was classified as homogeneous in 98.3% of all cases with a mean thickness of 120 ± 15 μ m (Table A1). Statistical analysis revealed significantly higher values in male participants (Table A1: MP9-11, Figure A1 and Figure A2). There were no unsharp stages determined in the course of the basement membrane. Compared to the other measurement points, the most extensive grade of vascular supply was found, because of the large sublingual arteries and veins within the lamina propria in this oral region [46]. In the present study, 86.6% of the OCT sections were evaluated as highly vascularized with a mean ratio of 0.82 ± 0.17 (Figure 6). Beyond this, OCT images did not show any supplementary local features.

3.4. Hard Palate

As exemplarily illustrated in (Figure 10b), in 44.6% of the detected OCT cross sections of the hard palate, multiple alterations of the epithelial surface have been detected. Moreover, the surface profile contained single or groups of convex ridges (38.8%) matching with the transverse palatal folds, as characteristic regional feature [38], which can be more or less pronounced for the selected measurement region (MP12 in Figure 1). Since hyperreflective areas have been detected below the folds, indicating a denser tissue, more than one third of the epithelial layer of the hard palate (37.5%) were classified as inhomogeneous (Figure 4). Mean epithelial thickness was 198 ± 26 μ m (Table A1) being up to 40% higher inside the convex areas. Altogether, these findings represent a physiological adaptation to the masticatory function [46]. The mean value among female volunteers (175 ± 11 μ m ) was lower compared to the male (218 ± 19 μ m ) (Table A1: MP12, Figure A1 and Figure A2) in accordance with former histological studies [48]. In about 34.5% of all cases, the basement membrane was assessed as unsharp due to a reduced contrast of the hyperreflective epithelial layer compared to the subsequent lamina propria. Previous studies discussed this aspect as a consequence of the keratinized surface [27]. Minor salivary glands appeared as additional components in 15.0% of the OCT cross sections, which is confirmed by histology [46].

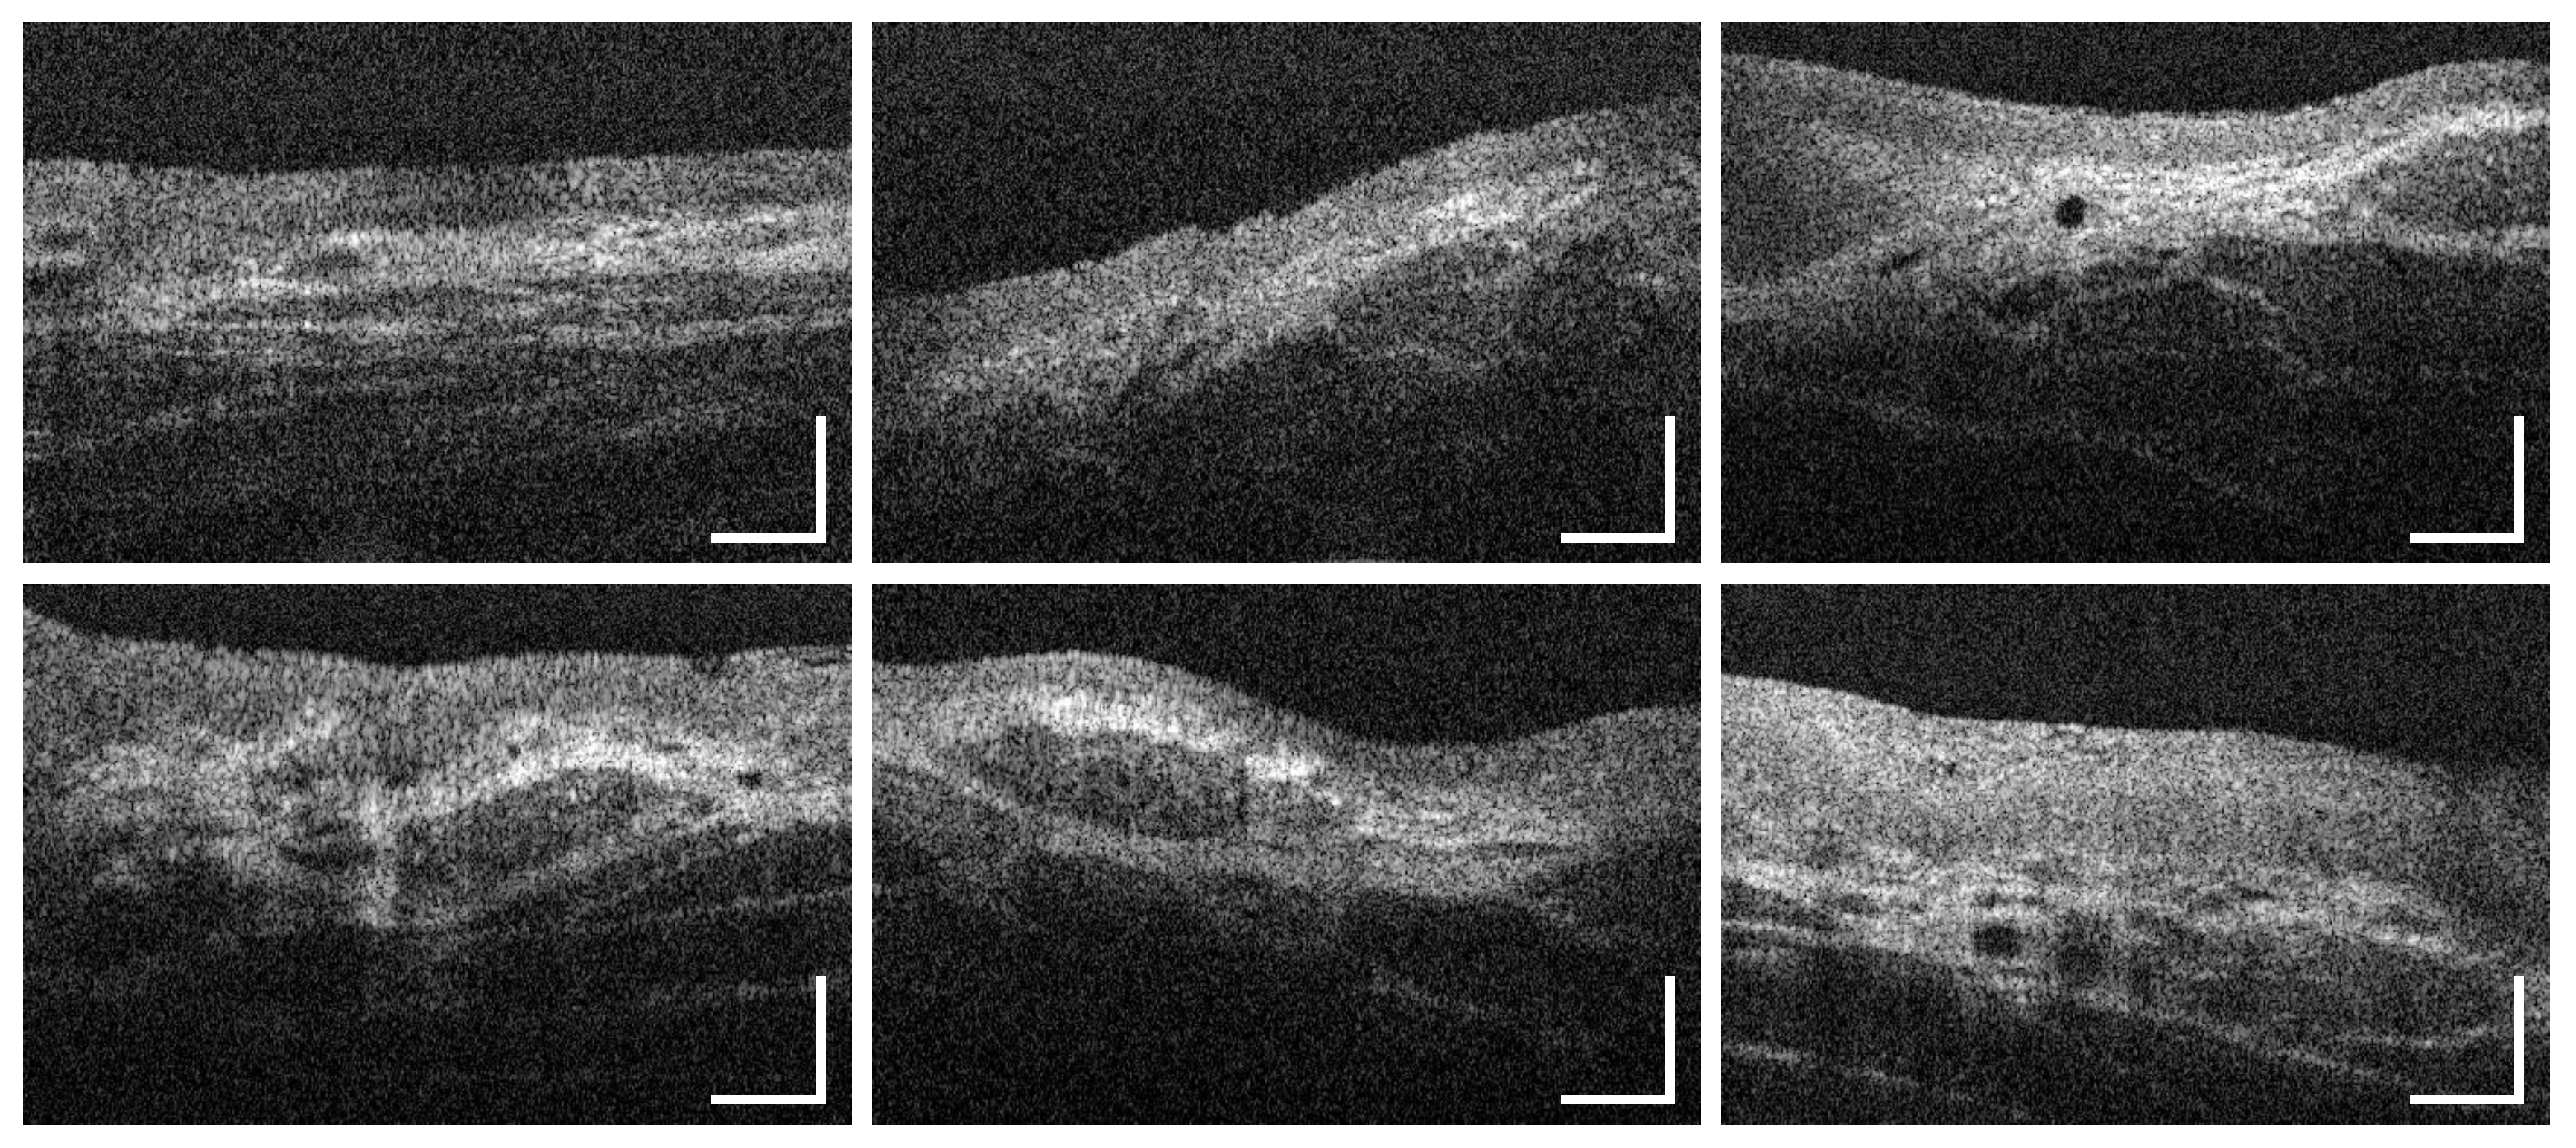
3.5. Soft Palate and Oropharynx

Combining the results alongside the soft palate (MP13), the uvula (MP14) and the oropharynx (MP15), the epithelial surface was intact (96.7%) and even (96.4%), as depicted in the OCT images (Figure 10e–i) and the epithelium appeared homogeneous (89.6%). Among the measurement points, there were no significant differences in the epithelial thickness and the mean value resulted in 130 ± 11 μ m (Table A1: MP13-15, Figure A2). The basement membrane was visible and evaluated as intact in all of the OCT cross sections and the histological slides (e.g., Figure 10d), respectively. Vascularization by major vessels was rated as high in the majority of cases (56.1%) with a mean ratio of 0.34 ± 0.09 due to a distinct vessel network in the reticular layer of the lamina propria [46]. Moreover, packets of minor salivary glands, surrounded by connective tissue, occurred in 61.1% of all cases. This feature has been also seen in histological images and described in the literature [47].

3.6. Palatine Tonsils

Image analysis of the palatine tonsil was performed by using OCT cross sections (Figure 10k,l) by means of a single measurement point (MP16 in Figure 1). In 76.1% of all cases, epithelial surface was categorized as intact in correspondence to the histological slides (e.g., Figure 10j). The surface profile was classified as uneven (87.5%) with concave pits that are equal to the tonsillar crypts [43]. A homogeneous (70.6%) epithelium was found with a mean thickness of 125 ± 17 μ m (Table A1) being similar to the neighboring soft palate. Looking at age-related changes, thickness was lower in the participants between 25 and 45 years compared to younger volunteers (Table A1). Confirming this aspect, an age-dependent decrease in the parenchymal lymphatic tissue combined with an increase in tissue fibrosis and fatty degeneration was reported by former histological investigations [49]. Due to a lower contrast between the epithelium and the lamina propria, the basement membrane was evaluated as unsharp in 52.2%. This finding is caused by a more permeable epithelial junction resulting in huge numbers of lymphocytes between the regularly arranged epithelial cells and in the underlying connective tissue to ensure a sufficient defense of exogenous infections [50]. In 60.3% of all cases, a moderate vascular supply was determined with a mean ratio of 0.19 ± 0.07 (Figure 6). Regarding additional characteristic features, 86.4% of the OCT images and all histological slides showed groups of lymphoid follicles within the lamina propria as part of the primary immune function [43].

4. Discussion

With reference to the limited number of freely accessible OCT images concerning the healthy human oral mucosa, this study aimed to examine a representative sample of disease-free volunteers by means of an endoscopic OCT system. Looking at the study population (Table 2), the distribution between both sexes was balanced, especially within the age groups. Moreover, most participants were younger than 45 years and none of them exceeded the tolerance levels of smoking and alcohol intake or possessed visually suspicious lesions. Thus, oral soft tissue among the study population can be stated as healthy while leaving out invasive biopsies. By using the endoscopic OCT system, all of the measurement points of the oral cavity could be reached. Although some volunteers reported an uncomfortable feeling during the examination process for measurement points within the posterior oral cavity and the oropharynx, at least 60% of the cases have been accessible and therefore image data were sufficient for a representative analysis. Previous studies concerning healthy oral soft tissue concentrated on the imaging of the anterior oral mucosa [17,25,26,27], so detailed information about the accessibility of the posterior areas have not been reported before. However, the presented data suggest that this aspect should be considered for the determination of the sample size.
Regarding the results of the epithelial thickness measurement, the lowest mean values were determined for the sublingual mucosa (120 ± 15 μ m ) in accordance with the reference values of the mouth floor (100 ± 14 μ m ) by Stasio et al. [27]. Additionally, Stasio et al. provided comparable results for the labial mucosa (271 ± 36 μ m ) and Prestin et al. [25] presented similar data for the anterior mouth floor (99 ± 22 μ m ), the uvula (144 ± 30 μ m ) and the hard palate (239 ± 57 μ m ). The highest mean value within the presented study was calculated for the buccal mucosa with about 336 ± 25 μ m . At this point, Stasio et al. reported a mean value of 374 ± 62 μ m agreeing with the reference value of Prestin et al. (294 ± 68 μ m ). One should consider, that the results for the buccal mucosa by Prestin et al. were received by measurements with direct contact containing the influence of tissue stretching. In this study, measurement process was performed contact-free for which reason local tissue compression could be avoided. On the other hand, the penetration depth of the probing light was limited by a thick epithelium reducing the visibility of the basement membrane and the subsequent lamina propria. Thus, the thickness measurement of the buccal epithelium by the presented EOCT system is limited. Histological investigations reported a mean value of 480 ± 90 μ m for the buccal mucosa [51]. Deviations between in vivo OCT and histology could be reasoned in tissue fixation and histological preparation of the physiological oral mucosa [52]. In compliance with our expectations, the epithelial thickness of the measurement points did not show notable differences within the investigation areas (MP6-MP8), and thus, reference values can be defined by means of a reduced number of recommended measurement points as shown in the diagram (Figure 11).
The assessment of tissue vascularization was realized by calculating the mean vascular density by means of major vessels. Considering the anatomical structure of the oral mucosa, the luminal cross-sectional area of larger vessels was related to the avascular epithelium. Apart from the buccal mucosa and the hard palate where measurement was restricted due to a limited penetration depth, a moderate to high grade of vascularization was found within the defined investigation areas (Figure 1). Setting these results in a wider context, previous OCT studies used different approaches to quantify vascular supply [40,45]. Tsai et al. [40] calculated an average vessel density by using en-face projections of OCT angiographic images. At a depth of 250 to 500 μ m , a high vascularization was determined for the labial mucosa, the buccal mucosa and the sublingual mucosa, respectively. For future research on pathologies, the combination of intensity-based OCT and functional imaging, e.g., Doppler OCT and OCT angiography, is recommended while concentrating on both, capillaries and large blood and lymphatic vessels.
Looking at the qualitative image criteria, the evaluation of the OCT cross sections provided similar results for the labial mucosa, the alveolar mucosa, the sublingual mucosa and the soft palate, respectively. There, OCT cross sections displayed an even and homogeneous epithelial layer without surface alterations that is clearly demarcated by a visually consistent basement membrane. With reference to previous histological descriptions [46], these findings correlate with the anatomical structure of the lining mucosa, which includes an intact and regular epithelium with a smooth border to the adjacent lamina propria. The appearance of lining mucosa in OCT was analyzed by Ridgway et al. [26] using sample pictures of the lower lip, the ventral side of the tongue and the mouth floor showing a homogeneous hyporeflective epithelium and a hyperreflective lamina propria. Gentile et al. [17] presented a similar characterization in the context of a systematic review as reference for future investigations. However, epithelial surface has not been widely examined by means of OCT before due to the absence of established criteria. Although the buccal mucosa is histologically classified as lining mucosa as well, in vivo OCT images showed an epithelium containing numerous alterations and inhomogeneous areas. According to former histologic reports [46], this feature can be explained as a consequence of mechanical stress leading to epithelial damage and local reactive keratinization. Concerning the epithelial homogeneity, Stasio et al. [27] described regional changes in the epithelial layer as a result of surface keratinization. OCT cross sections of the hard palate displayed an epithelium with multiple alterations and a keratinized surface as typical feature of the masticatory mucosa in agreement with histological examinations [46]. For the first time, the presented study provided detailed information about the surface profile by delivering in vivo OCT pictures of the transverse palatal folds.
Concerning the depiction of minor salivary glands, the used OCT system allowed the identification of clusters that are located close to the basement membrane [53]. The appearance in the OCT images was accordant with the description of Grulkowski et al. [42] in the form of round hyporeflective elements with an excretory duct surrounded by connective tissue. However, for the depiction of deeper-lying clusters of minor salivary glands, the usage of an OCT system with a center wavelength of 1300 nm is recommended.

5. Summary and Conclusions

In the presented clinical study, in vivo OCT cross sections of the healthy human oral mucosa were obtained with the aim of generating a standardized image analysis of intensity-based OCT cross sections. Concentrating on cancer-relevant parts of the oral cavity and the oropharyngeal isthmus, a total of 47 volunteers was examined gathering more than 3500 OCT images out of seven investigation areas by means of an EOCT system. In extension to former OCT studies, information about the not readily accessible posterior areas, such as the oropharynx and the palatine tonsil, was achieved. Concerning the image evaluation, a list of seven criteria was implemented especially considering the integrity and the profile of the epithelial surface as well as the grade of vascular supply by major vessels as future indicators for the detection of suspicious oral lesions. Moreover, the extent of freely available OCT cross sections was enlarged by creating a collection of sample pictures demonstrating regional characteristics to expand the current state of knowledge about the healthy adult oral soft tissue. In order to prevent unnecessary biopsies, histological correlation was realized using HE stained image material out of a virtual database of human tissue. Altogether, there was a good correlation between the OCT cross sections and the histological slides as diagnostic gold standard.
To the best of our knowledge, for the first time mean values for the epithelial thickness of the alveolar mucosa, the palatine tonsil and the oropharynx were obtained from OCT images. Comparing the results of different investigation areas, epithelium of the sublingual mucosa was found to be thinnest in contrast to a maximum alongside the buccal region. Furthermore, the influence of sex and age on the epithelium was examined by dividing the sample into groups. Within the sublingual and the palatal region, mean epithelial thickness was increased in male subjects while age-related variations were found at the palatine tonsil. According to the anatomical configuration, mean vascular density was measured in relation to the avascular epithelium. Focusing on major vessels, a moderate to high tissue vascularization was determined within the observed regions including a maximum alongside the sublingual area. In a wider context, the assessment might be extended by quantifying the number of capillaries by means of imaging techniques like OCT angiography.
Concerning the analysis of the qualitative criteria, areas of lining mucosa appeared similar in the OCT cross sections possessing an even and homogeneous epithelium without alterations followed by a visually intact basement membrane. Within the buccal region, the hard palate and the palatine tonsil, respectively, oral mucosa showed local features representing physiological adaptations to mechanical stress or immune functions. Altogether, the findings suggest that an appropriate characterization of the healthy oral soft tissue can be achieved with a few measurement points.
Looking at disease-free individuals without alcohol or tobacco consumption above the tolerance levels, this study also indicates fields of further research. As an example, visually normal oral soft tissue in subjects with increased alcohol and tobacco intake need to be investigated for reaching a better understanding of early changes. Beyond that, the results should be the basis for future clinical studies aiming to improve the differentiation of suspicious lesions into benign and malignant.
With regard to the examination process, image analysis confirmed that future in vivo measurements can be simplified by gathering short series of OCT cross sections from a limited number of sites inside the investigation areas. In addition, there is a potential for the automatic epithelial thickness measurement based on the presented data in combination with future studies with an increased number of image data sets and analysts. In clinical practice, OCT might serve as adjunctive screening tool that is used to complement the visual evaluation and to facilitate the determination of the biopsy site. Against this background, the presented study offers a recommendation for the selection of the measurement points and comprehensive data about the expected appearance in OCT images.

Author Contributions

Conceptualization, M.A and J.W.; methodology, M.A., C.S. and J.W..; investigation, C.S. and J.W.; custom software development, C.S., J.M. and J.G.; formal analysis, J.W.; resources, J.W. and E.K.; data curation, M.A., J.M. and J.W.; writing—original draft preparation, M.A. and J.W.; writing—review and editing, C.S., J.G. and E.K.; visualization, J.W.; supervision, J.W.; project administration, J.W.; funding acquisition, J.W. and E.K. All authors have read and agreed to the published version of the manuscript.

Funding

This project is supported by the Roland Ernst Foundation Dresden (Project: TOMscan). The author Juliane Mueller was supported by the European Union/European Social Fund (ESF) and the Free State of Saxony within the ESF junior research group “Optical Technologies in Medicine” (project number 100270108). The author Jonas Golde received a doctoral scholarship (project number 100284305) by the European Union/European Social Fund (ESF) and the Free State of Saxony.

Acknowledgments

We would like to thank Karl Storz GmbH & Co. KG, Tuttlingen, Germany for provision of the rigid NIR endoscopes and corresponding components. Histological cross sections were thankfully provided by the Institute of Anatomy, TU Dresden, Carl Gustav Carus Faculty of Medicine, Dresden, Germany.

Conflicts of Interest

The authors declare no conflict of interest.

Appendix A

Figure A1. Box plot of the gender- and age-specific epithelial thickness of selected distinctive measurement points. Labial: MP4, Alveolar: MP5, Buccal: MP7, Sublingual: MP9, Hard palate: MP12, Soft palate: MP13 (cp. Figure 1).
Diagnostics 10 00827 g0a1
Figure A2. Box plot of the gender-specific epithelial thickness according to the location. Labial: MP1/MP3/MP4, Alveolar: MP2/MP5, Buccal: MP6-MP8, Sublingual: MP9/MP10, Mouth floor: MP11, Hard palate: MP12, Soft palate: MP13, Uvula: MP14, Oropharynx: MP15, Tonsils: MP16 (cp. Figure 1).
Diagnostics 10 00827 g0a2
Table A1. Mean epithelial thickness ( ± standard deviation) of individual measurement points and defined regions adjusted by sex and age.
Measurement Point/RegionSex DistributionAge GroupTotal
MaleFemale< 2525–45> 45
MP 1 238 ± 30 μ m 244 ± 30 μ m 250 ± 32 μ m 236 ± 28 μ m 250 ± 37 μ m 241 ± 30 μ m
MP 2 155 ± 7 μ m 124 ± 5 μ m 140 ± 15 μ m 140 ± 17 μ m 147 ± 31 μ m 141 ± 17 μ m
MP 3 250 ± 10 μ m 214 ± 15 μ m 232 ± 18 μ m 231 ± 23 μ m 264 ± 7 μ m 233 ± 22 μ m
MP 4 267 ± 9 μ m 244 ± 10 μ m 253 ± 16 μ m 258 ± 15 μ m 253 ± 9 μ m 256 ± 15 μ m
MP 5 148 ± 9 μ m 136 ± 12 μ m 136 ± 15 μ m 144 ± 7 μ m 162 ± 13 μ m 142 ± 12 μ m
MP 6 344 ± 23 μ m 310 ± 19 μ m 327 ± 34 μ m 327 ± 24 μ m 341 ± 18 μ m 328 ± 27 μ m
MP 7 348 ± 20 μ m 345 ± 21 μ m 349 ± 22 μ m 347 ± 21 μ m 333 ± 10 μ m 347 ± 21 μ m
MP 8 351 ± 18 μ m 315 ± 13 μ m 336 ± 24 μ m 333 ± 24 μ m 331 ± 28 μ m 334 ± 24 μ m
MP 9 128 ± 8 μ m 103 ± 9 μ m 116 ± 7 μ m 116 ± 18 μ m 121 ± 14 μ m 116 ± 15 μ m
MP 10 131 ± 9 μ m 110 ± 12 μ m 124 ± 7 μ m 120 ± 17 μ m 119 ± 14 μ m 121 ± 15 μ m
MP 11 134 ± 11 μ m 114 ± 8 μ m 121 ± 5 μ m 127 ± 17 μ m 117 ± 5 μ m 124 ± 14 μ m
MP 12 218 ± 19 μ m 175 ± 11 μ m 190 ± 21 μ m 199 ± 26 μ m 220 ± 43 μ m 198 ± 26 μ m
MP 13 139 ± 12 μ m 121 ± 7 μ m 122 ± 8 μ m 135 ± 14 μ m 131 ± 7 μ m 131 ± 13 μ m
MP 14 129 ± 12 μ m 129 ± 6 μ m 126 ± 7 μ m 129 ± 7 μ m 148 ± 14 μ m 129 ± 9 μ m
MP 15 128 ± 8 μ m 130 ± 8 μ m 131 ± 7 μ m 128 ± 7 μ m 122 ± 12 μ m 129 ± 8 μ m
MP 16 133 ± 17 μ m 118 ± 14 μ m 142 ± 15 μ m 115 ± 11 μ m 141 ± 3 μ m 125 ± 17 μ m
Labial mucosa 252 ± 22 μ m 234 ± 24 μ m 245 ± 25 μ m 242 ± 25 μ m 256 ± 20 μ m 243 ± 25 μ m
Alveolar mucosa 152 ± 9 μ m 130 ± 11 μ m 138 ± 15 μ m 142 ± 13 μ m 155 ± 23 μ m 142 ± 15 μ m
Buccal mucosa 348 ± 20 μ m 323 ± 24 μ m 338 ± 28 μ m 336 ± 24 μ m 335 ± 18 μ m 336 ± 25 μ m
Sublingual mucosa 131 ± 10 μ m 109 ± 11 μ m 121 ± 7 μ m 121 ± 18 μ m 119 ± 10 μ m 120 ± 15 μ m
Hard palate 218 ± 19 μ m 175 ± 11 μ m 190 ± 21 μ m 199 ± 26 μ m 220 ± 43 μ m 198 ± 26 μ m
Soft palate and oropharynx 133 ± 12 μ m 126 ± 8 μ m 126 ± 8 μ m 131 ± 11 μ m 134 ± 15 μ m 130 ± 11 μ m
Palatine tonsils 133 ± 17 μ m 118 ± 14 μ m 142 ± 15 μ m 115 ± 11 μ m 141 ± 3 μ m 125 ± 17 μ m
Table A2. Mean vascular density of specific oral measurement points and regions. Due to the limited visualization of the lamina propria for the inner cheek and the hard palate, vascularization by major vessels of both regions could not be determined.
Measurement Point/RegionVascularization
MP1 0.42 ± 0.10
MP2 0.44 ± 0.12
MP3 0.38 ± 0.09
MP4 0.39 ± 0.11
MP5 0.39 ± 0.12
MP9 0.81 ± 0.20
MP10 0.83 ± 0.17
MP11 0.81 ± 0.16
MP13 0.33 ± 0.08
MP14 0.37 ± 0.10
MP15 0.34 ± 0.11
MP16 0.19 ± 0.07
Labial mucosa 0.39 ± 0.10
Alveolar mucosa 0.41 ± 0.13
Sublingual mucosa 0.82 ± 0.17
Soft palate and oropharynx 0.34 ± 0.09
Palatine tonsils 0.19 ± 0.07
Table A3. Success rate of OCT data collection per measurement point, participant and investigation area.
Participant NumberAge GroupSexMeasurement PointSuccess Rate (%)
13425678910111213141516
1(1)mxxxxxxxxxxxxxxxx100
2(1)mxxxxxxxxxxxxxxxx100
3(1)mxxxxxxxxxxxxxxxx100
4(1)mxxxxxxxxxxxxxxxx100
5(1)mxxxxxxxxxxxxxx0x93.8
6(1)mxxxxxxxxxxxxxx0087.5
7(1)mxxxxxxxxxxxxxx0087.5
8(1)mxxxxxxxxxxxxx00081.3
9(2)mxxxxxxxxxxxxxxxx100
10(2)mxxxxxxxxxxxxxxxx100
11(2)mxxxxxxxxxxxxxxxx100
12(2)mxxxxxxxxxxxxxxxx100
13(2)mxxxxxxxxxxxxxxxx100
14(2)mxxxxxxxxxxxxxxxx100
15(2)mxxxxxxxxxxxxxxxx100
16(2)mxxxxxxxxxxxxxx0x93.8
17(2)mxxxxxxxxxxxxxx0x93.8
18(2)mxxxxxxxxxxxxxx0087.5
19(2)mxxxxxxxxxxxxxx0087.5
20(2)mxxxxxxxxxxxxxx0087.5
21(2)mxxxxxxxxxxxxx00081.3
22(2)mxxxxxxxxxxxx000075.0
23(2)mxxxxxxxxxxxx000075.0
24(3)mxxxxxxxxxxxxxxxx100
25(3)mxxxxxxxxxxxxxxxx100
26(1)fxxxxxxxxxxxxxxxx100
27(1)fxxxxxxxxxxxxxxxx100
28(1)fxxxxxxxxxxxxxxxx100
29(1)fxxxxxxxxxxxxxx0x93.8
30(1)fxxxxxxxxxxxxx00081.3
31(2)fxxxxxxxxxxxxxxxx100
32(2)fxxxxxxxxxxxxxxxx100
33(2)fxxxxxxxxxxxxxxxx100
34(1)fxxxxxxxxxxxxxxxx100
35(2)fxxxxxxxxxxxxxxxx100
36(2)fxxxxxxxxxxxxxxxx100
37(2)fxxxxxxxxxxxxxxxx100
38(2)fxxxxxxxxxxxxxxxx100
39(2)fxxxxxxxxxxxxxxxx100
40(2)fxxxxxxxxxxxxxxxx100
41(2)fxxxxxxxxxxxxxxxx100
42(2)fxxxxxxxxxxxxxxxx100
43(2)fxxxxxxxxxxxxxx0x93.8
44(2)fxxxxxxxxxxxxxx0087.5
45(2)fxxxxxxxxxxxxxx0087.5
46(2)fxxxxxxxxxxxxx000100
47(3)fxxxxxxxxxxxxxxxx100
Investigation area Labial mucosaAlveolar mucosaBuccal mucosaSublingual mucosaHard palateSoft palate/oropharynxPalatine tonsil
Success rate % 10010010010010095.785.161.772.3
Age group: (1): <25; (2): 25–45; (3): >45. Sex: m: male; f = female. Success rate: Percentage of measurement points reached (x: OCT data collected, 0: no OCT data).
Figure A3. Representative OCT images of the human oral mucosa in vivo of the labial, alveolar, buccal and sublingual region as well as the oropharynx and the hard palate demonstrating the principle of the visual image analysis. EP: epithelium, BM: basement membrane, LP: lamina propria; Vertical lines: epithelial thickness measurement, Ellipsoidal shapes: marked regions of vascularization. Scale bars: 200 μ m .
Diagnostics 10 00827 g0a3
Figure A4. Supplementary HE stained histological cross sections of the human labial oral mucosa [44]. EP: epithelium, BM: basement membrane, LP: lamina propria, SG: salivary gland. Scale bar: 200 μ m .
Diagnostics 10 00827 g0a4
Figure A5. Supplementary HE stained histological cross sections of the human alveolar mucosa [44]. EP: epithelium, BM: basement membrane, LP: lamina propria, Scale bar: 200 μ m .
Diagnostics 10 00827 g0a5
Figure A6. Supplementary HE stained histological cross sections of the human buccal mucosa [44]. EP: epithelium, BM: basement membrane, LP: lamina propria, Scale bar: 200 μ m .
Diagnostics 10 00827 g0a6
Figure A7. Supplementary HE stained histological cross sections of the human sublingual mucosa [44]. EP: epithelium, BM: basement membrane, LP: lamina propria, Scale bar: 200 μ m .
Diagnostics 10 00827 g0a7
Figure A8. Supplementary HE stained histological cross sections of the mucosal tissue of the human hard palate [44]. EP: epithelium, BM: basement membrane, LP: lamina propria, SG: salivary gland. Scale bar: 200 μ m .
Diagnostics 10 00827 g0a8
Figure A9. Supplementary HE stained histological cross sections of the mucosal tissue of the human soft palate [44]. EP: epithelium, BM: basement membrane, LP: lamina propria, SG: salivary gland. Scale bar: 200 μ m .
Diagnostics 10 00827 g0a9
Figure A10. Supplementary HE stained histological cross sections of the mucosal tissue of the human tonsil [44]. EP: epithelium, BM: basement membrane, LP: lamina propria, LF: lymphoid follicle. Scale bar: 200 μ m .
Diagnostics 10 00827 g0a10
Figure A11. Supplementary intensity-based OCT cross sections of the mucosal tissue of the inner upper lip (MP1, Figure 1). Scale bars: 200 μ m .
Diagnostics 10 00827 g0a11
Figure A12. Supplementary intensity-based OCT cross sections of the alveolar mucosa of the upper vestibular region (MP2, Figure 1). Scale bars: 200 μ m .
Diagnostics 10 00827 g0a12
Figure A13. Supplementary intensity-based OCT cross sections of the mucosal tissue of the central inner lower lip (MP3, Figure 1). Scale bars: 200 μ m .
Diagnostics 10 00827 g0a13
Figure A14. Supplementary intensity-based OCT cross sections of the mucosal tissue of the lateral inner lower lip (MP4, Figure 1). Scale bars: 200 μ m .
Diagnostics 10 00827 g0a14
Figure A15. Supplementary intensity-based OCT cross sections of the alveolar mucosa of the lower vestibular region (MP5, Figure 1). Scale bars: 200 μ m .
Diagnostics 10 00827 g0a15
Figure A16. Supplementary intensity-based OCT cross sections of the buccal mucosa of the anterior inner cheek (MP6, Figure 1). Scale bars: 200 μ m .
Diagnostics 10 00827 g0a16
Figure A17. Supplementary intensity-based OCT cross sections of the buccal mucosa of the central inner cheek (MP7, Figure 1). Scale bars: 200 μ m .
Diagnostics 10 00827 g0a17
Figure A18. Supplementary intensity-based OCT cross sections of the buccal mucosa of the posterior inner cheek (MP8, Figure 1). Scale bars: 200 μ m .
Diagnostics 10 00827 g0a18
Figure A19. Supplementary intensity-based OCT cross sections of the oral mucosa of the anterior ventral tongue (MP9, Figure 1). Scale bars: 200 μ m .
Diagnostics 10 00827 g0a19
Figure A20. Supplementary intensity-based OCT cross sections of the oral mucosa of the central ventral tongue (MP10, Figure 1). Scale bars: 200 μ m .
Diagnostics 10 00827 g0a20
Figure A21. Supplementary intensity-based OCT cross sections of the mucosal tissue of the mouth floor (MP11, Figure 1). Scale bars: 200 μ m .
Diagnostics 10 00827 g0a21
Figure A22. Supplementary intensity-based OCT cross sections of the oral muucosa of the hard palate (MP12, Figure 1). Scale bars: 200 μ m .
Diagnostics 10 00827 g0a22
Figure A23. Supplementary intensity-based OCT cross sections of the mucosal tissue of the soft palate (MP13, Figure 1). Scale bars: 200 μ m .
Diagnostics 10 00827 g0a23
Figure A24. Supplementary intensity-based OCT cross sections of the oral mucosa of the uvula (MP14, Figure 1). Scale bars: 200 μ m .
Diagnostics 10 00827 g0a24
Figure A25. Supplementary intensity-based OCT cross sections of the mucosal tissue of the oropharynx (MP15, Figure 1). Scale bars: 200 μ m .
Diagnostics 10 00827 g0a25
Figure A26. Supplementary intensity-based OCT cross sections of the mucosal tissue of the palatine tonsil (MP16, Figure 1). Scale bars: 200 μ m .
Diagnostics 10 00827 g0a26

References

  1. World Health Organization (WHO). Cancer Today—Data Visualization Tools for Exploring the Global Cancer Burden in 2018; World Health Organization (WHO): Geneva, Switzerland, 2019. [Google Scholar]
  2. Montero, P.H.; Patel, S.G. Cancer of the Oral Cavity. Surg. Oncol. Clin. N. Am. 2015, 24, 491–508. [Google Scholar] [CrossRef] [PubMed] [Green Version]
  3. Rivera, C.; Venegas, B. Histological and molecular aspects of oral squamous cell carcinoma. Oncol. Lett. 2014, 8, 7–11. [Google Scholar] [CrossRef] [PubMed] [Green Version]
  4. Robert Koch-Institut; die Gesellschaft der epidemiologischen Krebsregister in Deutschland e.V. Krebs in Deutschland für 2015/2016; Technical report; 2020; Available online: https://www.krebsdaten.de/Krebs/DE/Content/Publikationen/Krebs_in_Deutschland/krebs_in_deutschland_inhalt.html (accessed on 15 October 2020).
  5. Shield, K.D.; Ferlay, J.; Jemal, A.; Sankaranarayanan, R.; Chaturvedi, A.K.; Bray, F.; Soerjomataram, I. The global incidence of lip, oral cavity, and pharyngeal cancers by subsite in 2012. CA Cancer J. Clin. 2017, 67, 51–64. [Google Scholar] [CrossRef] [PubMed]
  6. de Martel, C.; Georges, D.; Bray, F.; Ferlay, J.; Clifford, G.M. Global burden of cancer attributable to infections in 2018: A worldwide incidence analysis. Lancet Glob. Health 2020, 8, e180–e190. [Google Scholar] [CrossRef] [Green Version]
  7. Deutsche Krebsgesellschaft; Deutsche Krebshilfe; AWMF. Konsultationsfassung S3-Leitlinie Diagnostik und Therapie des Mundhöhlenkarzinoms; Leitlinienprogramm Onkologie: Berlin, Germany, 2019; Volume 3.01, pp. 26–37. Available online: https://www.leitlinienprogramm-onkologie.de/fileadmin/user_upload/Downloads/Leitlinien/Mundhoehlenkarzinom/Version_3/LL_Mundhoehlenkarzinom_Langversion_Konsultationsfassung_3.01.pdf (accessed on 15 October 2020).
  8. Rivera, C. Essentials of oral cancer. Int. J. Clin. Exp. Pathol. 2015, 8, 11884–11894. [Google Scholar] [CrossRef]
  9. Avon, S.L.; Klieb, H.B. Oral soft-tissue biopsy: An overview. J. Can. Dent. Assoc. 2012, 78, 1–9. [Google Scholar]
  10. Kumaraswamy, K.L.; Vidhya, M.; Rao, P.K.; Mukanda, A. Oral biopsy: Oral pathologist’s perspective. J. Cancer Res. Ther. 2012, 8, 192–198. [Google Scholar] [CrossRef]
  11. Herranz González-Botas, J.; Varela Vázquez, P.; Vázquez Barro, C. Second primary tumours in head and neck cancer. Curr. Oncol. Rep. 2016, 67, 123–129. [Google Scholar] [CrossRef]
  12. Bhatia, N.; Lalla, Y.; Vu, A.N.; Farah, C.S. Advances in optical adjunctive aids for visualisation and detection of oral malignant and potentially malignant lesions. Int. J. Dent. 2013, 2013. [Google Scholar] [CrossRef] [Green Version]
  13. Huang, D.; Swanson, E.A.; Lin, C.P.L.; Schuman, J.S.; Stinson, W.G.; Chang, W.; Hee, M.R.; Flotte, T.; Gregory, K.; Puliafito, C.A.; et al. Optical coherence tomography (OCT). Science 1991, 254, 1178–1181. [Google Scholar] [CrossRef] [Green Version]
  14. Wilder-Smith, P.; Holtzman, J.; Epstein, J.; Le, A. Optical diagnostics in the oral cavity: An overview. Oral Dis. 2010, 16, 717–728. [Google Scholar] [CrossRef] [PubMed] [Green Version]
  15. Gora, M.J.; Suter, M.J.; Tearney, G.J.; Li, X. Endoscopic optical coherence tomography: Technologies and clinical applications [Invited]. Biomed. Opt. Express 2017, 8, 2405–2444. [Google Scholar] [CrossRef] [PubMed] [Green Version]
  16. Higgins, L.M.; Pierce, M.C. Design and characterization of a handheld multimodal imaging device for the assessment of oral epithelial lesions. J. Biomed. Opt. 2014, 19, 086004. [Google Scholar] [CrossRef] [PubMed] [Green Version]
  17. Gentile, E.; Maio, C.; Romano, A.; Laino, L.; Lucchese, A. The potential role of in vivo optical coherence tomography for evaluating oral soft tissue: A systematic review. J. Oral Pathol. Med. 2017, 46, 864–876. [Google Scholar] [CrossRef] [PubMed]
  18. Matheny, E.S.; Hanna, N.M.; Jung, W.G.; Chen, Z.; Wilder-Smith, P.; Mina-Araghi, R.; Brenner, M. Optical coherence tomography of malignancy in hamster cheek pouches. J. Biomed. Opt. 2004, 9, 978. [Google Scholar] [CrossRef]
  19. Wilder-Smith, P.; Lee, K.; Guo, S.; Zhang, J.; Osann, K.; Chen, Z.; Messadi, D. In vivo diagnosis of oral daysplasia and malignancy using optical coherence tomography: Preliminary studies in 50 Patients. Lasers Surg. Med. 2009, 41, 353–357. [Google Scholar] [CrossRef] [Green Version]
  20. Hamdoon, Z.; Jerjes, W.; Upile, T.; McKenzie, G.; Jay, A.; Hopper, C. Optical coherence tomography in the assessment of suspicious oral lesions: An immediate ex vivo study. Photodiagnosis Photodyn. Ther. 2013, 10, 17–27. [Google Scholar] [CrossRef]
  21. Volgger, V.; Stepp, H.; Ihrler, S.; Kraft, M.; Leunig, A.; Patel, P.M.; Susarla, M.; Jackson, K.; Betz, C.S. Evaluation of optical coherence tomography to discriminate lesions of the upper aerodigestive tract. Head Neck 2012, 35, 1558–1566. [Google Scholar] [CrossRef]
  22. Tsai, M.T.; Lee, C.K.; Lee, H.C.; Wang, Y.M.; Yang, C.C.; Chiang, C.P. Effective indicators for oral cancer diagnosis based on optical coherence tomography. Opt. Infobase Conf. Pap. 2008, 16, 15847–15862. [Google Scholar] [CrossRef]
  23. Tsai, M.T.; Lee, C.K.; Lee, H.C.; Chen, H.M.; Chiang, C.P.; Wang, Y.M.; Yang, C.C. Differentiating oral lesions in different carcinogenesis stages with optical coherence tomography. J. Biomed. Opt. 2009, 14, 044028. [Google Scholar] [CrossRef] [Green Version]
  24. Lee, C.K.; Chi, T.T.; Wu, C.T.; Tsai, M.T.; Chiang, C.P.; Yang, C.C.C.C. Diagnosis of oral precancer with optical coherence tomography. Biomed. Opt. Express 2012, 3, 1632. [Google Scholar] [CrossRef] [PubMed]
  25. Prestin, S.; Rothschild, S.I.; Betz, C.S.; Kraft, M. Measurement of epithelial thickness within the oral cavity using optical coherence tomography. Head Neck 2012, 34, 1777–1781. [Google Scholar] [CrossRef] [PubMed]
  26. Ridgeway, J.M.; Armstrong, W.B.; Guo, S.; Mahmood, U.; Su, J.; Jackson, R.P.; Shibuya, T.; Crumley, R.L.; Gu, M.; Chen, Z.; et al. In vivo optical coherence tomography of the human oral cavity and oropharynx. Arch. Otolaryngol.—Head Neck Surg. 2006, 132, 1074–1081. [Google Scholar] [CrossRef] [PubMed] [Green Version]
  27. Di Stasio, D.; Lauritano, D.; Iquebal, H.; Romano, A.; Gentile, E.; Lucchese, A. Measurement of oral epithelial thickness by optical coherence tomography. Diagnostics 2019, 9, 90. [Google Scholar] [CrossRef] [PubMed] [Green Version]
  28. Pande, P.; Shrestha, S.; Park, J.; Serafino, M.J.; Gimenez-Conti, I.; Brandon, J.; Cheng, Y.S.; Applegate, B.E.; Jo, J.A. Automated classification of optical coherence tomography images for the diagnosis of oral malignancy in the hamster cheek pouch. J. Biomed. Opt. 2014, 19, 086022. [Google Scholar] [CrossRef] [Green Version]
  29. Goldan, R.N.; Lee, A.; Cahill, L.C.; Liu, K.Y.; MacAulay, C.E.; Poh, C.F.; Lane, P.M. Automated Segmentation of Oral Mucosa from Wide-Field OCT Images (Conference Presentation). In Advanced Biomedical and Clinical Diagnostic and Surgical Guidance Systems XIV; International Society for Optics and Photonics: Bellingham, WA, USA, 2016; p. 25. [Google Scholar] [CrossRef]
  30. Wei, W.; Choi, W.J.; Wank, R.K. Microvascular imaging and monitoring of human oral cavity lesions in vivo by swept-source OCT based angiography. Lasers Med Sci. 2018, 33, 123–134. [Google Scholar] [CrossRef]
  31. de Boer, J.F.; Hitzenberger, C.K.; Yasuno, Y. Polarization sensitive optical coherence tomography—A review [Invited]. Biomed. Opt. Express 2017, 8, 1838–1873. [Google Scholar] [CrossRef] [Green Version]
  32. Walther, J.; Golde, J.; Kirsten, L.; Tetschke, F.; Hempel, F.; Rosenauer, T.; Hannig, C.; Koch, E. In vivo imaging of human oral hard and soft tissues by polarization-sensitive optical coherence tomography. J. Biomed. Opt. 2017, 22, 1–17. [Google Scholar] [CrossRef] [Green Version]
  33. Walther, J.; Li, Q.; Villiger, M.; Farah, C.S.; Koch, E.; Karnowski, K.; Sampson, D.D. Depth-resolved birefringence imaging of collagen fiber organization in the human oral mucosa in vivo. Biomed. Opt. Express 2019, 10, 1942. [Google Scholar] [CrossRef] [PubMed]
  34. Burger, M.; Brönstrup, A.; Pietrzik, K. Derivation of tolerable upper alcohol intake levels in Germany: A systematic review of risks and benefits of moderate alcohol consumption. Prev. Med. 2004, 39, 111–127. [Google Scholar] [CrossRef]
  35. Hashibe, M.; Brennan, P.; Benhamou, S.; Castellsague, X.; Chen, C.; Curado, M.P.; Maso, L.D.; Daudt, A.W.; Fabianova, E.; Wünsch-Filho, V.; et al. Alcohol drinking in never users of tobacco, cigarette smoking in never drinkers, and the risk of head and neck cancer: Pooled analysis in the international head and neck cancer epidemiology consortium. J. Natl. Cancer Inst. 2007, 99, 777–789. [Google Scholar] [CrossRef] [PubMed]
  36. Walther, J.; Schnabel, C.; Tetschke, F.; Rosenauer, T.; Golde, J.; Ebert, N.; Baumann, M.; Hannig, C.; Koch, E. In vivo imaging in the oral cavity by endoscopic optical coherence tomography. J. Biomed. Opt. 2018, 23, 071207. [Google Scholar] [CrossRef] [Green Version]
  37. Walther, J.; Krüger, A.; Cuevas, M.; Koch, E. Effects of axial, transverse, and oblique sample motion in FD OCT in systems with global or rolling shutter line detector. J. Opt. Soc. Am. 2008, 25, 2791. [Google Scholar] [CrossRef]
  38. Abràmoff, M.D.; Magalhães, P.J.; Ram, S.J. Image processing with imageJ. Biophotonics Int. 2004, 11, 36–41. [Google Scholar] [CrossRef]
  39. Curl, C.L.; Bellair, C.J.; Harris, T.; Allman, B.E.; Harris, P.J.; Stewart, A.G.; Roberts, A.; Nugent, K.A.; Delbridge, L.M. Refractive index measurement in viable cells using quantitative phase-amplitude microscopy and confocal microscopy. Cytom. Part A 2005, 65, 88–92. [Google Scholar] [CrossRef]
  40. Tsai, M.T.; Chen, Y.; Lee, C.Y.; Huang, B.H.; Trung, N.H.; Lee, Y.J.; Wang, Y.L. Noninvasive structural and microvascular anatomy of oral mucosae using handheld optical coherence tomography. Biomed. Opt. Express 2017, 8, 5001–5012. [Google Scholar] [CrossRef] [Green Version]
  41. Maslennikova, A.V.; Sirotkina, M.A.; Moiseev, A.A.; Finagina, E.S.; Ksenofontov, S.Y.; Gelikonov, G.V.; Matveev, L.A.; Kiseleva, E.B.; Zaitsev, V.Y.; Zagaynova, E.V.; et al. In-vivo longitudinal imaging of microvascular changes in irradiated oral mucosa of radiotherapy cancer patients using optical coherence tomography. Sci. Rep. 2017, 7, 16505. [Google Scholar] [CrossRef] [PubMed]
  42. Grulkowski, I.; Nowak, J.K.; Karnowski, K.; Zebryk, P.; Puszczewicz, M.; Walkowiak, J.; Wojtkowski, M. Quantitative assessment of oral mucosa and labial minor salivary glands in patients with Sjögren’s syndrome using swept source OCT. Biomed. Opt. Express 2014, 5, 259–274. [Google Scholar] [CrossRef] [PubMed] [Green Version]
  43. Pahlevaninezhad, H.; Lee, A.M.; Rosin, M.; Sun, I.; Zhang, L.; Hakimi, M.; MacAulay, C.; Lane, P.M. Optical coherence tomography and autofluorescence imaging of human tonsil. PLoS ONE 2014, 9, e115889. [Google Scholar] [CrossRef] [PubMed] [Green Version]
  44. Institute of Anatomy, Faculty of Medicine, Technische Universitaet Dresden. Virtual Database—Histological Cross Sections of the Healthy Human Oral Mucosa; Institute of Anatomy, Faculty of Medicine, Technische Universitaet Dresden: Dresden, Germany, 2020. [Google Scholar]
  45. Otis, L.L.; Piao, D.; Gibson, C.W.; Zhu, Q. Quantifying labial blood flow using optical Doppler tomography. Oral Surg. Oral Med. Oral Pathol. Oral Radiol. Endodontol. 2004, 98, 189–194. [Google Scholar] [CrossRef]
  46. Squier, C.; Brogden, K.A. Human Oral Mucosa—Development, Structure & Function; John Wiley & Sons, Ltd.: Hoboken, NJ, USA, 2011. [Google Scholar] [CrossRef]
  47. Kessler, A.T.; Bhatt, A.A. Review of the Major and Minor Salivary Glands, Part 1: Anatomy, Infectious, and Inflammatory Processes. J. Clin. Imaging Sci. 2018, 8, 47. [Google Scholar] [CrossRef] [PubMed]
  48. Lee, Y.J.; Kwon, Y.H.; Park, J.B.; Herr, Y.; Shin, S.I.; Heo, S.J.; Chung, J.H. Epithelial Thickness of the Palatal Mucosa: A Histomorphometric Study in Koreans. Anat. Rec. 2010, 293, 1966–1970. [Google Scholar] [CrossRef] [PubMed]
  49. Harada, K. The histopathological study of human palatine tonsils—Especially age changes. Nihon Jibiinkoka Gakkai Kaiho 1989, 92, 1049–1064. [Google Scholar] [CrossRef] [PubMed] [Green Version]
  50. Pai, S.I.; Westra, W.H. Molecular Pathology of Head and Neck Cancer: Implications for Diagnosis, Prognosis, and Treatment. Annu. Rev. Pathol. 2009, 4, 49–70. [Google Scholar] [CrossRef] [Green Version]
  51. Landay, M.A.; Schroeder, H.E. Quantitative electron microscopic analysis of the stratified epithelium of normal human buccal mucosa. Cell Tissue Res. 1977, 177, 383–405. [Google Scholar] [CrossRef]
  52. Singhal, P.; Singh, N.N.; Sreedhar, G.; Banerjee, S.; Batra, M.; Garg, A. Evaluation of histomorphometric changes in tissue architecture in relation to alteration in fixation protocol—An invitro study. J. Clin. Diagn. Res. 2016, 10, ZC28–ZC32. [Google Scholar] [CrossRef]
  53. Hand, A.R.; Pathmanathan, D.; Field, R.B. Morphological features of the minor salivary glands. Arch. Oral Biol. 1999, 44, S3–S10. [Google Scholar] [CrossRef]
Figure 1. Schematic illustration of the human oral cavity with seven investigation areas (colored zones) and selected measurement points (red dots) in consideration of common sites of oral cancer.
Diagnostics 10 00827 g001
Figure 2. Representative OCT images of the sublingual mucosa (a), the hard palate (b) and the labial mucosa (c) demonstrating the principle of the visual image analysis. EP: epithelium, BM: basement membrane, LP: lamina propria; Arrows in (b): epithelial surface alteration, Yellow dots: palatal ridges (uneven surface profile), Asterisk: salivary gland opening; Vertical lines in (c): epithelial thickness measurement, Ellipsoidal shapes: marked regions of vascularization. Scale bar: 200 μ m .
Diagnostics 10 00827 g002
Figure 3. Exemplary OCT images of the oropharynx (a) and the palatine tonsil (b). The connective tissue of the oropharynx contains minor salivary glands whereas the palatine tonsil includes multiple lymphoid follicles. EP: epithelium, BM: basement membrane, LP: lamina propria, SG: salivary gland, LF: lymphoid follicle. Scale bar: 200 μ m .
Diagnostics 10 00827 g003
Figure 4. Results of the evaluation of the OCT cross sections within seven oral investigation areas. The image analysis contained the assessment of surface integrity, surface profile, epithelial homogeneity and basement membrane. Percentage values of the qualitative evaluation of the different criteria are presented by the colored bars.
Diagnostics 10 00827 g004
Figure 5. Box plots of the epithelial thickness (age- and gender-independent). The results for all measurement points are presented by colored boxes in accordance with the corresponding investigation areas (cp. Figure 1). The sample median is depicted as central line inside the boxes, the sample mean value corresponds to the cross. The individual mean values are illustrated by circles. The width of the box is equivalent to the interquartile range. Maximum and minimum of the sample are shown by the whiskers.
Diagnostics 10 00827 g005
Figure 6. Box plot of the mean vascular density. Due to the limited penetration depth of the probing light within the buccal region and the hard palate, resulting in the limited visualization of the lamina propria and embedded vessels, reference values for the vascularization by major vessels of both regions could not be provided.
Diagnostics 10 00827 g006
Figure 7. OCT images of the labial mucosa (bf) and the alveolar mucosa (hl). The sample pictures represent the upper (MP1) (b,c) and the lower lip (MP3,MP4) (df) as well as the upper (MP2) (h,i) and lower alveolar region (MP5) (jl). Exemplary HE stained histological cross sections depicting the labial and the alveolar mucosa (a,g) ([44] modified). EP: epithelium, BM: basement membrane, LP: lamina propria. Scale bars: 200 μ m .
Diagnostics 10 00827 g007
Figure 8. OCT images of the buccal mucosa (bf). The sample pictures represent the anterior (MP6) (b,c), the central (MP7) (d) and the posterior buccal region (MP8) (e,f). Exemplary HE stained histological cross sections depicting the buccal mucosa (a) ([44] modified). EP: epithelium, BM: basement membrane, LP: lamina propria; Arrows: epithelial surface alteration, Yellow dots: uneven surface profile. Scale bars: 200 μ m .
Diagnostics 10 00827 g008
Figure 9. OCT images of the ventral tongue (b,c) and the mouth floor (MP11) (df). The sample pictures represent the anterior (MP9) (b) and posterior sublingual region (MP10) (c). Exemplary HE stained histological cross sections depicting the sublingual mucosa (a) ([44] modified). EP: epithelium, BM: basement membrane, LP: lamina propria. Scale bars: 200 μ m .
Diagnostics 10 00827 g009
Figure 10. OCT images of the hard palate (MP12) (b,c), the soft palate (MP13) (e,f), the uvula (MP14) (g), the oropharynx (MP15) (h,i) and the palatine tonsil (MP16) (k,l). Exemplary HE stained histological cross sections depicting the hard palate (a), the soft palate (d) and the palatine tonsil (j) ([44] modified). EP: epithelium, BM: basement membrane, LP: lamina propria, LF: lymphoid follicle; Arrows: epithelial alteration, Yellow dots: palatal ridges and tonsillar crypts. Scale bars: 200 μ m .
Diagnostics 10 00827 g010
Figure 11. Box plot of the gender-specific epithelial thickness of recommended measurement points. The limited selection of distinctive measurement points is conceivable to serve as prospective parameter for assessing oral health. Labial: MP4, Alveolar: MP5, Buccal: MP7, Sublingual: MP9, Hard palate: MP12, Soft palate: MP13, Tonsils: MP16.
Diagnostics 10 00827 g011
Table 1. Criteria of the OCT image analysis.
CriterionEvaluation
Surface integrityintact/with alterations
Surface profileeven/uneven
Epithelial homogeneityhomogeneous/inhomogeneous
Epithelial thicknessmean value of 25 measurements ( μ m )
Basement membraneintact/unsharp/not assessable
Tissue vascularizationlow (<0.10)/moderate (0.10–0.30)/high (>0.30)
Additional componentsDescription of regional features within the lamina propria
Table 2. Statistics on the study population and the amount of the OCT cross sections.
Study PopulationOCT Cross Sections
Nb. of volunteers47Investigation areaNb. of images
Male25 (53.2%)
Female22 (46.8%)Labial mucosa705
Mean age (years)29.36Alveolar mucosa470
<25 years14 (29.8%)Buccal mucosa705
25–45 years30 (63.8%)Sublingual mucosa705
>45 years3 (6.4%)Hard palate235
Oral symptoms/lesions0Soft palate & oropharynx570
Alcohol intake > TL 10Palatine tonsils170
Never drinking19 (40.4%)
Tobacco consumption > TL 10Total3,560
Never smoking20 (42.6%)
1 Tolerance level.
Publisher’s Note: MDPI stays neutral with regard to jurisdictional claims in published maps and institutional affiliations.

