Real-World Experience Measurement of Liver Iron Concentration by R2 vs. R2 Star MRI in Hemoglobinopathies

 , , ,
, , ,
Abstract
:1. Introduction
2. Materials and Methods
2.1. MRI
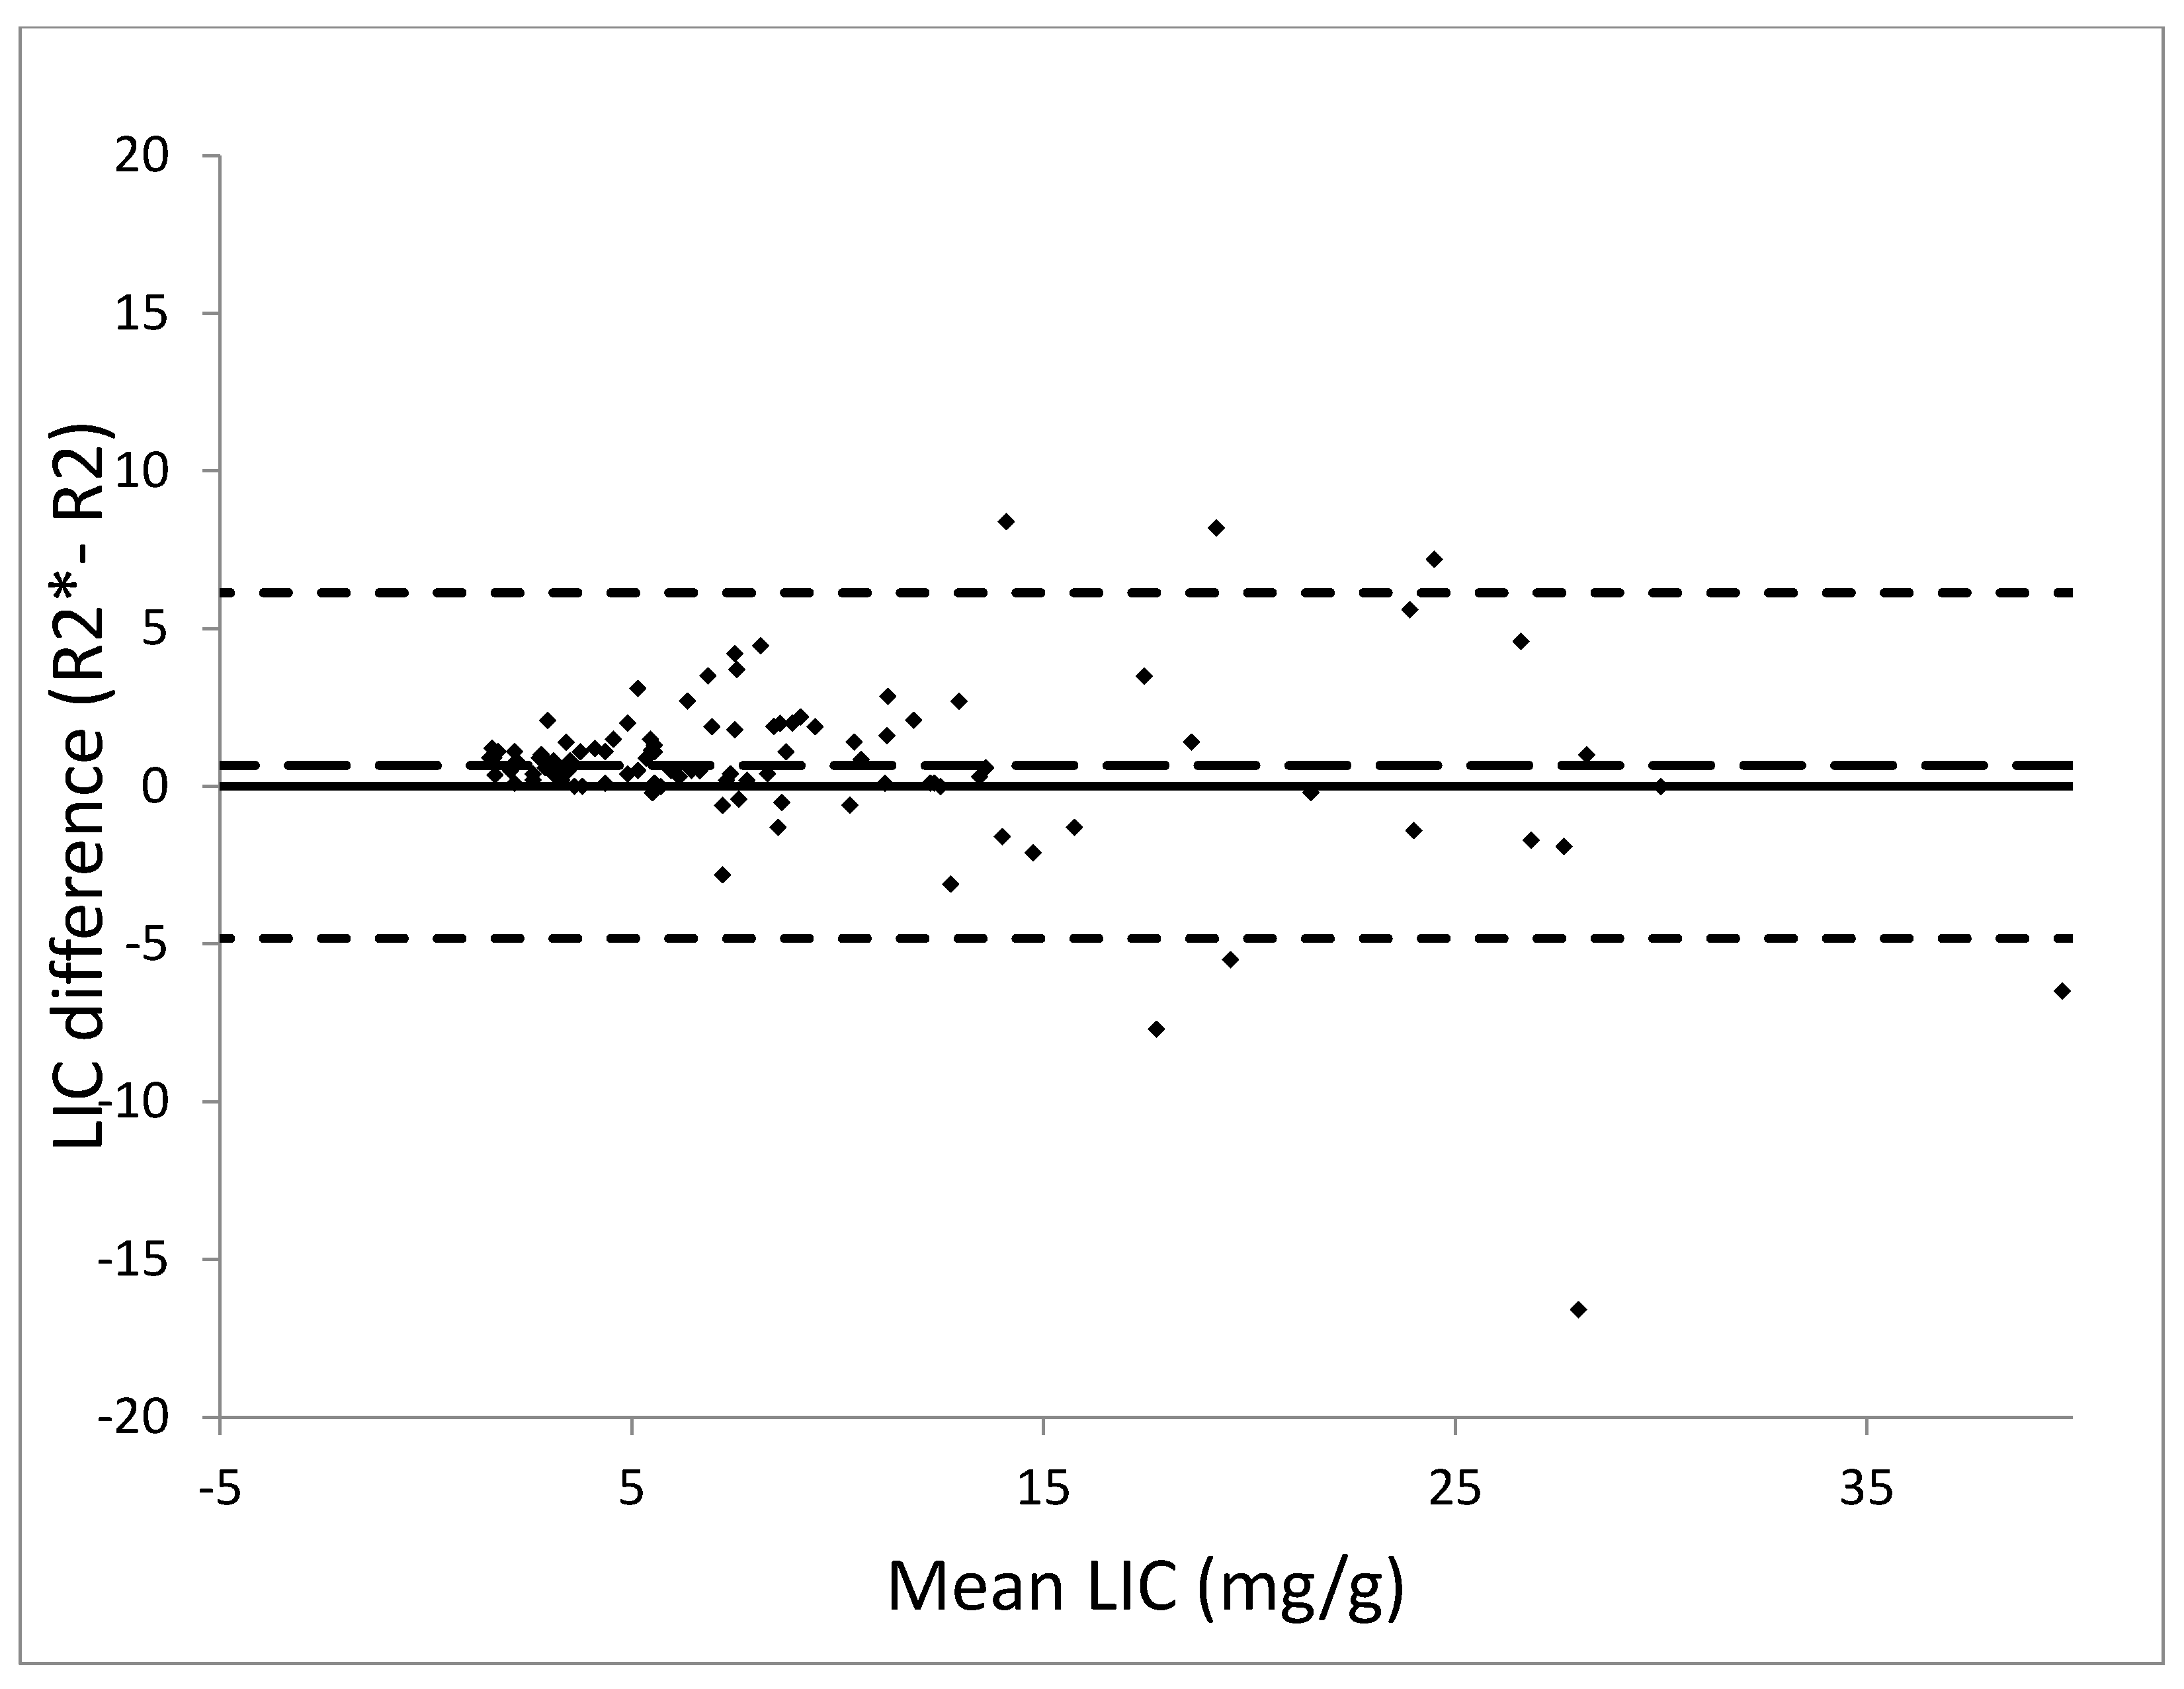
2.2. Analysis
3. Results
4. Discussion
5. Conclusions
Author Contributions
Funding
Conflicts of Interest
Abbreviations
| CI | Confidence interval |
| CMR | Cardiac magnetic resonance |
| CT | Computed tomography |
| ECG | electrocardiogram |
| Fe | iron |
| LIC | Liver iron concentration |
| MRI | Magnetic resonance imaging |
| ROI | Region of interest |
| T | Tesla |
| TR | Repetition time |
References
- Shander, A.; Sazama, K. Clinical consequences of iron overload from chronic red blood cell transfusions, its diagnosis, and its management by chelation therapy. Transfusion 2010, 50, 1144–1155. [Google Scholar] [CrossRef] [PubMed]
- Olivieri, N.F.; Brittenham, G.M. Iron-chelating therapy and the treatment of thalassemia. Blood 1997, 89, 739–761. [Google Scholar] [CrossRef] [PubMed] [Green Version]
- Angelucci, E.; Brittenham, G.M.; McLaren, C.E.; Ripalti, M.; Baronciani, D.; Giardini, C.; Galimberti, M.; Polchi, P.; Lucarelli, G. Hepatic iron concentration and total body iron stores in thalassemia major. N. Engl. J. Med. 2000, 343, 327–331. [Google Scholar] [CrossRef] [PubMed]
- Wood, J.C. Use of magnetic resonance imaging to monitor iron overload. Hematol. Oncol. Clin. N. Am. 2014, 28, 747–764. [Google Scholar] [CrossRef] [PubMed] [Green Version]
- Barry, M.; Sherlock, S. Measurement of liver-iron concentration in needle-biopsy specimens. Lancet 1971, 1, 100–103. [Google Scholar] [CrossRef]
- Emond, M.J.; Bronner, M.P.; Carlson, T.H.; Lin, M.; Labbe, R.F.; Kowdley, K.V. Quantitative study of the variability of hepatic iron concentrations. Clin. Chem. 1999, 45, 340–346. [Google Scholar] [CrossRef] [PubMed] [Green Version]
- Labranche, R.; Gilbert, G.; Cerny, M.; Vu, K.N.; Soulieres, D.; Olivie, D.; Billiard, J.S.; Yokoo, T.; Tang, A. Liver Iron Quantification with MR Imaging: A Primer for Radiologists. Radiographics 2018, 38, 392–412. [Google Scholar] [CrossRef]
- Kirk, P.; He, T.; Anderson, L.J.; Roughton, M.; Tanner, M.A.; Lam, W.W.; Au, W.Y.; Chu, W.C.; Chan, G.; Galanello, R.; et al. International reproducibility of single breathhold T2* MR for cardiac and liver iron assessment among five thalassemia centers. J. Magn. Reson. Imaging 2010, 32, 315–319. [Google Scholar] [CrossRef] [Green Version]
- Wood, J.C.; Zhang, P.; Rienhoff, H.; Abi-Saab, W.; Neufeld, E.J. Liver MRI is more precise than liver biopsy for assessing total body iron balance: A comparison of MRI relaxometry with simulated liver biopsy results. Magn. Reson. Imaging 2015, 33, 761–767. [Google Scholar] [CrossRef]
- Gandon, Y.; Olivie, D.; Guyader, D.; Aube, C.; Oberti, F.; Sebille, V.; Deugnier, Y. Non-invasive assessment of hepatic iron stores by MRI. Lancet 2004, 363, 357–362. [Google Scholar] [CrossRef]
- Henninger, B.; Alustiza, J.; Garbowski, M.; Gandon, Y. Practical guide to quantification of hepatic iron with MRI. Eur. Radiol. 2019, 30, 383–393. [Google Scholar] [CrossRef] [PubMed] [Green Version]
- St Pierre, T.G.; Clark, P.R.; Chua-anusorn, W.; Fleming, A.J.; Jeffrey, G.P.; Olynyk, J.K.; Pootrakul, P.; Robins, E.; Lindeman, R. Noninvasive measurement and imaging of liver iron concentrations using proton magnetic resonance. Blood 2005, 105, 855–861. [Google Scholar] [CrossRef] [PubMed]
- St Pierre, T.G.; El-Beshlawy, A.; Elalfy, M.; Al Jefri, A.; Al Zir, K.; Daar, S.; Habr, D.; Kriemler-Krahn, U.; Taher, A. Multicenter validation of spin-density projection-assisted R2-MRI for the noninvasive measurement of liver iron concentration. Magn. Reson. Med. 2014, 71, 2215–2223. [Google Scholar] [CrossRef] [PubMed] [Green Version]
- Wood, J.C.; Enriquez, C.; Ghugre, N.; Tyzka, J.M.; Carson, S.; Nelson, M.D.; Coates, T.D. MRI R2 and R2* mapping accurately estimates hepatic iron concentration in transfusion-dependent thalassemia and sickle cell disease patients. Blood 2005, 106, 1460–1465. [Google Scholar] [CrossRef] [Green Version]
- Serai, S.D.; Fleck, R.J.; Quinn, C.T.; Zhang, B.; Podberesky, D.J. Retrospective comparison of gradient recalled echo R2* and spin-echo R2 magnetic resonance analysis methods for estimating liver iron content in children and adolescents. Pediatr. Radiol. 2015, 45, 1629–1634. [Google Scholar] [CrossRef]
- Pepe, A.; Positano, V.; Santarelli, M.F.; Sorrentino, F.; Cracolici, E.; De Marchi, D.; Maggio, A.; Midiri, M.; Landini, L.; Lombardi, M. Multislice multiecho T2* cardiovascular magnetic resonance for detection of the heterogeneous distribution of myocardial iron overload. J. Magn. Reson. Imaging 2006, 23, 662–668. [Google Scholar] [CrossRef]
- Bland, J.M.; Altman, D.G. Statistical methods for assessing agreement between two methods of clinical measurement. Lancet 1986, 1, 307–310. [Google Scholar] [CrossRef]
- Kirk, P.; Roughton, M.; Porter, J.B.; Walker, J.M.; Tanner, M.A.; Patel, J.; Wu, D.; Taylor, J.; Westwood, M.A.; Anderson, L.J.; et al. Cardiac T2* magnetic resonance for prediction of cardiac complications in thalassemia major. Circulation 2009, 120, 1961–1968. [Google Scholar] [CrossRef] [Green Version]
- Wood, J.C.; Pressel, S.; Rogers, Z.R.; Odame, I.; Kwiatkowski, J.L.; Lee, M.T.; Owen, W.C.; Cohen, A.R.; St Pierre, T.; Heeney, M.M.; et al. Liver iron concentration measurements by MRI in chronically transfused children with sickle cell anemia: Baseline results from the TWiTCH trial. Am. J. Hematol. 2015, 90, 806–810. [Google Scholar] [CrossRef] [Green Version]
- Garbowski, M.W.; Carpenter, J.P.; Smith, G.; Roughton, M.; Alam, M.H.; He, T.; Pennell, D.J.; Porter, J.B. Biopsy-based calibration of T2* magnetic resonance for estimation of liver iron concentration and comparison with R2 Ferriscan. J. Cardiovasc. Magn. Reson. 2014, 16, 40. [Google Scholar] [CrossRef]
- McCarville, M.B.; Hillenbrand, C.M.; Loeffler, R.B.; Smeltzer, M.P.; Song, R.; Li, C.S.; Hankins, J.S. Comparison of whole liver and small region-of-interest measurements of MRI liver R2* in children with iron overload. Pediatr. Radiol. 2010, 40, 1360–1367. [Google Scholar] [CrossRef] [PubMed] [Green Version]
- Ghugre, N.R.; Gonzalez-Gomez, I.; Butensky, E.; Noetzli, L.; Fischer, R.; Williams, R.; Harmatz, P.; Coates, T.D.; Wood, J.C. Patterns of hepatic iron distribution in patients with chronically transfused thalassemia and sickle cell disease. Am. J. Hematol. 2009, 84, 480–483. [Google Scholar] [CrossRef] [PubMed] [Green Version]
- Hankins, J.S.; McCarville, M.B.; Loeffler, R.B.; Smeltzer, M.P.; Onciu, M.; Hoffer, F.A.; Li, C.S.; Wang, W.C.; Ware, R.E.; Hillenbrand, C.M. R2* magnetic resonance imaging of the liver in patients with iron overload. Blood 2009, 113, 4853–4855. [Google Scholar] [CrossRef] [PubMed]
- Ambu, R.; Crisponi, G.; Sciot, R.; Van Eyken, P.; Parodo, G.; Iannelli, S.; Marongiu, F.; Silvagni, R.; Nurchi, V.; Costa, V.; et al. Uneven hepatic iron and phosphorus distribution in beta-thalassemia. J. Hepatol. 1995, 23, 544–549. [Google Scholar] [CrossRef]
- Villeneuve, J.P.; Bilodeau, M.; Lepage, R.; Cote, J.; Lefebvre, M. Variability in hepatic iron concentration measurement from needle-biopsy specimens. J. Hepatol. 1996, 25, 172–177. [Google Scholar] [CrossRef]
- Butensky, E.; Fischer, R.; Hudes, M.; Schumacher, L.; Williams, R.; Moyer, T.P.; Vichinsky, E.; Harmatz, P. Variability in hepatic iron concentration in percutaneous needle biopsy specimens from patients with transfusional hemosiderosis. Am. J. Clin. Pathol. 2005, 123, 146–152. [Google Scholar] [CrossRef]
- Tanimoto, A.; Oshio, K.; Suematsu, M.; Pouliquen, D.; Stark, D.D. Relaxation effects of clustered particles. J. Magn. Reson. Imaging 2001, 14, 72–77. [Google Scholar] [CrossRef]
- Doyle, E.K.; Toy, K.; Valdez, B.; Chia, J.M.; Coates, T.; Wood, J.C. Ultra-short echo time images quantify high liver iron. Magn. Reson. Med. 2018, 79, 1579–1585. [Google Scholar] [CrossRef]
- Serai, S.D.; Laor, T.; Dwek, J.R.; Zbojniewicz, A.M.; Carl, M. Feasibility of ultrashort TE (UTE) imaging of children at 1.5 T. Pediatr. Radiol. 2014, 44, 103–108. [Google Scholar] [CrossRef]
- Anwar, M.; Wood, J.; Manwani, D.; Taragin, B.; Oyeku, S.O.; Peng, Q. Hepatic Iron Quantification on 3 Tesla (3T) Magnetic Resonance (MR): Technical Challenges and Solutions. Radiol. Res. Pract. 2013, 2013, 628150. [Google Scholar]
- Storey, P.; Thompson, A.A.; Carqueville, C.L.; Wood, J.C.; de Freitas, R.A.; Rigsby, C.K. R2* imaging of transfusional iron burden at 3T and comparison with 1.5T. J. Magn. Reson. Imaging 2007, 25, 540–547. [Google Scholar] [CrossRef] [PubMed] [Green Version]
- Wood, J.C.; Tyszka, J.M.; Carson, S.; Nelson, M.D.; Coates, T.D. Myocardial iron loading in transfusion-dependent thalassemia and sickle cell disease. Blood 2004, 103, 1934–1936. [Google Scholar] [CrossRef] [Green Version]
- Aldouri, M.A.; Wonke, B.; Hoffbrand, A.V.; Flynn, D.M.; Ward, S.E.; Agnew, J.E.; Hilson, A.J. High incidence of cardiomyopathy in beta-thalassaemia patients receiving regular transfusion and iron chelation: Reversal by intensified chelation. Acta Haematol. 1990, 84, 113–117. [Google Scholar] [CrossRef] [PubMed]
- Wacker, P.; Halperin, D.S.; Balmer-Ruedin, D.; Oberhansli, I.; Wyss, M. Regression of cardiac insufficiency after ambulatory intravenous deferoxamine in thalassemia major. Chest 1993, 103, 1276–1278. [Google Scholar] [CrossRef] [PubMed] [Green Version]
- Hershko, C.; Link, G.; Cabantchik, I. Pathophysiology of iron overload. Ann. N. Y. Acad. Sci. 1998, 850, 191–201. [Google Scholar] [CrossRef] [PubMed]
- Anderson, L.J.; Holden, S.; Davis, B.; Prescott, E.; Charrier, C.C.; Bunce, N.H.; Firmin, D.N.; Wonke, B.; Porter, J.; Walker, J.M.; et al. Cardiovascular T2-star (T2*) magnetic resonance for the early diagnosis of myocardial iron overload. Eur. Heart J. 2001, 22, 2171–2179. [Google Scholar] [CrossRef] [PubMed] [Green Version]


| Patient Characteristics | Results |
|---|---|
| Total number of patients | 107 |
| Mean age (years) | 12.5 |
| Primary Diagnoses | |
| Sickle cell anemia | 76 |
| Thalassemia | 20 |
| Blackfan Diamond anemia | 2 |
| Acute lymphoblastic leukemia | 8 |
| Wilms tumor | 1 |
© 2020 by the authors. Licensee MDPI, Basel, Switzerland. This article is an open access article distributed under the terms and conditions of the Creative Commons Attribution (CC BY) license (http://creativecommons.org/licenses/by/4.0/).
Share and Cite
Abou Zahr, R.; Burkhardt, B.E.U.; Ehsan, L.; Potersnak, A.; Greil, G.; Dillenbeck, J.; Rogers, Z.; Hussain, T. Real-World Experience Measurement of Liver Iron Concentration by R2 vs. R2 Star MRI in Hemoglobinopathies. Diagnostics 2020, 10, 768. https://doi.org/10.3390/diagnostics10100768
Abou Zahr R, Burkhardt BEU, Ehsan L, Potersnak A, Greil G, Dillenbeck J, Rogers Z, Hussain T. Real-World Experience Measurement of Liver Iron Concentration by R2 vs. R2 Star MRI in Hemoglobinopathies. Diagnostics. 2020; 10(10):768. https://doi.org/10.3390/diagnostics10100768
Chicago/Turabian StyleAbou Zahr, Riad, Barbara E. U. Burkhardt, Lubaina Ehsan, Amanda Potersnak, Gerald Greil, Jeanne Dillenbeck, Zora Rogers, and Tarique Hussain. 2020. "Real-World Experience Measurement of Liver Iron Concentration by R2 vs. R2 Star MRI in Hemoglobinopathies" Diagnostics 10, no. 10: 768. https://doi.org/10.3390/diagnostics10100768