Article

The Panel of 12 Cell-Free MicroRNAs as Potential Biomarkers in Prostate Neoplasms

by
Maria Yu. Konoshenko
1,2,*,
Evgeniy A. Lekchnov
1,2,
Olga E. Bryzgunova
1,2,
Ivan A. Zaporozhchenko
1,2,
Sergey V. Yarmoschuk
2,
Oksana A. Pashkovskaya
2,
Svetlana V. Pak
2 and
Pavel P. Laktionov
1,2
1
Institute of Chemical Biology and Fundamental Medicine SB RAS, 630090 Novosibirsk, Russia
2
E.N. Meshalkin National Medical Research Center of the Ministry of Health of the Russian Federation, 630055 Novosibirsk, Russia
*
Author to whom correspondence should be addressed.
Diagnostics 2020, 10(1), 38; https://doi.org/10.3390/diagnostics10010038
Submission received: 10 December 2019 / Revised: 27 December 2019 / Accepted: 8 January 2020 / Published: 10 January 2020
(This article belongs to the Special Issue Diagnostic Biomarkers in Prostate Cancer 2020)

Abstract

:
Prostate cancer is a global biological, medical, and social issue aggravated by the lack of reliable, highly specific, and sensitive non-invasive tests for diagnosis and staging of prostate cancer. One prospective source of biomarkers are the cell-free miRNAs present in various biological fluids. In the present study, we validated the diagnostic potential of cell-free miRNAs: miR-19b, miR-22, miR-92a, miR-378, miR-425, miR-30e, miR-31, miR-125b, miR-200b, miR-205, miR-375, and miR-660; we estimated the required sample size and the minimal miRNA set for a subsequent large-scale validation study. Relative expression of 12 miRNA combined in 31 ratios was investigated in three fractions of biological fluids (urine extracellular vesicles, clarified urine, and plasma) obtained from patients with prostate cancer (n = 10), benign prostate hyperplasia (n = 8), and healthy volunteers (n = 11). Eight of the miRNAs found in urine vesicles (miR-19b, miR-30e, miR-31, miR-92a, miR-125, miR-200, miR-205, and miR-660) showed great promise and when combined into six ratios (miR-125b/miR-30e, miR-200/miR-30e, miR-205/miR-30e, miR-31/miR-30e, miR-660/miR-30e, and miR-19b/miR-92a) could classify patients with prostate cancer, benign prostate hyperplasia, and healthy donors with 100% specificity, 100% sensitivity, and with a high degree of reliability for most donors.

Graphical Abstract

1. Introduction

Prostate cancer (PCa) is the second most common cancer with a predicted further increase in incidence over the following years and the fifth leading cause of cancer-related deaths in men, thus presenting a significant biological, medical, and social problem [1,2]. Serum prostate-specific antigen (PSA), digital rectal examination (DRE), and transrectal ultrasound (TRUS) followed by ultrasound-guided biopsy of the prostate constitute the foundation of modern clinical diagnosis for PCa. However, the sensitivity and the specificity of these methods are insufficient for effective detection and monitoring of PCa [3]. Moreover, the United States Preventive Services Task Force (USPSTF) has repeatedly issued recommendations against widespread use of PSA as a screening marker due to overdiagnosis and uncertain impact on patients’ survival. Despite the contradicting view of the European Association of Urology (uroweb.org/guideline/prostate-cancer/#5), low specificity of PSA calls for a reliable, highly specific, and sensitive alternative for diagnosis and staging of PCa. There is a special demand for low cost, simple, and minimally invasive screening tests to facilitate early detection and tumor monitoring after therapy without added health risks and overdiagnosis. Liquid biopsy based on detection of cell-free miRNA is a fast-evolving field with the potential to be successfully used in clinical cancer diagnostics. Many miRNAs are known to be involved in oncogenesis, tumor progression, and metastasis by targeting tumor suppressors, oncogenes, or other proteins associated with disease progression or drug resistance [4,5,6,7,8]. Differential expression of miRNAs in biological fluids of patients with different cancers and healthy donors has been previously reported by many groups [7,9,10,11,12,13,14,15]. Other reports also showed extracellular vesicles (EVs) and cell-free nucleoprotein complexes carry distinct populations of miRNA, and the content of these miRNA pools can be used to develop promising tools for PCa screening [16,17]. We recently analyzed the expression of 84 miRNAs in paired samples of urine EVs and cell-free urine supernatant from healthy donors as well as patients with benign and malignant prostate tumors and revealed sets of miRNAs differentially expressed between PCa and control groups [3]. Based on these results, we designed an algorithm comprising 17 analytical systems that allowed for PCa detection with 97.5% accuracy [18].
Here, we aim to validate candidate biomarker miRNAs selected from our previous data [3,18] in blood plasma, clarified urine, and urine EVs by quantitative reverse transcription PCR (qRT-PCR) in order to define the minimal set of miRNA markers and estimate the required sample size for subsequent large-scale validation study.

2. Results

Based on previous data obtained by profiling of miRNA expression using LNA-based RT-PCR arrays (miRCURY LNA miRNA qPCR, Exiqon, Denmark) in paired samples of urine EVs and cell-free urine supernatant, we identified 12 candidate miRNA biomarkers of PCa [3,18]. For all miRNAs, qRT-PCR assays with a working range of 24–38 threshold cycles (Ct) of PCR were designed. Non-template controls produced no signal or were at least seven cycles away from the minimum detectable amount of specific template. All reported data were obtained using RNA samples that produced Ct values within the working range of the systems. Spike-in control (cel-miR-39) was detected in all samples at 25 ± 1 Ct.
Table 1 and Table 2 demonstrate the results of comparative expression analysis for miRNA ratios based on the difference of Ct difference (dCt) values (ddCt) or dddCt values in the respective categories. Only statistically significant differences are shown. There were no significant intergroup differences of miRNA ratios in blood plasma. Expression of 15 miRNA ratios (12 miRNA) in at least one fraction of the included biological fluids allowed differentiating between healthy men and PCa patients [Table 2.1; PCa vs. healthy male donors (HD)]. Among these ratios, 14 were detected in urine EVs and one in urine supernatant. Levels of 20 miRNA ratios (10 miRNAs) could differentiate between PCa and benign prostatic hyperplasia (BPH) patients. These miRNA ratios were found in urine EVs (14 ratios) and urine supernatant (nine ratios). Of particular interest were the 10 miRNA ratios for which dCt values for HD and BPH groups were both located above or below those for PCa patients (i.e., dCt values had the same sign). This common directionality of differences in PCa comparisons with HD and BPH suggests they can potentially differentiate malignant from benign or absence of disease (Table 1, highlighted in yellow). Finally, 15 miRNA ratios were different between BPH patients and healthy volunteers, including 15 ratios from urine EVs and two from urine supernatant. For five miRNA ratios, the difference between HD and PCa or BPH had the same direction (Table 1, highlighted by bold). Considering statistical distribution of the data, the minimal sample size to confirm these differences at 95% significance and power did not exceed 18 participants per group, increasing to 35 per group at 99% significance.
Study of miRNA representation revealed 20 miRNA ratios with significant differences in ddCt values for any two sample types between PCa patents and healthy men (Table 2), including 16 ratios differently distributed between urine EVs and supernatant, and one and 15 ratios for comparisons of urine EVs and urine supernatant with plasma, respectively. Similarly, 15 miRNA ratios were differently distributed between PCa and BPH patients (13 for urine EVs–urine supernatant, none for urine supernatant-blood plasma, 11 for urine EVs–blood plasma). Common directionality of differences in PCa comparisons with HD and BPH was found for 21 dddCt values (Table 2, highlighted by bold). Distribution of nine miRNA ratios for urine EVs–blood plasma was significantly different between BPH patients and healthy men patients. Twenty-one miRNA ratios for PCa–HD and PCa–BPH comparisons had the same sign of the difference in distribution, while for HD–PCa and HD–BPH comparisons, the number of ratios with identical signs was only seven. Two miRNA ratios were differently distributed between all three groups in a progressive manner—miR-miR-31/miR-30e, and miR-200b/miR-30e for urine EVs and blood plasma (Table 2). Notably, the selection of differently distributed ratios was not identical to differently expressed miRNA ratios in any of the sample types.
Minimal sample size required for verification of these data (Table 2) was no more than 35 at 95% significance and power, and 40 per group at 99% significance (with the exception of miR-660/miR-375 ratio, which would require 75 participants per group).
The receiving operator characteristic (ROC) curve analysis was used to measure the diagnostic performance of miRNA ratios in the donor classification. Table 3 and Table 4 show sensitivity at 100% specificity for discrimination of PCa patients from control group (BPH+HD) and pairwise classification of PCa from HD, PCa from BPH, and BPH from HD, respectively.
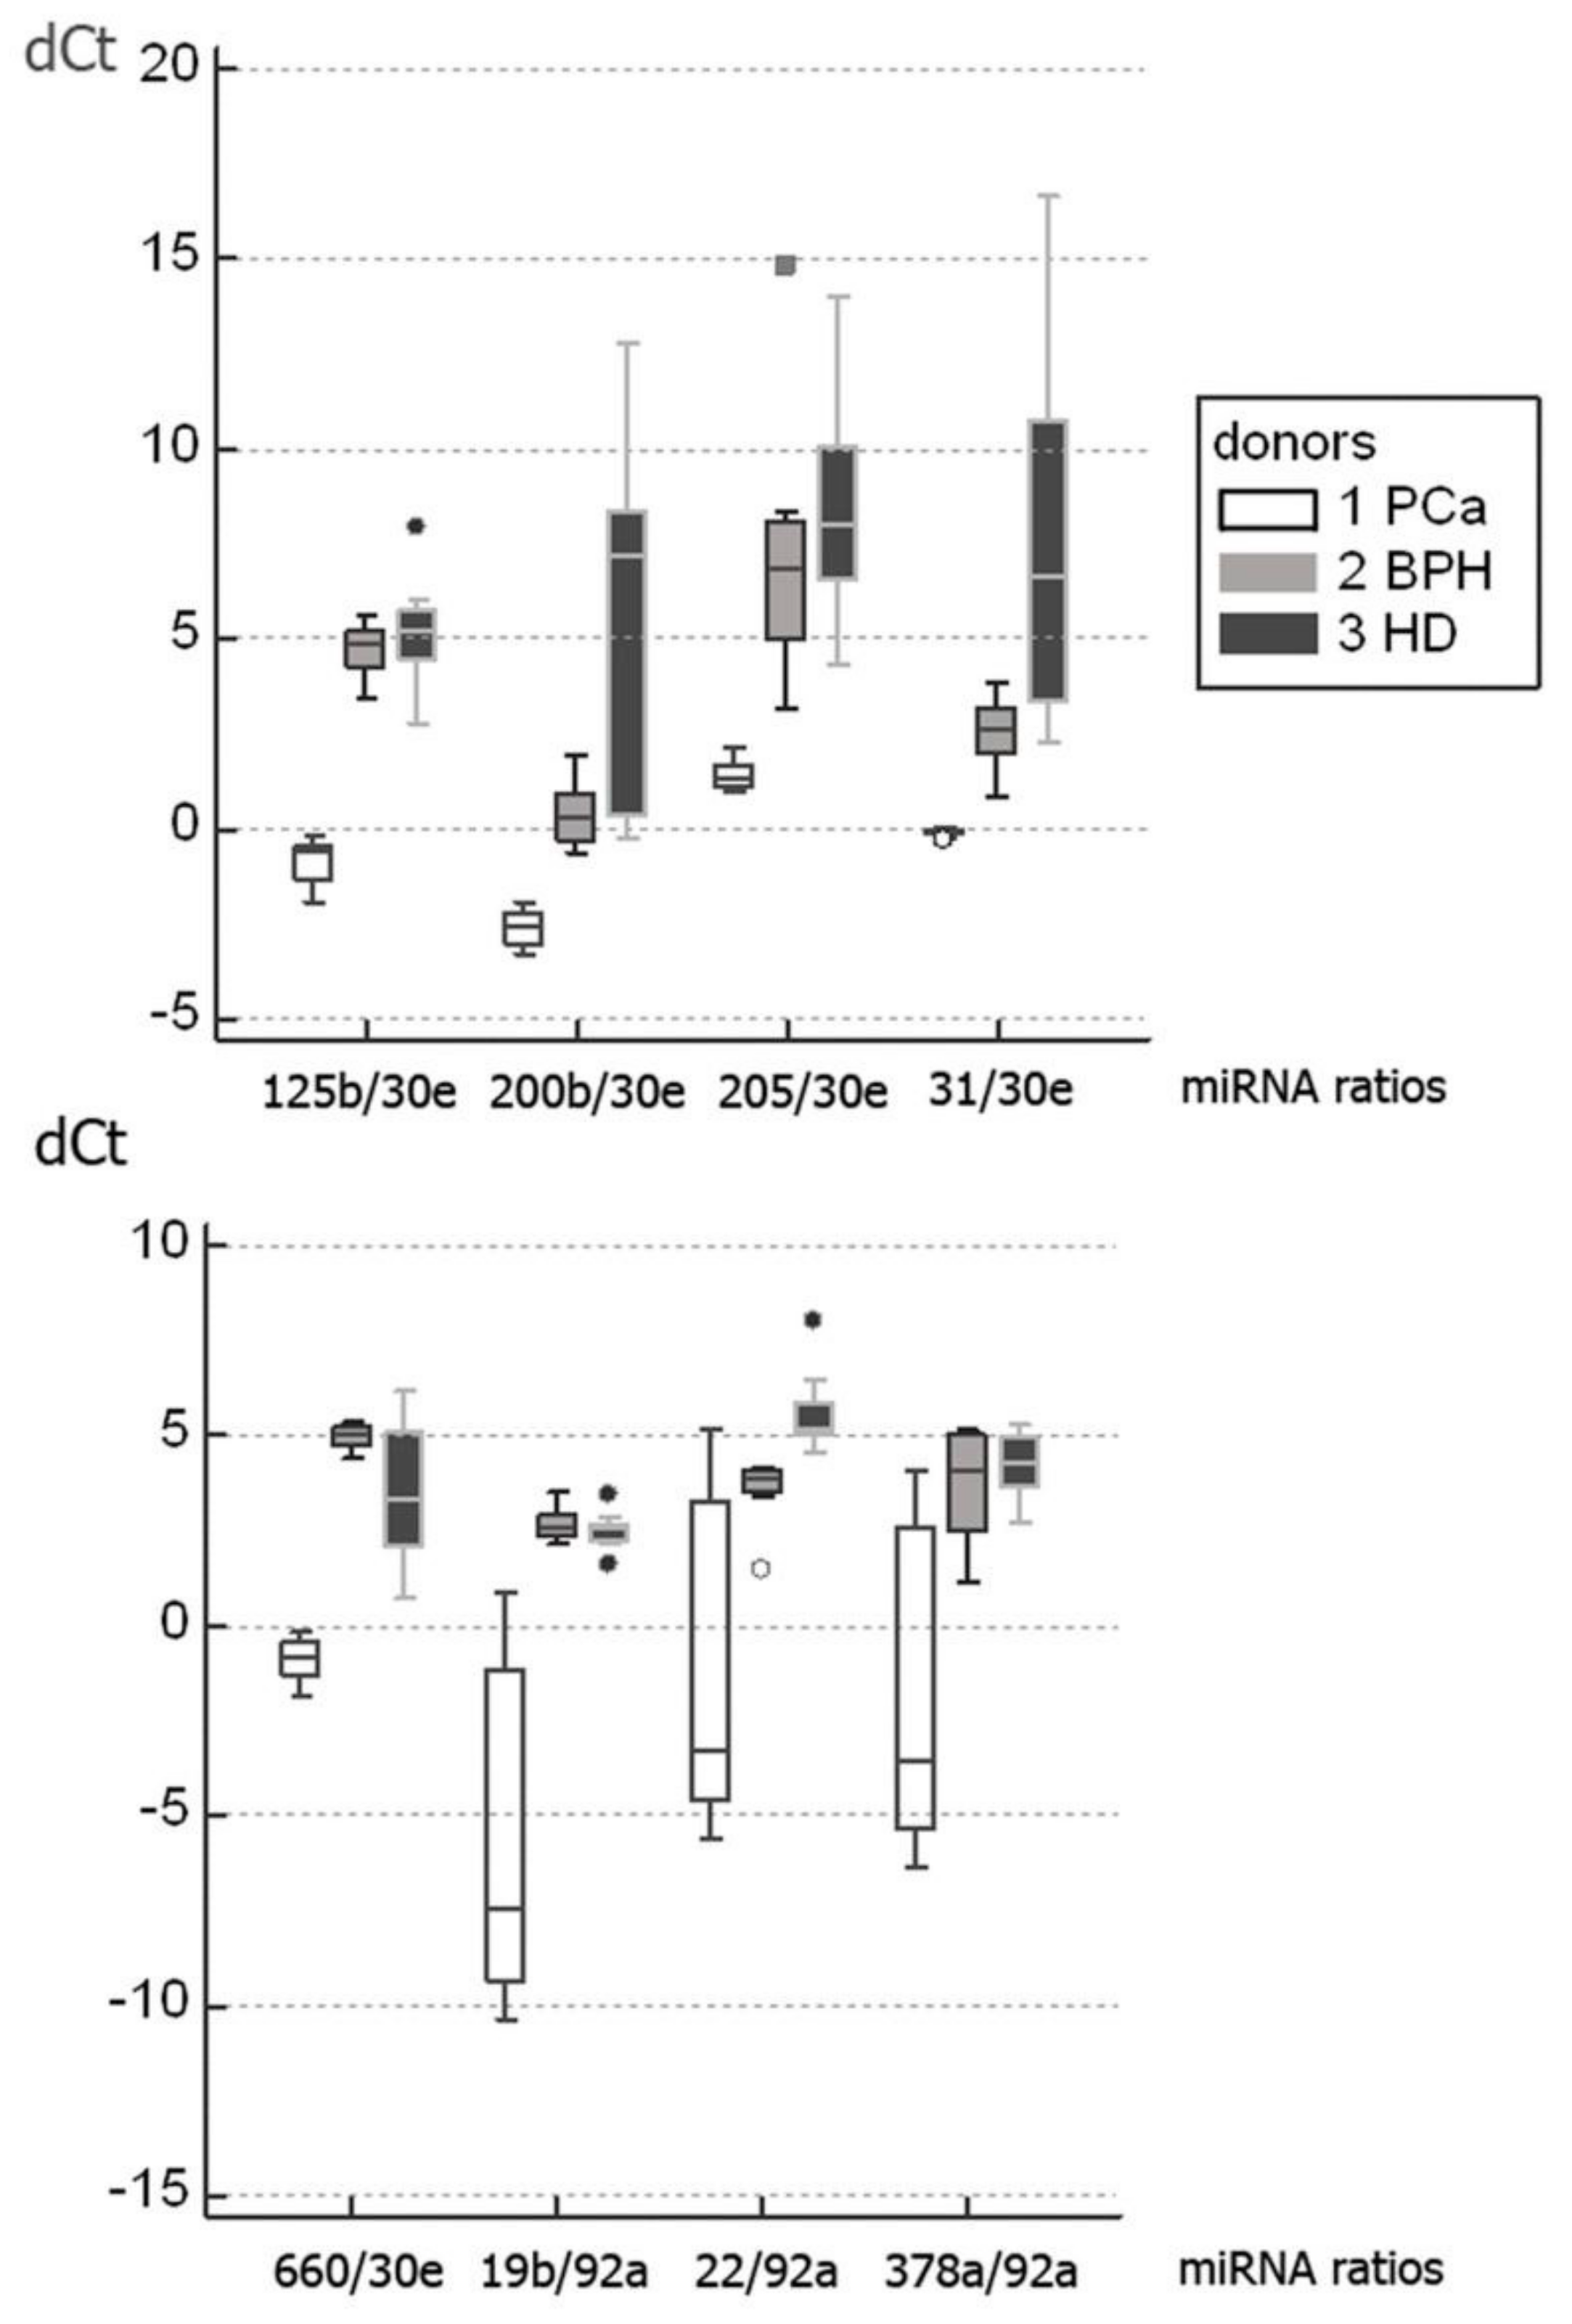
The miRNAs isolated from urine EVs demonstrated the highest diagnostic value (Table 3, Table 4 and Table 5) with six miRNA ratios (miR-125/miR-30e, miR-200/miR-30e, miR-205/miR-30e, miR-31/miR-30e, miR-660/miR-30e, and miR-19b/miR-92a) allowing discrimination of PCa patients from the combined control group of healthy donors and BPH patients with 100% sensitivity and 100% specificity (Table 3). Figure 1 demonstrates the dCt values for these miRNA ratios.
Four additional ratios could discriminate PCa patients and the control group with sensitivity between 80% and 100% at absolute specificity: miR-375/miR-30e, miR-22/miR-19b, miR-378a/miR-19b, and miR-425/miR-92a [area under the curve (AUC) = 0.90, 0.86, 0.98, 0.99, respectively] (Table 3). Analysis of distribution between different fractions could increase the sensitivity of classification, as shown for miR-22/miR-19, miR-378/miR-19, and miR-425/miR-92 (Table 3). In several cases, classification made on the basis of miRNA ratio distribution achieved absolute sensitivity and specificity—for example, in miR-30/31, miR-19/92, and miR-125/30—however, in all of these cases, expression of miRNA ratio in urine EVs alone yielded the same classification efficiency (Table 3).
Discrimination of PCa patients and healthy men with 100% sensitivity and 100% specificity could be achieved with miR-125/miR-30, miR-200/miR-30, miR-205/miR-30, miR-31/miR-30, and miR-19/miR-92 in urine EVs and miR-22/miR-92 for ddCt urine EVs–blood plasma (Table 4). Three more miRNA pairs discriminated PCa and HD with 100% specificity and sensitivity 80% or 90%: miR-378/miR-19, miR-425/miR-92 (AUC = 0.97, 0.99, respectively; urine EVs), and miR-22/miR-19 (AUC = 0.92, ddCt urine supernatant–blood plasma) (Table 4).
The following miRNA ratios were effective in the discriminating PCa from BPH: miR-125/miR-30, miR-125/miR-31, miR-200/miR-125, miR-200/miR-30, miR-205/miR-30, miR-31/miR-30, miR-660/miR-200, miR-660/miR-30, miR-660/miR-31, miR-19/miR-92, miR-22/miR-19, miR-378/miR-19, and miR-425/miR-19 in urine EVs and miR-375/miR-200 in ddCt urine EVs–blood plasma with 100% sensitivity and 100% specificity (Table 5). Five additional ratios achieved lower sensitivity (80–100%) in classifying PCa and BPH patients: miR-22/miR-425 (AUC = 0.91; urine EVs), miR-425/miR-92 (AUC = 0.94, ddCt urine EVs–blood plasma) miR-375/miR-30, miR-660/miR-375, and miR-660/miR-125 (AUC = 0.84, 0.98, 0.89, respectively; ddCt urine EVs–urine supernatant) (Table 5).
Only the miR-22/miR-92a ratio measured in urine EVs could discriminate BPH patients from healthy men with 100% sensitivity and 100% specificity (Table 6). Three ratios demonstrated lower sensitivity (80–100%): miR-125/miR-30e, miR-200/miR-125 (AUC = 0.89; 0.91; urine supernatant), and miR-200/miR-30e (AUC = 0.99, ddCt urine EVs–blood plasma) (Table 6).
To select the most diagnostically efficient miRNA pairs, we used a modification of the algorithm described earlier [18]. Here, we followed only the first two steps for miRNAs ratios with the highest sensitivity in previous assays (50% or higher sensitivity of discrimination between case and control groups) to obtain an overlapping diagnostic system with maximum stability:
Step 1. Data are divided into case and control groups. If normality of distribution is confirmed, mean and standard deviation (SD) for the control group are calculated; if normality is rejected, median, 5% and 95% quantiles (Q5, Q95) are calculated instead. This is done for all candidate biomarkers.
Step 2. Set cut-off values to [mean + 2SD] or [mean − 2SD] calculated from control group. If the mean value in the case group is smaller than in the control group, −2SD is used, otherwise +2SD is used. Patients with values above [mean + 2SD] or below [mean − 2SD] are considered positive for tested condition based on that biomarker.
Here, normality was confirmed for all candidates, thus mean and SD values were used to generate cut-offs. Table 7, Table 8, Table 9 and Table 10 show the percentage of cases correctly classified from the control group by every miRNA ratio using this approach. Each of the PCa patients could be discriminated from the control group (HD+BPH) based on 7–21 dCt or ddCt of miRNA ratios. In total, 11 miRNAs could be used to separate these groups (Table 7).
In the reverse situation, each of the donors in the combined non-cancer group (HD+BPH) was discriminated from the control group (PCa patients) based on 14–23 dCt or ddCt of miRNA ratios. To discriminate the groups in such a manner, 12 miRNAs were used (Table 8).
All PCa patients and all but one BPH patient were discriminated from healthy donors based on 2–14 dCt or ddCt of miRNA ratios. The remaining BPH patient could only be classified using ddCt of miR-22/miR-92a between urine EVs and blood plasma. To completely separate these groups, 10 miRNAs were used (Table 9).
In the final assay, healthy donors could be discriminated from the control group of PCa and BPH patients based on 5–9 dCt or ddCt of miRNA ratios. One healthy donor could not be correctly classified by any of the ratios in any sample type. The inclusion of miR-375/miR-30e ddCt between urine EVs and blood plasma allowed discriminating this donor correctly. A total of six miRNAs were required to discriminate the groups (Table 10).
Correlation of miRNA ratio expression levels with clinical and demographic parameters [tumor size (TNM), Gleason score, blood PSA, and age] was examined. No correlations (k >= 0.6) between donor characteristics and miRNA ratio levels in urine supernatant or blood plasma were found. Strong correlation between levels of miR-19b/miR-92a (k = −0.76), miR-22/miR-92a (k = −0.73), miR-378/miR-92a (k = −0.76), miR-425/miR-92a (k = −0.77), miR-30e/miR-125b (k = 0.78), and miR-205/miR-30e (k = −0.70) in urine EVs and PSA concentration was revealed. These correlations were mostly confounded by the fact that blood PSA was used as one of the criteria when forming the groups. As such, PCa and BPH patients had elevated PSA values, which is not necessarily the case in the general population. Tumor size (T) positively correlated with miR-205/miR-200b ratio in urine EVs (k = 0.79). No meaningful correlation with Gleason’s score was identified for any of the ratios. Notably, none of the miRNA ratios correlated with donor age.

3. Discussion

Here, we investigated relative expression levels of 12 miRNAs assembled into 31 ratios in three fractions of biological fluids (urine EVs, urine supernatant, and plasma) from patients with PCa, BPH, and healthy men. With the exception of miR-378/miR-425, miR-200b/miR-31, miR-205/miR-125b, miR-205/miR-375, and miR-205/miR-660, all ratios were differently expressed between at least one pair of groups in at least one of the fractions (Table 1 and Table 2). Urine EVs were the source of the majority of differentially expressed miRNA ratios. This is in line with the latest trend suggesting EVs as a potent source of biomarkers, such as PCA3 and TMPRSS2:ERG fusion transcripts ([19], for review), including the test widely available in the US, the ExoDx Prostate Intelliscore test, which comprises PCA3, TMPRSS2:ERG, and SPDEF [20]. Alterations of miRNA distribution between urine EVs, supernatant, and plasma were also discovered and were shown to correlate with prostate health (Table 2). This additional data could in several cases increase the diagnostic sensitivity of the system, as illustrated by the distribution of miR-22/miR-19 and miR-378/miR-19 (ddCt, urine EVs, and urine supernatant) (Table 3). The results obtained are consistent with our previous reports [3,18].
One major difficulty in PCa diagnostics is discriminating malignant and benign prostate tumors. Pca and BPH foci can co-exist in the same patient, and the difference in miRNA expression in prostate tissue and biological fluids of PCa and BPH patients is generally far less pronounced than it is for PCa patients and healthy men [18]. Here, we identified 20 miRNA ratios that were differently expressed between PCa and BPH in at least one sample type, 14 of which could differentiate PCa and BPH patients with 100% sensitivity and specificity (Table 9). Particular consideration should be given to miRNA ratios that can reliably distinguish PCa from both BPH and HD (Table 7). These results show great promise in tackling the issue of differential diagnosis of prostate lesions, but they require additional verification in a larger sample to confirm the performance of miRNA ratios and select the best biomarker candidates.
We found meaningful correlation between blood PSA and relative expression of miR-19b/miR-92a, miR-22/miR-92a, miR-378/miR-92a, miR-425/miR-92a, miR-30e/miR-125b, and miR-205/miR-30e in urine EVs. These ratios were very effective in classifying PCa patients using a diagnostic algorithm (Table 7). This can be viewed as a confirmation of their diagnostic potential but is in fact a limitation of their use alongside PSA. However, their use alongside PSA should be further studied in non-PCA-preselected groups. Another five miRNA ratios (miR-200/miR-30e, miR-205/miR-30e, miR-31/miR-30e, miR-660/miR-30e, and miR-22/miR-378a) were not associated with PSA level while achieving 100% sensitivity and 100% specificity of PCa detection. These ratios may prove to be more suitable candidates for diagnostic routines combining newly developed markers with established clinical diagnostic tools.
We also discovered a positive correlation between tumor size (TNM) and miR-205/miR-200b ratio, but none of the miRNA ratios were related to Gleason score. This is partly consistent with an earlier report by Schaefer et al. [21] showing association of miRs-125b, -205, and -222 expression with tumor stage and significant correlation between Gleason score and miR−205 expression. This may indicate a role of miR-205 and miR-200b in tumor progression [22]. It is worth mentioning that our sample consisted of early stage PCa patients (T1-2, Gleason score 5–7), which benefits the search for biomarkers for differential diagnosis but restricts the clinical utility of selected markers for other applications, for example, tracking tumor progression and risk stratification. This may explain the overall lack of correlation between miRNA expression and clinical characteristics of patients. Due to the characteristics of the donors included in this study, it is not possible to differentiate low-risk and high-risk prostate cancer. However, it is an important goal of modern diagnostics and an ambitious aim of future studies.
Although there were inter-group differences of donors age (healthy 50–60 years old, PCa patients 54–71 years old, and BPH patients 63–81 years old, we also found no meaningful association between miRNA ratios and age. This is important because prostate tissue exhibits many age-related changes, which are often erroneously identified as neoplasms by other diagnostic tests, such as PCa, resulting in needless additional tests and false positive diagnoses. Absence of correlation between miRNA expression and age further supports the potential of selected ratios for PCa diagnosis.
Differential expression of miR-19b, miR-30e, miR-92a, miR-125b, miR-200b, miR-205, miR-378a, and miR-660 between PCa and healthy donors in biological fluids and/or tissues was demonstrated previously ([23,24,25,26,27,28,29,30,31,32,33,34,35,36,37,38] and others). These miRNAs are also known to be associated with specific aspects of PCa oncogenesis, including androgen receptor (AR) signaling [39,40], cell cycle regulation [40], cell proliferation and differentiation [26,41], epithelial–mesenchymal transition (EMT) [21,42,43,44], cell growth, apoptosis [45,46,47], adhesion and invasion [22], extraprostatic extension of the tumors [32], metastasis [38,42], biochemical failure [36,41], and hormone refractory [30,33]. Most of the identified miRNAs have known targets involved in PCa oncogenesis. All of these miRNAs have targets from cancer-related pathways such as TGF-β, FoxO, p53, ErbB, TNF, HIF, MAPK, and Wnt, and 11 of the miRNAs target the mTOR signaling pathway (DIANA-mirPath v.3, http://snf-515788.vm.okeanos.grnet.gr/). For example, miR-125b is involved in AKT/mTOR pathway regulation and targets candidate genes such as BAK1 and EIF4EBP1 associated with the AKT/mTOR pathway [21,27]. MiR-19b directly targets PTEN and TP53 and consequently reduces levels of their downstream targets such as Bax and p21 [48]. MiR-378 inhibits PCa development, reducing MAPK1 expression [27,31]. Down regulation of miR-200 in PC3 cells triggered by the growth factor PDGFD results in up-regulation of the transcription repressors ZEB1, ZEB2, and SNAI2, which regulate the loss of epithelial markers—a characteristic process in the epithelial–mesenchymal transition [22]. Presence of miR-205 is an essential factor for the inhibitory effects of p63, a metastasis suppressor, on EMT markers, ZEB1, and vimentin in PCa cells [42]. MiRNA-660 targets PCa-associated genes AMACR and PSMA [37]. Involvement in oncogenesis indirectly supports biomarker status of selected miRNAs and suggests they may have a broader clinical utility. Moreover, selected miRNAs regulate various signaling pathways that guarantee higher sensitivity and stability of the diagnostic panel. Previously, some researchers also attempted to create a diagnostic panel for the differential diagnosis of PCa and BPH patients based on the analysis of three (miR222-3p * miR-24-3p/miR-30c-5p) siRNAs (after checking 45 siRNA candidates) in clarified urine [49] and two siRNAs (miR 100/200b) in cell urine sediment [50]. The authors showed that such tests can be useful as an adjunct to PSA [in patients with PSA levels in the “gray area” (4–10 ng/mL)] to confirm the need for a prostate biopsy, but they cannot be used as stand-alone tests for diagnosing PCa. Despite the amount of reports describing the involvement of various miRNAs in PCa development, our results are among the few that demonstrate the potential of EVs-associated miRNAs as PCa biomarkers using a stable and robust ratio-based approach. For example, diagnostical potential of let-7c, miR-1, and miR-21 и miR-375 was shown by Laura Foj and coauthors [51].
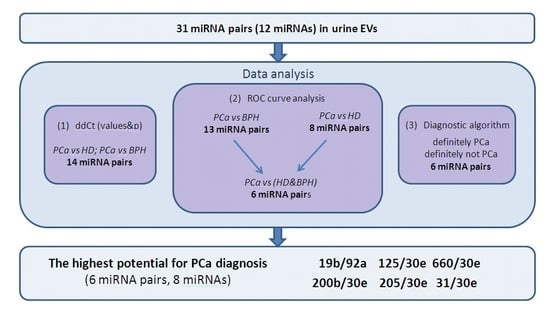
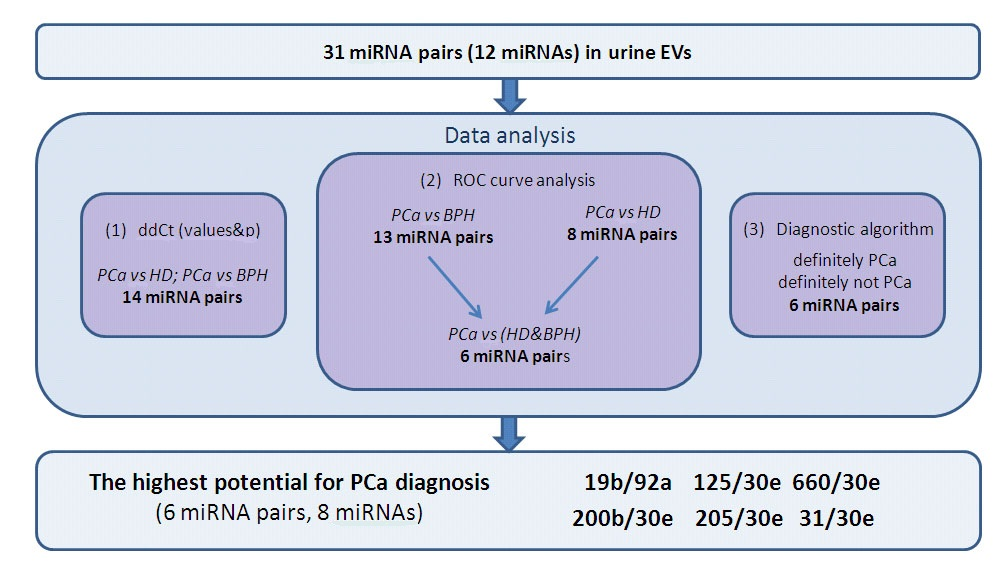
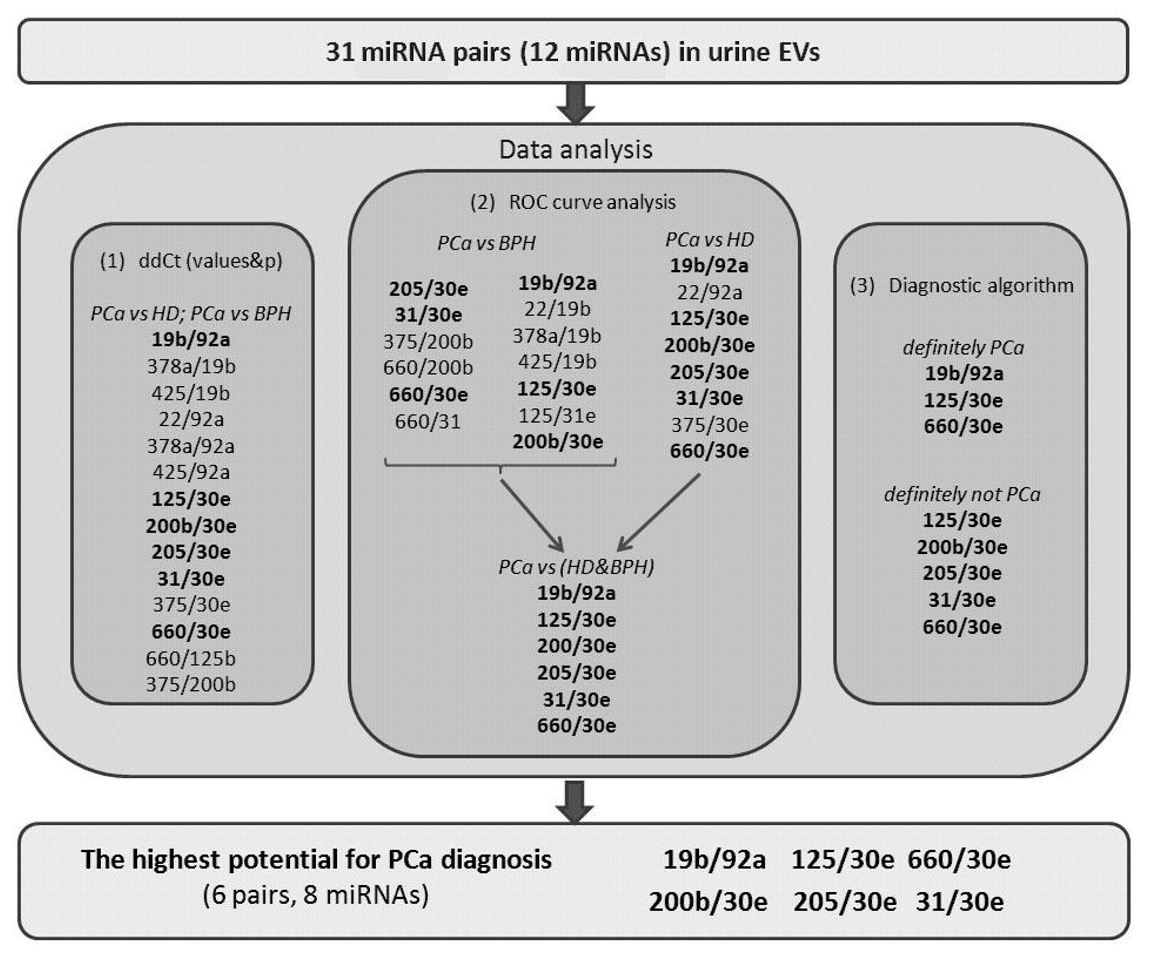
Here, we used several approaches to analyze the data on miRNA expression and to select the most suitable miRNA ratios for PCa diagnosis (Figure 2). Figure 2 illustrates the course of the study and which miRNA ratios were the best according to each part of data analysis. According to our data, the most perspective miRNA ratios for PCa diagnosis were miR-125b/miR-30e, miR-200/miR-30e, miR-205/miR-30e, miR-31/miR-30e, miR-660/miR-30e, and miR-19b/miR-92a. These ratios were able to distinguish PCa patients with 100% sensitivity and 100% specificity and could be complemented by four other miRNAs (miR-375, miR-378, miR-22, and miR-425) to create four additional ratios with lesser sensitivity (80–90%). The analysis of the diagnostic algorithm, which includes these miRNA ratios, revealed that the most stable for distinguishing PCa patients from control group (HD+BPH) are miR-125b/miR-30e, miR-660/miR-30e, and miR-19b/miR-92a.
Thus, the most promising direction for a further verification with larger samples is the study of miR-19b, miR-30e, miR-31, miR-92a, miR-125, miR-200, miR-205, and miR-660 in urine EVs from PCa and BPH patients. At least 35 participants should be included in each group to achieve the desired statistical significance and power. Additionally, to facilitate clinical application of such biomarker panels, a simple and robust method for isolation of urine EVs should be developed and thoroughly characterized, as different EVs isolation techniques have shown to be selective towards different vesicle populations.

4. Materials and Methods

4.1. Sample Collection

Blood and urine samples from 11 healthy male donors (HD), 10 PCa, and 8 patients with benign prostatic hyperplasia (BPH) were obtained from E. Meshalkin National medical research center of the Ministry of Health of the Russian Federation (Novosibirsk, Russia). The age range and mean age, the blood PSA, the disease stage, and the Gleason score (for PCa patients) of the study population are shown by the Table 11. The study was approved by the ethics committee. Written informed consent was provided by all participants.
Venous blood was collected in EDTA spray-coated vacutainers, stored at 4 °C, and processed within 4 h. To obtain blood plasma, samples were sequentially centrifuged at 400× g for 20 min and at 800× g for 20 min, both at 4 °C. To remove cellular debris, samples were centrifuged at 17,000× g at 4 °C for 20 min.
Fresh urine samples were collected in sterile containers. Urinary cells and debris were removed by sequential centrifugation at 400× g for 20 min at room temperature and clarified at 17,000× g for 20 min at 24 °C to obtain urine supernatant.

4.2. Isolation of Urine EVs by Ultracentrifugation

Human urine (5 mL) was brought to 12 mL with phosphate-buffered saline (PBS), transferred to a 14 mL open top Ultra-ClearTM centrifuge tube (Beckman Coulter, Brea, CA, USA), and centrifuged at 100,000 g for 90 min at 18 °C in a Beckman Coulter Optima TM L-90k centrifuge with SW 40Ti rotor (Beckman Coulter). The pellet was washed by resuspending in 10 mL of PBS and centrifugation in the same conditions. Finally, the pellet was resuspended in 500 µL PBS snap-frozen in liquid nitrogen and stored at −80 °C.

4.3. Isolation of miRNA by Gu/OcA Protocol

Before isolation of miRNA, blood plasma or urine samples were thawed and gently mixed. Gu/OcA miRNA isolation from urine and blood plasma was performed as described previously by Lekchnov et al. [52]. Isolation from urine EVs was performed as described for clarified urine. After the addition of denaturation buffer, synthetic cel-miR-39-3p was spiked-in the samples at 5 × 10⁷ copies per isolation.

4.4. RNA Precipitation

RNA precipitation by isopropanol was performed as described previously in Lekchnov et al. [52]. To stabilize the miRNA, 1.5 µL of glycogen (20 mg/mL) was added into each tube. Air dried miRNA pellets were dissolved in 30 µL of RNAse-free water.

4.5. Reverse Transcription and Quantitative RT-PCR

Reverse transcription (RT) on miRNA templates was performed as described by Chen et al. [53]. Primers and probes for reverse transcription and TaqMan qPCR (view Supplementary Materials) were synthesized in the Laboratory of Medicinal Chemistry (ICBFM SB RAS, Novosibirsk). Each RT reaction was performed in a total volume of 10 µL and contained 2.5 µL of RNA, 25 nM each of miRNA-specific primers, 0.5 unit of RiboLock RNAse inhibitor (Fermentas, Vilnius, Lithuania), 50 units of M-MuLV-RH reverse transcriptase (Biolabmix, Novosibirsk, Russia), 2 µL of 5× MMLV reaction buffer [250 mM Tris-HCl (pH 8.3 at 25 °C), 250 mM KCl, 20 mM MgCl2, 50 mM DTT], and 125 mM of each dNTP. The reaction conditions were as follows: 16 °C for 30 min, 42 °C for 30 min, and 70 °C for 10 min. Samples without RNA templates were used as negative controls.
Real-time PCR was carried out on the CFX 96TM Real-Time System (Bio-Rad, USA). All reactions were carried out in duplicate in a total volume of 24 µL. Each reaction contained 4 µL of RT product, 1 unit of Taq DNA polymerase (BiolabMix, Russia), 2.4 µL of 10× PCR buffer [750 mM TrisHCl (pH 8.8 at 25 °C), 200 mM (NH4)2SO4, 0.1% (v/v) Tween 20], 3.2 mM MgCl2, 200 mM of each dNTP, 480 nM miRNA-specific forward primer, 640 nM universal reverse primer, and 240 nM specific TaqMan probe (see Supplementary Materials, Table 11). After an initial denaturation at 95 °C for 3 min, the reactions were run for 50 cycles at 95 °C for 15 s and 60 °C for 45 s. Threshold cycle (Ct) values of assessed miRNAs were compared in samples from different donor groups. The miRNA expression of was evaluated in 2 sets—miR-19b, miR-22, miR-92a, miR-378, miR-425, and cel-miR-39 and miR-30e, miR-31, miR-125b, miR-200b, miR-205, miR-375, and miR-660.

4.6. Statistical Analysis

Statistical analysis was carried out with Statistica 6.0 software. Threshold cycle (Ct) values were used to perform ratio-based normalization, effectively evaluating the relative expression of all possible combinations of any two miRNAs in the sample [54,55]. Because miRNA expression was evaluated in 2 sets of 5 and 7 miRNAs, normalization was only used inside of each group. Thus, 31 miRNA ratios were formed from the 12 analyzed miRNAs. For every ratio, Ct difference (dCt) values and the difference of dCt values (ddCt) between every pair of sample types (urine supernatant–urine EVs, urine–blood plasma, and urine EVs–blood plasma) were calculated. For each miRNA ratio, mean dCt, mean ddCt, and their standard deviations were calculated in each of the fractions of biological fluids. Comparisons between groups were done with one-way ANOVA followed by Fisher’s Post-Hoc Test. p-values  <  0.05 were considered statistically significant. Benjamini–Hochberg correction (padj) was used to adjust the statistical significance for multiple comparisons. Power analysis was performed, and minimal sample size required to confirm the detected differences was calculated at 95% and 99% significance and 95% statistical power. The specificity and the sensitivity of the analytical systems were assessed using receiving operator characteristic (ROC) curves. The area under ROC curves (AUC) was used as a measure of the diagnostic performance of miRNA ratios. To examine the correlation of miRNA ratio levels with donor characteristics, Spearman’s correlation coefficient was used.

5. Conclusions

In the present study, we validated diagnostic potential of cell-free miRNAs—miR-19b, miR-22, miR-92a, miR-378, miR-425, miR-30e, miR-31, miR-125b, miR-200b, miR-205, miR-375, and miR-660—in blood plasma, clarified urine, and urine extracellular vesicles. Different fractions of biological fluids have distinct miRNA expression profiles, and here we demonstrated the great promise of urine vesicles for PCa diagnosis. Those with the highest potential for PCa diagnosis include miR-19b, miR-30e, miR-31, miR-92a, miR-125, miR-200, miR-205, and miR-660 measured in urine EVs. Selected miRNA ratios allow for efficient PCa detection when combined into the following ratios: miR-125b/miR-30e, miR-200/miR-30e, miR-205/miR-30e, miR-31/miR-30e, miR-660/miR-30e, and miR-19b/miR-92a. These results advance our understanding of cancer biology and present one more step towards development of new PCa diagnostics. The next steps are an independent verification of selected miRNA ratios in a sample of at least 35 donors per group to achieve 99% significance and 95% power followed by the development of a diagnostic panel and the differentiation of low-risk and high-risk PCa using miRNA markers.

Supplementary Materials

The following are available online at https://www.mdpi.com/2075-4418/10/1/38/s1, Table S1: Sequences of primers and probes used for reverse transcription and TaqMan qPCR, Figure S1: Examples of the qPCR curves for following miRNAs: miR-19b, miR-22, miR-92a, miR-378, miR-425 in urine EVs of healthy donor (A) BPH (B) and PCa (C) patients. Figure S2: Examples of the ROC curves for miRNA ratios with 100% specificity while discriminating PCa patients from healthy donors: (A) (100% sensitivity) miR19b/miR92a in urine EVs, (B) (90% sensitivity): miR375/miR30e in urine EVs, C (80% sensitivity) miR22/miR92a in urine EVs, (D) (70% sensitivity) miR378/miR92a in urine EVs, (E) (60% sensitivity) miR205/miR30e in blood plasma, (F) (40% sensitivity) miR125/miR30e in blood plasma. Ratios like miR125/miR30e in blood plasma were considered as low sensitive and are not shown in the manuscript tables.

Author Contributions

Conceptualization, M.Y.K., E.A.L., O.E.B., I.A.Z., P.P.L.; Methodology, M.Y.K., E.A.L.; Software, M.Y.K.; Validation, M.Y.K., E.A.L.; Formal Analysis, M.Y.K.; Investigation, M.Y.K., P.P.L.; Resources, S.V.Y., O.A.P., S.V.P.; Data Curation, P.P.L.; Writing—Original Draft Preparation, M.Y.K.; Writing—Review & Editing, M.Y.K., I.A.Z., O.E.B., P.P.L.; Visualization, M.Y.K., O.E.B.; Supervision, P.P.L.; Project Administration, P.P.L.; Funding Acquisition, O.E.B. All authors have read and agreed to the published version of the manuscript.

Funding

The work of M.Y.K., E.A.L., O.E.B., I.A.Z., S.V.Y., and O.A.P. was supported by the Russian Science Foundation (project No. 16-15-00124). P.P.L. acknowledges financial support within the framework of the Russian state budget project #AAAA-A17-117020210024-8 to the ICBFM SB RAS.

Conflicts of Interest

The authors declare no conflict of interest.

References

  1. Ferlay, J.; Soerjomataram, I.; Dikshit, R.; Eser, S.; Mathers, C.; Rebelo, M.; Parkin, D.M.; Forman, D.; Bray, F. Cancer incidence and mortality worldwide: Sources, methods and major patterns in GLOBOCAN 2012. J. Cancer 2015, 136, E359–E386. [Google Scholar] [CrossRef] [PubMed]
  2. Siegel, R.L.; Miller, K.D.; Jemal, A. Cancer Statistics, 2016. CA A Cancer J. Clin. 2016, 66, 7–30. [Google Scholar] [CrossRef] [PubMed] [Green Version]
  3. Lekchnov, E.; Amelina, E.; Bryzgunova, O.; Zaporozhchenko, I.; Konoshenko, M.; Yarmoschuk, S.; Murashov, I.; Pashkovskaya, O.; Gorizkii, A.; Zheravin, A.; et al. Searching for the Novel Specific Predictors of Prostate Cancer in Urine: The Analysis of 84 miRNA Expression. Int. J. Mol. Sci. 2018, 19, 4088. [Google Scholar] [CrossRef] [PubMed] [Green Version]
  4. Berindan-Neagoe, I.; Monroig, P.d.C.; Pasculli, B.; Calin, G.A. MicroRNAome genome: A treasure for cancer diagnosis and therapy: miRNA Knowledge for Clinicians. CA Cancer J. Clin. 2014, 64, 311–336. [Google Scholar] [CrossRef]
  5. Khanmi, K.; Ignacimuthu, S.; Paulraj, M.G. MicroRNA in prostate cancer. Clin. Chim. Acta 2015, 451, 154–160. [Google Scholar] [CrossRef]
  6. Bryzgunova, O.E.; Konoshenko, M.Y.; Laktionov, P.P. MicroRNA-guided gene expression in prostate cancer: Literature and database overview. J. Gene Med. 2018, 20, e3016. [Google Scholar] [CrossRef]
  7. Wang, X.; Fang, L. Advances in circular RNAs and their roles in breast Cancer. J. Exp. Clin. Cancer Res. 2018, 37, 206. [Google Scholar] [CrossRef]
  8. Wu, K.-L.; Tsai, Y.-M.; Lien, C.-T.; Kuo, P.-L.; Hung, A.J. The Roles of MicroRNA in Lung Cancer. Int. J. Mol. Sci. 2019, 20, 1611. [Google Scholar] [CrossRef] [Green Version]
  9. Zaporozhchenko, I.A.; Morozkin, E.S.; Ponomaryova, A.A.; Rykova, E.Y.; Cherdyntseva, N.V.; Zheravin, A.A.; Pashkovskaya, O.A.; Pokushalov, E.A.; Vlassov, V.V.; Laktionov, P.P. Profiling of 179 miRNA Expression in Blood Plasma of Lung Cancer Patients and Cancer-Free Individuals. Sci. Rep. 2018, 8, 6348. [Google Scholar] [CrossRef]
  10. Sierzega, M.; Kaczor, M.; Kolodziejczyk, P.; Kulig, J.; Sanak, M.; Richter, P. Evaluation of serum microRNA biomarkers for gastric cancer based on blood and tissue pools profiling: The importance of miR-21 and miR-331. Br. J. Cancer 2017, 117, 266–273. [Google Scholar] [CrossRef] [Green Version]
  11. Fendler, A.; Stephan, C.; Yousef, G.M.; Kristiansen, G.; Jung, K. The translational potential of microRNAs as biofluid markers of urological tumours. Nat. Rev. Urol. 2016, 13, 734–752. [Google Scholar] [CrossRef]
  12. Formosa, A.; Markert, E.K.; Lena, A.M.; Italiano, D.; Finazzi-Agro’, E.; Levine, A.J.; Bernardini, S.; Garabadgiu, A.V.; Melino, G.; Candi, E. MicroRNAs, miR-154, miR-299-5p, miR-376a, miR-376c, miR-377, miR-381, miR-487b, miR-485-3p, miR-495 and miR-654-3p, mapped to the 14q32.31 locus, regulate proliferation, apoptosis, migration and invasion in metastatic prostate cancer cells. Oncogene 2014, 33, 5173–5182. [Google Scholar] [CrossRef]
  13. Australian Prostate Cancer BioResource; Matin, F.; Jeet, V.; Moya, L.; Selth, L.A.; Chambers, S.; Clements, J.A.; Batra, J. A Plasma Biomarker Panel of Four MicroRNAs for the Diagnosis of Prostate Cancer. Sci. Rep. 2018, 8, 6653. [Google Scholar] [CrossRef] [Green Version]
  14. Bryant, R.J.; Pawlowski, T.; Catto, J.W.F.; Marsden, G.; Vessella, R.L.; Rhees, B.; Kuslich, C.; Visakorpi, T.; Hamdy, F.C. Changes in circulating microRNA levels associated with prostate cancer. Br. J. Cancer 2012, 106, 768–774. [Google Scholar] [CrossRef] [Green Version]
  15. Cozar, J.M.; Robles-Fernandez, I.; Rodriguez-Martinez, A.; Puche-Sanz, I.; Vazquez-Alonso, F.; Lorente, J.A.; Martinez-Gonzalez, L.J.; Alvarez-Cubero, M.J. The role of miRNAs as biomarkers in prostate cancer. Mutat. Res. Rev. Mutat. Res. 2019, 781, 165–174. [Google Scholar] [CrossRef]
  16. Bryzgunova, O.E.; Zaripov, M.M.; Skvortsova, T.E.; Lekchnov, E.A.; Grigor’eva, A.E.; Zaporozhchenko, I.A.; Morozkin, E.S.; Ryabchikova, E.I.; Yurchenko, Y.B.; Voitsitskiy, V.E.; et al. Comparative Study of Extracellular Vesicles from the Urine of Healthy Individuals and Prostate Cancer Patients. PLoS ONE 2016, 11, e0157566. [Google Scholar] [CrossRef]
  17. Fredsøe, J.; Rasmussen, A.K.I.; Thomsen, A.R.; Mouritzen, P.; Høyer, S.; Borre, M.; Ørntoft, T.F.; Sørensen, K.D. Diagnostic and Prognostic MicroRNA Biomarkers for Prostate Cancer in Cell-free Urine. Eur. Urol. Focus 2018, 4, 825–833. [Google Scholar] [CrossRef] [Green Version]
  18. Bryzgunova, O.E.; Zaporozhchenko, I.A.; Lekchnov, E.A.; Amelina, E.V.; Konoshenko, M.Yu.; Yarmoschuk, S.V.; Pashkovskaya, O.A.; Zheravin, A.A.; Pak, S.V.; Rykova, E.Y.; et al. Data analysis algorithm for the development of extracellular miRNA-based diagnostic systems for prostate cancer. PLoS ONE 2019, 14, e0215003. [Google Scholar] [CrossRef] [Green Version]
  19. Sanguedolce, F.; Cormio, A.; Brunelli, M.; D’Amuri, A.; Carrieri, G.; Bufo, P.; Cormio, L. Urine TMPRSS2: ERG Fusion Transcript as a Biomarker for Prostate Cancer: Literature Review. Clin. Genitourin. Cancer 2016, 14, 117–121. [Google Scholar] [CrossRef]
  20. McKiernan, J.; Donovan, M.J.; O’Neill, V.; Bentink, S.; Noerholm, M.; Belzer, S.; Skog, J.; Kattan, M.W.; Partin, A.; Andriole, G.; et al. A Novel Urine Exosome Gene Expression Assay to Predict High-grade Prostate Cancer at Initial Biopsy. JAMA Oncol. 2016, 2, 882–889. [Google Scholar] [CrossRef] [Green Version]
  21. Schaefer, A.; Stephan, C.; Busch, J.; Yousef, G.M.; Jung, K. Diagnostic, prognostic and therapeutic implications of microRNAs in urologic tumors. Nat. Rev. Urol. 2010, 7, 286–297. [Google Scholar] [CrossRef]
  22. Kong, D.; Li, Y.; Wang, Z.; Banerjee, S.; Ahmad, A.; Kim, H.-R.; Sarkar, F.H. MiR-200 Regulates PDGF-D-Mediated Epithelial-Mesenchymal Transition, Adhesion, and Invasion of Prostate Cancer Cells. Stem Cells 2009, 27, 1712–1721. [Google Scholar] [CrossRef] [Green Version]
  23. Hao, Y.; Zhao, Y.; Zhao, X.; He, C.; Pang, X.; Wu, T.-C.; Califano, J.A.; Gu, X. Improvement of Prostate Cancer Detection by Integrating the PSA Test With miRNA Expression Profiling. Cancer Investig. 2011, 29, 318–324. [Google Scholar] [CrossRef]
  24. Srivastava, A.; Goldberger, H.; Dimtchev, A.; Ramalinga, M.; Chijioke, J.; Marian, C.; Oermann, E.K.; Uhm, S.; Kim, J.S.; Chen, L.N.; et al. MicroRNA Profiling in Prostate Cancer—The Diagnostic Potential of Urinary miR-205 and miR-214. PLoS ONE 2013, 8, e76994. [Google Scholar] [CrossRef] [Green Version]
  25. Cheng, H.H.; Mitchell, P.S.; Kroh, E.M.; Dowell, A.E.; Chéry, L.; Siddiqui, J.; Nelson, P.S.; Vessella, R.L.; Knudsen, B.S.; Chinnaiyan, A.M.; et al. Circulating microRNA Profiling Identifies a Subset of Metastatic Prostate Cancer Patients with Evidence of Cancer-Associated Hypoxia. PLoS ONE 2013, 8, e69239. [Google Scholar] [CrossRef] [Green Version]
  26. Wang, S.-Y.; Shiboski, S.; Belair, C.D.; Cooperberg, M.R.; Simko, J.P.; Stoppler, H.; Cowan, J.; Carroll, P.R.; Blelloch, R. miR-19, miR-345, miR-519c-5p Serum Levels Predict Adverse Pathology in Prostate Cancer Patients Eligible for Active Surveillance. PLoS ONE 2014, 9, e98597. [Google Scholar] [CrossRef]
  27. Schaefer, A.; Jung, M.; Mollenkopf, H.-J.; Wagner, I.; Stephan, C.; Jentzmik, F.; Miller, K.; Lein, M.; Kristiansen, G.; Jung, K. Diagnostic and prognostic implications of microRNA profiling in prostate carcinoma. Int. J. Cancer 2009, 126, 1166–1176. [Google Scholar] [CrossRef]
  28. Tong, A.W.; Fulgham, P.; Jay, C.; Chen, P.; Khalil, I.; Liu, S.; Senzer, N.; Eklund, A.C.; Han, J.; Nemunaitis, J. MicroRNA profile analysis of human prostate cancers. Cancer Gene Ther. 2009, 16, 206–216. [Google Scholar] [CrossRef] [Green Version]
  29. Volinia, S.; Calin, G.A.; Liu, C.-G.; Ambs, S.; Cimmino, A.; Petrocca, F.; Visone, R.; Iorio, M.; Roldo, C.; Ferracin, M.; et al. A microRNA expression signature of human solid tumors defines cancer gene targets. Proc. Natl. Acad. Sci. USA 2006, 103, 2257–2261. [Google Scholar] [CrossRef] [Green Version]
  30. Porkka, K.P.; Pfeiffer, M.J.; Waltering, K.K.; Vessella, R.L.; Tammela, T.L.J.; Visakorpi, T. MicroRNA Expression Profiling in Prostate Cancer. Cancer Res. 2007, 67, 6130–6135. [Google Scholar] [CrossRef] [Green Version]
  31. Ozen, M.; Creighton, C.J.; Ozdemir, M.; Ittmann, M. Widespread deregulation of microRNA expression in human prostate cancer. Oncogene 2008, 27, 1788–1793. [Google Scholar] [CrossRef] [Green Version]
  32. Ambs, S.; Prueitt, R.L.; Yi, M.; Hudson, R.S.; Howe, T.M.; Petrocca, F.; Wallace, T.A.; Liu, C.-G.; Volinia, S.; Calin, G.A.; et al. Genomic Profiling of MicroRNA and Messenger RNA Reveals Deregulated MicroRNA Expression in Prostate Cancer. Cancer Res. 2008, 68, 6162–6170. [Google Scholar] [CrossRef] [Green Version]
  33. Nguyen, H.C.N.; Xie, W.; Yang, M.; Hsieh, C.-L.; Drouin, S.; Lee, G.-S.M.; Kantoff, P.W. Expression differences of circulating microRNAs in metastatic castration resistant prostate cancer and low-risk, localized prostate cancer. Prostate 2013, 73, 346–354. [Google Scholar] [CrossRef] [Green Version]
  34. Hühn, D.; Kousholt, A.N.; Sørensen, C.S.; Sartori, A.A. miR-19, a component of the oncogenic miR-17∼92 cluster, targets the DNA-end resection factor CtIP. Oncogene 2015, 34, 3977–3984. [Google Scholar] [CrossRef] [Green Version]
  35. Kristensen, H.; Thomsen, A.R.; Haldrup, C.; Dyrskjøt, L.; Høyer, S.; Borre, M.; Mouritzen, P.; Ørntoft, T.F.; Sørensen, K.D. Novel diagnostic and prognostic classifiers for prostate cancer identified by genome-wide microRNA profiling. Oncotarget 2016, 7, 30760–30771. [Google Scholar] [CrossRef]
  36. Stuopelytė, K.; Daniūnaitė, K.; Jankevičius, F.; Jarmalaitė, S. Detection of miRNAs in urine of prostate cancer patients. Medicina 2016, 52, 116–124. [Google Scholar] [CrossRef]
  37. Erdmann, K.; Kaulke, K.; Thomae, C.; Huebner, D.; Sergon, M.; Froehner, M.; Wirth, M.P.; Fuessel, S. Elevated expression of prostate cancer-associated genes is linked to down-regulation of microRNAs. BMC Cancer 2014, 14, 82. [Google Scholar] [CrossRef] [Green Version]
  38. Watahiki, A.; Wang, Y.; Morris, J.; Dennis, K.; O’Dwyer, H.M.; Gleave, M.; Gout, P.W.; Wang, Y. MicroRNAs Associated with Metastatic Prostate Cancer. PLoS ONE 2011, 6, e24950. [Google Scholar] [CrossRef]
  39. Pasqualini, L.; Bu, H.; Puhr, M.; Narisu, N.; Rainer, J.; Schlick, B.; Schäfer, G.; Angelova, M.; Trajanoski, Z.; Börno, S.T.; et al. miR-22 and miR-29a Are Members of the Androgen Receptor Cistrome Modulating LAMC1 and Mcl-1 in Prostate Cancer. Mol. Endocrinol. 2015, 29, 1037–1054. [Google Scholar] [CrossRef]
  40. Lin, P.-C.; Chiu, Y.-L.; Banerjee, S.; Park, K.; Mosquera, J.M.; Giannopoulou, E.; Alves, P.; Tewari, A.K.; Gerstein, M.B.; Beltran, H.; et al. Epigenetic Repression of miR-31 Disrupts Androgen Receptor Homeostasis and Contributes to Prostate Cancer Progression. Cancer Res. 2013, 73, 1232–1244. [Google Scholar] [CrossRef] [Green Version]
  41. Selth, L.A.; Das, R.; Townley, S.L.; Coutinho, I.; Hanson, A.R.; Centenera, M.M.; Stylianou, N.; Sweeney, K.; Soekmadji, C.; Jovanovic, L.; et al. A ZEB1-miR-375-YAP1 pathway regulates epithelial plasticity in prostate cancer. Oncogene 2017, 36, 24–34. [Google Scholar] [CrossRef]
  42. Tucci, P.; Agostini, M.; Grespi, F.; Markert, E.K.; Terrinoni, A.; Vousden, K.H.; Muller, P.A.J.; Dotsch, V.; Kehrloesser, S.; Sayan, B.S.; et al. Loss of p63 and its microRNA-205 target results in enhanced cell migration and metastasis in prostate cancer. Proc. Natl. Acad. Sci. USA 2012, 109, 15312–15317. [Google Scholar] [CrossRef] [Green Version]
  43. Gandellini, P.; Folini, M.; Longoni, N.; Pennati, M.; Binda, M.; Colecchia, M.; Salvioni, R.; Supino, R.; Moretti, R.; Limonta, P.; et al. miR-205 Exerts Tumor-Suppressive Functions in Human Prostate through Down-regulation of Protein Kinase C. Cancer Res. 2009, 69, 2287–2295. [Google Scholar] [CrossRef] [Green Version]
  44. Szczyrba, E.; Nolte, S.; Wach, E.; Kremmer, R.; Stöhr, A.; Hartmann, W.; Wieland, W.; Wullich, B.; Grässer, F.A. Downregulation of Sec23A protein by miRNA-375 in prostate carcinoma. Mol. Cancer Research. 2011, 9, 791–800. [Google Scholar]
  45. deVere White, R.W.; Vinall, R.L.; Tepper, C.G.; Shi, X.-B. MicroRNAs and their potential for translation in prostate cancer. Urol. Oncol. Semin. Orig. Investig. 2009, 27, 307–311. [Google Scholar] [CrossRef] [Green Version]
  46. Shi, X.-B.; Xue, L.; Ma, A.-H.; Tepper, C.G.; Kung, H.-J.; White, R.W. deVere miR-125b promotes growth of prostate cancer xenograft tumor through targeting pro-apoptotic genes. Prostate 2011, 71, 538–549. [Google Scholar] [CrossRef] [Green Version]
  47. Verdoodt, B.; Neid, M.; Vogt, M.; Kuhn, V.; Liffers, S.-T.; Palisaar, R.-J.; Noldus, J.; Tannapfel, A.; Mirmohammadsadegh, A. MicroRNA-205, a novel regulator of the anti-apoptotic protein Bcl2, is downregulated in prostate cancer. Int. J. Oncol. 2013, 43, 307–314. [Google Scholar] [CrossRef]
  48. Fan, Y.; Yin, S.; Hao, Y.; Yang, J.; Zhang, H.; Sun, C.; Ma, M.; Chang, Q.; Xi, J.J. miR-19b promotes tumor growth and metastasis via targeting TP53. RNA 2014, 20, 765–772. [Google Scholar] [CrossRef] [Green Version]
  49. Fredsøe, J.; Rasmussen, A.K.I.; Laursen, E.B.; Cai, Y.; Howard, K.A.; Pedersen, B.G.; Borre, M.; Mouritzen, P.; Ørntoft, T.; Sørensen, K.D. Independent Validation of a Diagnostic Noninvasive 3-MicroRNA Ratio Model (uCaP) for Prostate Cancer in Cell-Free Urine. Clin Chem. 2019, 65, 540–548. [Google Scholar]
  50. Salido-Guadarrama, A.I.; Morales-Montor, J.G.; Rangel-Escareño, C.; Langley, E.; Peralta-Zaragoza, O.; Cruz Colin, J.L.; Rodriguez-Dorantes, M. Urinary microRNA-based signature improves accuracy of detection of clinically relevant prostate cancer within the prostate-specific antigen grey zone. Mol. Med. Rep. 2016, 13, 4549–4560. [Google Scholar] [CrossRef]
  51. Foj, L.; Ferrer, F.; Serra, M.; Arévalo, A.; Gavagnach, M.; Giménez, N.; Filella, X. Exosomal and non-Exosomal urinary miRNAs in prostate Cancer detection and prognosis. Prostate 2017, 77, 573–583. [Google Scholar] [CrossRef]
  52. Lekchnov, E.A.; Zaporozhchenko, I.A.; Morozkin, E.S.; Bryzgunova, O.E.; Vlassov, V.V.; Laktionov, P.P. Protocol for miRNA isolation from biofluids. Anal. Biochem. 2016, 499, 78–84. [Google Scholar] [CrossRef]
  53. Chen, C. Real-time quantification of microRNAs by stem-loop RT-PCR. Nucleic Acids Res. 2005, 33, e179. [Google Scholar] [CrossRef]
  54. Boeri, M.; Verri, C.; Conte, D.; Roz, L.; Modena, P.; Facchinetti, F.; Calabrò, E.; Croce, C.M.; Pastorino, U.; Sozzi, G. MicroRNA signatures in tissues and plasma predict development and prognosis of computed tomography detected lung cancer. Proc. Natl. Acad. Sci. USA 2011, 108, 3713–3718. [Google Scholar] [CrossRef] [Green Version]
  55. Landoni, E.; Miceli, R.; Callari, M.; Tiberio, P.; Appierto, V.; Angeloni, V.; Mariani, L.; Daidone, M.G. Proposal of supervised data analysis strategy of plasma miRNAs from hybridisation array data with an application to assess hemolysis-related deregulation. BMC Bioinform. 2015, 16, 388. [Google Scholar] [CrossRef] [Green Version]
Figure 1. The dCt values of miRNA ratios isolated from urine EVs with the highest diagnostic value.
Diagnostics 10 00038 g001
Figure 2. The course of the study.
Diagnostics 10 00038 g002
Table 1. The difference of Ct difference (dCt) (ddCt) values for differentially expressed miRNA pairs in the following groups of comparison: prostate cancer (PCa)–healthy male donor (HD), PCa–benign prostatic hyperplasia (BPH), BPH–HD.
miRNAPCa–HDPCa–BPHBPH–HD
PairsUEUUEUUEU
22/19b −1.7 *3.2 *** −2.2 **−1.6 *
19b/92a−8.2 *** −8.4 ***1.5 *
378a/19b1.8 ** 2.5 ***−17 *
425/19b1.0 ** 1.6 ***
22/92a−6.7 *** −4.7 ***
378a/92a−5.9 *** −5.4 ***
425/92a−6.7 *** −63 ***
22/378a 1.5 *−1.5 *−1.5 *
22/425 1.6 *** −1.6 **
31/30e−7.4 *** −4.8 **
125b/30e−6.0 *** 5.6 ***−1.3 *
200b/30e−8.4 *** −5.3 **
205/30e−7.0 *** −5.8 ***
375/30e−5.0 ** −3.5 **
660/30e−4.4 *** −5.9 *** 1.5 *
125b/31 −3.0 *4.3 **
205/31 −0.74 *
375/31 3.3 *
660/31 6.3 **
200b/125b 3.4 *−4.9 **
375/125b 2.1 *
660/125b1.7 * 2.0 *
205/200b −2.8 *4.1 *
375/200b3.3 * 3.8 *
660/200b −2.9 *6.8 *
660/375 −2.4 * 3.0 *
Number of differently expressed miRNA pairs141149152
ddCt values with a common directionality of differences with comparisons between PCa and HD are highlighted. *** p < 0.001; ** p < 0.01; * p < 0.05; UE: ddCt in urine extracellular vesicles (EVs); U: ddCt in clarified urine.
Table 2. The dddCt values for differentially expressed miRNA pairs in the following groups of comparison: PCa–HD, PCa–BPH, BPH–HD.
miRNAPCa–HDPCa–BPHBPH–HD
RatiosUE-UP-UUE-PUE-UP-UUE-PUE-UP-UUE-P
22/19b2.9 ***−2.3 * 3.4 *** 2.1 *
19b/92a−9.2 *** −8.5 ***−9.9 *** −7.5 ***
378a/19b3.2 ** 4.4 ***
425/19b2.8 ** 2.8 **
22/92a−6.1 *** −7.3 ***−6.0 ** −4.8 **
378a/92a−5.6 ** −6.0 ***−5.2 ** −5.4 ***
425/92a−6.2 *** −7.2 ***−6.5 *** −6.2 ***
22/378a −1.4 * 2.1 *
22/425 1.4 * −1.5 *
31/30e−8.0 *** −9.5 **−3.9 ** −4.2 *
125b/30e5.8 *** −7.5 ***−4.3 *** −6.1 ***
200b/30e−9.5 *** −11.8 ***−5.3 * −5.0 ** −4.3 ***
205/30e−6.7 *** −9.4 ***5.1 * 7.0 *
375/30e−3.3 ** −5.9 *** 4.3 **
660/30e−4.4 *** − 4.0***5.4 *** 5.7 ***
200b/125b −4.3 *** −2.8 **
375/125b2.4 *
660/125b 3.5 *** 2.5 **
375/200b 5.9 ***3.0 ** 3.2 **
660/200b5.1 * 7.8 *** 5.3 ***
660/375−1.1 * 2.0 *
Number of differently expressed miRNA pairs1611513011009
dddCt values with a common directionality of differences with comparisons between PCa and HD are highlighted. *** p < 0.001; ** p < 0.01; * p < 0.05; UE-U: dddCt between urine EVs and clarified urine; P-U: dddCt between clarified urine and blood plasma; UE-P: dddCt between urine EVs and plasma.
Table 3. Receiving operator characteristic (ROC) curve analysis: PCa vs. (HD+BPH), sensitivity at 100% specificity.
miRNA RatiosUEUE-UUE-P
19b/92a10010090
22/19b 90
22/92a706060
378a/19b8090
378a/92a606060
425/19b70
425/92a807090
125b/30e100100100
200b/30e10090100
205/30e10080
31/30e10010060
375/30e 80
660/30e10060
UE: dCt in urine EVs; UE-U: ddCt between urine EVs and clarified urine; UE-P: ddCt between urine EVs and plasma; ratios with the highest sensitivity are given in bold.
Table 4. ROC curve analysis: PCa vs. HD, sensitivity at 100% specificity.
miRNA RatiosUEUPUE-UP-UUE-P
19b/92a100 100 90
22/19b 70 9090
22/92a80 60 100
378a/19b78 90
378a/92a70
425/19b67 7080
425/92a90 70 90
125b/30e100 100 100
200b/30e100 90 100
205/30e100 6090 100
31/30e100 100 70
375/30e90
378a/42570
660/30e100
UE: dCt in urine EVs; U: dCt in clarified urine; P: dCt in plasma; UE-U: ddCt between urine EVs and clarified urine; P-U: ddCt between clarified urine and blood plasma; UE-P: ddCt between urine EVs and plasma. Classifications with highest sensitivity for each miRNA ratio are given in bold.
Table 5. ROC curve analysis: PCa vs. BPH, sensitivity at 100% specificity.
miRNA RatiosUEUPUE-UP-UUE-P
19b/92a1007070100 90
22/19b100 7090 70
22/92a70 70 60
378a/19b100 6090
378a/92a60 60 60
425/19b100 70
425/92a80 90
22/42580
125b/30e100 100 100
125b/31100 70
200b/125b100
200b/30e100 100 100
205/200b 70
205/30e100 80
31/30e100 100 60
375a/200b 70 100
375a/30e 80
660/125b 80
660/200b10080
660/30e10070 100 100
660/31100 80
660/375a 6090
UE: dCt in urine EVs; U: dCt in clarified urine; P: dCt in plasma; UE-U: ddCt between urine EVs and clarified urine; P-U: ddCt between clarified urine and blood plasma; UE-P: ddCt between urine EVs and plasma. Classifications with highest sensitivity for each miRNA ratio are given in bold.
Table 6. ROC curve analysis: BPH vs. HD, sensitivity at 100% specificity.
miRNA RatiosUEUPUE-UP-UUE-P
22/19b 75
22/378a62
22/92a100 100
22/42575
425/92a 62
125b/30e 87
125b/31 62
200b/30e 75 87
200b/125b 87
205/30e 62
375/205 75
UE: dCt in urine EVs; U: dCt in clarified urine; P: dCt in plasma; UE-U: ddCt between urine EVs and clarified urine; P-U: ddCt between clarified urine and blood plasma; UE-P: ddCt between urine EVs and plasma. Classifications with highest sensitivity for each miRNA ratio are given in bold.
Table 7. Definitely PCa. The percentage of PCa patients divided from the control group (HD+BPH).
miRNA RatiosUEUE-UUE-PAll Fractions
19b/92a100%90%70%100%
22/92a70%60%60%70%
378a/92a60%60%60%60%
425/92a80%70%80%90%
125/30e100%100%100%100%
200b/30e 60%50%
205/30e60% 60%
375/30e 70%60%
660/30e100%70%70%100%
All ratios100%100%100%100%
UE: dCt in urine EVs; UE-U: ddCt between urine EVs and clarified urine; UE-P: ddCt between urine EVs and plasma.
Table 8. Definitely not PCa. The percentage of HD and BPH patients divided from the control group (PCa).
miRNA RatiosUEUE-UUE-PAll Fractions
19b/92a 63% 63%
22/42558% 58%
378a/42574% 74%
125b/30e100%100%100%100%
200b/30e100% 68%100%
205/30e100%53%89%100%
31/30e100%100% 100%
375/30e84% 58%
660/30e100%84%89%100%
205/3174% 74%
660/125b 53%53%
205/200b53% 53%
660/200b 53%53%
660/205 53%63%
All ratios100%100%100%100%
UE: dCt in urine EVs; UE-U: ddCt between urine EVs and clarified urine; UE-P: ddCt between urine EVs and plasma.
Table 9. Definitely ill. The percentage of PCa and BPH patients divided from the control group (HD).
miRNA RatiosUEUUE-UUE-PAll Fractions
22/19b 50% 50%
22/92a50% 72%72%
378a/92a50% 50%
425/92a55% 61%61%
125b/30e55% 55%55%55%
200/b30e 83%83%
205/30e 66%66%
660/30e55% 55%
19b/92a55% 55% 55%
All ratios55%50%55%100%100%
UE: dCt in urine EVs; U: dCt in clarified urine; UE-U: ddCt between urine EVs and clarified urine; UE-P: ddCt between urine EVs and plasma.
Table 10. Definitely healthy. The percentage of HD divided from the control group (PCa and BPH patients).
miRNA RatiosUEUE-UUE-PAll Fractions
31/30e63% 63%
200b/30e63% 81%91%
375/31 54%63%73%
660/3163% 72%91%
200b/125b63% 63%91%
660/125b54% 82%91%
375/200b54% 63%82%
660/200b63%63%91%91%
All ratios 91%91%
UE: dCt in urine EVs; U: dCt in clarified urine; UE-U: ddCt between urine EVs and clarified urine; UE-P: ddCt between urine EVs and plasma.
Table 11. Overview of the study population.
PCaBPHHD
Age(Mean ± SD)61.9 ± 6.072.2 ± 9.754.8 ± 3.6
Range54–7163–8150–60
Total Prostate-Specific Antigen (PSA), ng/mL 8.2 ± 0.96.3 ± 2.10.9 ± 0.1
PSAT1N0M030%N/AN/A
T2N0M070%
Gleason Score510%N/AN/A
630%
760%

