1. Introduction
Given the move from structured, safe and controlled robotic cells to unstructured, dynamic and human-shared environments, robots are being called to perform even more complex tasks, often mimicking human beings or collaborating with them. As the task increases in complexity, more sensing abilities are required by the robots to autonomously determine the optimal task strategy, to enact it and to guarantee the maximum level of safety for itself, the external environment and the surrounding humans. Nowadays robots are equipped with various and heterogeneous sensory systems, e.g., cameras, odometers, LIDARs, radars, successfully accomplishing navigation tasks without colliding with external and dynamic objects [
1,
2].
Like for navigation tasks, for manipulation tasks robots must be able to perceive near objects and to estimate their pose with high accuracy, sometimes even before grasping and manipulating them. Grasping and manipulation are still challenging due to intrinsic difficulties with accurately perceiving objects of different shapes and sizes in cluttered environments. With these type of applications vision/depth sensors can capture positional and geometric information, but they are affected by problems related to occlusions and calibration errors. The latter may result in imprecise estimation of object shape and pose with severe impacts on the grasping process. Although in-hand cameras are preferred to the more conventional head-mounted ones, there are still some limitations in the classical calibration procedures that result not so precise even though the distance between the sensor and the object is reduced, as demonstrated in [
3].
While cameras can be employed by robots to sense objects from relatively high distance, tactile sensing can be used only in strict contact with an object. However, tactile sensors are typically installed on the robot end-effector, e.g., robot grippers, robotic hands, and could potentially sense areas closer to the objects that could be not accessible to cameras. By exploiting the strategic position of tactile sensors, the integration of proximity sensors on them could enable robots to rely on pre-touch sensing, easily allowing the estimation of the object pose and shape when the robot is in the approaching and grasping phase. Differently from vision-based and tactile sensors, pre-touch sensors operate at an intermediate range, providing benefits of both the mentioned class of sensors: mounted to the robot end-effector, they are more robust against occlusion than cameras; mounted at a closer range, they may potentially provide more precise measurements; similar to camera/depth sensors, they do not require to get in contact with objects.
In these terms, through specific scanning strategy pre-touch sensors would enable robots to acquire geometric information of an object necessary to estimate its pose and shape and, hence, to perform grasping actions, manipulation and re-grasping by exploiting more accurate data.
Pre-touch sensors have been already used in robotics and different technologies, e.g., optical, electric field and acoustic have been adopted in recent years. Electric field (EF) pre-touch sensors have been widely used [
4,
5,
6]. EF sensors exploit electric field generated between two electrodes irradiating the nearby objects with AC signals. By analyzing the alteration of the electric field, it is able to reconstruct the information of the irradiated objects. Despite the good performance, the use of EF sensors is limited to conductive materials with a high dielectric constant, so they are not so efficient with paper or rubber objects. Acoustic pre-touch sensors have been proposed in [
7,
8], where seashell effect has been studied. With this sensor technology a cavity and a microphone are used to scan the environment reconstructing the object shape information by analyzing the changes in the resonant frequency spectrum while the robot is approaching the object. Optical sensors have been demonstrated to be the most reliable technology, able to work with a wide range of materials with precise and accurate results. References [
9,
10,
11] showed the effectiveness of the optical approach obtaining with high precision the shape or the distance of the object of interest. All three approaches measure the amount of light reflected by the objects, so intrinsic problems due to specific calibration procedures requested for any kind of color and surface reflectivity should be take into account.
Among the optical pre-touch sensors, Time-of-Flight (ToF) technology represents the solution to overcome the classical optical sensors issues. As shown in [
3,
12,
13], time-of-flight sensors do not need calibration and they are robust and accurate enough with a wide range of materials. In particular, Lancaster et al. [
3] successfully combine depth camera-based point cloud with pre-touch sensor information to improve the accuracy of the objects pose estimation, while Yang et al. [
12] used similar time-of-flight-based sensors to improve the accuracy of the grasping actions in sequential manipulation tasks during the Rubik’s Cube solving. Sasaki et al. [
13], more recently, successfully exploit ToF sensors to increase the robustness of the positioning of a robot hand during grasping task. Because slight errors in the posture and position are enough to cause grasping failure, they used proximity sensors installed on the hand fingernails, besides on the fingertips, to detect both target object and support surface. Proximity sensor data are, then, used in a grasping control technique based on the relative pose between the hand and the support surface and between the hand and the target object.
For the sake of completeness, the authors would remark how pre-touch sensing is not only useful in object shape and pose estimation, but it could provide a relevant contribution also in safety critical situations, e.g., Human-Robot Collaboration tasks. Some examples are reported in [
14,
15], where proximity sensors are used in nursing applications to prevent and avoid unintended collision with patients, absorb impact due to them and perform automatic rehabilitation activity.
Considering the good performance and the limited dimensions of the new off-the-shelf ToF sensors, the authors believe that they represent the best enabling technology for pre-touch sensing. In particular, starting from the tactile sensors already developed by some of the authors in the last ten years [
16,
17], in this paper the authors present a new pre-touch sensing solution, fully integrated in the pre-existent tactile sensors, able to recognize the shape of the objects through a specific scanning procedure. The work focuses on Deformable Linear Objects (DLO) manipulation, which represents one of the main objectives of H2020 REMODEL project
https://remodel-project.eu/ (accessed on 2 September 2021). More in detail, during the switchgear assembly the recognition of the shape and pose of the manipulated wires results fundamental for the successful task execution. A precise knowledge of the wire pose obtained with pre-touch sensors in the pre-grasping phase can be used to correct the a priory knowledge on the grasping target obtained with supplementary sensors, e.g., depth cameras. In this way the robot end-effector pose can be corrected, guaranteeing a more stable wire grasping. The need of a pre-touch sensor, intended also as a complementary sensor for camera-based systems, is remarked by supplementary studies conducted within H2020 REMODEL project and presented by Cop et al. [
18]. In particular, a benchmark between several commercial depth cameras has been conducted in order to highlight the limitations of that sensors when used to recognize very small and thin objects, i.e., wires. The cameras performance have been evaluated through standard metrics and carefully focusing on the object distance estimation (depth in the Z-dimension). The study shows that low- and mid-range cameras, e.g., Intel RealSense D415, Microsoft Kinect Azure, etc., are not able to provide accurate reconstruction of wires thinner than
mm. Moreover, reconstruction accuracy is affected by the object materials and it is highly altered when transparent objects are considered.
The direct use of 2D camera images in wire shape recognition can be sufficient in constrained conditions, where 3D information is not necessary. Chapman et al. [
19] were recently faced with the FFC cables grasping problem, and they approached the challenge with a customized low-cost gripper. An in-hand RGB camera allows for the recognition and 2D pose estimation of the flat cables through standard computer vision methods. However, the specific task requires solving only a 2D problem given that the cables lie on a flat surface assumed to be parallel to the robot base. In these terms, no information about the distance between the cables and the support are needed, so the main effort is focused on the design of the gripper used to efficiently grasp and assemble the cables. In a more general meaning, wires grasping and manipulation require the estimation of the object 3D pose. An accurate knowledge of the complete pose in the Cartesian space by using 2D camera images is quite challenging and computationally expensive as shown in [
20], where the authors combine multiple 2D views to reconstruct the 3D pose. This approach requires tackling problems related to the alignment of the multiple views by considering the DLOs features. Once the different perspective views have been detected (not an immediate task given that they depend also on the available lightning and on the reachable areas), object reference points shall be used to merge the 2D images, which in case of DLOs are not easily obtainable due to the high uniformity of their surface and to the absence of shape corners, usually considered for more common objects.
Despite the effectiveness of ToF-based pre-touch sensors widely demonstrated in other works (see [
12,
13]), in case of daily-life and common objects, e.g., bottles, hammers and screwdrivers, fruits and vegetables, no evidence of their performance is reported in case of small and thin objects such as wires. For that reason, this work would further explore the application of ToF pre-touch in DLO manipulation tasks REMODEL is faced with. More in detail, the manipulation of DLOs requires an accurate 3D reconstruction of the wires to allow a correct grasp for the execution of the following task (e.g., wire insertion, wire routing). In this paper, to reach this goal, a custom hardware and software design for a ToF based sensor is presented. Additionally, to evaluate if the sensor performance is adequate to the objective, a detailed characterization is also reported. Specific experiments have been defined and carried out to evaluate the proposed solution with thin wires.
The paper is organized as follows.
Section 2 describes the main design features of the pre-touch sensor used in this paper.
Section 3 tackles the sensor characterization by reporting the main characteristics as Signal-to-Noise Ratio (SNR), repeatability and hysteresis.
Section 4 describes more in detail the scanning procedure used to extract the shape and pose information from the pre-touch sensor data.
Section 5 reports the experimental analysis and results. Finally,
Section 6 highlights the conclusion and the future works.
2. Sensor Technology
This section describes the mechanical, software (SW) and hardware (HW) design of the proposed prototype. The design completely refers to the custom solution presented in this work. Only few references to the chip datasheet are reported in order to provide general functioning information used in
Section 3 and to support a more detailed comparison between the proposed solution and a commercial one.
Starting from the tactile sensor developed and presented by the authors in [
16,
17], the pre-touch (proximity) sensor prototype described in this paper has been designed in order to be compatible with the existing tactile sensor solution from both mechanics and hardware/software points of view. In particular, the compatibility of the new sensors with the mentioned tactile one represented the principal design constraint, e.g., the new board has been designed in such a way it can be installed on the rear side of the tactile sensor and respecting the electrical and software interface of the latter. The choice of a reliable, accurate, but also small-sized proximity sensor is mandatory in order to not significantly alter the shape and dimensions of the tactile sensor chassis. Given the previously listed requirements, the VL6180X Time-of-Flight sensor provided by STMicroelectronics has been chosen.
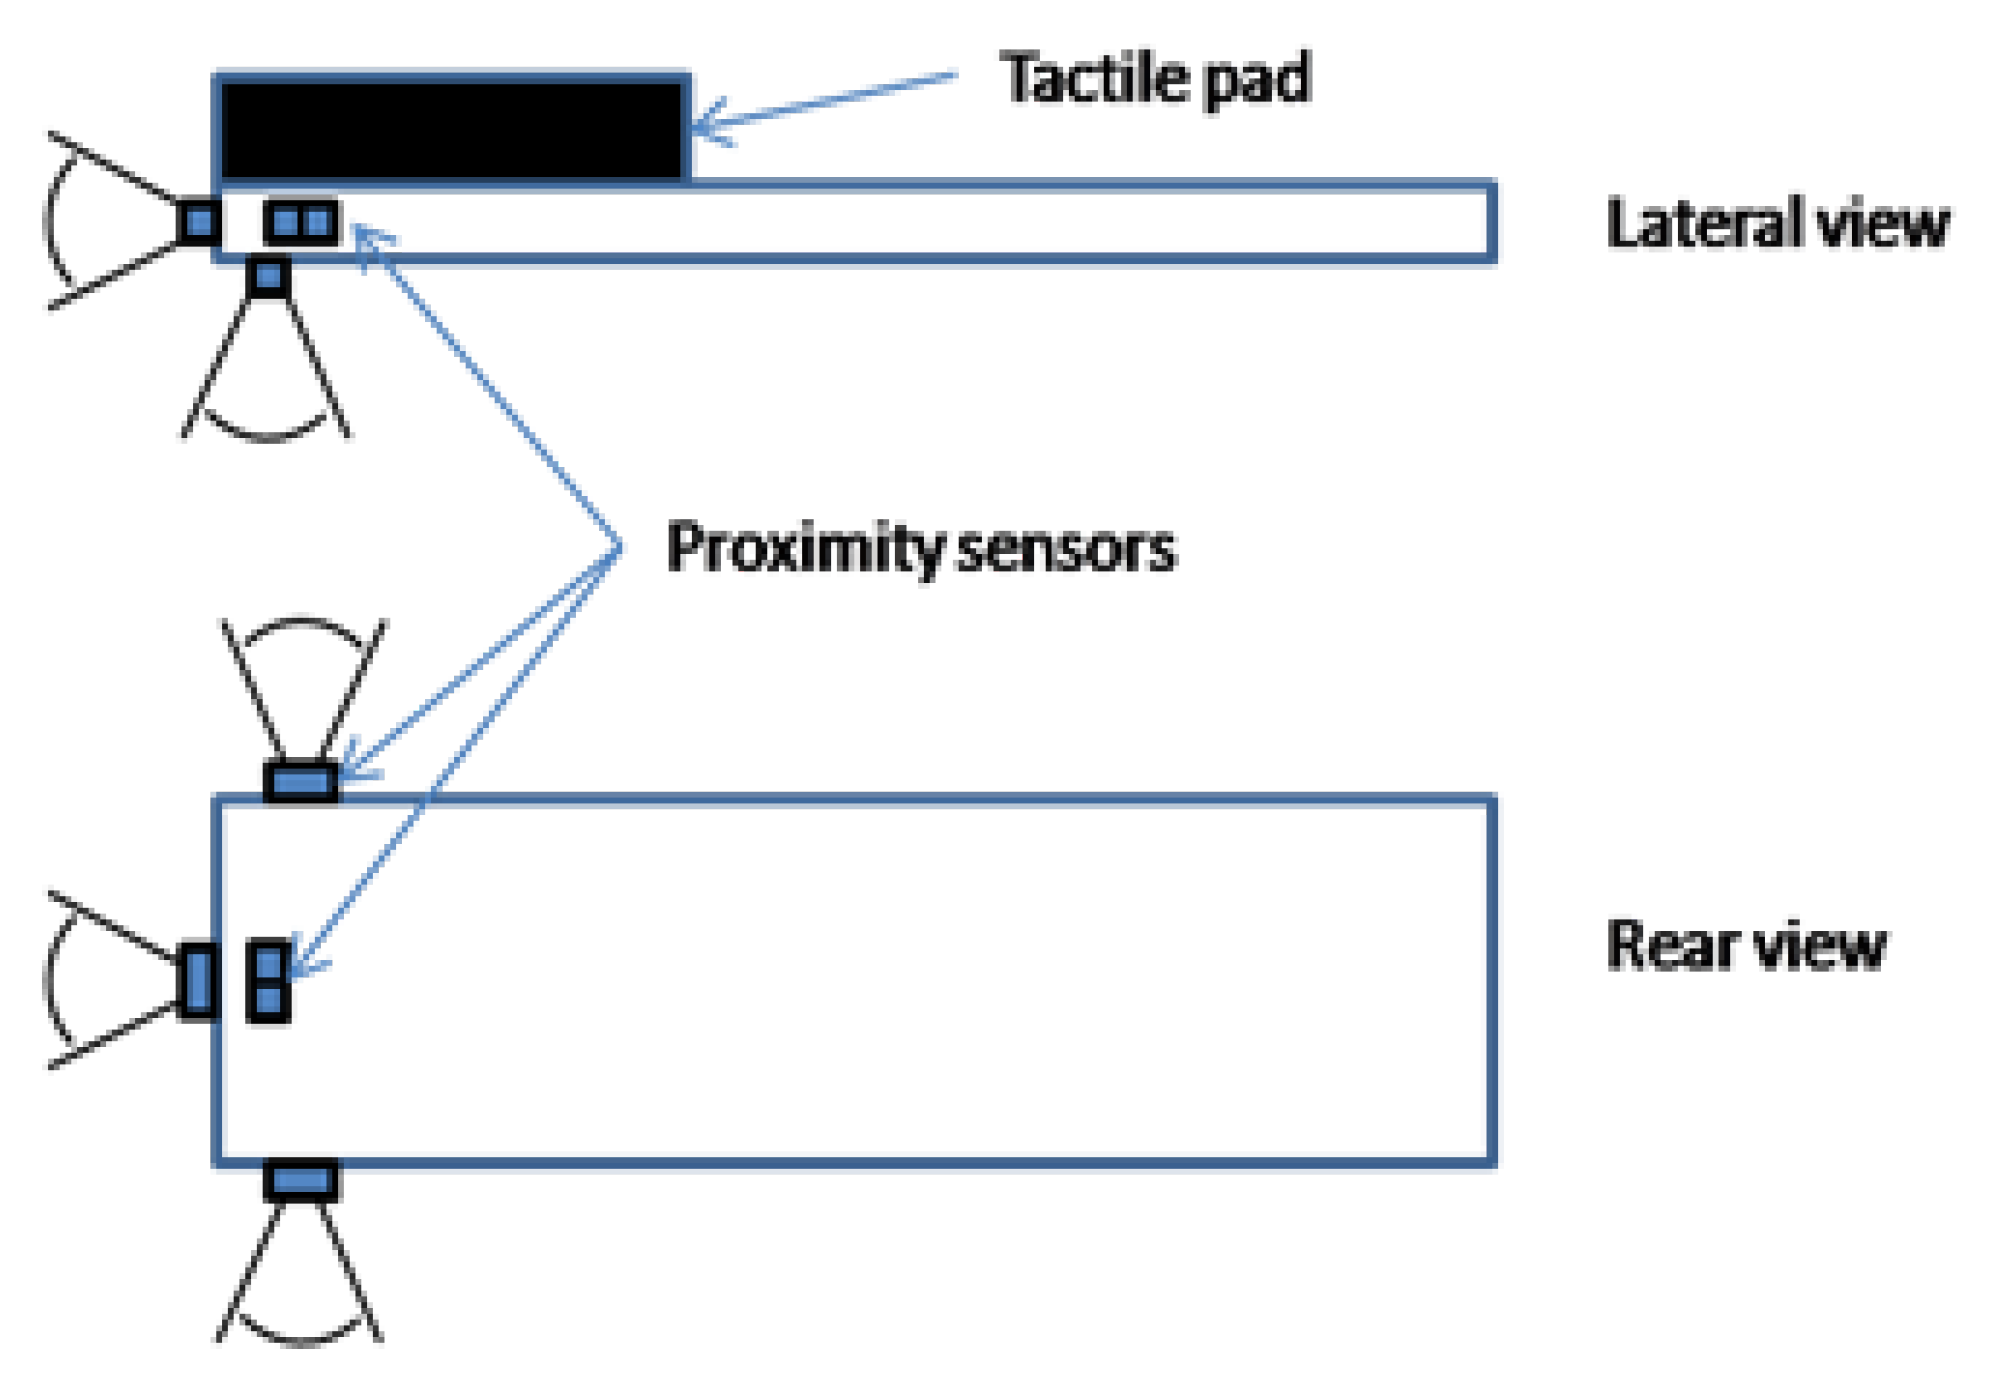
As said before, the ideas behind the integration of proximity sensors on the tactile finger are two: (a) to detect unknown objects in the surroundings of the sensorized finger when a robotic arm, where the latter is installed on, is performing a pick and place task; (b) to estimate the position and the shape of close objects, i.e., thin wires, that the robotic gripper has to grasp and manipulate. Proximity sensors have to be placed along different axis in order to detect objects in all the directions, see
Figure 1. From that comes the need of designing small and multiple proximity sensor modules which can be installed, with a Plug&Play procedure, on the existent tactile sensor using small and non-invasive connectors and PCBs.
2.1. Mechanical Design
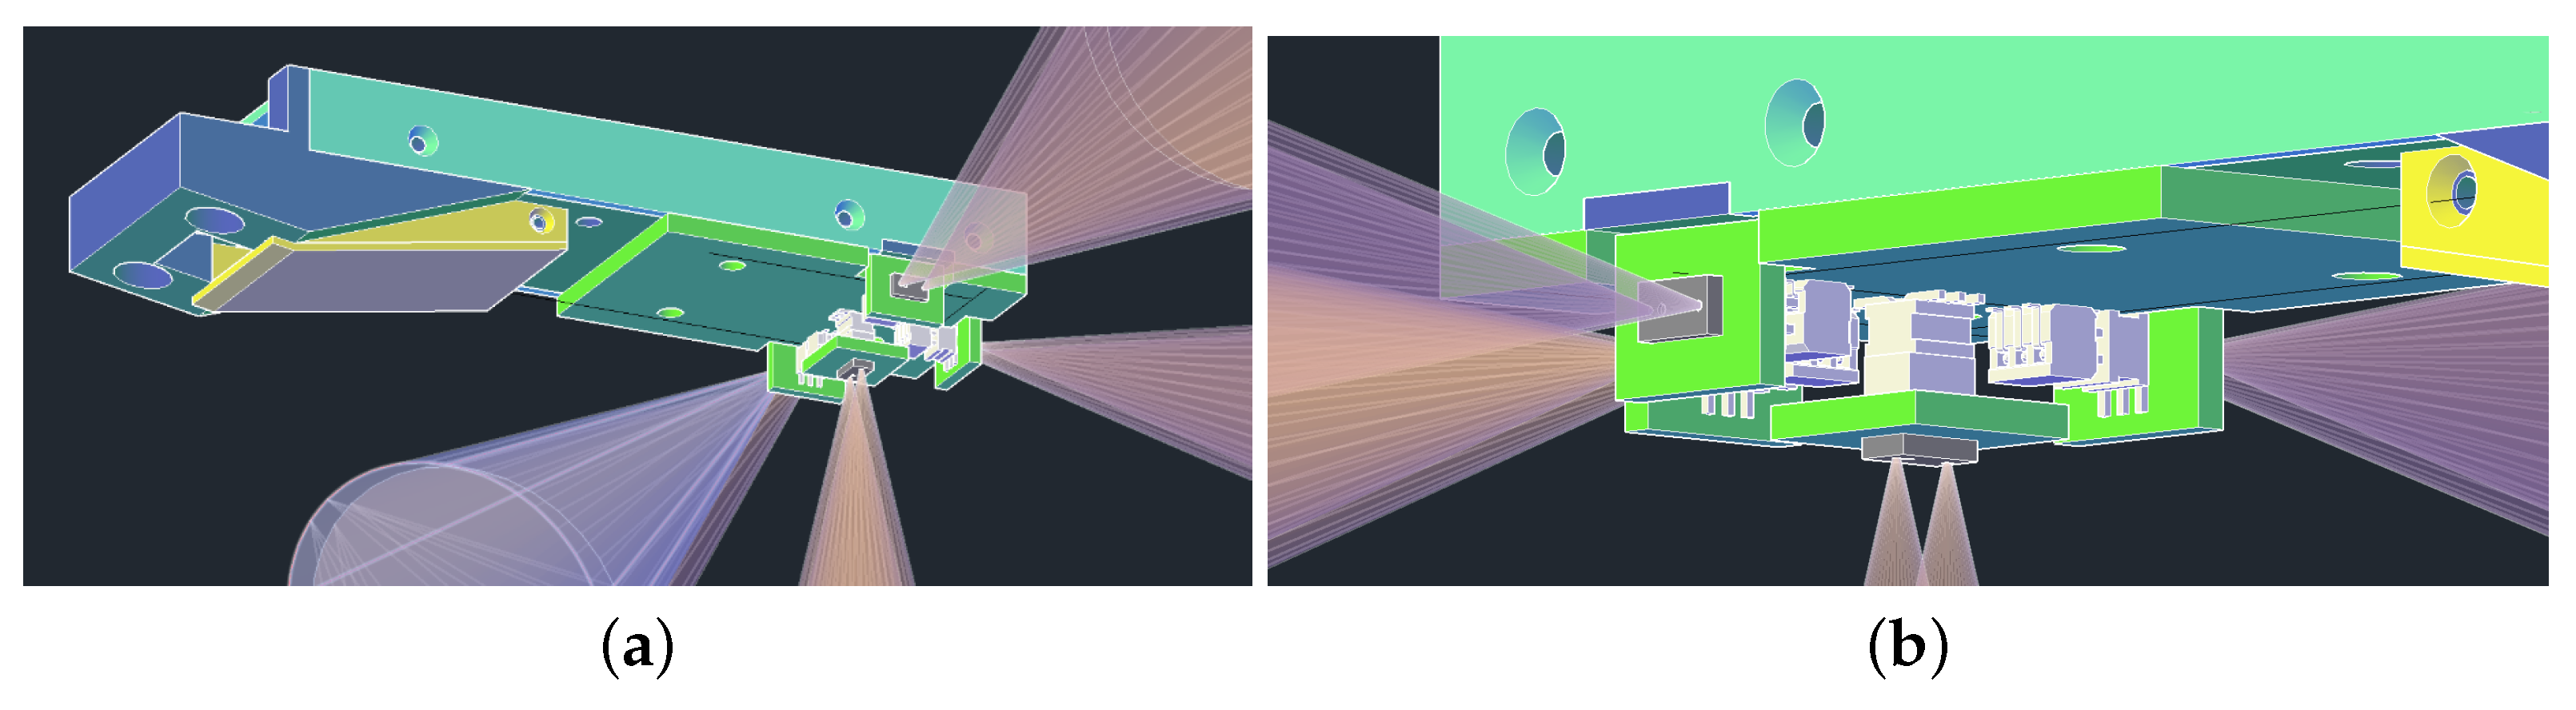
The mechanical design starts from the CAD drawings of the tactile sensor chassis. In order to cover four directions around the tactile sensor with the proximity module Field of View (FoV) and given the limited space available on the pre-existent chassis of the tactile sensor, i.e.,
mm, specific connection solutions have been detected. The chosen connectors allow for the installation of new and small PCBs forming 90 degrees w.r.t. the tactile sensor chassis by guaranteeing a low height profile of the pre-existent chassis, i.e., new electronics can be embedded in
mm height-sized box. In fact, with the detected components, it is possible to design proximity sensor modules with very small PCBs, i.e.,
mm. See
Figure 2 for the CAD drawings.
For more details, the part numbers of the connectors are listed below:
Samtec CLP-103-02-F-DH: female horizontal low profile connector;
Samtec FTSH-103-04-F-DV: male vertical connector (compatible with CLP-103-02-F-DH);
Samtec CLP-103-02-F-D: female vertical low profile connector;
Samtec FTSH-103-03-F-DV: male vertical connector (compatible with CLP-103-02-F-D).
2.2. Hardware Design
This section describes the design of the system from a hardware point of view. The electronics has been developed in order to separate the pre-touch system into two parts:
An interface board, which shall be installed on the rear side of the tactile sensor chassis;
A self consistent sensor module, that hosts the VL6180X.
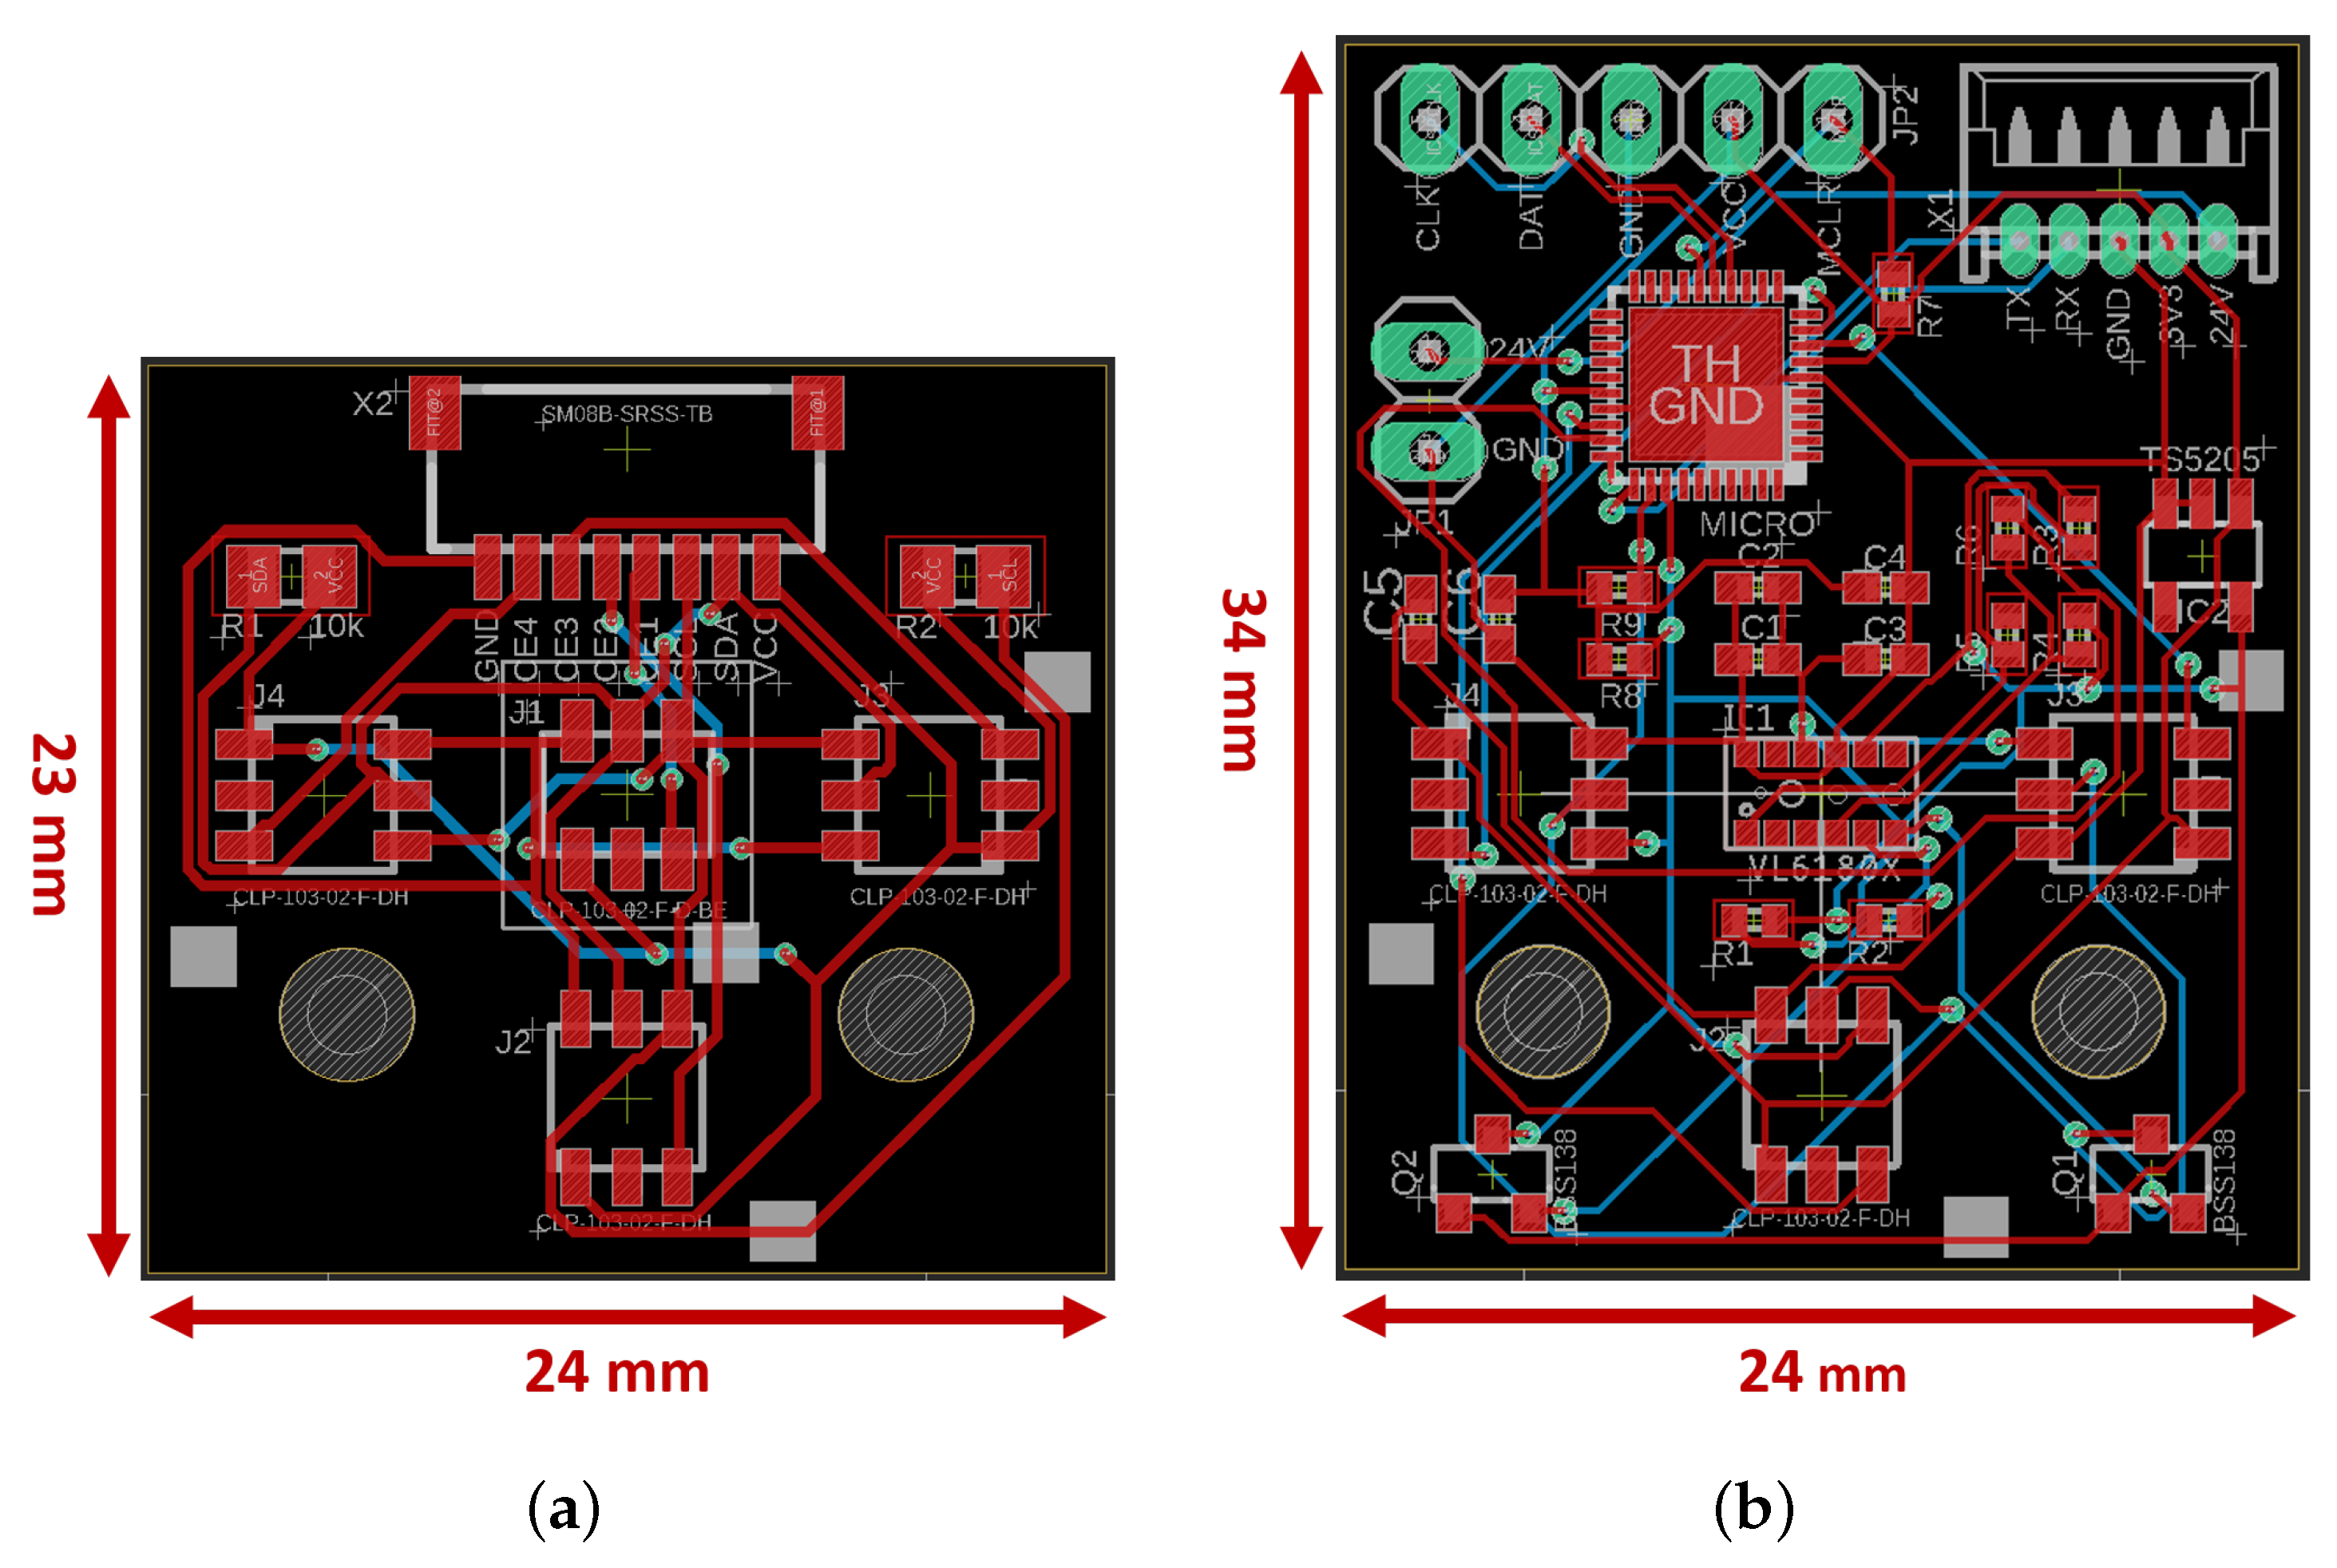
According to the specific need to locally have or not a dedicated processing unit, two versions of the interface board have been designed. The first one (v1) represents only an adapter, a kind of bridge, between the proximity sensor modules and the interrogation board of the tactile sensor. The board, whose dimensions are
mm, is able to host up to four proximity sensor modules through horizontal connectors and can be connected to the tactile board via a 8-ways connector, i.e., JST SM08B-SRSS-TB.
Figure 3a reports the Eagle [
21] view of the designed 2-layers PCB, while
Table 1 reports the interface connector pinout.
The second version (v2) of the interface board provides a complete, compact (
mm) interrogation system for the proximity sensor modules. As the first version, it can host up to four proximity modules, but it provides also an elaboration unit for sensor data acquisition. The MCU is a PIC microcontroller, i.e., Microchip PIC16F19176. The microcontroller can be externally interrogated through a Serial Bus via the 5-ways interface connector, while it scans the proximity sensor modules via I2C interface. Differently from the v1, in the v2 the middle proximity module is directly soldered on the PCB and it is no more connected through the connector. Moreover, the board provides the programming connector that can be used to flash the PIC firmware via PicKit 3 programmer.
Figure 3b reports the Eagle view of the designed 2-layers PCB, while
Table 2 reports the interface and programming connectors pinout.
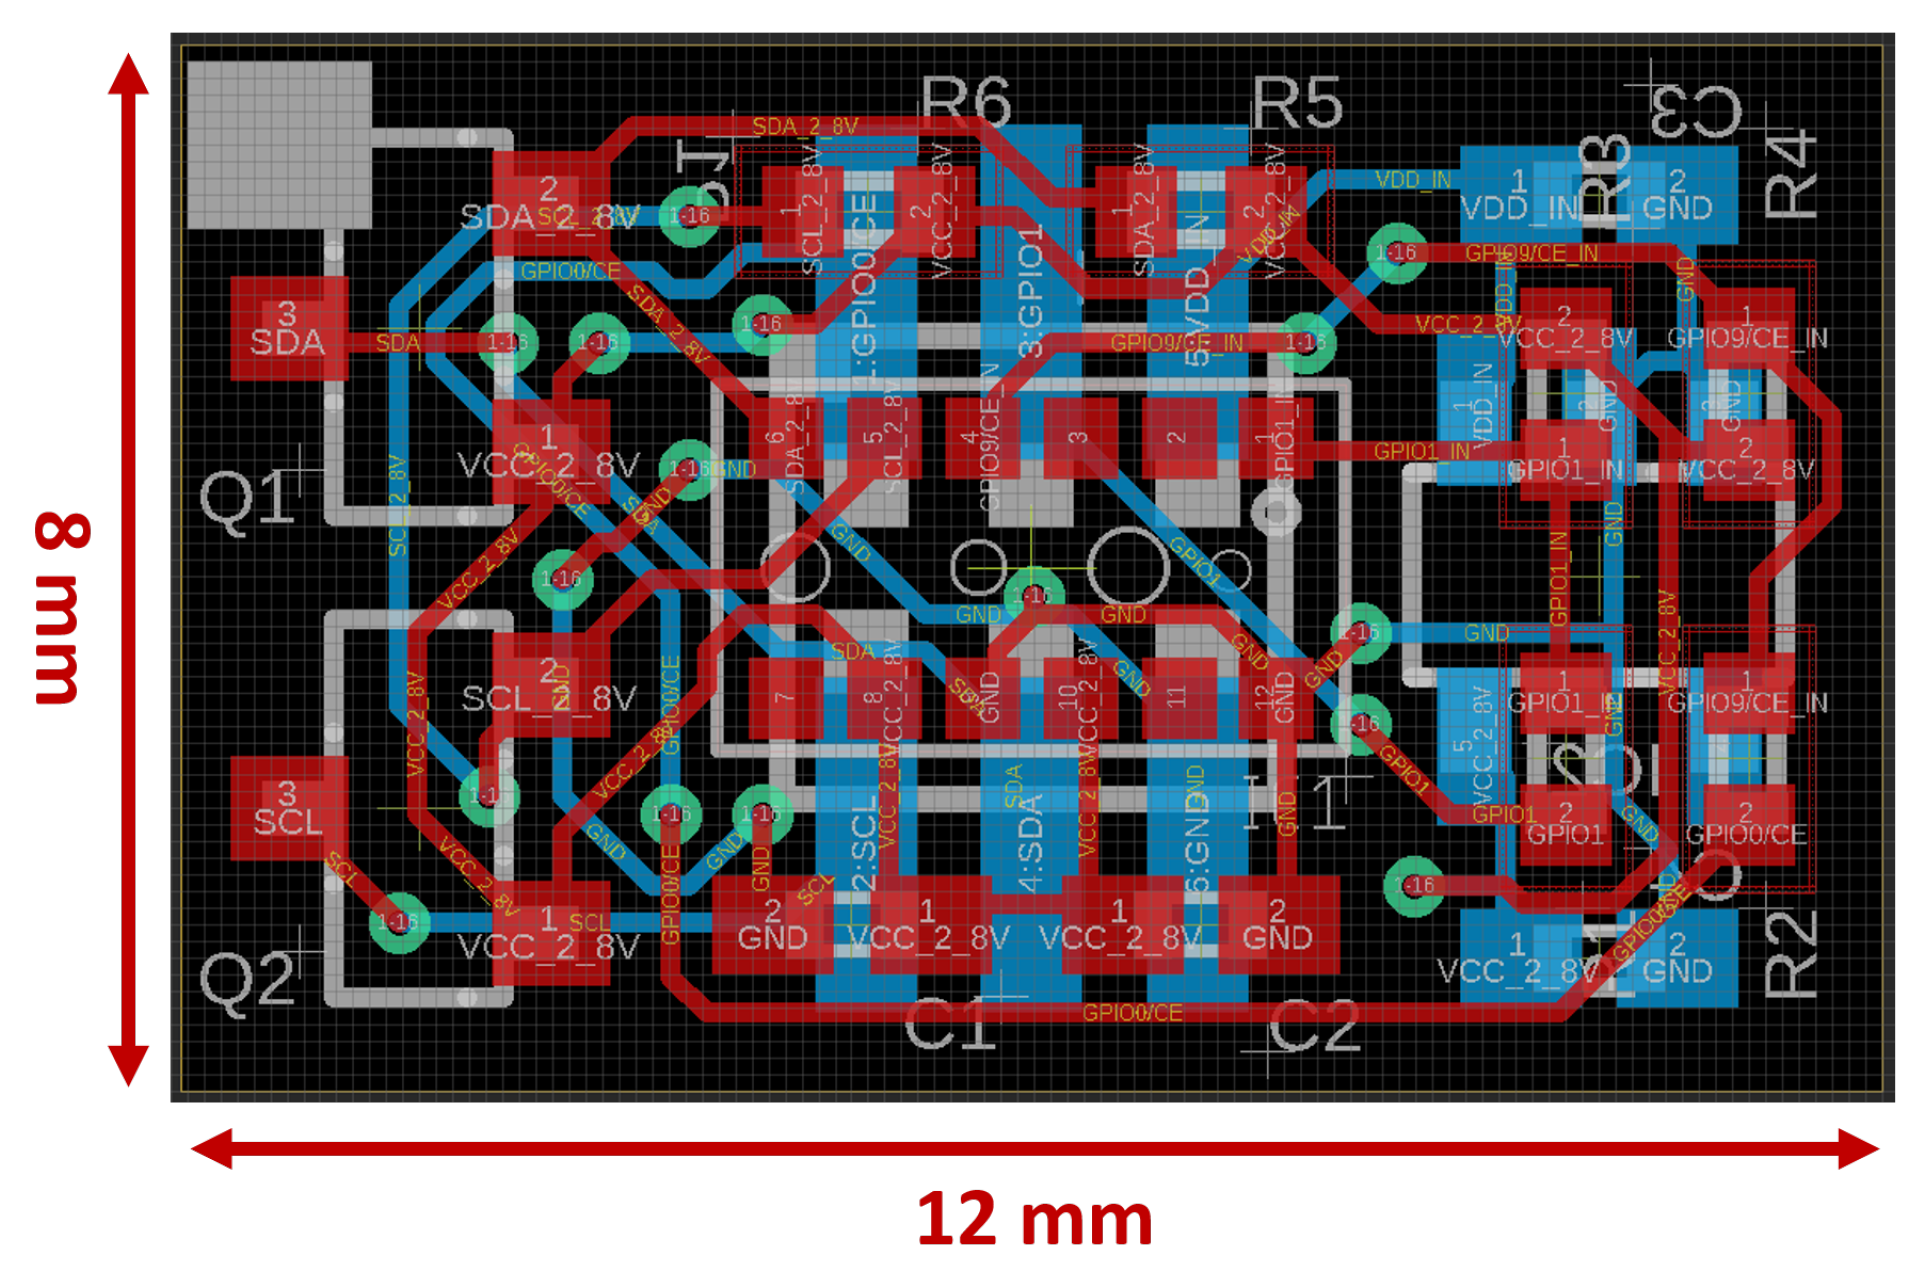
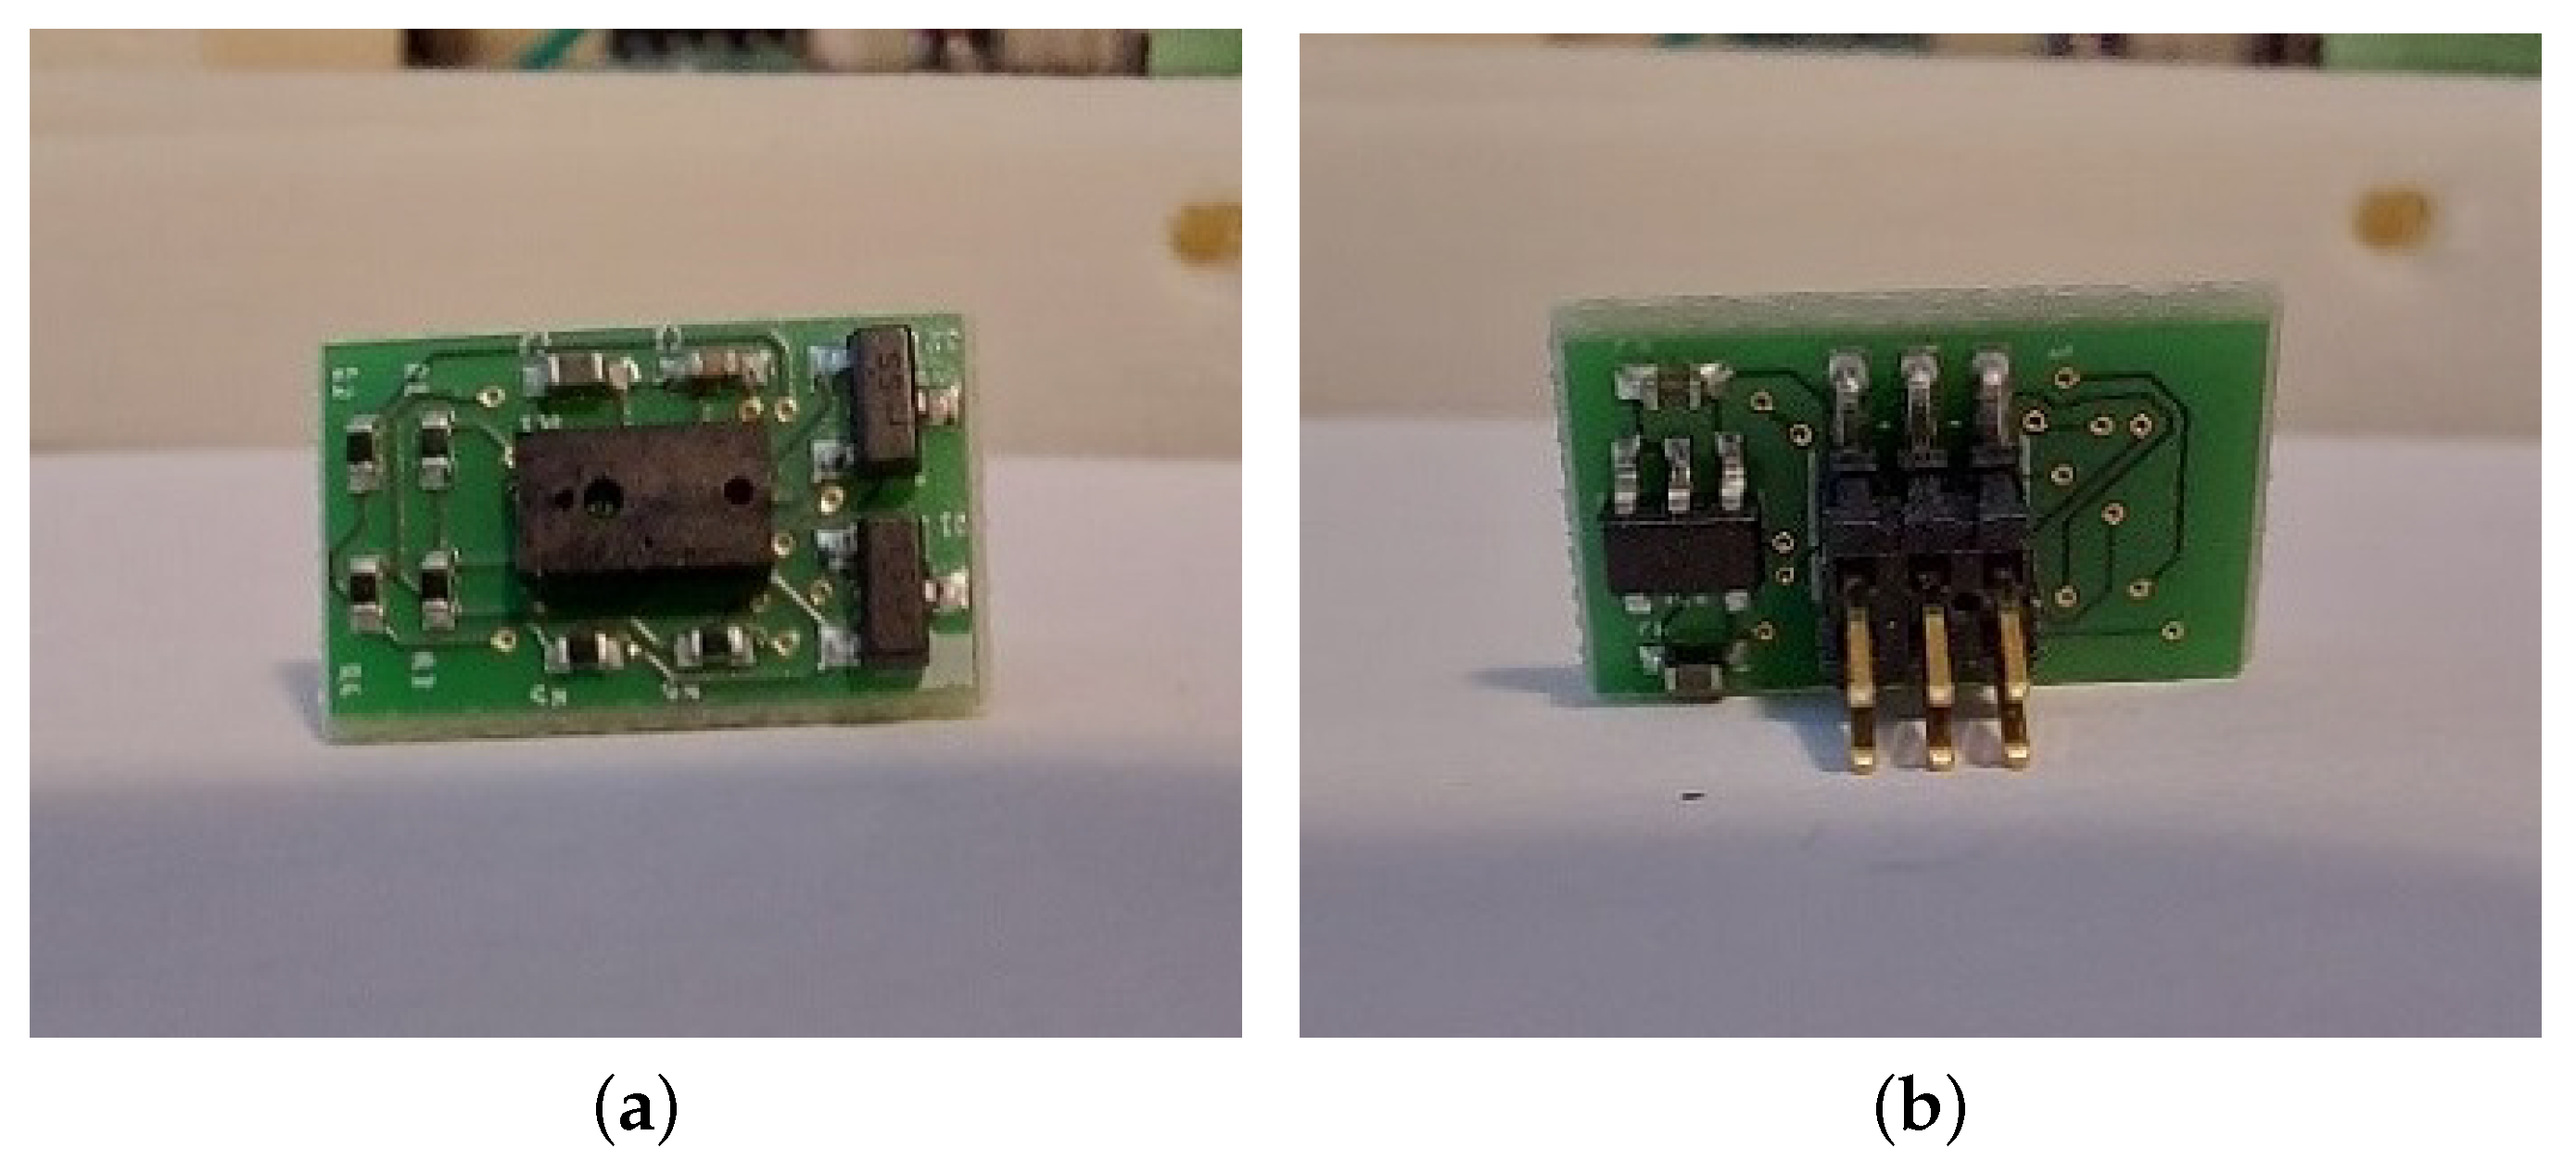
Concerning the proximity sensor module, it has been designed in order to obtain a self consistent module. The module PCB hosts all the components needed to properly communicate with the VL6180X device and to supply it: a LDO Regulator, i.e., TPS76928 by Texas Instruments, is used to provide the
V to the sensor, while two NXP BSS138 are used as level shifters to adapt the logic levels for the I2C bus. The module, with dimensions of only
mm, can be accessed via a 6-ways Samtec connector, namely, the Samtec FTSH-103-04-F-DV.
Figure 4 shows the Eagle view of the PCB of the proximity sensor module, while
Figure 5 shows the top and bottom perspectives of the complete proximity sensor module.
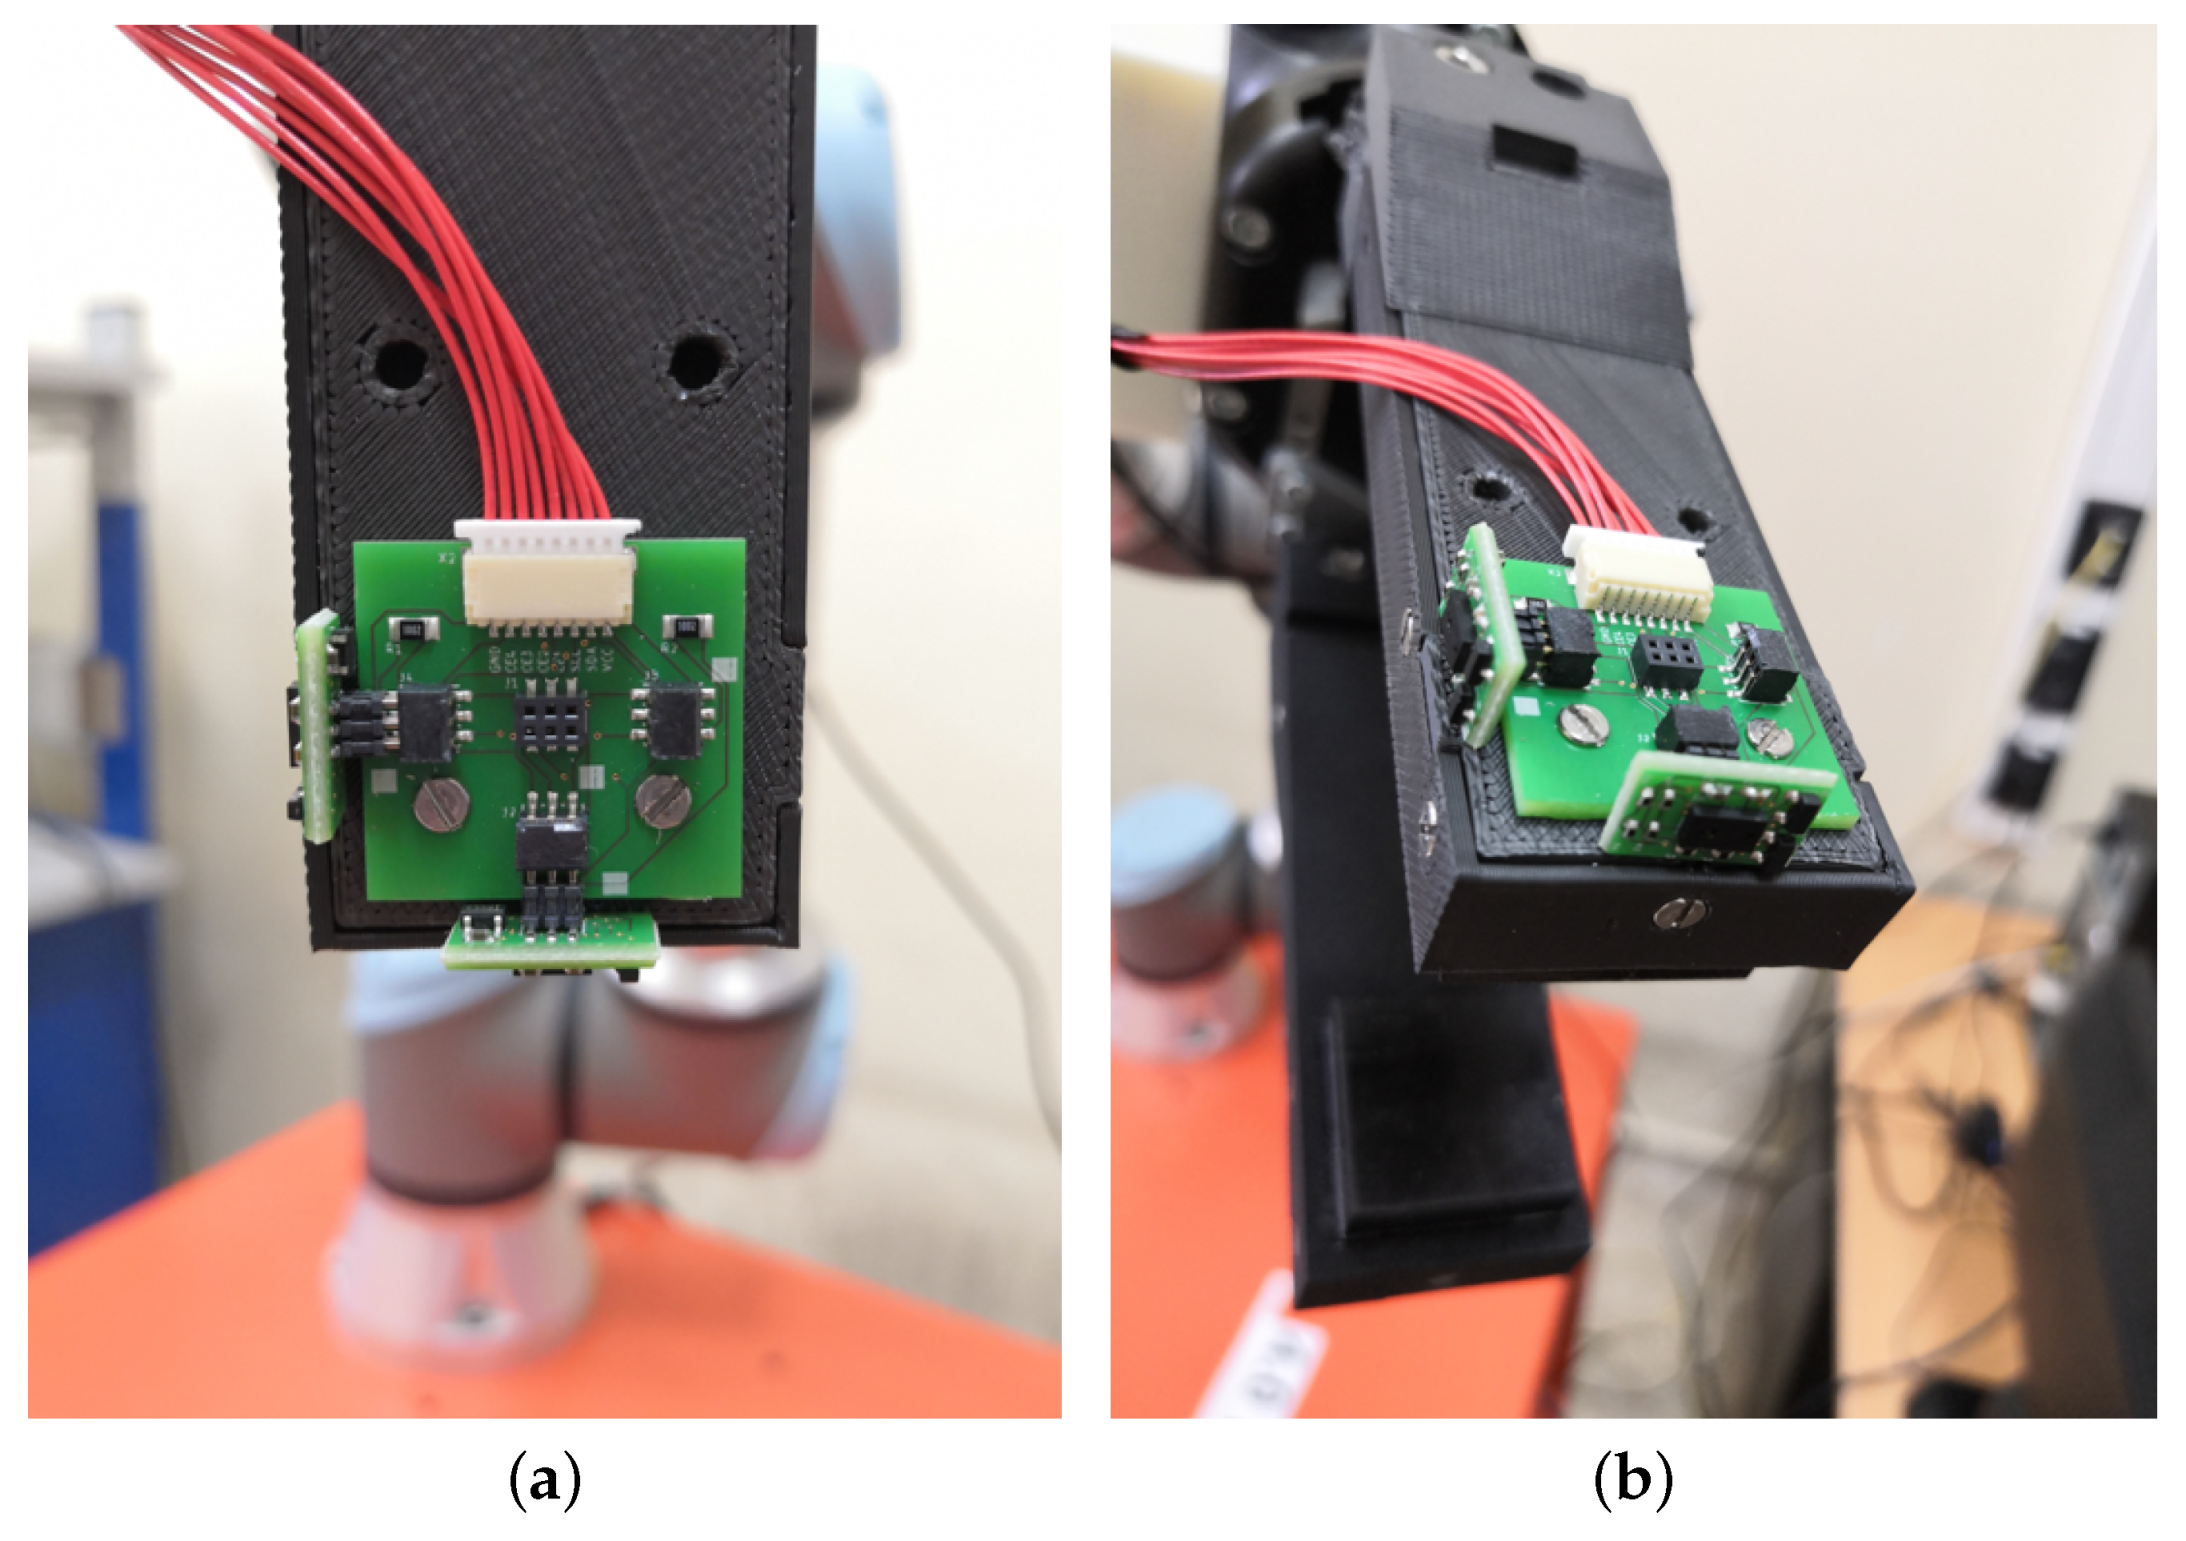
Figure 6 reports a view of the complete system composed by the Interface Board (v1) and two proximity sensor modules integrated on the same finger that hosts the tactile sensor.
2.3. Software Design-MCU Side
The VL6180X is a Time-of-Flight proximity sensor that communicates with a microcontroller system through a serial I2C bus (it represents a slave device). The communication protocol is not a standard one, so a custom I2C low level driver for read and write operations needs to be developed. As described in
Section 2.2, the chosen elaboration unit is a Microchip PIC16F19175/176 microcontroller, so the Microchip MPLab IDE and XC8 compiler have been chosen as firmware development toolchain. According to [
22], the VL6180X has different registers that can be used to:
Configure the range measurement functionality;
Configure the ambient light sensor measurement functionality;
Configure the convergence time;
Configure the measurement period;
Read the sensor measurements.
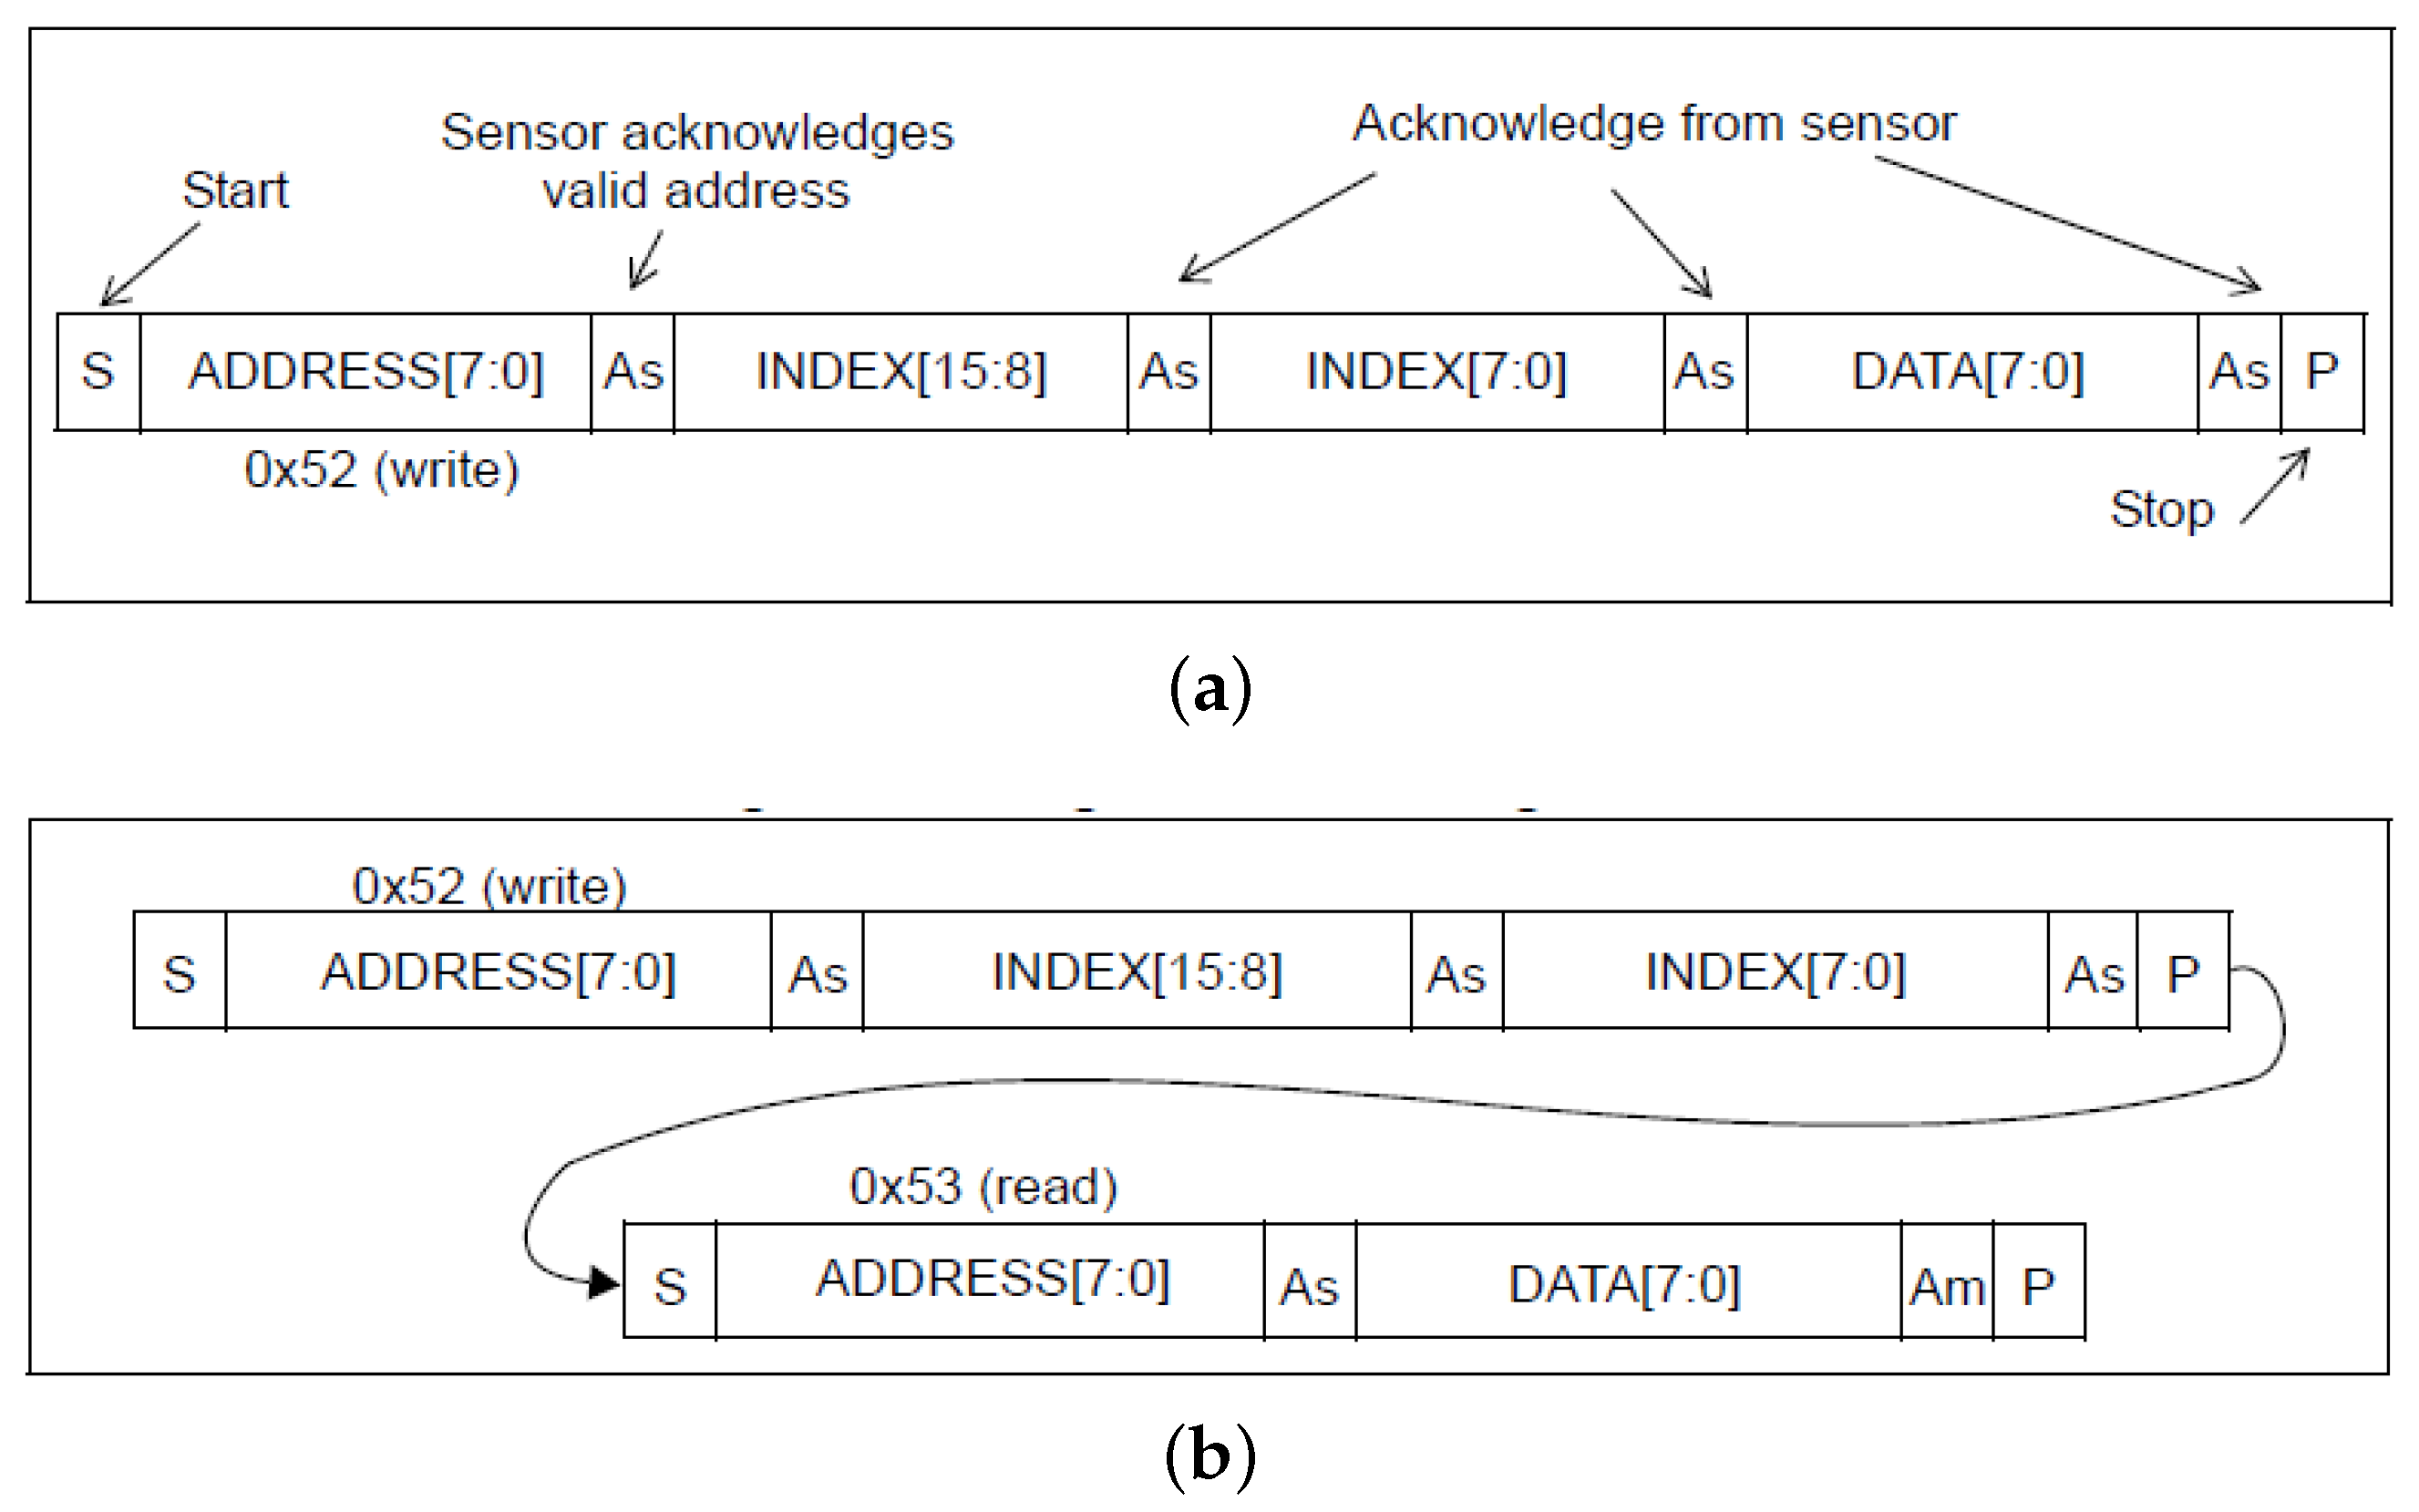
In order to access to the mentioned registers, the I2C protocol reported in
Figure 7a,b has to be implemented, where “S” is the start bit, “As” is the acknowledge of the slave device, “Am” is the acknowledge of the master device and “P” is the stop bit. A high level API library has been developed in order to allow the user to easily configure the device and read the range measurements. The APIs are listed below:
uint8_t VL6180X_IdentifyDevices(void): identifies the number of VL6180X devices on the I2C bus;
void VL61800X_SetChipEnable(uint8_t DeviceNumber): enables the device through the dedicated GPIO microcontroller pin;
bool VL6180X_WriteRegister(uint8_t address, uint16_t reg, uint8_t data): writes a device register;
uint8_t VL6180X_ReadRegister(uint8_t address, uint16_t reg, bool error): reads a device register;
void VL6180X_SetupRegisters(uint8_t DeviceNumber): setups all the configuration registers of the device;
void VL6180X_MeasureRange(uint8_t NumDeviceToRead, uint8_t measure, uint8_t status): reads the range measurements of the devices on the I2C bus.
A typical application should call in sequence the following routines in order to properly accomplish a range measurement:
VL6180X_IdentifyDevices();
VL6180X_SetupRegisters() for each detected device;
VL6180X_MeasureRange() for one range measurement.
The specific SW implementation allows one to plug and unplug the proximity sensor modules without any SW modifications or re-compilations. Once the number of proximity modules changes, it is enough to restart the MCU in order to automatically re-configure it.
The developed SW library is freely available to the readers at the repository reported in [
23].
2.4. Software Design-PC Side
Concerning the design of the software developed to acquire and elaborate the data from the proximity sensors, two software versions are available, i.e., one for Windows OS systems and one for Linux OS systems. For both versions, Robot Operating System (ROS) has been selected as framework for process scheduling and inter-process communication management. In this paper, the Linux Version will be described in more detail, but generally the Windows version follows the same SW design and specifications.
The software has been designed in order to be as flexible as possible and independent on the type of sensor (also tactile sensor is compatible) and on the number of sensing elements installed on it. Moreover, due to the particular protocol used for data exchange, it is possible to automatically detect the number and the type of the sensors attached to the elaboration system, e.g., PC-based system. It means that the designed SW, in the initialization phase, is able to detect:
The number of available serial ports on the PC system;
The sensor type attached to each serial port: tactile or proximity sensor;
The number of sensing elements installed on each sensor, i.e., number of tactile elements or VL6180X modules.
Once the initialization phase is completed, the proximity sensor RAW data are made available on a ROS topic, namely, “/sensor_data” topic. The RAW data correspond to the distance (not filtered signal), in millimeters, from the observed object. The distance is codified with an unsigned integer of 8 bits (uint8_t) and the maximum reading frequency reached with the presented system is Hz for each proximity module. With the configuration used in this specific application the proximity sensor is able to measure the distance from an object with millimetric accuracy in a range from mm to mm.
If the reader is interested in having more details about the PC side—SW design and implementation, they can refer to [
17].
3. Sensor Characterization
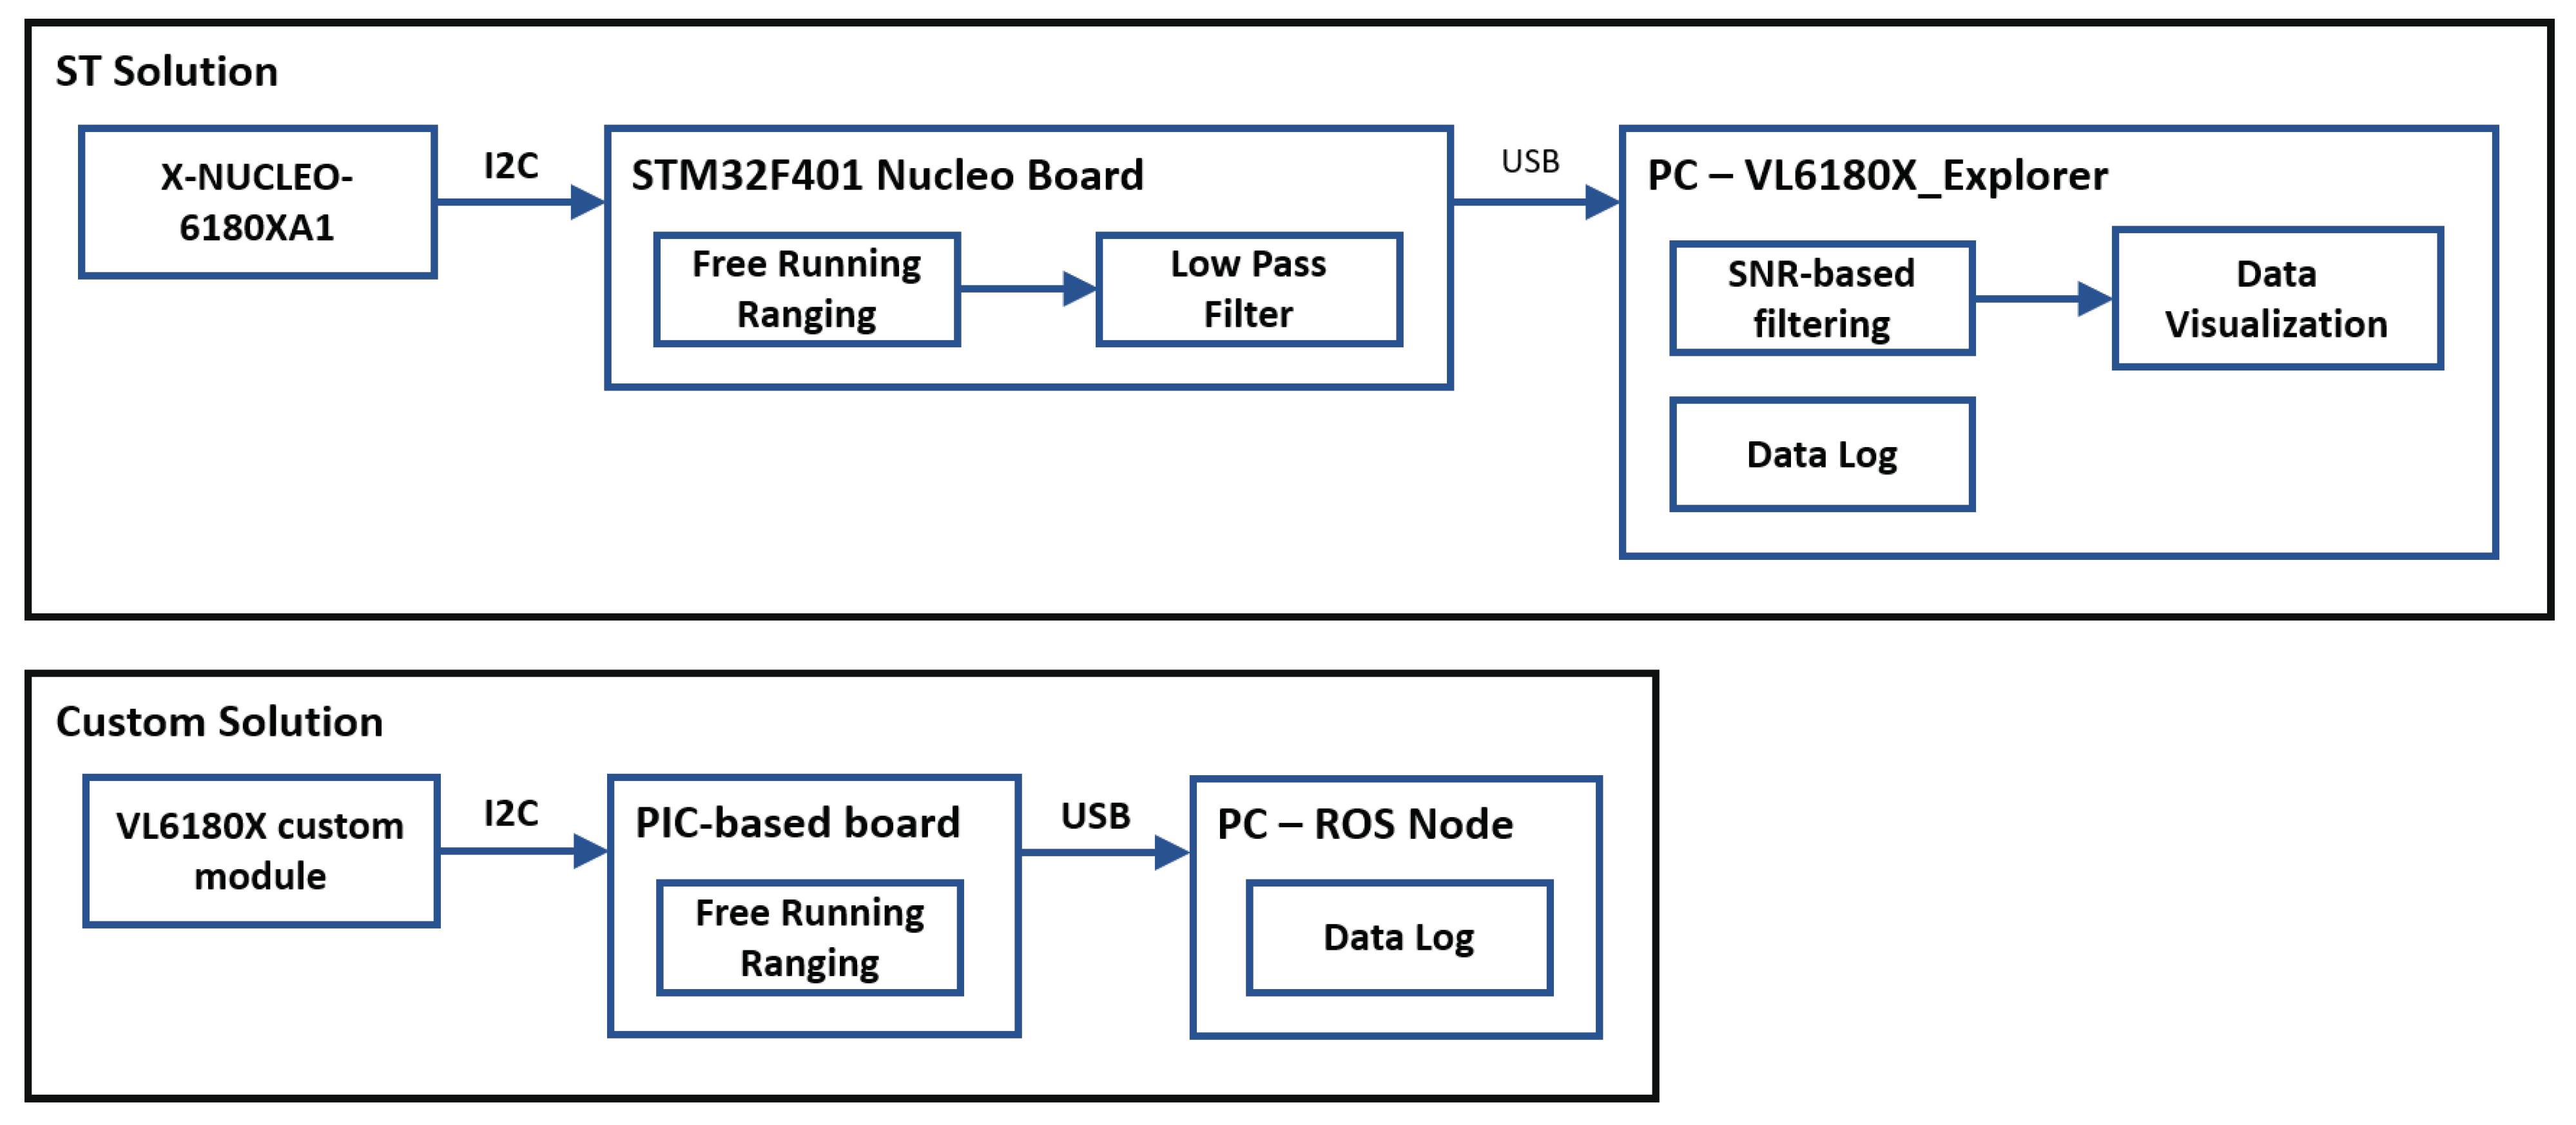
This section reports the sensor characterization in terms of repeatability, hysteresis, SNR and sampling frequency. In order to provide a complete overview of the designed system, the developed proximity sensor and the interrogation board based on the PIC MCU have been compared with the on-hand ST solution. The characterization and the comparison analyses show the effectiveness of the proposed solution. The two systems under comparison are resumed in
Table 3.
From a software point of view the ST solution provides:
A Windows-based application (VL6180X_Explorer) with a graphic interface that allows to visualize at run-time the sensor data, e.g., range in mm, Ambient Light Sensor (ALS) mode data, frequency, and to log the acquired data in CSV format;
A firmware compatible with the Windows application and the STM32F401 Nucleo Board.
To better understand how the sensor data are acquired with both systems, please refer to
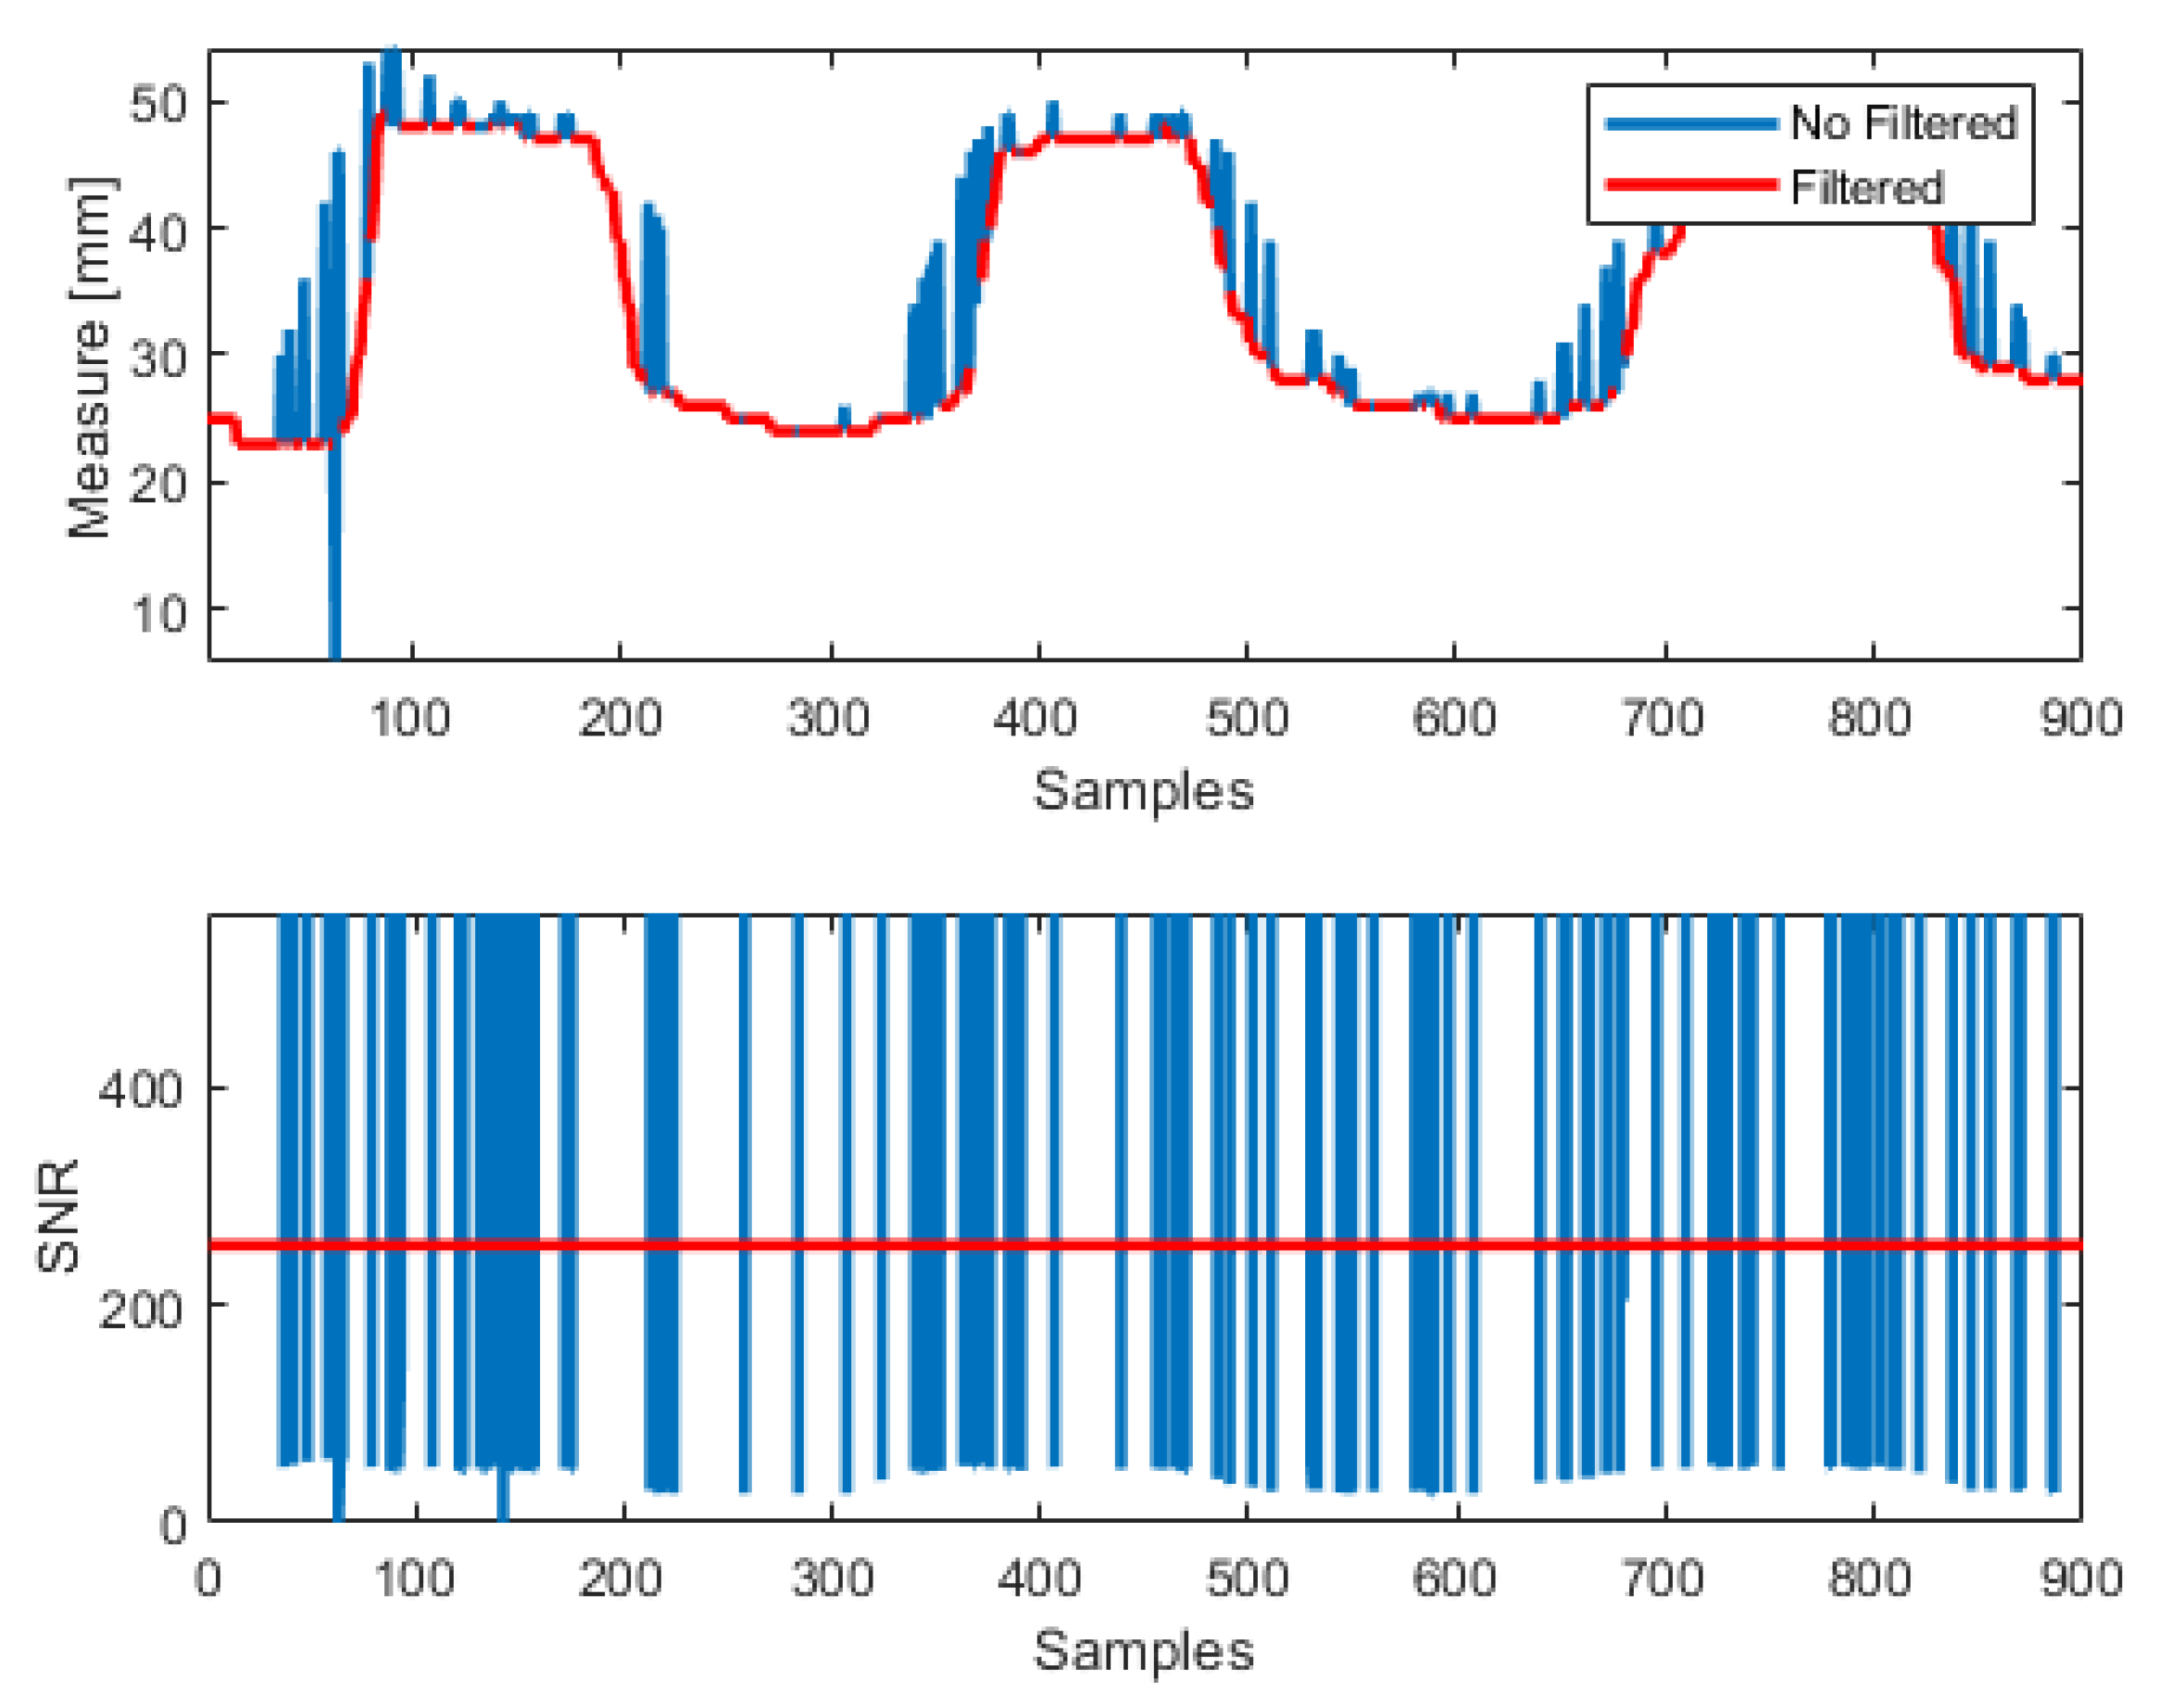
Figure 8. In the upper diagram a schematization of the operating phases for the ST solution is reported, while in the lower one there are the operating phases for the designed solution. It is clear how the ST solution does not allow one to read the RAW sensor data. In fact, at PC application level only filtered data are available. In particular, the sensor data are processed by two filtering steps:
A low pass filter (LPF) is implemented at firmware level and its output is provided to the PC application;
A filtering process based on the SNR is implemented at application level, i.e., when the SNR of a single sample is too low then the sample is discarded. The second filtering step is necessary in order to obtain a clean ranging signal. Given the low level driver configuration of VL6180X device for the ST solution, the acquired data are not always correct due to high convergence time and low SNR. The upper image in
Figure 9 shows:
The lower image, instead, reports the SNR acquired from the PC ST application. The red curve is obtained selecting the samples of the blue curve by thresholding the SNR. In particular, if a specific sample elaborated by the LPF has a SNR lower than 255, the sample itself is discarded.
Concerning the Custom Solution, the SW does not implement any filtering stage, so all the analyses are made on the RAW sensor signal.
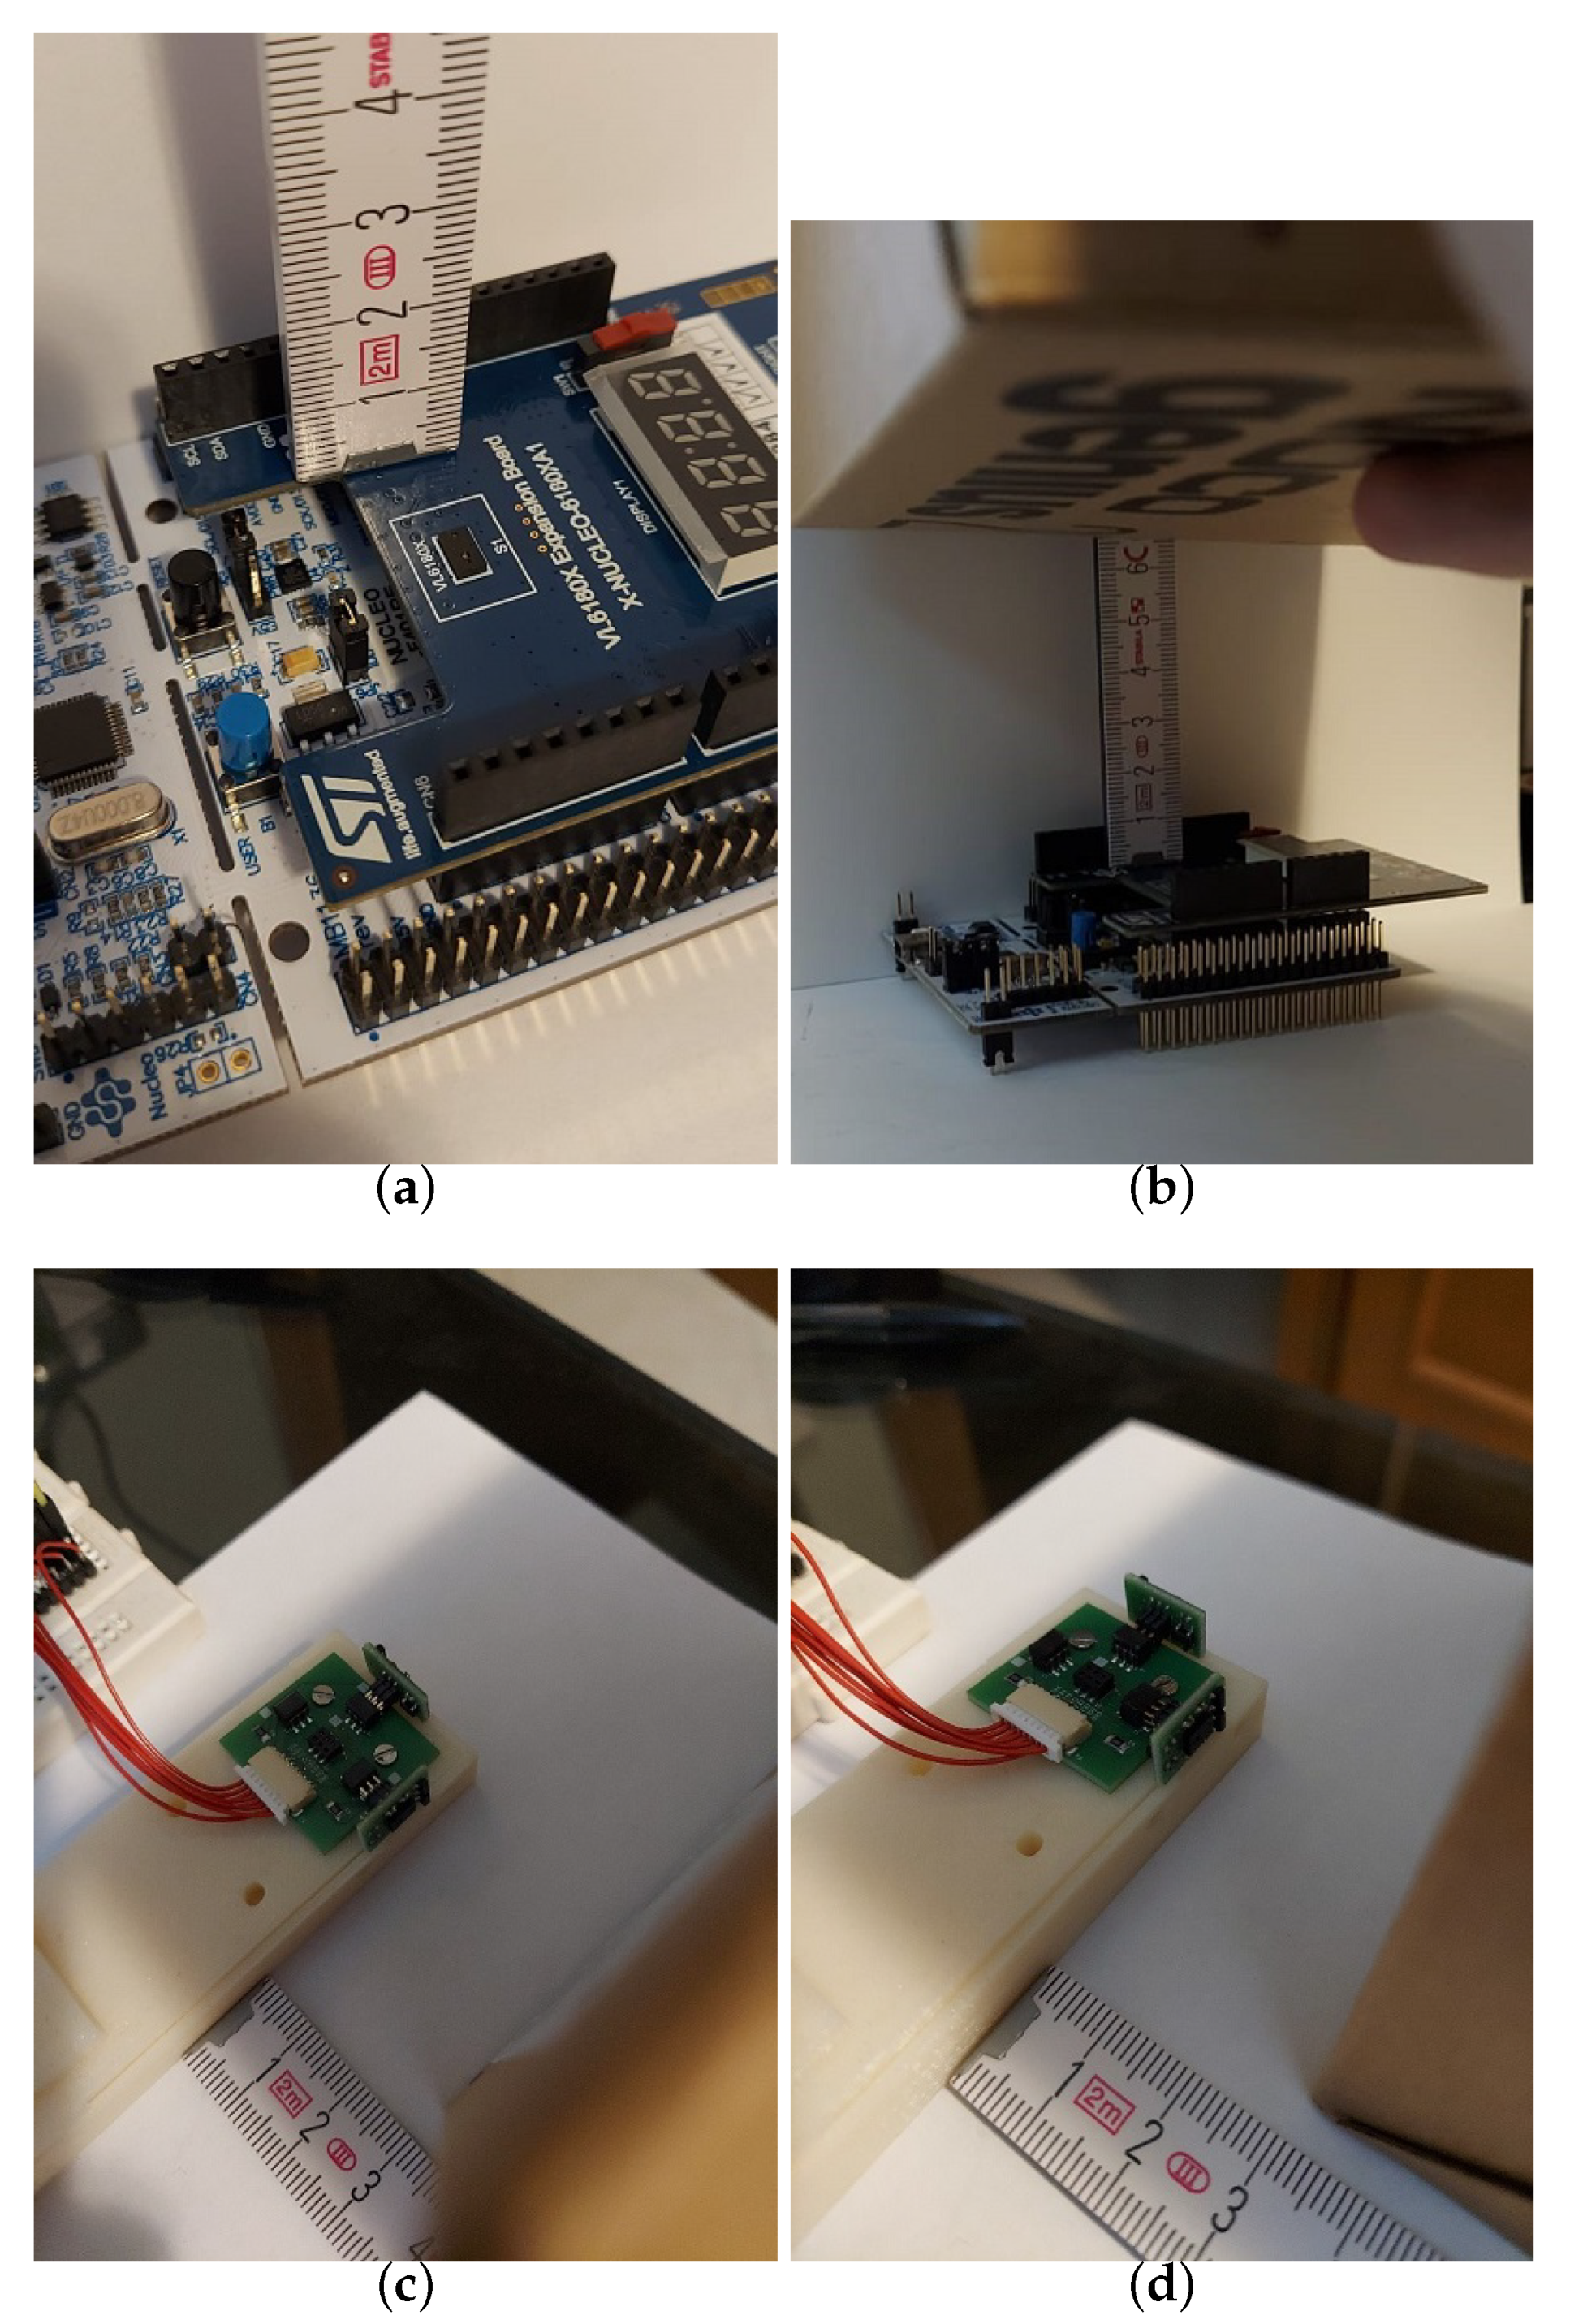
Figure 10 reports the characterization setup for the two solutions. A paper box is used as object, while a standard meter is used to measure the distance between the object and the sensor. The same setup is used for both systems’ characterization.
3.1. Sampling Frequency
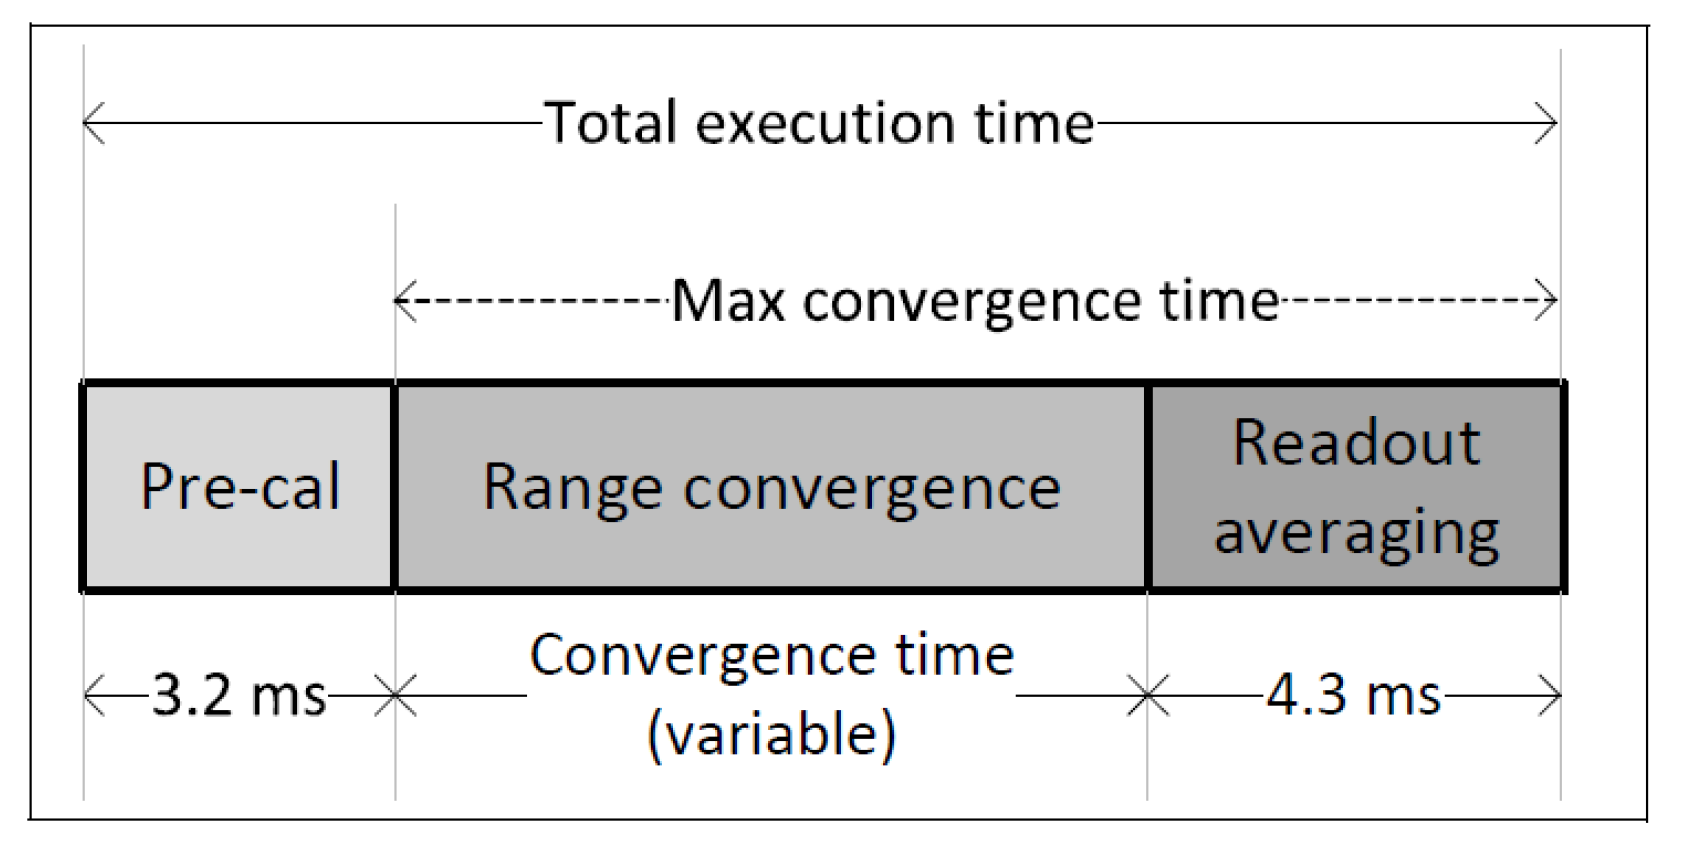
Sampling frequency characterization is of high interest for a Time-of-Flight sensor as VL6180X. In such sensors, the sampling frequency highly depends on the convergence time of each measure, hence, on the object distance. From datasheet (see
Figure 11), it can be noticed that the total execution time of a single reading process can be calculated as the sum of:
Pre-Calibration Time: 3.2 ms;
Range Convergence Time: variable;
Readout Averaging Time: 4.3 ms.
The range convergence time depends on the maximum range the sensor is configured for. For example, for a maximum range of 100 mm, the convergence time is ms with a target reflectance of % and ms with a target reflectance of %. In these conditions, a reading operation typically ranges between ms and ms that corresponds to a sampling frequency range of Hz.
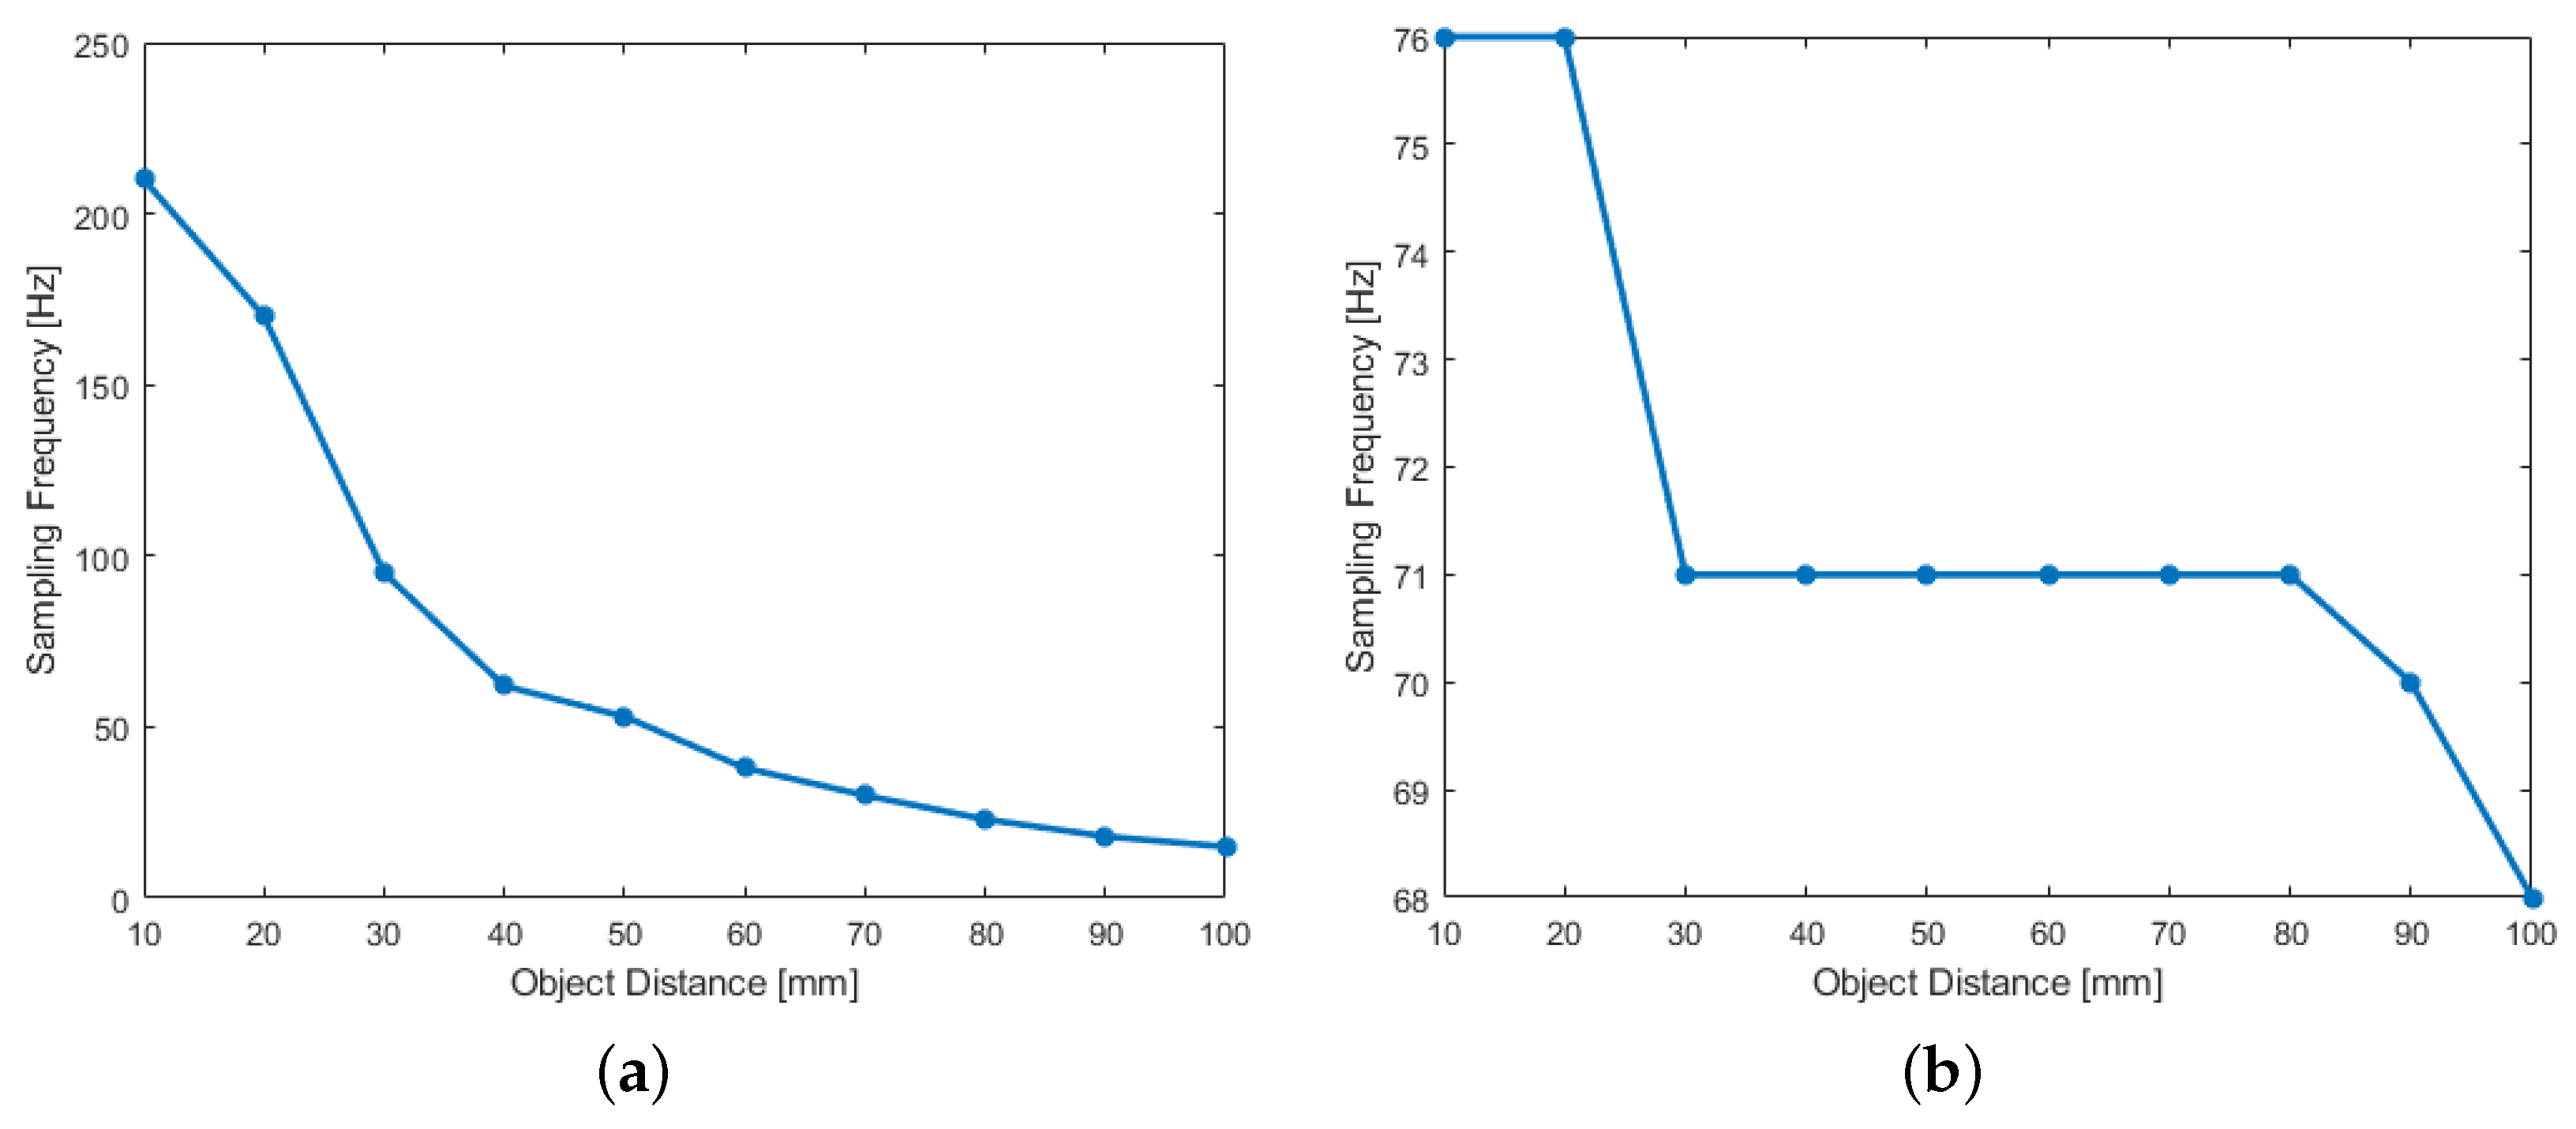
Figure 12a,b report the sampling frequency for the two systems. In the ST solution case, the behaviour described at the beginning of this chapter has to be taken into account. In particular, the sampling frequency reported in
Figure 12a refers to the data available before the second filtering stage and so it is not the sampling frequency obtained at the end of the processing channel. In both cases, the sampling frequency depends on the obstacle distance: the higher the distance, the lower the sampling frequency. The custom solution shows a more stable behavior and, in general, a higher sampling frequency when the object distance is about
mm, e.g.,
Hz.
3.2. Repeatability
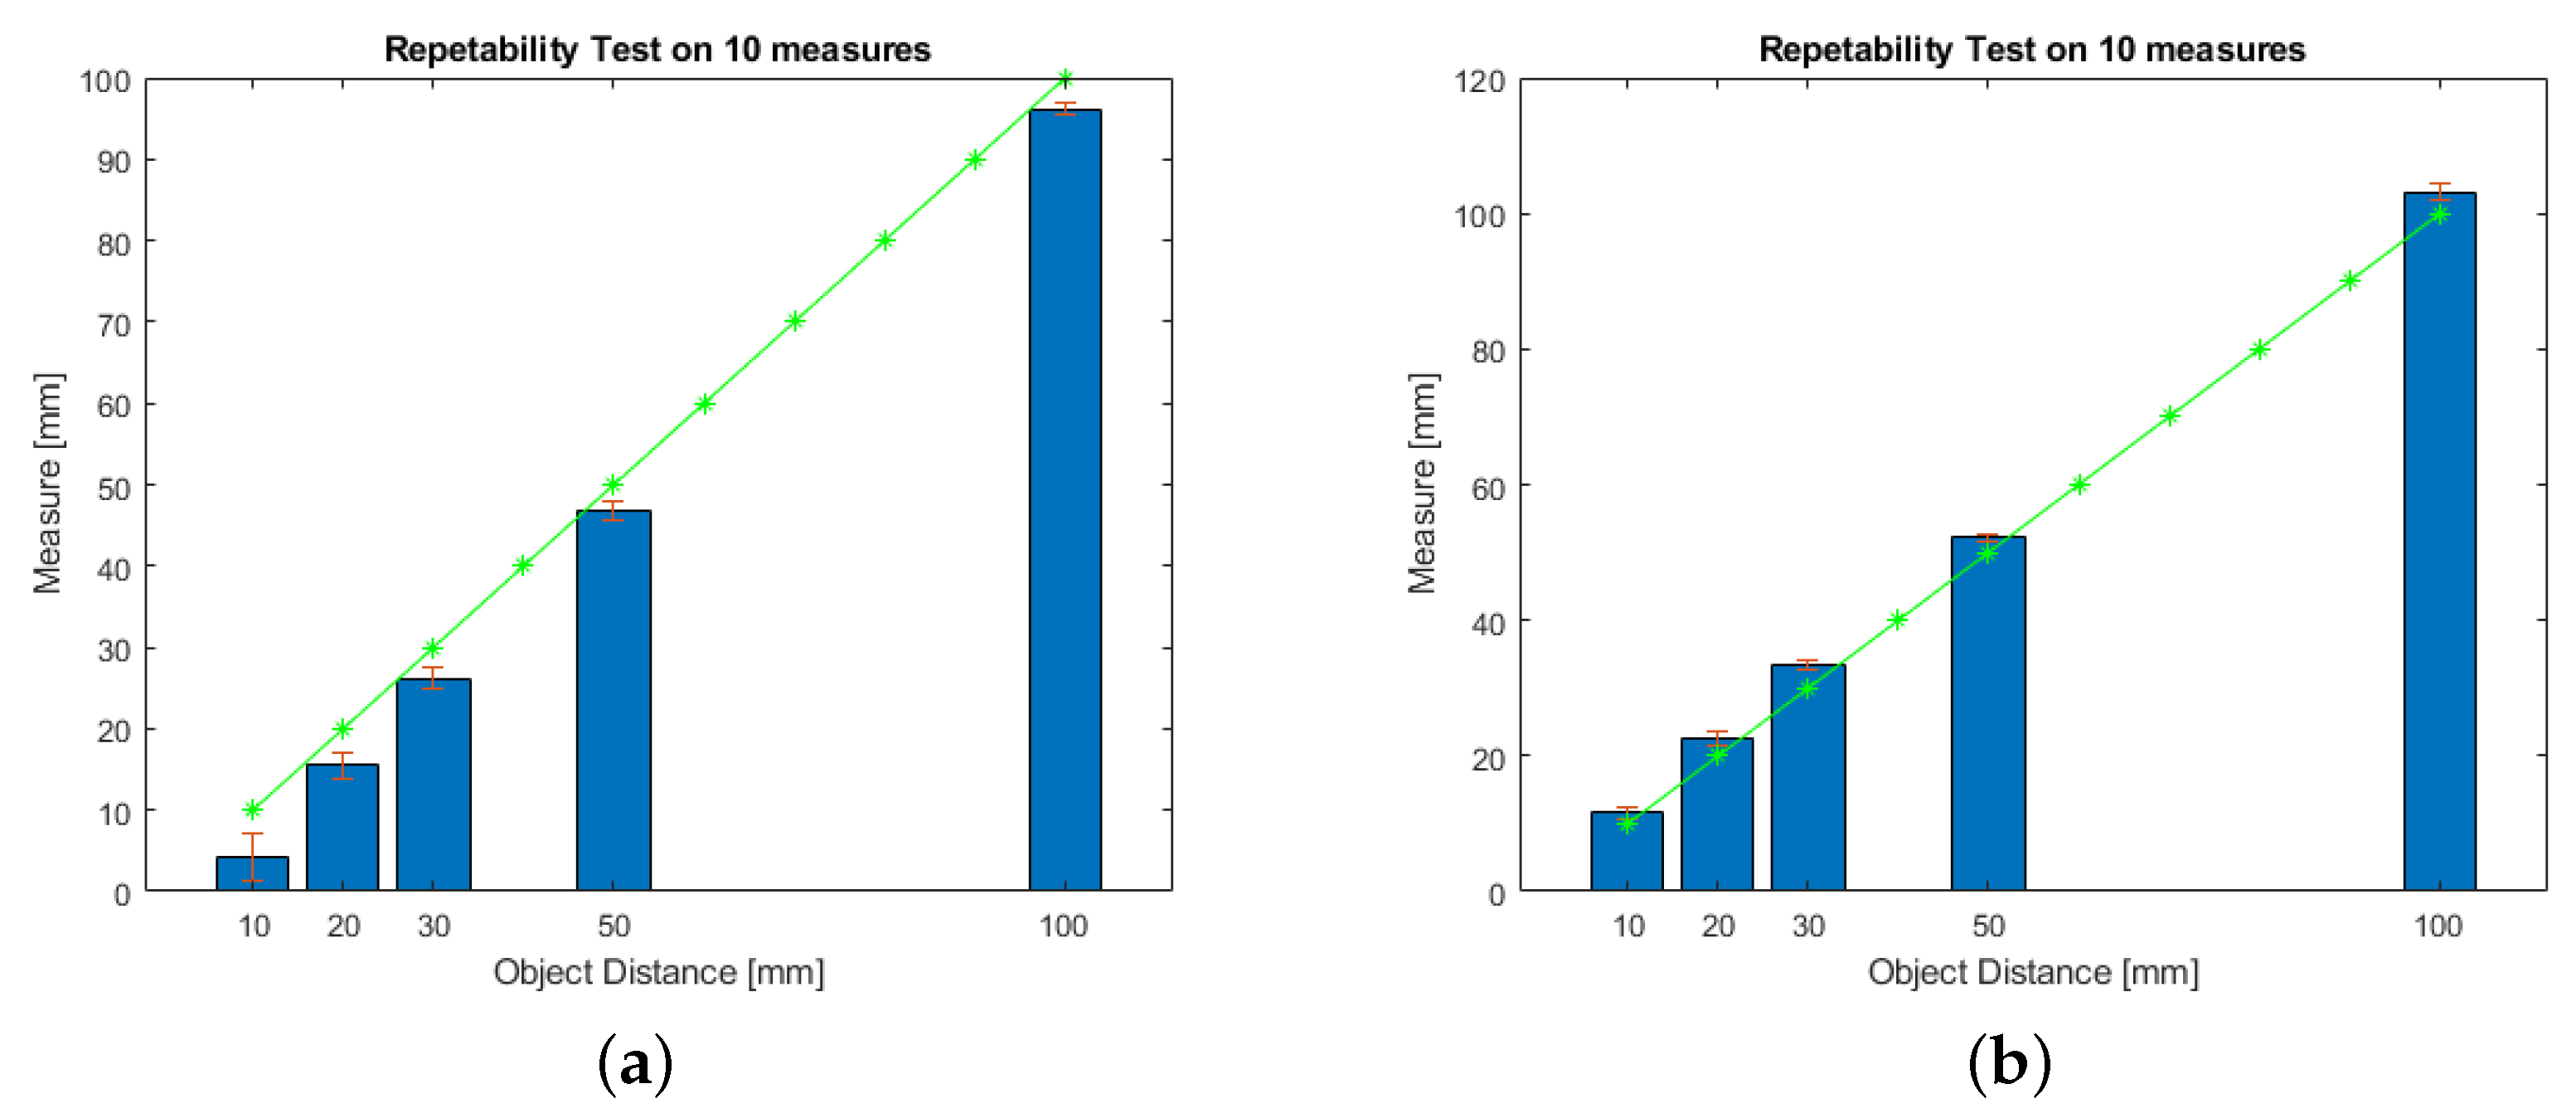
The repeatability evaluation has been carried out considering a total of 10 measurements. During the tests, the object has been moved several times in different positions in order to obtain 10 measurements for each of the following distances:
mm,
mm,
mm,
mm,
mm.
Figure 13a,b report the results. The repeatability error has been evaluated by considering the variance w.r.t. the mean value computed on the 10 measures. The ST solution shows a repeatability error that increases when the object is closer to the sensor, e.g., at
mm the max error in percentage is 68%. Instead, the repeatability error decreases when the object is farther, e.g., at
mm the max error in percentage is
%. For the custom solution, the repeatability error is quite constant at the different evaluated object distances. In particular, at
mm the max repeatability error in percentage is 16% while at
mm it is 13%.
By using the same measures, also the measurement error has been computed. Green lines/stars in
Figure 13 represent the expected values. In particular, the measurement error is obtained by considering the difference between the mean values obtained on the 10 measures and the expected values. As for repeatability error, the ST solution shows a measurement error that increases when the object is closer to the sensor, e.g., at
mm the max error in percentage is 57%. Differently, the custom solution shows a more constant measurement error of about 10%.
Table 4 summarizes the repeatability and the measurement errors in the different working conditions for the two solutions.
3.3. Hysteresis
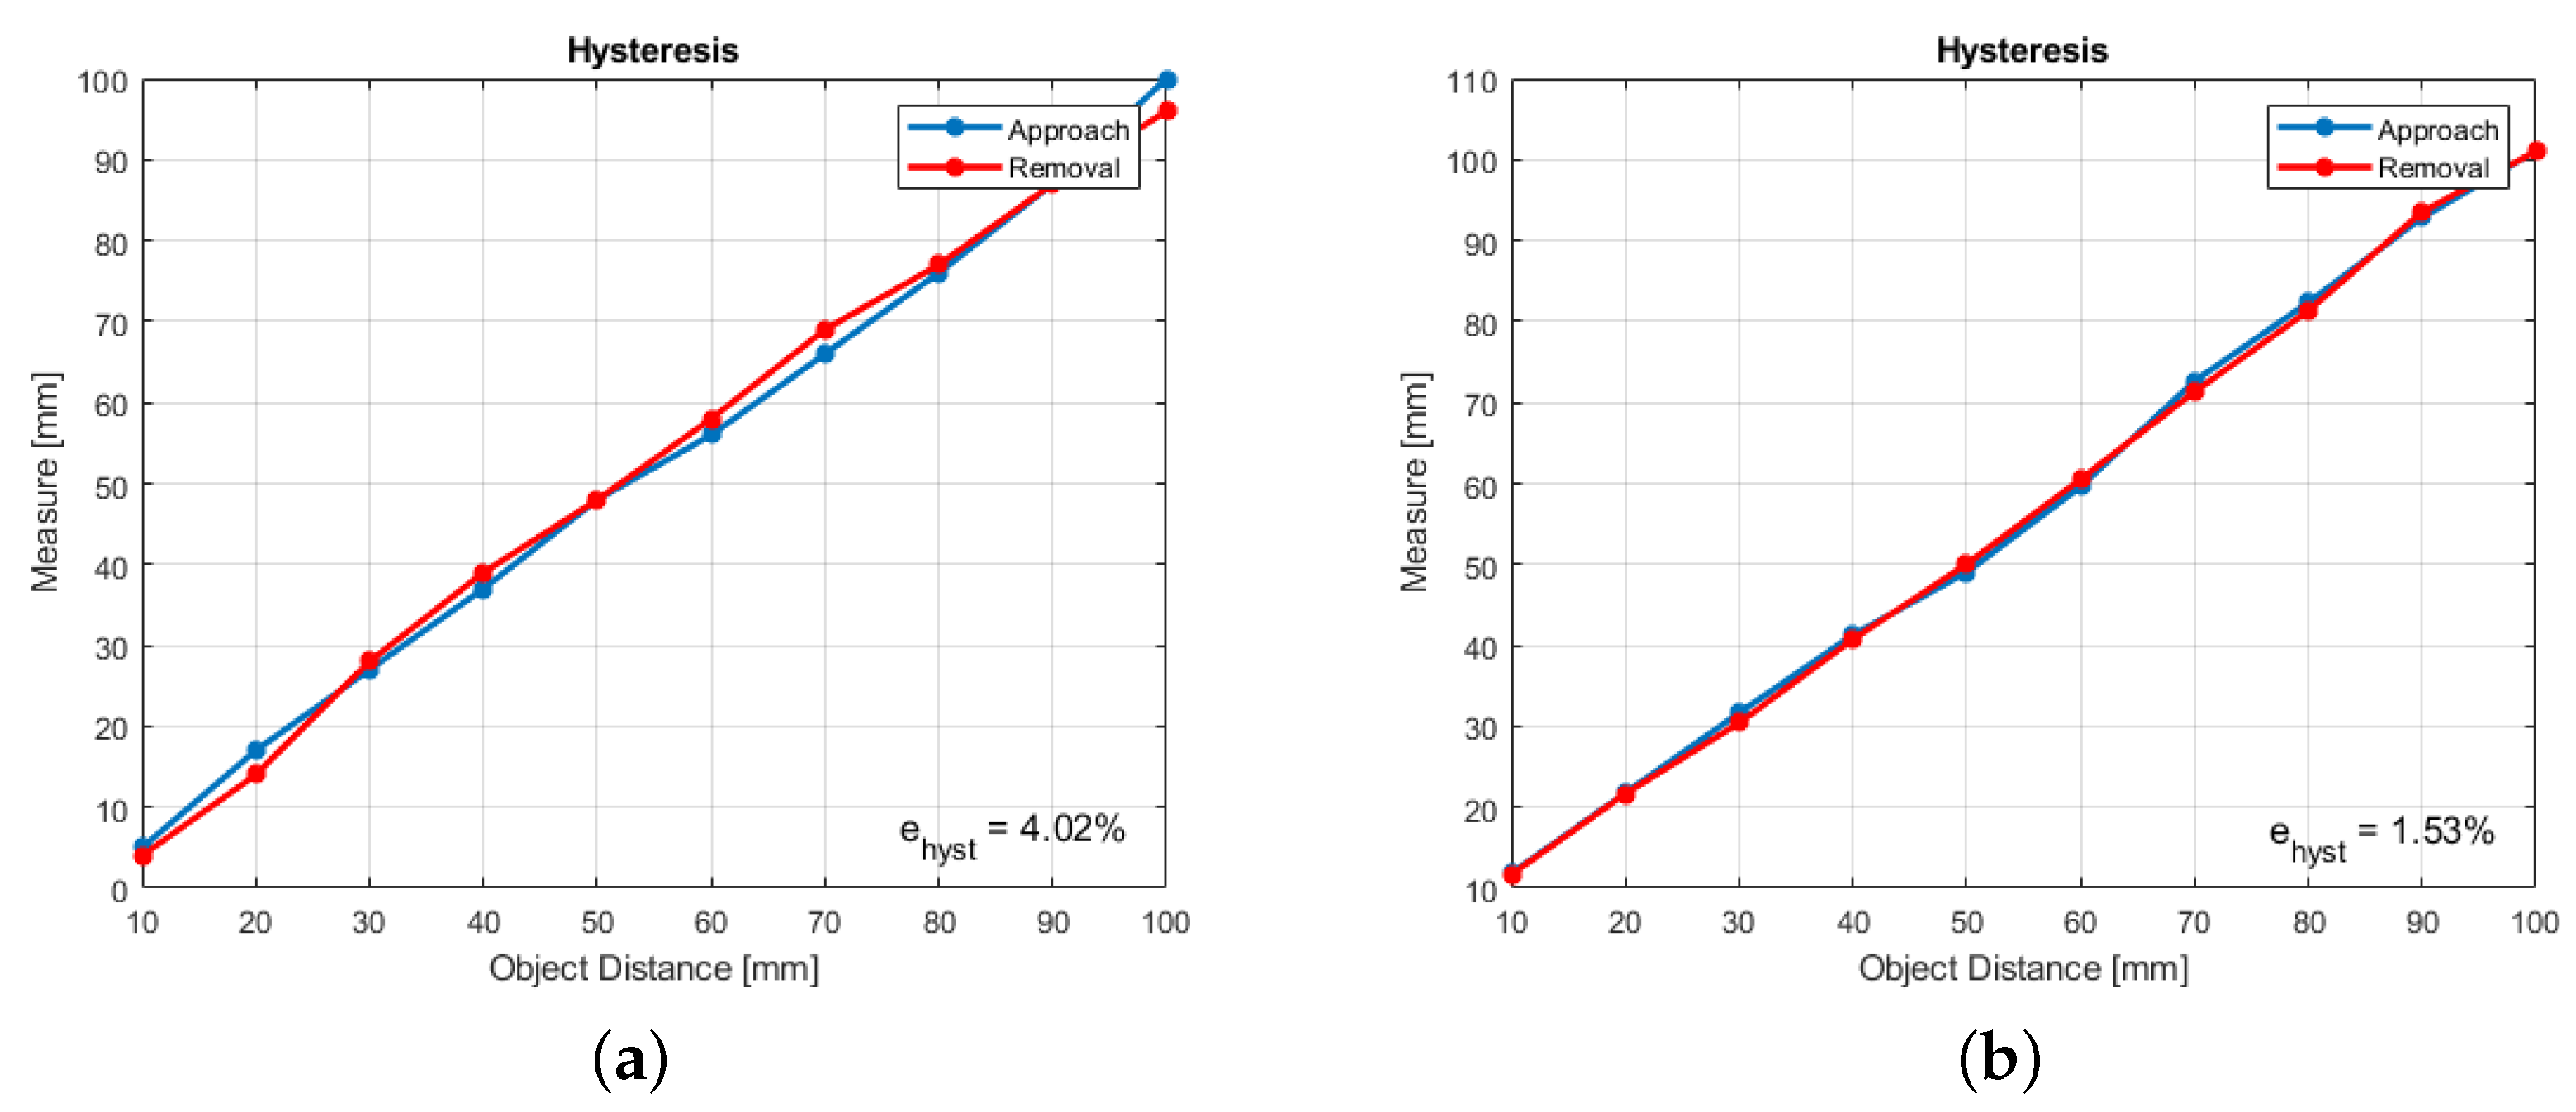
Figure 14a,b report the hysteresis for the two solutions. The sensor behavior is quite linear for both solutions and the tests showed the absence of a hysteretical behavior for VL6180X sensor. The hysteresis error has been computed finding the maximum difference between the distance values on the two “sides” of the hysteresis graph corresponding to the same object distance value and using the following equation:
where
and
are the distance values on the increasing and decreasing sides respectively and
is the maximum distance value reached during the experiment. In the specific test, data of one cycle have been used to compute the error index. No relevant differences are obtained with two or more cycles.
According to the previous equation, the hysteresis errors for the two systems are:
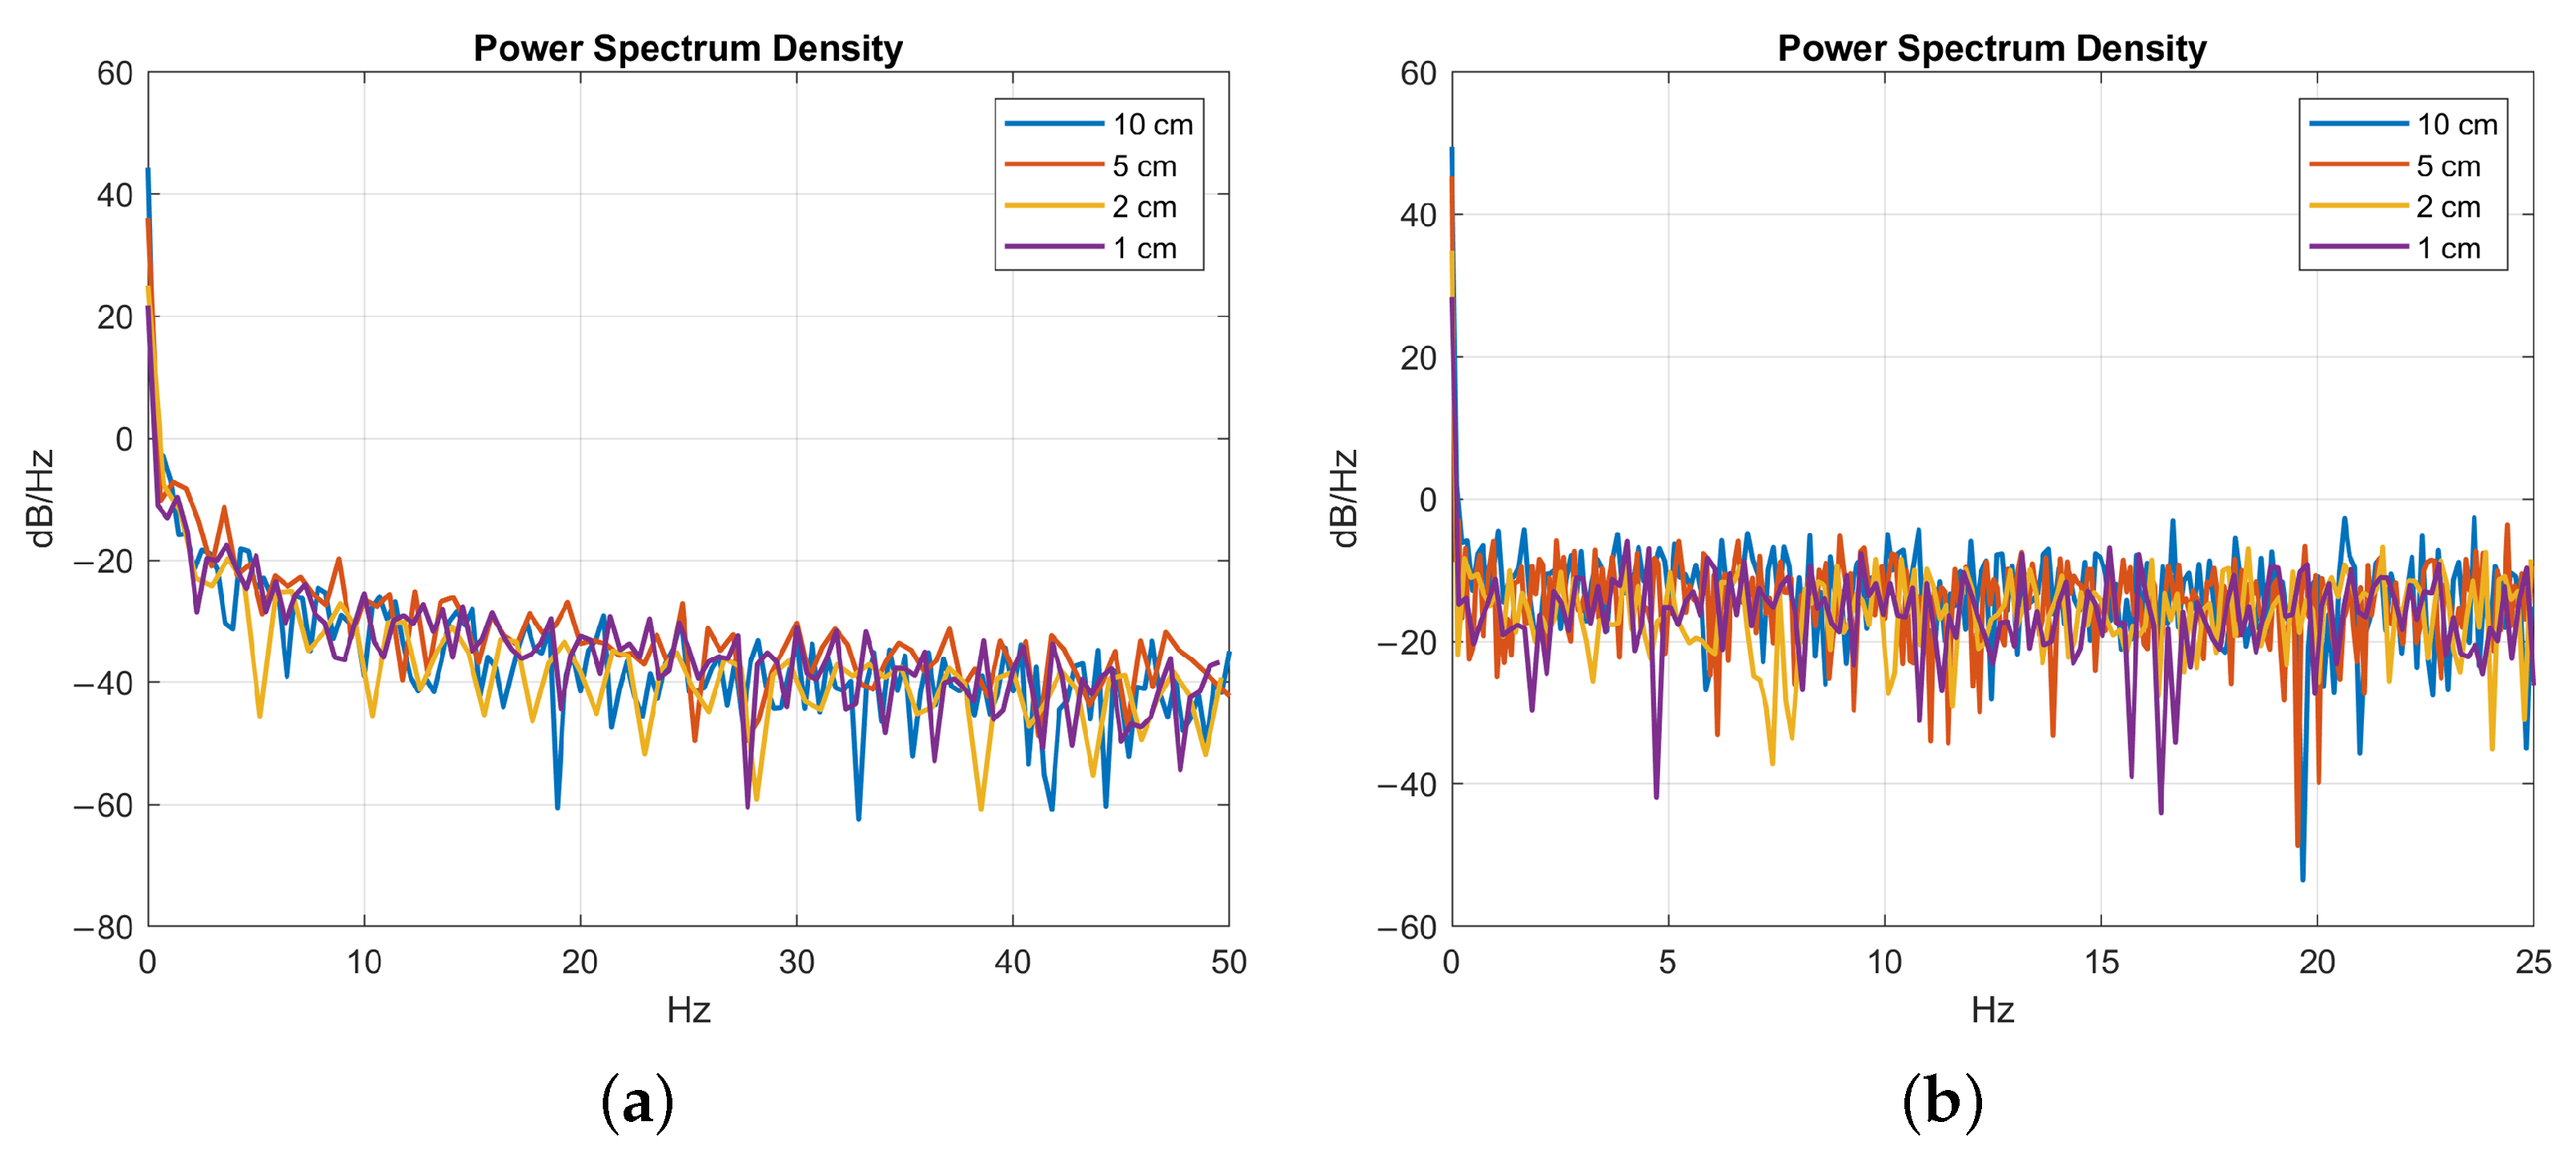
3.4. Power Spectrum
The power spectrum for the two systems has been computed to evaluate the SNR. The tests have been performed placing the object at different distances in order to evaluate if the SNR depends on the object distance. The object has been located at the following distances: 100 mm, 50 mm, 20 mm, 10 mm.
The results are reported in
Figure 15a,b. It is possible to see how, since the signal bandwidth is limited to few hertz, the noise level is about 4–5 orders of magnitude below the signal level in all cases.
The noise level for the custom solution is higher than the ST case. It is quite obvious that these results are related to the filtering stages used in the ST processing chain.
4. Wire Detection and Scanning Procedure
As said in
Section 1, one of the main objectives of H2020 REMODEL project is related to Deformable Linear Objects manipulation, i.e., thin wires for switchgears assembly. For such a task and for all the grasping and manipulation tasks on thin and small objects, where the contact area is very small, an accurate knowledge of the object pose is fundamental. To this aim, in this work the proposed pre-touch sensor has been used to increase the a priori knowledge of the object pose by re-constructing a
proximity-based point cloud. In particular, a specific scanning strategy has been adopted to scan a predetermined area: the measurements of the pre-touch sensor, properly processed to be referred w.r.t. to the robot base frame, are collected in order to obtain the object point cloud. By properly processing the point cloud, the shape of the wire under analysis is estimated. The validity of the reconstruction algorithm is demonstrated by letting the robot end-effector autonomously follow the wire for all its length through a classical position control. In the following, more details on the scanning strategy and on the estimation algorithm are reported, while
Section 5 describes the experimental results.
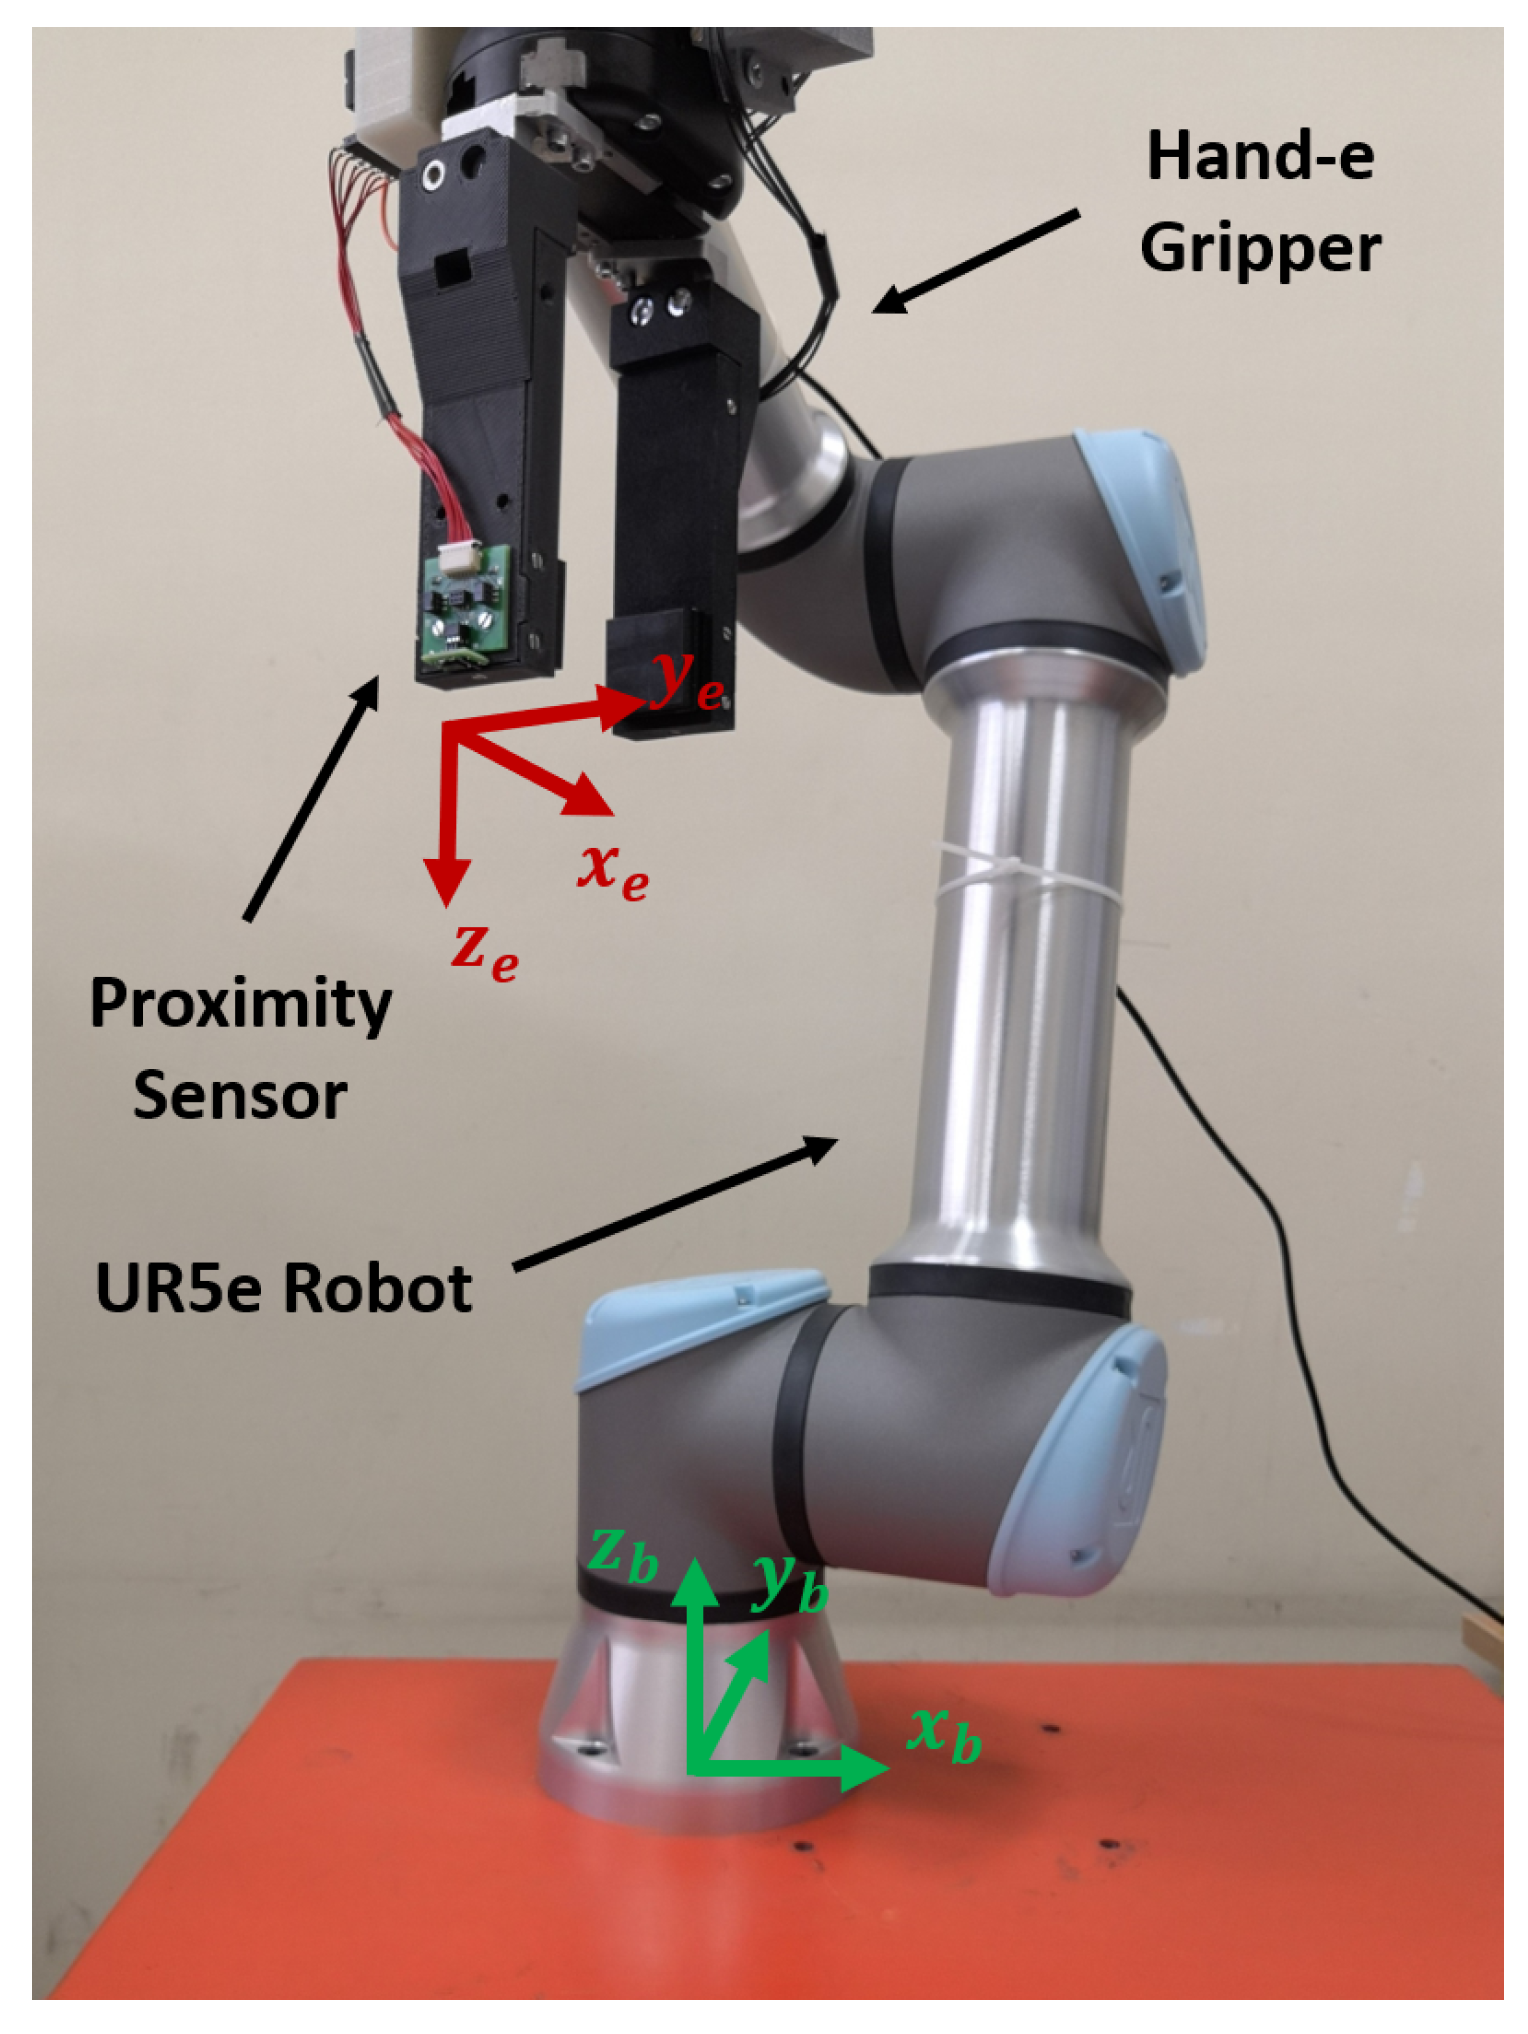
Let
and
be the robot base frame and the end-effector frame (whose origin corresponds to the center of the proximity sensor), respectively. See
Figure 16 for clarification about the reference frames’ pose. For simplicity, let us divide the scanning strategy into two main parts: (a) scanning phase and (b) shape estimation phase.
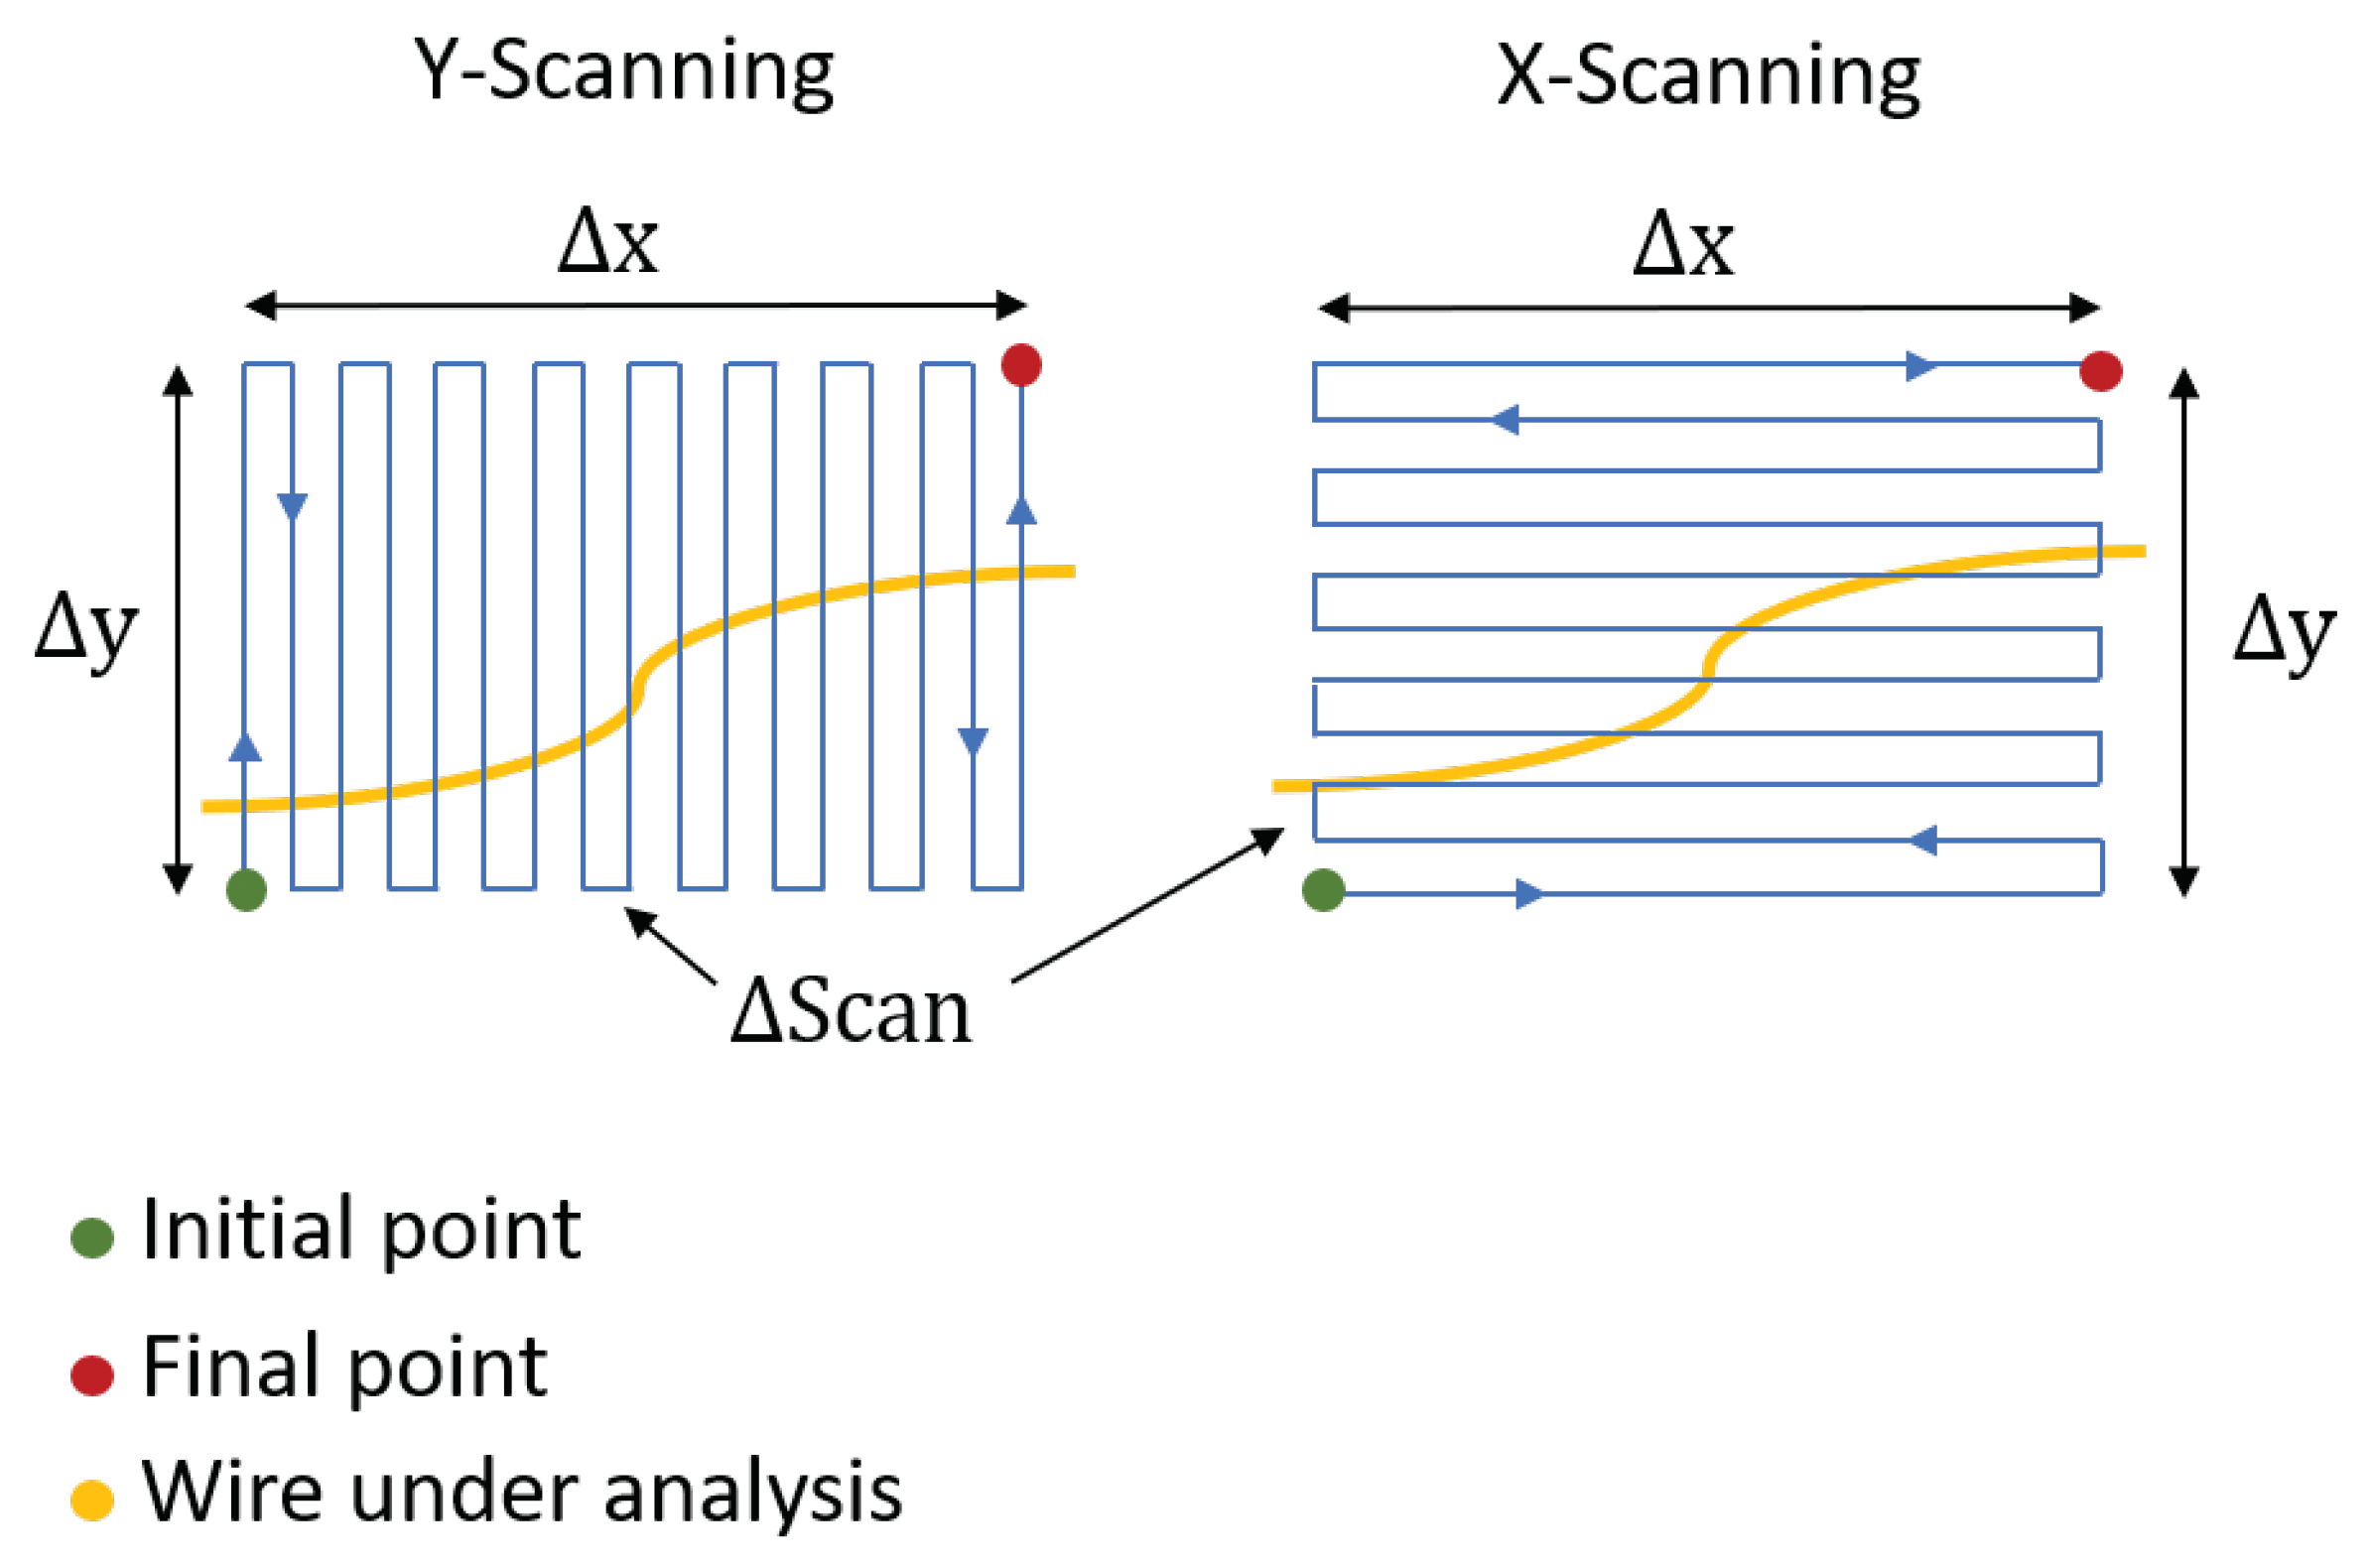
(a) Scanning strategy algorithm has been designed in order to generate a point map starting from the following parameters (refer to
Figure 17):
X: the dimension of the area to scan along the x-axis of and expressed in ;
Y: the dimension of the area to scan along the y-axis of and expressed in ;
Ze: the delta along the z-axis of and expressed in ;
Scan: the distance between two successive scanning lines expressed in ;
v: the scanning speed expressed in ;
ScanningDirection: the main axis for the scanning map generation.
With the defined parameters, the initial point
and the final point
of the map are
and
, where
is the
to
rotation matrix. In these terms, a Y-Scanning Point Map can be obtained as in Equation (
2).
The X-Scanning Map is similarly obtained. To compute the scanning trajectory in Cartesian space expressed in base frame, Equation (
3) is used.
where
is the homogeneous transformation matrix that expresses
in
and it is computed with the direct kinematic algorithm on the initial robot joints configuration. Once the point map
is generated, a position trajectory in the Cartesian space is obtained with a constant speed profile according to the parameter
v. Afterwards, the joint-space trajectory used to control the robot is computed with a first order CLIK (Closed-Loop Inverse Kinematics) algorithm [
24]. The point cloud is obtained collecting the pre-touch sensor measurements, acquired at a rate of
Hz while the robot is moving according to the trajectory previously computed. In particular, the
k-th point of the point cloud is stored as
, where:
is the current x-coordinate of the end-effector;
is the current y-coordinate of the end-effector;
is the current z-coordinate of the end-effector minus the current proximity sensor measurement.
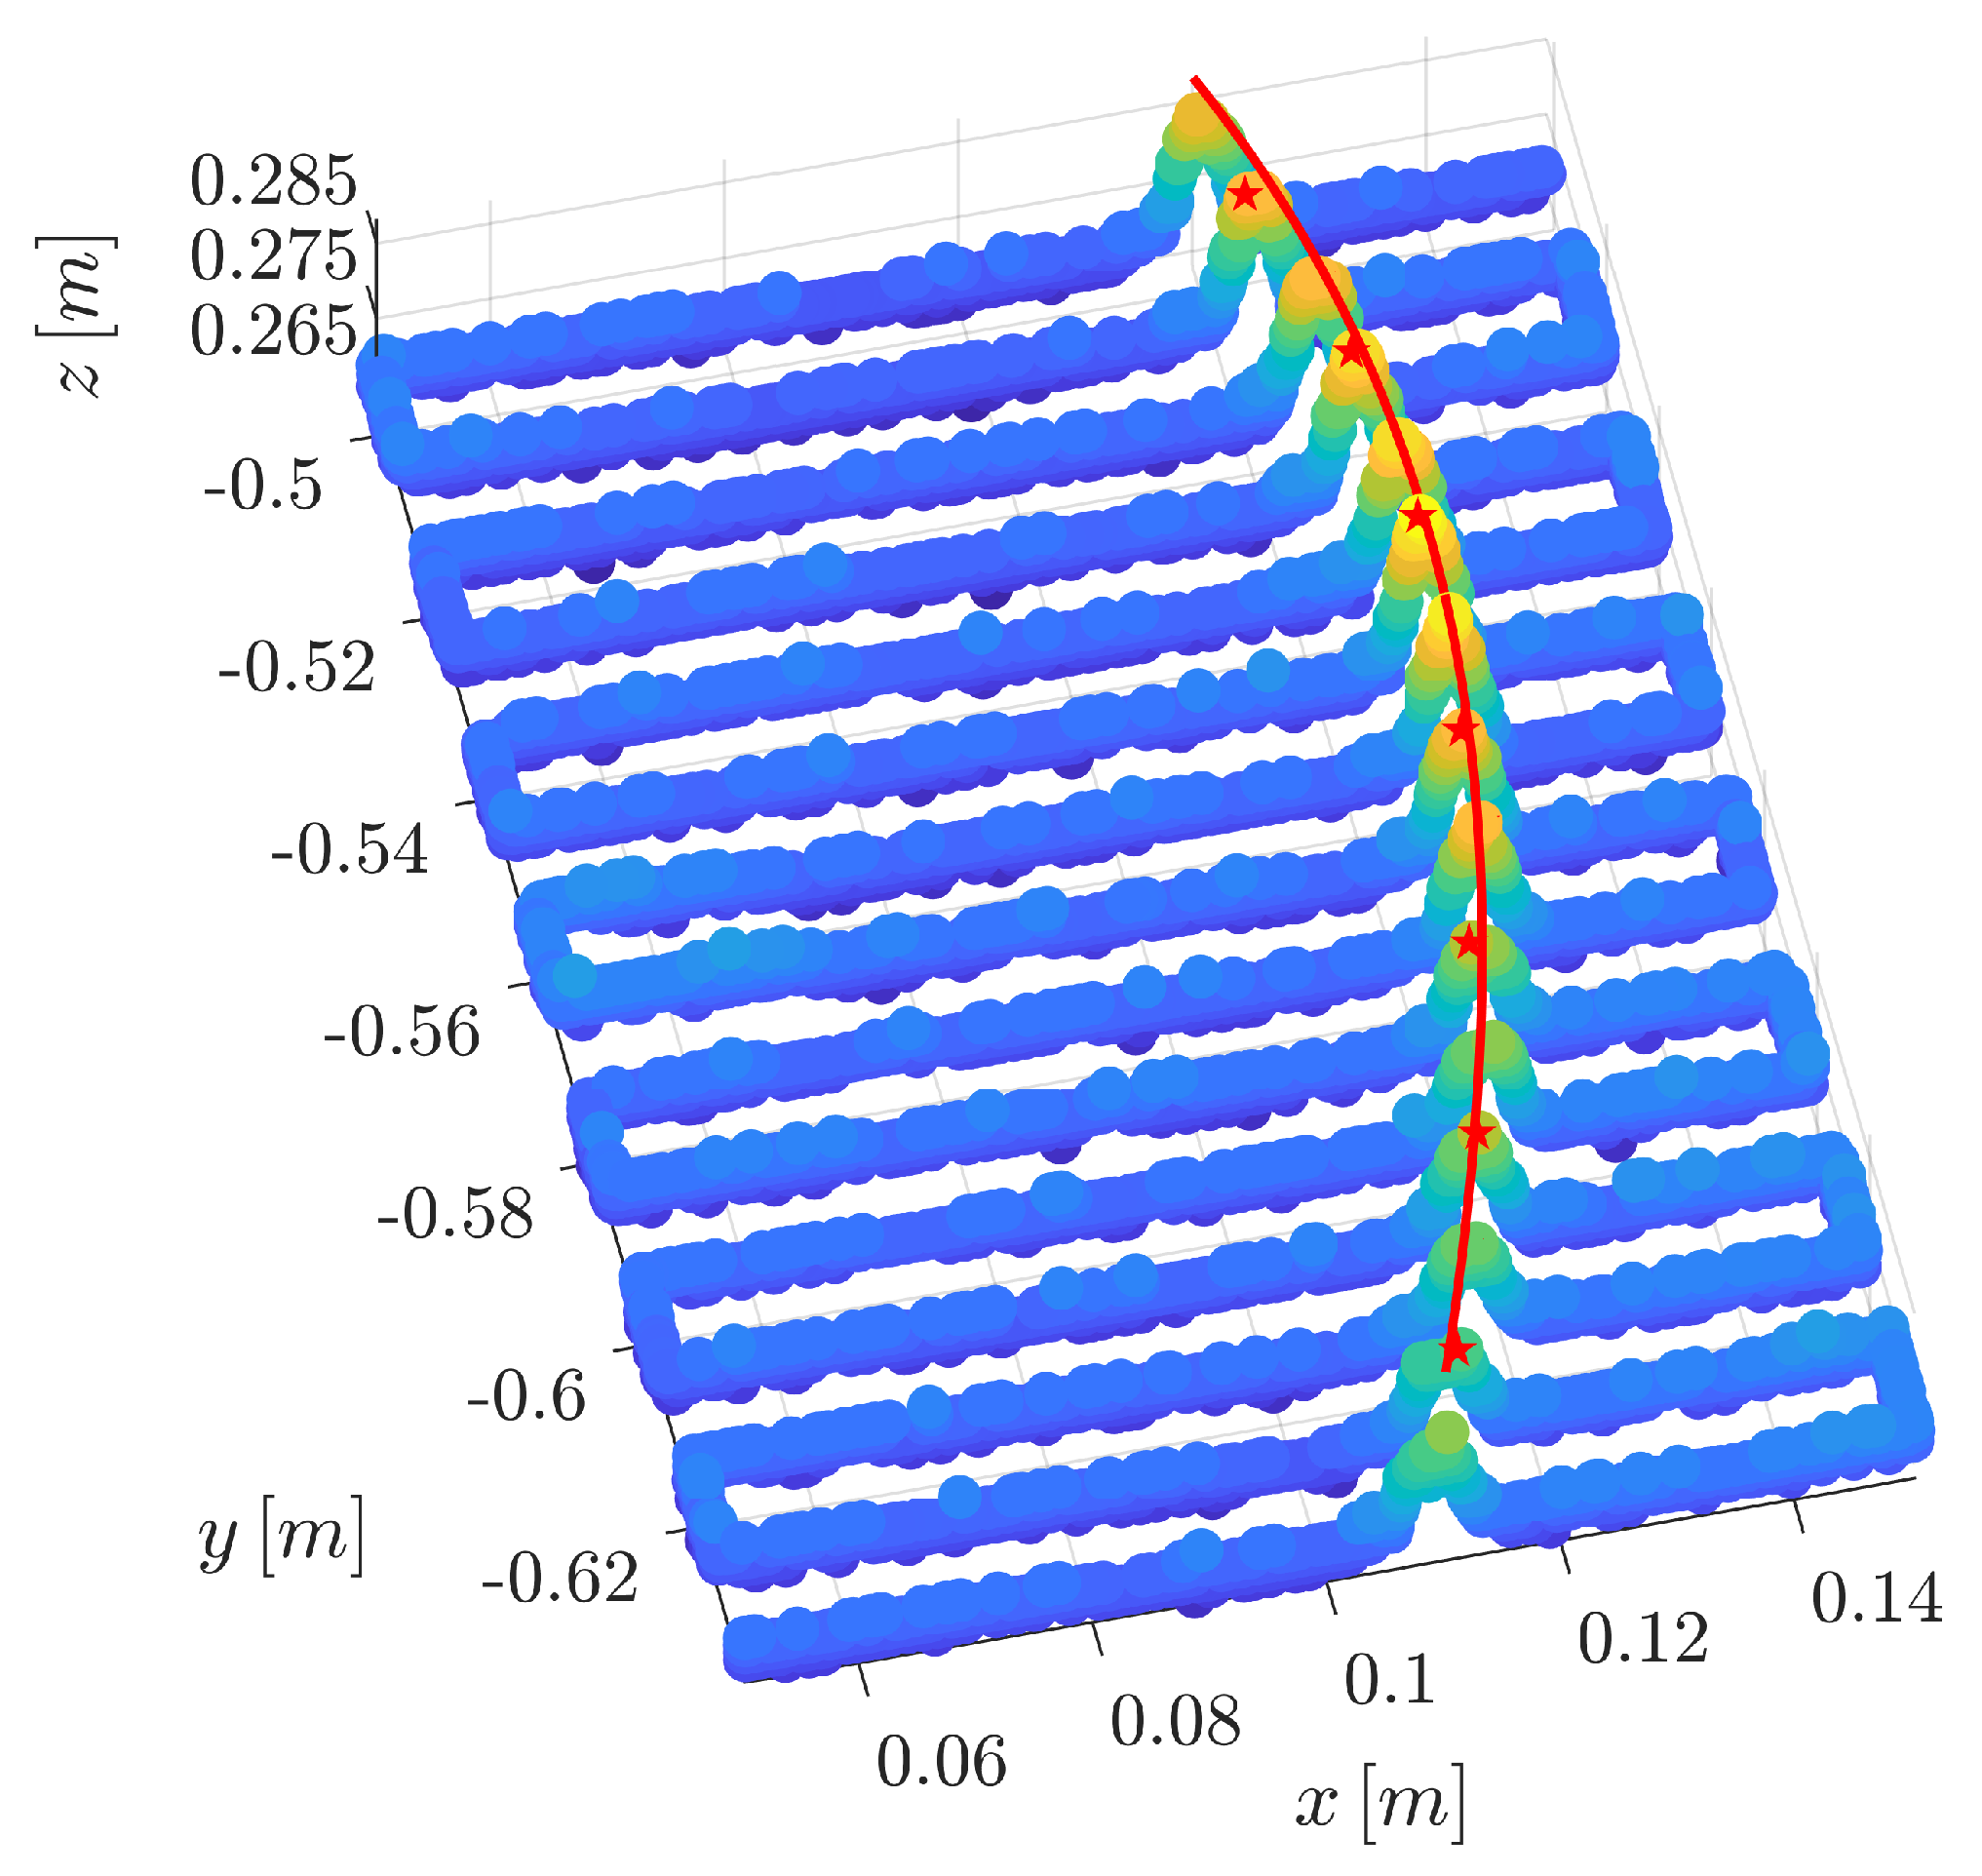
Figure 18 reports an example of point cloud acquired with a
mm diameter wire at a cruiser speed of
m/s.
(b) Shape estimation phase consists in approximating the scanned wire shape by using a third order polynomial. The algorithm can be described with the following steps:
Segmentation of the point cloud acquired during the scanning phase in separate rows (or columns) considering two by two the points in the
reported in Equation (
2);
Selection of the point with the maximum z-coordinate for each segment;
Computation of the analytical form of the wire shape estimation by using a third order polynomial interpolating the points obtained in the previous step.
For the last mentioned step, supposing the wire main direction is mostly parallel to the
x-axis of
, once the coordinates of the points
are known for each segments, it is possible to write:
with
M being the number of segments. Inverting the Equation (
4) by using a pseudo-inverse, the parameters
a,
b,
c and
d of the polynomial are found in the sense of minimum square error. If the main direction of the wire is orthogonal to the
x-axis of
, the
x and
y coordinates in the (
4) are exchanged.
An example of shape estimation is reported in
Figure 18, where the red stars are the points with the maximum
z-coordinate of the rows in the point cloud and the red line is the third order polynomial approximating the wire shape.
5. Experiments
In wires’ manipulation, the quality of the grasping is really important to assure the success of the whole task. For this reason it is necessary to precisely know where to grasp the wire and, since thin wires are not easily detectable by using depth cameras as pointed out in [
18], other procedures are needed to compute with a good resolution the pose to use for the grasping. In this work preliminary experiments have been carried out to evaluate performance and limitations of the proposed procedure.
In particular, the aim of this section is to assess:
- a
What is the minimum diameter of the DLOs well recognizable with the proposed solution, regardless of the material;
- b
What is the minimum distance between two adjacent and parallel wires that allows one to distinguish them;
- c
What is the maximum allowed approaching distance between the sensor and the scanned wires;
- d
The goodness of the estimated wire shape, thus, the possibility to use it for the computation of a correct grasping pose.
Referring to the parameters defined in
Section 4, the experiments described below have been performed choosing:
and
depending on the area to scan,
m,
. Concerning the cruiser speed
v used for the scanning phase, tests have been performed considering
m/s obtaining similar results. The scanning time depends on the above parameters. To have an idea, for the scanning area (about
cm) reported in the
Video S1 attached to the paper (see details below), with
m and
m/s, the scanning time needed to obtain the point cloud is about
s.
The experimental setup, refer to
Figure 16, consists of a UR5e robot manipulator by Universal Robot equipped with the Hand-e gripper by Robotiq. The proximity sensor presented in the previous sections is mounted on the tip of one of the two fingers of the aforementioned gripper. The background of the scanned area is a common white paper.
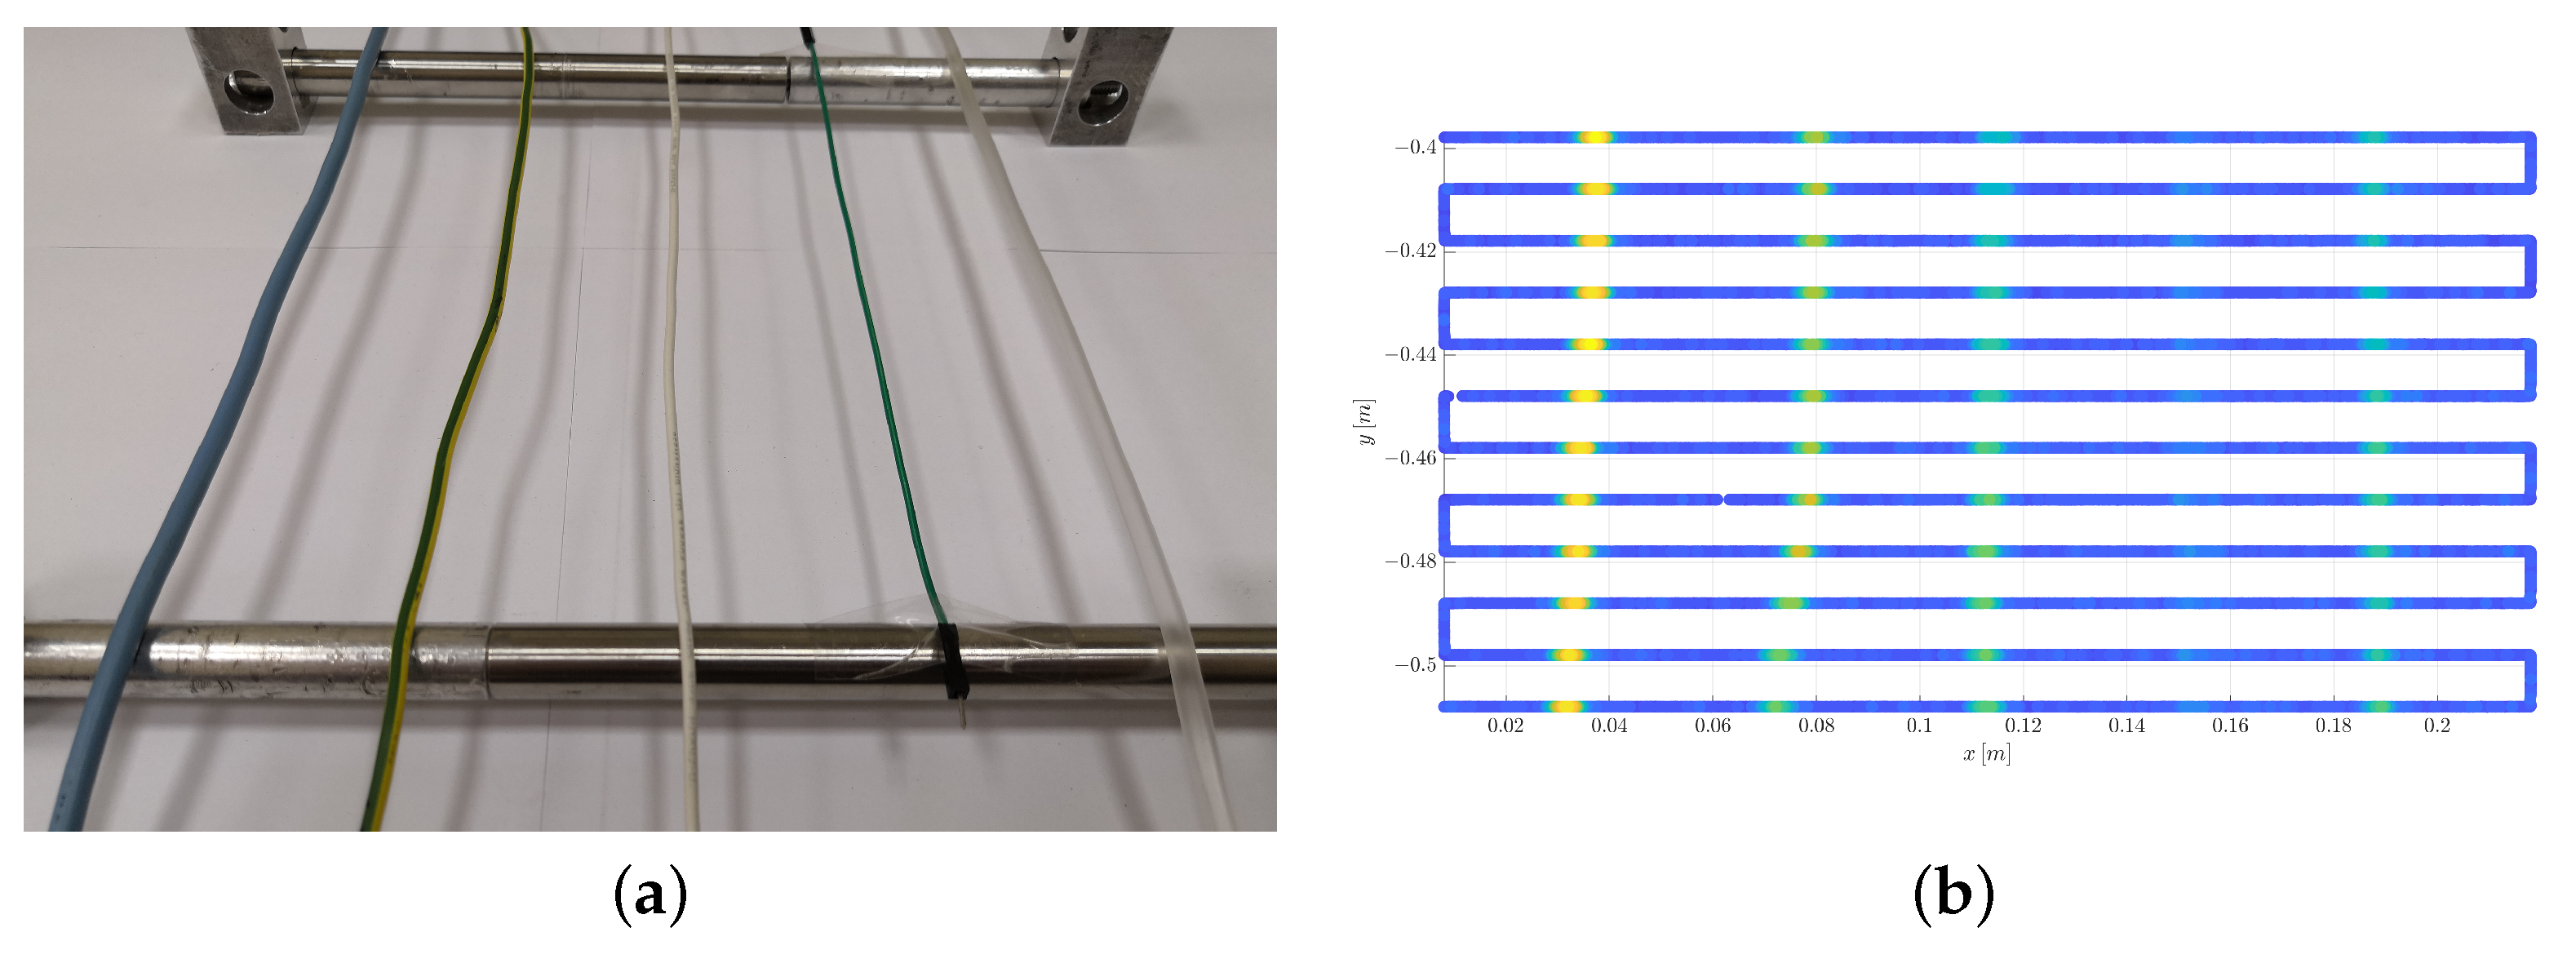
The first experiment has been implemented to evaluate what DLOs in terms of diameter and material are recognizable with the proposed solution. In particular, in the experiment (see
Figure 19a) four wires and a flexible hose have been taken into account, since they are the DLOs used in REMODEL use cases. The diameters of the considered wires are (from left to right)
mm,
mm,
mm and
mm respectively, while the hose diameter is
mm.
Figure 19b reports the scanned map obtained by the sensor and it highlights how only the wire with the smallest diameter is hard to distinguish. By considering these results for the following experiments the wire with
mm of diameter has been selected since it represents the DLO well recognizable with the minimum diameter.
The second experiment is devoted to assess if the sensor is able to distinguish two parallel
mm diameter wires and at which distance they begin to be detected as one single wire by the sensor. The results are reported in
Figure 20, where it is possible to see the point clouds obtained maintaining the same height of the end effector for four different distances between the two wires:
mm,
mm,
mm and
mm. The two wires can be distinguished in the first three cases but not in the last one, i.e., with a distance of
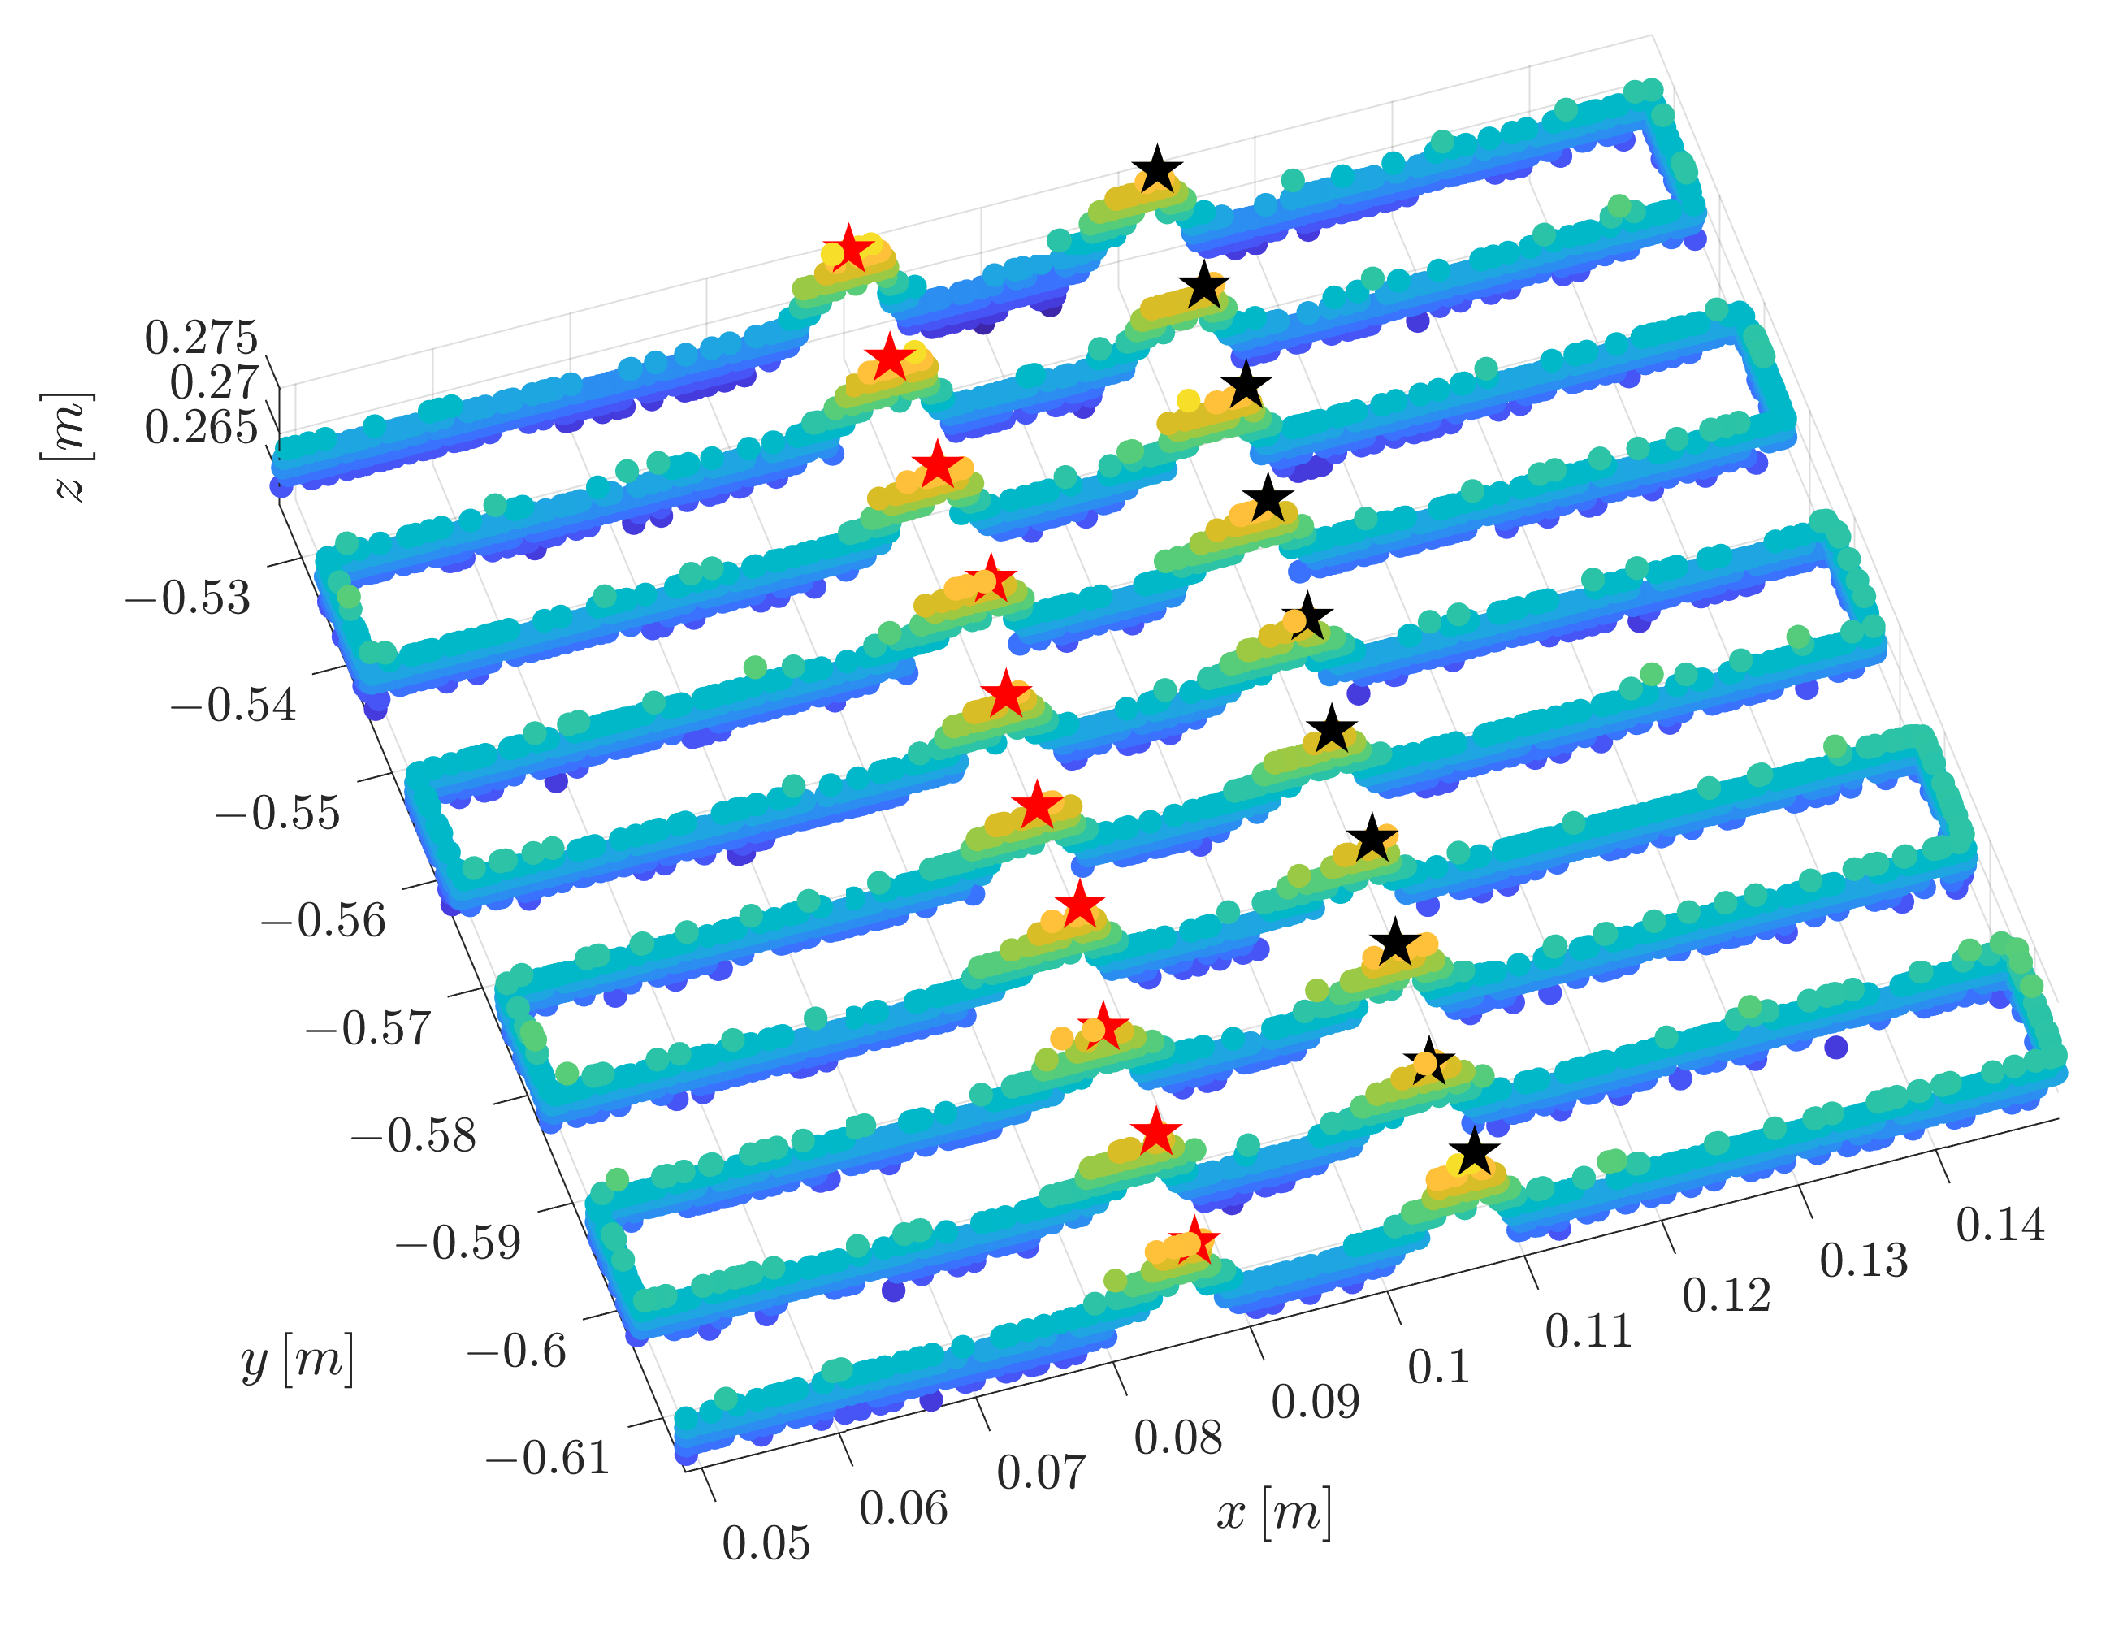
mm between the wires. To partially quantify the quality of recognition described above, since a ground truth for the scene is not available, the mean distance
estimated among the recognized wires is compared with the nominal one
. In particular, referring to a generic case, as the one reported in
Figure 21, the estimated mean distance
is obtained by computing the mean of the distances between the two points (red and black stars in the figure) corresponding to each of the two wires for all the “scanned segments”. Hence, an error indicator can be computed as
Evaluated error reported in
Table 5 highlights how errors greater than
% correspond to low recognition quality.
The third experiment is similar to the second one. The aim is, again, to see if the sensor is able to distinguish two parallel
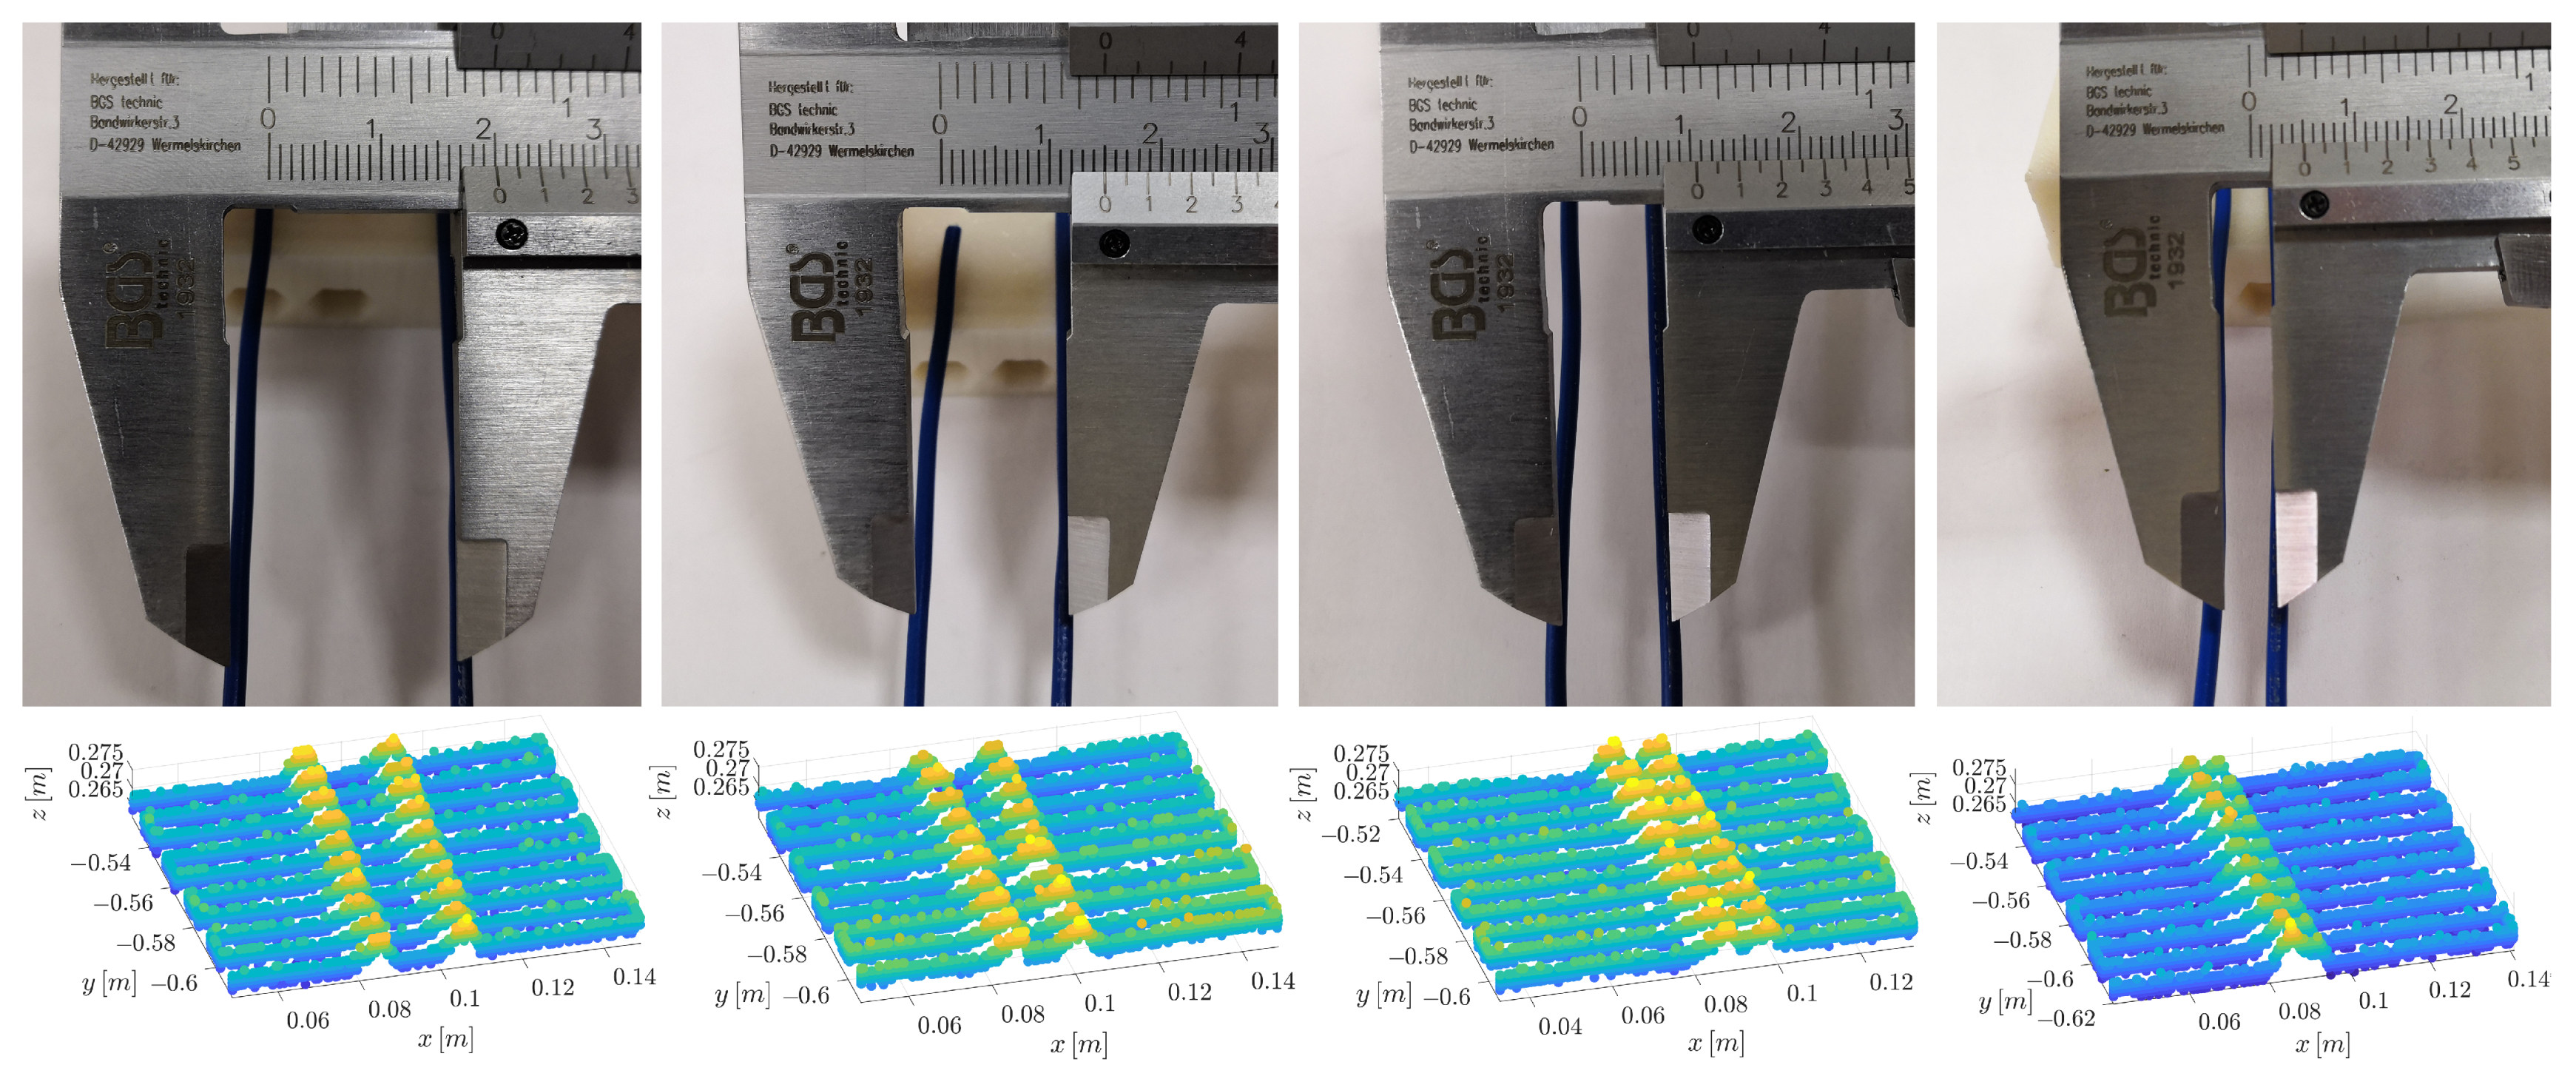
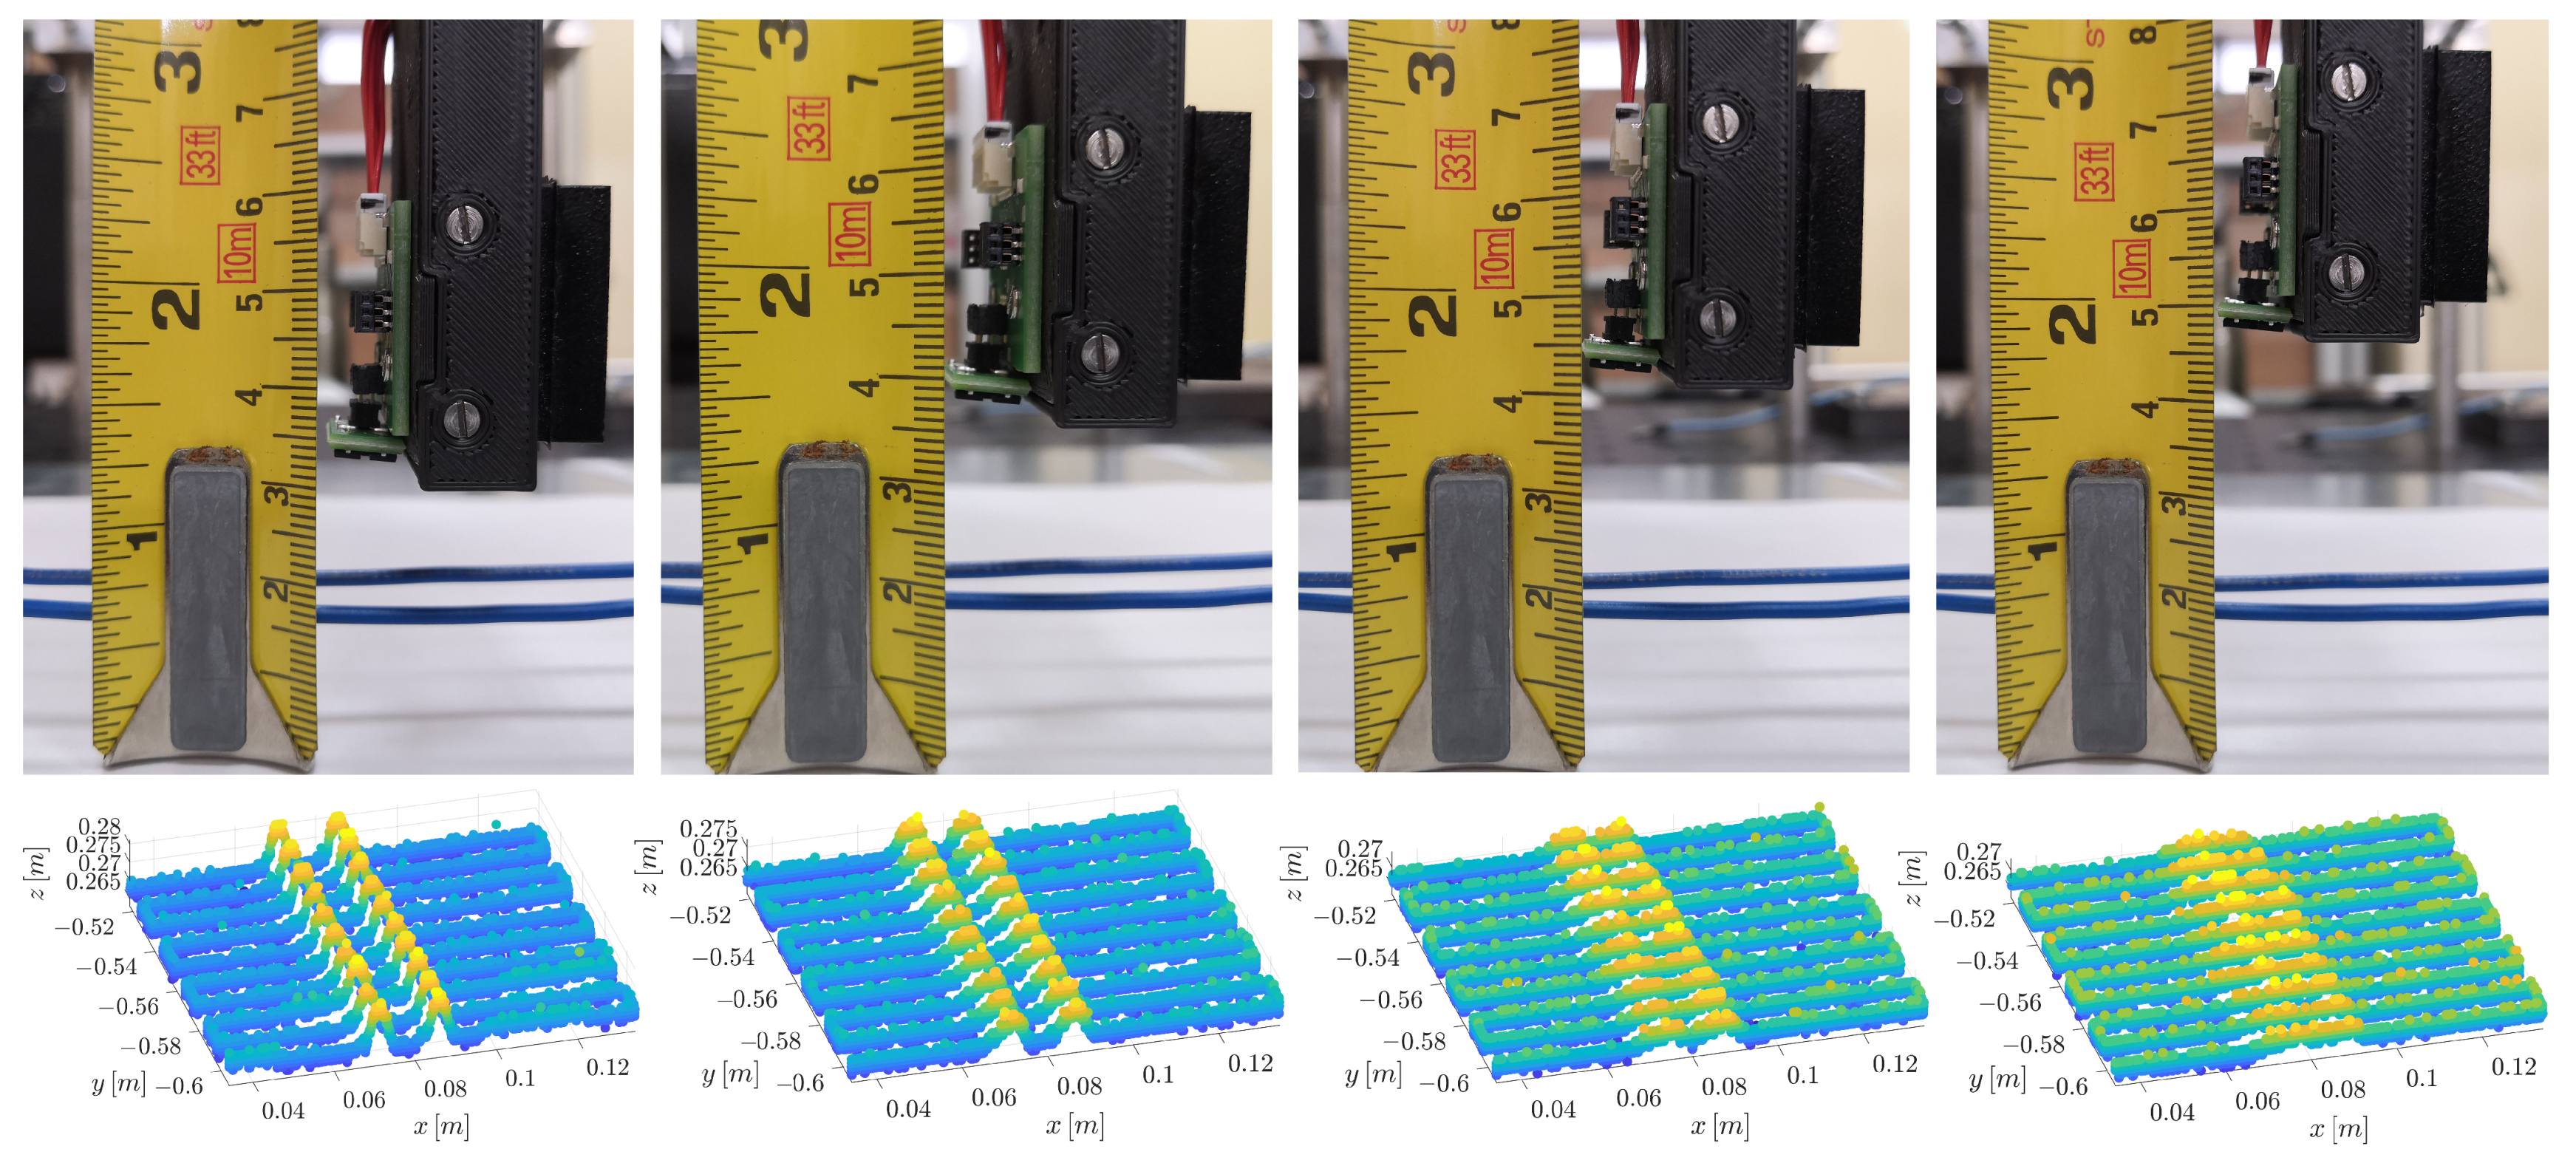
mm diameter wires but, this time, changing the height of the end effector, i.e., the distance between the wires and the proximity sensor, for the scanning phase.
Figure 22 reports the point clouds of two
mm diameter wires, spaced
mm apart, obtained with four different heights
of the end effector:
mm,
mm,
mm and
mm from the wires. As in the previous experiment, the two wires can be distinguished in the first three cases but not in the last one, i.e., with a distance of
mm from the wires. In addition, in this case, to quantify the quality of reconstruction, the error indicator of Equation (
5) has been computed and the results are reported in
Table 6.
The limitations observed during the previous experiments, i.e., the impossibility to detect two parallel wires in the mentioned conditions, are mainly due to the Field of View (FOV) the VL6180X sensor is sensible to. VL6180X FOV is typically 42 degrees (half angle) in both x and y axes. In case of small or thin objects, for example, the light beam used by the sensor to detect the presence of the object and hence to measure its distance could be reflected by surfaces belonging to two or more objects, i.e., the two wires in the experiments. In the mentioned conditions, it is not possible to properly distinguish the objects between them. Since the FOV angle is an intrinsic parameter of the device, i.e., it is a non-calibratable feature, this represents a limitation of the proposed system that can be overcome only by changing the sensing element.
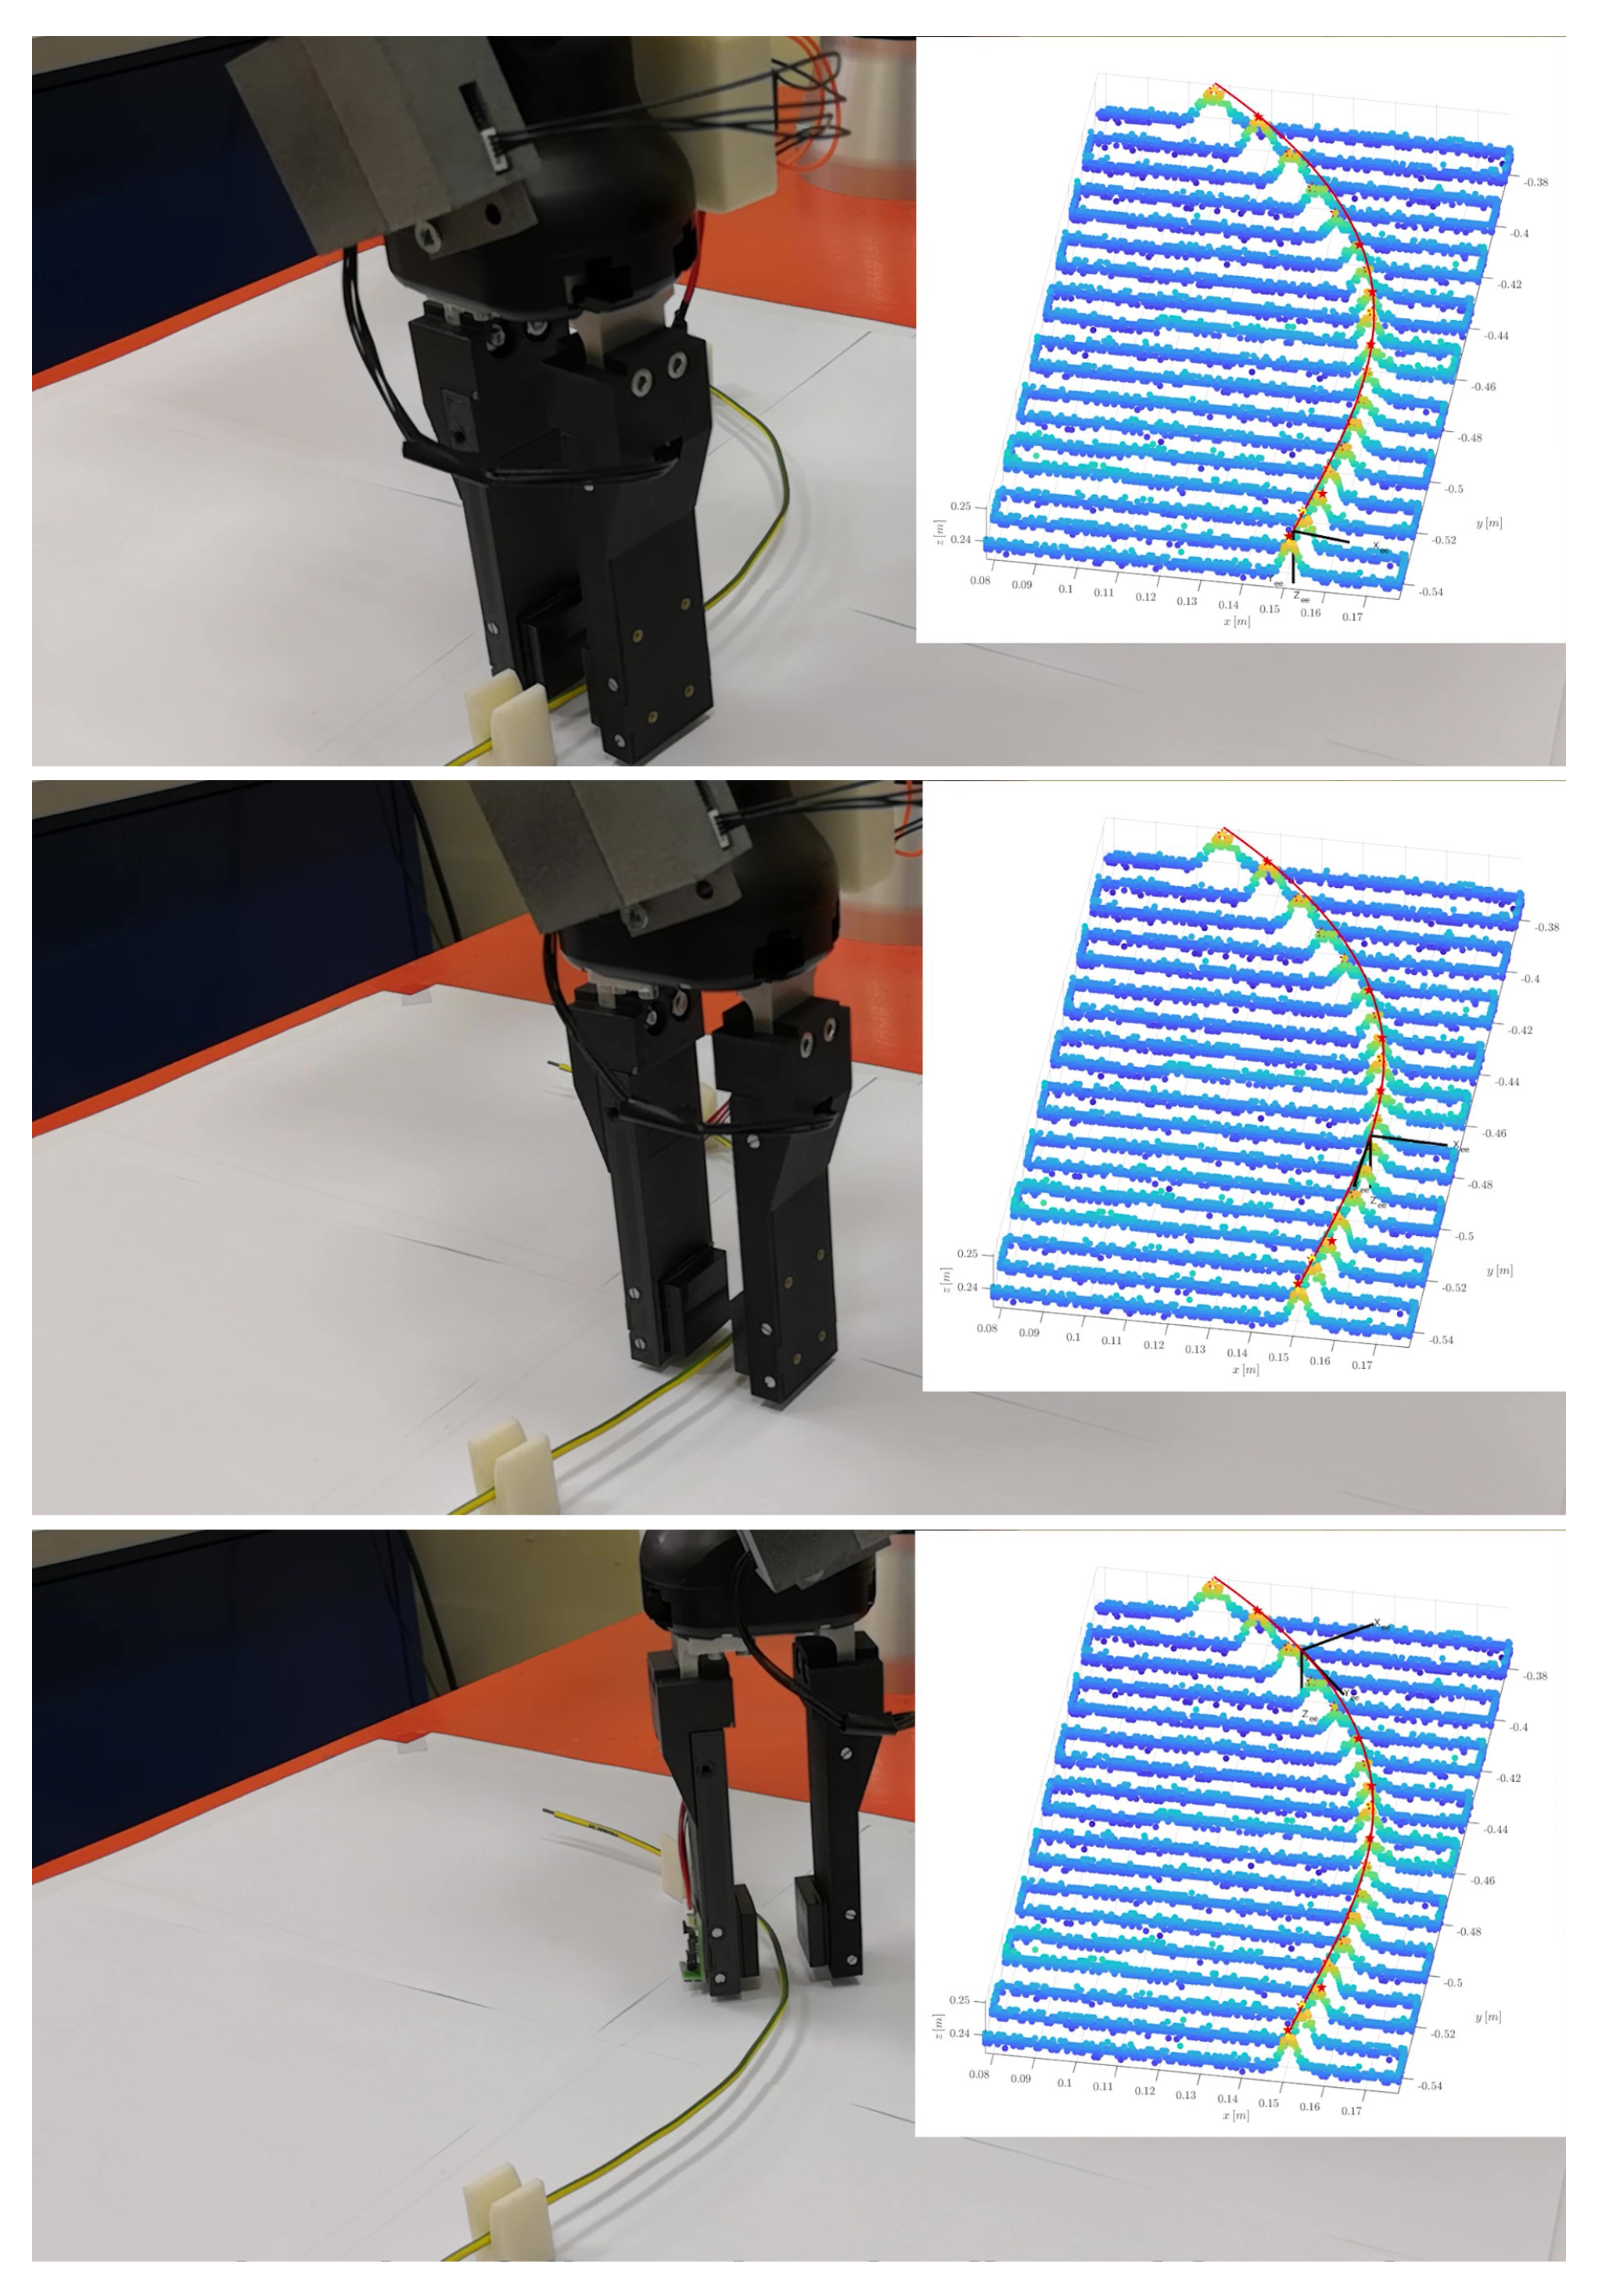
The last experiment is thought to show how the scanning procedure and the wire shape estimation can be used in a wire manipulation task. The goal is to demonstrate how it is possible to precisely compute the grasping pose by using the estimation of the wire shape obtained with the algorithm presented in
Section 4. In the experiment the robot end effector follows the wire for all its length according to the estimated shape, as shown in the video attached to the paper. To this aim, the trajectory is computed by using the
x,
y and
z coordinates of the estimated wire for the end effector position and the corresponding first derivative for its orientation, so as to have the fingers well positioned to grasp the wire. In particular, the first order derivative
of the polynomial
represents, for each
x, the angular coefficient of the tangent to the curve representing the wire shape and it is used, together with the
x,
y coordinates from the shape approximation and
z coordinate from the point cloud, to compute the pose of the robot end effector. The latter can be described by the following homogeneous transformation matrix:
In this way, the robot end effector follows the estimated wire shape in position and with the
y-axis of
parallel to the tangent to the wire, so to have the fingers’ tactile pads aligned with the wire, ready to successfully grasp it.
Figure 23 reports some frames of the video showing the robot executing the trajectory explained above. It is important to underline that the action of the robot end effector following the wire is not so useful in a real scenario, indeed it is here used only to demonstrate the validity of the proposed shape reconstruction algorithm. In a real use case only one grasping point is necessary and it corresponds to one of the points of the trajectory computed for this experiment.


