Article

Numerical and Experimental Investigation of Temperature Distribution for Dry-Clutches

1
Department of System Science, University of Shanghai for Science and Technology, Shanghai 200094, China
2
School of Mechanical Engineering, Beijing Institute of Technology, Beijing 100081, China
*
Author to whom correspondence should be addressed.
Machines 2021, 9(9), 185; https://doi.org/10.3390/machines9090185
Submission received: 30 May 2021 / Revised: 26 August 2021 / Accepted: 30 August 2021 / Published: 3 September 2021
(This article belongs to the Section Vehicle Engineering)

Abstract

:
The temperature rise of the engaging clutch during shifting depends heavily on the transmitted torque. Precisely estimating the clutch temperature not only improves clutch control but also the optimal design of the clutch. However, the contact surface of the friction lining is closed, and the surface temperature is often difficult to measure accurately. In this study, a theoretical model of a two-dimensional transient temperature field for the friction disc has been established. In the radial and axial directions under different launching conditions, the temperature field of a friction disc is investigated. Four stages of clutch engagement have been determined, and finite-element analysis has been used to study the temperature field of a single clutch and to determine its duration.Then, the latest internationally developed distributed optical fiber sensing technology is used to perform measurement tests on the designed dry clutch friction characteristic test rig. The distributed fiber-optic temperature measurement technology can accomplish accurate temperature measurement with fast response speed and can acquire temperature value on different radii of friction discs with high spatial resolution. Such temperature sensing technology is very suitable for clutch working conditions. By analyzing the simulation and experimental results of temperature variation of different radii, different working conditions and different components, an important reference is provided for the establishment of the clutch temperature model and the optimization of the clutch heat dissipation structure design.

1. Introduction

The friction clutch is an essential component for a vehicle as it plays an important role in the process of power transmission. The clutch can engage and disengage the engine from the gearbox, and it also transfer the torque from the engine to the wheels. Since the clutch is engaged, the sliding contact between the surfaces of the friction plates helps in converting the mechanical energy into frictional heat resulting from the increase in the temperature. After repeated engagements, the temperature field could increase beyond the range of 250 ℃∼300 ℃, causing a sharp decline in the friction coefficient and even resulting in clutch failure [1,2,3]. In order to improve the performance of the dry clutch transmission, it is important to implement deep investigation relative to the temperature distribution after repeated engagements.
Early theoretical models of the temperature field of friction discs were established based on a one-dimensional analysis [4,5,6]. The equations of the one-dimensional transient temperature model were derived to calculate the temperatures at various depths inside the contacting bodies during the slipping period. These studies assumed that the variation in the heat flux with respect to the radius could be neglected and that the frictional heat energy is transferred only along the axial direction. Based on the same assumptions, the surface temperature of a friction disc was calculated by using different methods under single and multiple contact conditions [7,8]. In both of these models, the heat-flux variation along the radial direction was neglected in order to reduce computation time. The temperature fields of dry clutches are usually modeled using finite-element analysis [9]. Abdullah, O. I [10] emphasized the importance of studying the temperature distribution. They conducted simulations under three typical launch maneuvers to estimate the heat flux and developed an axisymmetric finite-element model of the dry-clutch discs. The results of the longitudinal vehicle dynamics have been used in a FEA to predict the temperature field during repeated clutch engagement. Furthermore, the temperature distribution and the heat generated in a dry clutch were studied using a three-dimensional finite-element model [11]. The same authors established a three-dimensional transient temperature model based on two different assumptions: uniform pressure and uniform wear [12]. In general, the complexities of the slipping processes and boundary conditions of the 2D models are major obstacles in obtaining the solutions of the equations. Moreover, the solutions to the temperature fields were obtained using commercial software such as ANSYS [13]. However, the investigations cannot be obtained from the transmission-control unit of a real vehicle. In this study, the solutions to the FE model were obtained by using a numerical method with the help of programming in MATLAB. Thus, we could optimize the algorithm used to calculate the clutch temperature and finally propose an online calculation method to optimize the clutch control by estimating the temperature when the vehicle is driven. As the frictional behaviors of the disc-brake system and dry clutch are similar, studies on the thermal behavior of a brake disc could be referred. In [14,15], some mathematical methods were applied to obtain the temperature distribution of a disc-brake system such as Green’s function and the FE method. An integral-transform method was applied to solve the theoretical model, and an analytical solution of the temperature field was deduced in [16,17]. In this study, the theoretical model of a two-dimensional transient temperature field was established and was simulated using the FE method. Different stages of engagement were considered by applying different boundary conditions.
In most of the previous studies on clutch temperature, a theoretical approach was employed that was rarely experimental. This is because it is difficult to place a sensor on the surface of a rotating friction disc in order to obtain the temperature signal [18,19]. A thermocouple is used as temperature sensors, and the key to temperature measurement is the arrangement of sensors in the clutch system. In [20,21], the authors opened a hole in the back of the test disc and inserted the thermocouple into the hole in order to measure the internal temperature of the platen at different thicknesses and different circumferential positions. In [22,23], the surface temperature distribution of friction disc was measured by using an infrared thermometer, and the thermal effect of a pin-on-disc tribology test was analyzed. Infrared thermometer has better accuracy and response speed than a thermocouple, but it often need a specific test rig to realize the measurement. For the measurement of the friction surface temperature, there is also research [24] using a thin-film thermocouple (TFTC) as a temperature sensor, which is directly attached to the friction contact surface. Theoretically, the result from this TFTC measurement is closest to actual temperature of the contact friction interface, and it does not need to destroy the original structure; however, the thin-film thermocouple sensor is prone to failure under high sliding speed. Therefore, TFTC is not suitable for the temperature measurement of the clutch system. Distributed fiber optical temperature measurements are a new type of temperature sensing technology and have developed greatly during these years. By using light as a carrier for sensitive information and using optical fiber as a medium for transmitting signals, fiber-optic sensors can detect temperature, pressure and strain. Compared with traditional measurement methods, fiber-optic sensors are characterized by fast response speed and high precision, and they are now being widely applied in many engineering fields such as aerospace engineering and safety monitoring [25,26]. In [27], the researchers first attempted to apply fiber optic sensors to the temperature measurement of dry clutch. By drilling several radial bores in the pressure plate, the sensing fiber was threaded in these bores and theoretically offered more than 700 measurement points. In [28], a keyhole-shaped bore has been used to replace the old round bore; the new bores could provided better measurement accuracy and had less influence on the heat flux according to the FE simulation. The test pressure plate and friction lining were custom-made for the test bench, and machining holes required high accuracy; thus, this makes it difficult to apply on actual clutch production.
In this investigation, a dry clutch temperature numerical model is analyzed. In order to validate the accuracy of the clutch temperature numerical model, an experiment is designed and conducted under different working conditions. The distributed optical fiber sensing device is used as a sensor to measure the temperature change of the clutch friction disc surface. It could be used for temperature measurement of any real clutch system, and the device is able to reflect the temperature variation of various components inside the clutch system. The experimental results, which are in reasonable agreement with the theory, prove that the interface temperature constantly increases and reaches high values after repeated clutch engagement.

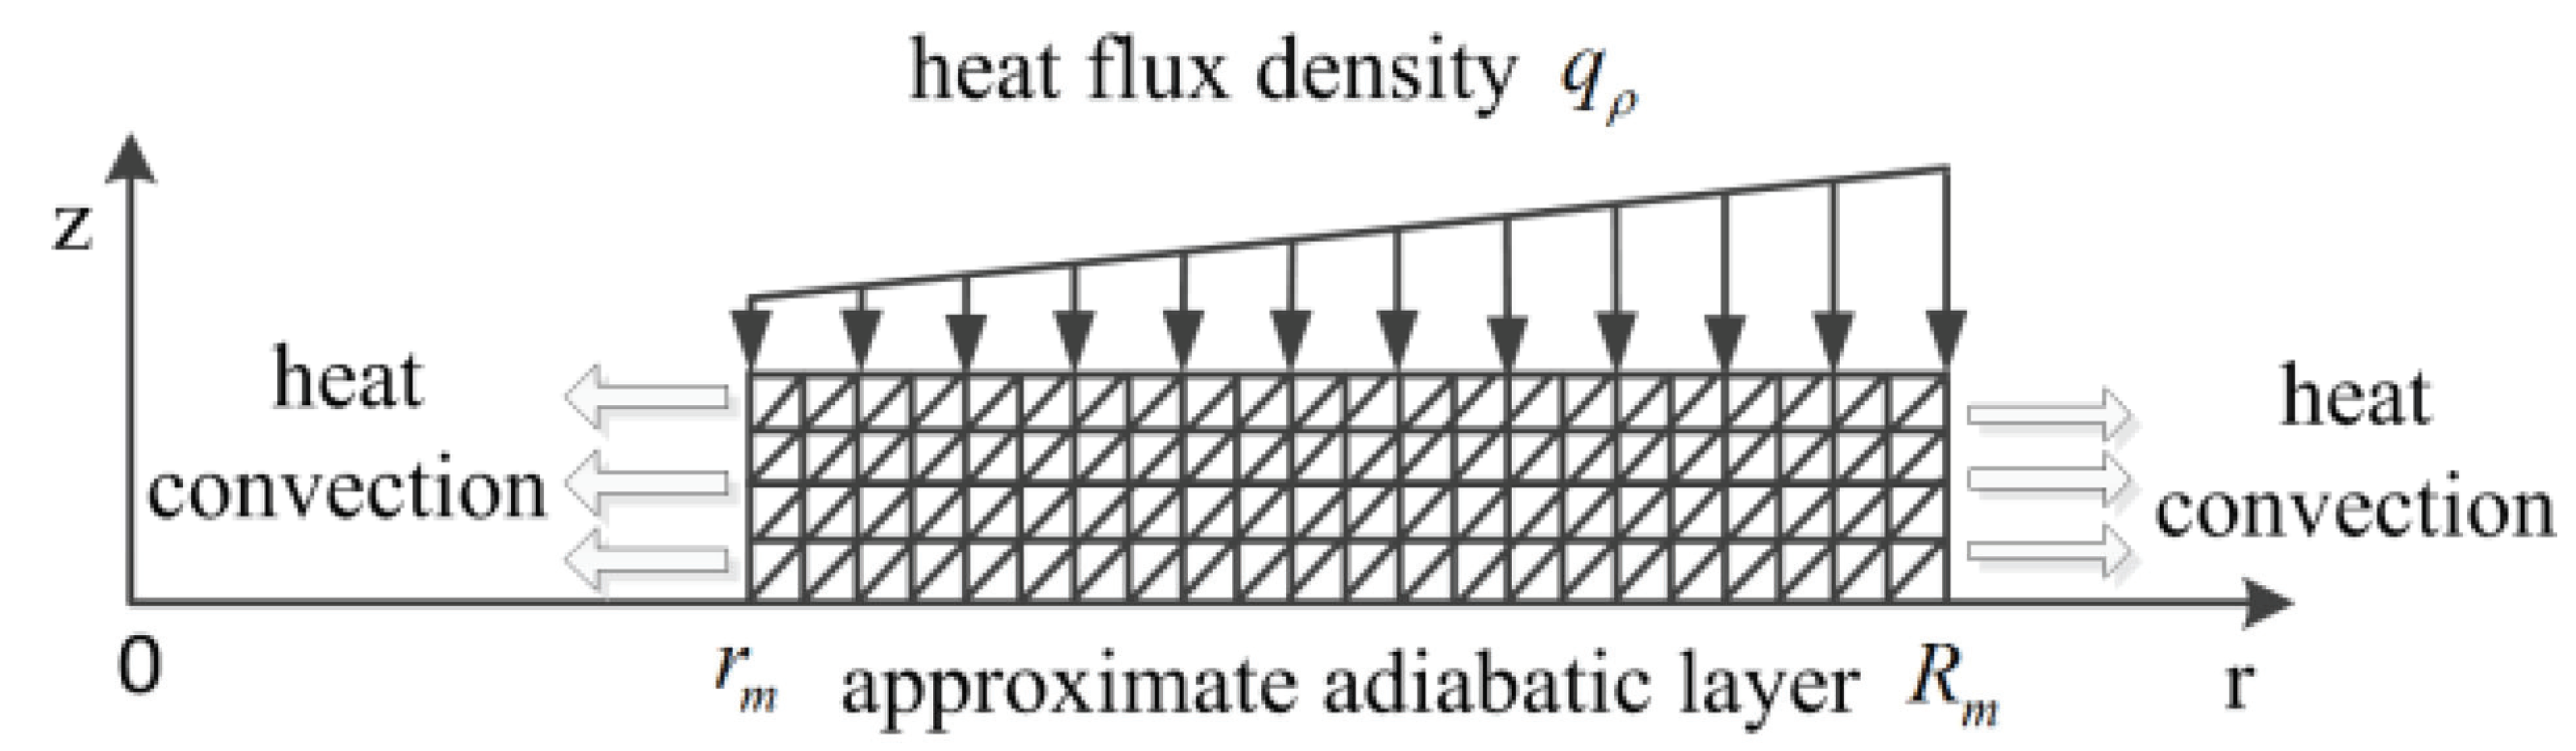
2. Analysis of Clutch Engagement Process

The frictional work generated during the engagement process is the main factor causing the increase in the temperature. To calculate the frictional work, a simplified dynamic model of the clutch is established, as shown in Figure 1. When a vehicle is started, the slipping process can be divided into two phases [3].
First phase: The driving and driven parts of the clutch begin to contact until the transmission torque T c gradually increases from 0 to T n in a time duration t a . (Significance of all parameters are listed in Nomenclature) The transmitted torque is insufficient to overcome the resistance torque to start the vehicle; therefore, all the input energy from the engine is transformed into frictional work. The resultant value is as follows,
W 1 = 0 t a T c ω e d t
Second phase: The transmitted torque T c overcomes the resistance torque T n , and the vehicle starts. At this time, the rotation speed of the driven plate ω n gradually increases from 0 to the engine speed ω e during the time duration t a to t b . Hence, the frictional work during this stage is given as follows.
W 2 = t a t b T c ( ω e ω n ) d t
As the clutch starts to engage, the frictional work causes heat generation, resulting in temperature increasing. Based on the simulation and experiment results, the change in temperature of the friction plate of the clutch during engagement and separation can be divided into four stages: (a) sharp increase, (b) slight change, (c) rapid decrease and (d) slight change.
(a) The stage of sharp increase in the temperature: The friction disc speed ω n gradually increases from zero to ω e . The slipping generates a large amount of heat will lead to a sharply increasing the temperature of the friction plate of the clutch.
(b) The stage of slight change in temperature: The driving and driven plates are synchronous, i.e., the friction plate is in direct contact with the driving plates, and there is no slippage between the plates during this stage. Hence, a slight amount of heat energy is generated in this period. In addition, only the edge of the friction plate is exposed to air. The heat dissipation conditions of the friction plate are restricted, and the temperature of the friction plate changes slowly in this period.
(c) The stage of rapid decrease in temperature: The driving and driven plates separate from each other, and the entire surface of the friction disc is exposed to air. The speed of friction disc decreases gradually to zero. The convective heat-transfer coefficient is approximately proportional to the speed [29]. As the friction plate rotates, the convective heat-transfer coefficient is relatively high. The heat-dissipation conditions of the friction plate are favorable and the temperature of the friction plate decreases sharply.
(d) The stage of slight change in temperature: The friction disc stops running, which will slow down the speed of air circulation. Thereafter, the convective heat-transfer coefficient decreases. Therefore, the temperature of friction plate changes slowly in this period.

3. Theoretical Analysis

In order to calculate the temperature distribution of the friction plate (as shown in Figure 2) under frequent launching conditions, a finite-element model of the friction disc has been established. Some assumptions are made as follows:
  • The material properties are isotropic and independent of the temperature.
  • The contact pressure is uniformly distributed over all the friction surfaces.
  • The convective heat-transfer coefficient varies linearly with the speed.
  • Radiation is neglected because of the short launching time.
  • The wear on the contact surface is negligible.
In order to determine the temperature distributions, both analytical and numerical techniques have been applied. Based on the actual heating condition of the friction disc of the clutch, it can be assumed that the heat-conduction model of the friction disc satisfies the axisymmetric geometry, axisymmetric load, axisymmetric boundary conditions and constraints, which implies that the circumferential temperature of the friction disc is the same. Hence, the 3D model (Figure 2) of the friction disc can be simplified as a 2D axisymmetric heat-conduction model (Figure 3). The axisymmetric two-dimensional heat-conduction equation of the friction disc is as follow.
2 T r 2 + 1 r T r + 2 T Z 2 = ρ c k T t
The boundary and initial conditions of the non-stationary problem are established as follows.
k T Z Z = 0 = q r , 0 , t , R 1 r R 2 , t 0 k T Z Z = δ = q r , δ , t , R 1 r R 2 , t 0 k T r r = R 1 = h T T R 1 , Z , t , 0 Z δ , t 0 k T r r = R 2 = h T T R 2 , Z , t , 0 Z δ t 0 T r , Z , 0 = T , R 1 r R 2 , 0 Z δ , t 0
A mesh was created for the cross section of the friction disc, and the boundaries were added as follows.
Multiplying both sides of Equation (3) by r. The standard form of this function can be written as follows.
Π = k 2 Ω r [ ( 2 T r 2 + 2 T Z 2 ) ] d z d r + Ω ρ c r T T t d z d r + Γ k T n T r d s
The boundary conditions can be divided into three categories:
Γ = Γ 1 + Γ 2 + Γ 3
where Γ 1 , Γ 2 and Γ 3 are the given temperature, intensity of the heat flux and convective heat-transfer condition at the boundary, respectively.
In this study, the domain is divided into triangular meshes, as shown in Figure 3. The temperature and the derivative of the temperature can be expressed as a linear combination of the basis function associated with this node in each unit as follows.
T t = l = 1 n N l T l t
Finally, based on the above equations, the expression can be written as follows.
Π T i = e Ω k j = 1 n ( N i z N j z + N i r N j r ) T j d z d r + e Ω e ρ c j = 1 n N i N j T j t r d z d r + e Ω Γ 2 q f l u x N i r d s + e Ω Γ 3 h j = 1 n N j T j T f N i r d s = 0
Equation (8) describes the evolution of temperature filed in the time domain and establishes the temperature relationship between each point at every moment any given time. In order to solve the ordinary differential Equation (8), the backward differentiation method is applied. This method has advantages such as simplicity in calculation and stability during the solving processes. Assuming that T ( t ) is the temperature at t and T ( t Δ t ) is the temperature at t Δ t , the following equation can be written as follows and will be solved by the finite element method.
K T t + C T t T t Δ t Δ t = { P ( t ) }

4. Design of Experiments

4.1. Fiber Optic Temperature Measurement

In this test, the temperature sensing fiber is placed along the radial groove of the friction disc, as shown in Figure 4; some glue is used in the groove to fix a certain length of the optical fiber tube, and then the fiber is threaded into the tube. Each fiber tube with about 25 mm in length is regarded as a temperature measuring unit, and they can measure the temperature change of 12 points with a spatial resolution of 2 mm.
The radial groove on the surface of the friction disc is used to temporarily store friction debris and heat dissipation. The depth of the groove on the new friction disc used in this test is 2 mm, and the groove depth will become smaller as the friction disc wears. A fiber optic protection tube with an outer diameter of 2 mm and an inner diameter of 1 mm is inserted into a bending-resistant and high-temperature resistant fiber and then fixed in the groove with some glue. The minimum distance between the optical fiber and the contact frictional interface is about 0.5 mm. Due to the axisymmetric shape of the friction disc structure, the surface temperature is theoretically different in radial and axial direction, and there is no temperature gradient on the ring of the same thickness and the same radius. Therefore, more measurement units along the circumferential direction are not required. In this test, only two temperature measuring units are mounted for the flywheel-friction disc interface and the pressure plate-friction disc interface.
In order to validate the theoretical model, an experiment is designed to measure the temperature of the friction disc along the circumferential and radial directions. Table 1 lists the detailed parameters of the friction disc.
Figure 4 shows the temperature-acquisition system. The signal-input module, temperature-signal acquisition module, wireless-transmitting module and power-supply module are fixed tightly onto the shock absorber of the friction disc by high-temperature glue. The thermocouples are placed between the cracks on the surface of friction disc. Sixteen thermocouples are distributed in the circumferential and radial directions of the friction disc. Moreover, four thermocouples are installed along the same radial line at distances of 19, 35, 55 and 75 mm from the inner radius of the friction disc. The four radial lines are separated by 90°.
The friction disc of the clutch is installed on the MASMEC comprehensive test machine for the experiments. The clutch slipping time, engaging time, separating time, resistance torque and input speed are set on the test bench. In this study, the experiment is conducted under eight different working conditions. Table 2 lists the specific parameters. T f is the resistance moment. ω represents the input speed. t p denotes the time required for a single clutch engagement and separation, including the clutch slipping time, engaging time and separating time. N represents the clutch engaged and separated times.

4.2. Dry Clutch Friction Temperature Measurement Test Rig

The dry clutch friction characteristic test bench is shown in Figure 5. It consists of a mechanical transmission system, a servo motor control system and a data acquisition system. It can realize the pressure input or the clutch bearing displacement input by hand wheel, with different motor speed or torque input by servo motor control system. Data acquisition systems are able to acquire signals of pressure, speed, friction torque and friction surface temperature simultaneously. In the experiment, by rotating the hand wheel to control the displacement of the clutch bearing, the diaphragm spring is pushed to separate and combine the pressure plate and the friction disc. Alternatively, by using a spring with a force sensor, a certain value of the pressing force input can be performed. The servo motor is connected with the flywheel and the pressure plate assembly, which can realize different speed inputs through the system controller to completely simulate the working condition of the dry clutch system. The relevant performance parameters in this test are shown in Table 1.

5. Simulation and Experiment

Figure 6 shows the half section of the friction disc. Line c, line d and curve e are all, respectively, along the axial, radial and circumferential directions. By solving the two-dimensional transient temperature model, the distributions of temperature along the lines c and d under the different working conditions are obtained. Thereafter, the simulation results are compared with the experimental results under different working conditions in order to validate the accuracy of the model.

5.1. Change in Temperature along the Line c

Due to the structural complexity of the friction disc, it is difficult to place the thermocouples inside the disc. Therefore, the temperature data of the friction disc cannot be obtained for the line c. Here, we only analyze the temperature change in the line c based on the simulation results of the 2D model. The temperature changes with different depths on the line c with time t is shown in Figure 7. The temperature of the friction disc first increases and then subsequently decreases to a temperature higher than that in the previous condition. The increasing rate of temperature clearly decreases with the increase in Z. The decreasing rate of the temperature also decreases with the increase in Z. A large amount of heat energy is generated on the surface during the slipping stage. The surface is then directly in contact with air during the cooling stage. Thus, the boundary conditions significantly affect the surface temperature.

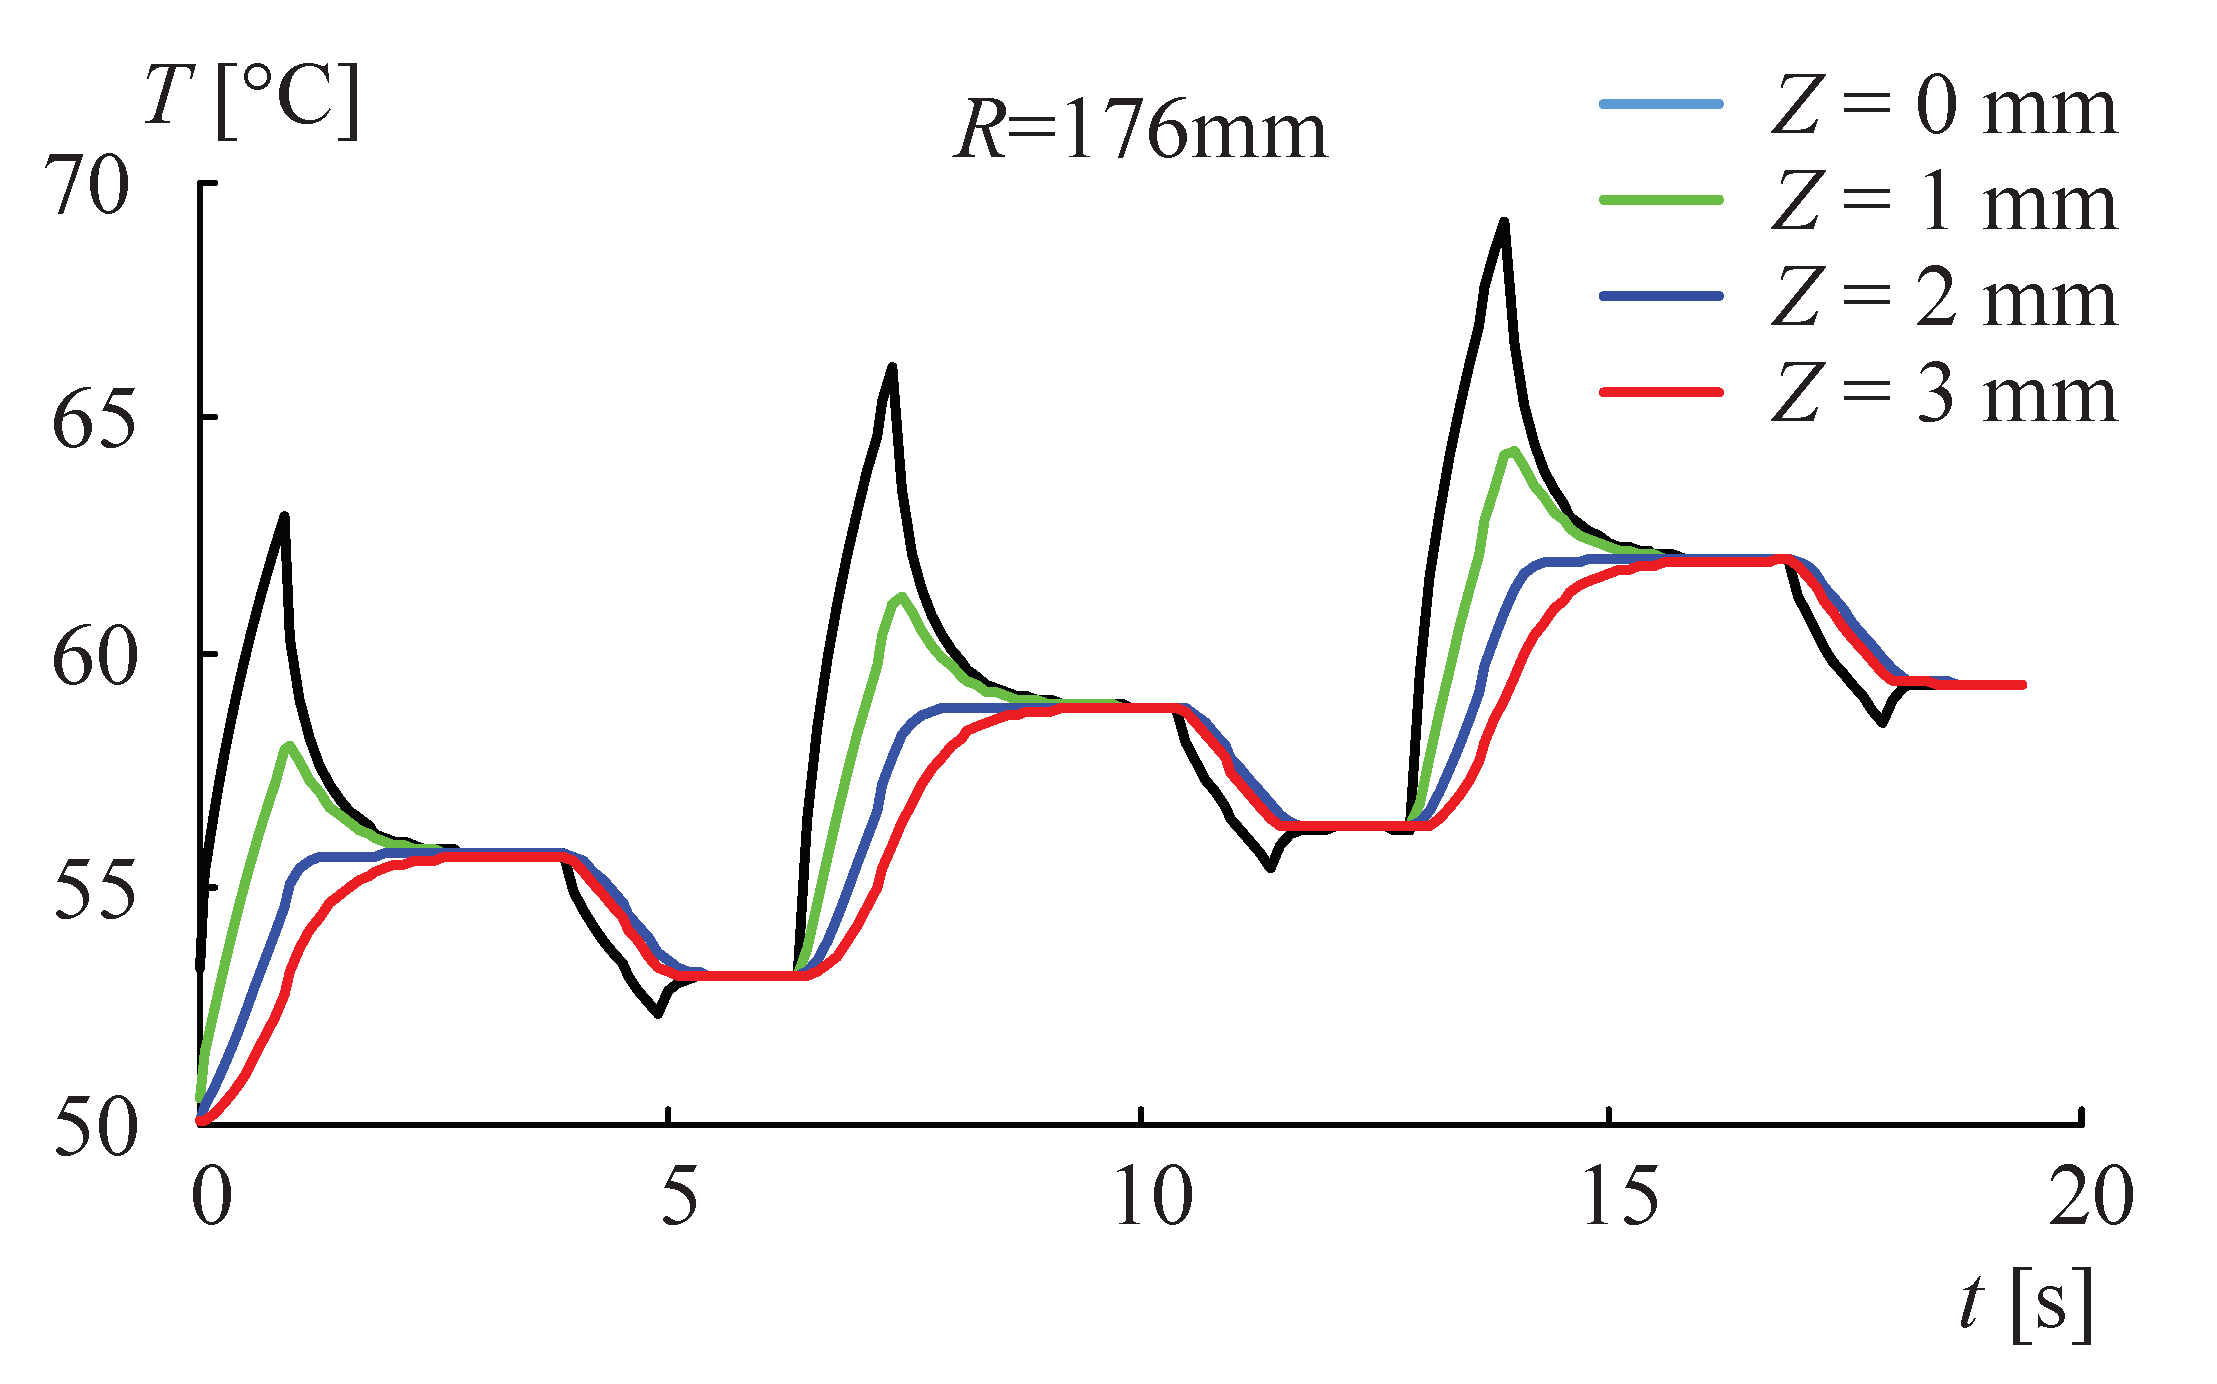
5.2. Change in Temperature along the Line d

Figure 8 shows the changes in temperatures on the contact surface of the friction disc at different radii: (a) R = 196 mm, (b) R = 176 mm, (c) R = 156 mm and (d) R = 140 mm. The circumferential angle is 90°; the input speed is 400 r/min; the resistance torque is 200 N·m; and the clutch is engaged and separated 30 times. The black and red lines represent the simulation and test values, respectively. The simulation results are in good agreement with the experimental data. The maximum error is approximately 6 ℃, and the average error is within 3 ℃, which lies in the acceptable range. With the increase in the number of engagement and separation processes, the temperature constantly increases. However, the increasing rate of the temperature declines gradually. Compared to the experimental data, the simulation results have better periodicity, but both vary similarly.
Figure 9 shows the experimental data at different radii. It is evident that the temperature distribution is related to the radius of the friction disc. The outer temperature of the friction disc is higher than inside, and temperature change outside the friction plate is much more intense. The reason for this is that the outside surface of the friction disc generates much more local heat during the slipping stage. Moreover, during the separating stage, the driving and driven plates are separated, and the temperature of the friction-disc surface is significantly different from that of the air around it and that of the friction-disc surface directly in contact with the air; the temperature of the friction disc decreases rapidly.

5.3. Change in Temperature along the Line e

Figure 10 shows the experimental temperature change on the contact surface of the friction disc at radii 156 mm and at different locations along the circumference: (a) θ = 0°, (b) θ = 90° and (c) θ = 180°. The input speed is 400 r/min; the resistance torque is 200 N·m; and the clutch is engaged and separated 30 times. It can be observed that, in this work condition, the hypothesis for circumferential temperature of the friction plate remains the same and is approved. In the theoretical model of the two-dimensional transient temperature field proposed in this study, we assumed that the boundary conditions are symmetrical along the axial direction and that the circumferential temperature of the friction disc is the same. Based on the experimental data, the assumption is reasonable.

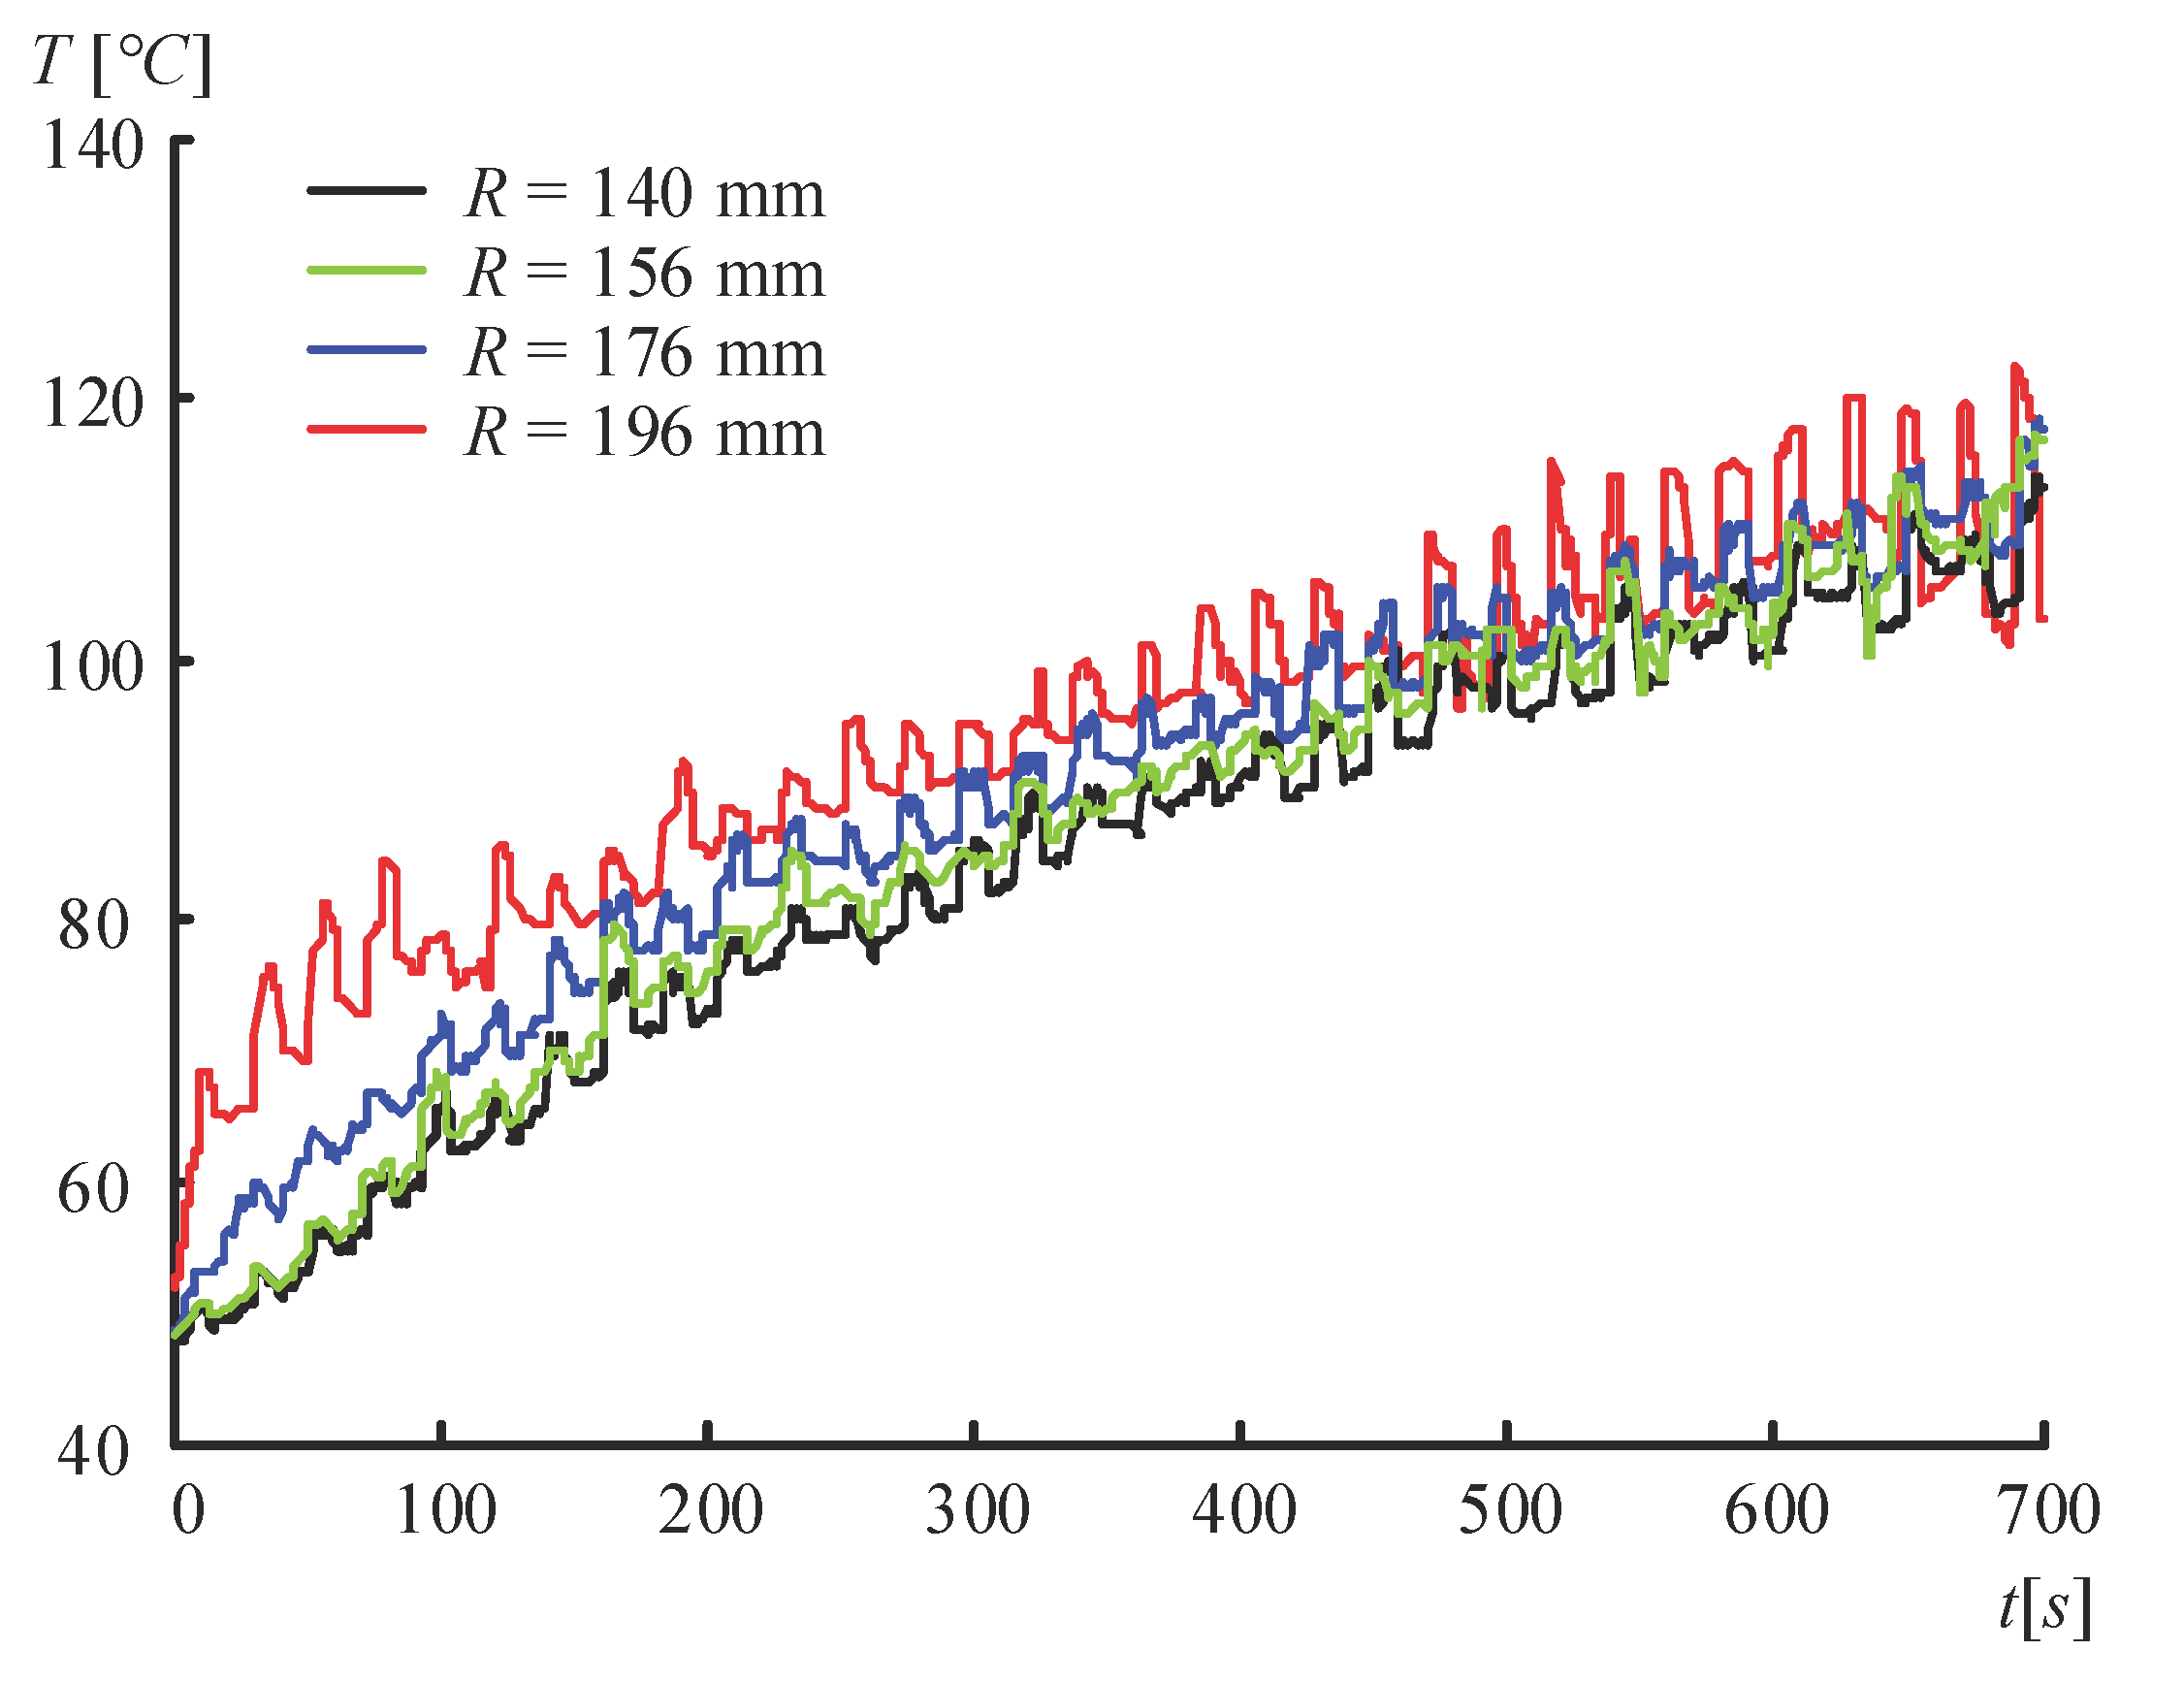
5.4. Change in Temperature under Different Working Conditions

Figure 11 shows the temperature distributions on the contact surface of the friction disc (R = 176 mm; θ = 90°). The red and blue lines represent the simulation results and experimental data, respectively. Table 3 lists the detailed data.
The increasing rate of the temperature is closely related to the working conditions: the input speed ω and the resistant torque T n . At the same input torque T n , the higher the input speed ω , the higher the temperature increasing rate. The higher the input torque and speed, the higher the temperature of the temperature increasing rate.

6. Conclusions

Based on the assumption of uniform pressure and the theory of heat transfer, a two-dimensional transient temperature model of the friction disc of the clutch is established. By the finite-element method, a numerical solution of the temperature with different work conditions is obtained. The experimental data are in good agreement with the simulation results. The error in their highest temperature is less than 5%, which validates the accuracy of the proposed model. The change in the temperature is divided into four stages for a single engagement and separation cycle: sharp increase, slight change, rapid decrease and slight change. The temperature distribution on the friction disc varies along the radial and axial directions and is similar to that along the circumferential direction. After repeated engagements, the temperature easily increases beyond 150 ℃, which is approximately equal to the critical temperature of a normal clutch material. Thus, an online calculation method is necessary to optimize the clutch control and to prevent clutch failure.

Author Contributions

Conceptualization, methodology, validation, writing—original draft preparation, formal analysis and investigation, F.M.; Resources, writing—review and editing and supervision, J.X. Both authors have read and agreed to the published version of the manuscript.

Funding

This research was supported by Natural Scientific Foundation of China (NSFC) under grant number 51275038.

Conflicts of Interest

The authors declare no conflict of interest.

Nomenclature

SymbolDescriptionValue
ω e Engine speedr/min
ω n Friction disc speedr/min
ω Input speedr/min
T n Resistance torqueN· m
T e Engine torqueN· m
T c Clutch torqueN· m
I e Moment of inertia of inputkg· m 2
I n Moment of inertia of outputkg· m 2
pContact pressureMPa
μ Coefficient of friction
γ Heat flux distribution coefficient
ρ Densitykg/m 3
cHeat capacityJ/K
kThermal conductivityW/(m/°C)
hConvective heat transfer coefficientW/(m 2 /K)
PHeat source vector
QIntensity of heat fluxW/m 2
R 1 Inner radiusmm
R 2 Outer radiusmm
t p Time required for single clutch engagement and separations
T m e Maximum temperature of experimental data°C
T m s Maximum temperature of simulation results°C
Δ T m Maximum difference between simulation°C
results and experimental data
ZAxial coordinatemm
θ Circumferential coordinate
δ Thickness of the clutchmm

References

  1. Al-Zubaidi, S.; Senatore, A.; Abdullah, O.I.; Scuotto, N. Effect of Sliding Speed on the Thermal Fields and Frictional Behaviours of Asbestos-free Frictional Materials Used for Dry Clutch System. IOP Conf. Ser. Mater. Sci. Eng. 2020, 881, 012086. [Google Scholar] [CrossRef]
  2. Wang, H.; Wang, B.; Pi, D.; Wang, E.; Wang, X. Two-Layer Structure Control of an Automatic Mechanical Transmission Clutch During Hill Start for Heavy-Duty Vehicles. IEEE Access 2020, 8, 49617–49628. [Google Scholar] [CrossRef]
  3. Della Gatta, A.; Iannelli, L.; Pisaturo, M.; Senatore, A.; Vasca, F. A survey on modeling and engagement control for automotive dry clutch. Mechatronics 2018, 55, 63–75. [Google Scholar] [CrossRef]
  4. Wang, Y.; Li, Y.; Li, N.; Sun, H.; Wu, C.; Zhang, T. Time-varying friction thermal characteristics research on a dry clutch. Proc. Inst. Mech. Eng. Part D J. Automob. Eng. 2014, 228, 510–517. [Google Scholar] [CrossRef]
  5. Wang, Y.Y.; Liu, X. Temperature distribution of friction plate for dry clutch. J. Traffic Transp. Eng. 2015, 15, 86–92. [Google Scholar]
  6. Lin, X.; Xi, J.; Hao, S. The calculation model of the friction torque on a dry clutch. Proc. Inst. Mech. Eng. Part D J. Automob. Eng. 2017, 231, 1796–1805. [Google Scholar] [CrossRef]
  7. Abdullah, O.I.; Akhtar, M.J.; Schlattmann, J. Investigation of Thermo-Elastic Behavior of Multidisk Clutches. J. Tribol. 2015, 137, 011703. [Google Scholar] [CrossRef]
  8. Abdullah, O.I.; Schlattmann, J.; Senatore, A.; Al-Shabibi, A.M. Investigation of thermoelastic problem of multiple-disc friction clutches applying different thermal loads. Heat Mass Transf. 2018, 54, 3461–3471. [Google Scholar] [CrossRef]
  9. Gong, Y.; Ge, W.; Yi, Y.B. Finite element analysis of thermal buckling characteristics of automotive 430 dry clutch pressure plate. Int. J. Veh. Des. 2018, 78, 108–130. [Google Scholar] [CrossRef]
  10. Abdullah, O.I.; Schlattmann, J. A Three-Dimensional Finite Element Approach to Grooved Dry Clutches Analysis. J. Balk. Tribol. Assoc. 2014, 20, 184–198. [Google Scholar]
  11. Cakmak, T.; Kilic, M. Estimation of friction surface temperature of a dry clutch. Int. J. Heavy Veh. Syst. 2020, 27, 683–702. [Google Scholar] [CrossRef]
  12. Gong, Y.; Wang, P.; Ge, W.; Yi, Y.B. Numerical Simulation and Mechanism Analysis on the Concave Deformation of Automotive Dry Clutch Pressure Plate. Appl. Sci. 2019, 9, 5017. [Google Scholar] [CrossRef] [Green Version]
  13. Mouffak, E.; Bouchetara, M. Transient thermal behavior of automotive dry clutch discs by using Ansys software. Mechanika 2016, 22, 562–570. [Google Scholar] [CrossRef] [Green Version]
  14. Senatore, A.; D’Auria, C.; Pisaturo, M. Simulations of engagement control in actuated dry-clutch: Influence of frictional response of facing materials. Appl. Mech. Mater. 2017, 868, 15–20. [Google Scholar] [CrossRef]
  15. Koranteng, K.; Shaahu, J.S.; Ma, C.; Li, H.; Yi, Y.B. The performance of Cu-based friction material in dry clutch engagement. Proc. Inst. Mech. Eng. Part J J. Eng. Tribol. 2020, 235, 1994–1996. [Google Scholar] [CrossRef]
  16. Liang, X.; Chen, L.; Wang, Y.; Wan, L. A proposed torque calculation model for multi-plate clutch considering boundary lubrication conditions and heat transfer. Int. J. Heat Mass Transf. 2020, 157, 119732. [Google Scholar] [CrossRef]
  17. Skugor, B.; Deur, J.; Ivanovic, V. E-Clutch Torque Control Including Compensation of Thermal Expansion Effects. IEEE Trans. Veh. Technol. 2020, 69, 246–257. [Google Scholar] [CrossRef]
  18. Funck, J.; Knoblich, R.; Scholz, D.; Nowoisky, S.; Guehmann, C. Wireless System for Measuring Temperatures in Automotive Dry Clutches. TM-Tech. Mess. 2013, 80, 84–91. [Google Scholar] [CrossRef]
  19. Fernandes, G.; Zanotto, P.; Sinatora, A. The Role of Counter-Face Roughness on the Tribological Performance of a Clutch System Tested with a Pin-On-Disc Tribometer. Lubricants 2016, 4, 18. [Google Scholar] [CrossRef] [Green Version]
  20. Effects of Different Kinds of Fibers on Mechanical and Tribological Properties of Brake Friction Materials. Tribol. Trans. 2013, 56, 536–545. [CrossRef]
  21. Wu, W.; Xiao, B.; Yuan, S.; Hu, C. Temperature distributions of an open grooved disk system during engagement. Appl. Therm. Eng. 2018, 136, 349–355. [Google Scholar] [CrossRef]
  22. Verma, P.C.; Ciudin, R.; Bonfanti, A.; Aswath, P.; Straffelini, G.; Gialanella, S. Role of the friction layer in the high-temperature pin-on-disc study of a brake material. Wear 2016, 346, 56–65. [Google Scholar] [CrossRef]
  23. Abdullah, O.I.; Schlattmann, J. Temperature analysis of a pin-on-disc tribology test using experimental and numerical approaches. Friction 2016, 4, 1–9. [Google Scholar] [CrossRef] [Green Version]
  24. Kennedy, F.E. Thin film thermocouple arrays for sliding surface temperature measurement. Wear 1997, 207, 46–54. [Google Scholar] [CrossRef]
  25. Feng, Y.; Zhang, H.; Li, Y.L.; Rao, C.F. Temperature Sensing of Metal-Coated Fiber Bragg Grating. IEEE/ASME Trans. Mechatron. 2010, 15, 511–519. [Google Scholar] [CrossRef]
  26. Ren, L.; Jiang, T.; Jia, Z.G.; Li, D.S.; Yuan, C.L.; Li, H.N. Pipeline corrosion and leakage monitoring based on the distributed optical fiber sensing technology. Measurement 2018, 122, 57–65. [Google Scholar] [CrossRef]
  27. Jonas, K.; Michael, G.; Benoit, L. A new approach for the optimization of the thermo-mechanical behaviour of dry-running clutches using fibre-optic sensing technology with high spatial measurement density. Proc. Inst. Mech. Eng. Part J J. Eng. Tribol. 2015, 229, 1003–1010. [Google Scholar] [CrossRef]
  28. Albers, A.; Ott, S.; Kniel, J.; Eisele, M.; Basiewicz, M. Investigation of the thermo-mechanical behaviour of clutches using fibre optic sensing technology with high spatial measurement density. Proc. Inst. Mech. Eng. Part J J. Eng. Tribol. 2017, 232, 26–35. [Google Scholar] [CrossRef]
  29. Senatore, A.; Pisaturo, M.; Dasic, P. Frictional Torque Behavior in Actively-Closed Actuated Dry Clutch: The Temperature Influence. Appl. Mech. Mater. 2016, 806, 240–248. [Google Scholar] [CrossRef]
Figure 1. Simplified dynamic model of dry clutch.
Machines 09 00185 g001
Figure 2. Schematic of the friction plate.
Machines 09 00185 g002
Figure 3. The heat flux density, boundary conditions and the finite element grid of the friction disc.
Machines 09 00185 g003
Figure 4. Arrangement of the optical fiber.
Machines 09 00185 g004
Figure 5. Temperature measurement test rig.
Machines 09 00185 g005
Figure 6. Half section of friction disc.
Machines 09 00185 g006
Figure 7. Temperature variation at different height on the line c.
Machines 09 00185 g007
Figure 8. Temperature variation at different radii on the line d.
Machines 09 00185 g008
Figure 9. Temperature variation at different radii.
Machines 09 00185 g009
Figure 10. Temperature variation of different points on curve e.
Machines 09 00185 g010
Figure 11. Temperature variation at different working conditions.
Machines 09 00185 g011
Table 1. Parameters for experiments.
ItemsSymbolUnitValue
Thermal conductivitykW/(m·℃)43
Heat capacitycJ/(kg·K)1412
Density ρ kg/m 3 2412
Convective heat transfer CoefficienthW/(m 2 /K)50
Transmitted Torque T c N·m71∼88
Working Pressing ForceFN1940∼2380
Coefficient of Friction μ N0.27
Inner radius R 1 mm121
Outer radius R 2 mm215
Input speed ω r/min200–1000
Resistance moment T f N·m200–600
Table 2. Specific parameters under different working conditions.
Case T f (N·m ) ω (r/min) t p (s)N
I20020036.530
II20040023.530
III40050023.530
IV40060023.530
V40080036.525
VI60060023.530
VII60080036.512
VII600100036.52
Table 3. Experimental data and simulation results under different working conditions.
CaseIIIIIIIV
T 0 32575972
N1212122
T m s 48.7193160.3172.5
T m e 49.5689.33157.1167.8
Δ T m 25610
ω 2004008001000
T n 200200600600
Publisher’s Note: MDPI stays neutral with regard to jurisdictional claims in published maps and institutional affiliations.

