Article

Numerical Optimization for the Impact Performance of a Rubber Ring Buffer of a Train Coupler

1
Key Laboratory of Traffic Safety on Track, Ministry of Education, School of Traffic & Transportation Engineering, Central South University, Changsha 410075, China
2
Joint International Research Laboratory of Key Technology for Rail Traffic Safety, Central South University, Changsha 410075, China
3
National & Local Joint Engineering Research Center of Safety Technology for Rail Vehicle, Central South University, Changsha 410075, China
4
State Key Laboratory of High Performance Complex Manufacturing, Central South University, Changsha 410075, China
*
Author to whom correspondence should be addressed.
Machines 2021, 9(10), 225; https://doi.org/10.3390/machines9100225
Submission received: 30 August 2021 / Revised: 28 September 2021 / Accepted: 30 September 2021 / Published: 2 October 2021
(This article belongs to the Section Material Processing Technology)

Abstract

:
Shock and vibration caused by mechanical motion bring huge potential threats to the service life and assembly reliability of mechanical systems. Rubber materials have been widely used in aircraft, trains, and other engineering fields, due to their excellent properties in shock and vibration absorption. This paper aimed to study the rubber ring buffer applied to a certain type of Chinese locomotive. Firstly, the finite element model was established and verified through experimental data. Based on the verified simulation model, the influence of the constitutive parameters (C01/C10 ratio height H and contour radius R) of the rubber ring on its energy absorption and peak crushing force under impact loading was studied in a numerical environment. Finally, the design of the experiment was carried out by the optimized Latin hypercube method, and the response surface model was established, which intuitively demonstrated the influence of the relevant parameters of the rubber ring on the change trend of the energy absorption and peak force. Based on the proxy model, the parameters that improve the crashworthiness of the rubber ring buffer were found quickly by the NSGA-II optimization algorithm, and the problems of a long calculation time and low optimization efficiency when using the conventional finite element method were avoided. The optimization results stated that when H = 107.57 mm and R = 85.70 mm, C01/C10 = 0.0571 of the energy absorption of the optimized buffer was increased by 59.03%, and the peak force was decreased by 14.37%, compared with the original structure. The optimized rubber ring buffer is expected to reduce the peak crushing force, enhance the energy absorption capacity, and mitigate the damage to the train system caused by shock and vibration.

1. Introduction

During the operation of a train, there is a coupling relationship between adjacent vehicles in the longitudinal, lateral, and vertical directions. The longitudinal impulse of the train will have a greater impact on the lateral and vertical dynamics of the vehicle, as it is an important factor that affects the comfort and safety of the vehicle. The buffer has the function of dissipating the shock and vibration energy between the vehicles, thereby reducing the damage to the car body structure and the loaded goods, simultaneously improving the running stability of the train. In order to better discover and understand the relevant properties of rubber buffers, the cushioning performance and energy absorption characteristics of rubber materials have become the focus of research in many fields.
Lin et al. [1] established a buffer collision simulation mathematical model based on the test data of a railway buffer system, which overcomes the difficulty of the railway vehicle buffer through the actual vehicle collision test and performance evaluation. By studying the cushioning characteristics of a 10-car train colliding at 25 km/h, it was proved that the buffer can better match the energy dissipation. Wu et al. [2] established a finite element model of the rubber extrusion process by the Euler–Lagrangian coupling method, and simulated the expansion phenomenon in the rubber extrusion process, which was consistent with reality. The extrusion process parameters were optimized by the finite element method, and the tire forming quality was improved. Wang et al. [3] established the finite element model of the steering rubber buffer seat of the loader, and determined the design variables, constraint function, and objective function of the optimal design model of the rubber buffer seat in detail. Through optimization and iterative calculation, the optimal design parameters of the design model of the steering rubber cushion seat of the loader were found finally, which improved the comfort of the machine operation and, recognized by the market, it proves the correctness and rationality of the finite element design method. Zhang et al. [4] used the improved non-linear mathematical model of the buffer and the dynamic model verified by experiments to study the parameters affecting the stability of coupler compression and the safety of locomotive operation. Shang et al. [5] used finite element simulation technology to analyze and predict the static characteristics of rubber components, indicating the effectiveness of the finite element prediction method and indicating that the finite element analysis method can play an important role in the design of rubber vibration isolators. Peng et al. [6] established the finite element simulation model of the FRP rubber bearing, studied the influence of its size parameters on the compression performance, and obtained the influence law of the size parameter, which provided a reference for the engineering design of the FRP rubber bearing. Pang et al. [7] proposed a new finite element method for static calculation and analysis of automobile composite rubber suspension, and conducted stress distribution and deformation analysis on rubber suspension under different working conditions through finite element software. It provides a reference for the virtual design and lightweight design of vehicle composite rubber suspension. Tao et al. [8] proposed an improved superelastic constitutive model, and carried out related finite element simulation calculations based on the test data of filled rubber. The results showed that the constitutive model has the characteristics of accurate results, less material parameters, and simple testing for simulated rubber materials. Freckley et al. [9] deduced the empirical formula of the IRHD (International Rubber Hardness Degrees) hardness Hr and elastic modulus E0 of rubber materials through related experiments, which laid the foundation for the reverse calculation of rubber material parameters. Zhang et al. [10] derived the constitutive equation of rubber material based on the hyperelasticity theory, and obtained the material parameters by fitting the experiment data. Based on the established simulation method of rubber ring sealing’s performance, the excellent sealing performance of the proposed new butterfly rubber ring was verified. Mariusz et al. [11] determined the basic stiffness under a variable strain rate through the compression test results of a rubber bumper, so as to adjust the numerical model of the buffer, and finally obtained an improved rubber buffer and a numerical model that can be used for accurate simulation. Shi et al. [12] used a new type of rubber material strain energy function to analyze the large deformation of an incompressible rubber cylinder under internal pressure, and proposed a new method to control the calculation stability and convergence rate, and the influence of the choice of penalty factor on the result of finite element calculation was also discussed. Yildiz [13] determined the actual performance of the rubber fender through experiments and used three different strain energy functions as the superelastic material model in its finite element analysis. After comparing the results of the experiments and simulations, the most suitable strain energy function hyperelastic material model of the rubber fender was determined finally. Wang et al. [14] analyzed the factors of the stress field and strain field of rubber joints and the relationship between these factors and the location of fatigue cracks through three-dimensional finite element simulation. The results showed that the stress concentration is not sensitive to the prediction of a fatigue crack’s location, and the method of using strain concentration to predict the fatigue crack location of rubber joints was proposed. This method is of great significance to the design of rubber joints and the theoretical study of fatigue strength.
The energy absorption of the rubber buffer mainly relies on its own elastoplastic deformation and friction with related parts. Due to the unique super-elastic properties of rubber, there is a certain difference in energy absorption from metal deformation. These characteristics have also become an attraction for researchers to study [15,16]. Resistance–displacement is an important indicator of the energy absorption of the buffer, and the area enclosed by the curve is the energy absorption of the buffer. Sometimes, these data will become input data for studying multi-body dynamics [17]. The commonly used methods to obtain the resistance–displacement curve include the static compression test and drop hammer impact test. Li et al. [18] determined the dynamic mechanical properties of high-damping rubber through the Hopkinson pressure bar (SHPB) test. The results showed that the stress–strain curve and dynamic modulus of high-damping rubber have obvious strain rate effects. The strength and energy absorption capacity of the material increase with the increase of the strain rate. Yao et al. [19] studied the quasi-static and impact energy absorption characteristics of railway vehicle rubber buffers by using quasi-static tests and drop-weight tests. Zhang et al. [20] analyzed the energy absorption value of rubber materials under a dynamic impact load. The study found that the strain value effect of rubber is very obvious, and the hardness of rubber is an important factor affecting the energy absorption value. Chen et al. [21] developed a high computational efficiency method to simulate the vertical dynamic behavior of the vehicle-track coupling system, and adopted the direct solution algorithm instead of the iterative method, which significantly improved the overall computational efficiency. Compared with existing models, the accuracy and efficiency of this method have been studied. Cui et al. [22] proposed a model simplification method to analyze the dynamic response of beam structures under moving loads, and successively applied this technique to simply supported beams under single point loads moving along the beam and a practical model for dynamic analysis of wheel–rail interaction in railway engineering. Numerical examples show that the condensation model can solve the moving load problem more quickly than the analytical model or the full finite element model, and the model has higher calculation accuracy. Chen et al. [23] studied the influence of the friction coefficient, wave grinding depth, and wave grinding wavelength on rail wave grinding development. The results show that the vibration caused by wheel–rail friction can cause rail wrinkling, and the uneven feedback vibration of rail wrinkling can aggravate the development of subsequent rail wrinkling.
At present, the research on rubber products mainly adopts the method of combining finite element simulation with experiments, and the general finite element method requires high computing resources and takes a long time. Experimental methods need to consume more human and material resources. If the proxy model is used for research, the efficiency of calculation and optimization will be greatly improved, and the change rule between research parameters and responses can be seen intuitively. In this paper, based on the Mooney–Rivilin constitutive model of rubber compression, the effects of different ratios of constitutive parameter ratios C01/C10, rubber ring buffer height H, and contour radius R on rubber ring buffer energy absorption and peak force were studied through ABAQUS simulation, and the relationship between each parameter and response was established by building a proxy model. The optimum performance parameters of the rubber ring buffer were obtained.

2. Finite Element Modeling

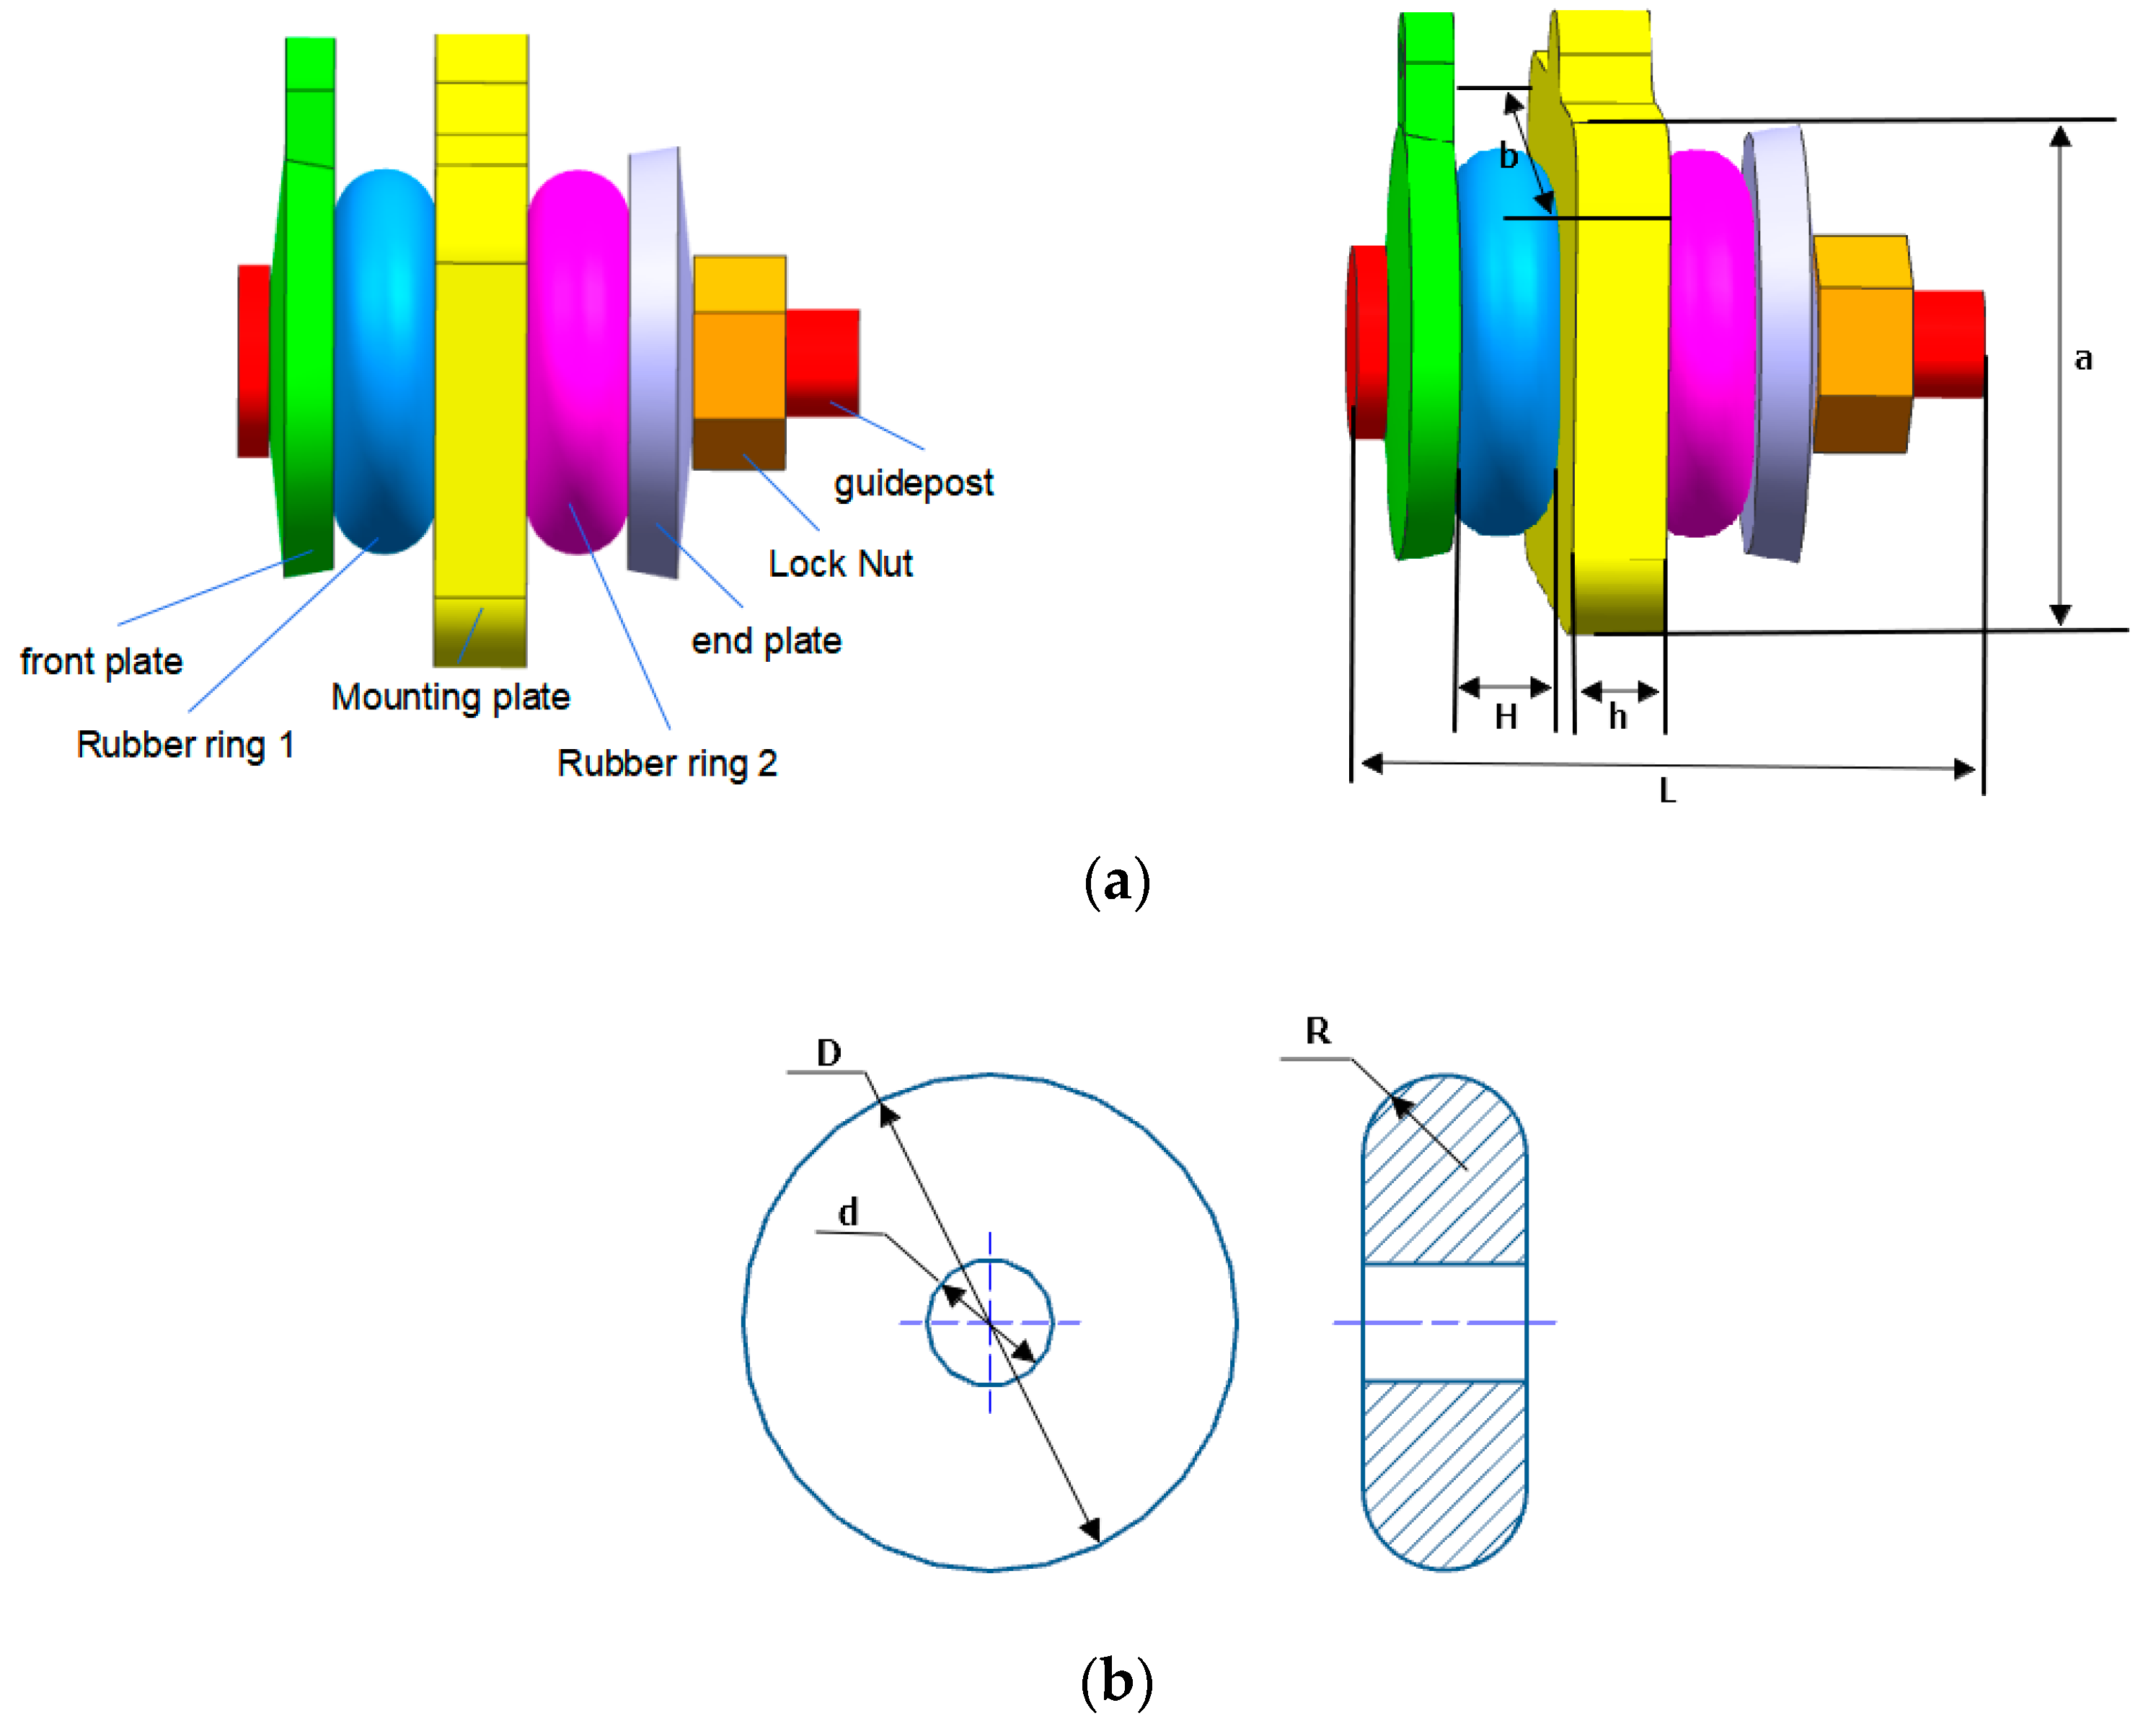
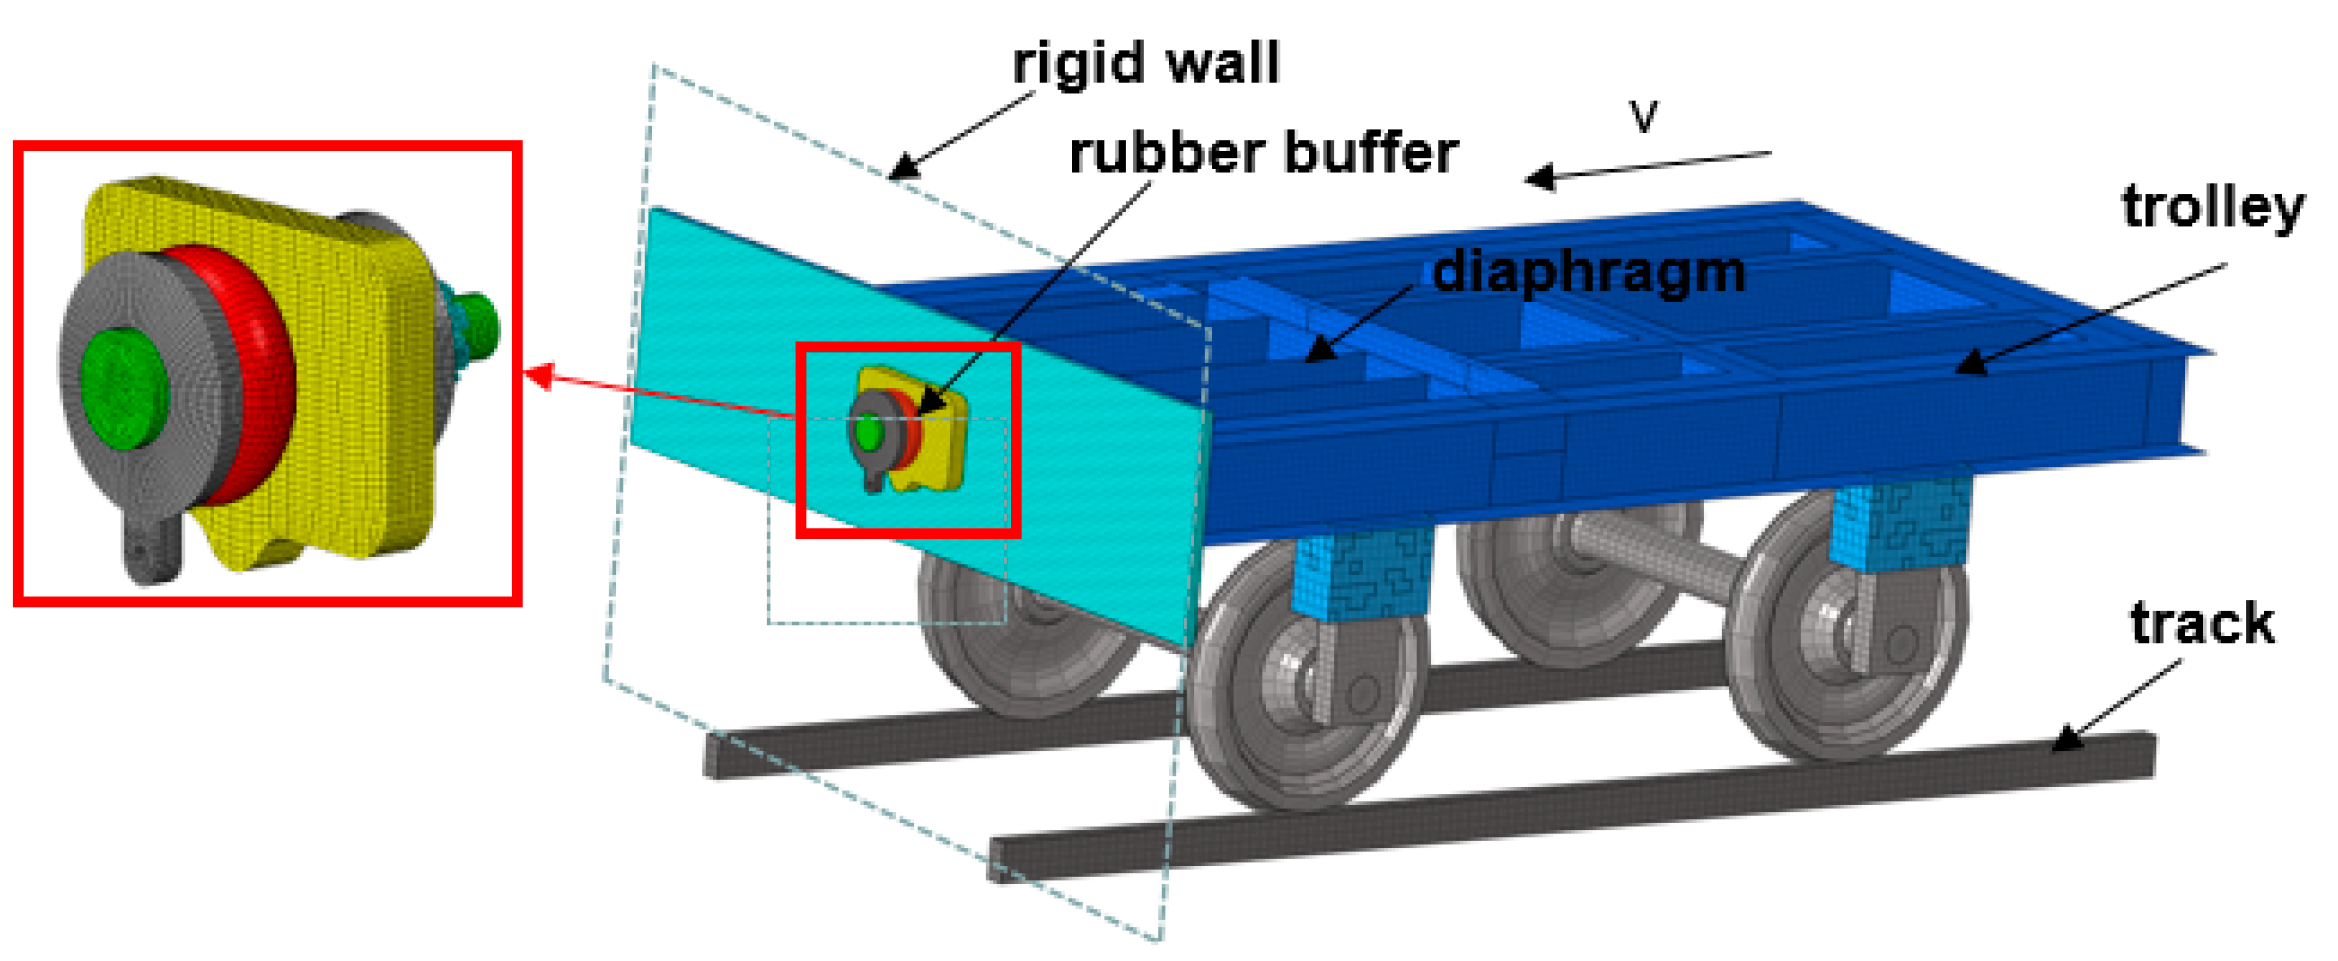
2.1. Description of the Structure and Position of the Rubber Ring Buffer

The rubber ring buffer described in this paper is located between the coupler and the body buffer beam, which is used to connect the body buffer beam and the train coupler, and plays a certain role in cushioning energy absorption and shock absorption for the longitudinal impact of the train. The specific position is shown in Figure 1a, and the details of the train coupler and rubber buffer are shown in Figure 1b.

2.2. Introduction of the Mooney–Rivilin Model

The Mooney–Rivilin model is based on the phenomenological theory of large elastic deformation [24], which is based on two assumptions:
  • Rubber is isotropic in the undeformed state and has an incompressibility volume.
  • Hooke’s law is followed in the shear deformation, that is, the stress and strain are in a linear relationship. The constitutive relationship of the rubber material can be expressed as a function of the three invariants (I1, I2, I3) of the deformation tensor by a strain energy density function, or as a function of the three main elongation ratios (λ1, λ2, and λ3):
I 1 = λ 1 2 + λ 2 2 + λ 3 2
I 2 = λ 1 2 λ 2 2 + λ 2 2 λ 3 2 + λ 3 2 λ 1 2
I 3 = λ 1 2 λ 2 2 λ 3 2
According to the incompressibility volume of rubber materials, the following relationship is introduced:
I 3 = λ 1 2 λ 2 2 λ 3 2 = 1
Substituting formula (4) into formula (2), the following relationship can be obtained:
I 2 = λ 1 2 + λ 2 2 + λ 3 2
Regarding I1 and I2 as two independent variables, which is determined by the three stretching ratios, the strain energy density (W) of an isotropic incompressible material can be expressed as:
W = i + j = 1 N C i j ( I i 3 ) i * ( I j 3 ) j
where Cij is the material constant.
Generally, the Mooney–Rivlin model is widely used, namely:
W = C 10 ( I 1 3 ) + C 01 ( I 2 3 )
This model can describe the characteristics of rubber deformation within the elongation of 150% well [25].
From the relationship between the Kirchoff stress tensor and Green strain tensor, the relationship between the principal stress σi of the rubber material and its principal elongation ratio λi is:
σ i = 2 ( λ i 2 w I 1 + 1 λ i 2 w I 2 ) + P
where P is the unknown pressure reflecting that the rubber is incompressible and insensitive to the pressure [26].
From formula (8), the differences among three principal stresses (engineering stress) can be obtained as:
σ 1 σ 2 = 2 ( λ 1 2 λ 1 2 ) ( w I 1 + λ 3 2 w I 2 )
σ 2 σ 3 = 2 ( λ 2 2 λ 3 2 ) ( w I 1 + λ 1 2 w I 2 )
σ 3 σ 1 = 2 ( λ 3 2 λ 1 2 ) ( w I 1 + λ 2 2 w I 1 )
For a single compression test, there is σ 2 = σ 3 = 0 , λ 2 2 = λ 3 2 = 1 λ 1 , hence:
σ 1 = 2 ( λ 1 2 1 λ 1 ) ( w I 1 + 1 λ 1 w I 2 )
Calculating the partial derivatives of Equation (7) with respect to I1 and I2, respectively, it can be obtained that:
w I 1 = C 10 , w I 2 = C 01
In addition:
λ 1 = 1 + ε 1
where ε1 is the principal strain (engineering strain) in this direction. Substituting formula (13) and formula (14) into formula (11), it can be obtained that:
σ 1 = C 10 ( 2 + 2 ε 1 2 ( 1 + ε 1 ) 2 ) + C 01 ( 2 2 ( 1 + ε 1 ) 2 )
It can be seen from Equation (15) that the stress–strain relationship is obtained through the material mechanical property test, and the coefficients C10 and C01 can be determined by the method of least squares fitting.

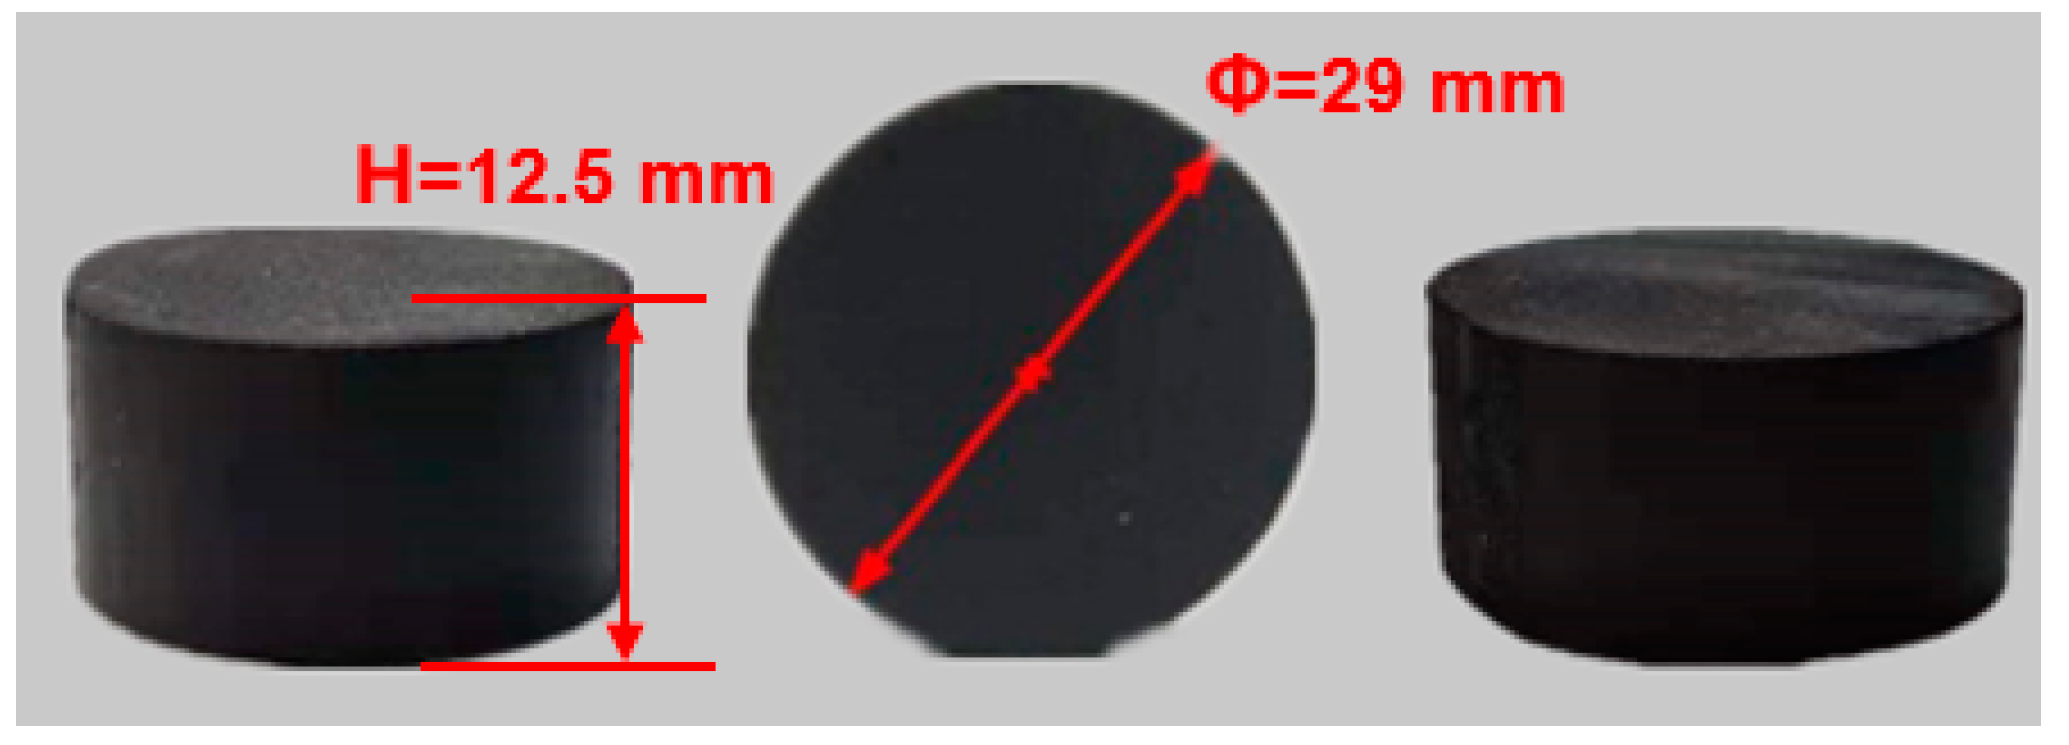
2.3. Uniaxial Compression Test of Rubber

2.3.1. Sample Preparation

According to Section 2.1, in order to obtain the material parameters of rubber materials, static mechanical tests of rubber materials were carried out as the next step. The test sample was the rubber cut from the rubber ring buffer, according to the Chinese National Standard, i.e., “GB/T 7757-2009: determination of compressive stress-strain properties of vulcanized rubber or thermoplastic rubber”. The sample was made into a cylinder with a diameter of 29 mm and a height of 12.5 mm, as shown in Figure 2.

2.3.2. Experimental Procedure

The equipment used in the experiment was the “MTS Insight 30 electronic tension and compression testing machine”, as shown in Figure 3. The maximum test force measured was 30 kN, and the load accuracy was ±0.5%.
Before the initiation of the experiment, a layer of lubricant was firstly attached to the two horizontal surfaces of the rubber to eliminate the influence of friction on the experiment results. The rubber sample was gently placed on the center of the pressure plate. During the test, the sample was compressed at a speed of 10 mm/min until the strain reached 60%. Then, the sample was relaxed at the same speed. This loading loop was repeated three times. The purpose of this operation was to eliminate the experimental error caused by the Mullins effect of the rubber material. After that, the formal experiment was conducted. The force during the experiment was measured by the load cell on the top of the pressure plate, and the displacement was obtained by the displacement sensor of the testing machine; thus, the computer could automatically record the force–displacement curve.

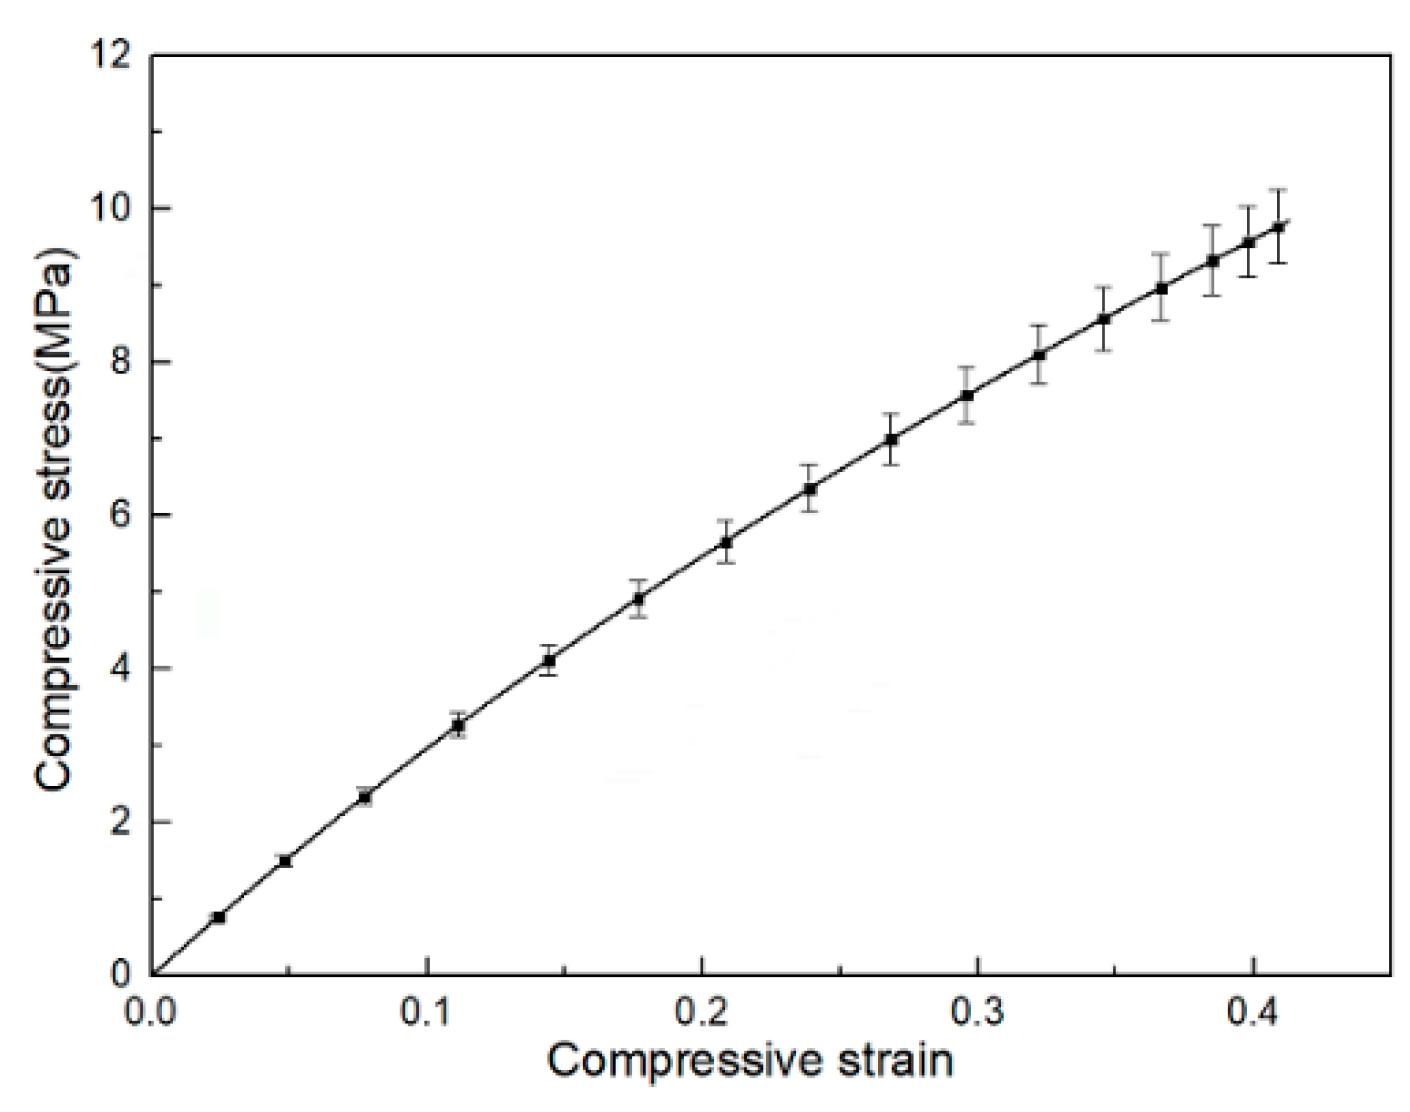
2.3.3. Experiment Results

The nominal stress–strain curve of the rubber can be obtained by dividing the experimentally measured force by the cross-sectional area of the rubber column, and dividing the displacement by the height of the rubber column. The formal experiments were carried out for three samples, and the arithmetic average of the results is shown in Figure 4. Combining the stress–strain data obtained from the experiment with formula (15) and using the least squares fitting method, the fitting parameters were obtained as, C10 = 5.2367, C01 = 0.2994.

2.4. Finite Element Model

The structure of the rubber buffer is shown in Figure 5. Figure 5a shows the main structure composition and dimensions of the general structure of the rubber ring buffer, which is mainly composed of a front-end plate, rubber ring 1, mounting plate, rubber ring 2, rear end plate, locking nut, and guide column. The length of the guide column is L = 404 mm, and the length, width, and height of the mounting plate are a = 330 mm, b = 520 mm, and h = 60 mm, and the thickness of the rubber ring is H = 90 mm. The rubber ring is installed on both sides of the mounting plate through the guide column. The rubber rings on both sides of the mounting plate have the same shape and size, and their dimensions are shown in Figure 5b. The inner diameter of the rubber ring is d = 70 mm, the outer rubber circle diameter is D = 184 mm, and the outer contour radius is R = 45 mm.
We used ABAQUS software to establish the finite element model of the rubber buffer. Based on the finite element analysis method, the subsequent calculation was carried out for the longitudinal stiffness of the buffer. The ABAQUS/Explicit module was used to solve the problem. This module is mainly used to analyze the dynamic, quasi-static, and complex nonlinear dynamic problems. When the contact conditions of the system are more complicated, this module can solve the problem efficiently. The finite element model of the structure is shown in Figure 6. In the modeling process, shell elements were used for the thin walls and diaphragm, and solid elements were used for the rubber buffers. The welding between the rubber mounting plate and the trolley was simulated by node coupling.
Since meshing will seriously affect the length of the calculation time and the accuracy of the computational results, especially when meshing materials with large strain characteristics, such as rubber, the contact surface or stress concentration should be appropriately refined to prevent the occurrence of grid distortion, which would lead to analysis failure in the calculation process. In addition, appropriate element types should be selected to simulate each component. For metal materials, C3D8R elements (8-node linear first-order reduction integration elements) are usually used; for rubber materials, C3D8H elements (8-node hexahedral hybrid elements) are the most appropriate, while there are no hybrid elements in the ABAQUS/Explicit solver. However, Reddy et al. [27] pointed out that it is reasonable to use reduced integration elements to simulate nonlinear material properties when using the ABAQUS/Explicit solver. Therefore, we used C3D8R elements to mesh the rubber material. However, the hourglass effect often occurs in the calculation of rubber deformation when using reduced integral units, which can easily lead to inaccurate calculation results or calculation failures. In order to avoid this, the hourglass control enhancement technology was used when meshing. Through the division of each part, the mesh of the rubber buffer model was finally completed. The number of elements and nodes of the finite element model were 120,292 and 130,040, respectively.
The trolley adopts rigid body modeling, and the number of elements and nodes of the finite element model were 50,065 and 60,219, respectively. The rear part of the car was equipped with a mass point for weighting, making the whole car weigh 17 t. The whole set of test equipment was placed on the track and the lower side was fixed, hitting the rigid wall at a speed of 5.75 km/h. In addition to the rubber ring, the trolley and related installation structural materials were set to Q235. The parameters of the relevant materials are shown in Table 1.
In the finite element analysis, this paper used a general contact algorithm to establish the contact relationships among the mounting plate, guide column, surface of the rubber block, surface of the front and rear-end plates, metal surfaces of the mounting plate, guide posts, and surface of the rubber ring serves. According to the actual constraints of the buffer, corresponding constraints were set in the non-axial direction of the model, that is, the translation and rotation of the model along the non-axial direction were restricted. The collision simulation time was set to 0.1 s.

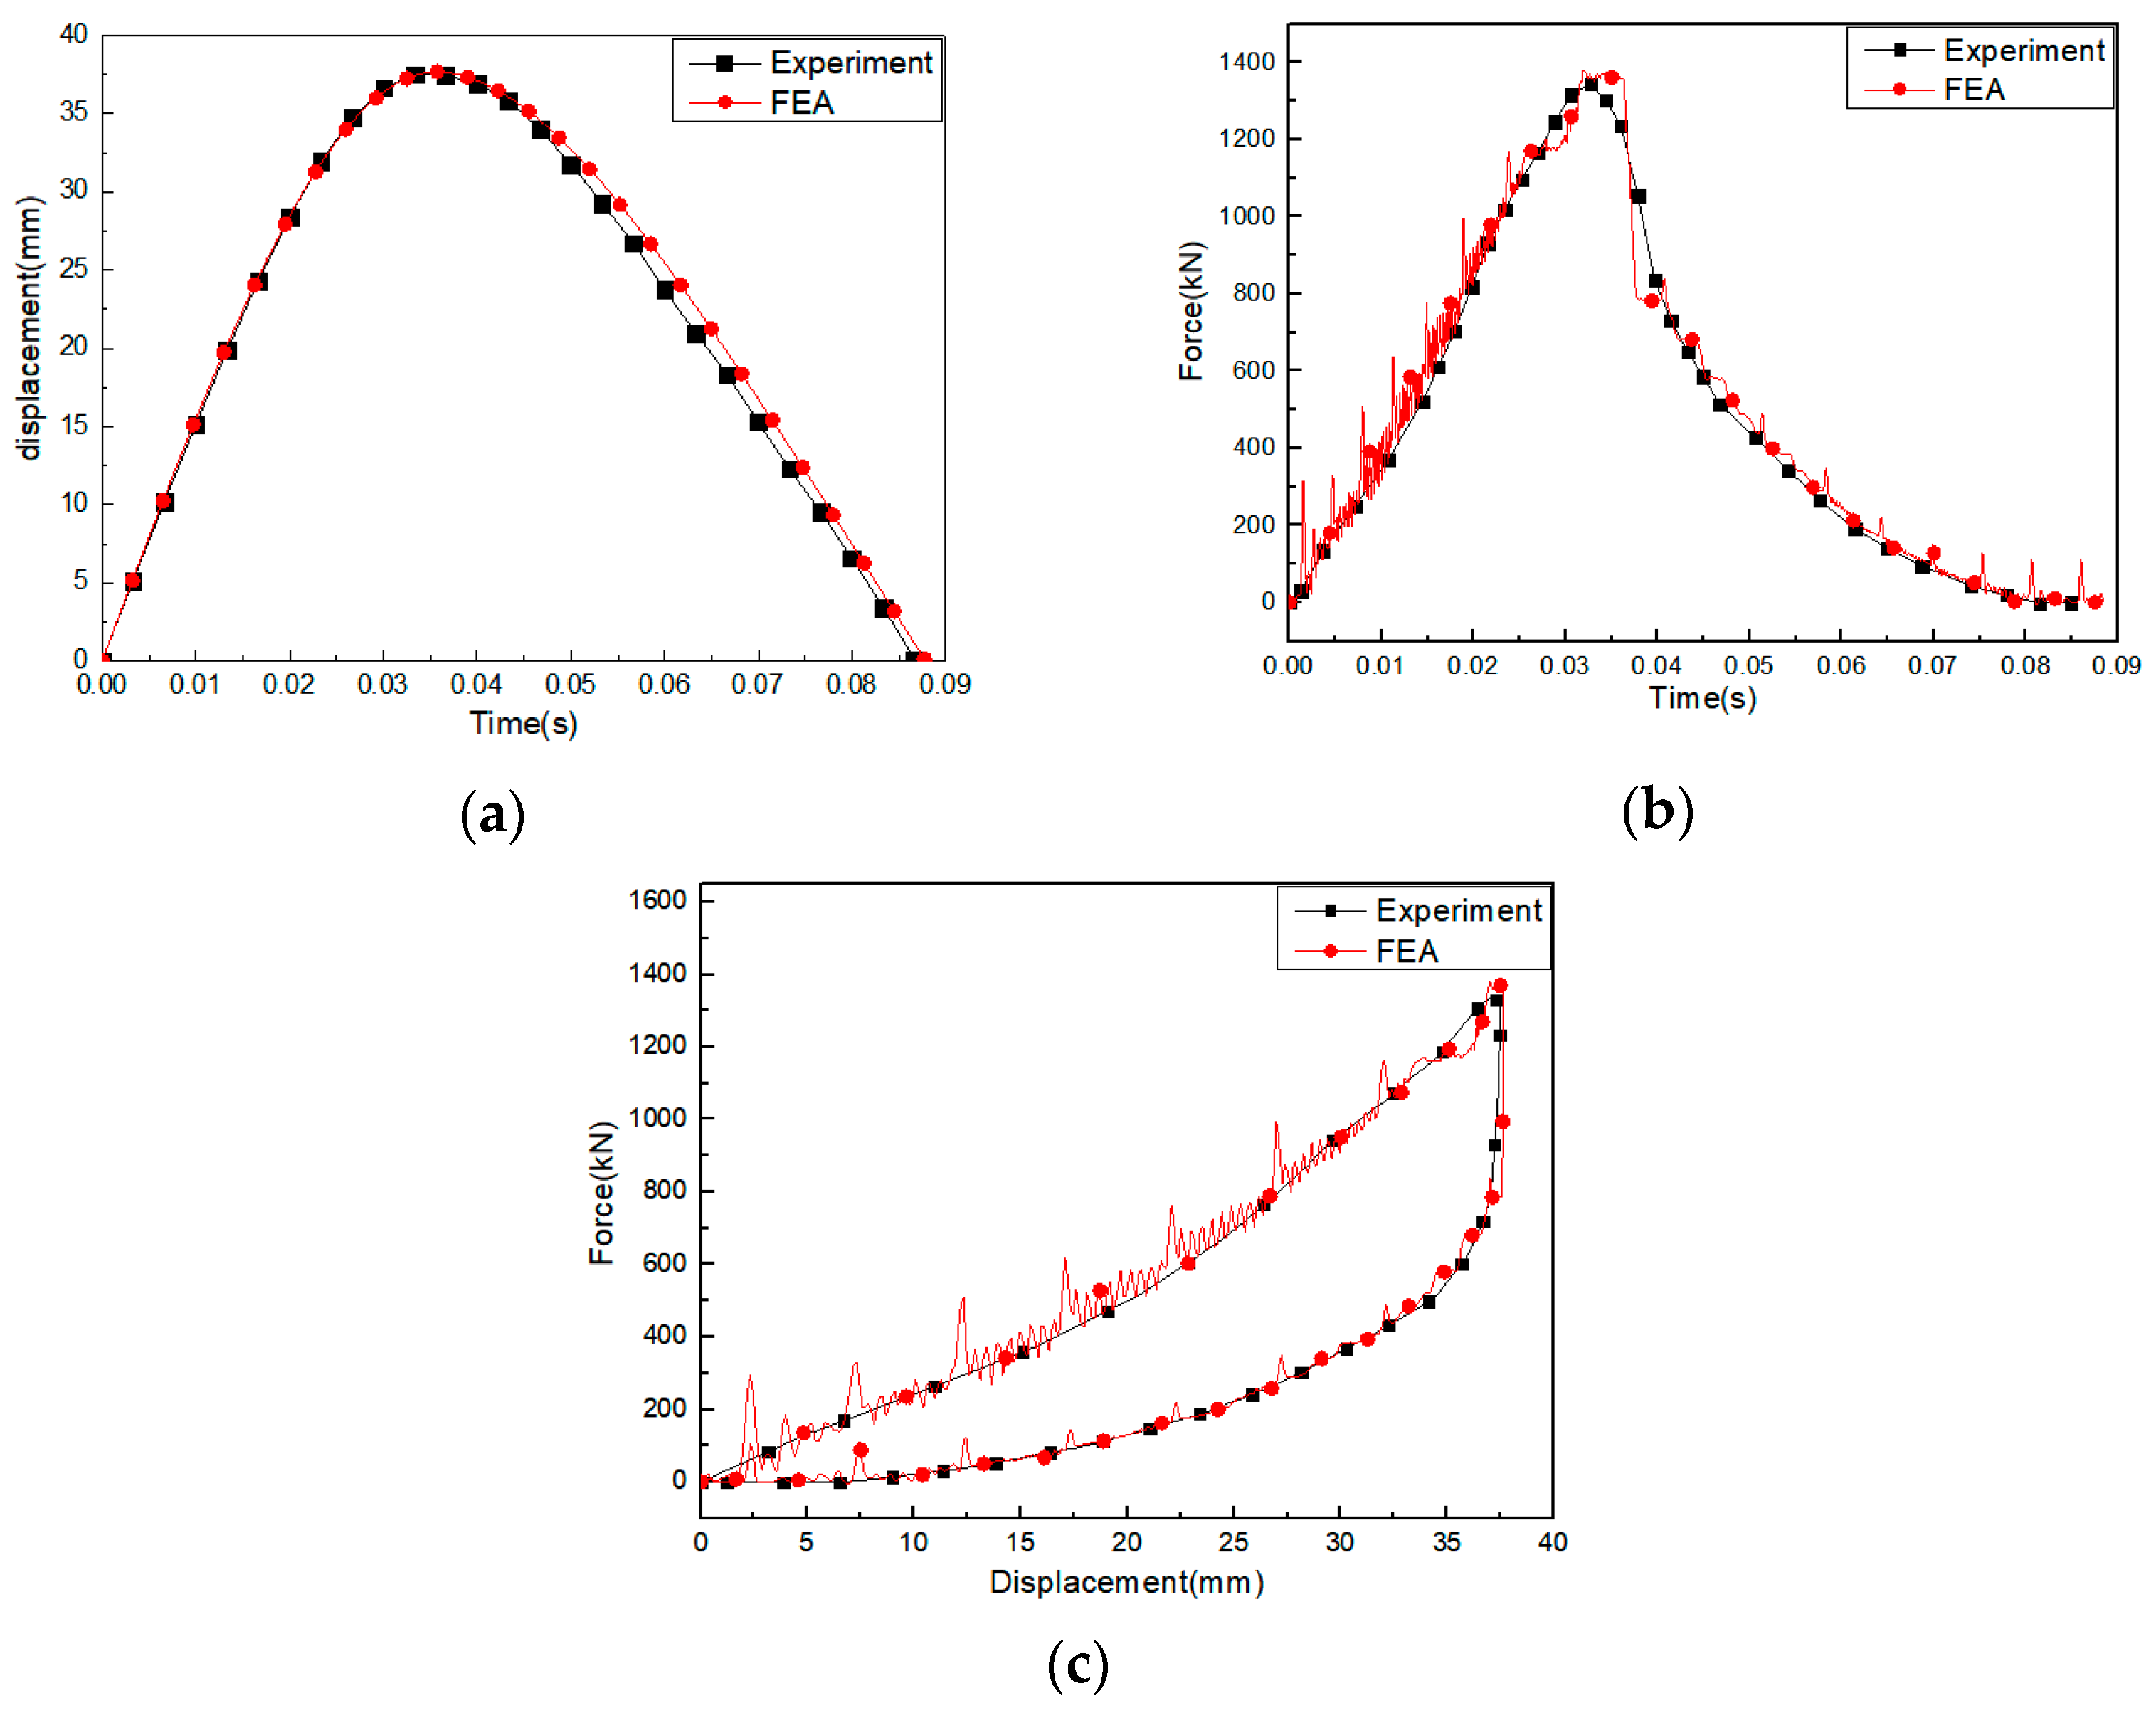
2.5. Validation of FE Model

In order to verify the validity of the model and correctness of the parameter settings, a dynamic collision test was carried out under the same conditions to obtain the dynamic mechanical properties of rubber ring buffer. The entire test system was mainly composed of a pneumatic launching device that provided a certain speed, force equalizing plate used for impact, 200 t load cell installed between the rigid wall and the equalizing plate to obtain the impact force, and speed measuring instrument that recorded the speed. The collision process of the device was captured by high-speed photography. The related equipment is shown in Figure 7. The high-speed camera shot at a high frame rate of 3000 frames per second, and the sampling frequency of the load cell was 500,000 Hz.
High-speed photography captures the collision and deformation modes of the rubber ring at different times. From the comparison between the finite element model and the actual collision diagram at different times in Figure 8, it can be seen that the compression and deformation modes of the rubber ring are basically the same.
The displacement–time curve obtained by high-speed photography and the force–time curve obtained by the force sensor were compared with the simulation results, as shown in Figure 9a,b. The beginning of the test is the time when the rubber buffer and the rigid wall began to contact. It can be seen from the figure that the force value of the rubber buffer gradually increased with the compression of the buffer. When the buffer was compressed to the limit state, a peak force formed; as the trolley rebounded, the final force value gradually returned to 0. In the experiment, the amount of compression of the rubber was obtained by taking high-speed photography to capture the points on the scale paper positioned with paste on the mounting plate, and the amount of displacement and compression was basically consistent with the simulation. The force–displacement curve was obtained by combining the force–time and displacement–time curves, as shown in Figure 9c. It can be seen from the figure that these curves are in good agreement. Table 2 shows the relative error between the experiment and simulation.
In summary, the force–displacement curves and structural deformation modes of the test and simulation output are in good agreement, and the relative error is within 10%, indicating that the simulation model is credible and can be used for subsequent parameter research and optimization.

3. Parametric Analysis

3.1. Structural Crashworthiness Criteria

Figure 9c is the force–displacement curve of a typical rubber buffer under an axial impact load. In order to evaluate the energy absorption of the rubber buffer under axial load, the energy absorption EA, maximum impact force Fmax, and specific energy absorption SEA were selected as the evaluation criteria. Among them, the energy absorption EA is an important criterion for judging the energy absorption capacity of energy absorbers. The formula is defined as:
E A = 0 x F ( x ) d x
where x is the effective compression displacement of the rubber, and F(x) is the instantaneous collision force that changes with the displacement. The specific energy absorption SEA is the energy absorption per unit mass of the energy absorbing structure, which is defined by the formula:
S E A = E A M
where M is the mass of the energy absorber. The greater the specific energy absorption SEA, the better the energy absorption effect of the energy absorber.

3.2. The Influence of the Height Parameter H on the Rubber Ring under Different Ratios of C01/C10

In order to study the effect of the height H of the rubber ring on the energy absorption and peak impact force of the rubber buffer under different ratios of C01/C10, keeping the outer contour radius of the rubber buffer unchanged, R = 55 mm and C10 = 5.2367 were set, and C01/C10 = 0.057, 0.157, 0.257, 0.357, 0.457, H = 70 mm, 80 mm, 90 mm, 100 mm, 110 mm, respectively. Under different C01/C10 ratios, the impact of different rubber ring heights on the mechanical properties of the buffer is shown in Figure 10. It can be seen from the figure that under the same C01/C10 ratio, as the rubber ring height H increased, the energy absorption of the buffer gradually increased first, when the height of the rubber ring reached 100 mm, the energy absorption dropped suddenly. The specific energy absorption gradually decreased with the increase of the rubber ring height and the peak force gradually decreased with the increase of the rubber ring height and gradually stabilized. Under different C01/C10 ratios, as the C01/C10 ratio increased, the energy absorption and specific energy absorption both showed a decreasing trend, while the peak force gradually increased with the increase of the ratio of C01/C10.

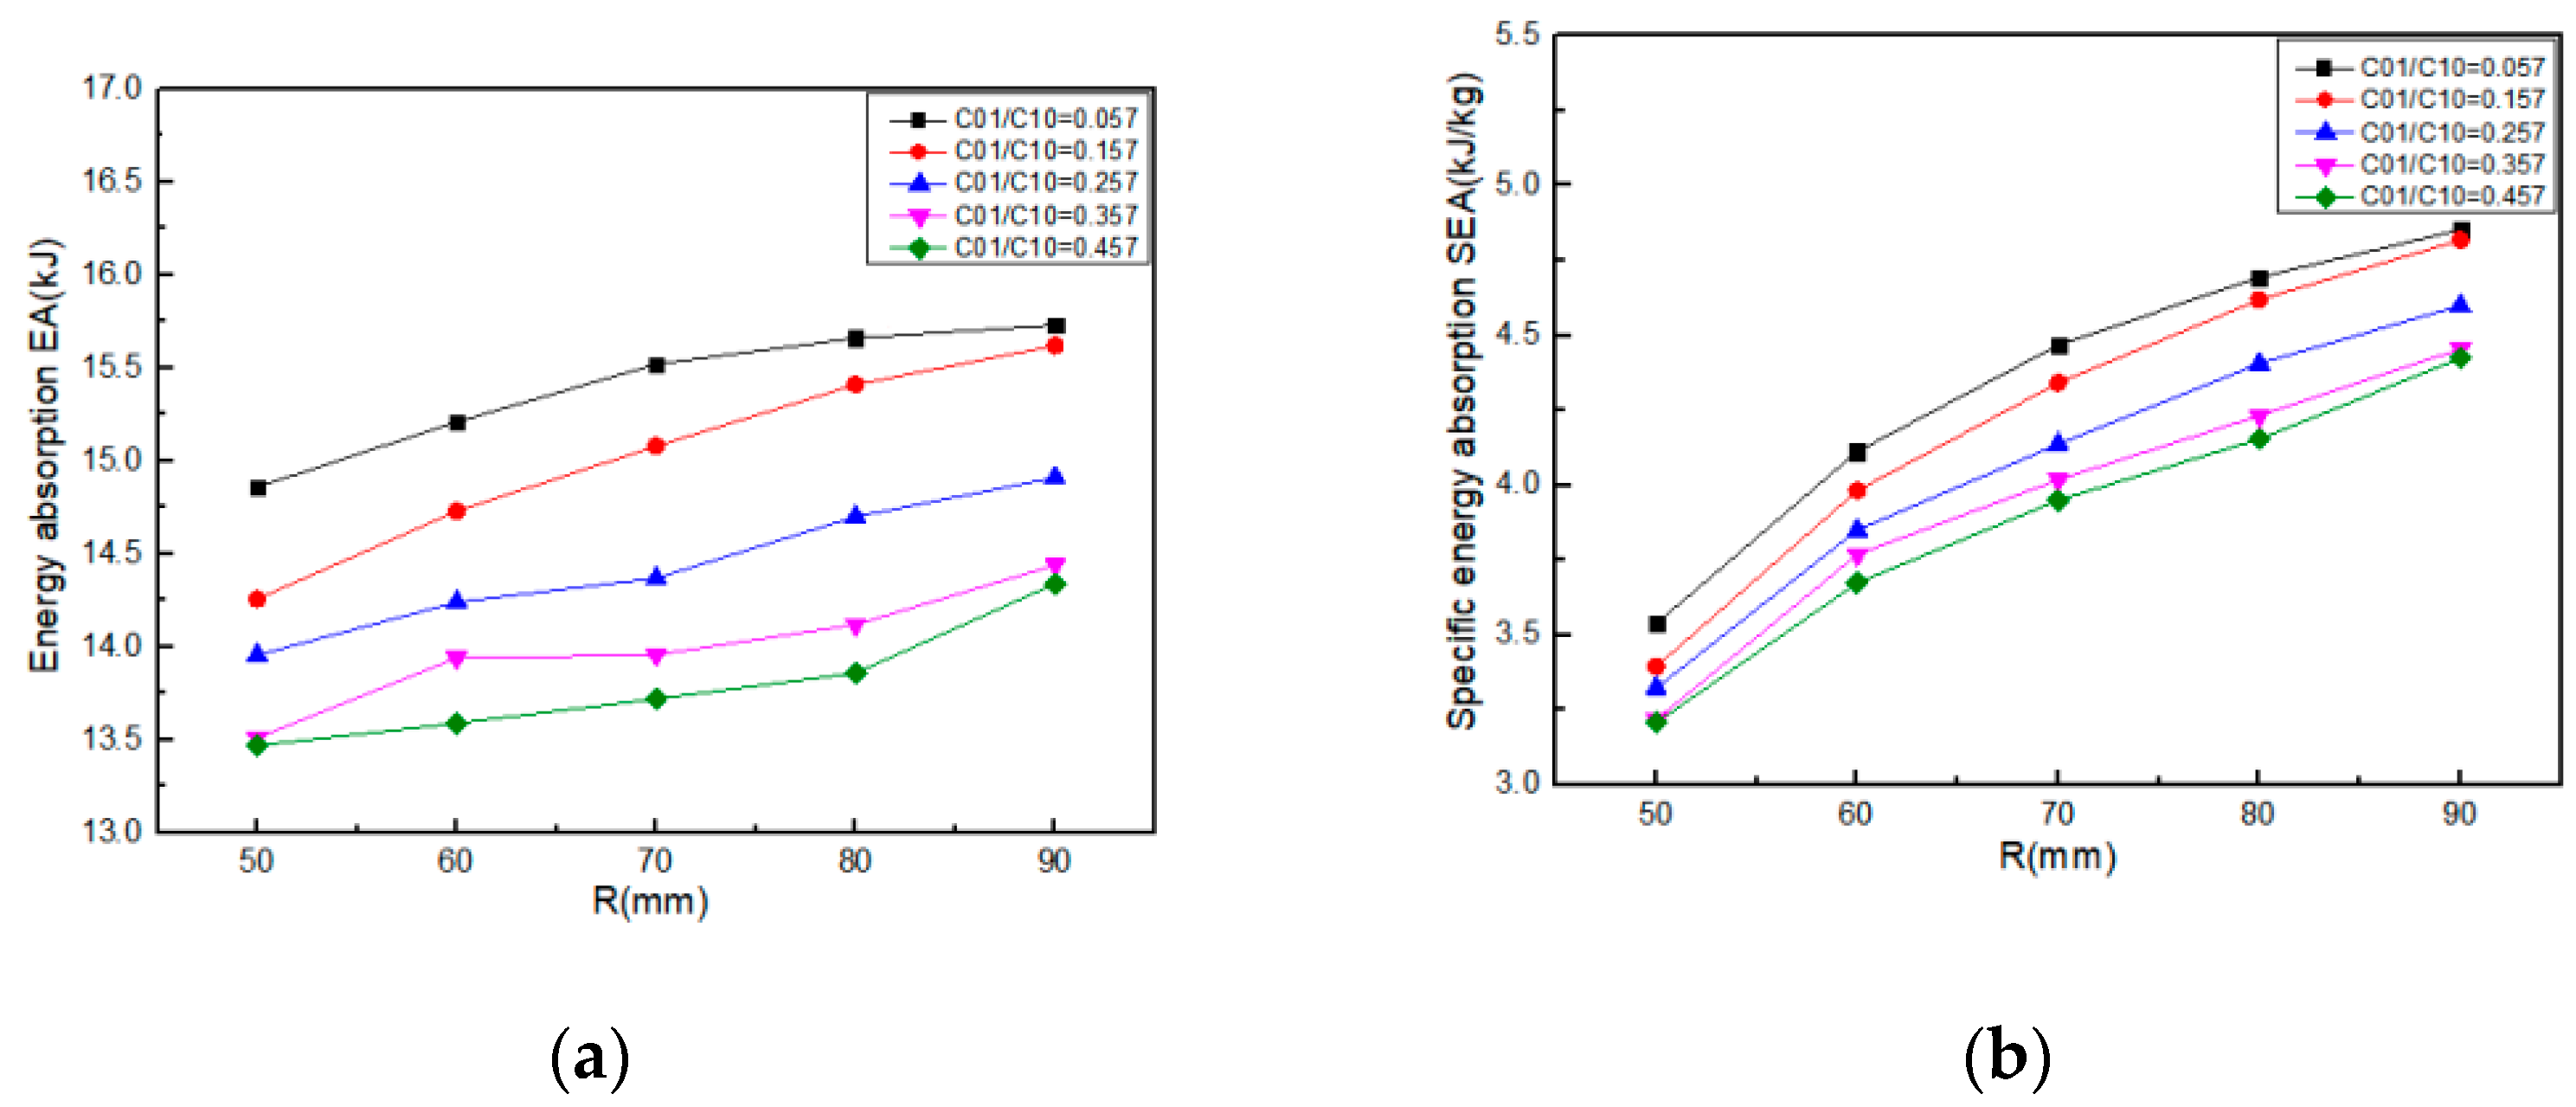
3.3. The Influence of the Outer Contour Parameter R of the Rubber Ring

In order to study the influence of the outer contour parameter R of the rubber ring on the energy absorption and peak impact force of the rubber buffer under different ratios of C01/C10, keeping the height of the rubber buffer unchanged, H = 90 mm, C10 = 5.2367 and C01/C10 = 0.057, 0.157, 0.257, 0.357, 0.457, R = 50 mm, 60 mm, 70 mm, 80 mm, 90 mm, respectively. Under different ratios of C01/C10, the effect of the outer contour radius R of different rubber rings on the mechanical properties of the buffer is shown in Figure 11. It can be seen from the figure that under the same ratio of C01/C10, as the outer contour radius R of the rubber ring increased, the energy absorption and specific energy absorption of the buffer gradually increased, and the peak force decreased slowly with the increase of the radius R of the outer contour of the rubber ring. Under different C01/C10 ratios, as the ratio of C01/C10 increased, the energy absorption and specific energy absorption gradually decreased, while the peak force gradually increased with the increase of the ratio of C01/C10.

4. Multi-Objective Optimization

4.1. Experimental Design

In order to optimize the mechanical properties of the rubber buffer and reduce the amount of calculation for simulation optimization, the response surface method was used here to optimize the design. In the construction of the response surface, the selection of test points is very important. Arbitrarily selected test points will lead to inaccurate response surfaces or even a failure to construct response surfaces. The theory of experimental design can help determine reasonable design points. The optimized Latin hypercube experimental design has the characteristics of high efficiency, good accuracy, and a uniform distribution, which can provide excellent test sample points for the response surface model. Therefore, this paper adopted the optimized Latin hypercube experimental design method to construct the response surface model. The optimized Latin hypercube test method was used to design 30 sets of experiments on the three variables of C01/C10 ratio, buffer height H, and buffer contour radius R. The C01/C10 ratio distribution interval was [0.057, 0.457], the buffer height H distribution interval was [70, 110], and the buffer contour radius R distribution interval was [50, 90], with C10 = 5.2367. The specific energy absorption SEA of the rubber buffer and the maximum peak force Fmax were used as the optimization goals, and the 30 sets of test samples obtained were calculated by the ABAQUS software to obtain the results of the optimization goals. The experimental design and results are shown in Table 3.
In order to analyze the influence of the design variables constitutive parameter C01/C10, rubber ring thickness H, and contour radius R on the buffer performance, the main effect results were analyzed. The main effects analysis only considers the influence of a single design variable on the response, and does not consider other design variables. The greater the absolute value of the main effect result, the greater the influence of the variable on the result of the response. Table 4 lists the impact analysis of the main effect results.
It can be seen from the table that the height of the rubber ring has the greatest influence on the main effect. The main effect of the height of the rubber ring on the specific energy absorption SEA is 3.62 and 1.95 times the constitutive parameters C01/C10 and the radius of the rubber ring contour, respectively. The main effect of H on the maximum peak force Fmax is 2.05 and 7.13 times the constitutive parameter C01/C10 and the radius R of the rubber ring, respectively. The main effect of the constitutive parameter C01/C10 on the maximum peak force Fmax is larger than the radius R of the rubber ring, while the influence of the radius R on the main effect of energy absorption SEA is larger than that of the constitutive parameters C01/C10.

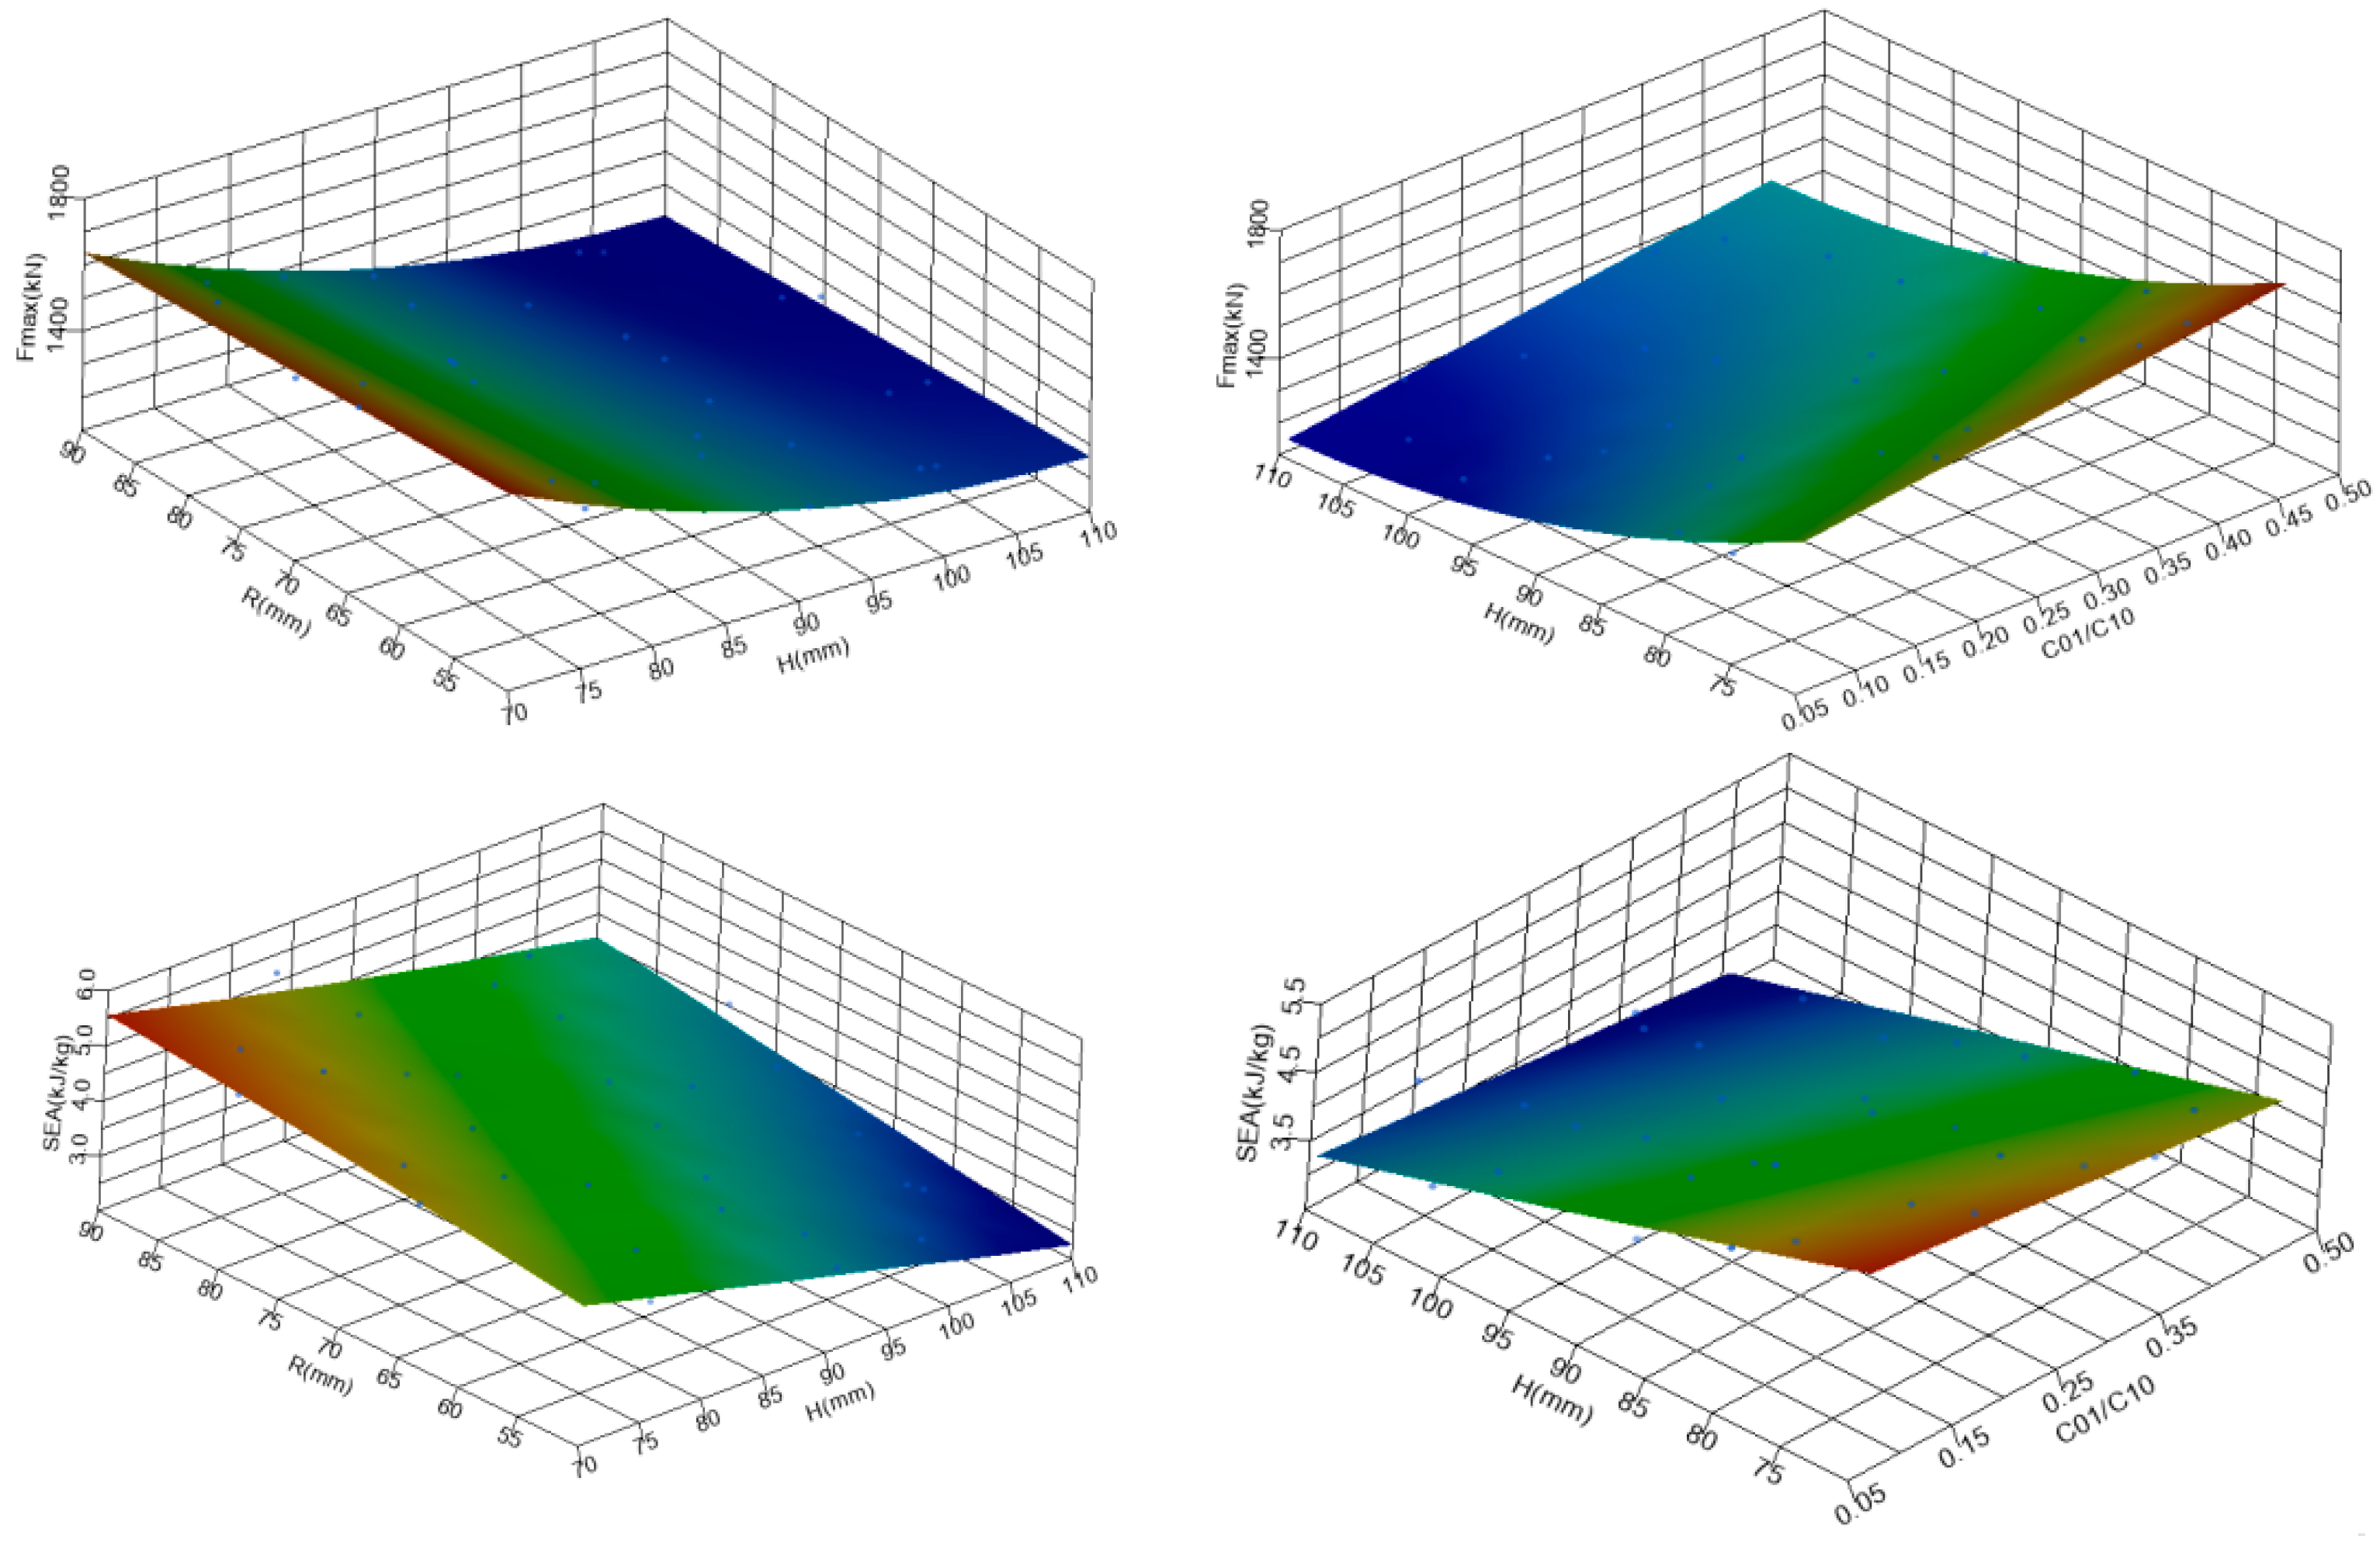
4.2. Surrogate Model

Based on the results of the optimized Latin hypercube test design, the response surface method was used to construct a response surface model of specific energy absorption and maximum peak force. Figure 12 shows the response surface model of specific energy absorption SEA and maximum peak force Fmax at different constitutive parameters C01/C10, rubber ring height H, and outer contour radius R. It can be seen from the figure that as the height H of the rubber ring increased, the peak force of the rubber ring and the specific energy absorption SEA both showed a decreasing trend. As the radius R of the outer contour of the rubber ring increased, the peak force of the rubber ring slowly decreased, while the specific energy absorption SEA gradually increased. As the ratio of the constitutive parameter C01/C10 of the rubber ring increased, the peak force of the rubber ring increased, and the specific energy absorption SEA showed a slow decreasing trend. The proxy model equations for the specific energy absorption and maximum peak force of the rubber ring are shown in (18) and (19). To simplify the equation, C01/C10 = L:
S E A = 73.228 6.428 L 3.372 H + 0.4339 R + 39.626 L 2 + 0.0555 H 2 0.00692 R 2 + 0.01473 LH 0.03298 LR + 0.00033 HR 112.842 L 3 0.000414 H 3 + 4.481 × 10 5 R 3 + 112.785 L 4 + 1.1568 × 10 6 H 4 8.9768 × 10 8 R 4
F m a x = 76,443.585 + 2874.934 L 2374.689 H 1206.435 R 19,819.206 L 2 + 38.973 H 2 + 26.198 R 2 + 4.1861 LH 0.8362 LR 0.08619 HR + 58,524.713 L 3 0.2847 H 3 0.2487 R 3 59,339.25 L 4 + 0.000779 H 4 + 0.000876 R 4
In order to evaluate the correctness of the proxy model, the relative error RE, root mean square error RMSE, maximum absolute error, and R2 value were used to evaluate the error between the proxy model and the numerical simulation calculation results [28]. The error expression is shown in (20)–(23):
R E = y ( x ) y ˜ ( x ) y ( x )
R M S E = i = 1 n ( y i y ˜ i ) 2 n
M A X = max | y i y ˜ i | , i = 1 , 2 , …… n
R 2 = 1 i = 1 n ( y i y ˜ i ) 2 i = 1 n ( y i y ¯ i ) 2
where n is the number of design sample points, and y ˜ ( x ) and y ( x ) are the calculated values of the surrogate model and the finite element model, respectively. When the value of MAX and RMSE is smaller or the value of R2 is larger, it indicates that the accuracy of the surrogate model is higher. The error analysis of the surrogate model is shown in Table 5. It can be seen from the table that the surrogate model has high accuracy, which lays the foundation for the next optimization design.

4.3. Optimization Method

The functional relationship between the specific energy absorption, maximum impact force, and ratio of the constitutive parameters C01/C10 of the rubber ring, the height H, and the outer contour radius R was constructed through the response surface model, in order to obtain a higher specific energy absorption and a lower peak value. It is necessary to optimize the proxy model to find the best rubber ring constitutive parameter C01/C10 ratio, height H, and outer contour radius R, and the boundary of specific energy absorption and the maximum peak force were determined by the test values. In this paper, the non-dominated sorting multi-objective genetic algorithm (NSGA-II) was used to solve the multi-objective optimization problem. The optimization objective function is:
{ Min { S E A , F m a x } 70 H 110 ; 50 R 90 ; 0.057 C 01 / C 10 0.457 S E A > 2.38 , F m a x < 1342.99
The multi-objective genetic algorithm was used to solve the optimal value of the surrogate model. First, the initial population was randomly generated and the objective function value and constraint function value of each point were calculated. Next, the population was sorted non-dominantly according to the objective function value, and constraint penalties, poor solution penalties, and total penalties were calculated for each point according to the constraint function value and grading result. Then, the crowding degree based on the total penalty for each point was calculated and selection, crossover and mutation operations, and population merging performed. Then, the constraint penalties, poor solution penalties, and total penalties of each point were calculated again according to the constraint function value and the classification result, and the crowding degree was calculated based on the total penalty of each point to generate a new group. The termination conditions were determined and the pareto optimal solution set and the corresponding objective function value were output in the candidate table. Finally, the most suitable problem solution from the pareto optimal set was selected. The flow chart of the multi-objective genetic algorithm is shown in Figure 13, and the specific parameters of the surrogate model used in this paper are shown in Table 6.

4.4. Optimization Results

In order to verify the correctness of the finite element model, this paper studied the minimum peak force and maximum specific energy absorption that the structure can achieve under certain constraints. According to the initial calculation results, SEA was set to be no less than 2.38 kJ/kg, and Fmax was no more than 1342.99 kN. Figure 14 shows the comparison of the experiment results and simulation results after parameter optimization and the Pareto-front solution for -SEA and Fmax. Table 7 shows the multi-objective optimization results, finite element calculation results, and comparative error analysis. The errors of SEA and maximum peak force Fmax were both below 10%, indicating that the optimization results have relatively high accuracy.
In summary, the general design process of rubber buffer is shown in Figure 15.

5. Conclusions

This paper studied the influence of relevant parameters of rubber ring buffer on its energy-absorption characteristics. The experimental design was carried out by using the optimized Latin hypercube experimental design method, and the response surface model was constructed to directly express the influence of rubber ring parameters on its mechanical properties. On the basis of the agent model, the non-dominated genetic algorithm NSGA-II was used to optimize the rubber ring quickly, which avoided the long calculation time and low optimization efficiency of the traditional finite element method. The SEA error and the maximum impact force error Fmax of the pareto-front front solution were both within 10%, which verifies the accuracy of the optimization and the effectiveness of the method. It shows that construction of the proxy model can help to search for optimization quickly and has certain reference value in engineering. The main findings of this study are summarized as follows:
(1)
On the premise that the contour radius (R) of the rubber ring is fixed, the SEA and the Fmax gradually decrease with the increase of the rubber ring height. The SEA also gradually decreases with the increase of C01/C10, while the Fmax gradually increases with the increase of C01/C10.
(2)
On the premise that the height (H) of the rubber ring is fixed, the SEA gradually increases with the increase of the contour radius, and the Fmax decreases slowly with the increase of the contour radius. However, the SEA gradually decreases with the increase of the C01/C10, while the Fmax gradually increases with the increase of the C01/C10. The rubber height (H) takes the main effect on both the specific energy absorption and the maximum peak force.
(3)
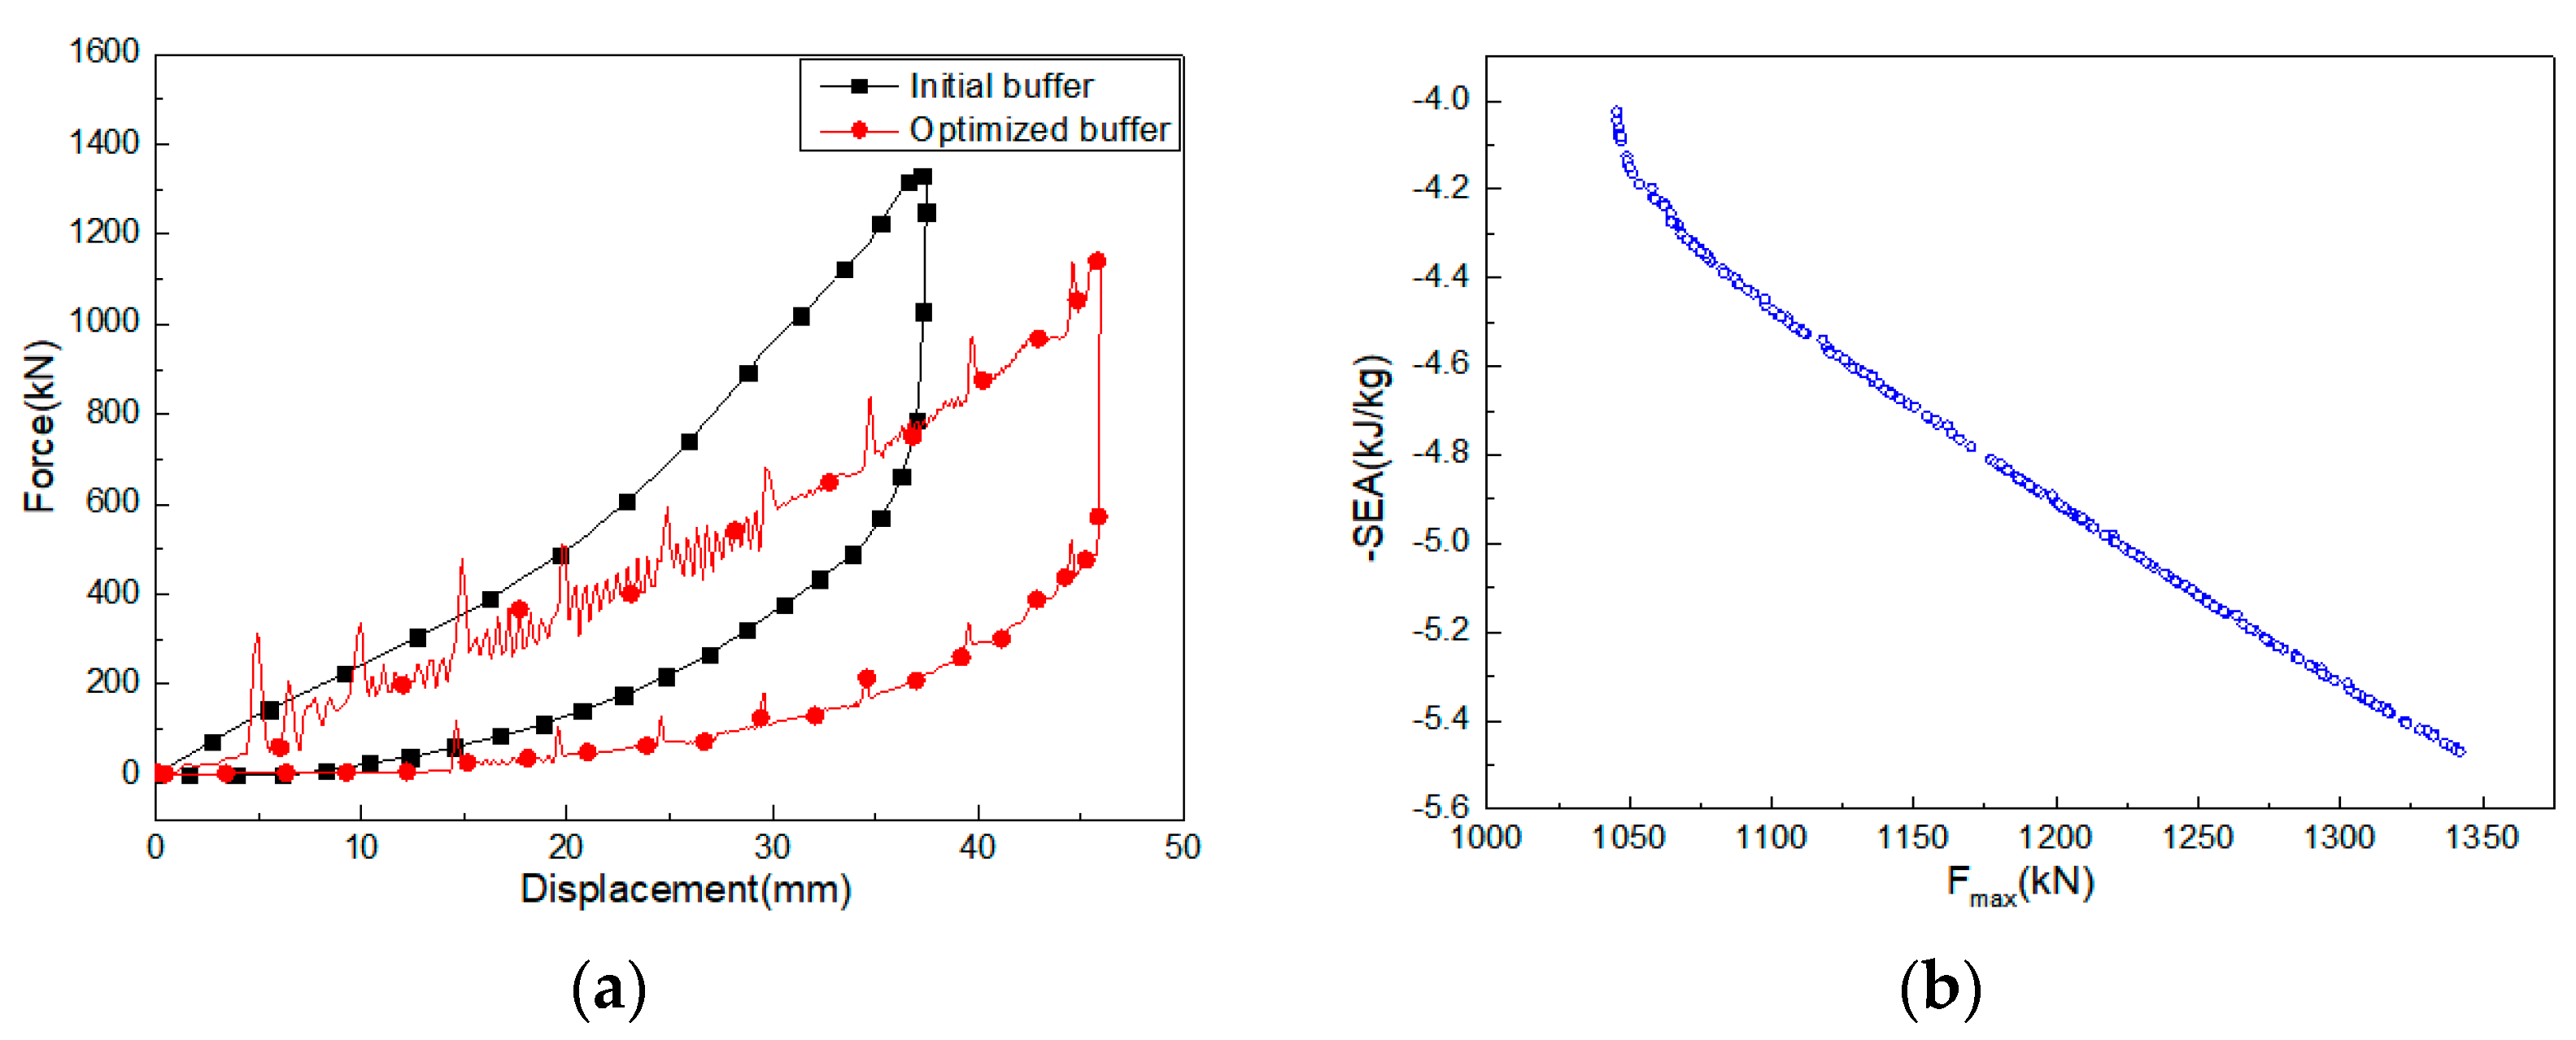
In order to maximize SEA and minimize Fmax, the response surface model was constructed and the non-dominated genetic algorithm NSGA-II was used to optimize the rubber ring quickly. The Pareto-front solution was obtained for the rubber ring buffer. When H = 107.57 mm, R = 85.70 mm, and C01/C10 = 0.0571, the energy absorption of the optimized buffer was increased by 59.03% and the peak force decreased by 14.37%, compared with the original structure.

Author Contributions

Conceptualization, C.Q. and P.X.; methodology, C.Q., P.X. and C.Y.; investigation, C.Q. and A.W.; resources, C.Q. and S.Y.; data curation, C.Q. and C.Y.; writing—original draft preparation, C.Q. and C.Y.; writing—review and editing, C.Q. and C.Y.; project administration, P.X.; funding acquisition, P.X. All authors have read and agreed to the published version of the manuscript.

Funding

This research was funded by the National Key Research and Development Program of China, grant number 2016YFB1200505-016, and the Scientific Research Foundation for Young Scholars of Central South University (No. 202044019).

Institutional Review Board Statement

Not applicable.

Informed Consent Statement

Not applicable.

Data Availability Statement

Not applicable.

Conflicts of Interest

The authors declare no conflict of interest.

Nomenclature

C01, C10Constitutive parameters of rubber materials
I1, I2, I3three invariants of deformation tensor of strain energy density function
λ1, λ2, λ3three principal elongation ratios of strain energy density function deformation tensor
Wstrain energy density function
σiprincipal stress of rubber material
Ppressure
Ɛprincipal strain
Φdiameter
Llength of guide column for rubber buffer
a, b, hlength, width and height of rubber buffer mounting plate
Hthickness
ddiameter of inner hole of rubber ring
Ddiameter of rubber circle outside rubber ring
Router contour radius of rubber ring
Fmaxmaximum peak force

References

  1. Lim, S.; Ji, Y.H.; Park, Y.I. Simulation of energy absorption performance of the couplers in urban railway vehicles during a heavy collision. Machines 2021, 9, 91. [Google Scholar] [CrossRef]
  2. Wu, J.; Liu, Q.; Wang, Y.S. Finite element simulation on tire rubber extrusion process. Adv. Mater. Res. 2013, 2337, 548–551. [Google Scholar] [CrossRef]
  3. Wang, Q.; Xiao, X.; Luo, R. Optimum design of wheeled loader’s steering rubber buffer seat based on ANSYS. Adv. Mater. Res. 2011, 1169, 1217–1222. [Google Scholar] [CrossRef]
  4. Zhang, Z.; Li, G.; Chu, G. Compressed stability analysis of the coupler and buffer system of heavy-haul locomotives. Veh. Syst. Dyn. 2015, 53, 833–855. [Google Scholar] [CrossRef]
  5. Shang, B.; Lu, H.; Shi, J. Finite element analysis of static elastic characteristics of the rubber isolators in automotive dynamic systems. SAE Trans. 2003, 112, 185–193. [Google Scholar]
  6. Peng, B.; Wang, N.; Yu, T. Influences of dimension parameters on the compression performance of FRP rubber bearings. Adv. Mater. Res. 2011, 1279, 977–981. [Google Scholar] [CrossRef]
  7. Pang, H.; Li, H.Y.; Fang, Z.D.; Zhu, X.Y. Finite element analysis of mechanical characteristics on the composite rubber suspension of heavy vehicle. Appl. Mech. Mater. 2012, 1498, 1702–1706. [Google Scholar] [CrossRef]
  8. Tao, X.; Wang, P.; Ma, X. Numerical mechanical analysis of filled rubber under different deformation states based on a new hyperelastic constitutive model. Mater. Sci. Forum. 2021, 6181, 15–22. [Google Scholar]
  9. Freakley, P.K.; Payne, A.R. Theory and Practice of Engineering with Rubber; Applied Science Publishers: London, UK, 1978. [Google Scholar]
  10. Zhang, L.; Wei, H. A novel structure of rubber ring for hydraulic buffer seal based on numerical simulation. Appl. Sci. 2021, 11, 87–102. [Google Scholar]
  11. Mariusz, S.; Dzialak, P.; Zedzianowski, B. Numerical and experimental analysis of the rubber bumper stiffness. Mater. Today Proc. 2019, 12, 508–513. [Google Scholar]
  12. Shi, S.X.; Yang, J.L. Large deformation of incompressible rubber cylinder under plane strain. Acta Mech. Solida Sin. 1999, 12, 348–355. [Google Scholar]
  13. Yildiz, F. The effect of different strain energy functions on rubber fender. J. Elastomers Plast. 2014, 46, 722–736. [Google Scholar] [CrossRef]
  14. Wang, S.W.; Wang, W.D.; Zhou, D.M. Rubber joint for fatigue crack factors numerical analysis of certain vehicle. Appl. Mech. Mater. 2011, 1326, 1505–1508. [Google Scholar] [CrossRef]
  15. Xue, X.; Robinson, M.; Schmid, F. Development issues for impact safety of rail vehicles: Robustness of crashworthy designs, effect of structural crashworthiness on passenger safety and behaviour characterisation of vehicle materials. J. Rail Rapid Transit 2018, 232, 461–470. [Google Scholar] [CrossRef] [Green Version]
  16. Afazov, S.; Denmark, W.; Yaghi, A. Modelling aspects of the design of railway vehicle structures and their crashworthiness. J. Rail Rapid Transit 2016, 230, 1575–1589. [Google Scholar] [CrossRef]
  17. Yang, L.; Kang, Y.; Luo, S. Assessment of the curving performance of heavy haul trains under braking conditions. J. Modern Trans. 2015, 23, 169–175. [Google Scholar] [CrossRef] [Green Version]
  18. Li, D.; Mao, Y.; Xu, K. A SHPB experimental study on dynamic mechanical property of high-damping rubber. Shock. Vib. 2018, 2018, 55–64. [Google Scholar] [CrossRef] [Green Version]
  19. Yao, G.; Li, X. Experimental investigation of the quasi-static and impact tests on the energy absorption characteristics of coupler rubber buffers used in railway vehicles. J. Rail Rapid Transit. 2019, 233, 937–950. [Google Scholar] [CrossRef]
  20. Zhang, W.; Zheng, F.; Liu, C. Energy absorption ratio of rubber material under dynamic impact load. Ordnance Mater. Sci. Eng. 2012, 35, 19. [Google Scholar]
  21. Chen, Y.; Zhang, B.; Zhang, N.; Zheng, M. A condensation method for the dynamic analysis of vertical vehicle–track interaction considering vehicle flexibility. J. Vib. Acoust. 2015, 13, 41010. [Google Scholar] [CrossRef]
  22. Cui, X.; He, Z.; Huang, B.; Chen, Y.; Du, Z.; Qi, W. Study on the effects of wheel-rail friction self-excited vibration and feedback vibration of corrugated irregularity on rail corrugation. Wear 2021, 477, 203854. [Google Scholar] [CrossRef]
  23. Chen, Y.; Zhang, B.; Chen, S. Model reduction technique tailored to the dynamic analysis of a beam structure under a moving load. Shock. Vib. 2014, 2014, 406093. [Google Scholar] [CrossRef]
  24. Mooney, M. A theory of large elastic deformation. J. Appl. Phys. 1940, 11, 582–592. [Google Scholar] [CrossRef]
  25. Yeoh, O.H. Some forms of the strain energy function for rubber. Rubber Chem. Technol. 1993, 66, 754–771. [Google Scholar] [CrossRef]
  26. Sussman, T.; Bathe, K.J. A finite element formulation for nonlinear incompressible elastic and inelastic analysis. Comput. Struct. 1987, 26, 357–409. [Google Scholar] [CrossRef] [Green Version]
  27. Reddy, M.V.; Reddy, M.C.; Reddy, P.V.; Vinod, S.R. Numerical analysis of rubber assisted sheet hydro-forming process and its experimental verification. Int. J. Mech. Prod. Eng. Res. Dev. 2018, 8, 591–600. [Google Scholar]
  28. Ebrahimi, S.; Vahdatazad, N. Multi-objective optimization and sensitivity analysis of honeycomb sandwich cylindrical columns under axial crushing loads. Thin Wall Struct. 2015, 88, 90–104. [Google Scholar] [CrossRef]
Figure 1. (a) Installation position diagram of the rubber ring buffer; (b) detailed drawing of the train coupler and rubber buffer.
Machines 09 00225 g001
Figure 2. Illustration of the rubber sample.
Machines 09 00225 g002
Figure 3. Illustration of the electronic tension and compression testing machine.
Machines 09 00225 g003
Figure 4. Compressive stress–strain curve of the rubber column.
Machines 09 00225 g004
Figure 5. (a) The main structure composition and size of the rubber ring buffer; (b) rubber ring size.
Machines 09 00225 g005
Figure 6. Finite element model.
Machines 09 00225 g006
Figure 7. Experimental scene: (a) trolley; (b) rigid wall and uniform slab; (c) speedmeter; (d) high-speed photography.
Machines 09 00225 g007
Figure 8. Comparison of the deformation process between the experimental and simulation results.
Machines 09 00225 g008
Figure 9. Experiment and simulation comparison: (a) Displacement–time curve; (b) force–time curve; (c) force–displacement curve.
Machines 09 00225 g009
Figure 10. Comparison of the same contour radius at different heights and different C01/C10 ratios: (a) Energy absorption; (b) Specific energy absorption; (c) Peak force.
Machines 09 00225 g010
Figure 11. Comparison of the same height, under different contour radii and different C01/C10 ratios: (a) Energy absorption; (b) specific energy absorption; (c) peak force.
Machines 09 00225 g011aMachines 09 00225 g011b
Figure 12. Response surface analysis diagram of SEA and Fmax.
Machines 09 00225 g012
Figure 13. Flow chart of the NSGA-II genetic algorithm.
Machines 09 00225 g013
Figure 14. (a) Comparison of the experiment results and simulation results after parameter optimization; (b) Pareto-front solution for -SEA and Fmax.
Machines 09 00225 g014
Figure 15. General design process of rubber buffer.
Machines 09 00225 g015
Table 1. Material parameters used in the simulation.
ParameterRubberSteel
Density/(t·mm3)1.3 × 10−97.85 × 10−9
Young’s modulus/(MPa)/2.1 × 105
Poisson’s ratio0.4990.3
C10/MPa5.2367/
C01/MPa0.2994/
Table 2. The relative error between the experiment and simulation.
Amount of
Compression (mm)
Peak
Force (kN)
Energy
Absorption (kJ)
Experiment Data37.521342.9913.23
Finite element analysis37.66138014.09
Relative error−0.37%2.76%6.5%
Table 3. Experimental design and numerical results.
Serial Number
Parameter
C01/C10H (mm)R (mm)SEA
(kJ/kg)
Fmax (kN)
10.154110.0078.973.50161170
20.12683.7990.005.12021370
30.25100.3452.762.84261300
40.31989.3158.283.74191380
50.098104.4856.902.96251170
60.40294.8369.313.61791380
70.416101.7284.483.38861310
80.11290.6950.003.44061370
90.33370.0063.794.89861750
100.38871.3880.344.99431710
110.223107.2465.172.85441190
120.30582.4172.074.32681480
130.45793.4555.523.23241410
140.08598.9770.693.82191170
150.18192.0762.413.64371320
160.42986.5581.723.93331410
170.05775.5277.595.35641420
180.1497.5985.864.17151180
190.3676.951.383.85861600
200.16785.1776.214.61881370
210.44379.6666.554.26851570
220.29187.9387.244.30141370
230.278103.188.623.93951210
240.374105.8659.662.63841350
250.23674.1483.15.29211560
260.20978.2854.144.385911450
270.07181.0361.034.601811360
280.19572.7667.934.91751560
290.26496.2174.833.70401320
300.347108.6273.453.05441300
Table 4. Analysis of main effect results.
SEA (kJ/kg)Fmax (kN)
C01/C10−0.588211.9
H−2.13−434.7
R1.09−61.0
Table 5. Error analysis of the surrogate model.
FunctionRMSEMAXR2RE (%)
SEA (kJ/kg)0.0780.150.94(−5.07, 3.51)
Fmax (kN)0.0730.130.93(−3.94, 5.35)
Table 6. NSGA-II algorithm tables and figures.
ParameterValue
Population size (multiples of 4)20
Number of generations50
Crossover probability0.9
Crossover distribution index10
Mutation distribution index20
Maximum number of failed runs5
Table 7. Optimization results of minimizing Fmax with the SEA constraint.
Design VariablesNSGA-IIFEA ResultAccuracy
SEA (kJ/kg)Fmax (kN)SEA (kJ/kg)Fmax (kN)RESEA (%)REFmax (%)
H = 107.57 mm
R = 85.70 m
C01/C10 = 0.0571
4.021045.573.7811506.35−9.08
Publisher’s Note: MDPI stays neutral with regard to jurisdictional claims in published maps and institutional affiliations.

