Article

Design and Testing of a 3-DOF Robot for Studying the Human Response to Vibration

1
Dipartimento di Meccanica, Politecnico di Milano, via Previati 1/C, 23900 Lecco, Italy
2
School of Industrial and Information Engineering, Politecnico di Milano, Via Raffaele Lambruschini, 15, 20156 Milano, Italy
3
Dipartimento di Ingegneria Industriale e dell’Informazione, Università di Pavia, Via ferrata 5, 27100 Pavia, Italy
*
Author to whom correspondence should be addressed.
Machines 2019, 7(4), 67; https://doi.org/10.3390/machines7040067
Submission received: 22 August 2019 / Revised: 24 October 2019 / Accepted: 26 October 2019 / Published: 30 October 2019

Abstract

:
This work describes the design and validation of an electro-mechanical excitation system for characterization of the response of the human body to multiaxial vibrations. The presented system is based on the linear delta configuration and is designed to expose standing subjects to vibration along three perpendicular axes, with an excitation bandwidth of at least 30 Hz and a maximum vibration amplitude of ±30 mm along the vertical direction and ±20 mm along the horizontal directions. The shaker characteristic dimensions are the result of numerical optimization of the inverse manipulability index; the motors and transmissions have been selected using a multibody dynamic simulation. Finite element simulations were performed to ensure that the structural resonances were outside the excitation bandwidth. Once the shaker had been manufactured, experiments were performed to verify the capability of the system in real testing conditions. The mean quadratic error between the modulus of the imposed acceleration and the measured one is between 5.7 × 10⁻³ and 1.4 × 10⁻² m/s2 in the frequency range between 1 and 50 Hz, proving the good outcome of the design process.

1. Introduction

1.1. Effects of Vibrations on the Human Body

Whole-body vibration (WBV) is the term used to describe the situation when the vibration is affecting the body as a whole and is transmitted to the human body by the surface supporting it [1]. WBV is a widespread and serious occupational hazard in many fields, for example, in truck, crane, tractor, lorry, and fork-lift drivers, as well as pilots, who are exposed to significant rates of WBV [1,2]. It has been suggested that prolonged exposure to WBV can cause fatigue failures at the endplates of the lumbar vertebrae [3], in addition to low back pain [4,5].
Other studies have focused on the positive effects that WBV can have on physical training, with mixed results, as shown in the review of the state of the art conducted by Nordlund et al. [6]. In fact, the authors state that the positive results obtained by training in a WBV condition are comparative to those of control groups, which do not do any training at all. Out of the 12 articles analyzed, only five compared the results obtained with the same protocol, except for WBV, and out of them, only one highlighted a positive effect of training under WBV. It is relevant to say that the actual acceleration signal imposed is often neither measured nor controlled, and the nominal parameters and settings of the machines are held as true. This may play an important role in the mixed results reported. Orsini et al. [7,8] have shown how the acceleration measured on the surface of the platform can be extremely different from the nominal signal that is supposed to be generated.
Experimental studies have been conducted in controlled and reproducible conditions, in order to observe the mechanical behavior of the human body under WBV conditions and to develop mathematical models representing specific aspects of the body’s response [9,10,11,12,13,14,15,16,17,18]. Tarabini et al. [12] investigated the effect of body posture on the apparent mass distribution of standing subjects, applying the vibration with an electrodynamic shaker. Mansfield et al. [9] investigated the effect of the magnitude of vibration: seated human subjects were excited through random vertical vibrations [0.2–20 Hz] of six different magnitudes ranging from 0.25 to 2.5 m/s2 Root Mean Square (RMS), generated by an electrohydraulic vibrator. Several papers have focused on the effect of the vibration direction on the response of the human body. For example, Paddan et al. [11] investigated the effect of floor vibration along three axes (vertical, fore- and aft-, and horizontal) on standing subjects; however, the vibration along the different directions was not provided simultaneously. Tarabini et al. [19] described a system for the measurement of the mass matrix of a standing human subject when simultaneously excited with vertical and horizontal vibration. The system able to provide multi-axial acceleration consists of two single-axis electrodynamic shakers (one for the vertical and one for the horizontal direction) connected to compliant plates, which allow movement in one horizontal direction, while being rigid in the vertical and along the other horizontal direction. Subashi et al. [20] proposed a lumped parameter model of the human body that could mimic the response of the standing human body when exposed to only vertical WBV; however, the effect of the cross talk between the axis is so relevant that the authors had to include horizontal and rotational degrees of freedom to model it. Therefore, it is possible to state that an excitation of the human body along one axis also generates relevant effects along the other two axes. Moreover, to the best of the authors’ knowledge, there are no studies in which the effect of simultaneous three-axial vibration on the standing human body has been investigated. Therefore, the purpose of this paper is to propose a machine able to generate simultaneous translational vibration along the three mutually perpendicular spatial axes, which can be used to generate the signal required to improve the measurement of the human response to vibration.

1.2. Linear Delta Robot Selection

The parallel manipulator is the geometry of the mechanism that was selected, as in the literature, it is highlighted that parallel manipulators have features that better match the requirement for this application, when compared to serial manipulators [21,22]. In fact, they offer a high mechanical stiffness, precise positioning, and a high load capacity. Their main downside when compared to the serial manipulator is their lower working volume; however, since the objective of the machine is the generation of vibrations, this is not a critical issue. Given that three degrees of freedom are necessary, we selected the delta robot as the actuator configuration [23]. Other configurations have been proposed [24]; however, their poor workspace volume to size ratio is a major disadvantage. Among the different configurations, the linear delta with vertical linear actuators has been chosen for the development, since it can provide larger displacement along its main direction and it has been proven that it is more suited for applications requiring stiffness [25].

1.3. Functional Requirements

The functional requirements guided the design of the shaker presented in this work. Firstly, the shaker must be capable of simultaneously providing vibrations with a maximum frequency of at least 20 Hz in the three mutually perpendicular axes. The desired working volume is a cube with a size of ±20 mm along the two horizontal directions and ±30 mm along the vertical direction. The vibrating platform with a person on it should also be able to reach the acceleration of 5 m/s2 along the three axes. Finally, the maximum weight carried by the shaker is defined as 200 kg, which corresponds to the apparent mass in the vertical direction of a standing subject weighing 100 kg subjected to vertical vibrations at the resonance frequency of 5–6 Hz [14].
The structure of this paper is as follows: Section 2 describes the design of the shaker, the modeling of its structure through the Finite Element Method (FEM), and the experimental setup used to validate the model and evaluate the performance of the shaker; Section 3 compares the results obtained from the FEM model and experimental tests, and shows the performance of the shaker; and Section 4 discusses the results obtained in the previous section, draws the conclusion, and presents possible future developments.

2. Materials and Methods

2.1. Design of the Delta Shaker

This section describes the optimization process employed for the selection of the defining dimensions of the kinematic scheme of linear delta, as Figure 1 shows. Then, the motor and transmission selection procedure is detailed.

2.1.1. Kinematic Optimization

The objective of the optimization process is to compute the defining dimensions of the delta robot, in particular, the radius of the base, i.e., the modulus of the vector si, and the length of the links, i.e., the modulus of the vector li. The radius of the platform, i.e., the modulus of the vector bi, was set to 250 mm, given the fact that is must be wide enough to support a standing person.
The parameter to be optimized is the inverse of the conditioning number, i.e., the ratio between the smallest and the largest singular value of the Jacobian matrix. This is a real number that becomes 0 when the position of the end effector is close to a singularity, and 1 when the end effector is working in an isotropic condition. Equation (1) shows the Jacobian matrix of the vertical linear delta robot:
J = [ P x + D L 2 [ ( P x + D ) 2 + ( P y ) 2 ] P y L 2 [ ( P x + D ) 2 + ( P y ) 2 ] 1 P x D 2 L 2 [ ( P x D 2 ) 2 + ( P y + 3 · D 2 ) 2 ] P y + 3 · D 2 L 2 [ ( P x D 2 ) 2 + ( P y + 3 · D 2 ) 2 ] 1 P x D 2 L 2 [ ( P x D 2 ) 2 + ( P y 3 · D 2 ) 2 ] P y 3 · D 2 L 2 [ ( P x D 2 ) 2 + ( P y 3 · D 2 ) 2 ] 1 ] ,
where Pj is the component of the position vector of the center of the moving platform along the j direction and D is the difference between the radius of the base and the radius of the moving platform. Appendix A includes all the analytical steps necessary to obtain such an equation.
The numerical optimization process consisted of creating a set of values for the parameters to be optimized, as shown in Table 1.
As it is possible to see in Equation (1), the Jacobian matrix depends on the position of the end effector inside the x-y plane. Therefore, each combination of the two dimensions has been associated with the minimum and maximum conditioning number inside the desired working volume. The parameter to be maximized is the minimum inverse conditioning number inside the working volume, given that the maximum must not be lower than 0.90 and the minimum must not be lower than 0.55. A dedicated script written in the MATLAB environment (MathWorks®, 1 Apple Hill Drive, Natick, MA, USA) has been used to process all the computations.

2.1.2. Actuator Selection

After the optimization process, the motors and transmissions of the delta robots were selected. Given the need for a high stiffness, no backlash, and precise actuation, a direct coupling of electric brushless motors and ball screws was chosen for further development. To estimate the forces and moments required, the model of the delta robot was created in the multibody dynamic simulation software Adams (MSC Software, 4675 MacArthur Court, Newport Beach, CA, USA). Only the moving parts were taken into account, and their geometry has been simplified.
The ball screws’ guides were modeled with a vertical translation joint, while the effects of the joints at the ends of the links were modeled as a revolute joint. The mass applied to the platform was 20 kg, to which 200 kg was added to model the payload. The working cycle of the end effector was modeled as the sum of sinusoids with random phase, along the three mutually orthogonal space directions. The frequencies included in the signal were between 0.5 and 30 Hz, with the step of 0.5 Hz. The amplitude of each component was set as 10 m/s2 divided by the number of components and the signal along the vertical axis was increased by 50%. The signal duration was 2 s. Given the random components, 25 different signals were created to explore the different possibilities.
The method followed to select a range of motors and actuators knowing the expected forces was the α-β method, as explained in [26]. The ball screws were selected among the catalogue of Rollon S.p.A. and the brushless motors were selected from the catalogue of Omron Electronics S.p.A.
The final selection was then based on the combination of the motor and ball screws that could provide the highest acceleration to the platform when only moving along the vertical direction. Equation (2) explains how to compute the vertical acceleration, starting from the energy balance, under the hypothesis that during the vertical movement, the three motors equally share the load:
A = 2 π · T m a x p · M · g p ( J s · ( 2 π p ) 2 + M ) ,
where Tmax is the maximum torque that the motor can provide, p is the pitch of the ball screw, Js is the total inertia of the rotating parts, g is the acceleration of gravity, and M is the total translating mass divided by three. The inertia of the rotating part is the sum of the inertia of the motor; the screw, which is modeled as a cylinder; and the inertia of the joint between the two. The joint that was selected is the model smartflex® 1/932.333 manufactured by Mayr, which has a mass moment of inertia of 1.04 × 10⁻⁴ kg·m2. The total translating mass is the sum of the mass of the payload and the mass of the translating parts of the shaker, which was set to 32 kg, plus the mass of the translating part of the screw.
Among all the combinations tested, the minimum dimensions that meet the requirements are 420 mm for the base of the platform of and 215 mm for the length of the link of. In this configuration, the maximum and minimum value of the inverse of the conditioning number inside the working volume are 0.91 and 0.55, respectively.
Table 2 shows the maximum forces and moments at the joints, computed through the multibody dynamic simulation.
According to the α-β method, multiple couples of brushless motors and ball screws were able to perform the task required. However, the couple that could provide the maximum acceleration along the vertical direction was the servomotor L3K030C-400V coupled with the ball screw TV-110-32-32.

2.1.3. FEM Modal Analysis

After the computation of the defining sizes of the Delta Robot kinematic and the actuator selection, the components of the Delta Robot were drawn in the CAD environment Solid Edge ST9 (Siemens PLM Software, Plano, TX, USA), as Figure 2 shows. The geometry of the parts of the delta shaker was simplified and imported into Abaqus FEA (Dassault Systèmes, Vélizy-Villacoublay, France) to proceed with the modal analysis through FEM.
Aluminum was assigned as the material (ρ = 2.71 × 10³ kg/m3, E = 69 GPa, ν = 0.33) of all the parts, except the base, for which steel was assigned (ρ = 7.86 × 10³ kg/m3, E = 210 GPa, ν = 0.33). The effect of the bearings was modeled using the coupling and tie interaction property. For each bearing, the outer surface of the rotating ring and the inner surface of the hole were coupled with a separate reference point at the center. The two reference points were then constrained to only rotate along the desired direction. Following this, the two surfaces were tied together to avoid interpenetration.
The compliance of the sliders of the ball screws was modeled through linear springs, applied to the four vertices of each slider, with a stiffness of 5500 N/mm. Moreover, only rotation along the vertical axis of the sliders was allowed.
The fixation to the ground of the shaker is based on the adjustable leveling components. The properties of the rubber base were modeled through the definition of a new material, whose type is hyperelastic. The Yeoh model describes the material’s behavior. Since no information about the type of rubber used by the producer was available, reasonable values for a common natural rubber were used. Shear constants and compressibility constants are those reported in [27] for this type of rubber, and are reported in Table 3. The bottom surface of the rubber feet was constrained so that it was fixed.
The first two modes of the moving parts are the rotation of the platform along the two horizontal axes, and happen at a frequency of 33 Hz. The third mode is the vibration of the platform along the vertical axis, which happens at a frequency of 40 Hz. The fourth mode is the deformation of the platform, which happens at a frequency of 124 Hz.

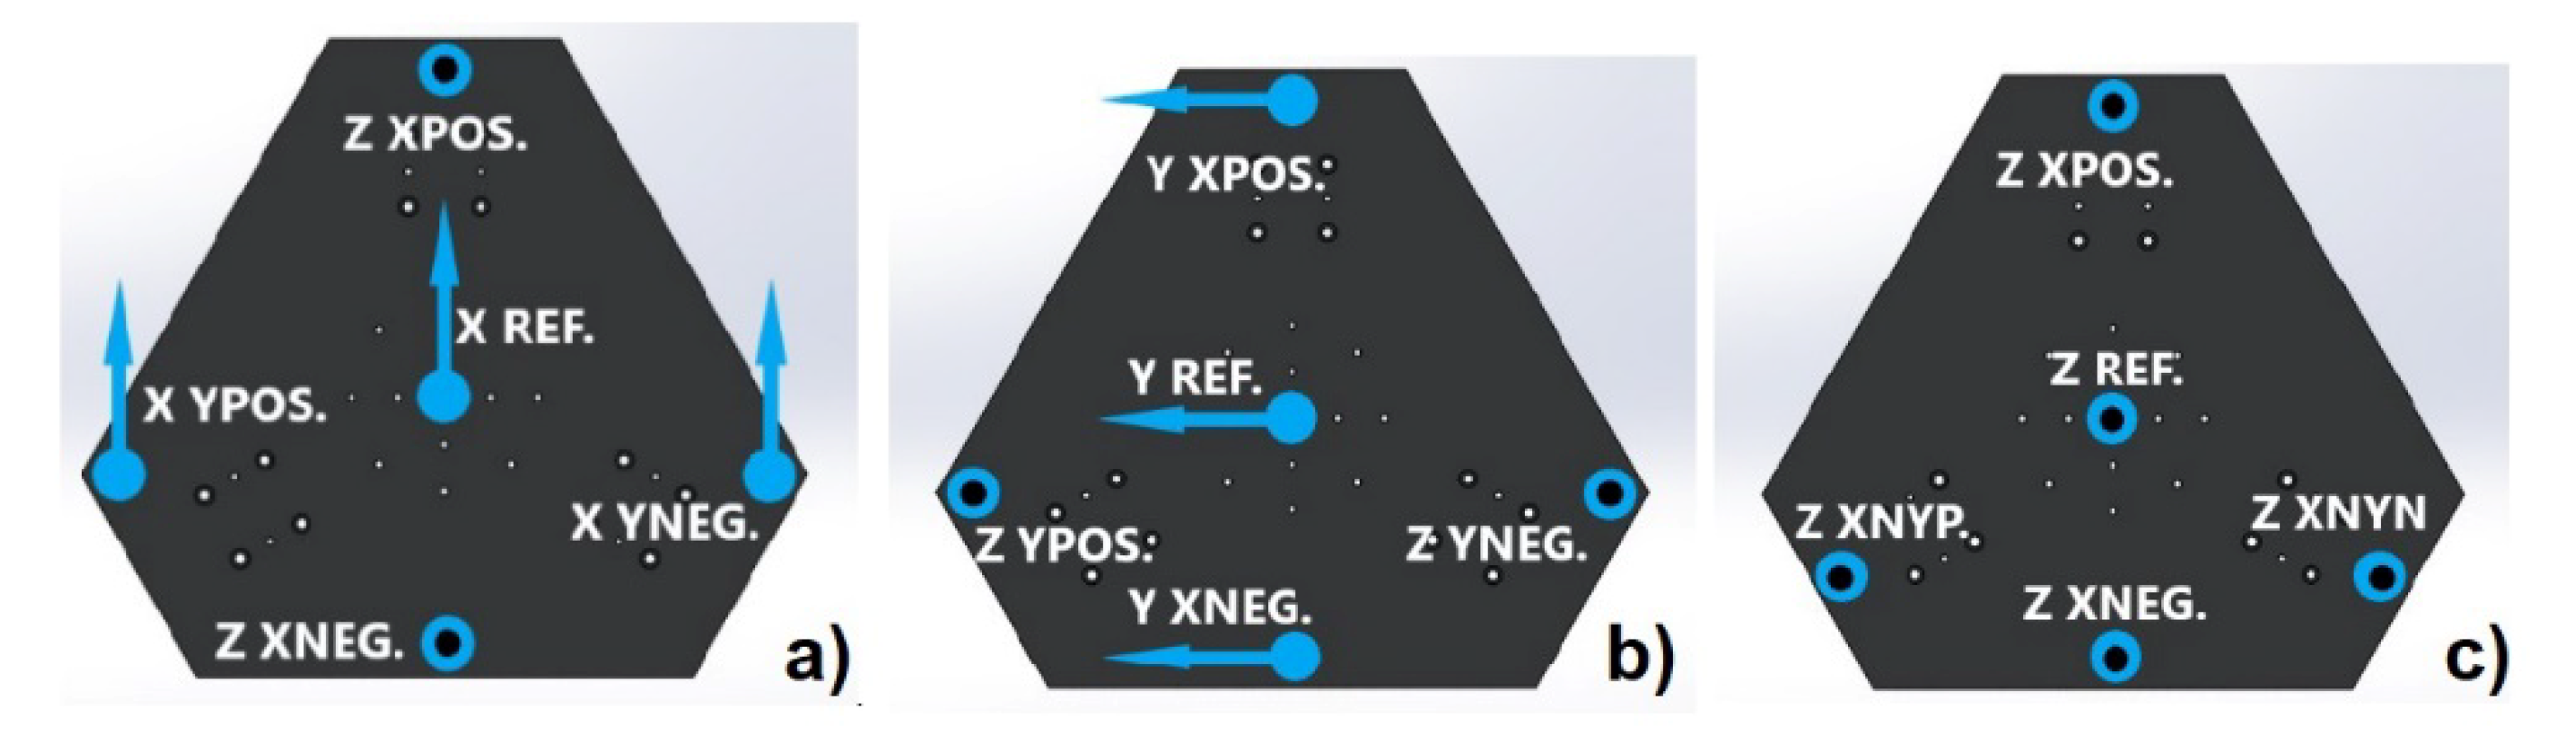
2.1.4. Experimental Modal Analysis

An experimental modal analysis was performed to validate the model created through the FEM. The structure of the shaker was excited through the dynamometric hammer 086C02 (PCB Piezotronics, Inc. 3425 Walden Avenue, Depew, NY, USA). Given the high mass of the shaker and the interest in the resonances at a low frequency, an additional mass and a plastic tip were used. The signals were acquired through four single-axis piezoelectric accelerometers 4508B (PCB Piezotronics, Inc. 3425 Walden Avenue, Depew, NY, USA), with a nominal sensitivity of 100 mV/g, and one three-axes piezoelectric accelerometer 356A22 (PCB Piezotronics, Inc. 3425 Walden Avenue, Depew, NY, USA), with a nominal sensitivity of 100 mV/g. According to the modal shape of interest, the position and direction of the accelerometers and the impact were changed in different configurations, as it will be shown in the next chapter, to improve the clarity of the article. The locations of the impact were identified with a red star, while the locations of the accelerometers were identified with a red circle. Vectors were used to identify the sensing direction of the accelerometers and the hit directions. If no vectors are visible, the direction is the vertical one. For each configuration, 10 impact tests with an acquisition time of at least 5 s each were performed. The signals were sampled at 2048 Hz with two NI 9234 acquisition boards. Both cards were connected to the NI cDAQ9174 (National Instruments Corporation, 11500 N MoPac Expwy, Austin, TX, USA). The data were collected and analyzed through Labview-based software on a PC. For each configuration, the average H1 estimator of the different impacts was computed, together with the coherence. Experimental results and FEM analyses were compared using, as a figure of merit, the percentage error between the corresponding resonance frequencies and the Modal Assurance Criterion (MAC) [28], as was done in [29].

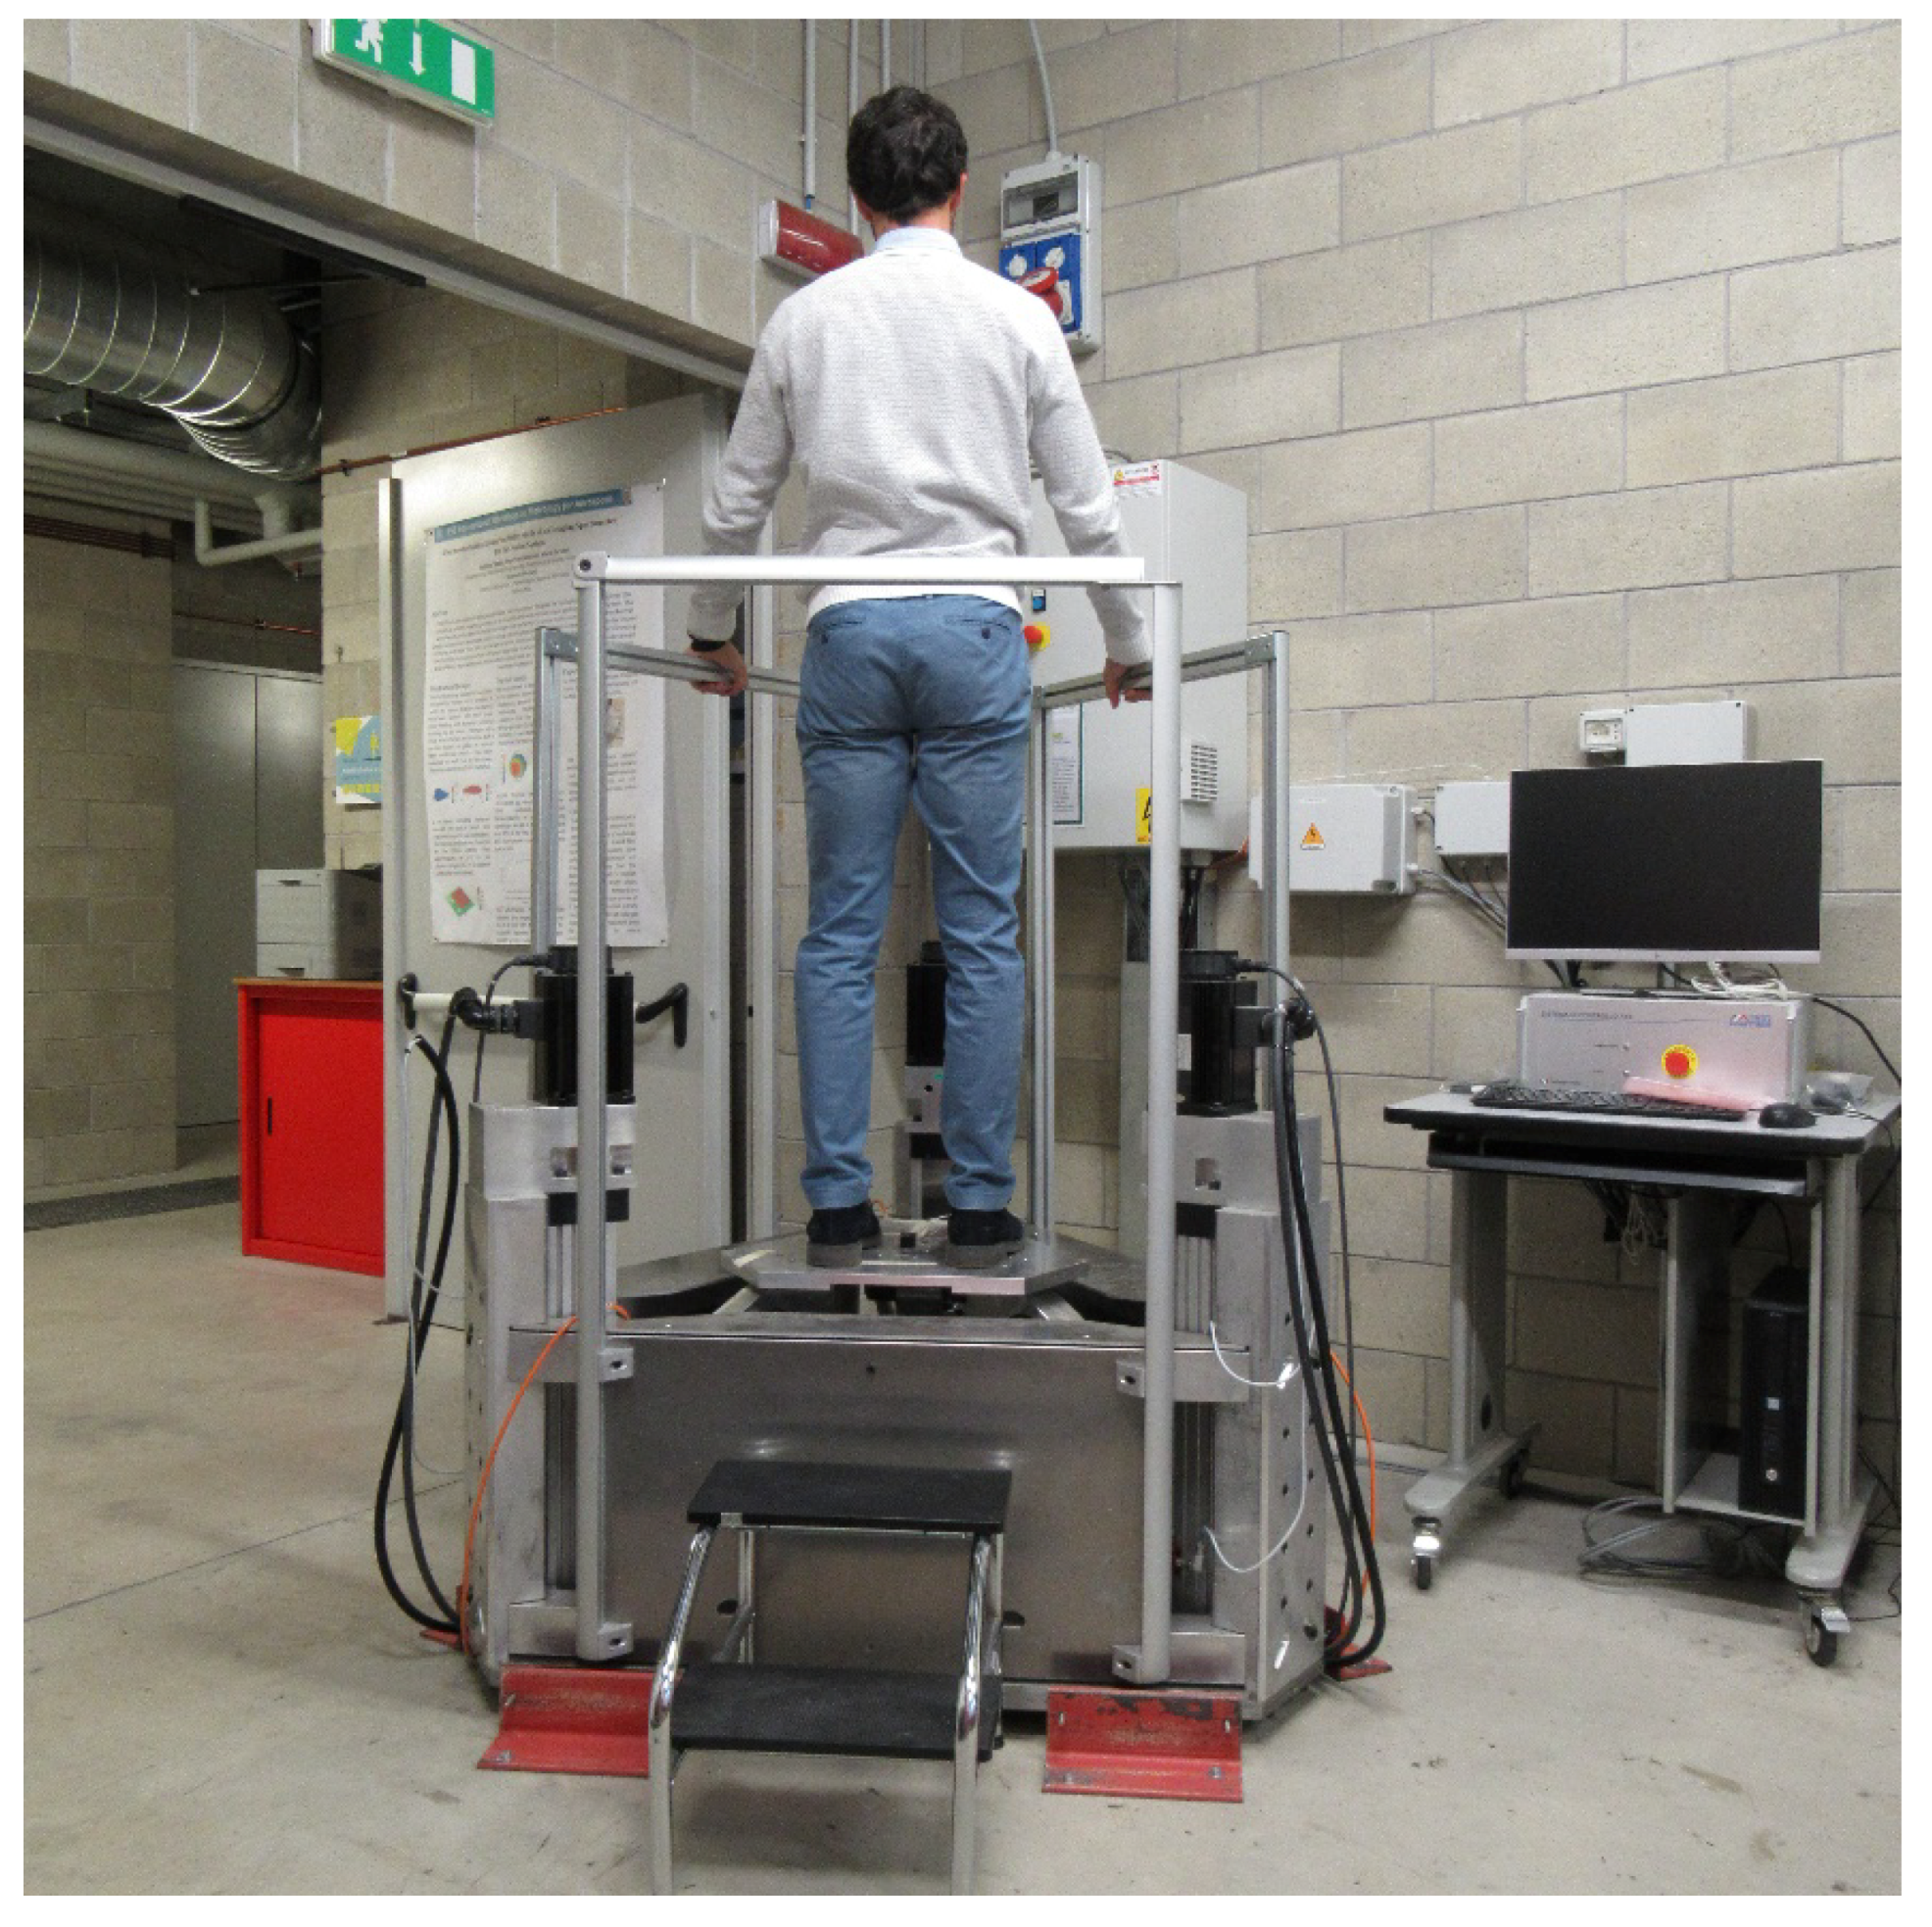
2.2. Performance Tests

This section explains the tests aimed at evaluating the performances reached by the moving platform. Two tests were conducted to verify the quality of the generated signal. First, to evaluate the undesired rotation of the platform, the shaker was moved in the three directions separately, imposing a sinusoidal signal with an amplitude of 1 m/s2. The frequencies tested were from 5 to 20 Hz, with a step of 5 Hz. For each frequency, the acquisition time was 10 s and the acquisition frequency was 2048 Hz. The signals were acquired through six single-axis piezoelectric accelerometers 4508B (PCB Piezotronics, Inc. 3425 Walden Avenue, Depew, NY, USA), which were connected to two NI 9234 acquisition boards. Both cards were connected to the NI cDAQ9174 (National Instruments Corporation, 11500 N MoPac Expwy, Austin, TX, USA). The data were collected and analyzed through Labview-based software on a PC. The position of the accelerometers on the platform was changed for each direction of motion, as shown in Figure 3. Figure 3a shows the setup for the test conducted along the X direction. Three accelerometers were oriented to measure along the X direction: one at the center of the platform, one on the left side, and one on the right side, with the latter two representing the positive and negative side of the Y axis, respectively. Two accelerometers were oriented to measure along the vertical direction, on the top and bottom of the moving platform, i.e., along the positive and negative side of the X axis, respectively. Figure 3b shows the position and the orientation of the accelerometers during the tests along the Y direction. The setup is equivalent to the one previously explained, but rotated by 90° along the vertical axes. Figure 3c shows the setup for the tests executed to evaluate the performance along the vertical direction. For this test, all the accelerometers were rotated to measure along the vertical direction. One accelerometer was placed at the center of the platform, three accelerometers were placed at each short side of the moving platform, and the last accelerometer was placed on the long side of the moving platform at the negative side of the X axis. The RMS value of the signal acquired by the different accelerometers was then compared.
Then, pseudo-random noise was simultaneously imposed along the three directions, with and without a person standing on the platform (weight of 62 kg, height of 172 cm, and age of 27 years), as is shown in Figure 4. The signal was created by summing sine waves in the frequency range between 1 and 50 Hz, with a step of 1/120 Hz. The RMS of the signal was set to 1 m/s2. Moreover, the actual signal imposed on the moving platform was modified to compensate for the frequency response function of the shaker, thanks to a specific feature of the control system. The total duration of the test was 120 s. The acceleration of the end effector was measured as was explained for the previous test, but using only one three-axis piezoelectric accelerometer 356A22, placed at the center of the platform. The measured acceleration was divided into 120 segments with a duration of 1 s, and the average modulus of all the segments, multiplied by the Hanning window, was computed. The moduli of the resulting signals were compared with a ±3 dB tolerance band applied to the reference signal. Moreover, the mean quadratic error between the moduli of the actual signals and the reference signal was computed in the frequency band of interest (i.e., 1–50 Hz). To characterize the background noise, the root mean squared values of the components higher than 50 Hz were computed.
Given that the objective of the machine is to provide mechanical vibration to test humans, attention was given to the safety of the subjects. A two-step ladder helped the subject to reach the vibrating platform. The risk of falling while on top of the vibrating platform was limited by the installation of handrails decoupled from the shaker structure (Figure 2). Two emergency stop buttons were installed, as per EU machinery regulations.

3. Results

3.1. Experimental Modal Analysis

Figure 5 shows the first vibration mode of the platform was the pitch around the horizontal axis, and it was computed to occur at the frequency of 33 Hz. The experimental modal analysis evidenced a peak in the modulus of the Frequency Response Function at 65 Hz. At this frequency, the response of accelerometer 2 is close to 0, accelerometers 0 and 3 move in phase, and accelerometer 1 moves in counter phase. The MAC computed for this mode was 0.97. The second vibration mode was the rotation of the vibrating plate along the vertical axis (41 Hz according to the FEM model, and 43 Hz in the experimental modal analysis). The MAC computed for this mode was 0.99. The third mode was the bending of the platform. The natural frequency was 126 Hz according to the FEM model and 110 Hz according to the experimental modal analysis. The MAC computed for this mode was 0.88.

3.2. Measured Performances

The shaker performances were evaluated by imposing the vibration along each single axis and evaluating the vibration along the perpendicular ones. Figure 6 shows the signal acquired at the center of the platform when imposing a 15 Hz sinusoidal wave along the X direction, in both the time and frequency domain. As it is possible to see, the signal is distorted by the multiple harmonics, and the most relevant one is the 3X; as later discussed, this limits the usage of the shaker to random and pseudo-random excitations. When the vibration was imposed along the X direction, the RMS of the accelerometers sensing the vibration along the X direction differed from the reference value, at most, by 18%, evidencing a partial rotation of the platform. The same parameter decreased to 6% when tests were performed along the Y direction and to 23% when excitation was provided along the vertical direction. The results evidence that the plate, because of the limited stiffness of the structure, rotates while translating; given the limited rotational impedance of the standing human body, this limitation is not critical.
Figure 7 shows the average modulus of the spectrum of the acceleration of the moving platform, along the three directions, when simultaneously imposing pseudo-random noise along the three directions, with frequency components between 1 and 50 Hz. The modulus is included in the tolerance gap of ±3 dB in all the frequencies tested. Table 4 shows the mean quadratic errors of the moduli of the acceleration signals measured on the moving platform. The error is generally lower than 10 mm/s2, except in the Y direction when a person is standing on the platform. Table 5 shows the RMS value of the components with a frequency higher than the maximum imposed value, as a measure of the background noise. All the values are lower than 10−2 m/s2, and the noise is higher along the Z direction both with and without load.

4. Discussion

The experimental results highlight that the shaker can be successfully used to test the response of standing subjects to multiaxial vibration. There are four main limitations of the proposed excitation system. The main one is the presence of mechanical resonances near the band of frequencies in which the shaker has to operate. These resonances do not compromise the performance of the machine when the stimulus is stochastic, given that closed-loop control is able to compensate for the non-unitary frequency response function evidenced by the modal analysis.
The second limitation is related to the presence of rotations of the plate along the axis perpendicular to the axes of actuation. The rotation implies that the vibration on the plate is not uniform, when imposing sinusoidal motion along a single axis. The tests conducted using sinusoidal signals also show that the signal is heavily distorted by multiple harmonics. The origin of this distortion is still under analysis and might be related to either structural resonances or the control algorithm of the shaker. The same tests, however, also show that the transmission system is not affected by backlash, as during the direction change, the acceleration signal does not show a transient response typical of this phenomenon.
The third limitation is related to the larger mechanical noise with respect to commercially available single axis shakers. The results showed that, when imposing pseudo-random noise with an RMS of 1 m/s2 between 1 and 50 Hz along the vertical direction, the RMS of the acceleration along the two other axes was 0.17 m/s2. When the same signal was imposed on a commercial single-axis shaker (model LDS V830), the RMS of the acceleration along the X and Y axes was 0.07 and 0.05 m/s2, respectively. This drawback is explained by the fact that the proposed machine is designed to simultaneously work along the three axes.
The results of the EMA validate the FEM model, with discrepancies in the first natural frequency compatible with the simplifications of the FEM model, which will be used to study possible improvements of the machine. The first improvement will be the stiffening of the rails of the ball screws, as the modeling of the rails as clamps instead of springs increased the first natural frequency by about 36%. A parallel outcome of the larger rail stiffness would be an improvement of the signal quality derived from the lower platform pitch. The performances of the delta shaker can also be improved by reducing the mass of the moving parts. The FEM model evidenced that an optimization of the design of the suspended parts and the adoption of composite materials would increase the first natural frequency by an additional 22%.
Within the limitations previously explained, the shaker offers several advantages with respect to commercial products and other setups proposed in the literature for measuring the complete apparent mass matrix of standing subjects. Moreover, when only considering the vertical axis, this machine is capable of a maximum stroke of 200 mm; the commercial shakers with similar peak forces have a maximum stroke of ±25 mm. With respect to the setup proposed by Tarabini et al. [19], this machine can excite all three axes simultaneously and over a wider range of frequency, namely over 1–50 Hz, in respect to 2–20 Hz. At the moment, the machine is lacking a system to evaluate the reaction force exerted by the person subjected to the vibration on the moving platform, which will form the focus of forthcoming works.

5. Conclusions

This paper presents the first linear delta robot with vertical actuators specifically designed to be able to generate simultaneous vibrations along the three mutually perpendicular spatial axes for identification of the human response to vibrations. The robot is based on the linear delta kinematic, and has been optimized to maximize the excitation bandwidth and the inverse of the conditioning number. Preliminary tests conducted with a person standing on the moving platform of the shaker showed a maximum mean quadratic error of 14 mm/s2 when imposing pseudo-random noise with an RMS value of 1 m/s2 and a flat spectrum in the frequency range of 1–50 Hz, along the three axes simultaneously. Given these results, within the limitations explained in the previous section, the machine presented here is capable of meeting the design requirements, and is able to generate the signal necessary for measuring the full apparent mass matrix of standing subjects.

Author Contributions

Conceptualization, H.G., P.M., and E.N.; methodology, H.G.; software, E.N. and A.A.; validation, P.M. and A.A.; formal analysis, P.M., E.N., and A.A.; investigation, P.M. and A.A.; resources, M.T. and H.G.; data curation, P.M. and A.A.; writing—original draft preparation, P.M.; writing—review and editing, M.T.; visualization, P.M.; supervision, M.T. and H.G.; project administration, M.T.; funding acquisition, M.T.

Funding

This research was funded by Regione Lombardia within the project “PORFESR 2014–2020: ‘Smart Fashion and Design’”.

Acknowledgments

The authors acknowledge the Lombardy region for the financial support within the program POR FESR 2014–2020-Bando Smart Fashion and design.

Conflicts of Interest

The authors declare no conflict of interest.

Appendix A

The point and vectors used to describe the kinematic of the delta robot, which are shown in Figure 1, are defined as follows:
  • Reference coordinate system: Oxyz;
  • Unit vectors of the reference coordinate system Oxyz: ( x ^ o y ^ o z ^ o ) ;
  • Reference system integral with the moving platform: TCPxyz. Due to the linear delta kinematic constraints, this reference system is always parallel to Oxyz;
  • Unit vectors of the moving platform coordinate system TCPxyz: ( x ^ T C P y ^ T C P z ^ T C P ) ;
  • Position vector of TCPxyz: p;
  • Components of p along the reference coordinates system Oxyz:
    { p x p y p z } ;
  • Linear actuator and joint index: i;
  • Distance between Oxyz and the projection of the linear actuators along the plane defined by ( x ^ o y ^ o ) : s;
  • Position vector of the projection of the ith linear actuator along the plane ( x ^ o y ^ o ) : si. Given the radial symmetry of the linear delta, its components are
    { s   cos ( 2 π 3 ( i 1 ) ) s   sin ( 2 π 3 ( i 1 ) ) 0 } ;
  • Distance between TCPxyz and the joints attached to the platform: b;
  • Position vector of the ith joint attached to the platform in the reference system TCPxyz: bi. As stated before, its components can be immediately computed:
    { b   cos ( 2 π 3 ( i 1 ) ) b   sin ( 2 π 3 ( i 1 ) ) 0 } ;
  • Vector of the distance between the position of the ith linear actuator end and its projection along the plane ( x ^ o y ^ o ) : qi. Its components are defined as
    { 0 0 q i } ;
  • Length of the linear delta links: l;
  • Vector connecting the joint of the ith linear actuator to the ith joint of the moving platform: li;
  • Unit vector of li: v ^ i ; Vector connecting the projection of the ith linear actuator on the plane ( x ^ o y ^ o ) and the ith joint of the moving platform: di;
    With reference to Figure 1, it is possible to write the following equations:
    l _ i = d _ i q _ i
    d _ i = p _ + b _ i s _ i .
It is also possible to obtain the inverse kinematic of the delta shaker, as in [30]. By computing the square of both terms of (A1), it is possible to write
l _ i T · l _ i = ( d _ i q _ i ) T · ( d _ i q _ i ) ,
which can be written as
l _ i T · l _ i = d _ i T · d _ i q _ i T · d _ i d _ i T · q _ i + q _ i T · q _ i .
Given the definitions of the vectors qi and li, it is possible to obtain the following quadratic equation with the unknown qi:
q i 2 2 d _ i T · z ^ o · q i + d _ i T · d _ i l 2 = 0 .
From the previous Equation (A5), it is possible to compute qi as a function of di. Given the position of the platform with respect of the links of the delta, a negative solution is taken.
q i = d _ i T · z ^ o d _ i T · ( z ^ o · z ^ o T I ) · d _ i + l 2
It is possible to substitute the term di with the terms provided by (A2). The relationship can be further simplified given the fact that the vectors bi and si are defined without components along z ^ o . In this way, it is possible to compute each qi as a function of p:
q i = p z ( p _ + b _ i s _ i ) T · ( z ^ o · z ^ o T I ) · ( p _ + b _ i s _ i ) + l 2 .
The direct kinematic can also be computed. The first step is to compute the squares of both terms of (1), and to substitute di with the terms provided by (A2):
l _ i T · l _ i = ( p _ + b _ i s _ i ) T · ( p _ + b _ i s _ i ) 2 ( p _ + b _ i s _ i ) T · q _ i + q _ i T · q _ i .
Given the symmetry of the delta, the modules of the vectors li, bi, and si are known and equal for each i, hence it is possible to write
p 2 + b 2 + s 2 l 2 + 2 p _ T · b _ i 2 p _ T · s _ i 2 b _ i T · s _ i 2 p _ T · z ^ o · q i 2 b _ i T · z ^ o · q i + 2 s _ i T · z ^ o · q i + q i 2 = 0 .
By substituting in (A9) the definitions of bi and si, the following equation can be computed:
p x 2 + p y 2 + p z 2 ( b s ) 2 l 2 + q i 2 2 p z q i + 2 p x ( b s ) cos ( 2 π 3 ( i 1 ) ) + 2 p y ( b s ) sin ( 2 π 3 ( i 1 ) ) = 0 .
By multiplying by 2 the previous Equation (A10) for i = 1 and subtracting the same equation computed for i = 2 and i = 3, it is possible to obtain
6 p x ( b s ) + 2 q 1 2 q 2 2 q 3 2 2 p z ( 2 q 1 q 2 q 3 ) = 0 .
Then, by subtracting the members of Equation (A10) computed for i = 2 from the members of the same equation computed for i = 3, the following relationship can be obtained:
2 3 p y ( b s ) + q 2 2 q 3 2 2 p z ( q 2 q 3 ) = 0   .
The two previous Equations (A11) and (A12) establish a linear relationship between px and pz, and between py and pz. Therefore, by substituting px and py in (A10) computed for i = 1, with the functions of pz defined before, it is possible to write a quadratic equation with the unknown of pz. Such an equation has the following parameters:
  α p z 2 + β p z + γ = 0
α = ( 2 q 1 q 2 q 3 ) 2 + 3 ( q 2 q 3 ) 2 9 ( b s ) 2 + 1
β = 3 ( q 2 q 3 ) ( q 3 2 q 2 2 ) ( 2 q 1 q 2 q 3 ) ( 2 q 1 2 q 2 2 q 3 2 ) 9 ( b s ) 2 + 2 ( 2 q 1 q 2 q 3 ) 3 2 q 1 .
γ = 3 ( q 2 2 q 3 2 ) 2 + ( 2 q 1 2 q 2 2 q 3 2 ) 2 36 ( b s ) 2 2 q 1 2 q 2 2 q 3 2 3 + ( b s ) 2 + q 1 2 l 2
Therefore, from (A13), it is possible to compute pz. Given the geometry of the delta, only the positive solution is relevant. Then, from (A11) and (A12), it is possible to compute the other two components of the vector p.
The kinematic optimization is based on the Jacobian matrix. Therefore, a speed analysis must be performed. The first step is to compute the derivative of (A4) with respect to time. By considering that l is constant in time, it is possible to write
d ˙ _ i T · d _ i + d _ i T · d ˙ _ i + q ˙ _ i T · q _ i + q _ i T · q ˙ _ i q ˙ _ i T · d _ i q _ i T · d ˙ _ i d ˙ _ i T · q _ i d _ i T · q ˙ _ i = 0 .
The previous Equation (A17) can be written as follows:
( d _ i q i z ^ o ) T ( d ˙ _ i q ˙ i z ^ o ) = 0 .
The first factor of (A18) is equal to the vector li, according to (A1), while d ˙ _ i is equal to p _ ˙ , according to (A2), because the other terms are constant in time. Therefore, by dividing both terms by the length of the links of the delta, the following relationship can be established:
v ^ i T · p _ ˙ q ˙ i v ^ i T · z ^ o = 0 .
The previous equation is valid for each of the three links, so it is possible to write it in a matrix form:
[ v 1 z 0 0 0 v 2 z 0 0 0 v 3 z ] { q 1 q 2 q 3 } ˙ = [ v 1 x v 1 y v 1 z v 2 x v 2 y v 2 z v 3 x v 3 y v 3 z ] { p x p y p z } ˙ ,
where the components along the three axis of the three unit vectors v ^ i can be computed from the kinematic chain of each link, expressed by (A1) and (A2). Considering the definitions of the vectors, given the geometry of the delta, it is possible to obtain
v ^ i = 1 l { p x + ( b s ) cos ( 2 π 3 ( i 1 ) ) p y + ( b s ) sin ( 2 π 3 ( i 1 ) ) p z q i } .
From Equations (A20) and (A21), the so-called Jacobian matrix can be computed.

References

  1. Smith, D.R.; Leggat, P.A. Whole-Body Vibration. Prof. Saf. 2005, 50, 35. [Google Scholar]
  2. Bovenzi, M.; Hulshof, C. An updated review of epidemiologic studies on the relationship between exposure to whole-body vibration and low back pain. J. Sound Vib. 1998, 215, 595–611. [Google Scholar] [CrossRef]
  3. Seidel, H.; Bluethner, R.; Hinz, B. Effects of sinusoidal whole-body vibration on the lumbar spine: The stress-strain relationship. Int. Arch. Occup. Environ. Health 1986, 57, 207–223. [Google Scholar] [CrossRef]
  4. Bovenzi, M.; Hulshof, C. An updated review of epidemiologic studies on the relationship between exposure to whole-body vibration and low back pain (1986–1997). Int. Arch. Occup. Environ. Health 1999, 72, 351–365. [Google Scholar] [CrossRef] [PubMed]
  5. Palmer, K.T.; Griffin, M.J.; Syddall, H.E.; Pannett, B.; Cooper, C.; Coggon, D. The relative importance of whole body vibration and occupational lifting as risk factors for low-back pain. Occup. Environ. Med. 2003, 60, 715–721. [Google Scholar] [CrossRef] [Green Version]
  6. Nordlund, M.; Thorstensson, A. Strength training effects of whole-body vibration. Scand. J. Med. Sci. Sports 2007, 17, 12–17. [Google Scholar] [CrossRef]
  7. Orsini, F.; Rossi, A.; Botta, F.; Scorza, A.; Sciuto, S.A.; Marzaroli, P.; Chadefaux, D.; Tarabini, M.; Scalise, L. A case study on the characterization of whole body vibration platforms for medical applications. In Proceedings of the 2018 IEEE International Symposium on Medical Measurements and Applications (MeMeA), Rome, Italy, 11–13 June 2018; pp. 1–6. [Google Scholar]
  8. Orsini, F.; Rossi, A.; Scorza, A.; Botta, F.; Sciuto, S.A. A comparison between a commercial WBV platform and an experimental prototype. In Proceedings of the 22nd IMEKO TC4 International Symposium & 20th International Workshop on ADC Modelling and Testing Supporting World Development through Electrical&electronic Measurements Iasi, Rome, Italy, 14–15 September 2017. [Google Scholar]
  9. Mansfield, N.J.; Griffin, M.J. Non-Linearities in apparent mass and transmissibility during exposure to whole-body vertical vibration. J. Biomech. 2000, 33, 933–941. [Google Scholar] [CrossRef]
  10. Matsumoto, Y.; Griffin, M. The horizontal apparent mass of the standing human body. J. Sound Vib. 2011, 330, 3284–3297. [Google Scholar] [CrossRef]
  11. Paddan, G.; Griffin, M. The transmission of translational floor vibration to the heads of standing subjects. J. Sound Vib. 1993, 160, 503–521. [Google Scholar] [CrossRef]
  12. Tarabini, M.; Saggin, B.; Scaccabarozzi, D.; Gaviraghi, D.; Moschioni, G. Apparent mass distribution at the feet of standing subjects exposed to whole-body vibration. Ergonomics 2013, 56, 842–855. [Google Scholar] [CrossRef]
  13. Tarabini, M.; Solbiati, S.; Moschioni, G.; Saggin, B.; Scaccabarozzi, D. Analysis of non-linear response of the human body to vertical whole-body vibration. Ergonomics 2014, 57, 1711–1723. [Google Scholar] [CrossRef] [Green Version]
  14. Tarabini, M.; Solbiati, S.; Saggin, B.; Scaccabarozzi, D. Apparent mass matrix of standing subjects exposed to multi-axial whole-body vibration. Ergonomics 2016, 59, 1038–1049. [Google Scholar] [CrossRef]
  15. Mansfield, N.; Griffin, M.J. Effects of posture and vibration magnitude on apparent mass and pelvis rotation during exposure to whole-body vertical vibration. J. Sound Vib. 2002, 2253, 93–107. [Google Scholar] [CrossRef]
  16. Dickey, J.P.; Eger, T.R.; Oliver, M.L.; Boileau, P.E.; Trick, L.M.; Edwards, A.M. Multi-axis sinusoidal whole-body vibrations: Part II—Relationship between Vibration Total Value and discomfort varies between vibration axes. J. Low Freq. Noise Vib. Act. Control 2007, 26, 195–204. [Google Scholar] [CrossRef]
  17. Welcome, D.E.; Dong, R.G.; Xu, X.S.; Warren, C.; McDowell, T.W.; Wu, J.Z. An examination of the vibration transmissibility of the hand-arm system in three orthogonal directions. Int. J. Ind. Ergon. 2015, 45, 21–34. [Google Scholar] [CrossRef]
  18. Boileau, P.; Rakheja, S. Whole-body vertical biodynamic response characteristics of the seated vehicle driver: Measurement and model development. Int. J. Ind. Ergon. 1998, 22, 449–472. [Google Scholar] [CrossRef]
  19. Tarabini, M.; Solbiati, S.; Saggin, B.; Scaccabarozzi, D. Setup for the measurement of apparent mass matrix of standing subjects. IEEE Trans. Instrum. Meas. 2016, 65, 1856–1864. [Google Scholar] [CrossRef]
  20. Subashi, G.; Matsumoto, Y.; Griffin, M. Modelling resonances of the standing body exposed to vertical whole-body vibration: Effects of posture. J. Sound Vib. 2008, 317, 400–418. [Google Scholar] [CrossRef]
  21. Merlet, J. Parallel manipulators: State of the art and perspectives. Adv. Rob. 1993, 8, 589–596. [Google Scholar] [CrossRef]
  22. Patel, Y.; George, P. Parallel manipulators applications—a survey. Mod. Mech. Eng. 2012, 2, 57. [Google Scholar] [CrossRef]
  23. Clavel, R. A fast robot with parallel geometry. In Proceedings of the 18th International Symposium on Industrial Robots, New York, NY, USA, 26–28 April 1988; pp. 91–100. [Google Scholar]
  24. Liu, X.; il Jeong, J.; Kim, J. A three translational DoFs parallel cube-manipulator. Robotica 2003, 21, 645–653. [Google Scholar] [CrossRef]
  25. Bouri, M.; Clavel, R. The linear delta: Developments and applications. In Proceedings of the Robotics (ISR), 2010 41st International Symposium on and 2010 6th German Conference on Robotics (ROBOTIK), Munich, Germany, 7–9 June 2010; pp. 1–8. [Google Scholar]
  26. Giberti, H.; Cinquemani, S.; Legnani, G. Effects of transmission mechanical characteristics on the choice of a motor-reducer. Mechatronics 2010, 20, 604–610. [Google Scholar]
  27. Ucar, H.; Basdogan, I. Dynamic characterization and modeling of rubber shock absorbers: A comprehensive case study. J. Low Freq. Noise Vib. Act. Control 2018, 37, 509–518. [Google Scholar] [CrossRef]
  28. Pastor, M.; Binda, M.; Harčarik, T. Modal assurance criterion. Procedia Eng. 2012, 48, 543–548. [Google Scholar] [CrossRef]
  29. Presas, A.; Valentin, D.; Egusquiza, E.; Valero, C.; Egusquiza, M.; Bossio, M. Accurate determination of the frequency response function of submerged and confined structures by using PZT-patches. Sensors 2017, 17, 660. [Google Scholar] [CrossRef]
  30. Giberti, H.; Sbaglia, L.; Silvestri, M. Mechatronic design for an extrusion-based additive manufacturing machine. Machines 2017, 5, 29. [Google Scholar] [CrossRef]
Figure 1. Kinematic scheme of the linear delta.
Machines 07 00067 g001
Figure 2. Drawing of the Delta Robot assembly.
Machines 07 00067 g002
Figure 3. Position and sensing direction of the accelerometers on the moving platform of the delta shaker for the performance tests along X direction (a), Y direction (b) and Z direction (c).
Machines 07 00067 g003
Figure 4. Person standing on the moving platform of the shaker.
Machines 07 00067 g004
Figure 5. Comparison of the modal analysis results obtained through the Finite Element Method (FEM) and experimentally.
Machines 07 00067 g005
Figure 6. Signal acquired by the reference accelerometer placed at the center of the platform when imposing a 15 Hz sinusoidal signal along the X direction, in both the time and frequency domain.
Machines 07 00067 g006
Figure 7. Comparison of the imposed acceleration signal and the acceleration of the moving platform, free and loaded with a person standing on it, along the three directions.
Machines 07 00067 g007
Table 1. Optimization space.
ParameterLower Bound (mm)Step (mm)Upper Bound (mm)
Base radius25010500
Link length1505250
Table 2. Maximum forces and moments at the joints, computed through the multibody dynamic simulation.
Fx (N)Fy (N)Fz (N)Mx (Nm)My (Nm)Mz (Nm)
19161908282148181320
Table 3. Yeoh rubber model parameters.
C10C20C30D1D2D3
0.9636−0.62130.3265000
Table 4. Mean quadratic errors of the moduli of the acceleration signals measured on the moving platform at frequencies between 1 and 50 Hz.
ax (mm/s2)ay (mm/s2)az (mm/s2)
No load5.78.26.3
Loaded9.614.09.8
Table 5. Mechanical noise outside the excitation band: RMS of the vibration at f > 50 Hz.
ax (mm/s2)ay (mm/s2)az (mm/s2)
No load4.96.58.2
Loaded4.66.07.8

