Article

DC Series Arc Fault Diagnosis Scheme Based on Hybrid Time and Frequency Features Using Artificial Learning Models

1
School of Electrical and Electronics Engineering, Chung-Ang University, Seoul 06974, Republic of Korea
2
Department of Electrical and Computer Engineering, Mississippi State University, Starkville, MS 39762, USA
*
Author to whom correspondence should be addressed.
Machines 2024, 12(2), 102; https://doi.org/10.3390/machines12020102
Submission received: 29 December 2023 / Revised: 27 January 2024 / Accepted: 28 January 2024 / Published: 1 February 2024
(This article belongs to the Section Machines Testing and Maintenance)

Abstract

:
DC series arc faults pose a significant threat to the reliability of DC systems, particularly in DC generation units where aging components and high voltage levels contribute to their occurrence. Recognizing the severity of this issue, this study aimed to enhance DC arc fault detection by proposing an advanced recognition procedure. The methodology involves a sophisticated combination of current filtering using the Three-Sigma Rule in the time domain and the removal of switching noise in the frequency domain. To further enhance the diagnostic capabilities, the proposed method utilizes time and frequency signals generated from power supply-side signals as a reference input. The time–frequency features extracted from the filtered signals are then combined with artificial learning models. This fusion of advanced signal processing and machine learning techniques aims to capitalize on the strengths of both domains, providing a more comprehensive and effective means of detecting arc faults. The results of this detection process validate the effectiveness and consistency of the proposed DC arc failure identification schematic. This research contributes to the advancement of fault detection methodologies in DC systems, particularly by addressing the challenges associated with distinguishing arc-related distortions, ultimately enhancing the safety and dependability of DC electrical systems.

1. Introduction

The widespread adoption of DC distribution systems in renewable energy systems, electric vehicles, microgrids, and electric aircraft brings numerous benefits but also introduces challenges associated with faults in these systems [1,2]. The DC voltage levels above 100 V at busbars, combined with numerous connections, elevate the probability of arc fault occurrences [3]. Additionally, the aging of insulation and the deterioration of terminals during the prolonged operation of DC distribution systems add to the probability of arc faults [4]. Unlike AC distribution systems, the absence of zero crossing in DC distribution systems makes sustained arc generation more likely [5]. The consequences of arc faults range from malfunctions of electrical devices to fire hazards, especially if the arc continues, posing a significant threat to safety [6,7]. Therefore, the detection of DC series arc faults has become a crucial issue in the application of DC power systems [8]. Arc faults in DC systems are categorized into series arc faults (SAFs) and parallel arc faults (PAFs). PAFs, when they occur, typically result in overcurrent, which can be protected by a circuit breaker. On the other hand, SAFs pose a more significant challenge as the current rise in the circuit is not obvious due to the introduction of arc impedance, making it difficult for circuit breakers to provide effective protection [9]. SAFs are recognized as more harmful to the system compared to PAFs, necessitating focused investigation into their detection methods. The traditional approach to DC series arc diagnosis relies on different statistical characteristics between normal and arc fault conditions. Detection methods based on time or frequency-domain statistical features offer advantages such as a lower sampling frequency and shorter detection latency [10,11]. However, these methods face challenges related to the unique difficulties posed by DC arcs, including susceptibility to switching noise and other background noise in the system. Previous feature extraction methods relied on wavelet decomposition to obtain characteristic frequency components, followed by calculating statistical features like RMS values, maximum magnitudes, and high-frequency band energy [12,13,14,15]. However, this approach requires careful selection of a wavelet basis function, and an inappropriate choice can lead to insufficiently distinct features for accurate arc fault differentiation. Gajula and Herrera [16] proposed a Kalman filter-based method for identifying cable parameters in DC distribution systems, enabling SAF diagnosis through parameter variation analysis. This approach necessitates collecting both current and terminal voltage data from multiple sensors, increasing the cost and complexity. Li et al. [17] employed recurrent neural networks (RNNs) to analyze three-phase line currents for SAF diagnosis and line selection. However, RNNs are susceptible to vanishing gradients during back-propagation due to excessive stacking, potentially impacting their diagnostic performance [18]. An extensive review paper offers a meticulous exploration of the latest progress and research within the domain of arc fault detection for electrical distribution systems. This review article places a concentrated lens on the identification and early detection of arc faults, placing a special emphasis on the crucial involvement of artificial intelligence [19]. The existing methods often focus solely on either time-domain or frequency-domain signals, neglecting comprehensive preprocessing of raw data [20,21,22]. This can lead to limitations in feature extraction and ultimately impact the accuracy of arc fault diagnosis.
This study introduces an innovative methodology that integrates empirical filtering, Switching Noise Removal (SNR), and Artificial Learning Models (ALMs) to address the complexities of DC arc fault diagnosis. The process involves capturing time-domain arc current signals, applying empirical rule-based filtering to eliminate unwanted signal elements [23], and employing Fast Fourier Transform (FFT) for frequency-domain analysis. The parallel frequency-domain analysis refines the signals to eliminate switching frequency noise [24]. The resulting post-filtered signals are then used as inputs for ALMs. The diagnostic results demonstrate the remarkable efficacy of this approach in significantly enhancing detection accuracy. The structure of this paper is organized to provide a comprehensive understanding of the configuration setup, variations in current properties in both the time and frequency domains, the ALMs used for arc fault detection, and the empirical filtering and switching noise filtering techniques. The scientifically reported conclusions cover scenarios involving different current scales and operational rates. Finally, the synthesis of cumulative findings underscores the significance of ALMs in arc fault detection, concluding this study with valuable insights for the future development of DC arc fault detection systems.

2. Arc Failure Generation, Specifications, and Characteristics

Figure 1 offers a detailed illustration of the intricate methodology employed for DC arc data acquisition. This experimental setup strictly adhered to the comprehensive guidelines outlined in UL1699B [25], which significantly influenced the blueprint of our arc generation circuitry. The controlled disjointing of the arc rods served as the precise trigger for initiating the arc event. This deliberate initiation was immediately followed by the deployment of a high-fidelity oscilloscope, specifically designed for meticulously recording the current flow paths through the rods before and after the arc occurrence. The acquired arc waveforms were subjected to a rigorous analysis, leveraging the advanced capabilities of MATLAB R2021b software for comprehensive evaluation. Our arc generation setup comprised essential components: a DC power source, an arc generator, and load elements. Figure 1 prominently displays the N8741A DC power supply, kindly provided by Keysight Technologies (USA), which delivered precisely controlled DC voltage to the load components. The intricate interplay between a highly accurate step motor and the arc rods ensured their precise separation. For precise data acquisition, we utilized the capabilities of an oscilloscope operating at an impressive sampling frequency of 250 kHz. The fundamental data acquisition process was further facilitated with the aid of a Tektronix TCP312 current probe, ensuring accurate measurement of arc currents. Our comprehensive investigation of DC arc failure encompassed a wide spectrum of domains, emphasizing the thoroughness of our research. Systematic generation of DC arcs took place under diverse experimental conditions, thereby facilitating the acquisition of comprehensive datasets. Our experimental parameters were meticulously defined, featuring a source voltage of 300 V. We explored a range of current amplitudes spanning from 5 to 8 A, across various switching rates, including 5, 10, 15, and 20 kHz. These experiments were conducted using both resistive (10 Ω) and inductive (10 mH) loads. Figure 1 visually presents the core architecture of the three-phase DC–AC converter modules, the central load components in our investigation. These inverters, capable of transforming DC signals into AC counterparts, were meticulously controlled through space vector modulation (SVPWM) throughout our research. By manipulating the state of the six individual switching devices with a predetermined DC voltage, we successfully emulated the sinusoidal waveforms characteristic of an AC network. This fine-grained control empowered us to precisely adjust both frequency and amplitude parameters, ensuring robust and accurate experimental conditions.
Figure 2 presents a captivating visual exploration of the time-domain waveforms observed under both normal operation and the onset of arcing events. This detailed analysis focuses on a 5 A current at 15 kHz. In the “pre-arc” phase, a remarkable uniformity is observed in the waveforms across both current amplitudes and switching frequencies. This uniformity suggests a stable and controlled environment within the electrical system. However, the introduction of an electrical arc into the system dramatically disrupts this harmony, introducing a plethora of abnormalities into the previously pristine waveforms. The once smooth and predictable waveform becomes overlaid with a multitude of high-frequency oscillations known as harmonics. These harmonics are not present in the normal operation waveforms and represent a clear deviation from the ideal current profile. The original waveform shape undergoes a significant transformation, becoming distorted and irregular. This distortion is a direct consequence of the chaotic nature of the arcing phenomenon and its disruptive influence on the electrical current flow. While often subtle, a noticeable decrease in the overall amplitude of the current can be observed upon arc initiation. This decrease is attributed to the energy dissipated through the arcing process, resulting in a less efficient transfer of energy to the load. The early stage of the arcing event is particularly noteworthy due to the presence of prominent spikes in amplitude. These spikes, often several times the magnitude of the pre-arc current, are a direct consequence of the fiery discharge of electrical sparks. These sparks represent a sudden and intense release of energy, resulting in corresponding spikes in the current waveform. It is crucial to emphasize that these conspicuous and atypical phenomena hold significant value as potential markers for arc fault detection. The observed waveform analysis offers valuable insights into the dynamics of electrical arcing.
Following the initial visual inspection of the time-domain waveforms, a meticulous examination delves into their spectral attributes revealed via an FFT investigation. To guarantee the highest accuracy, the dataset is meticulously divided into distinct groups, each subject to a tailored FFT analysis. This rigorous procedure yields individual sets, each encompassing precisely 200 data elements gained at a constant sample rate of 250 kHz. Figure 2 visually presents the results of the aforementioned FFT analysis, conducted both before and after arc initiation, for a 5 A current and a fixed switching rate of 15 kHz. A striking observation emerges from the depicted spectral profiles: a clear absence of distortions in the pre-arc FFT spectrum. This holds true across all examined switching frequency configurations. Upon closer examination of the frequency profiles, a fascinating revelation surfaces: the presence of concentrated switching noise exclusively in proximity to the designated switching frequency bands. This observation unveils a compelling pattern where, at a switching rate of 15 kHz, the spectral site is distinctly characterized by a core of switching noise encompassing the ranges of 15, 30, 45, and 60 kHz. Similar patterns resonate throughout the spectra of further examined switching rates, with the distribution of switching noise consistently aligning with the multiples of their respective switching rates. This detailed exploration of the spectral attributes offers valuable insights into the dynamics of electrical arcing. The absence of distortions prior to the arc event suggests a stable and controlled current flow within the system. In stark contrast to the pre-arc scenario devoid of distortions, a multitude of prominent distortions emerge within the spectrum encompassing the frequency span of 3 kHz to 30 kHz, irrespective of the specific switching frequency employed. This remarkable transformation signifies the profound influence of the arcing phenomenon on the frequency distribution of the current waveform. The existing switching noise present in the system interacts with the disturbances generated by the arc event, leading to a complex and convoluted spectral landscape. The process of obtaining features plays a pivotal role in the implementation of learning algorithms. For instance, consider a scenario with a pure resistive load where only FFT is utilized as input for artificial learning algorithms. In such cases, the diagnostic performance might suffer due to unclear distinctions between normal and arcing states in certain sectors [22]. However, this study employs both time and frequency domains; the feature in the time domain ensures that the ALMs maintain a high level of accuracy in the case of a pure resistive load.

3. Feature Extraction in Time and Frequency Domains, and Artificial Learning Models

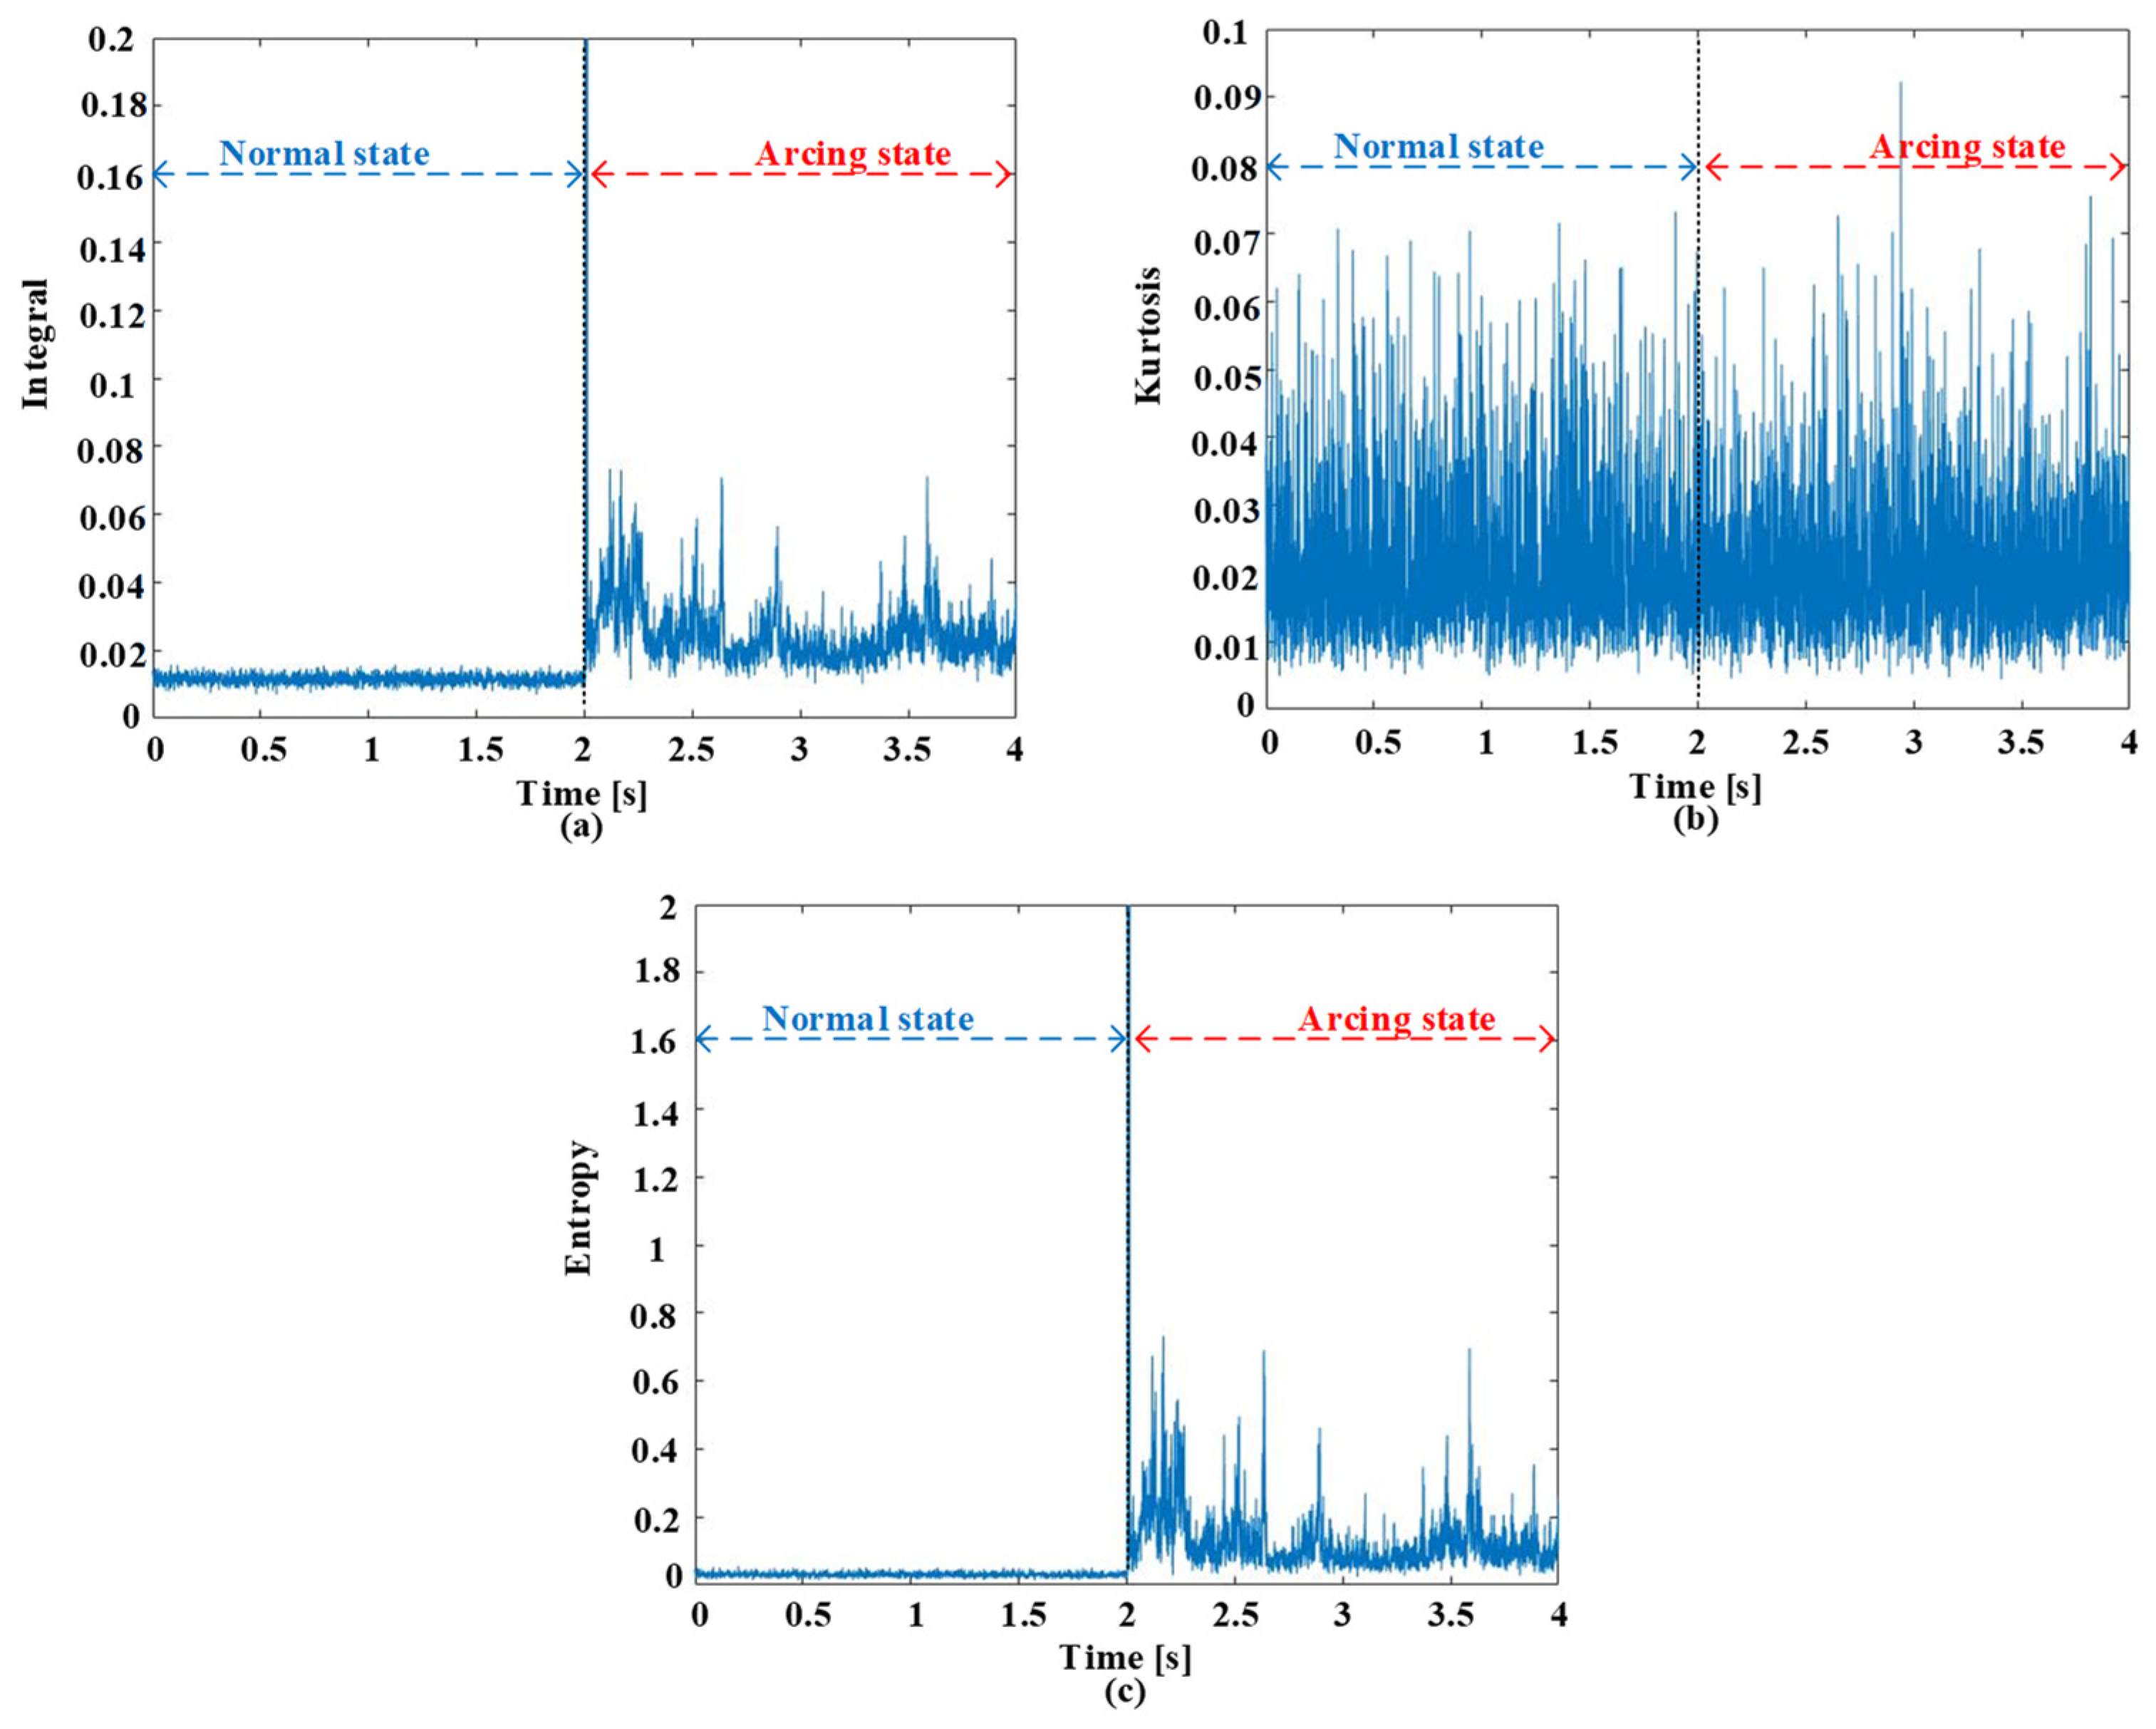
3.1. Feature Extraction in Time Domain

The Three-Sigma Rule, also known as the Empirical Rule, states that within a normally distributed dataset, a staggering majority—nearly 99.7%—of observed data points reside within a specific range. This range encompasses three standard deviations (±3 si) centered around the mean (m). To elaborate further, approximately 95% of all data points lie within the range of two standard deviations (m ± 2 si). Roughly 68% of data elements exist inside the span of one standard deviation (m ± si).
In this study, the dataset, generated using a frequency of 250 kHz, is meticulously divided into individual segments, each with an interval of 0.8 ms, to facilitate the subsequent filtering process. Within each segment, we diligently calculate both the mean (m) and the standard deviation (si). Following this calculation, we establish the below and above limits defined by the following equations:
b e l o w   l i m i t   k = m s e t k s i s e t ,
a b o v e   l i m i t   k = m s e t + k s i s e t ,
Here, k represents the si value. This meticulous approach effectively establishes three distinct empirical filtering ranges. Range 1: Within the range of one standard deviation (si) around the mean (m). Range 2: Between two standard deviations (2 si) away from the mean (m). Range 3: Encompassing the area three standard deviations (3 si) away from the mean (m). Data points falling within these predefined ranges are deemed valid and retained for further analysis. Conversely, data points falling outside of these ranges are subjected to a rigorous filtering process. This meticulous filtering process ensures the reliability and accuracy of the extracted features from each dataset. By leveraging the powerful insights provided by the Three-Sigma Rule, we are able to effectively separate relevant data from outliers and noise. This ensures that the features extracted from each dataset are representative of the true underlying phenomenon and can be utilized with confidence in subsequent analysis and modeling stages. The features of each dataset are obtained as follows [26,27]:
i n t e g r a l = i = 1 L x i · 1 L ,
K u r t o s i s = 1 L 1 i = 1 L x i m 2 ,
e n t r o p y = i = 1 L x i 2 · l g x i 2 ,
where x i is the data elements at the i t h position in each dataset and L denotes the number of sampling elements within each sample period.
Figure 3 presents a compelling visualization of the features extracted at a 5 A current and 15 kHz after undergoing the meticulous filtering process. This process employs a robust three-sigma filter, known as an empirical filter, which effectively differentiates the processed signals during various operating conditions. This is particularly evident in the distinct patterns observed for both the integral and entropy features across normal and arcing states. These features contribute valuable insights into the underlying dynamics of the signals, providing additional information beyond the raw data that can be utilized for enhanced classification performance. This filtered data hold significant promise for substantially improving the capabilities of ALMs in accurately distinguishing between normal operation and the presence of arcing events.
By leveraging these refined features, ALMs can achieve superior classification accuracy and reliability, ultimately contributing to a safer and more efficient electrical infrastructure. However, unlike the integral and entropy features, the Kurtosis feature does not exhibit such a clear differentiation between normal and arcing states. The variations observed are comparatively less pronounced, diminishing the effectiveness of Kurtosis as a discriminative feature. This overlap in Kurtosis values for both states suggests that relying solely on this feature might not provide sufficient discriminatory power for accurate classification.

3.2. Feature Extraction in Frequency Domain

The proposed approach for mitigating switching frequency noise is a sophisticated frequency-domain technique meticulously designed to enhance the extraction of fundamental characteristics, facilitate precise filtering, and ultimately improve the accuracy of arc fault detection. This method is intricately interwoven with the sampled current waveform and operates by pinpointing and isolating the essential aspects associated with arc failure. Working in tandem with this extraction process, a dedicated purification procedure plays a pivotal role in emphasizing the prominent frequency elements embedded within the fault event. The switching noise removal (SNR) procedure comprises two critical stages. The initial stage meticulously identifies and delimits the relevant frequency components within a predefined range. This range is carefully chosen to encompass the frequency bands where arc-specific features are most likely to reside. In the second stage, the identified frequency components are subjected to a rigorous filtering process aimed at eliminating the interfering switching noise. This process utilizes advanced filtering techniques to selectively remove noise while preserving the valuable information associated with the arc event. Through this meticulous two-stage process, the essential features of the arc current are extracted and purified, resulting in a highly refined dataset suitable for input into ALMs. This enhanced feature set, devoid of the disruptive influence of switching noise, significantly improves the diagnostic precision and reliability of the system. The frequency resolution (Δf) and the number of frequency components (N) are precisely defined by Equations (6) and (7), respectively. These equations utilize the fundamental parameters of the sampling process, where f s a m p l i n g = 250 kHz represents the sampling rate and L = 200 denotes the number of sampling elements within each sample period.
Δ f = f s a m p l i n g L
Number   of   frequency   components = L 2 .
Following the meticulous execution of the Fast Fourier Transform (FFT) task, a refined set of precisely 100 frequency components is generated. Each of these components possesses a specific frequency resolution of Δf = 1250 Hz, ensuring a granular exploration of the spectral landscape. Figure 2 presents a vivid illustration of the arc-related distortions, consistently observed inside the range of 3 kHz to 30 kHz. This insightful observation informs the establishment of the designated frequency range (FR), strategically set to initiate at 3 kHz. This deliberate choice ensures the comprehensive capture of all arc-specific features, preventing any critical information from being inadvertently overlooked during the analysis process. By carefully defining both the frequency resolution and the designated frequency range, we establish a robust framework for analyzing the spectral characteristics of the arc current. This framework paves the way for the development of advanced arc fault detection algorithms that leverage the unique spectral signature of arc events. By effectively differentiating between arc-induced distortions and background noise, these algorithms can significantly enhance the accuracy and reliability of arc fault detection.
The paramount objective of excluding switching distortions is to mitigate the detrimental influence of noise that manifests itself in close proximity to the multiples of the switching rate. In this context, each individual frequency component within a designated frequency range (FR), represented by F i , plays a critical role. Additionally, F a v r denotes the arithmetic mean of all frequency components encompassed within the FR. The detection and subsequent modification of these noise-contaminated frequencies are governed by a precise criterion. If the magnitude of a specific frequency component, F i , exceeds the mean frequency, F a v r , by a factor of three or more ( F i > 3 ×   F a v r ), then corrective action is instigated. This action involves resetting the magnitude of not only F i itself but also the two neighboring frequency components, one preceding and one succeeding F i , to align with the value of F a v r . This meticulous adjustment process, systematically applied to every individual current component, ensures that no frequency component exceeds a threshold of three times the mean frequency. This iterative progression of adjustments constitutes the “switching noise removal” technique. It plays a pivotal role in enhancing the quality of the extracted frequency components, effectively eliminating residual switching noise that can potentially interfere with the accurate detection of arc-related features. Following this meticulous noise removal process, the salient features are extracted using Equations (3)–(5), utilizing the filtered frequency components.
Figure 4 offers compelling evidence of the successful implementation of the SNR technique in scenarios with a 5 A current and switching frequency of 15 kHz, focusing on the designated FR of 3 kHz to 30 kHz. The meticulous application of this method resulted in significantly improved signal clarity, making arc-related distortions more readily discernible within the data. The analysis of the entropy feature, still within the same FR, revealed consistent results, further bolstering the robustness and effectiveness of the SNR technique. This consistency underscores the method’s capacity to enhance the visibility of arc distortions across diverse scenarios, even in the presence of different switching frequencies.
The SNR analysis paints a bright picture for arc fault detection. The integral and entropy features reveal clear differences between normal and arcing states, making crucial information readily accessible for accurate identification. This consistency held true across diverse scenarios, proving SNR’s effectiveness even with varying switching frequencies. Enhanced signal visibility significantly bolstered arc distortion detectability, leading to more reliable fault detection. Kurtosis, however, showed a less promising picture. Its lack of clear distinction between states suggests limited efficacy for this specific task. In conclusion, SNR with integral and entropy features emerges as a powerful tool for accurate and robust arc fault detection, while Kurtosis appears less suited for this application.
The application of the proposed method in nonstationary conditions, such as during the opening or closure of the gap between electrodes, is a crucial consideration. Unlike FFT, which assumes stationarity, our method is designed to address nonstationary conditions effectively. This is achieved through the incorporation of a meticulous empirical filtering procedure and the use of SNR techniques in the frequency domain. The empirical filtering process is particularly adept at handling nonstationary signals by identifying and replacing data points that fall outside predefined ranges. This helps eliminate spurious noise and outliers that may be present during dynamic events like the opening or closure of electrode gaps. Additionally, the SNR technique further enhances the method’s robustness in nonstationary scenarios by isolating specific frequency elements relevant to arc-related phenomena and effectively removing the influence of switching noise. Therefore, the proposed method is well-suited for situations involving changes in signal dynamics, ensuring its applicability and accuracy even under nonstationary conditions such as those encountered during the opening or closure of the electrode gap.

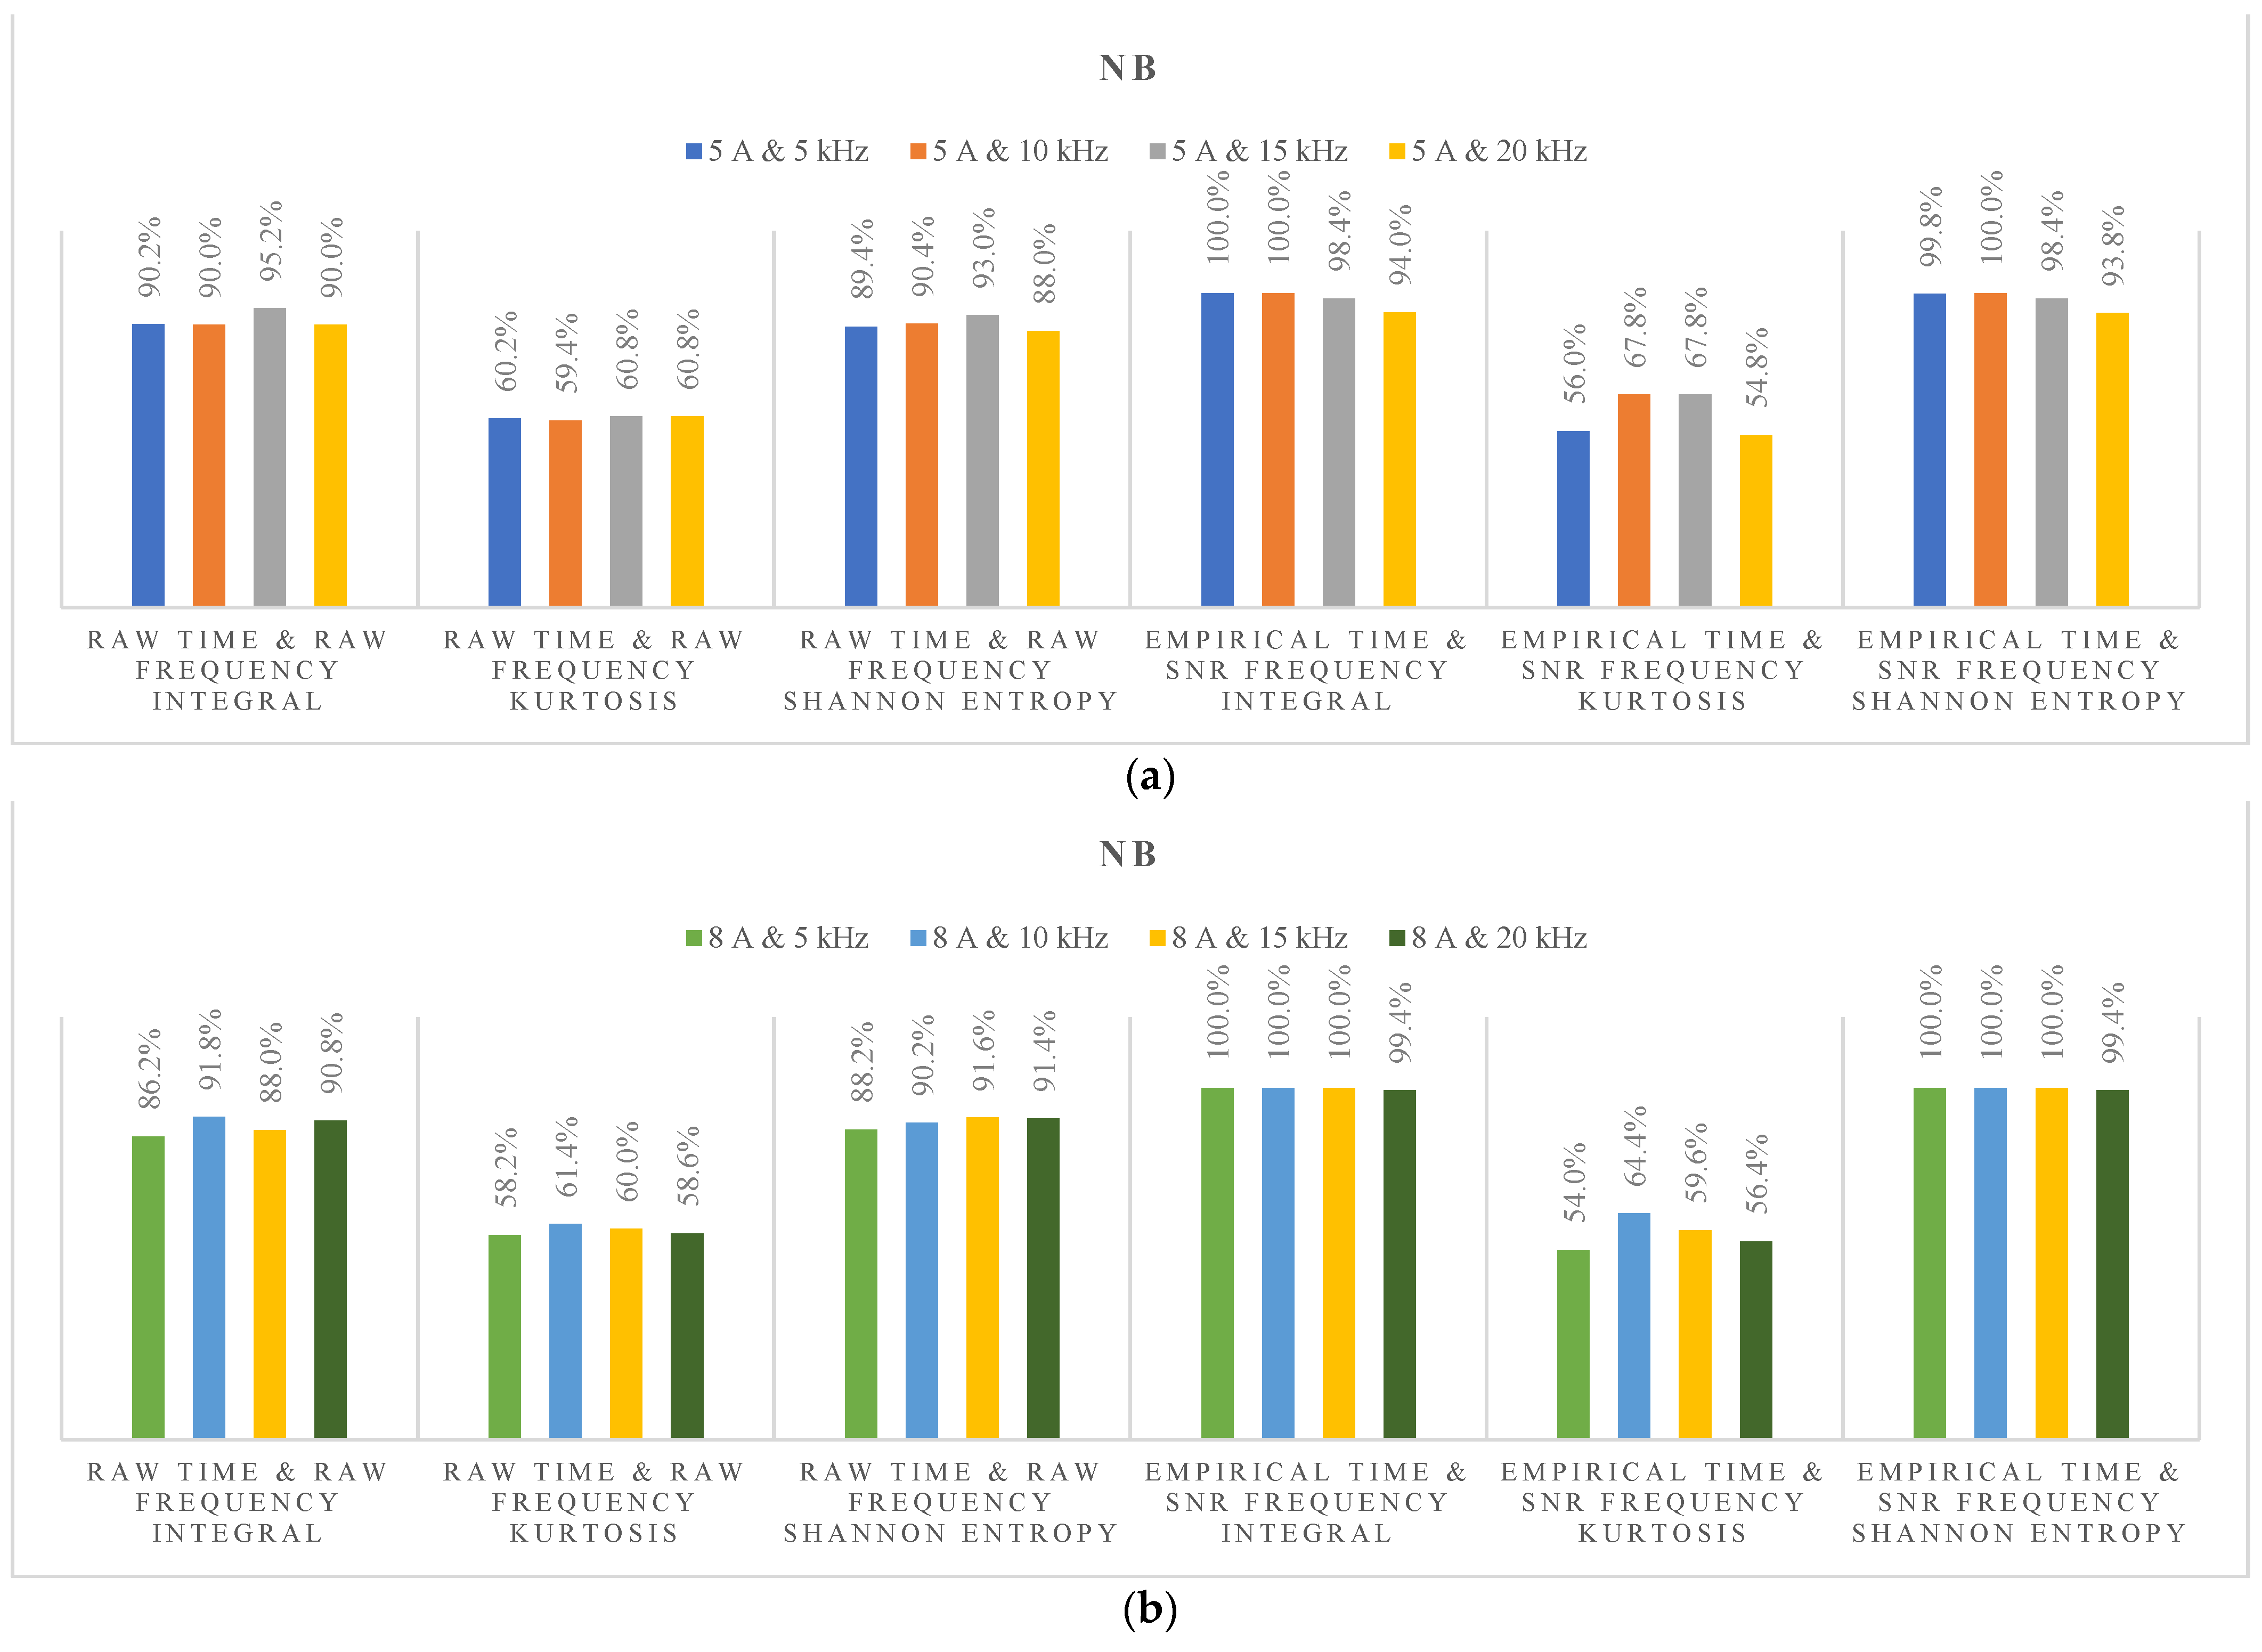
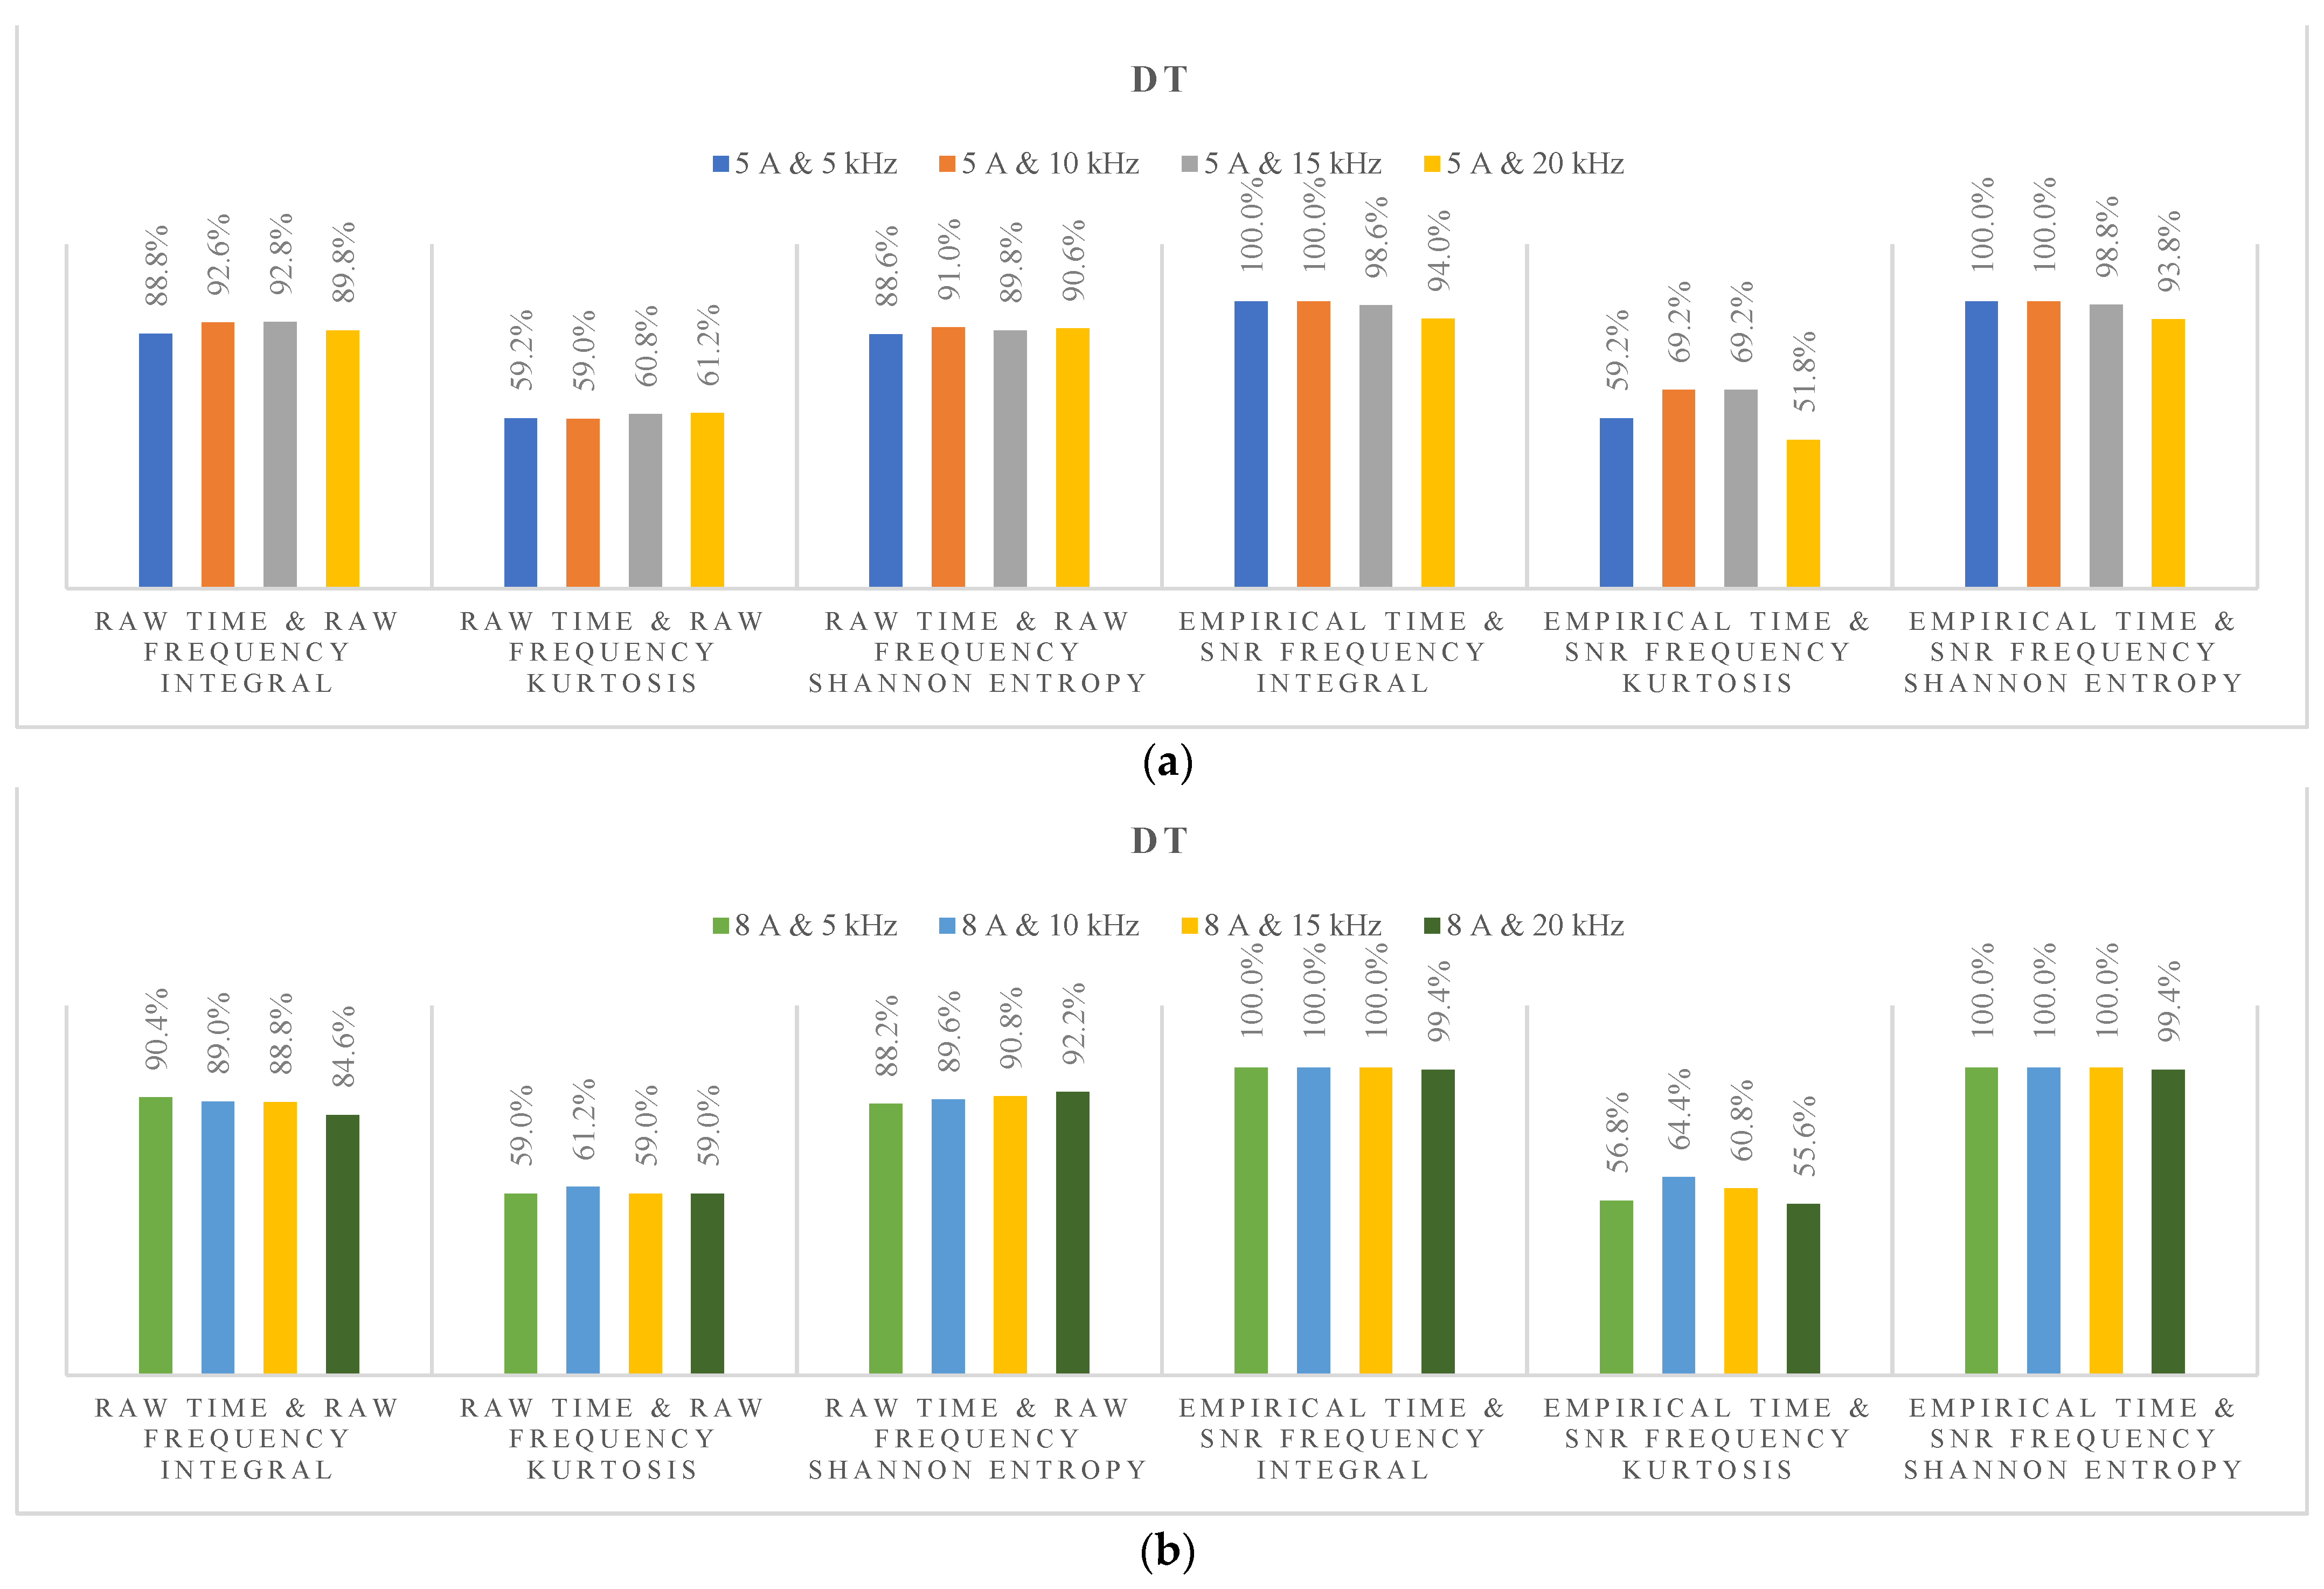
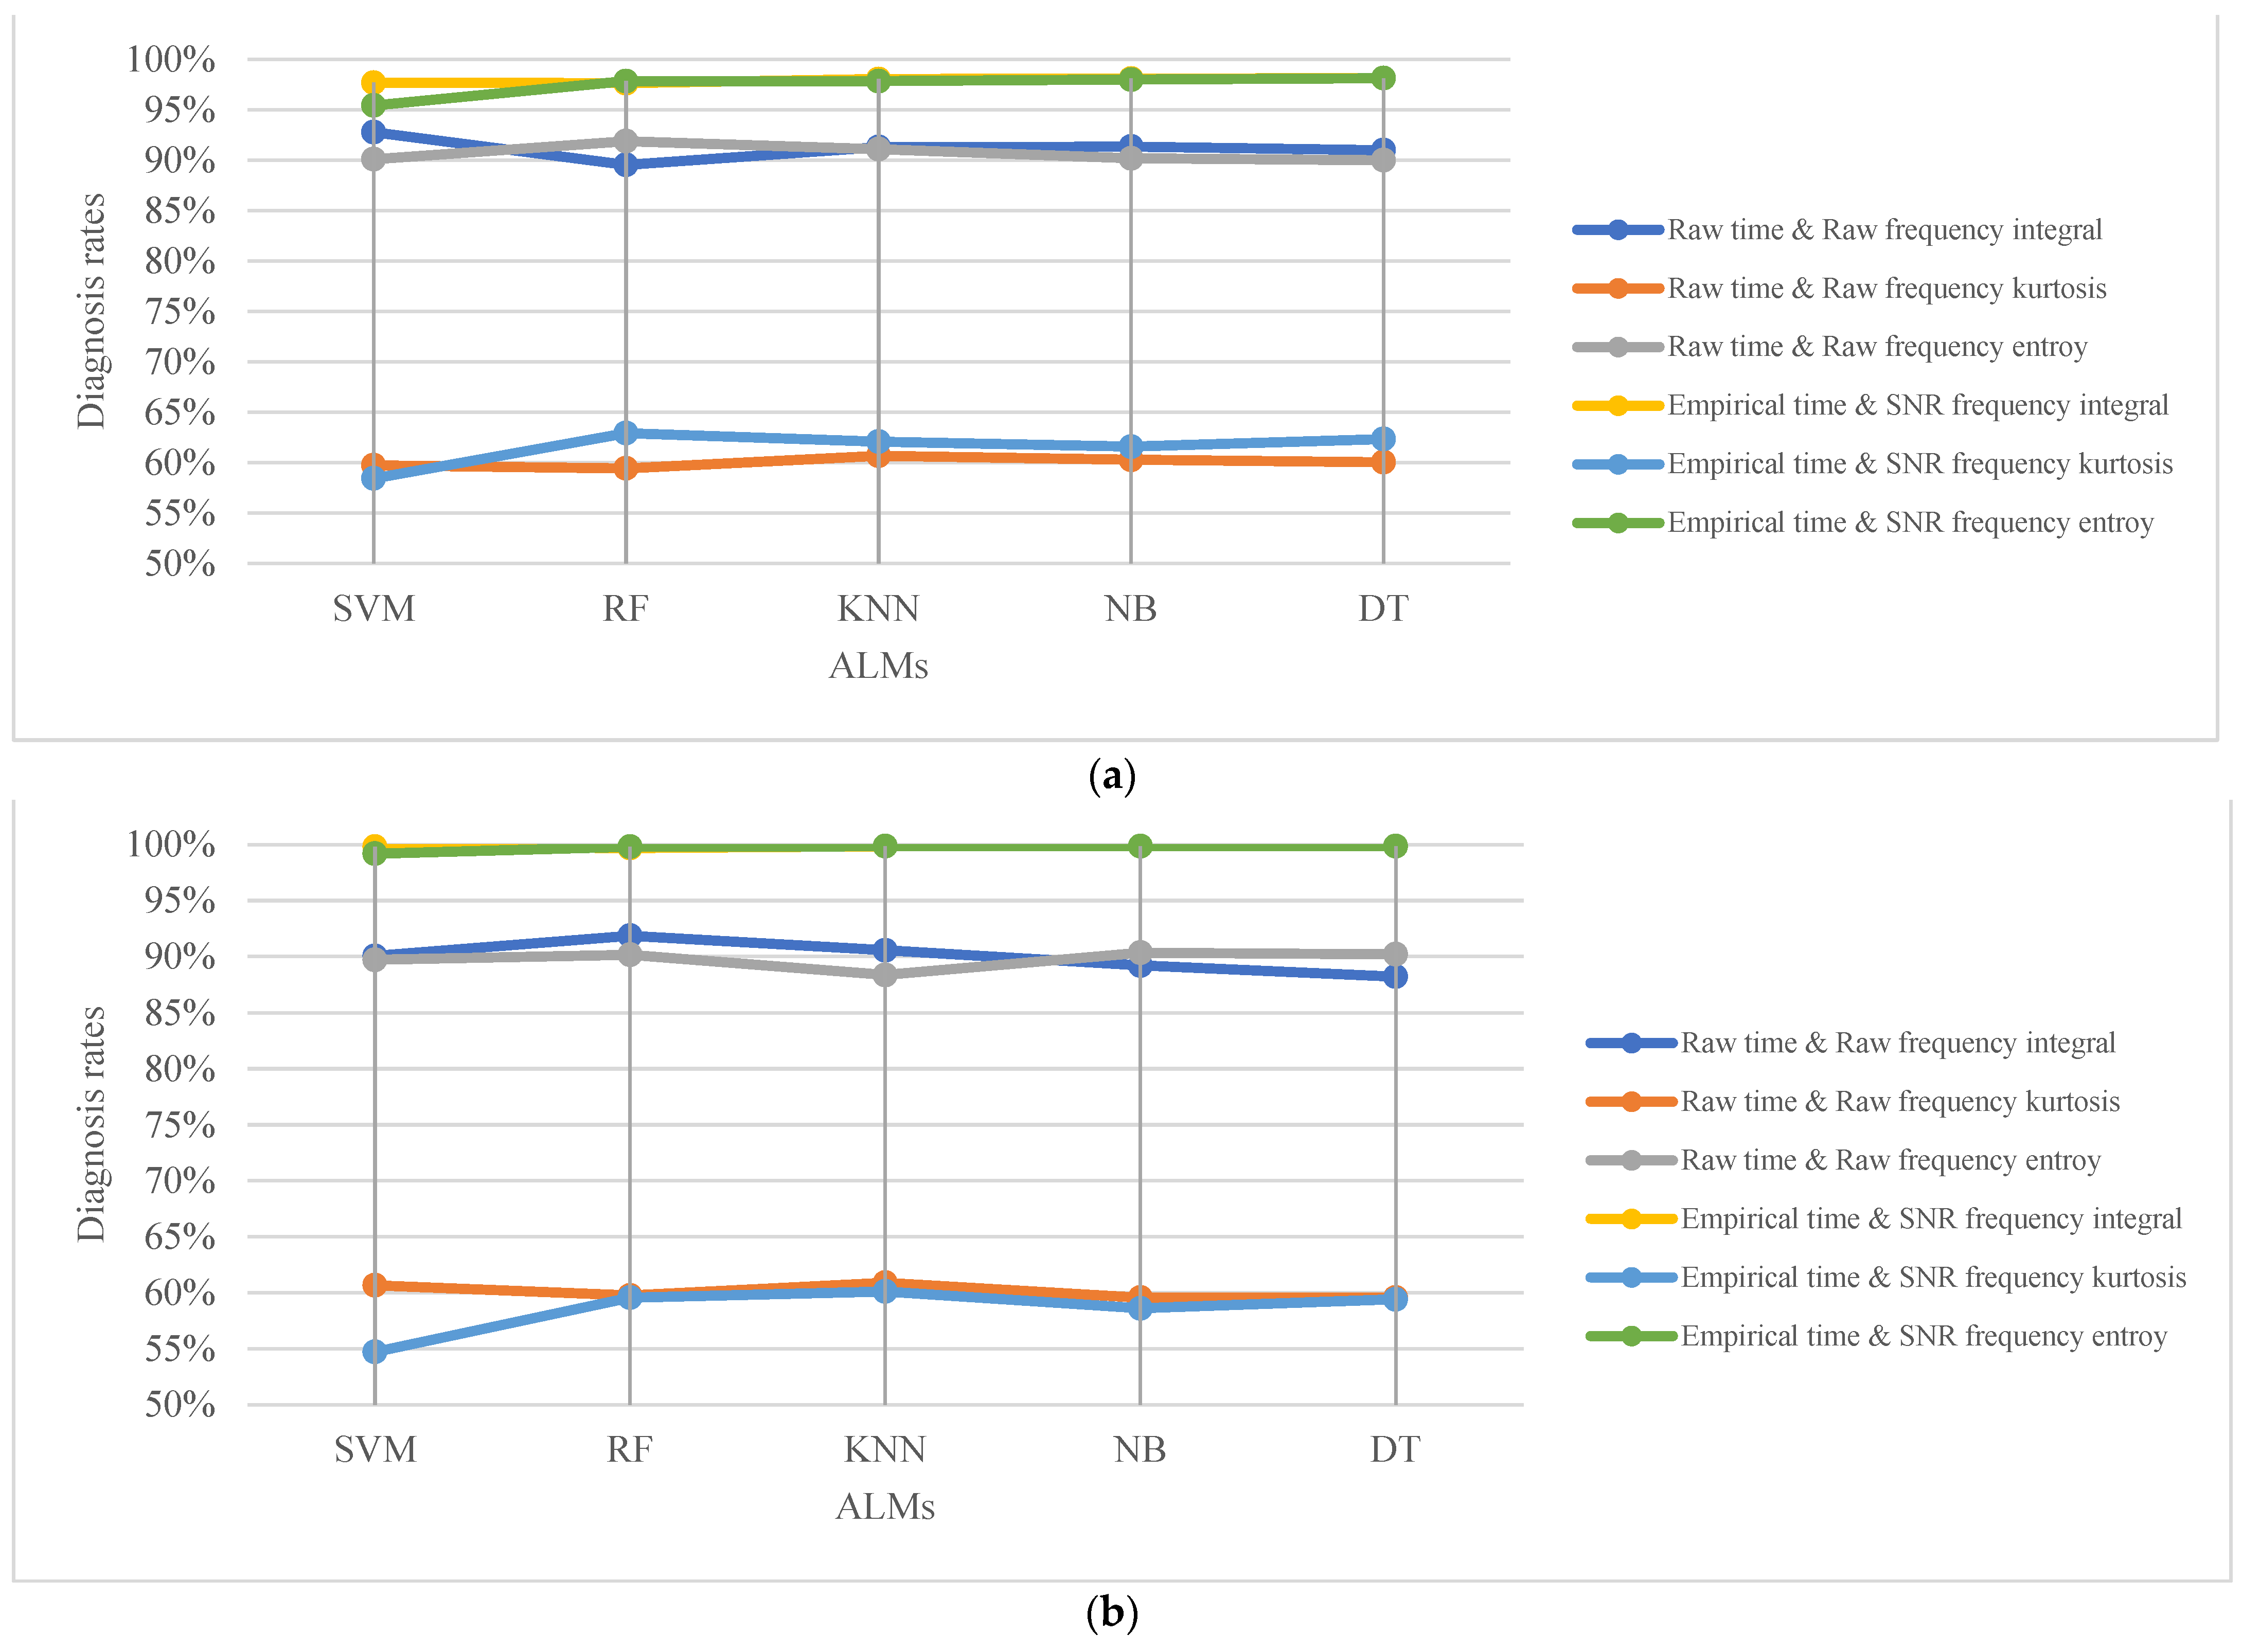
3.3. Artificial Learning Models (ALMs)

Table 1 presents the summary of all the ALMs used in this study. Support Vector Machines (SVMs) operate by finding a clear boundary (hyperplane) that separates data points into two or more distinct categories based on their features. This boundary, defined by a set of weights and biases, effectively separates data points belonging to different classes while maximizing the distance between them. The region between the hyperplane and the closest data points from each class is referred to as the margin, and maximizing this margin is crucial to achieving optimal classification performance [28]. K-Nearest Neighbors (KNN) first calculates the distance between the input data point and all other data points in the dataset. Based on the calculated distances, KNN selects the k data points closest to the input data point. These k data points are considered its neighbors. KNN then analyzes the class labels of the k neighbors and assigns the most frequent class label to the input data point. This process essentially implies that the input data point is classified based on the “vote” of its closest neighbors [29]. Decision Trees (DTs)’ core functionality lies in creating a model that makes predictions by learning a hierarchy of simple decision rules from the input features. This hierarchy is represented by a tree structure, where each node represents a decision based on a specific feature value and each branch represents a possible outcome. The DT starts with a single root node that encompasses the entire dataset. The root node is then recursively split into two or more child nodes based on the most informative feature at that level. The information gain, which measures the reduction in uncertainty about the class labels, is used to determine the most informative feature. At each node, a decision rule is created based on the chosen feature and a split point that maximizes information gain. This rule essentially divides the data into subsets based on the feature value. The process of splitting continues until a stopping criterion is met, such as reaching a maximum depth or achieving sufficient purity in each node. The resulting nodes at the bottom of the tree are called leaf nodes, each representing a final classification or regression prediction [30]. In contrast to single models, ensemble learning approaches leverage the collective wisdom of multiple models to achieve superior performance. This is accomplished by combining the predictions of diverse individual models, resulting in more accurate and reliable results than any individual model alone. One of the most widely used ensemble learning algorithms is the Random Forest (RF), which builds upon the foundation of DTs. RF operates by creating an ensemble of multiple DTs, each trained on a subset of the original data. The number of trees in an RF is a tunable hyperparameter, with larger forests generally leading to improved performance at the expense of increased computational cost. A common choice typically lies within the range of 100 to 1000 trees, striking a balance between accuracy and efficiency [31]. Naive Bayes (NB) is a probabilistic classifier that leverages Bayes’ theorem to make predictions. The term “Naive” refers to the simplifying assumption that all features are conditionally independent, meaning the presence or absence of one feature does not influence the presence or absence of any other feature. Initially, the prior probability of each class is determined. This represents the overall likelihood of encountering a data point belonging to each class before any specific features are considered. For each class, the conditional probability of observing the features given the class is calculated. This essentially measures the level of compatibility between the feature values and the specific class. Using Bayes’ theorem, the posterior probability of each class is computed based on the prior probability and the conditional probabilities. This final probability reflects the updated belief about the class membership of the data point after considering all observed features. The class with the highest posterior probability is ultimately assigned to the data point as the predicted class [32].

4. DC Series Arc Fault Diagnosis Based on Hybrid Time and Frequency Features Using Artificial Learning Models

Figure 5 illustrates the intricacies of the proposed diagnostic framework, designed to ensure accurate diagnoses of DC arc faults and the arc fault experimental setup. The process initiates with the sampling of continuous current data at an impressive rate of 250 kHz, capturing nuanced details within the signal. To facilitate efficient analysis and feature extraction, the collected data is then segmented into smaller subsets, each consisting of 200 data points, corresponding to a duration of 0.8 milliseconds. Before delving into further processing, an empirical filtering procedure is implemented to replace data points falling outside predefined ranges. This step is crucial for eliminating spurious noise and potential outliers that could otherwise impact the accuracy of the analysis. For each data segment, time-domain features are extracted twice—once with the application of the empirical filter and once without. This dual extraction strategy enables a comparative analysis, shedding light on the influence of filtering on the extracted features.
Concurrently, each data segment undergoes FFT analysis to delve into its spectral characteristics. Post FFT, a meticulous two-stage process isolates specific frequency elements within a designated FR. The careful selection of this FR ensures the capture of frequencies pertinent to arc-related phenomena. The extracted frequency components then undergo SNR processing, effectively eliminating the influence of switching noise and heightening the prominence of arc-related distortions. This rigorous process culminates in the generation of two sets of processed input indexes: one with SNR processing and one without. These indexes encapsulate refined information extracted from both the time and frequency domains. The processed time and frequency domain features, derived from both filtered and unfiltered data, serve as inputs for the deep learning models. This comprehensive information equips the models to effectively identify and classify arc faults. The proposed framework encompasses both training and testing phases, offering a robust evaluation of the model’s performance across diverse operational scenarios and varying data conditions. The combination of features from both the time and frequency domains, categorized into combinations of raw and filtered data, ensures a thorough exploration of diagnostic possibilities, enhancing the accuracy and reliability of DC arc fault detection.
Maintaining a balanced data distribution ratio between normal and arcing states is critical throughout the entire training and testing process. Consequently, there are a total of six distinct cases, with each case utilizing 3000 datasets for training and 2000 datasets for testing, resulting in a cumulative dataset of 18,000 for training and 12,000 for testing. This 1:1 ratio ensures that the model is exposed to an equal number of data points from both normal and arc states, preventing biases and promoting fair evaluation. This balance is crucial for ensuring the model’s ability to effectively discriminate between normal and arcing conditions with high accuracy. In this paper, the diagnosis results of the test data set are presented. The primary metric used to assess the performance of the ALMs in this context was accuracy. This metric provides a quantitative measure of the model’s ability to correctly identify and classify the state of the system, serving as a fundamental benchmark for performance evaluation. The accuracy metric is calculated as the percentage of correctly classified datasets out of the total number of datasets analyzed:
%   o f   C o r r e c t n e s s = #   o f   c o r r e c t l y   f o r e c a s t e d   d a t a s e t #   o f   t o t a l   e x a m i n a t i o n   d a t a s e t s
Figure 6 provides a captivating snapshot of the proposed arc fault diagnosis framework’s prowess in a three-phase inverter under diverse conditions. Integrating empirical filtering, SNR, and the SVM algorithm significantly enhanced arc fault detection accuracy across different current amplitudes (5 A and 8 A) and switching frequencies. The accuracy of arc fault detection consistently surpassed the baseline when utilizing features extracted from filtered signals compared to raw signals. This clearly indicates that the proposed filtering process successfully enhances the visibility of arc-related distortions within the data, leading to improved discriminative power for the SVM algorithm. Employing a combination of features preprocessed with both empirical filtering and SNR yielded a significant improvement in accuracy compared to using a combination of raw features alone. This observation highlights the synergy achieved by combining different feature sets, each capturing unique aspects of the arc phenomena, resulting in a more robust and comprehensive representation for effective classification. The proposed approach demonstrated consistent accuracy improvements across all tested switching frequencies, underscoring its effectiveness in mitigating the interference caused by switching events and enhancing the overall diagnostic performance. The integral and entropy features consistently outperformed Kurtosis in terms of accuracy, regardless of whether filtering techniques were employed or not. This finding suggests that integral and entropy capture more informative features for arc fault detection compared to Kurtosis. The enhanced accuracy gain achieved by the proposed approach was particularly evident for a current amplitude of 8 A. This suggests that the proposed technique is particularly effective in identifying arc faults at higher current levels, showcasing its robustness and applicability across diverse operational scenarios.
In Figure 7, the performance of the proposed arc fault diagnosis framework takes center stage for a three-phase inverter under diverse conditions. The integration of empirical filtering, SNR, and the RF algorithm substantially boosted the arc fault detection accuracy across varying current amplitudes (5 A and 8 A) and switching frequencies. The features extracted from filtered signals consistently yielded a higher arc fault detection accuracy compared to raw features. This clearly demonstrates the success of the proposed filtering process in enhancing the visibility of arc-related distortions within the data, leading to improved discriminative power for the RF algorithm. Combining features preprocessed with both empirical filtering and SNR resulted in a significant boost in accuracy compared to using raw features alone. This highlights the synergistic effect of combining diverse feature sets, each capturing unique aspects of the arc phenomena, leading to a more robust and comprehensive representation for effective classification. The proposed approach consistently improved accuracy across all tested switching frequencies. This underscores its effectiveness in mitigating the interference caused by switching events and enhancing the overall diagnostic performance. Regardless of filtering techniques employed, the integral and entropy features consistently outperformed Kurtosis in terms of accuracy. This suggests that integral and entropy capture more informative features for arc fault detection compared to Kurtosis. The enhanced accuracy gain achieved by the proposed approach is particularly pronounced at a current amplitude of 8 A. This points to the effectiveness of the proposed technique in identifying arc faults at higher current levels, showcasing its robustness and applicability across diverse operational scenarios.
Figure 8 spotlights the remarkable performance of the proposed arc fault diagnosis framework in a three-phase inverter under various conditions. The integration of empirical filtering, SNR, and the KNN algorithm significantly enhanced the arc fault detection accuracy across diverse current amplitudes (5 A and 8 A) and switching frequencies. The features extracted from filtered signals consistently demonstrated a superior arc fault detection accuracy compared to raw features. This clearly illustrates how the proposed filtering process successfully enhances the visibility of arc-related distortions within the data, leading to improved discriminative power for the KNN algorithm. Combining features preprocessed with both empirical filtering and SNR resulted in a significant increase in accuracy compared to using raw features alone. This observation underscores the synergistic effect of combining diverse feature sets, each capturing unique aspects of the arc phenomena, resulting in a more robust and comprehensive representation for effective classification. The proposed approach consistently improved the accuracy across all tested switching frequencies. This underscores its effectiveness in mitigating the interference caused by switching events and enhancing the overall diagnostic performance. Regardless of the filtering techniques employed, the integral and entropy features consistently outperformed Kurtosis in terms of accuracy. This suggests that integral and entropy capture more informative features for arc fault detection compared to Kurtosis. The enhanced accuracy gain achieved by the proposed approach was particularly evident at a current amplitude of 8 A. This indicates the effectiveness of the proposed technique in identifying arc faults at higher current levels, showcasing its robustness and applicability across diverse operational scenarios.
In Figure 9, the proposed arc fault diagnosis framework further solidifies its remarkable performance under diverse conditions for a three-phase inverter. The integration of empirical filtering, SNR, and the NB algorithm consistently boosted the arc fault detection accuracy across varying current amplitudes (5 A and 8 A) and switching frequencies. The features extracted from filtered signals demonstrably outperformed raw features in terms of arc fault detection accuracy. This clearly illustrates the success of the proposed filtering process in enhancing the visibility of arc-related distortions within the data, ultimately leading to improved discriminative power for the NB algorithm. Combining features preprocessed with both empirical filtering and SNR resulted in a significant boost in accuracy compared to using raw features alone. This emphasizes the synergistic effect of combining diverse feature sets, each capturing unique aspects of the arc phenomena, leading to a more robust and comprehensive representation for effective classification. The proposed approach exhibited consistent accuracy improvements across all tested switching frequencies. This underscores its effectiveness in mitigating the interference caused by switching events and enhancing the overall diagnostic performance. Regardless of the filtering techniques employed, the integral and entropy features consistently outperformed Kurtosis in terms of accuracy. This suggests that integral and entropy capture more informative features for arc fault detection compared to Kurtosis. The enhanced accuracy gain achieved by the proposed approach was particularly pronounced at a current amplitude of 8 A. This indicates the effectiveness of the proposed technique in identifying arc faults at higher current levels, showcasing its robustness and applicability across diverse operational scenarios.
Figure 10 reinforces the remarkable performance of the proposed arc fault diagnosis framework across diverse operating conditions for a three-phase inverter. The integration of the proposed framework with empirical filtering, SNR, and the DT algorithm consistently boosted the arc fault detection accuracy under varying current amplitudes (5 A and 8 A) and switching frequencies. The features extracted from filtered signals demonstrably outperformed raw features in terms of arc fault detection accuracy. This clearly demonstrates the success of the proposed filtering process in enhancing the visibility of arc-related distortions within the data, leading to improved discriminative power for the DT algorithm. Combining features preprocessed with both empirical filtering and SNR resulted in a significant boost in accuracy compared to using raw features alone. This emphasizes the synergistic effect of combining diverse feature sets, each capturing unique aspects of the arc phenomena, leading to a more robust and comprehensive representation for effective classification. The proposed approach exhibited consistent accuracy improvements across all tested switching frequencies. This underscores its effectiveness in mitigating the interference caused by switching events and enhancing the overall diagnostic performance. Regardless of the filtering techniques employed, the integral and entropy features consistently outperformed Kurtosis in terms of accuracy. This suggests that integral and entropy capture more informative features for arc fault detection compared to Kurtosis. The enhanced accuracy gain achieved by the proposed approach was particularly pronounced at a current amplitude of 8 A. This indicates the effectiveness of the proposed technique in identifying arc faults at higher current levels, showcasing its robustness and applicability across diverse operational scenarios.
Figure 11 offers a compelling analysis of the performance achieved by the various ALMs in the challenging domain of DC arc fault detection. The combination of empirical filtering and SNR consistently demonstrated superior performance across diverse input scenarios. This suggests that these two preprocessing techniques synergistically enhance the information content of the data, leading to improved diagnostic accuracy for the ALMs. This finding emphasizes the value of integrating seemingly simple techniques like SNR alongside advanced approaches like empirical filtering for optimal results. Among the ALMs evaluated, RF consistently emerged as the top performer, regardless of the input data or switching frequencies. This remarkable consistency underscores the robust capabilities of RF for DC arc fault detection. Its ability to adapt and provide accurate diagnoses under diverse conditions makes it a well-suited candidate for real-world applications in arc fault detection systems. The proposed DC arc fault diagnosis approach, which leverages the combined strength of empirical filtering, SNR, and the RF algorithm, consistently outperformed the various alternative techniques. This showcases its potential to significantly enhance the accuracy of DC arc fault detection across diverse scenarios. This research makes a significant contribution to the field of electrical system safety by addressing the critical concern of DC arc faults, which can pose substantial risks in various applications. The observed behavior of the filtering method based on Kurtosis, showing inferior performance compared to other methods, can be attributed to the distinctive characteristics of Kurtosis in both the time and frequency domains. In the time domain, the Kurtosis feature does not exhibit clear differentiation between normal and arcing states. The variations are less pronounced, diminishing its effectiveness as a discriminative feature. The overlap in Kurtosis values for both states suggests that relying solely on this feature might not provide sufficient discriminatory power for accurate classification. This lack of clarity in distinguishing between normal and arcing states in the time domain contributes to the suboptimal performance of the Kurtosis-based filtering method. Similarly, in the frequency domain, the Kurtosis feature presents less pronounced variations between normal and arcing states compared to integral and entropy features. This indicates that Kurtosis may not be as effective in capturing crucial distinctions between the two states. The reduced sensitivity of Kurtosis to the specific characteristics of arc-related phenomena contributes to its lower performance in enhancing the visibility of arc distortions during the filtering process. In summary, the explanation for the observed inferior performance of the Kurtosis-based filtering method lies in the inherent limitations of Kurtosis in capturing the nuanced differences between normal and arcing states, in both the time and frequency domains. The effectiveness of a filtering method is highly dependent on the discriminative power of the features it utilizes, and in this specific context, Kurtosis appears to be less adept at capturing the relevant patterns indicative of arc faults. This study presents a noteworthy contribution to the realm of electrical system safety, focusing on the pivotal issue of DC arc faults that can pose significant risks in diverse applications. In summary, the results depicted in Figure 11 highlight the efficacy of the proposed DC arc fault diagnosis approach. The amalgamation of empirical filtering, SNR, and the RF algorithm emerges as a potent strategy for achieving highly accurate and robust detection of arc faults, thereby making a substantial contribution to the safety and reliability of electrical systems.
Table 2 presents an overview of the detection accuracy achieved by the various approaches, including DAFD [33], TL-LEDArcNet [34], and DA-DCGAN [35], which exhibited accuracies of 95.76%, 95.8%, and 98.5%, respectively. In comparison, the proposed approach achieved an overall detection accuracy of 98.2%. Notably, the structures of the alternative approaches are characterized by complexity and the processing of extensive datasets, contrasting with the proposed approach. This distinction arises from the comprehensive utilization of both the time and frequency domains in our study. The inclusion of features from the time domain plays a pivotal role in ensuring that ALMs maintain a consistently high level of accuracy.

5. Conclusions

This research tackles the complex challenge of detecting DC arc faults with an innovative approach, leveraging the synergistic power of empirical filtering, SNR, and ALMs. Empirical filtering plays a pivotal role in enhancing signal clarity, making arc distortions significantly more visible. The SNR method further amplifies signal clarity, accentuating arc distortions under various conditions, including different current scales and switching rates. This noise reduction minimizes false positives, contributing to a more reliable detection system. This improvement remains consistent across a wide range of switching frequencies (3 kHz to 30 kHz), highlighting the importance of this specific frequency range selection. The combined power of the empirical filtering index and the SNR filtering feature significantly boosted the accuracy of all ALMs. This synergy not only improved diagnostic accuracy but also enhanced the ability to distinguish arc-related distortions. While the integral and entropy features demonstrated consistent, aligned patterns, the Kurtosis feature failed to provide a clear distinction between normal and arcing states. This emphasizes the need for diverse feature sets, carefully chosen based on their effectiveness in discriminating between operating conditions, to achieve optimal performance in arc fault detection systems. Notably, RF consistently stood out as a top-performing ALM. These models exhibited robust diagnostic capabilities, achieving the highest diagnosis rates regardless of input data variations, current amplitudes, or switching frequencies. This collective success confirms the potential of the proposed approach to significantly enhance the safety and reliability of electrical systems.

Author Contributions

Conceptualization, S.K. and S.C.; methodology, S.K. and S.C.; software, H.-L.D.; validation, H.-L.D.; formal analysis, S.K.; investigation, H.-L.D.; resources, S.K.; data curation, H.-L.D.; writing—original draft preparation, H.-L.D.; writing—review and editing, S.K. and S.C.; visualization, H.-L.D.; supervision, S.K.; project administration, S.K.; funding acquisition, S.K. All authors have read and agreed to the published version of the manuscript.

Funding

This work was supported by a National Research Foundation of Korea (NRF) grant funded by the Korea government (MSIT) (2020R1A2C1013413).

Data Availability Statement

Data are contained within the article.

Conflicts of Interest

The authors declare no conflicts of interest.

References

  1. Yin, Z.; Wang, L.; Yang, S.; Gao, Y. A Series Arc Fault Diagnosis Method in DC Distribution Systems Based on Multiscale Features and Random Forests. IEEE Sens. J. 2022, 23, 2605–2617. [Google Scholar] [CrossRef]
  2. Xing, L.; Wen, Y.; Xiao, S.; Zhang, D.; Zhang, J. A Deep Learning Approach for Series DC Arc Fault Diagnosing and Real-Time Circuit Behavior Predicting. IEEE Trans. Electromagn. Compat. 2021, 64, 569–579. [Google Scholar] [CrossRef]
  3. Jalil, M.; Samet, H.; Ghanbari, T.; Tajdinian, M. Development of Nottingham Arc Model for DC Series Arc Modeling in Photovoltaic Panels. IEEE Trans. Ind. Electron. 2021, 69, 13647–13655. [Google Scholar] [CrossRef]
  4. Yao, X.; Herrera, L.; Wang, J. Impact evaluation of series dc arc faults in dc microgrids. In Proceedings of the 2015 IEEE Applied Power Electronics Conference and Exposition (APEC), Charlotte, NC, USA, 15–19 March 2015; pp. 2953–2958. [Google Scholar]
  5. Yao, X. Study on DC arc faults in ring-bus DC microgrids with constant power loads. In Proceedings of the 2016 IEEE Energy Conversion Congress and Exposition (ECCE), Milwaukee, WI, USA, 18–22 September 2016; pp. 1–5. [Google Scholar]
  6. Pillai, D.S.; Rajasekar, N. A comprehensive review on protection challenges and fault diagnosis in PV systems. Renew. Sustain. Energy Rev. 2018, 91, 18–40. [Google Scholar] [CrossRef]
  7. Xiang, W.; Yang, S.; Adam, G.P.; Zhang, H.; Zuo, W.; Wen, J. DC Fault Protection Algorithms of MMC-HVDC Grids: Fault Analysis, Methodologies, Experimental Validations, and Future Trends. IEEE Trans. Power Electron. 2021, 36, 11245–11264. [Google Scholar] [CrossRef]
  8. Ahn, J.-B.; Jo, H.-B.; Ryoo, H.-J. Real-Time DC Series Arc Fault Detection Based on Noise Pattern Analysis in Photovoltaic System. IEEE Trans. Ind. Electron. 2022, 70, 10680–10689. [Google Scholar] [CrossRef]
  9. Chen, S.; Wu, H.; Meng, Y.; Wang, Y.; Li, X.; Zhang, C. Reliable Detection Method of Variable Series Arc Fault in Building Integrated Photovoltaic Systems Based on Nonstationary Time Series Analysis. IEEE Sens. J. 2023, 23, 8654–8664. [Google Scholar] [CrossRef]
  10. Georgijevic, N.L.; Jankovic, M.V.; Srdic, S.; Radakovic, Z. The Detection of Series Arc Fault in Photovoltaic Systems Based on the Arc Current Entropy. IEEE Trans. Power Electron. 2015, 31, 5917–5930. [Google Scholar] [CrossRef]
  11. Rabla, M.; Tisserand, E.; Schweitzer, P.; Lezama, J. Arc Fault Analysis and Localisation by Cross-Correlation in 270 V DC. In Proceedings of the 2013 IEEE 59th Holm Conference on Electrical Contacts (Holm 2013), Newport, RI, USA, 22–25 September 2013; pp. 1–6. [Google Scholar]
  12. Yao, X.; Herrera, L.; Ji, S.; Zou, K.; Wang, J. Characteristic Study and Time-Domain Discrete- Wavelet-Transform Based Hybrid Detection of Series DC Arc Faults. IEEE Trans. Power Electron. 2013, 29, 3103–3115. [Google Scholar] [CrossRef]
  13. Wang, Z.; Balog, R.S. Arc fault and flash detection in photovoltaic systems using wavelet transform and support vector machines. In Proceedings of the 2016 IEEE 43rd Photovoltaic Specialists Conference (PVSC), Portland, OR, USA, 5–10 June 2016; pp. 3275–3280. [Google Scholar]
  14. He, C.; Mu, L.; Wang, Y. The Detection of Parallel Arc Fault in Photovoltaic Systems Based on a Mixed Criterion. IEEE J. Photovolt. 2017, 7, 1717–1724. [Google Scholar] [CrossRef]
  15. Zhu, H.; Wang, Z.; Balog, R.S. Real time arc fault detection in PV systems using wavelet decomposition. In Proceedings of the 2016 IEEE 43rd Photovoltaic Specialists Conference (PVSC), Portland, OR, USA, 5–10 June 2016; pp. 1761–1766. [Google Scholar]
  16. Gajula, K.; Herrera, L. Detection and Localization of Series Arc Faults in DC Microgrids Using Kalman Filter. IEEE J. Emerg. Sel. Top. Power Electron. 2020, 9, 2589–2596. [Google Scholar] [CrossRef]
  17. Li, W.; Liu, Y.; Li, Y.; Guo, F. Series Arc Fault Diagnosis and Line Selection Method Based on Recurrent Neural Network. IEEE Access 2020, 8, 177815–177822. [Google Scholar] [CrossRef]
  18. Jalayer, M.; Orsenigo, C.; Vercellis, C. Fault detection and diagnosis for rotating machinery: A model based on convolutional LSTM, Fast Fourier and continuous wavelet transforms. Comput. Ind. 2020, 125, 103378. [Google Scholar] [CrossRef]
  19. Thakur, K.; Dwivedi, D.; Babu, K.; Parimi, A.M.; Yemula, P.K.; Chakraborty, P.; Pal, M. Advancements in Arc Fault Detection for Electrical Distribution Systems: A Comprehensive Review from Artificial Intelligence Perspective. arXiv 2023, arXiv:2311.16804. [Google Scholar]
  20. Dang, H.-L.; Kwak, S.; Choi, S. DC Series Arc Failure Diagnosis Using Artificial Machine Learning With Switching Frequency Component Elimination Technique. IEEE Access 2023, 11, 119584–119595. [Google Scholar] [CrossRef]
  21. Dang, H.-L.; Kwak, S.; Choi, S. Empirical Filtering-Based Artificial Intelligence Learning Diagnosis of Series DC Arc Faults in Time Domains. Machines 2023, 11, 968. [Google Scholar] [CrossRef]
  22. Dang, H.-L.; Kwak, S.; Choi, S. Different Domains Based Machine and Deep Learning Diagnosis for DC Series Arc Failure. IEEE Access 2021, 9, 166249–166261. [Google Scholar] [CrossRef]
  23. Pukelsheim, F. The Three Sigma Rule; The American Statistician: Alexandria, VA, USA, 1994; Volume 48, pp. 88–91. [Google Scholar]
  24. Gu, J.-C.; Lai, D.-S.; Wang, J.-M.; Huang, J.-J.; Yang, M.-T. Design of a DC Series Arc Fault Detector for Photovoltaic System Protection. IEEE Trans. Ind. Appl. 2019, 55, 2464–2471. [Google Scholar] [CrossRef]
  25. UL 1699B; Outline of Investigation for Photovoltaic (PV) dc Arc-Fault Circuit Protection, Issue 2. Underwriters Laboratories, Inc.: Northbrook, IL, USA, 2013.
  26. Borges, F.A.; Fernandes, R.A.; Silva, I.N.; Silva, C.B.S. Feature Extraction and Power Quality Disturbances Classification Using Smart Meters Signals. IEEE Trans. Ind. Inform. 2015, 12, 824–833. [Google Scholar] [CrossRef]
  27. Wang, Y.; Zhang, F.; Zhang, X.; Zhang, S. Series AC Arc Fault Detection Method Based on Hybrid Time and Frequency Analysis and Fully Connected Neural Network. IEEE Trans. Ind. Inform. 2018, 15, 6210–6219. [Google Scholar] [CrossRef]
  28. Boser, B.E.; Guyon, I.M.; Vapnik, V.N. A training algorithm for optimal margin classifiers. In Proceedings of the Fifth Annual Workshop on Computation Learning Theory (COLT’92), Pittsburgh, PA, USA, 27–29 July 1992; pp. 144–152. [Google Scholar]
  29. Cover, T.; Hart, P. Nearest neighbor pattern classification. IEEE Trans. Inf. Theory 1967, 13, 21–27. [Google Scholar] [CrossRef]
  30. Breiman, L.; Friedman, J.; Olshen, R.; Stone, C. Classification and Regression Trees; Statistics/Probability Series; Wadsworth and Brooks: Belmont, CA, USA, 1984. [Google Scholar]
  31. Breiman, L. Random forests. Mach. Learn. 2001, 45, 5–32. [Google Scholar] [CrossRef]
  32. Langley, P.; Iba, W.; Thompson, K. An analysis of Bayesian classifiers. In Proceedings of the 10th National Conference on Artificial Intelligence, San Jose, CA, USA, 12–16 July 1992; pp. 223–228. [Google Scholar]
  33. Lu, W.; Liang, B.; Cheng, Y.; Meng, D.; Yang, J.; Zhang, T. Deep Model Based Domain Adaptation for Fault Diagnosis. IEEE Trans. Ind. Electron. 2016, 64, 2296–2305. [Google Scholar] [CrossRef]
  34. Sung, Y.; Yoon, G.; Bae, J.-H.; Chae, S. TL–LEDarcNet: Transfer Learning Method for Low-Energy Series DC Arc-Fault Detection in Photovoltaic Systems. IEEE Access 2022, 10, 100725–100735. [Google Scholar] [CrossRef]
  35. Lu, S.; Sirojan, T.; Phung, B.T.; Zhang, D.; Ambikairajah, E. DA-DCGAN: An Effective Methodology for DC Series Arc Fault Diagnosis in Photovoltaic Systems. IEEE Access 2019, 7, 45831–45840. [Google Scholar] [CrossRef]
Figure 1. Arc generation specifications.
Machines 12 00102 g001
Figure 2. Current analysis at 5 A and switching frequency of 15 kHz in time and frequency domains.
Machines 12 00102 g002
Figure 3. Empirical filtering features at 5 A current amplitude and 15 kHz. (a) Integral. (b) Kurtosis. (c) Entropy.
Machines 12 00102 g003
Figure 4. Switching noise removal filtering features at 5 A and 15 kHz. (a) Integral. (b) Kurtosis. (c) Entropy.
Machines 12 00102 g004
Figure 5. The diagnosis of DC series arc fault using hybrid features and ALMs. (a) Workflow diagram. (b) The arc fault experimental setup.
Machines 12 00102 g005
Figure 6. The detection rates of SVM under different current amplitudes and switching frequencies. (a) Three-phase DC–AC converter load at 5 A. (b) Three-phase DC–AC converter load at 8 A.
Machines 12 00102 g006
Figure 7. The detection rates of RF under different current amplitudes and switching frequencies. (a) Three-phase DC–AC converter load at 5 A. (b) Three-phase DC–AC converter load at 8 A.
Machines 12 00102 g007
Figure 8. The detection rates of KNN under different current amplitudes and switching frequencies. (a) Three-phase DC–AC converter load at 5 A. (b) Three-phase DC–AC converter load at 8 A.
Machines 12 00102 g008
Figure 9. The detection rates of NB under different current amplitudes and switching frequencies. (a) Three-phase DC–AC converter load at 5 A. (b) Three-phase DC–AC converter load at 8 A.
Machines 12 00102 g009
Figure 10. The detection rates of DT under different current amplitudes and switching frequencies. (a) Three-phase DC–AC converter load at 5 A. (b) Three-phase DC–AC converter load at 8 A.
Machines 12 00102 g010
Figure 11. The overall detection rates of ALMs under various inputs. (a) Three-phase DC–AC converter load at 5 A. (b) Three-phase DC–AC converter load at 8 A.
Machines 12 00102 g011
Table 1. The core principles of artificial learning models.
ALMsSVMKNNDTRFNB
Core principlesFinding the hyperplane that maximizing the margin between classes.Similar things are possess neighboring closeness. A tree structure starts with a root node and ends with a decision made by leaves. Consists of many individual decision trees that operate as an ensemble. Based on Bayes’ theorem with assumption that all features are conditionally independent.
Table 2. Comparison of various diagnosis approaches.
ApproachInput Domain(s)Data SizeLearning Type—Structure ComplexityOverall Accuracy
DAFD [33]Time domainLargeDeep learning—High95.76%
TL-LEDArcNet [34]Time and frequency domainsLargeDeep learning—High 95.8%
DA-DCGAN [35]Time domainLargeDeep learning—High98.5%
Proposed methodTime and frequency domainsSmallMachine learning—Medium98.2%
Disclaimer/Publisher’s Note: The statements, opinions and data contained in all publications are solely those of the individual author(s) and contributor(s) and not of MDPI and/or the editor(s). MDPI and/or the editor(s) disclaim responsibility for any injury to people or property resulting from any ideas, methods, instructions or products referred to in the content.

