1. Introduction
Due to the increasing demands for the development and innovation of new products in the markets, all industrial enterprises must deal with the issue of technical preparation of production. The pre-production phase is an important phase of the product life cycle, as it influences the costs of the other life stages of the product [
1,
2]. Up to 80% of production costs can be most influenced in the pre-production stages. In these stages, according to [
3,
4], up to 75% of the various errors that affect product quality, production time, and cost of production also occur. Furthermore, these stages usually involve project-driven activities, which are unique and therefore entail a high level of risk [
5]. The technical preparation of production can be influenced by the nature of the workplace and the production process as a whole [
6]. The importance of this stage is further enhanced by the high turnover rate and the proportion of foreign workers in industrial enterprises. It is important to address the appropriate training of employees and the form of instructions for new products, as an organized introduction to the process reduces the negative effects of environmental change [
7].
The current trend is to move away from paper manuals [
8]. Digitized manuals lead to better overall results and a reduction in errors [
9]. Some workers may need additional support that a conventional digital manual may not provide [
10]. For this reason, interactive digital tutorials are coming to the fore, which may be in the form of video, augmented reality or virtual reality [
11]. These tutorials can respond appropriately to the needs of the trainee and improve their overall effectiveness [
12].
Video tutorials were found to be beneficial and serve as a useful support tool for practical learning [
13]. Several factors determine the quality of a video tutorial such as the instructor’s behavior and visual presence, content, scene and other factors [
14]. A video recording of the manual assembly process is a simple approach for creating assembly instructions to teach assembly procedures to untrained workers [
15]. Workers working from video instructions are more successful in completing the task than workers working from paper instructions [
16] and at the same time, workers’ confidence in their abilities may increase [
17].
Augmented reality (AR) is interactive and combines real and virtual objects [
18]. The interactivity brought by this technology is one of the key factors to improve process flexibility and is also a tool to influence the quality and quantity of production [
19]. The behavioral effects of AR instructions stood out more in a complex task than in a simple task [
20]. Augmented reality tutorials are also suitable for assembling small parts [
21] and the difficulty of the tutorial can be adapted to the experience level of the trainee [
22]. An alternative use of augmented reality is to display it through a mobile app and project the AR onto the operator’s mobile phone display [
23]. This restricts the worker’s upper limb movement, so the display is often head-mounted (head-mounted system) [
24]. With the combination of a head-mounted display and augmented reality, instructors can dynamically place the display and annotations on the physical environment in the worker’s field of view during maintenance and repair, thereby instructing workers from anywhere [
25]. However, research comparing a video call with an expert to an augmented reality tutorial showed that most interviewees preferred the AR tutorial to a video call with a trainer [
26]. The development of augmented reality tutorials is currently quite a lengthy and challenging process [
27,
28]. Within the service and maintenance, it is possible to observe many global applications that are implemented using an indirect view, i.e., for example, using a tablet or a mobile phone. For direct view applications, for example using semi-transparent glasses (e.g., MS Hololens 2), we face many technological limitations. It seems that the use of glasses that mediate the final image by means of cameras (e.g., Meta Quest 3) may be the right way forward, but here we can face legislative restrictions (from an occupational safety point of view, it is usually not possible to work with opaque glasses). Within the research on the use of augmented reality in service and maintenance, a number of scientific studies confirm that this direction promises great innovations. (e.g., [
29,
30,
31]).
Virtual reality is computer-generated simulation of an immersive and interactive environment that can be experienced by individuals using specialized hardware, such as VR headsets or goggles. In a virtual reality environment, users are surrounded by three-dimensional (3D) visuals. Virtual reality environments can help increase user creativity levels [
32]. The use of virtual reality (VR) to create instructions and assembly procedures has already been addressed in several papers [
33,
34]. Results have shown that there is a lack of evaluation methods applicable to industrial practice and it is difficult to obtain feedback, although there are methods aimed at learning effects [
35]. Furthermore, it was found that virtual reality does not help to acquire motor skills [
36] and is more suitable for workflow training [
37]. The simplified representation of work steps as well as the lack of multimodal stimuli during VR training negatively affect learning [
38]. Thus, it is important to maintain a high level of immersion [
39] and training is de-tuned from distracting errors by the trainee [
40]. In an experiment comparing paper tutorials, video tutorials, augmented reality, and virtual reality under constrained conditions, it was found that augmented reality led to the most satisfactory task performance [
41].
Digital work instructions can be partially generated using artificial intelligence from CAD model BOMs (Bill of Material) [
42] or a BOM of a recognized object can be generated [
43,
44]. Several tests of the automatic generation of augmented reality generated product assembly workflows have been performed, showing that it is possible, albeit with technological limitations, to machine-generate an augmented reality instruction manual [
45]. However, in the sources studied, no dependency was found between the use of advanced visualization tools in the context of technical production preparation and the nature of the production processes [
46,
47] (there are only partial studies that are limited to limited aspects, namely under laboratory conditions, e.g., [
48]). This is because manufacturing processes have many parameters (e.g., [
49]) that could have a major influence on whether it is appropriate to use modern tools for a particular manufacturing process, or which tool is more suitable for a given process [
50]. No methodology has been found that provides recommendations on whether the use of modern tools for instructional design is appropriate under given conditions, or which type of instructional design would be most suitable for a given process [
51]. From the literature studied, it was found that the complexity of the different stages of technical preparation for production is increasing, while at the same time the emphasis is on the rapid implementation of this pre-production phase. Companies that have a well-developed pre-production phase are at an advantage [
52]. To ensure the efficiency of production execution, modern tools that can work with virtual (physically non-existent) objects can be used [
53]. This approach would allow parallel execution of the different stages of technical preparation of production, which would have a positive impact on saving time [
54].
Although we have several types of modern visualization tools at our disposal, it is not always clear when these tools can be used for specific production processes in order to make the organizational preparation of production more efficient [
55]. At the same time, the question of which type of visualization tools should be selected and possibly combined under predefined conditions is not answered [
56]. In practice, then, it seems that companies are pushed into continuously rationalizing their production processes and deploying modern methods, techniques, and tools that are expected to help. However, we often see the opposite effect [
57]. Enterprises deploy one of the modern visualization tools without knowing the main added value and limitations of this tool.
Therefore, the main objective of this study is to create a methodology for the rationalization of the implementation of production instructions within the technical preparation of production. In order to achieve this goal, several sub-objectives need to be met:
Divide the process of designing the methodology into preparation, decision-making, evaluation and implementation phases;
Assess the relationship between the nature of manufacturing processes and visualization tools to rationalization of production execution;
Build a criterion function for evaluating the suitability of visualization tools with respect to the nature of production;
Define parameters that affect how visualization tools are used;
Develop a methodology for selecting a tool that optimally streamlines processes in preparation for production execution, distinguishing between usability and suitability based on external factors;
Verification.
The following hypotheses emerged from the main objective and the individual sub-objectives which will be tested:
There is a dependency between the choice of visualization tools for the creation of instructions for the organizational preparation of production and the nature of the production processes;
According to the characteristics of the production process, it can be assessed whether the use of modern visualization tools is suitable;
The proposed methodology can be used to select the appropriate type of visualization tool for a specific manufacturing process.
2. Materials and Methods
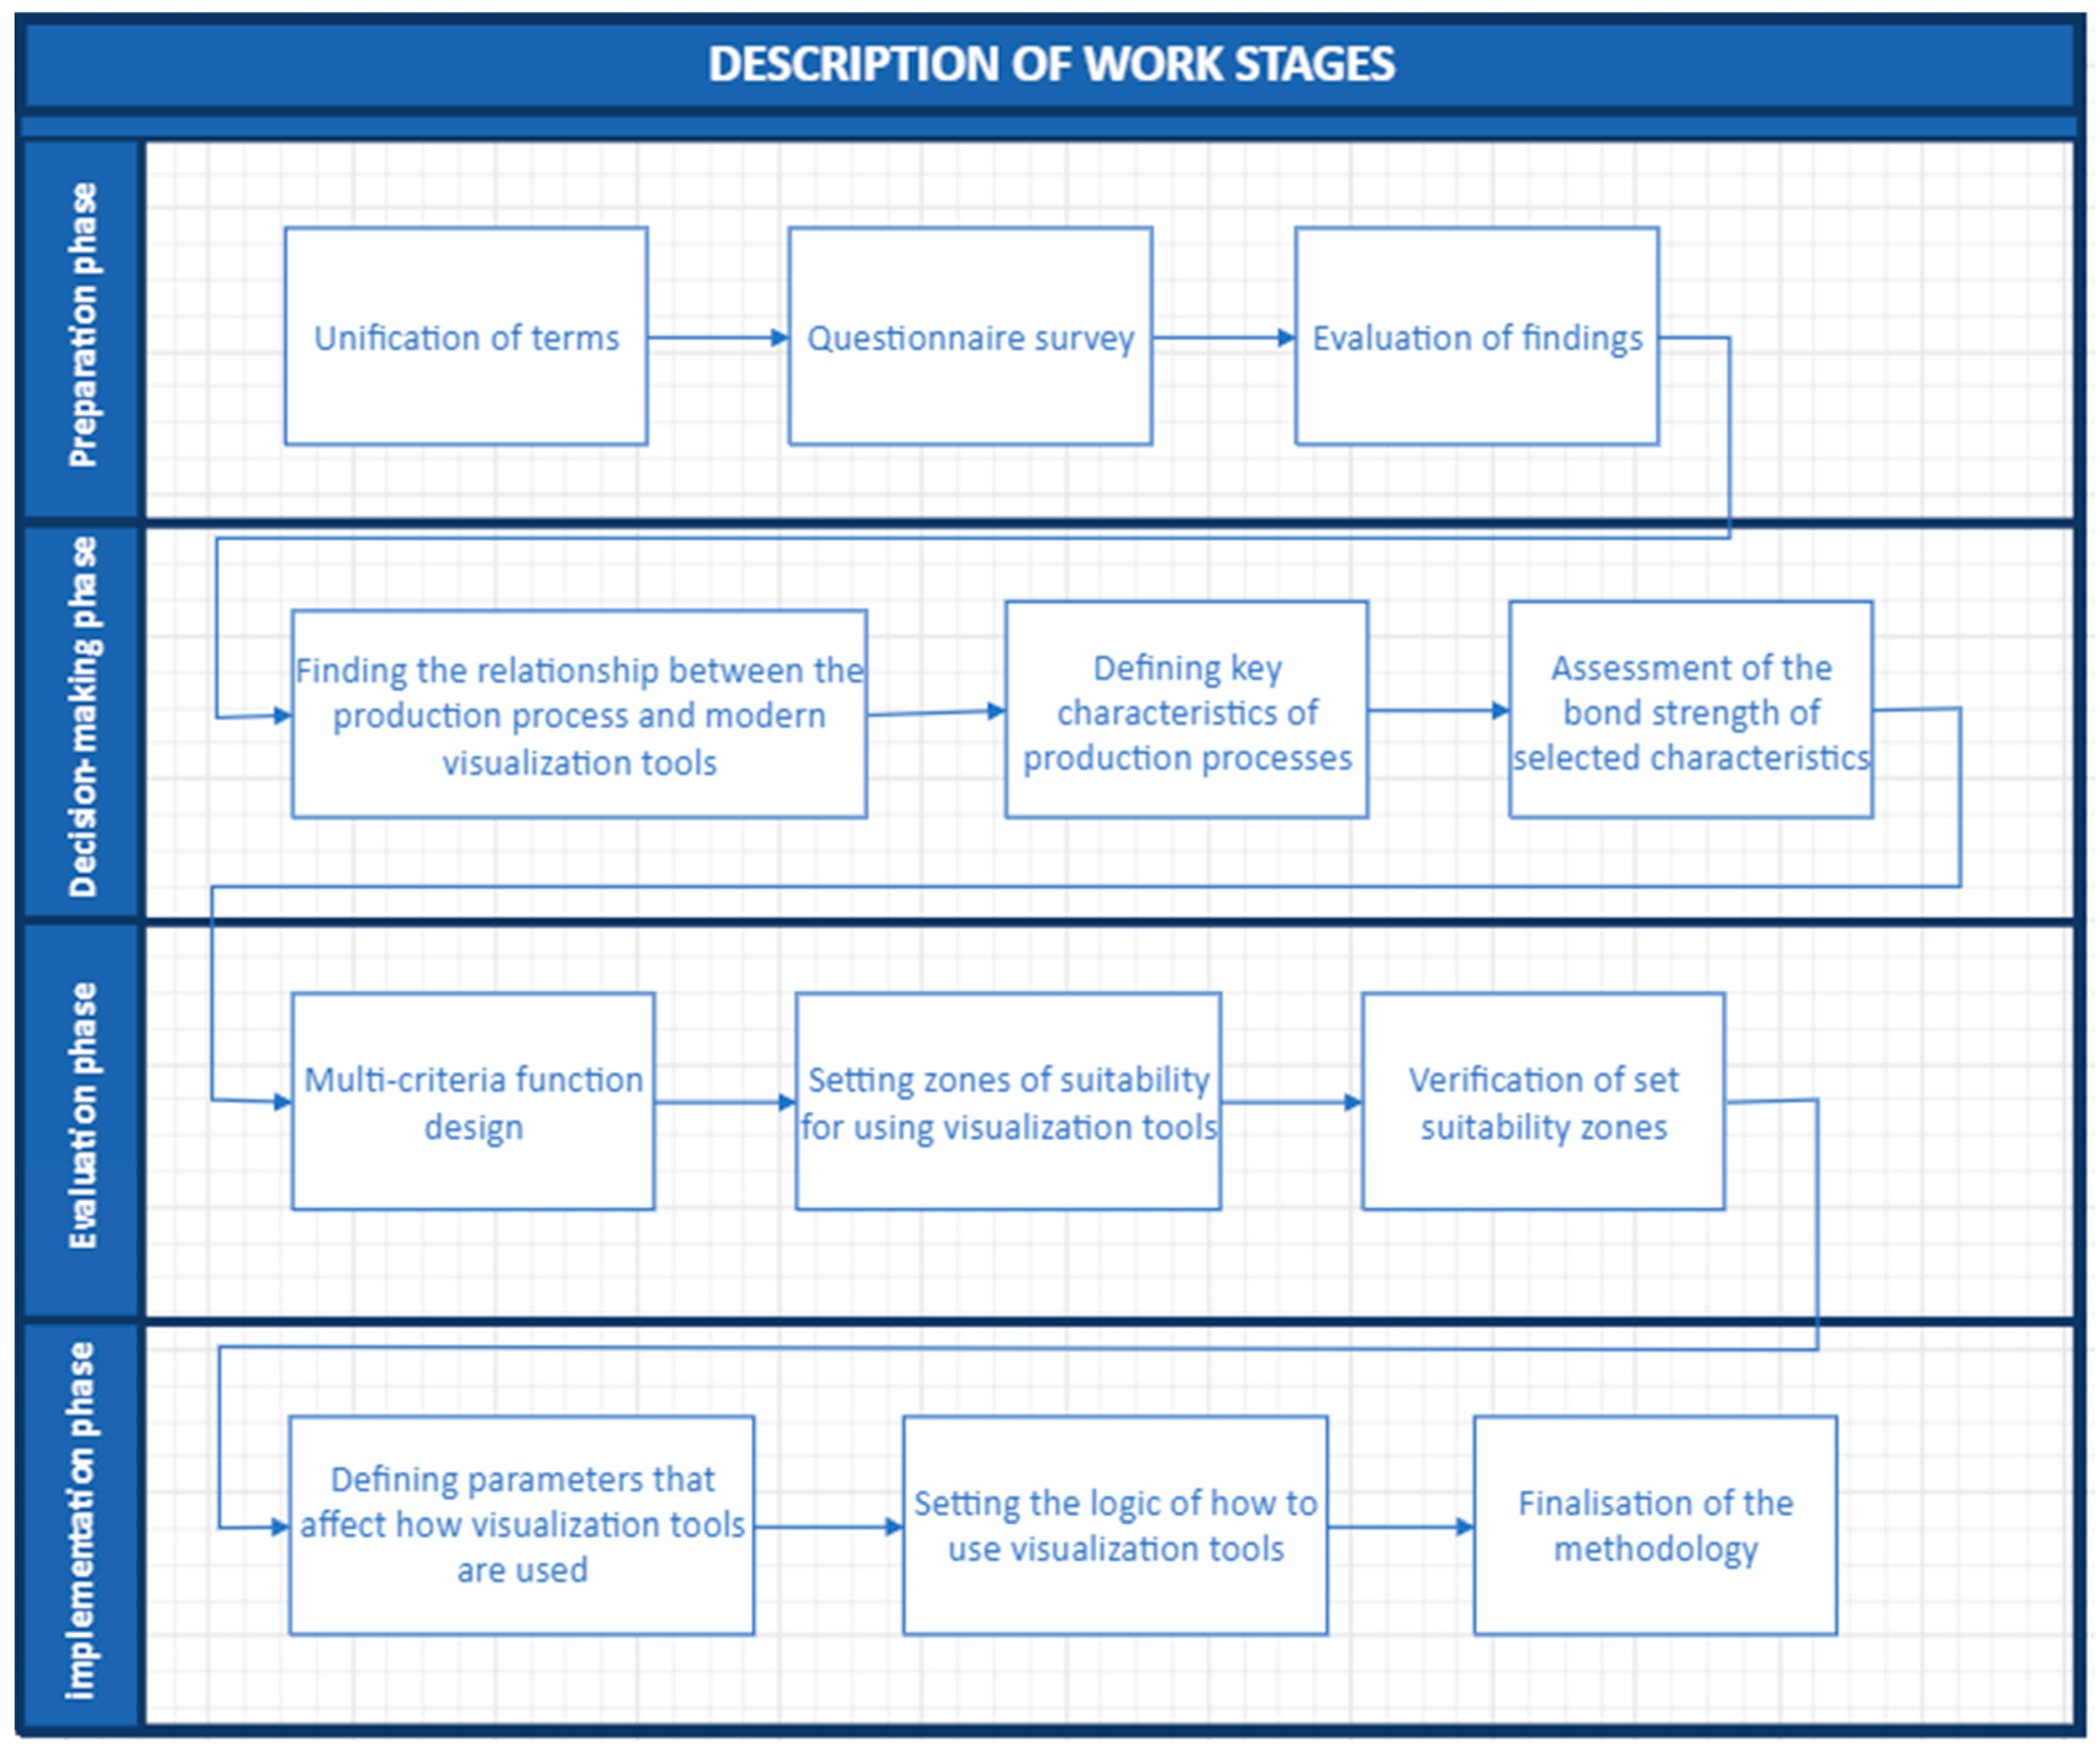
The actual research methodology consists of 4 main phases as shown in
Figure 1. The individual phases are dealt with completely independently but are logically linked to each other. Each phase contains several steps at the same time. This means that all steps must be gone through in sequence to achieve the expected result. This part of the methodology covers sub-objective 1.
2.1. Preparatory Phase
The preparatory phase is finding out the real state of the given issue in industrial practice. This phase is used to assess the specific problems related to the use of modern visualization tools in the organizational preparation of production. The main objective of this part is to support the theoretical benefits of the research activities with practical benefits.
In cooperation with the Ministry of Labour and Social Affairs of the Czech Republic and the Research Institute of Occupational Safety, a study was designed to assess the relevance of the topic and the contribution of its outputs to industrial practice. The aim of the research was to find the main problem areas related to the use of modern visualisation tools in industrial practice. This includes confirmation of the theoretical and practical benefits of the research and satisfies sub-objective 2 of the methodology. Types of tutorials (modern visualization tools) are divided into:
How to use the instructions is broken down into:
Before approaching the companies, it was necessary to prepare a set of questions to enable a proper understanding of the issues and the potential for further research. The following key questions were selected with the help of experts from the relevant departments:
Do you use modern visualization tools?
Are you considering using them?
Are you considering using them in the organizational preparation of production?
Do you know when it is appropriate for you to use modern visualization tools?
How to choose a suitable tool?
How to use the tool/how to set up the methodology?
2.2. Decision-Making Phase
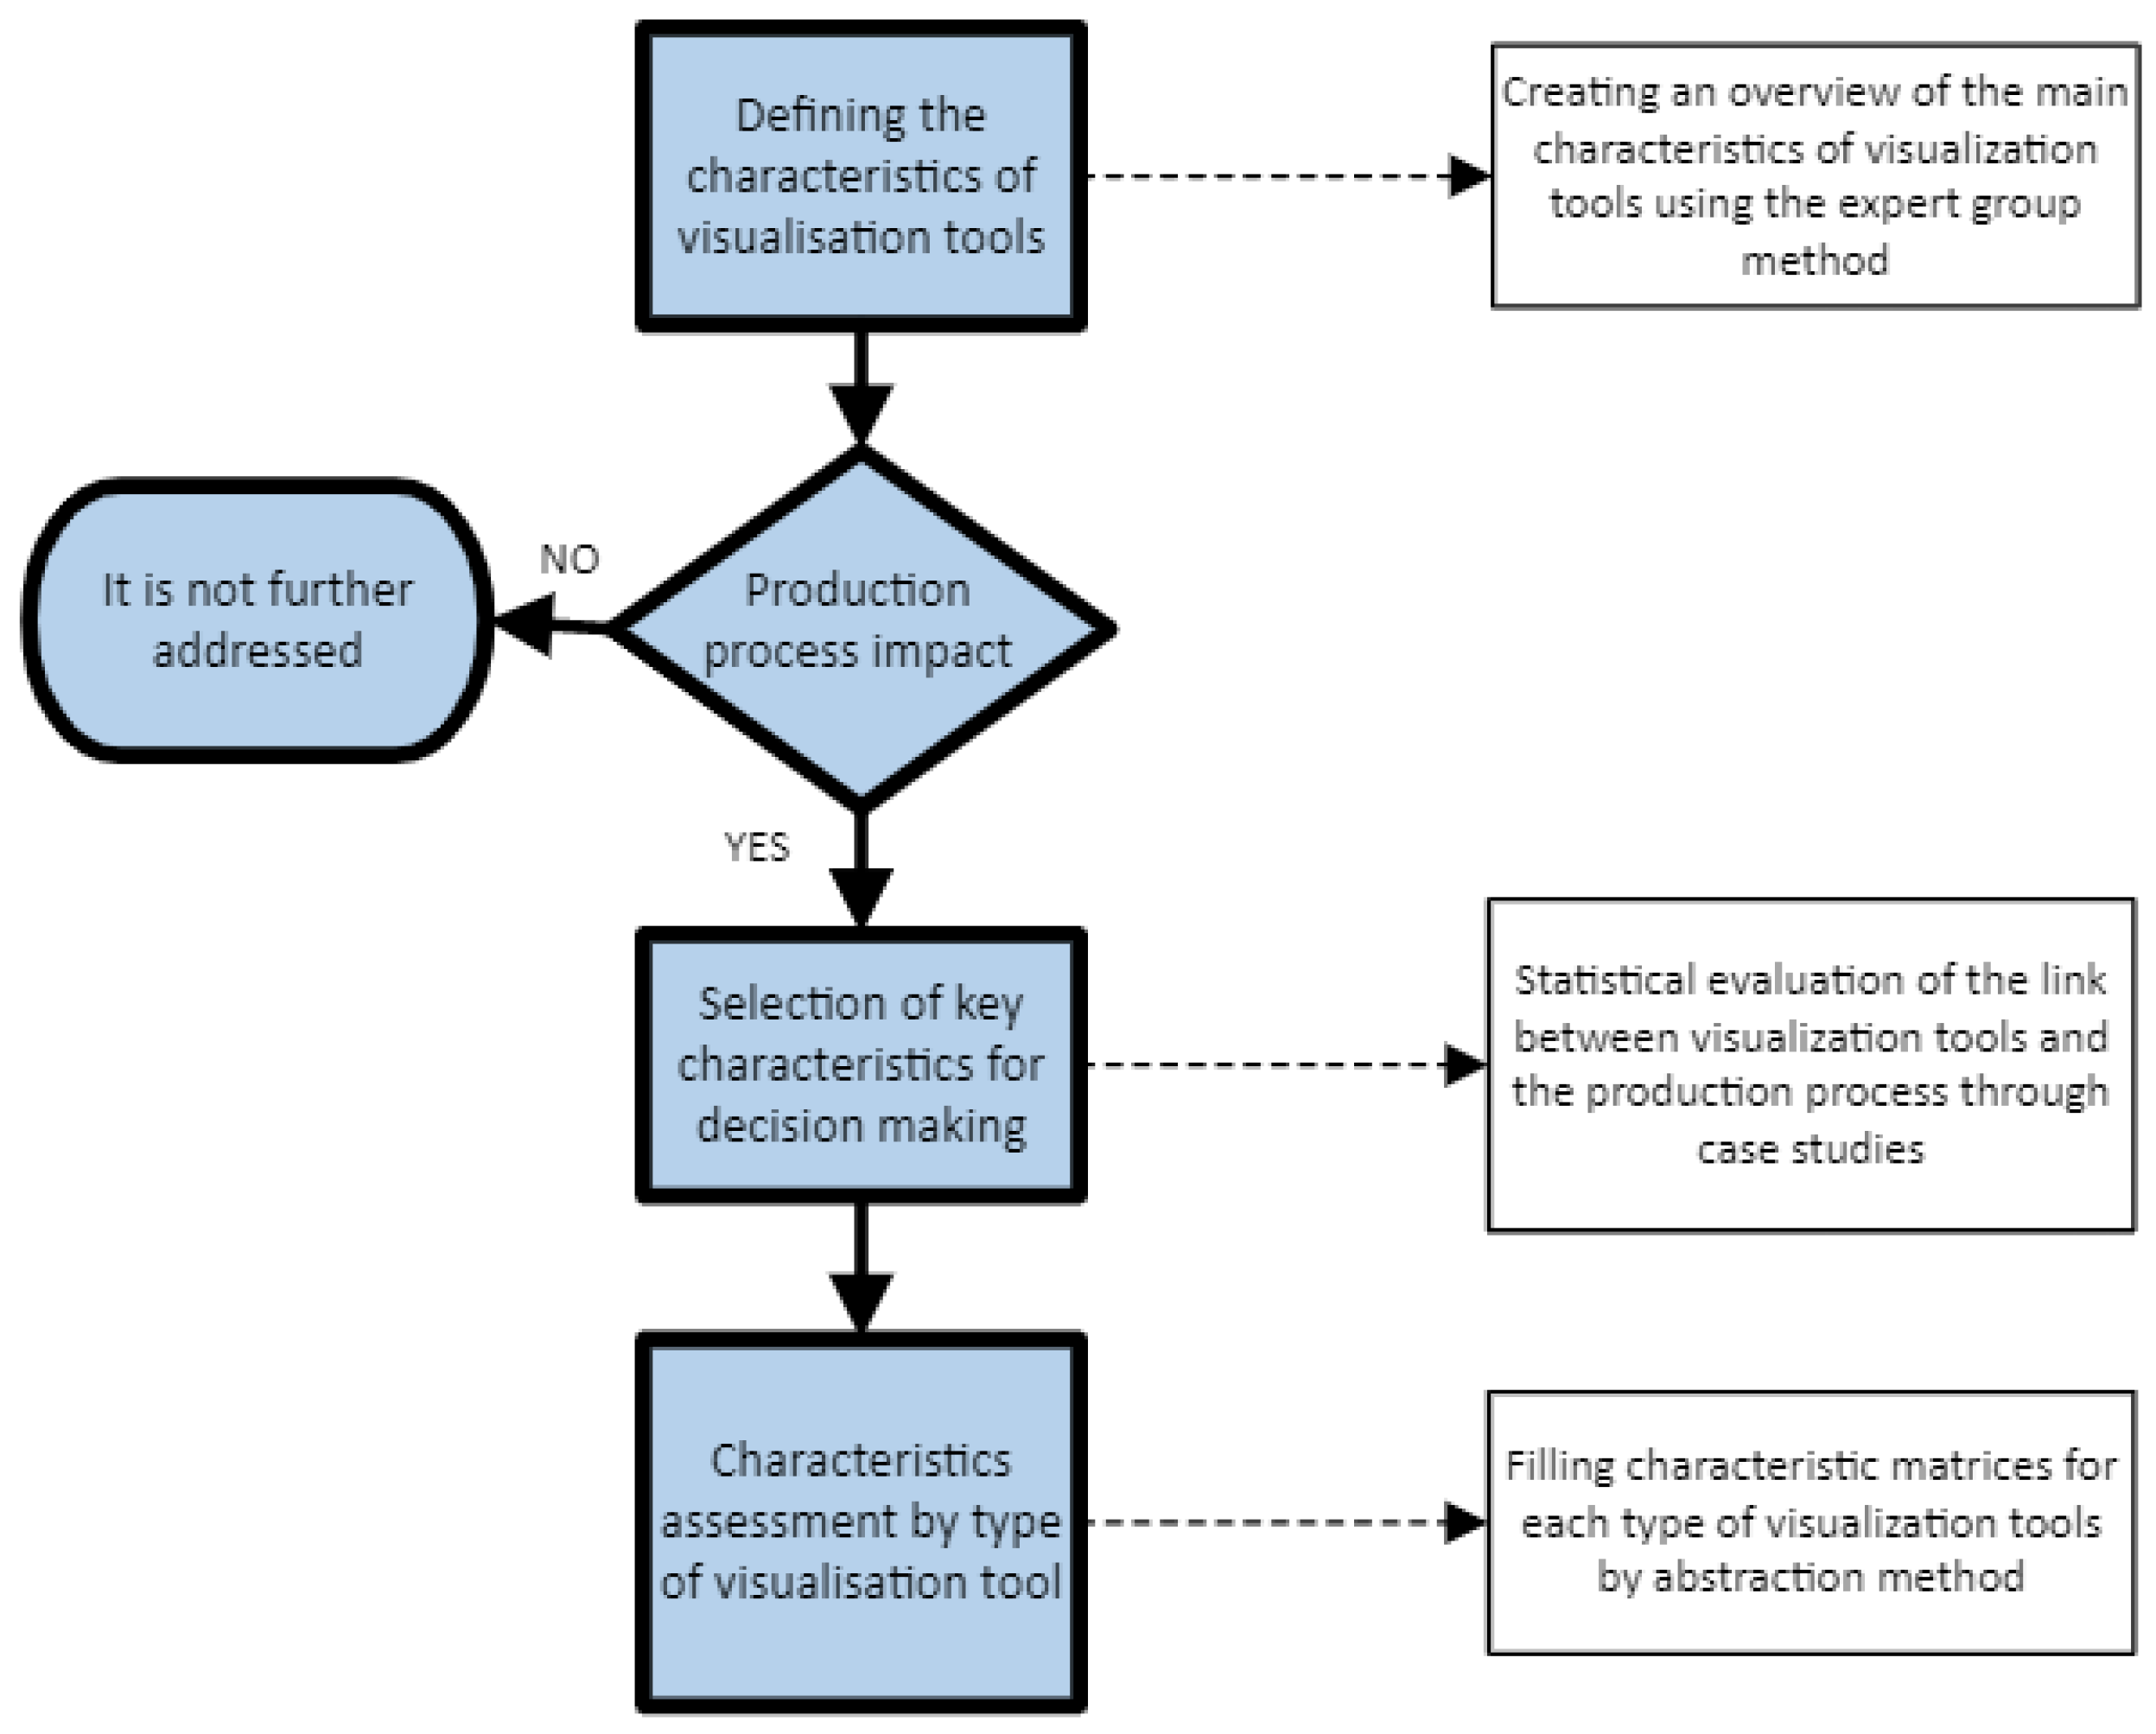
In this phase, the main objective is to define the PROCESS-TOOL relationship. First, it is necessary to find those characteristics of production processes that influence the decision about the suitability of using modern visualization tools in the organizational preparation of production. This is followed by identifying the key characteristics and assessing the strength of the link. In order to do this, it is necessary to use research methods to design a methodology that can take the above points into account. Define the parameters that influence how visualization tools are used is sub-objective number 4 for the development of the methodology.
Figure 2 represents the work with the individual characteristics of the production processes and the listing of the steps of the decision phase and their logical sequence.
The Likert scale was used to find the relationship between manufacturing processes and modern visualization tools. This measurement technique needs to be redesigned to fit the topic. Most often there are between 5 and 7 options to choose from [
58]. The Likert scale makes it possible to determine not only the content of an attitude, but also its approximate strength [
59].
In order to use the Likert scale, it is necessary to design an evaluation scale, describing the individual levels with respect to the issue under study. The modified scale consists of 5 levels, where the extreme points are opposite poles. The individual levels are used to evaluate the selected characteristics of the production processes and their impact on the application of modern visualization tools.
A modified scale was created to assess the relationship–see
Table 1. For the actual use of the modified scale, important characteristics of the production processes are defined:
- ▪
Technical aspect;
- ▪
Nature of production;
- ▪
Smoothness of production;
- ▪
The position of the human in the process;
- ▪
Human Resources (Qualifications);
- ▪
Impact in case of error;
- ▪
Repeatability of production;
- ▪
Continuous operation time;
- ▪
Production lead time;
- ▪
Currency exchange;
- ▪
Production and transport dose;
- ▪
Step time (operation time/count);
- ▪
Methods of transferring components;
- ▪
Personnel flows (place attachment);
- ▪
Work execution;
- ▪
Spatial arrangement;
The above characteristics, based on the literature [
60,
61,
62,
63], will be investigated to determine the impact on the choice of visualization tools and the strength of the correlation. Developing a methodology for selecting a tool that optimally streamlines processes in preparation for production execution, differentiating usability and suitability based on external factors is sub-objective number 5. To this end, an evaluation form was developed.
The next step is to use a modified Likert scale to identify key characteristics of the manufacturing processes that impact the assessment of the suitability and selection of visualization tools. The expert group research method was chosen to accomplish this task. The expert group has 21 members who are qualified representatives from industrial enterprises and research institutions with the following expertise:
2.3. Evaluation Phase
The aim of this phase is to design a multi-criteria function that can assess the suitability of deploying modern visualization tools in the production processes of industrial enterprises. If the suitability of their deployment is proven, it will be further necessary to decide what type of visualization tools will be chosen and how they will be used. The construction of a criterion function for evaluating the suitability of visualization tools with respect to the nature of production is part of sub-objective number 3 for the development of the methodology.
The proposed function will be based on the existing Altman model. The Altman model (also known as the bankruptcy identifier) is indicative of the financial situation of companies. It can predict the financial failure of a firm using statistics. This model was introduced by Prof. Edward Altman and expressed by a function called the Z-score [
64].
The Z-score formula is a combination of five indicators on the principle of discriminant analysis which expresses the general notation of the discriminant function [
64].
This is an example of one of the most common formulas, others with different multiples can be used [
64].
The ratio indicators contain 5 main values.
X1 = working capital/firm assets. Simplistically, we can say that a firm in loss can be expected to have liquidity problems as the ratio of current assets to total assets decreases. The problem with this relationship is that although there is a fairly clear relationship between liquidity and solvency, the relationship is significantly skewed in favour of joint stock companies as they have higher net working capital.
X2 = X2 = retained earnings/assets of the firm. It is not entirely clear whether to count funds from earnings as well, and the literature differs on this point. The weakness of this indicator is that it significantly favours companies that have been in existence longer due to the fact that they have built up sufficient reserves, however, currently in the Czech environment the creation of reserves is not mandatory, which again may affect this indicator. The original idea is that if there are reserves, bankruptcy is less likely, but in an emerging market this weakness is balanced by rapid growth, which the Altman model is unable to account for.
X3 = X3 = Earnings before interest and taxes (EBIT)/company assets.
X4 = X4 = Market value of equity (Market capitalization)/foreign capital.
X5 = X5 = Sales/Assets.
The evaluation allows the classification of the evaluated enterprise into 3 zones (This classification is part of the Altman models described in [
64]).
3.00 < Z-Safe Zone-Businesses with a high probability of survival
1.80 < Z < 2.99-Grey zone-Cannot be clearly identified
Z < 1.79-Crisis zone-Enterprises in imminent danger of bankruptcy
The Z factor should predict corporate bankruptcies two years in advance, the further into the future we want to predict, the lower the probability of bankruptcy.
In our particular case, we will then look for zones for these ranges:
Conventional tools zone
This zone is given by the resulting modified Z-score value, which is less than 9.5. If we reach these values in the multicriteria function, it is recommended to use conventional tools such as paper-and-pencil. Modern visualization tools would not be effective in this zone.
The grey zone
The grey zone represents a statistically indeterminate area. Thus, if the multicriteria function results in values between 9.5 and 14.0, it means that it is not clearly established whether it would be more appropriate to use conventional or advanced visualization tools. Careful consideration of process, time and financial factors will be required to make a decision in this zone.
Zone of use of modern visualization tools
A multicriteria function result that is greater than or equal to 14.0 represents a zone where it is appropriate and effective to use modern visualization tools. However, this zone does not in itself define which of the modern visualization tools to choose for a particular manufacturing process. It is necessary to assess the parameters of the production process.
2.4. Implementation Phase
The aim of this phase is to build on the multicriteria function proposed above. This function, whose result is characterized as a Z-score, is used to assess the suitability of deploying modern visualization tools. If the production process falls within the zone of use of modern visualization tools, it will be necessary to decide further which type of visualization tools will be chosen and how they will be used. Verification is sub-objective number 6. Our work does not deal with the zone of conventional tools or the grey zone. The implementation process is described in detail in the Results section.
3. Results
This chapter consists of a total of four phases:
Preparatory phase;
Decision-making phase;
Evaluation phase;
Implementation phase.
In each phase, partial results will be presented and evaluated. Finally, a statistical evaluation of the presented combinations will be presented, and a matrix will be created to help determine the most appropriate tool.
3.1. Preparatory Phase
The prepared questionnaire was sent to representatives of 100 companies based in the Czech Republic. The intention was to reach a sufficient sample of representatives of industrial enterprises by size:
Small and micro enterprises defined as having fewer than 50 employees and an annual turnover or balance sheet total of less than EUR 10 million;
Medium-sized enterprises-these are enterprises which employ fewer than 250 persons and whose annual turnover does not exceed EUR 50 million or whose annual balance sheet total does not exceed EUR 43 million;
Large enterprises-these are enterprises with more than 250 persons or an annual balance sheet total exceeding EUR 43 million or an annual turnover exceeding EUR 50 million.
In order for the results of the questionnaires to be statistically significant, the minimum threshold for the number of respondents for each type of enterprise was set at 15. The total number of respondents was 64. The small business sector was represented by 17 respondents. Medium enterprises had 19 respondents and large enterprises were represented by 28 respondents.
A total of 64 out of 100 industrial enterprises responded to the questionnaire survey. A complete list of questions and responses can be seen in
Table 2. The results are divided into small, medium, and large enterprises.
The most important findings from the table above include:
Most companies do not have direct experience with the use of modern visualization tools;
Large and medium-sized enterprises are significantly more interested in deploying modern visualization tools;
The interest in the use of these tools in the organizational preparation of production prevails among medium and large enterprises;
Businesses are unable to assess when and under what conditions the use of modern visualisation tools is appropriate for them;
There is no methodology available to help companies choose the most appropriate tool given the characteristics of their production processes;
Over 90% of businesses do not know how to use the tools.
The result of the investigation demonstrates the practical applicability of the research and the author’s assumptions. At the same time, according to the results, it is possible to specify the area of focus of the proposed methodology:
Large and medium-sized manufacturing companies;
Type of production-piece, serial, mass;
Business sector-industrial enterprises.
The methodology is proposed within the limits listed. However, it can be expected to be appropriate in other circumstances. However, this is not the focus of this paper, but rather it raises the potential for further investigation.
3.2. Decision-Making Phase
In order to set up a suitable algorithm for working with the characteristics of production processes, it is necessary to narrow down the number of relevant parameters. Therefore, those with the lowest weight need to be excluded.
The relevance rules for the values obtained for each characteristic were set as follows:
- I.
The difference between the arithmetic mean and the modulus is at most |1|;
- II.
The difference between the arithmetic mean and the median is at most |1|
- III.
The maximum value of the standard deviation is 1.5;
- IV.
A relevant association is given by an arithmetic mean value of 2 (inclusive) or higher.
In
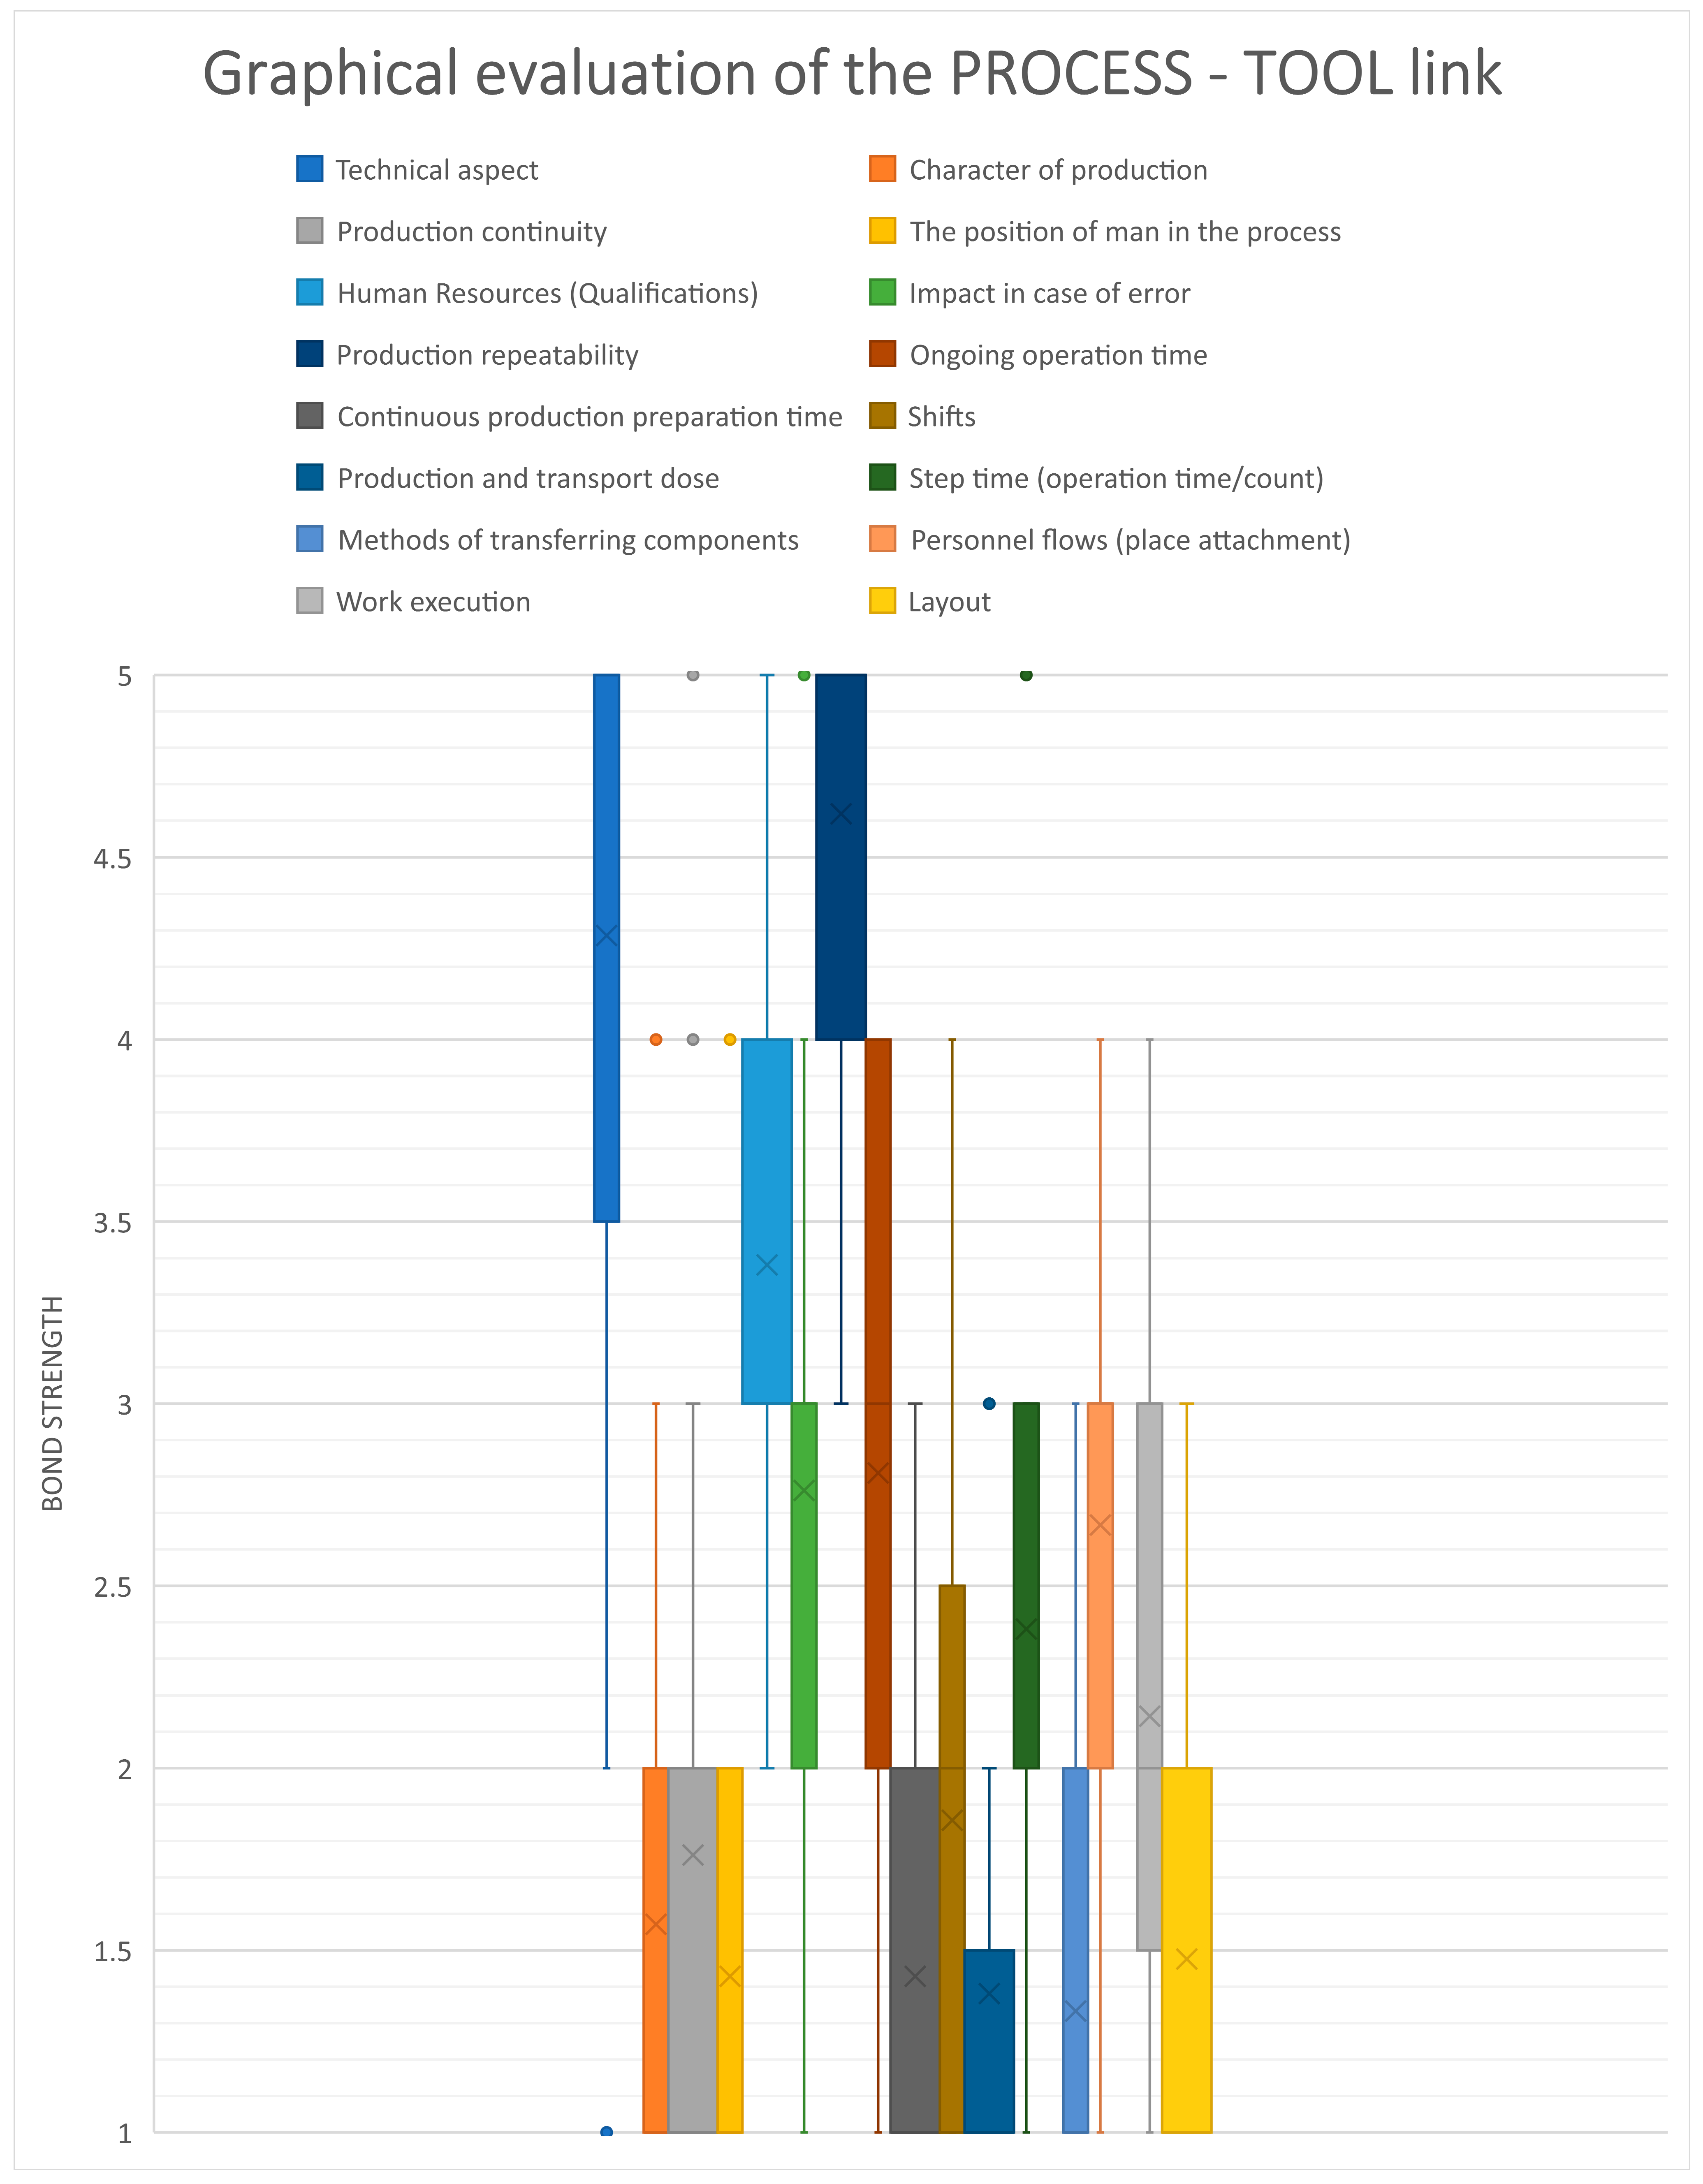
Figure 3 it can be seen that all the set assumptions regarding the relevance of the obtained data are met (specifically rules I, II and III). This confirms the claim that there is a link between the characteristics of the production processes and the assessment of the suitability of deploying modern visualization tools. The results obtained by the expert group method do not deviate significantly and are within the set tolerance.
According to Rule IV, the characteristics of the production processes are also divided into those that do not influence the assessment of the suitability and choice of visualization tools (arithmetic mean < 2) and those where a link has been identified (arithmetic mean ≥ 2).
In
Figure 3 one can further see the interpretation of the obtained data using boxplots, i.e., a graphical visualization of the numerical data using their quartiles. We can notice that the middle part of the diagram is bounded by the 3rd quartile from above and the 1st quartile from below. Between them there is a line defining the median. The boxplots also contain lines extending from the middle part of the diagram perpendicularly up and down, called ‘whiskers’. These show the variability of the data below the first and above the third quartile. The outliers are then plotted as separate points. The arithmetic mean is indicated by a cross in the body of each boxplot. A red line symbolizing Rule IV is also drawn through the graph.
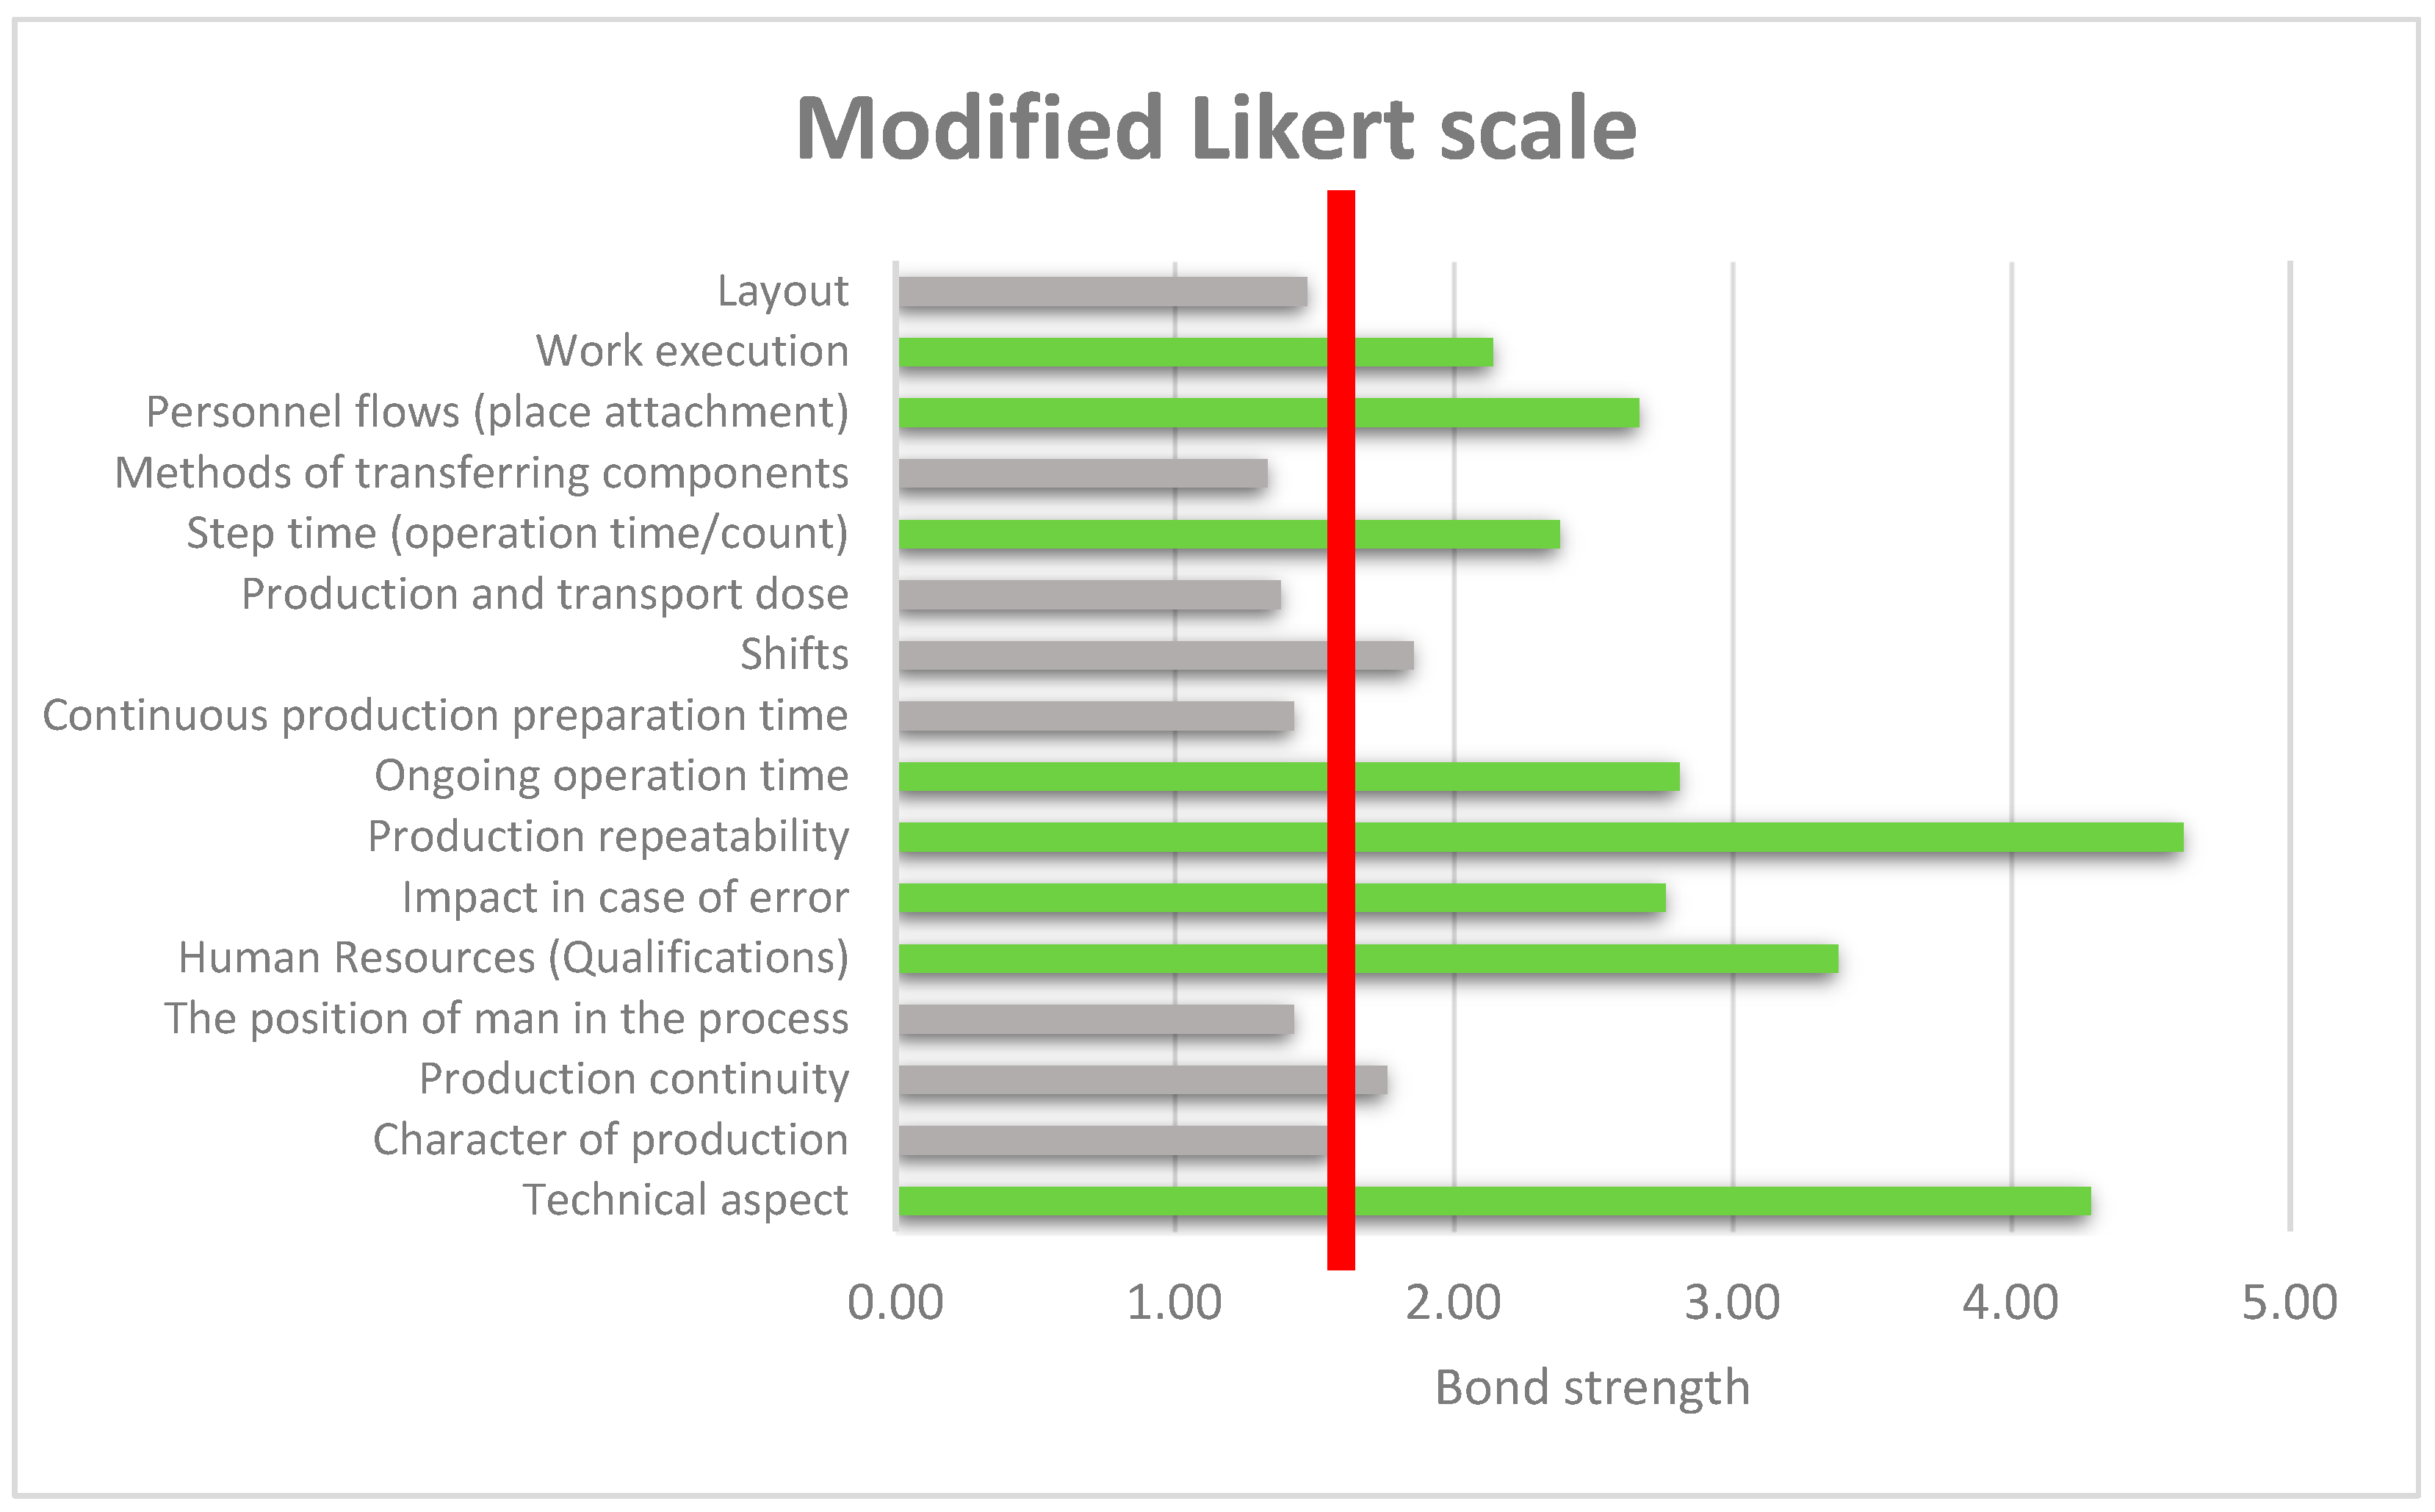
In
Figure 4 can be seen a selection of the characteristics of the production processes that fulfilled Rule IV. This means that they have the greatest influence on the assessment of the suitability, selection of the type and deployment of visualization tools. Now we need to group these characteristics according to their importance. The essential group will influence both the suitability and the type of visualisation tools. Other groups may only influence the type or method of use of visualization tools.
Selected characteristics of production processes that have a demonstrable PROCESS-TOOL link are further divided into three basic groups. Each of the groups A, B, and C has a different relationship to the assessment of the suitability of visualisation tools.
Selected characteristics:
- -
Technical aspect;
- -
Human Resources (Qualifications);
- -
Impact in case of error;
- -
Repeatability of production;
- -
Continuous operation time;
- -
Step time (operation time/count);
- -
Personnel flows (place attachment);
- -
Work execution.
Groups:
A—influences the type and use of visualization tools;
B—influences the type of visualization tools;
C—affects the way visualization tools are used.
The expert group method was used to carry out the sorting, which can be seen in
Table 3. Each characteristic was examined separately and then assigned to the group with the best consensus of the expert group. This decision is based on the fulfilment of rules I, II, and III, which confirm the relevance of the data and do not exceed the maximum variance limit.
The selected characteristics are further sorted according to parameter Px. The distribution shows that two characteristics are in group A (P1 and P4), four are in group B (P2, P3, P5 and P6) and two are in group C (P7 and P8). The strength of binding was not taken into account during the sorting of the characteristics. Its importance will be applied when constructing the multicriteria function.
3.3. Evaluation Phase
The proposed multicriteria function is based on the modified Altman model. The characteristics of the production processes, which were classified into groups A and B in the previous chapter, serve as the main indicators. Relevant in this case is the strength of the association of each characteristic and the value of the possible parameter that the characteristic can take on. The formula of the modified Z-factor is designed as follows:
where
FromMOD—modified multicriteria function score;
S1—bond strength characteristics Technical aspect;
S2—strength of the link Human Resources characteristics;
S3—strength of bond characteristics Impact when fault occurs;
S4—bond strength characteristics Repeatability of production;
S5—bond strength characteristics Continuous operation time;
S6—bond strength characteristics Step time;
Y1—value of the selected parameter of the characteristic Technical aspect;
Y2—value of the selected parameter of the Human Resources characteristic;
Y3—the value of the selected parameter of the characteristic Impact in case of error;
Y4—value of the selected parameter of the characteristic Repeatability of production;
Y5—value of the selected parameter of the characteristic Continuous operation time;
Y6—value of the selected parameter of the Step Time characteristic.
The strength of coupling of process characteristics was quantified in the previous section of the paper. Now we need to define what values each of the characteristics can take. These values must then be numerically ranked according to their impact on the assessment of the suitability of the visualization tools.
The larger the value of the modified Z factor, the more suitable the production process will be for the deployment of advanced visualization tools. Conversely, a low score predicts the deployment of conventional tools as more suitable.
The method of the expert group was also used to determine the values of the parameters of the individual characteristics of the production processes of group A + B. This expert group consisted of fifteen experts from various relevant disciplines. Some of them were contacted in person and others by correspondence. The aim is to clarify the missing specification of the parameters, namely their possibilities and their rating, in order to be able to provide each characteristic its partial score. The partial score of a parameter is calculated as the product of the parameter value and the strength of the association. The sum of the subscores then allows the total modified Z-score to be calculated. This is a prerequisite for categorizing manufacturing processes to interpret the suitability of using modern visualization tools.
In
Table 4 the necessary values that can be taken by individual parameters of production processes are added. With these values it is possible to prepare an evaluation and set up zones of suitability for the use of visualisation tools.
The above characteristics are important for obtaining information about production processes. Using the strengths of the relationships between the characteristics of the manufacturing processes and their partial values of each parameter, it is possible to simulate all combinations of the resulting modified Z-score that the manufacturing processes can achieve.
The next step is to set up three main zones that will determine the area of suitability for deploying modern visualization tools.
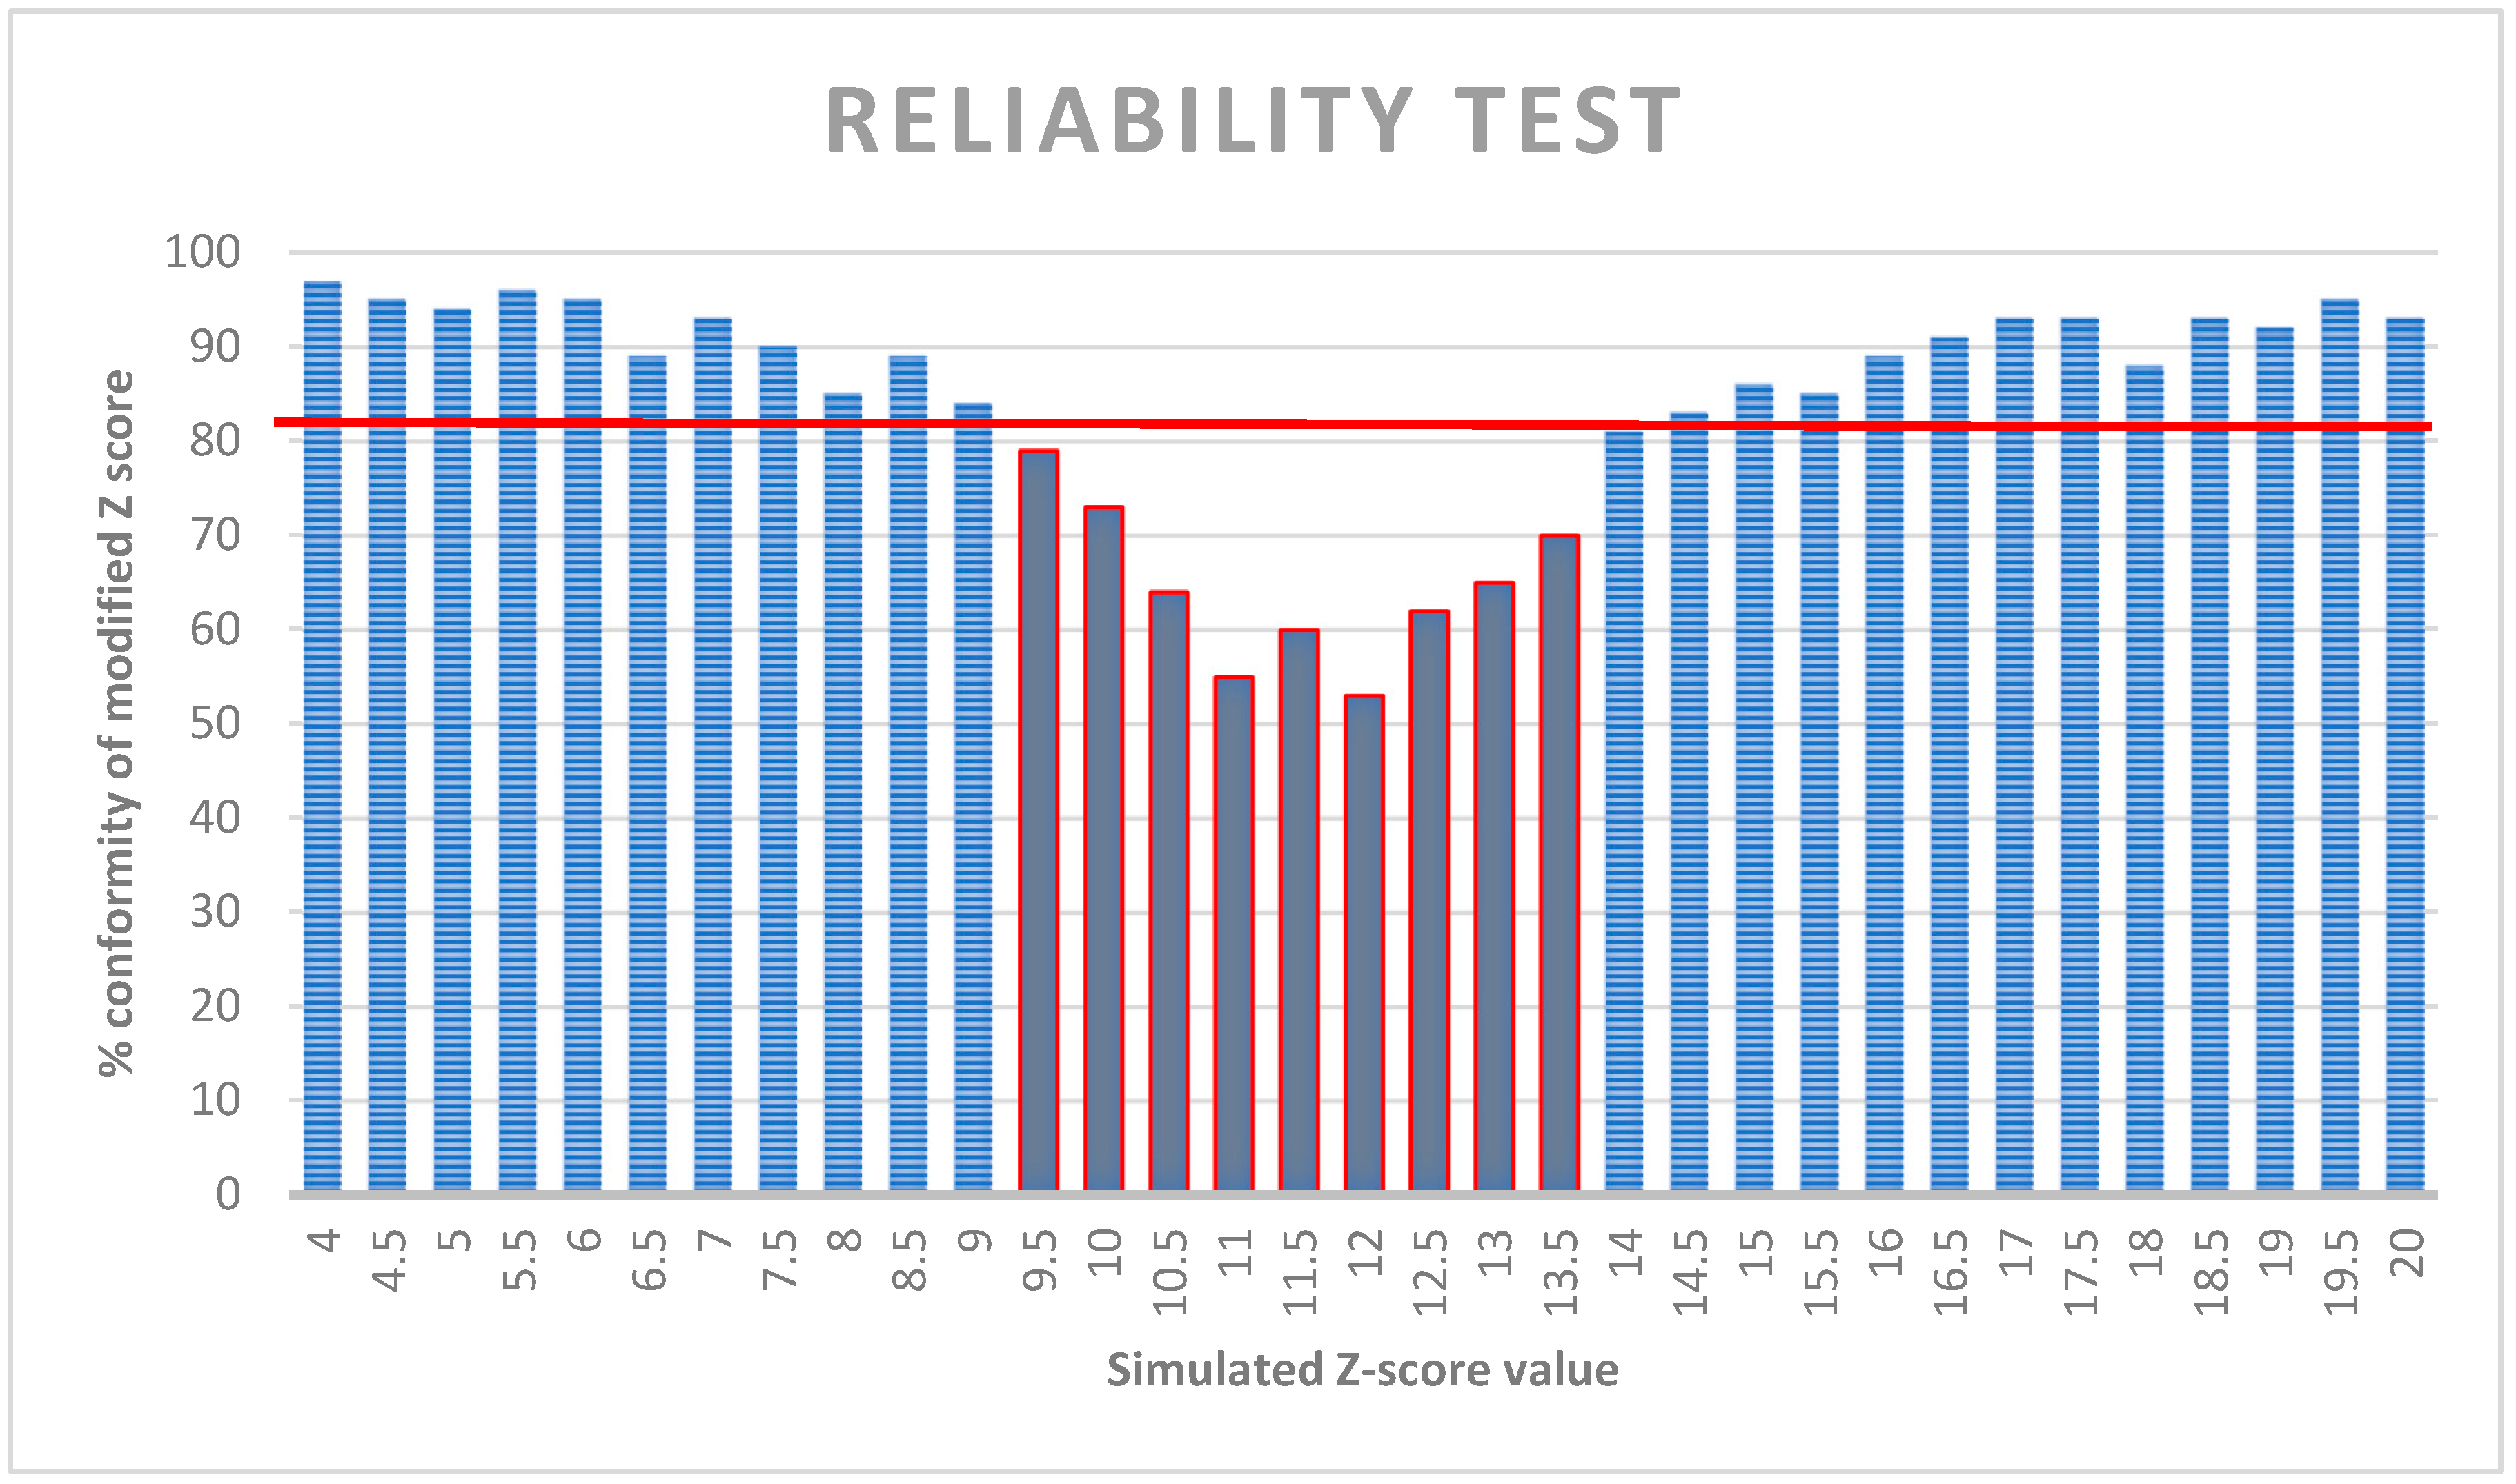
The 80% agreement for a particular simulated modified Z-score was chosen as the statistically significant value. The simulation results were divided by 0.5 points. The scale is always between 4 and 20 points. The minimum of the simulation was 4.25 points and the maximum was 19.68 points.
For the simulation itself, the possibility of creating different combinations of production process parameters was used. The expert group method was then used to assess whether conventional or modern tools would be appropriate for the score. In
Figure 5 it is possible to observe the percentage agreement of the expert group on the suitability of the simulated production processes for the use of visualisation tools. The left side of the graph indicates the agreement in the use of conventional tools. The right side has the agreement in the use of modern visualization tools. In the middle we see a grey area (less than 80% agreement) where it is not possible to clearly determine which of the tools it is appropriate to use.
Based on the reliability test of the simulated Z-scores by the expert group, the individual zones can be specified. An important value is 9.5 points, which defines the boundary between the zone of conventional instruments and the grey zone. The grey zone, on the other hand, is limited by the value of 13.5 points, see
Table 5.
3.4. Implementation Phase
To be able to decide on the type and use of advanced visualization tools in a zone where the Z-score exceeds 14, we need to define the characteristics that influence the use of these tools. These characteristics were set in
Table 3 where we can see their classification into groups A, B, and C. The groups that influence the type and way of using modern visualization tools are A and C. The characteristics belonging to groups A or C include:
P1—Technical aspect, can take values:
- ○
P11—Greenfield;
- ○
P12—Brownfield;
P4—Repeatability of production, can take values:
- ○
P41—Unit;
- ○
P42—Serial;
- ○
P43—Bulk;
P7—Personnel flows (place attachment), may take values:
- ○
P71—Above 80%;
- ○
P72—Less than 80%;
P8—Work execution, can take values:
- ○
P81—Parallel manual work up to 50%;
- ○
P82—Parallel manual work over 50%.
P7 indicates a person’s attachment to the workplace. A worker who does not rotate between workplaces and stays only at one of his/her own will reach the 100% workplace attachment threshold [
65]. P8 indicates the amount of manual work performed in a given time and [
66]. Each characteristic can take on different values. These values will be further sorted as the letter y for the parameter P
xy. Hence, it will be necessary to first compile all possible combinations of these four process characteristics. This results in a total of 24 possible combinations of the selected parameters shown in
Table 6. Within these combinations, it is now necessary to evaluate which type and method of using modern visualization tools will be suitable for each option.
Type and usage logic settings
Each sub-combination of process parameters will be evaluated to assess the suitability of the type and method of use of the visualisation tools. This is necessary to disentangle the relationships and interdependencies of the individual parameters. As in
Figure 3 the expert group method was used. The aim is to find the most suitable option (type and method of using modern visualization tools) for each sub-combination. Before the actual evaluation of the variants, rules were set. The relevance rules of the obtained values for each combination were set as follows:
- I.
The suitable variant is given by the modus function;
- II.
Value modus > 10 (out of 21 ratings);
- III.
The minimum Z-score must be at least 14 (rule from the previous phase).
Parameter P1 was selected as the most suitable for sorting combinations. Therefore, all 12 combinations of parameter P11 were evaluated first. These are all the possibilities related to a site that is in the design phase and does not yet exist in reality. The result is:
P11P41P71P81—the suitable variant is VR 3D selected 15 times, rule II has been fulfilled;
P11P41P71P82—suitable variant is VR 3D selected 14 times, rule II was met;
P11P41P72P81—the suitable variant is VR 3D selected 16x, rule II has been fulfilled;
P11P41P72P82—suitable variant is VR 3D selected 11 times, rule II was fulfilled;
P11P42P71P81—the suitable variant is VR 3D selected 15 times, rule II has been fulfilled;
P11P42P71P82—the suitable variant is VR 3D selected 16 times, rule II was fulfilled;
P11P42P72P81—the suitable variant is VR 3D selected 12 times, rule II was fulfilled;
P11P42P72P82—the suitable variant is VR 3D selected 18 times, rule II was fulfilled;
P11P43P71P81—suitable variant is VR 3D selected 14 times, rule II was met;
P11P43P71P82—suitable variant is VR 3D selected 14 times, rule II was met;
P11P43P72P81—suitable variant is VR 3D selected 13 times, rule II was met;
P11P43P72P82—the suitable variant is VR 3D selected 15 times, rule II was fulfilled.
As can be seen in all combinations met the set rules and it was thus clearly determined which type of visualization tool is suitable for specific combinations. Related to this is the choice of the method of use, which was also part of the evaluation. Subsequently, the evaluation was performed by combining the P12 parameter. These are options related to existing sites.
The following results are shown:
P12P41P71P81—does not meet the minimum required Z-score (Rule III);
P12P41P71P82—does not meet the minimum required Z-score (Rule III);
P12P41P72P81—does not meet the minimum required Z-score (Rule III);
P12P41P72P82—does not meet the minimum required Z-score (Rule III);
P12P42P71P81—suitable variant is VR 2D stationary selected 14 times, rule II was met;
P12P42P71P82—suitable variant is VR 2D stationary selected 15 times, rule II was met;
P12P42P72P81—the suitable variant is VR 2D portable selected 16x, rule II was met;
P12P42P72P82—suitable variant is AR portable selected 11 times, rule II was met;
P12P43P71P81—suitable variant is Video stationary selected 12 times, rule II was met;
P12P43P71P82—suitable variant is Video stationary selected 14 times, rule II was fulfilled;
P12P43P72P81—suitable variant is VR 2D portable selected 15 times, rule II was met;
P12P43P72P82—suitable variant is VR 2D stationary selected 12x rule II was met.
The results of the P12 combinations also meet the required rules and are clearly statistically demonstrable. The collected results are used to build a matrix of combinations for the use zone of modern visualization tools, where the processes will be assigned a type and use.
Matrix of combinations of process and application characteristics
Based on the results obtained above (specifically in
Table 7 and
Table 8), it is now possible to construct a matrix of all possible combinations of manufacturing process characteristics and types of modern visualization tools, including how they are used. We only consider those characteristics that have an impact on the type and use of visualisation tools, i.e., belong to groups A or C.
Thus,
Table 9 is a representation of the multidimensional matrix containing a complete list of combinations and suitable variants according to the proposed methodology. However, some combinations could not be specified as they do not reach the minimum modified Z-score according to the multicriteria function. Thus, we now have a completed methodology for rationalizing the execution of manufacturing processes in the context of organizational production preparation. Thanks to the proposed methodology, we are able to assess whether a particular manufacturing process is suitable for modern visualization tools. If so, this methodology can be used to select the type and method of using the visualization tool according to the defined characteristics of the production process.
The proposed methodology, which uses the above mathematical apparatus, therefore allows us to recommend a suitable visualization tool-Paper, Video (Stationary/Portable), VR 3D, VR 2D (portable/stationary), AR (portable/stationary)-based on the input, which are the parameters of the specified characteristics of the production processes, which were limited to six (see
Table 4). Due to the fact that the above limitations could be found, it is thus possible to perform validation on a limited number of combinations. Validation will be performed for these combinations. Thus, a testbed will be developed for each type of tutorial.
4. Validation of the Methodology
Here we describe the verification of the functionality of the proposed methodology through the deployment of the methodology in industrial practice and the subsequent implementation of the recommended solutions. The aim is to validate the methodology by testing the key combinations that can be created based on the methodology directly in the real operation of manufacturing companies. In order to effectively validate the proposed methodology on a larger number of combinations, it is necessary to develop software support that will facilitate filling of the values into the multicriteria function and allow the selection of the appropriate type and method of using visualization tools from a predefined matrix of combinations.
For the verification itself, a number of new in-house applications have been developed, tailored to this study, but mostly deployed in the actual company. Examples of these environments can be seen in the following subsections.
Creation of software support
Software support must respect all the knowledge gained as described in the previous sections. First of all, it is necessary to link the characteristics of the production processes with the assessment of suitability for modern visualisation tools using a multi-criteria function. The output is then a Z-score, which can be used to assess whether the manufacturing process is suitable or not. If the process is suitable, the selection of the correct type respecting the matrix of all combinations created must follow. Finally, these combinations will also allow the selection of the correct application.
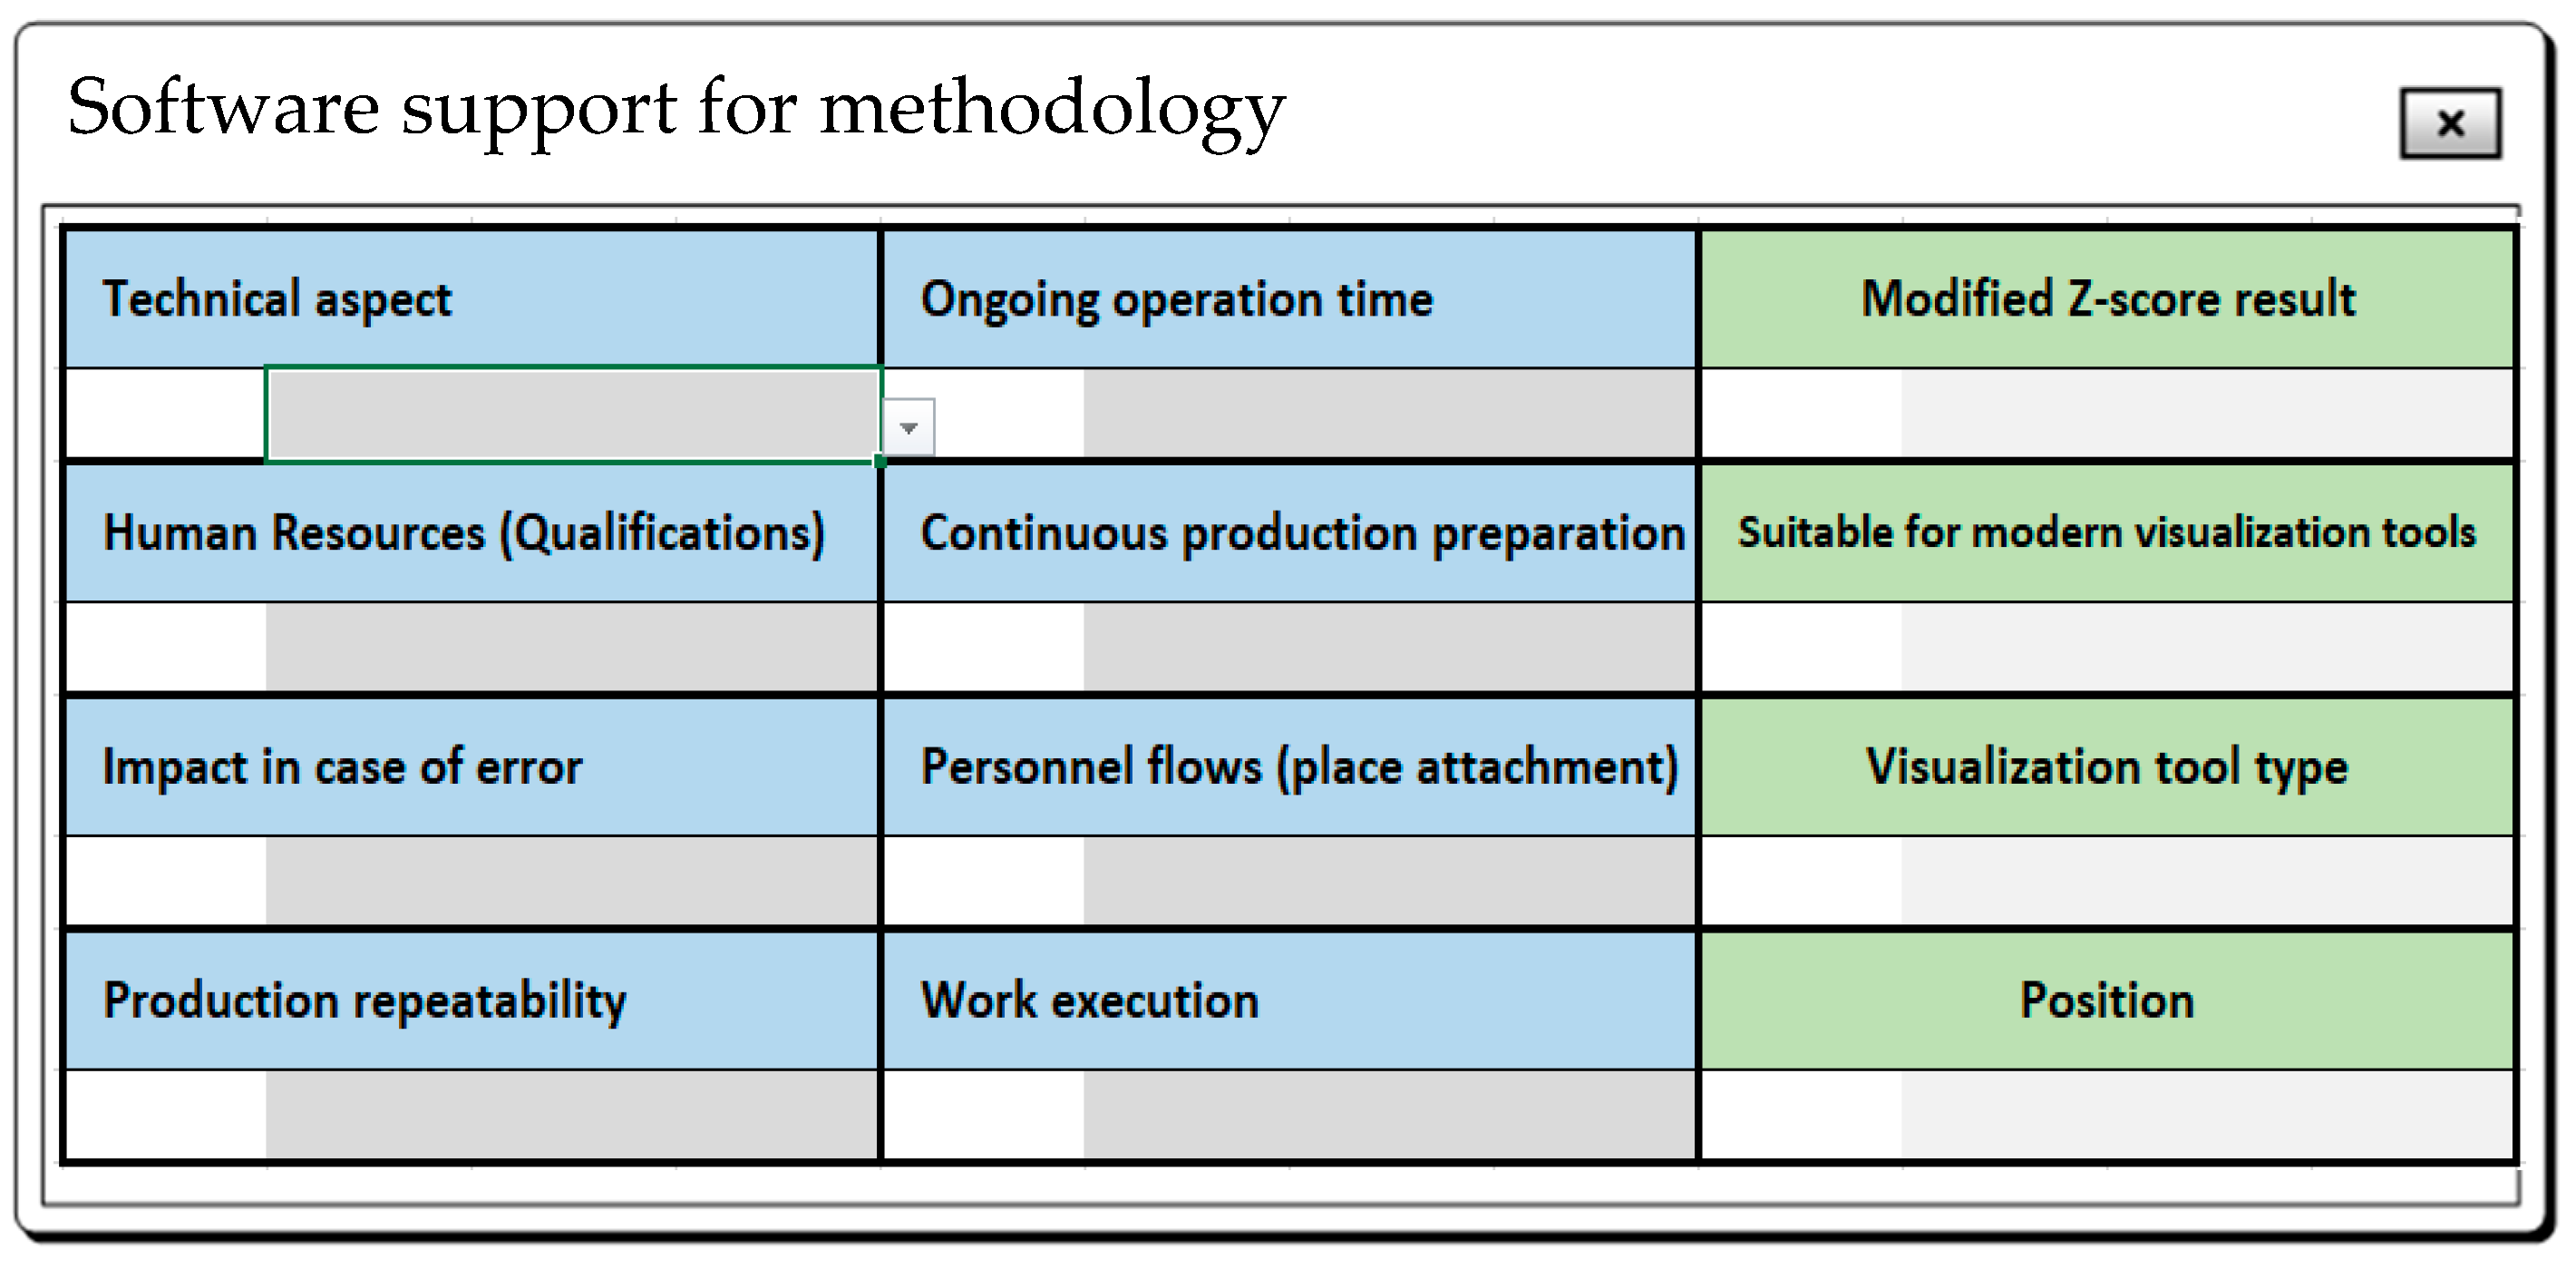
In
Figure 6 the initial menu of the created software support can be seen, where the blue fields are for adding and selecting from a predefined list. These are selected important characteristics of the production processes that influence the choice of visualization tools. All blue items must be pre-populated in order to calculate the subsequent modified Z-score. The green fields are generated automatically based on predefined algorithms.
Modified Z-score result-calculates the specific value of the modified Z-score according to the proposed methodology;
Suitable for modern visualization tools-if the Z-score is 14 or higher, this field returns YES (if less than 14, it returns NO);
Visualization tool type-if YES in the field above, this field returns the specific type of visualization tool according to the combination matrix;
Position-if the process is suitable for modern visualization tools, it returns the usage method (otherwise it remains empty).
4.1. Verification of the Combination P11P42P71P82
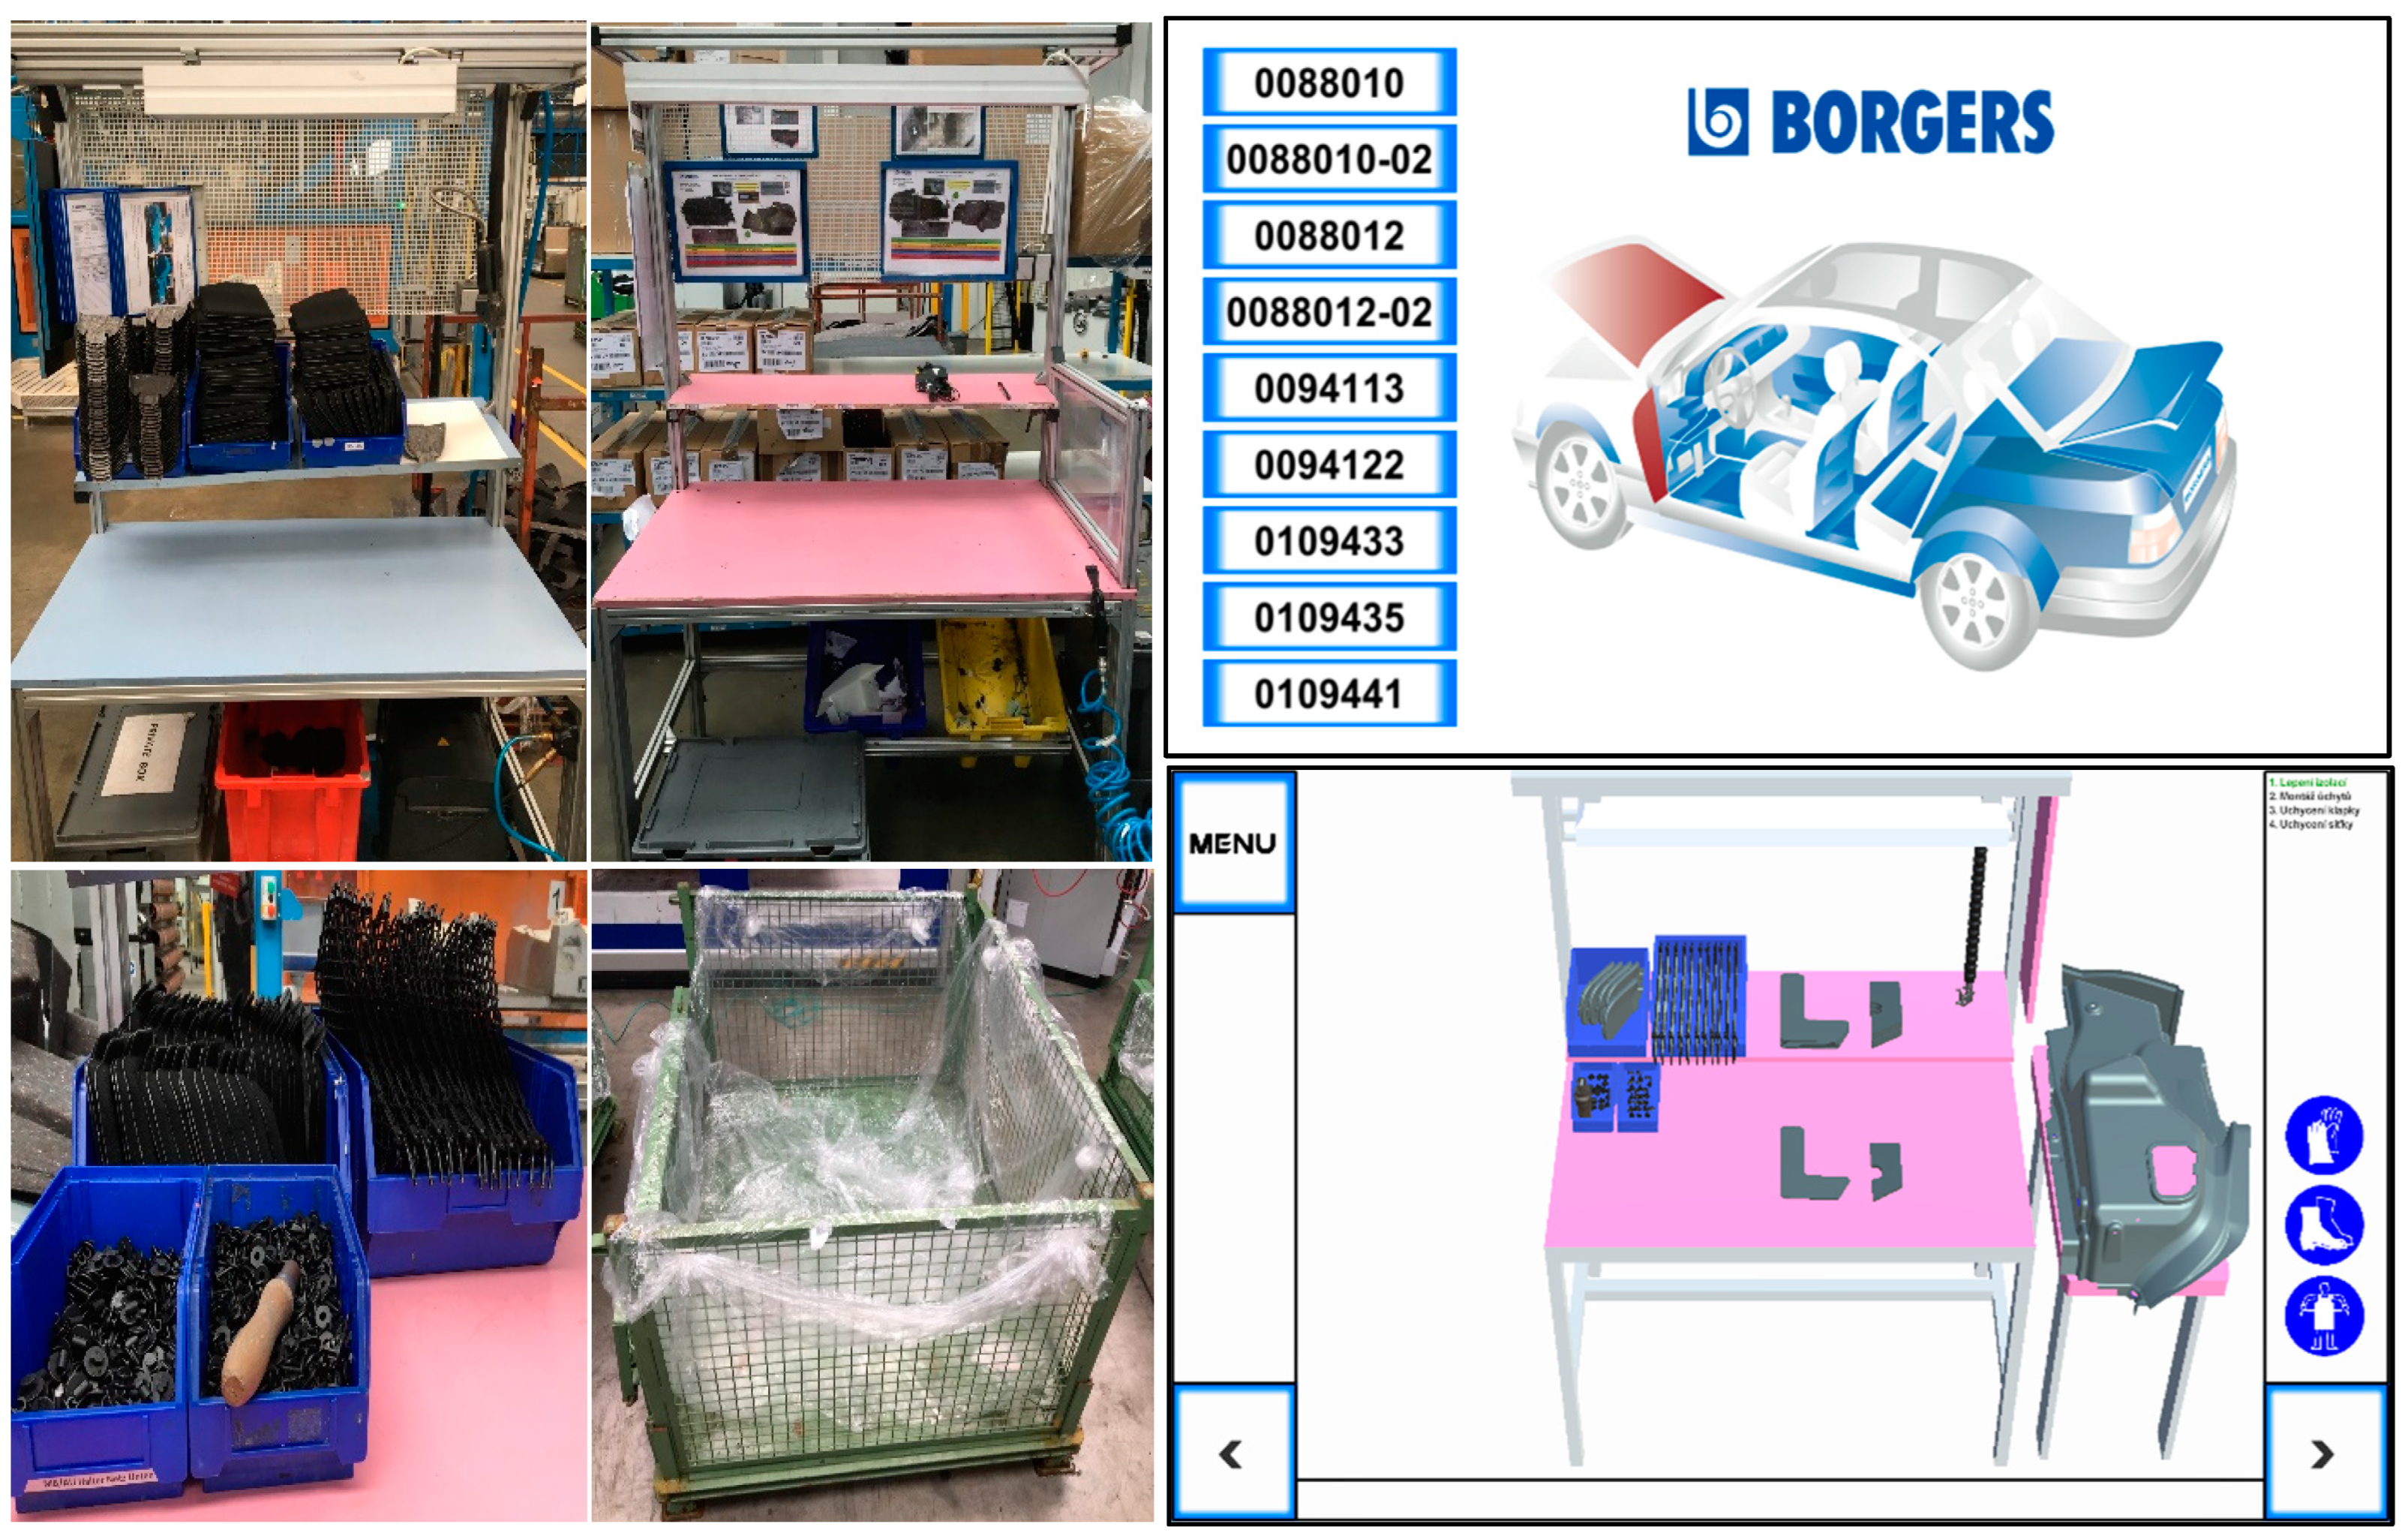
In order to verify the combination P11P42P71P82, it was necessary to find a suitable manufacturing process that would not only meet a sufficient value of the resulting modified Z-score, but also match the set parameters of this combination. In
Table 10 a specific manufacturing process from an automotive company can be seen.
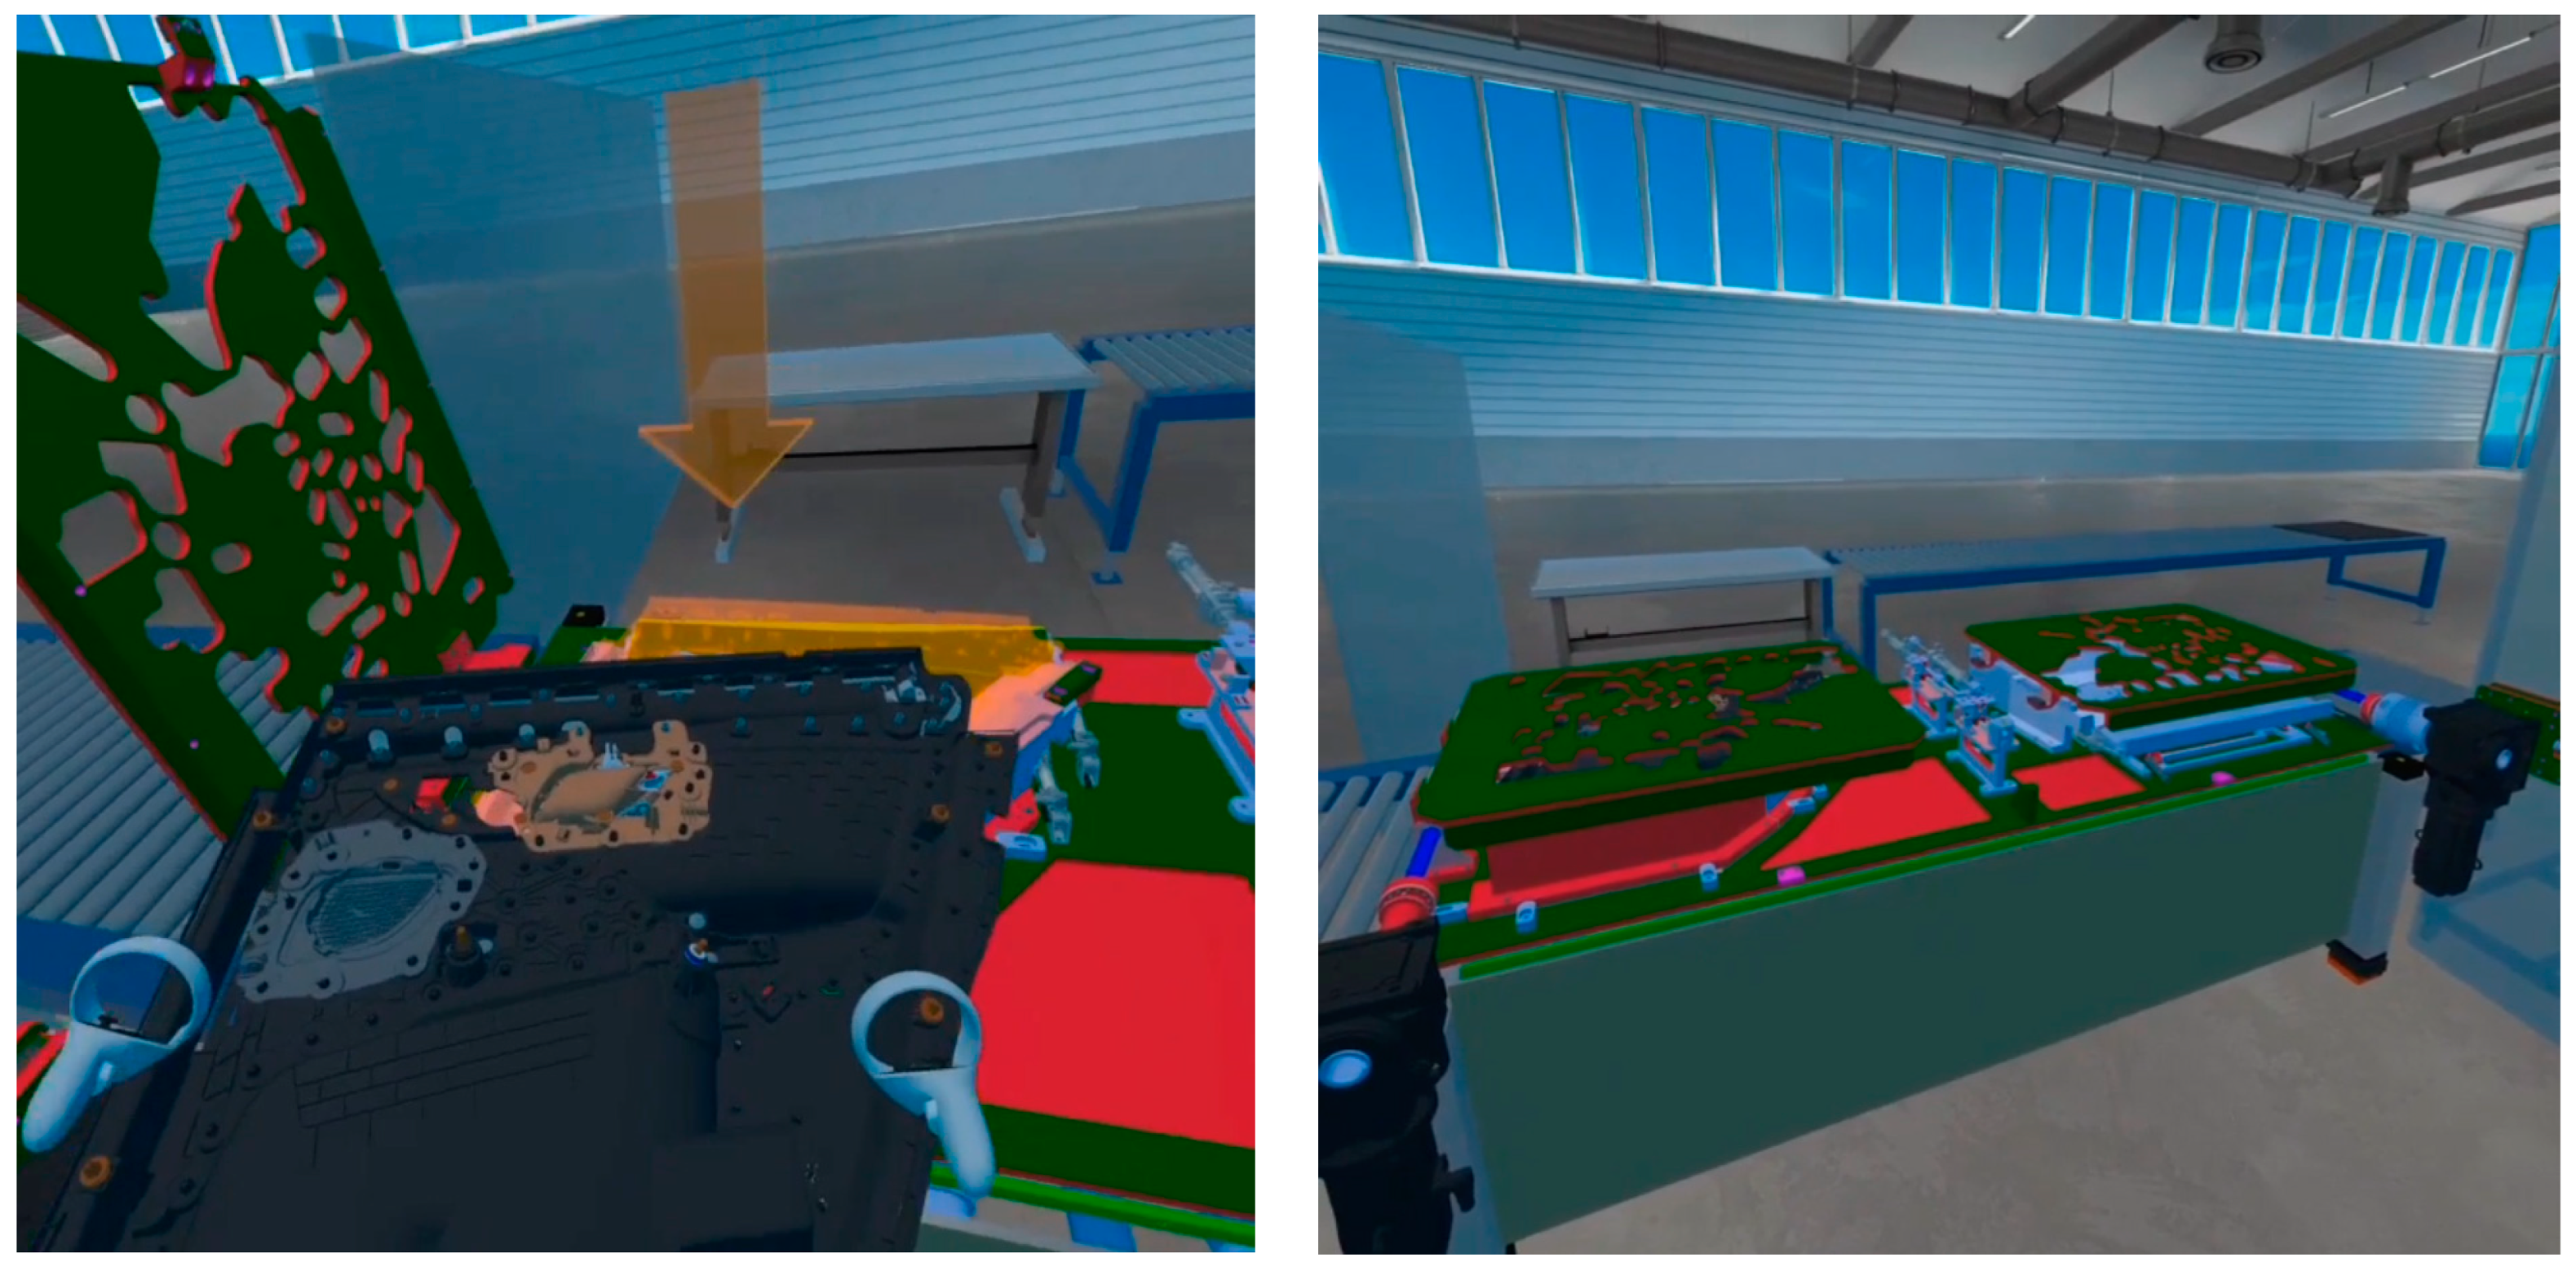
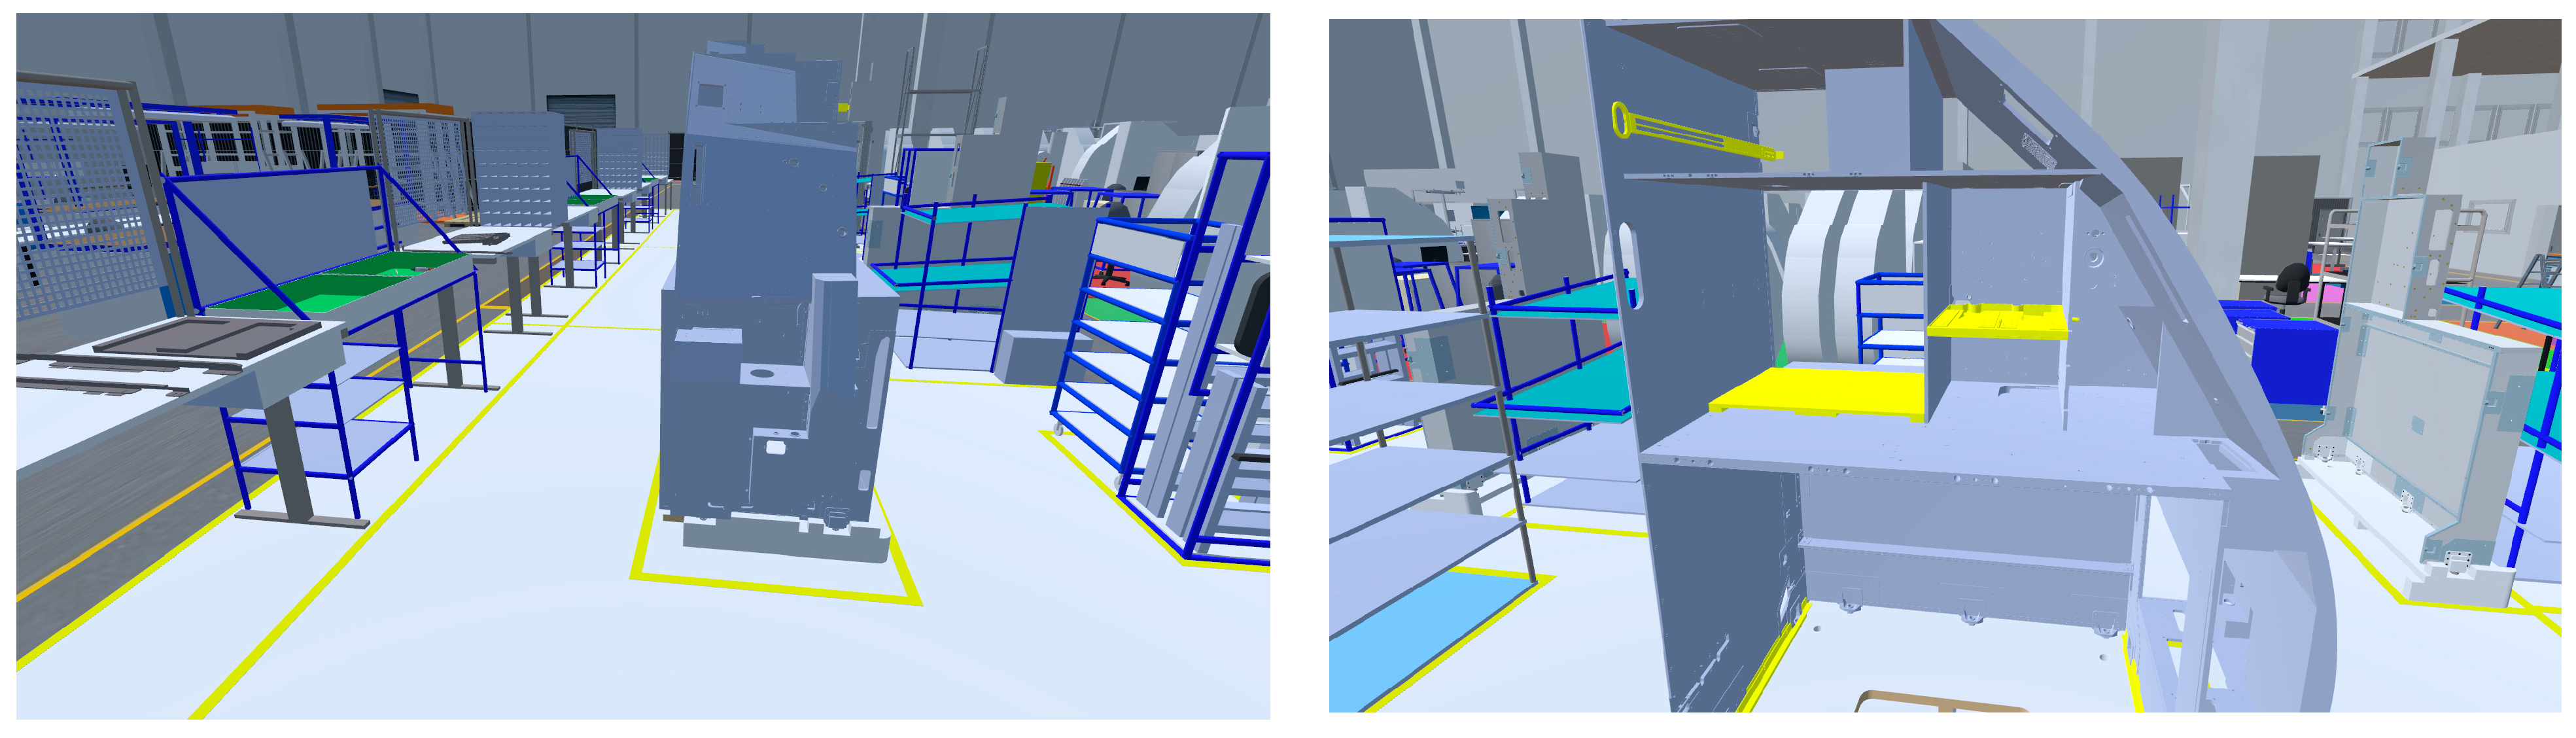
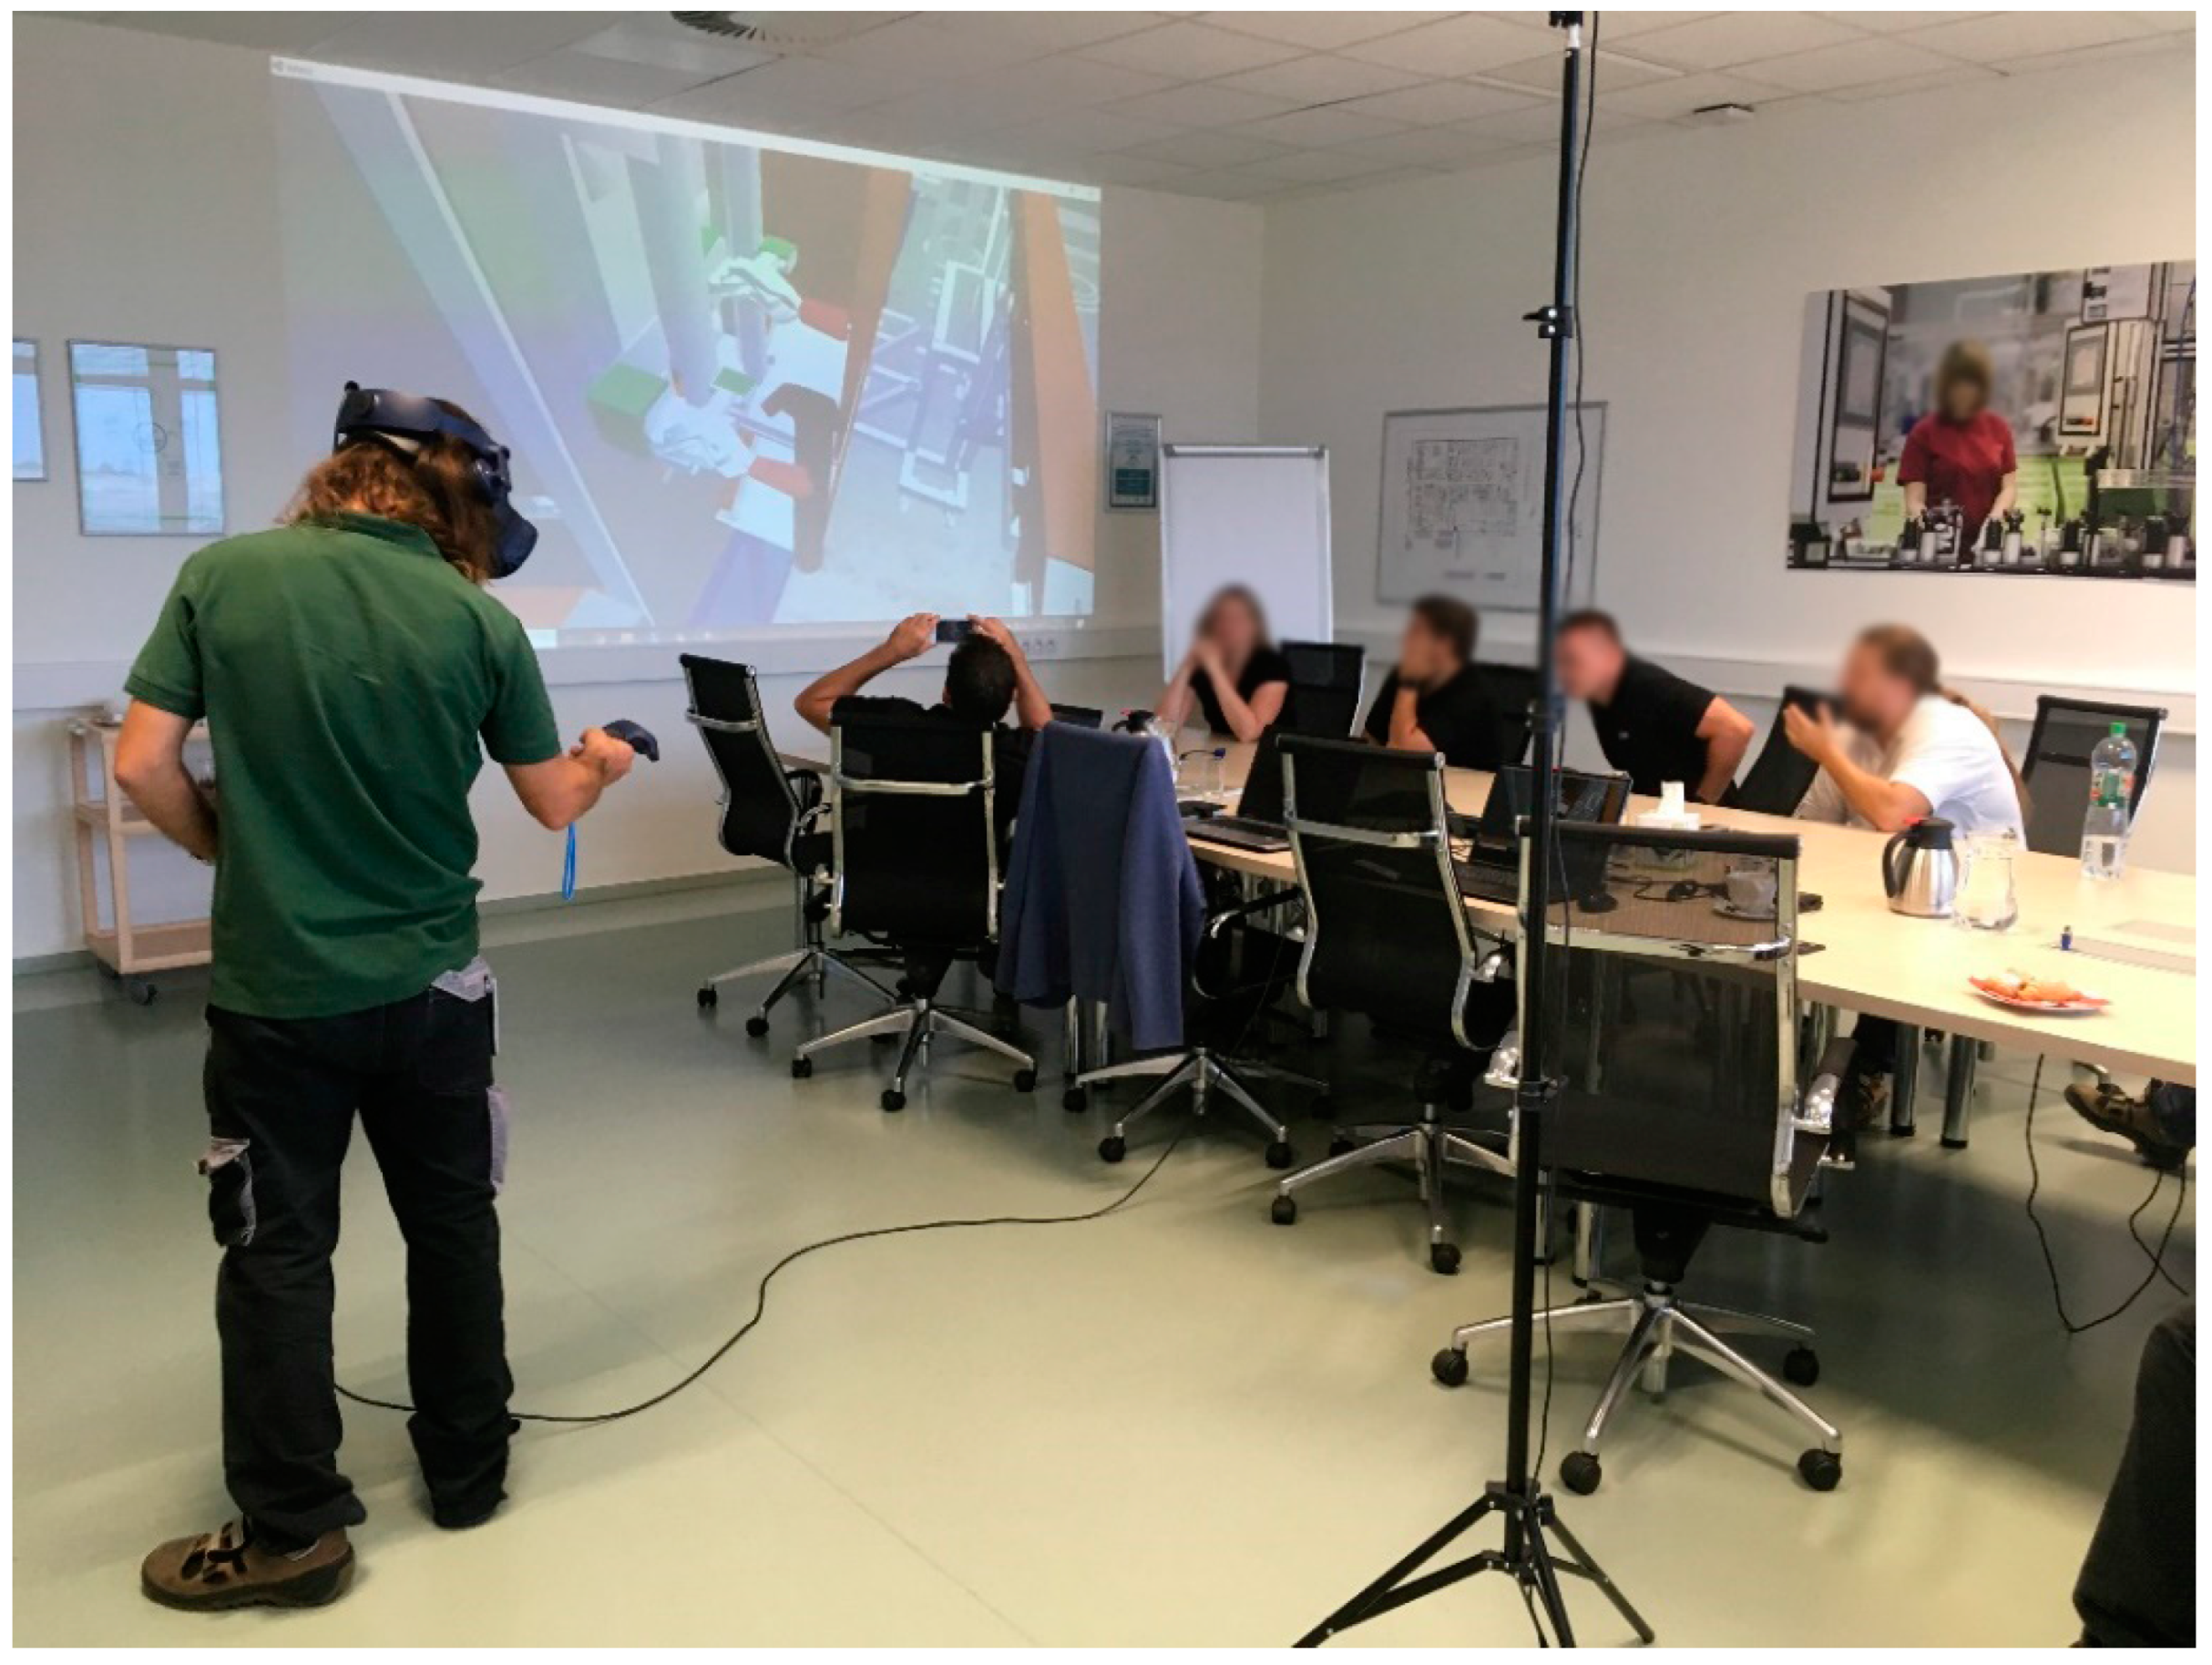
According to the proposed methodology, the process is suitable for the deployment of modern visualization tools. It is also recommended to use the VR 3D type. For this combination, a standalone VR headset was used, which allows full immersion and interaction with selected elements of the production process. A sample implementation can be seen in the images below. The whole process of the demonstration can be divided into two parts. The first part is purely manual and the second part involves working with automated production equipment as shown in
Figure 7.
The demonstration shows a visualisation of some of the steps in the production process. Specifically, this involves removing the prepared parts from the conveyor and then manually assembling the other components, including subsequent inspection and confirmation of the completion of this part with a special button.
Figure 8 shows the second part of the production process. Here, a worker removes the parts from the shelf and mounts them into the production equipment. Next, the rails are set up and a visual inspection takes place. After pressing the device button, the machine part of the work follows.
The combination and its suitability was assessed after deployment in industrial practice by an expert group and representatives of the selected company. These were representatives of the technological production preparation department and selected production operators. As a result of the validation, the suitability and type of the developed visualisation tool was demonstrated.
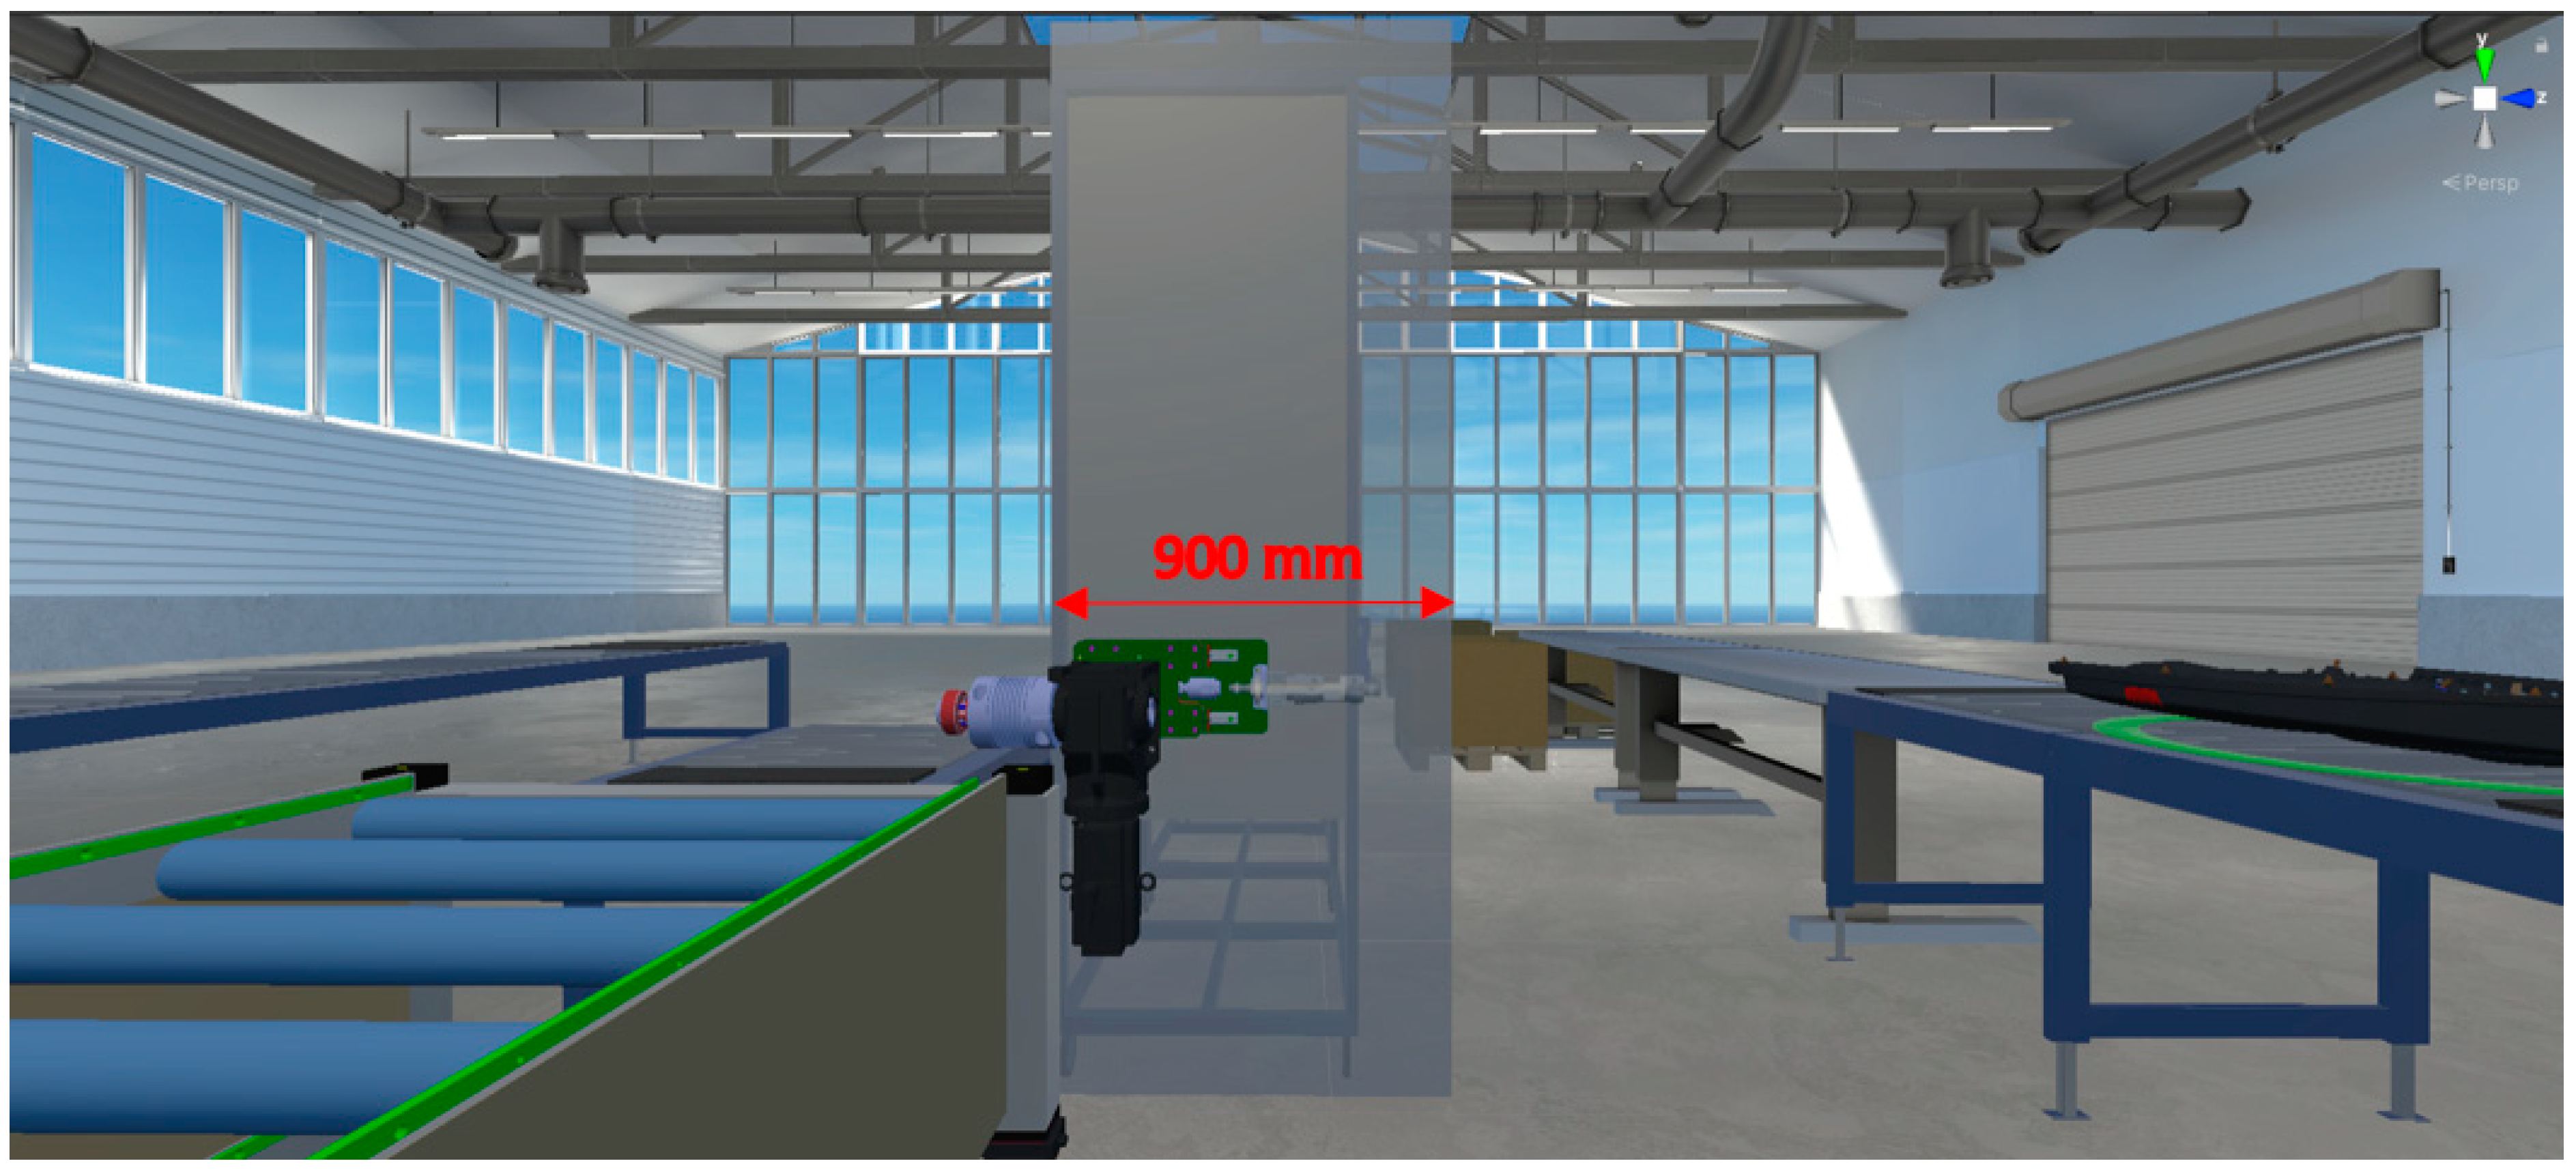
4.2. Verification of the Combination P11P42P72P81
Verification of the P11P42P72P81 combination was carried out on the production process according to the definition of the required parameters. A sufficient modified Z-score was also necessary. In
Table 11 can be seen a selected and compliant manufacturing process from a company focused on the production of components for the aerospace industry.
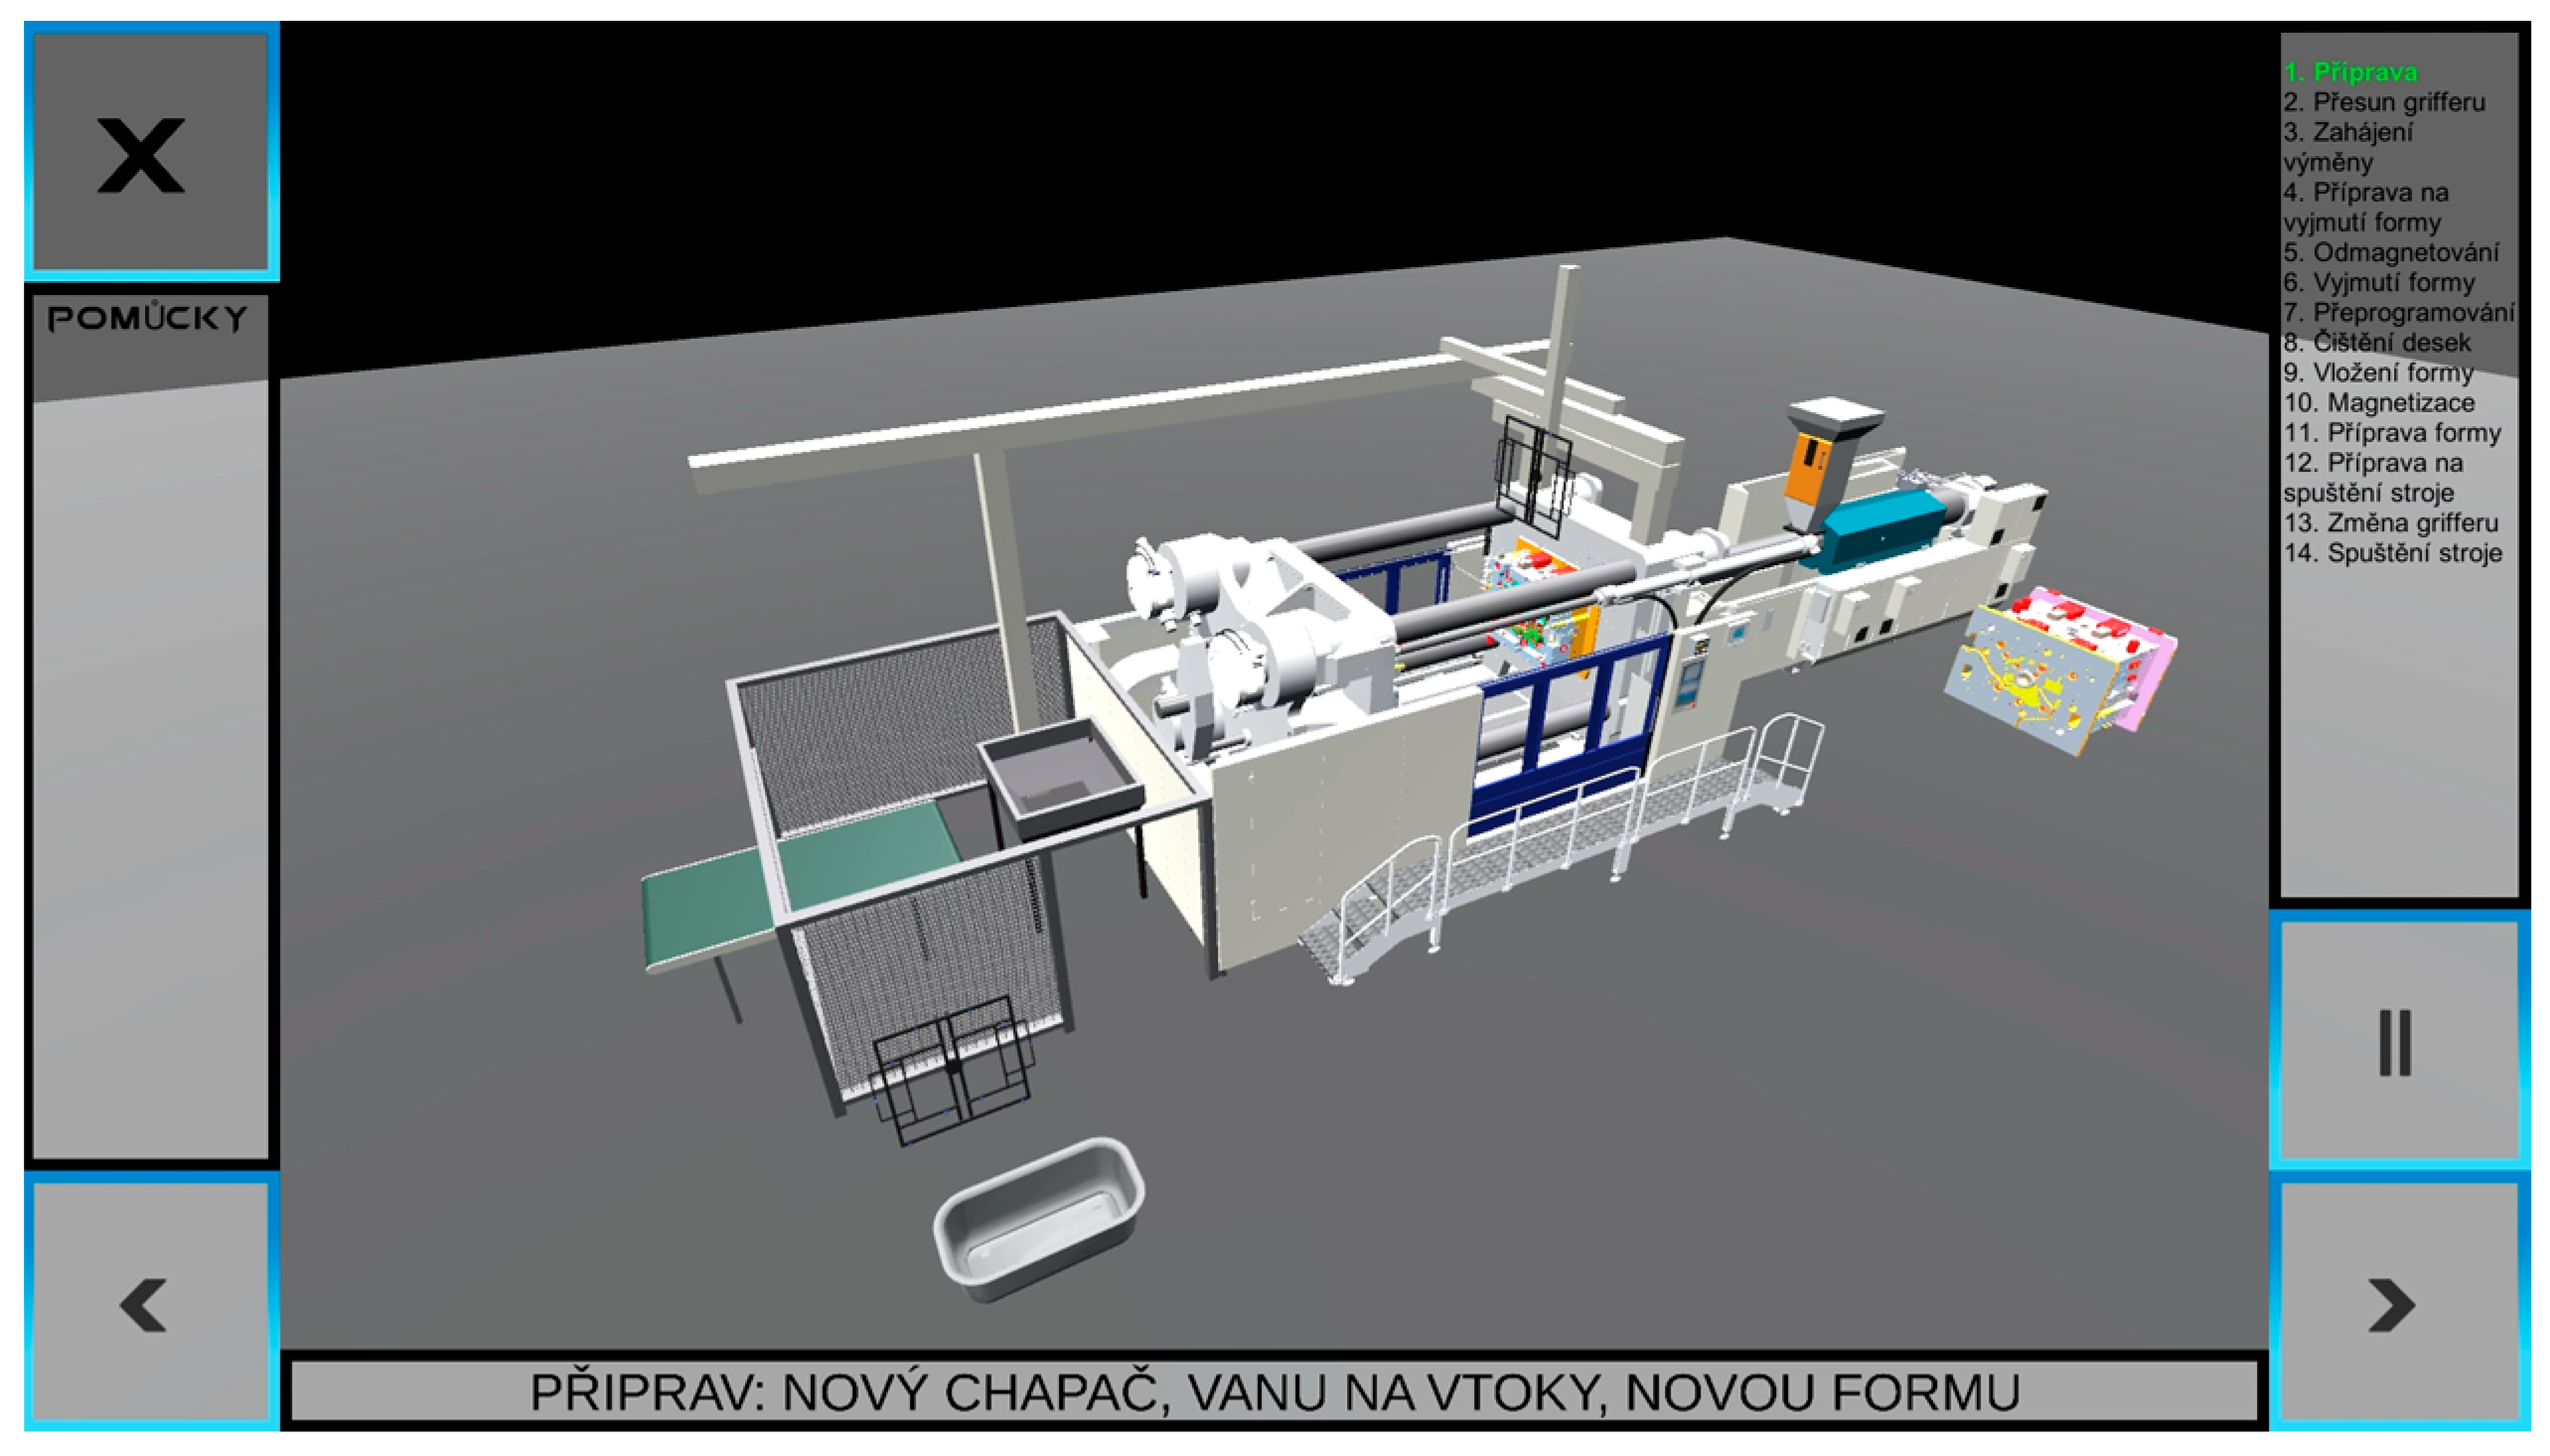
According to the proposed methodology, the suitability for deployment of modern visualization tools was confirmed. It was recommended to use the VR 3D type, as can be seen in the implementation example
Figure 9. The visualization was prepared for standalone virtual reality glasses. Again, full interaction with important elements of the process is enabled. Other elements that do not directly interfere with the process are left static without the possibility of interaction.
In the first step of the demonstration, the necessary components and tools need to be defined and prepared to successfully complete the task. These components are placed on the table marked in green. Until the preparation is complete, the worker cannot proceed to the next step.
After successful preparation, the individual components are assembled into a larger unit by hand according to a pre-set procedure. Here the worker uses several tools.
This combination was again tested after deployment in industrial practice.
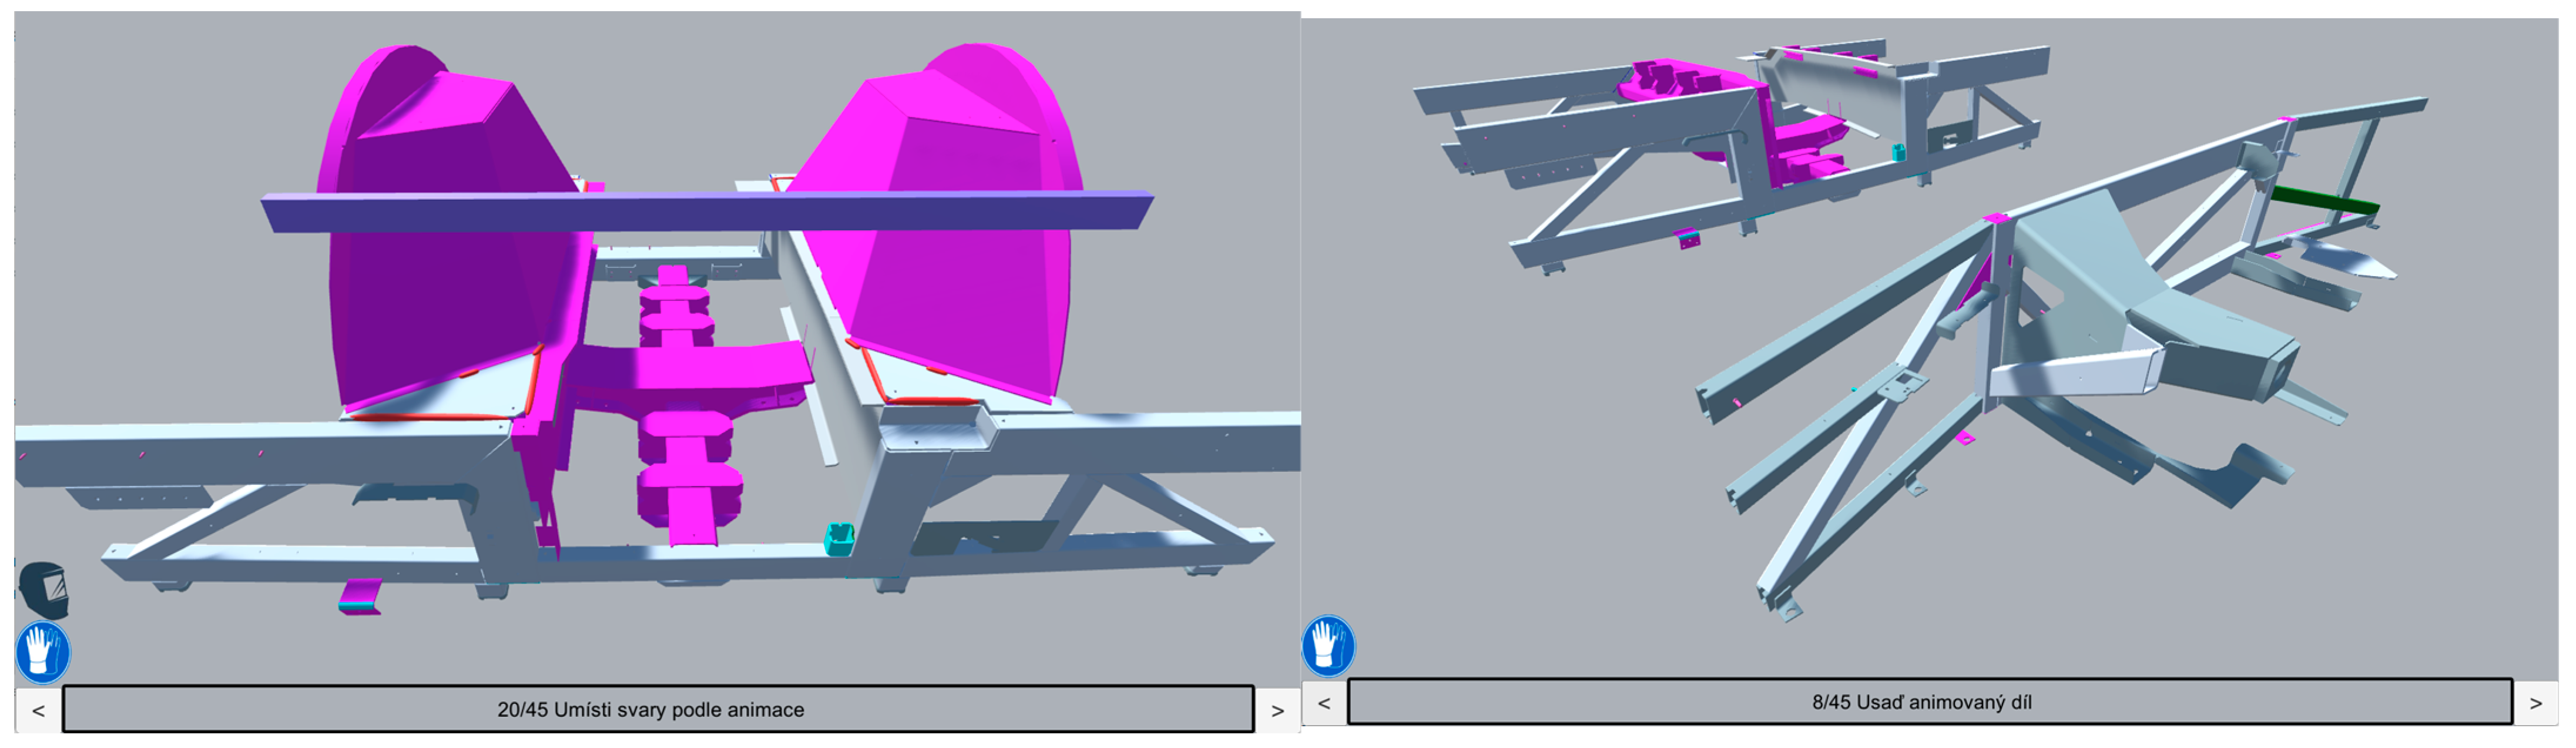
4.3. Verification of the Combination P11P43P71P82
The P11P43P71P82 combination was validated on a production process with a modified Z-score of 14.57. Again, this was an emerging workstation in the design phase, which is specific to high repeatability of production and fast time steps, as can be seen in
Table 12.
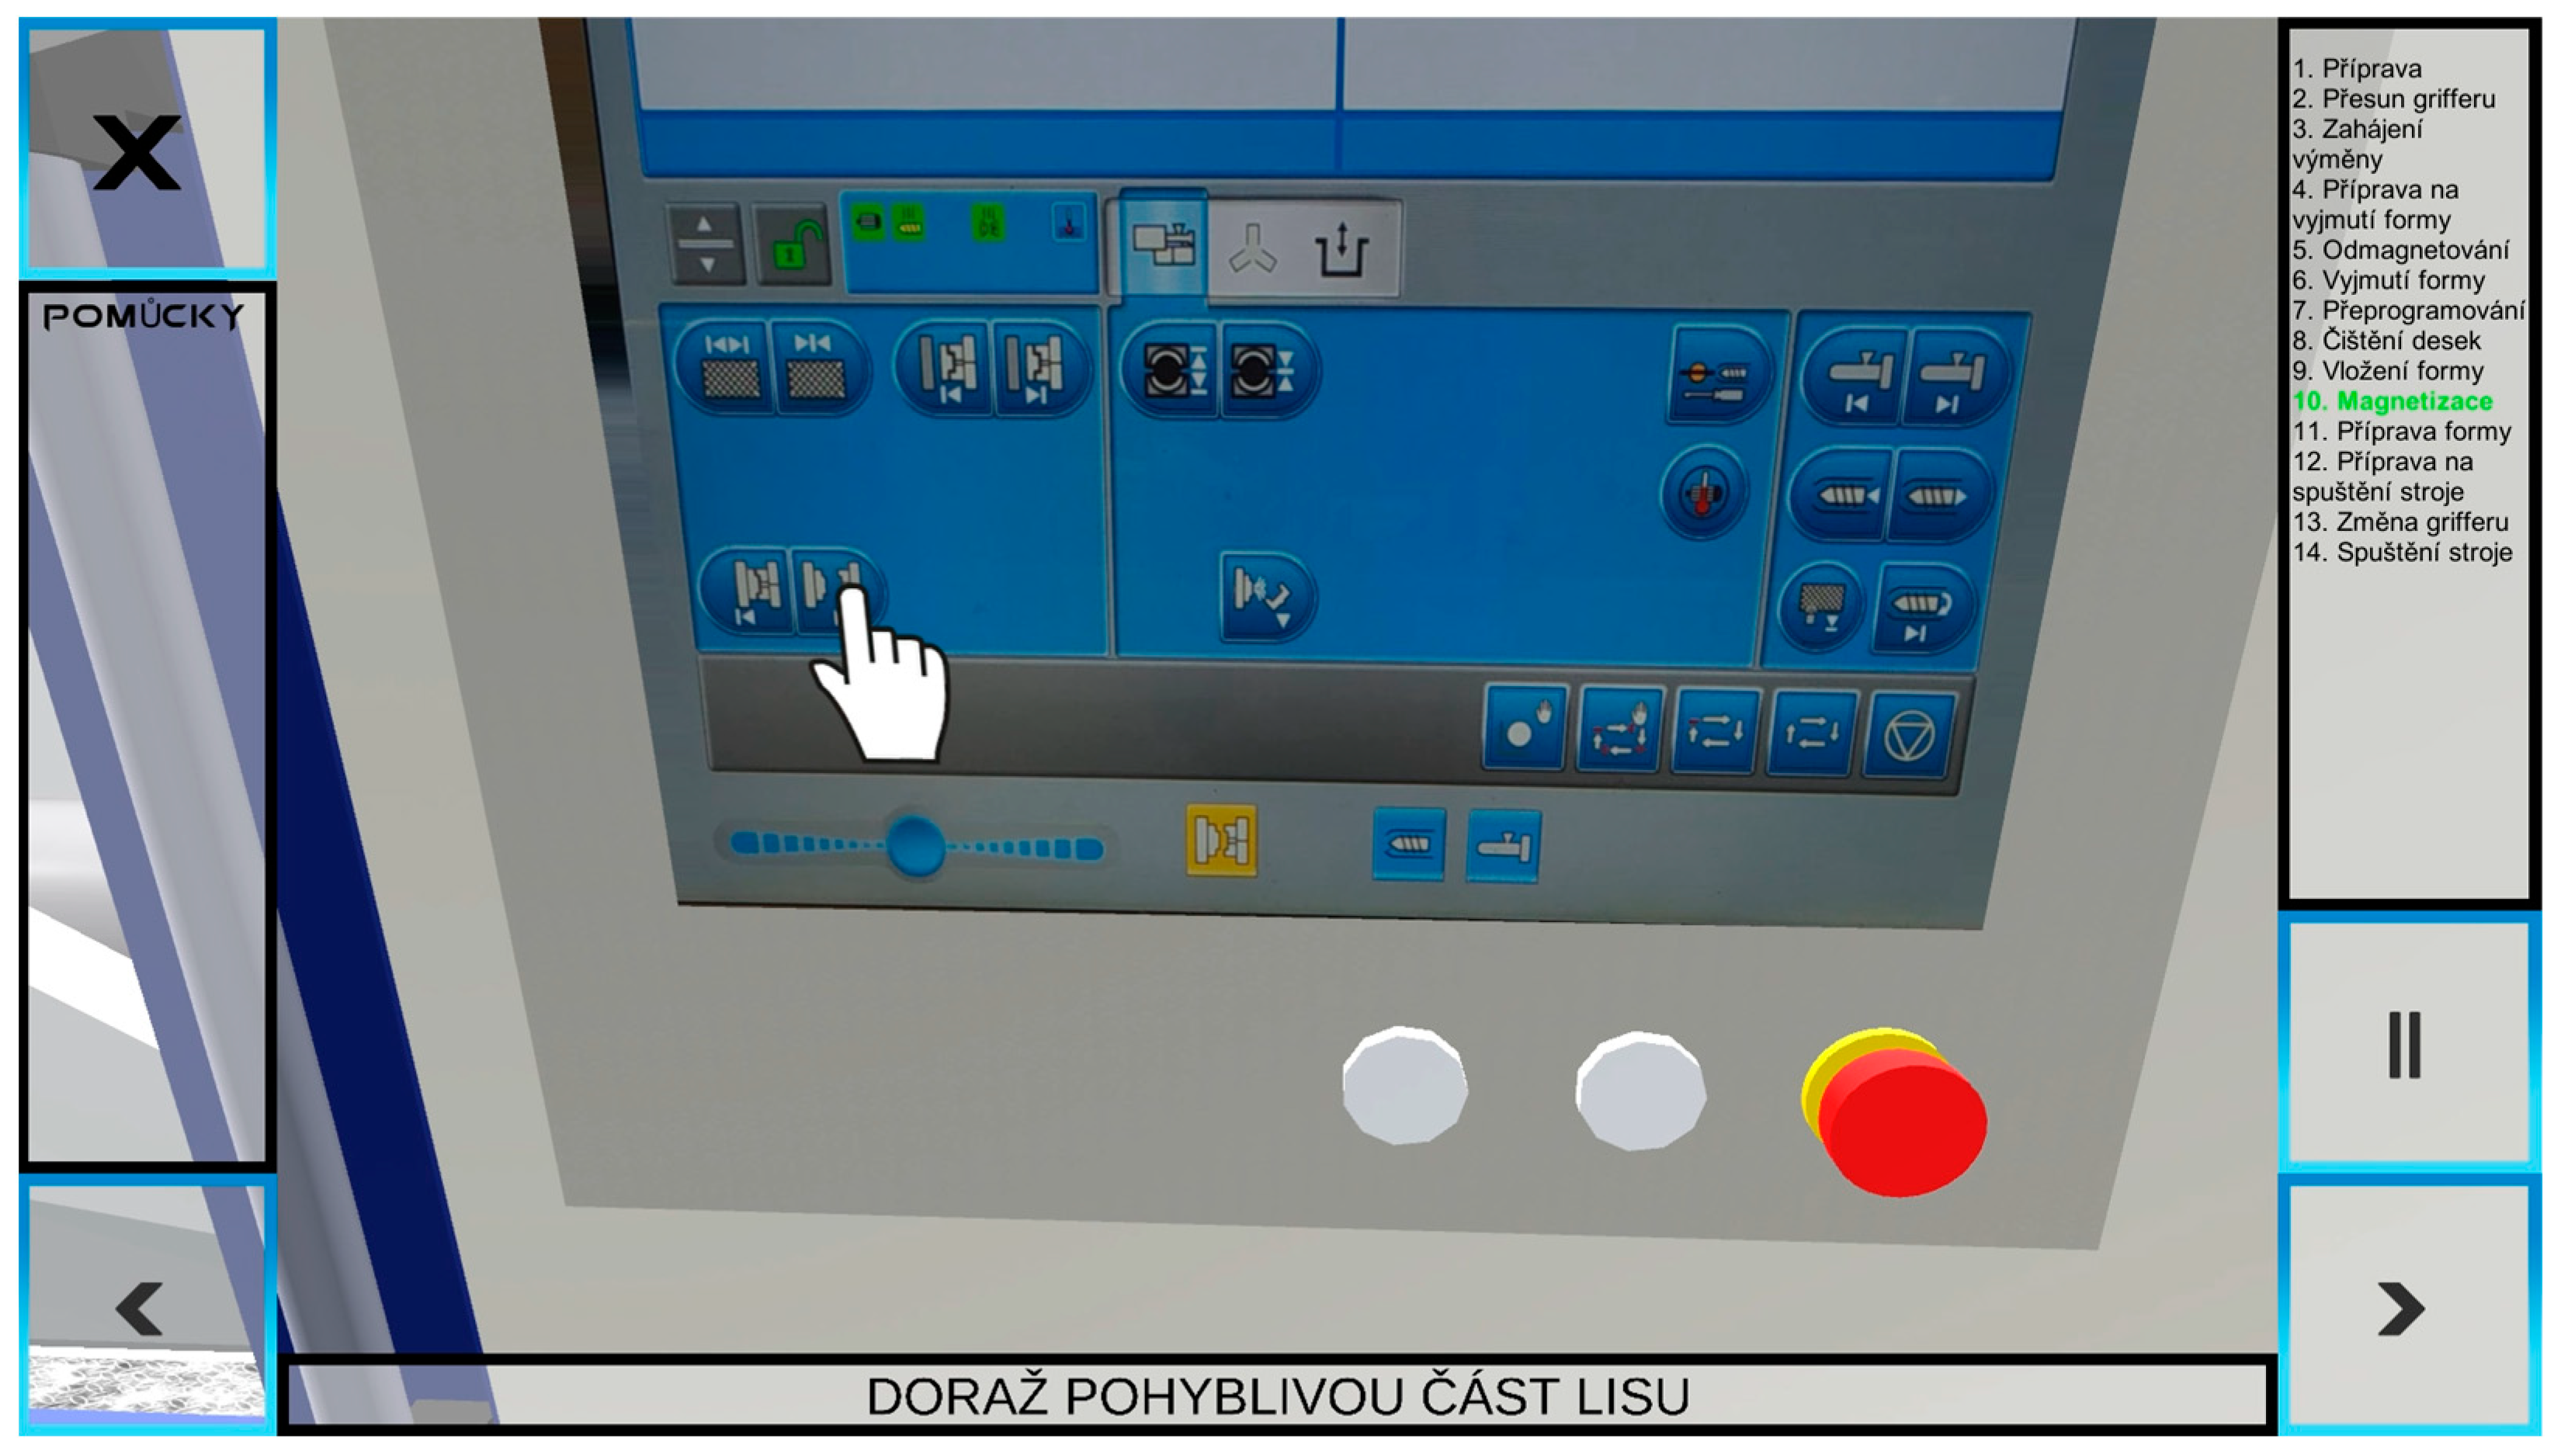
Using the methodology, it was recommended to use the VR 3D type. The visualization was prepared for a stationary VR headset, as it is commonly used in the company (see
Figure 10). The VR headset is equipped with a set of controllers that provide the worker’s interactions with the VR environment.
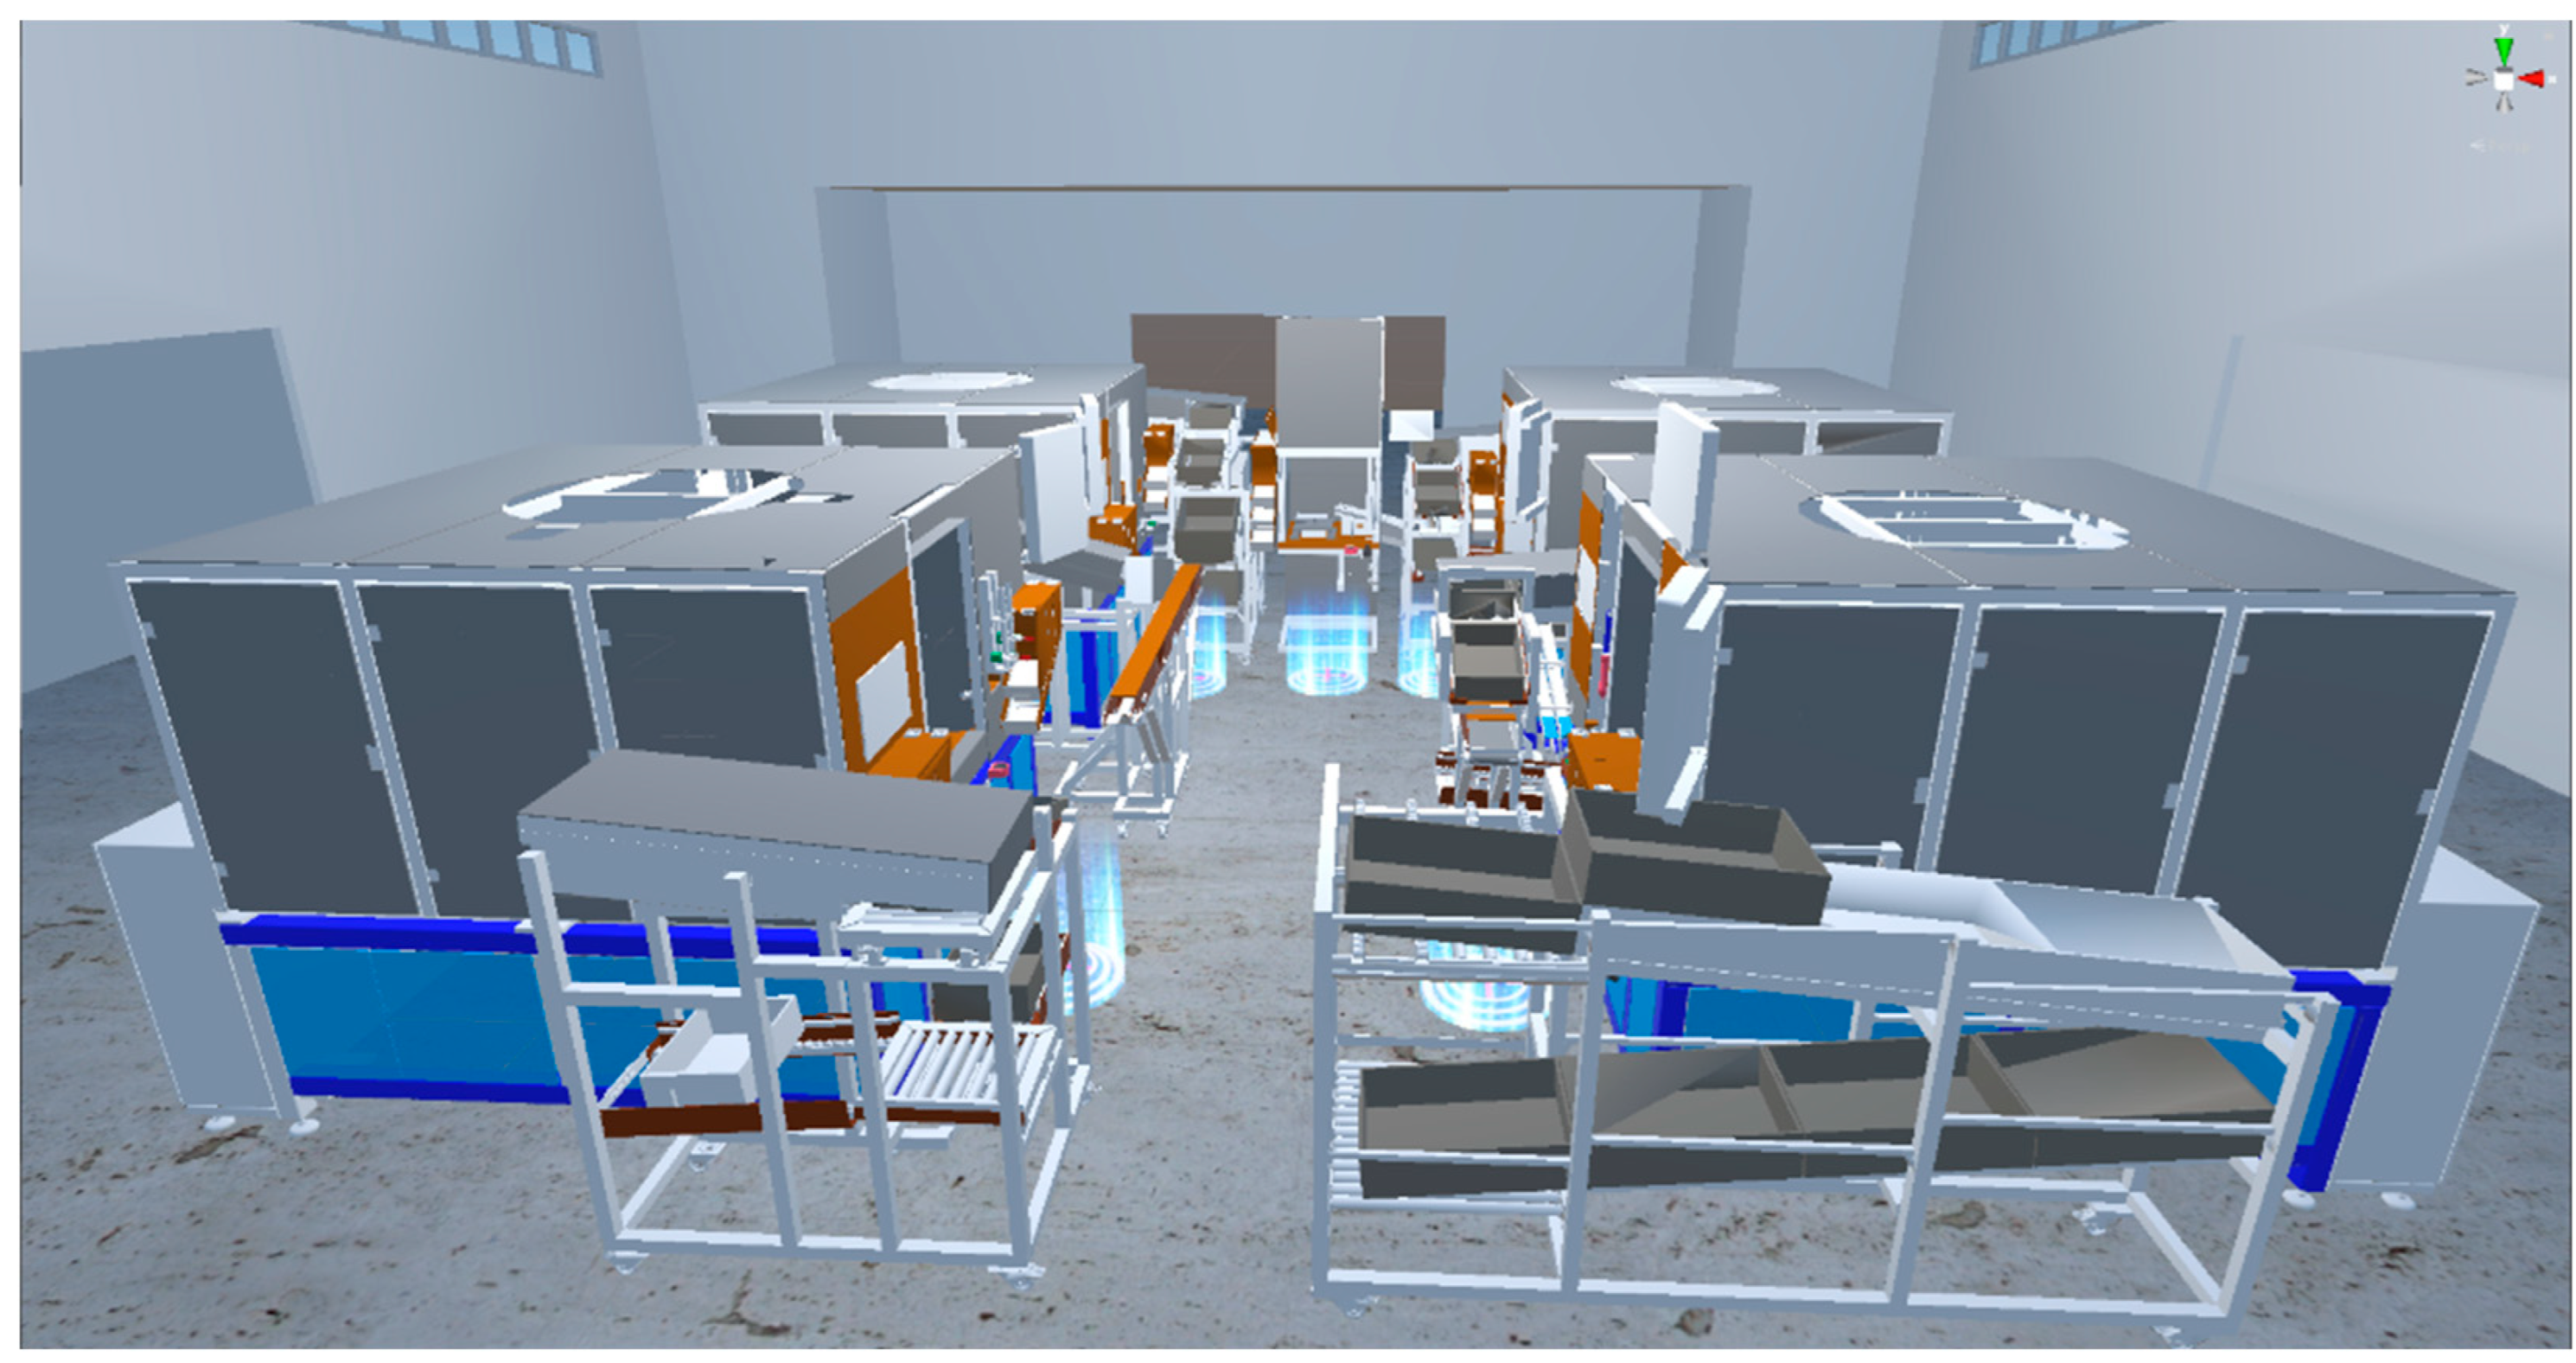
Using the visualization tool, it was possible to simulate the future production process, which consists of five jobs that interact with each other. It is therefore important to synchronise the production steps on all five workstations. VR 3D allowed for the efficient standardization of the individual process steps while aligning all the workstations so that downtime would not occur due to large differences in operation times between interconnected workstations. The speed of production is determined by the slowest link-the workstation.
In
Figure 11 you can see the created VR shared workspace environment. Each workspace is Interactable in VR. These workstations are used to load parts into a jig located inside the production facility. The stacking is performed in a pre-set sequence and a clearly defined final position for stacking.
The verification was carried out together with the technical training department, production workers and the expert group. As a result, it was confirmed that the solution was correctly selected according to the methodology.
4.4. Verification of the Combination P12P42P71P81
Validation of the P12P42P71P81 combination was performed on a production process with a modified Z-score of 14.88. This was an existing workstation.
Table 13 shows a specific manufacturing process from an automotive company.
According to the methodology, it was recommended to use a VR 2D stationary instrument. The visualisation was prepared for a 2D stationary display showing virtual reality (see
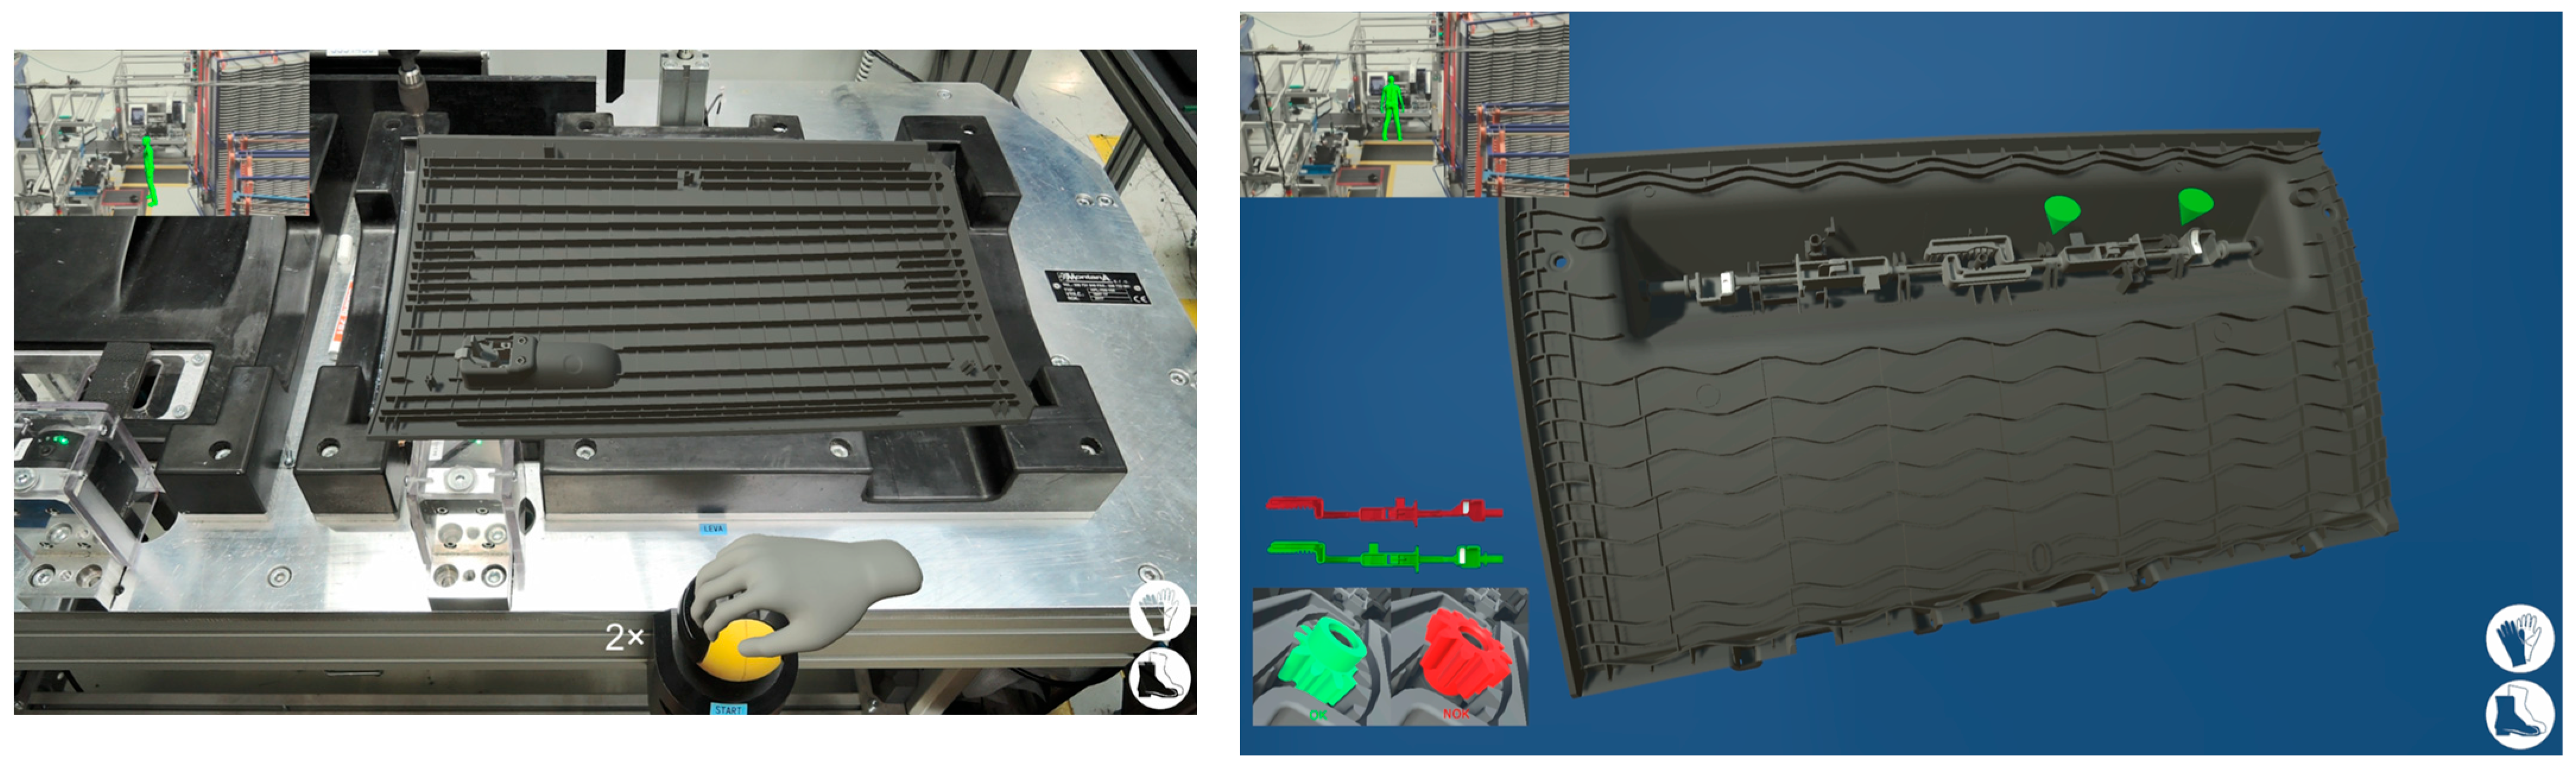
Figure 12). The placement was made fixed at the workstation. In the demonstration, two selected steps of the manufacturing process can be seen. The visualisation is supplemented with text or a colour scale for some steps for clarity. The green colour symbolizes the correct position or placement of the parts. Red shows the incorrect option.
For better orientation of workers in the space, the solution includes a virtual window of the worker’s position at the workplace. The window is located in the upper left corner of the demonstration.
This was followed by the deployment of the designed variant in a real production process and testing with the help of production workers and production managers. As a result, the suitability of the VR 2D stationary solution for this particular combination of parameters was demonstrated.
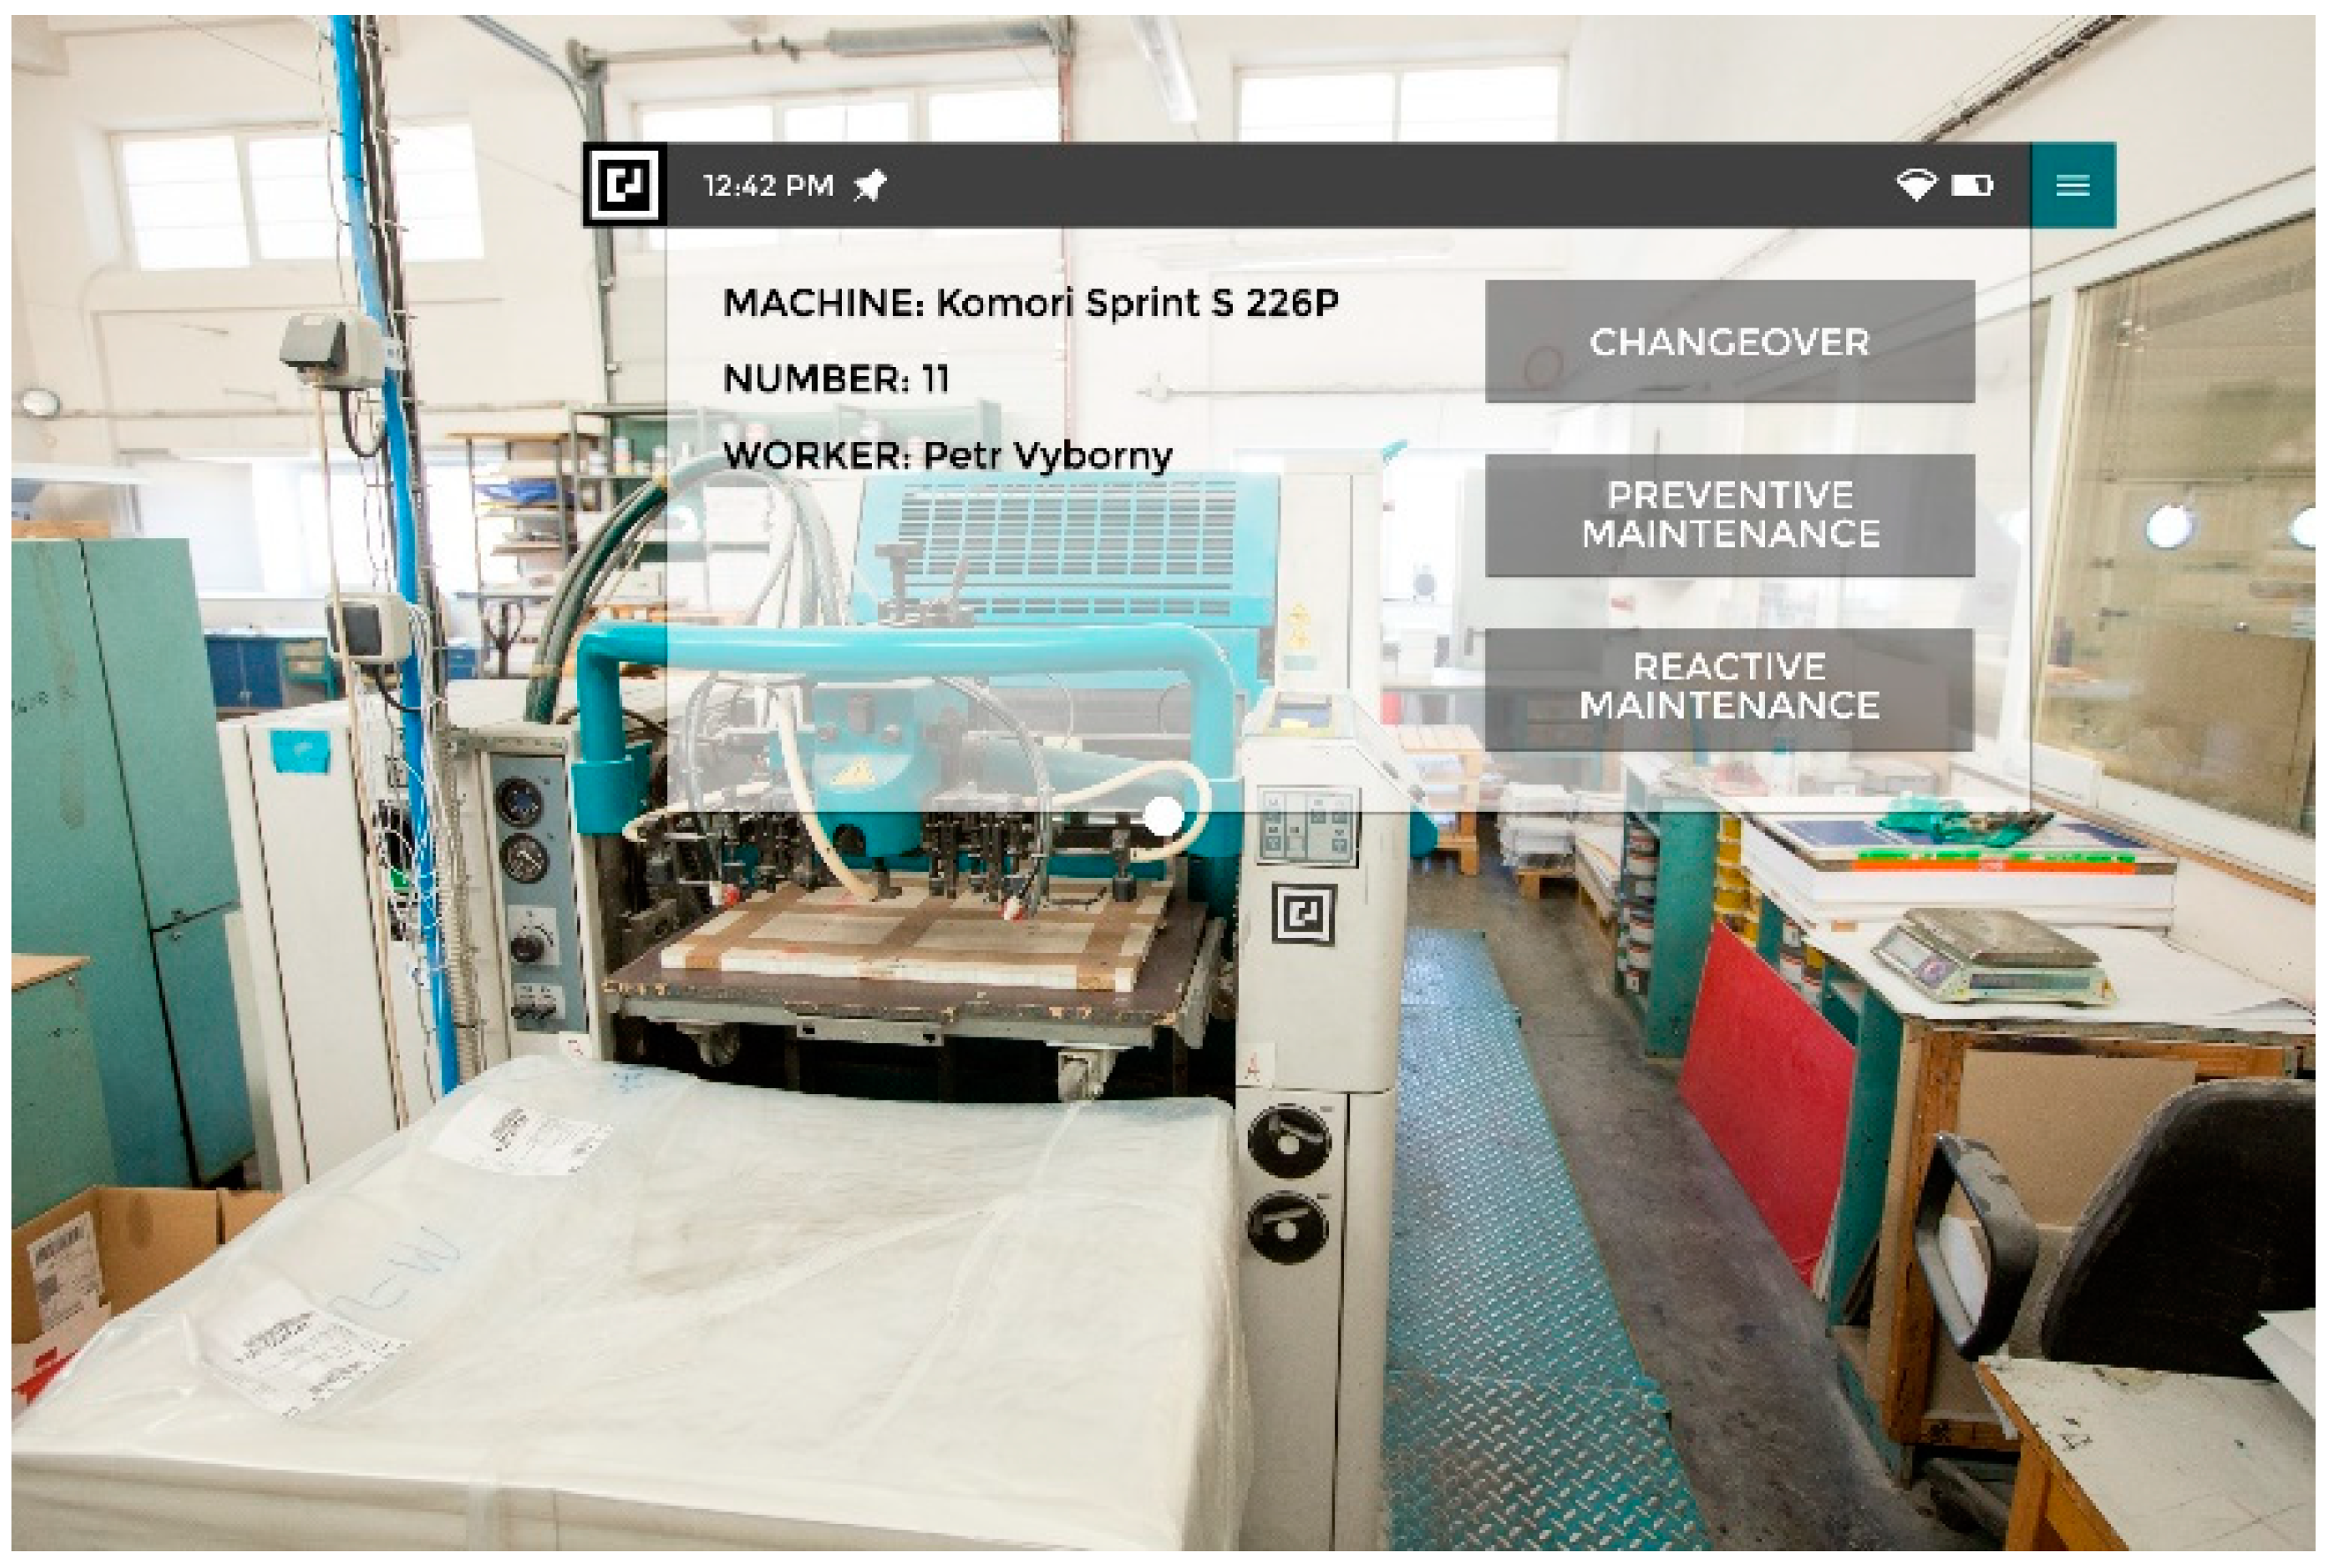
4.5. Verification of the Combination P12P42P71P82
Validation of the P12P42P71P82 combination was performed on a manufacturing process with a modified Z-score of 16.00. In
Table 14 can be seen the parameters of the manufacturing process in a company focused on the production of components for the automotive industry.
The type of VR 2D stationary visualization tool was selected based on the proposed methodology. The display was on a stationary 2D monitor suspended at the workstation. The selected visualization tool allows the selection of the specific type of product to be produced and it is possible to switch between the types. The steps are aligned in virtual reality with the real working time to avoid inaccurate display. It is possible to scroll between the steps of the visualization by pressing the arrows in the bottom corners of the touch screen as is shown in
Figure 13.
The designed visualization tool was then deployed and tested in a real industrial enterprise environment. The VR 2D stationary solution solved the long-term complications of the enterprise within the process. This means that the type and position of the visualization tool selected by the proposed methodology is proven to be very effective.
4.6. Verification of the Combination P12P42P72P81
The P12P42P72P81 combination was validated on a production process with a modified Z-score of 14.31. This is an existing workstation which has a high emphasis on error prevention and the personnel flow around the workstation, as can be seen in
Table 15.
Using the proposed methodology, the suitability of deploying modern visualization tools was assessed and a 2D portable VR type was selected, as can be seen in the actual display was performed on a 2D portable industrial display, shown in
Figure 14.
The selected process has a high personnel flow, which makes it impossible to use stationary solutions. Therefore, the option of a special industrial tablet was chosen. This tablet must also be able to be operated while wearing gloves. At the same time, the production process is carried out in a dusty environment, and it was necessary to choose a device that is suitable for the environment. It is controlled by simply switching between steps using arrow buttons in the bottom corners of the screen. For easy orientation in the process, a bottom bar with a description and a numerical designation of the visualization step is used.
This solution enables the movement of the worker together with the visualization tool to ensure its constant availability. This option has been assessed as satisfactory.
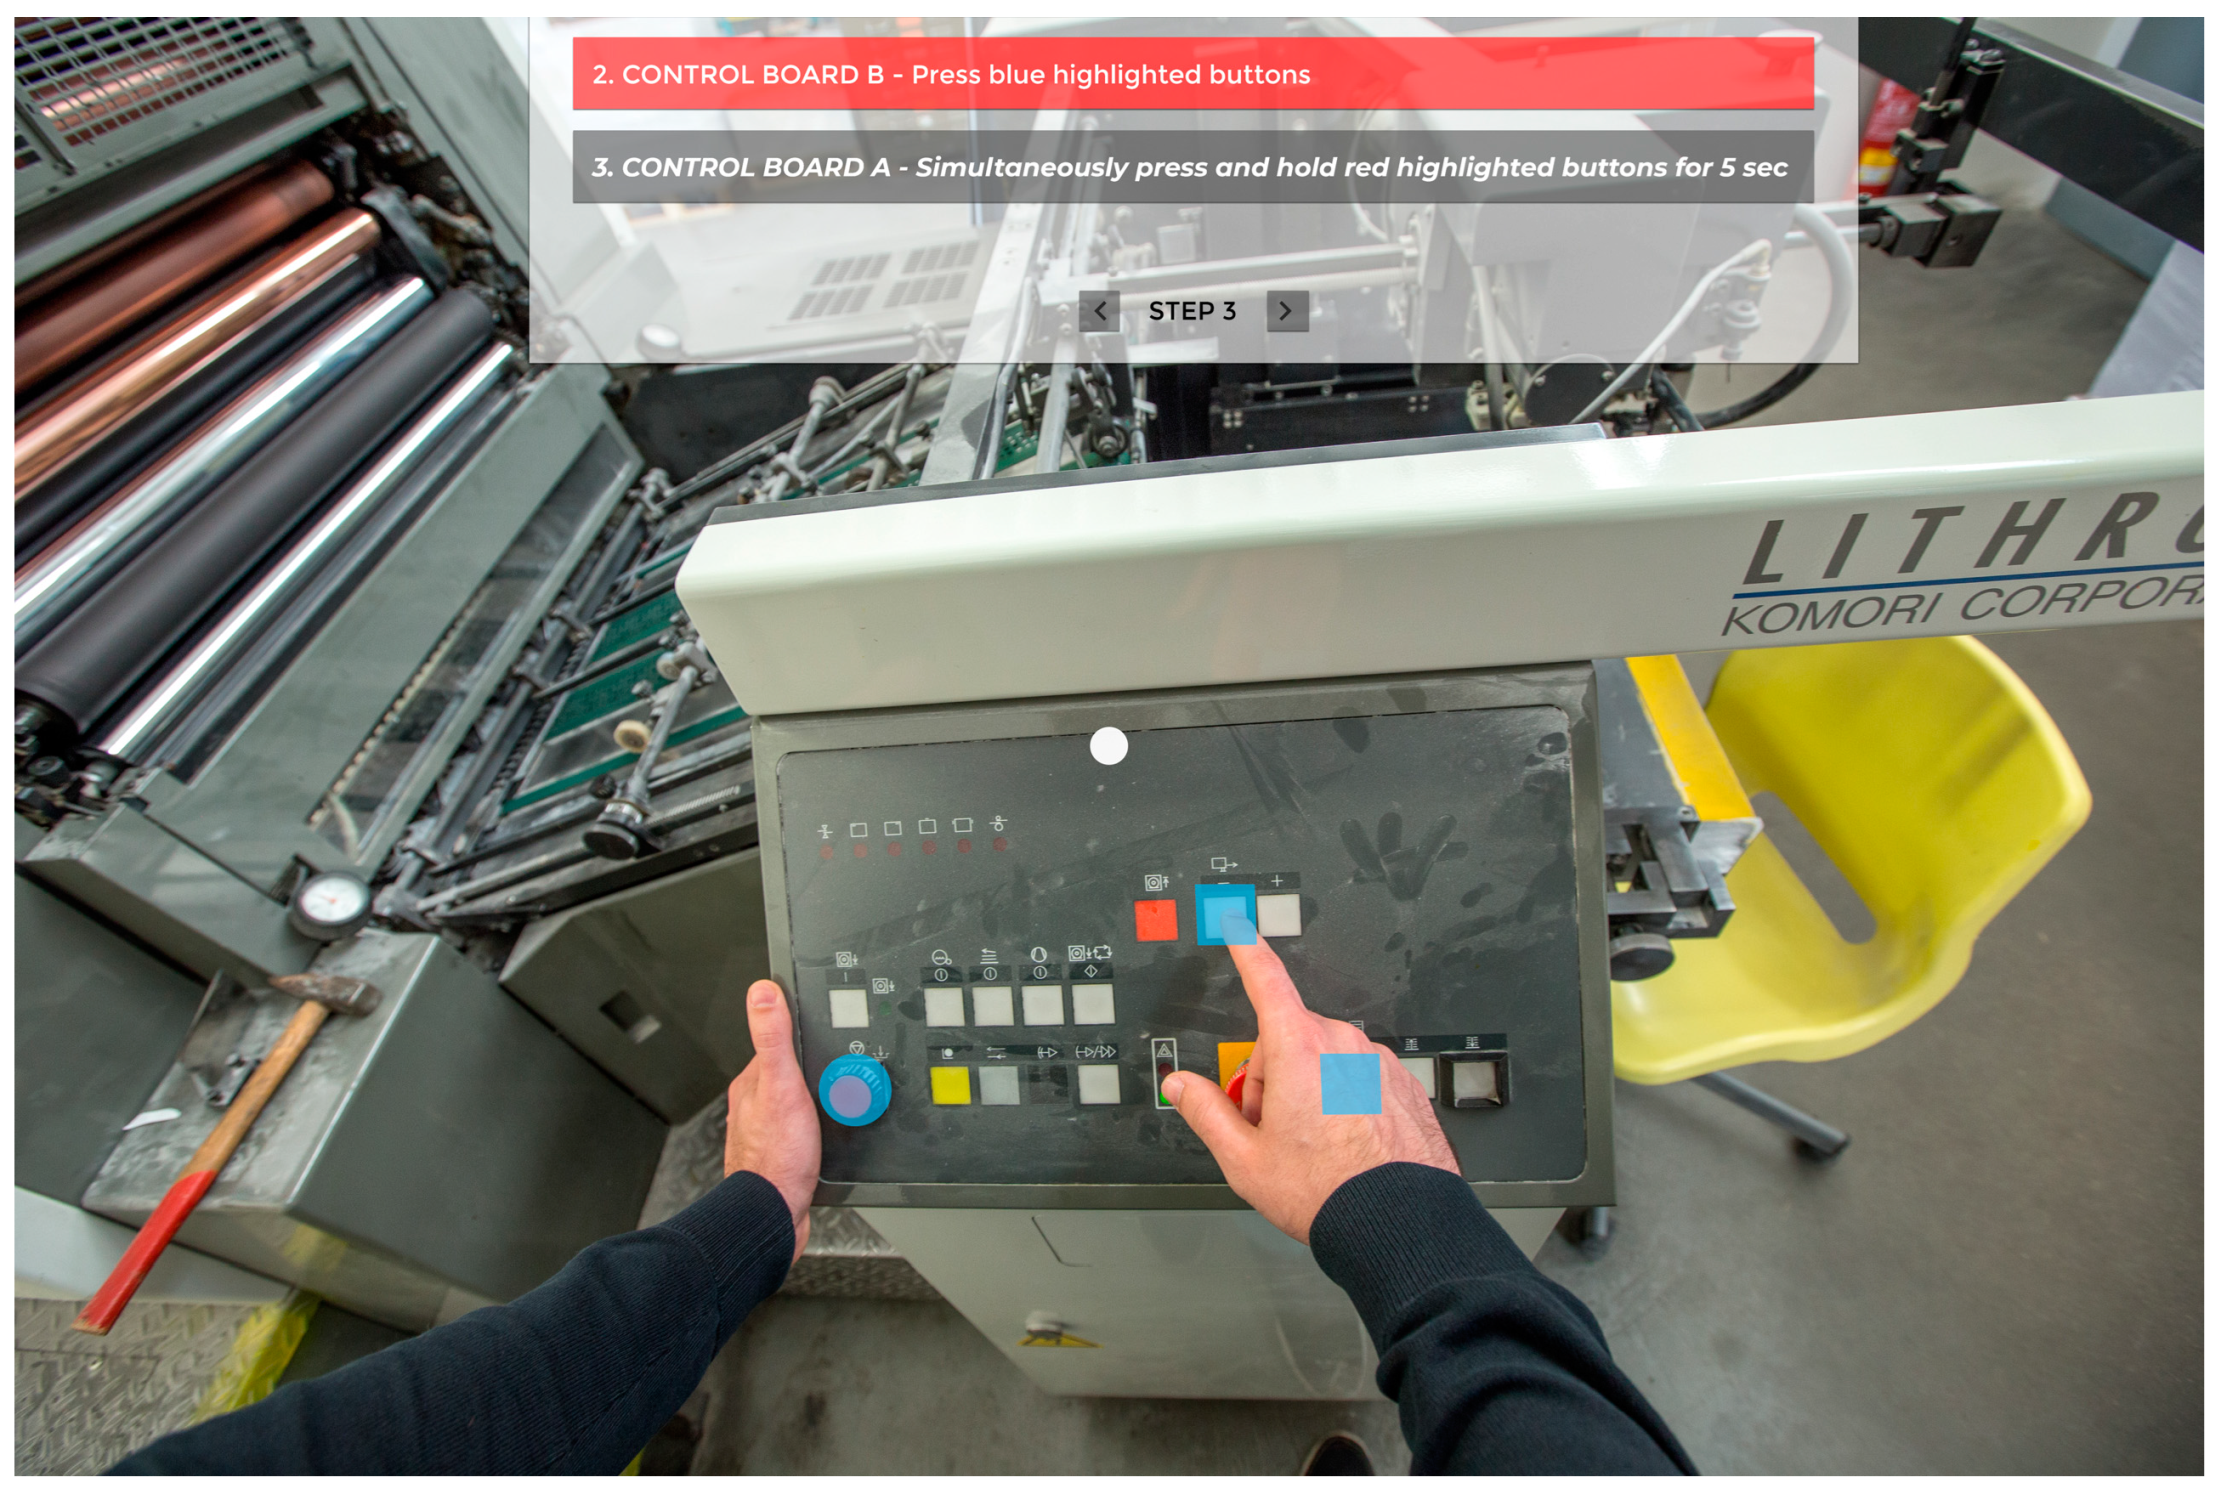
4.7. Verification of the Combination P12P42P72P82
The P12P42P72P82 combination was validated on a production process with a modified Z-score of 15.41. The site already exists. Here the key needs are for frequent work using both hands simultaneously and the large distance of personnel flows, as can be seen in
Table 16.
In
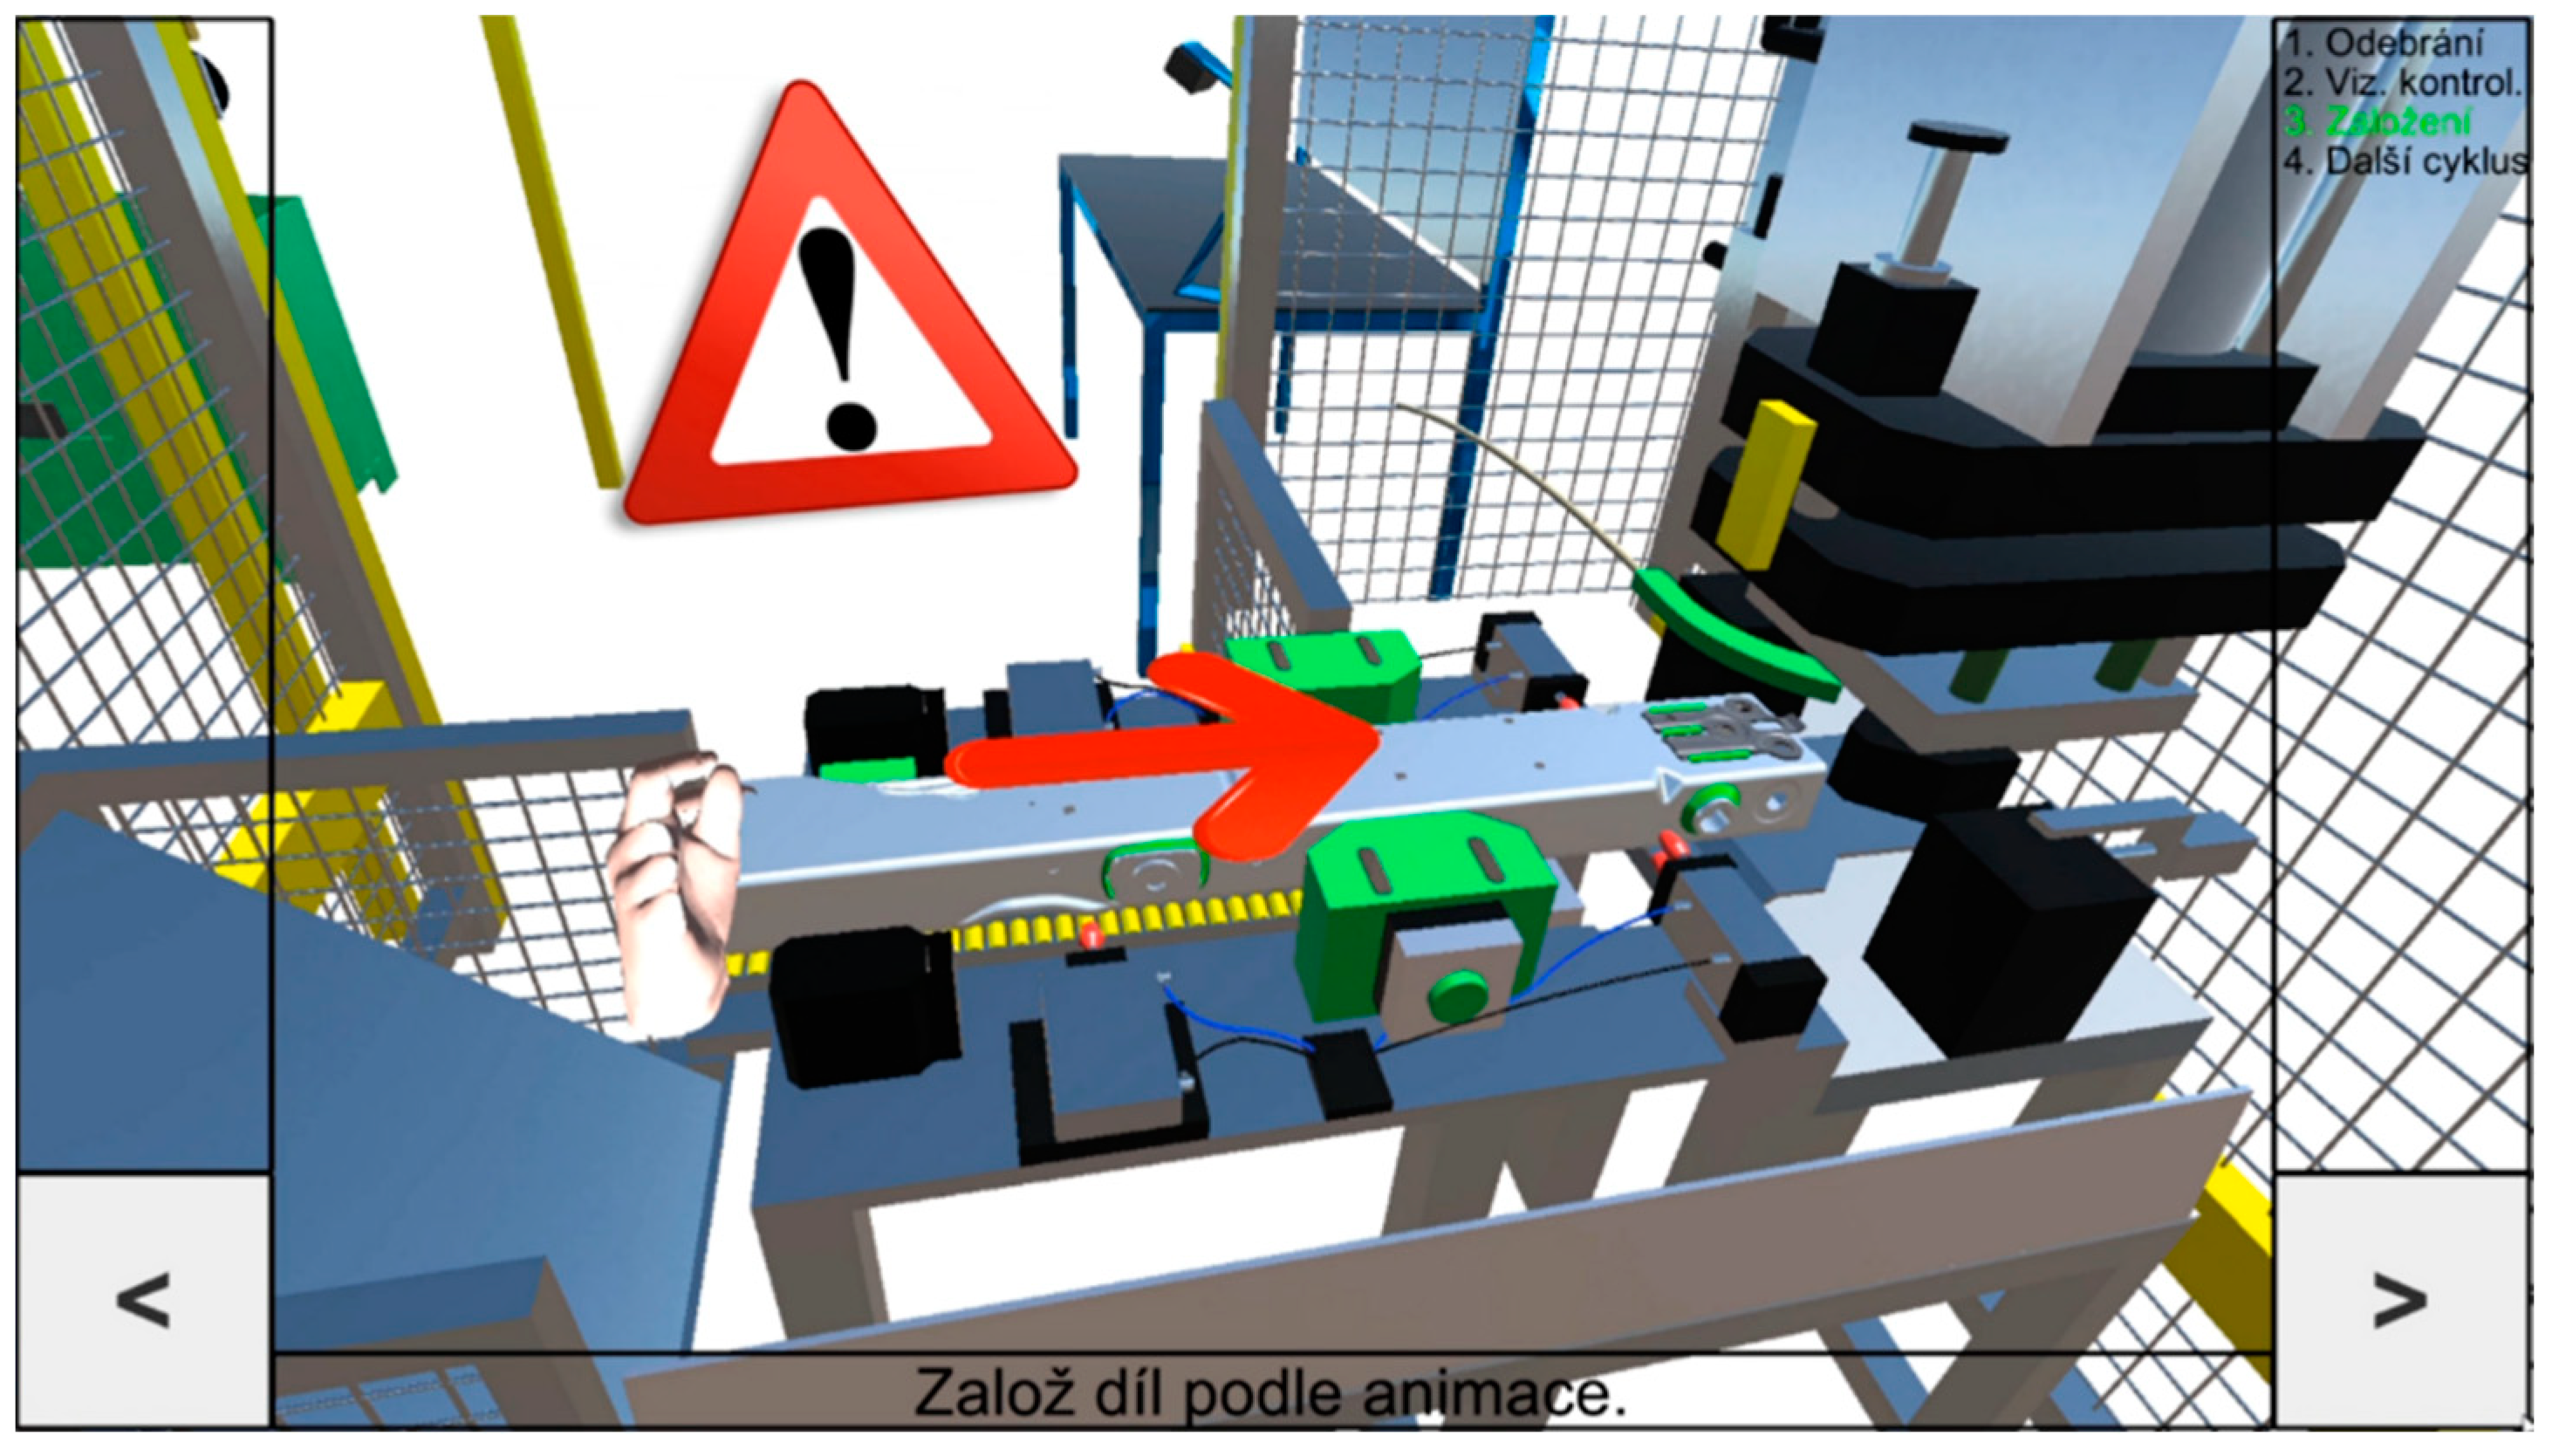
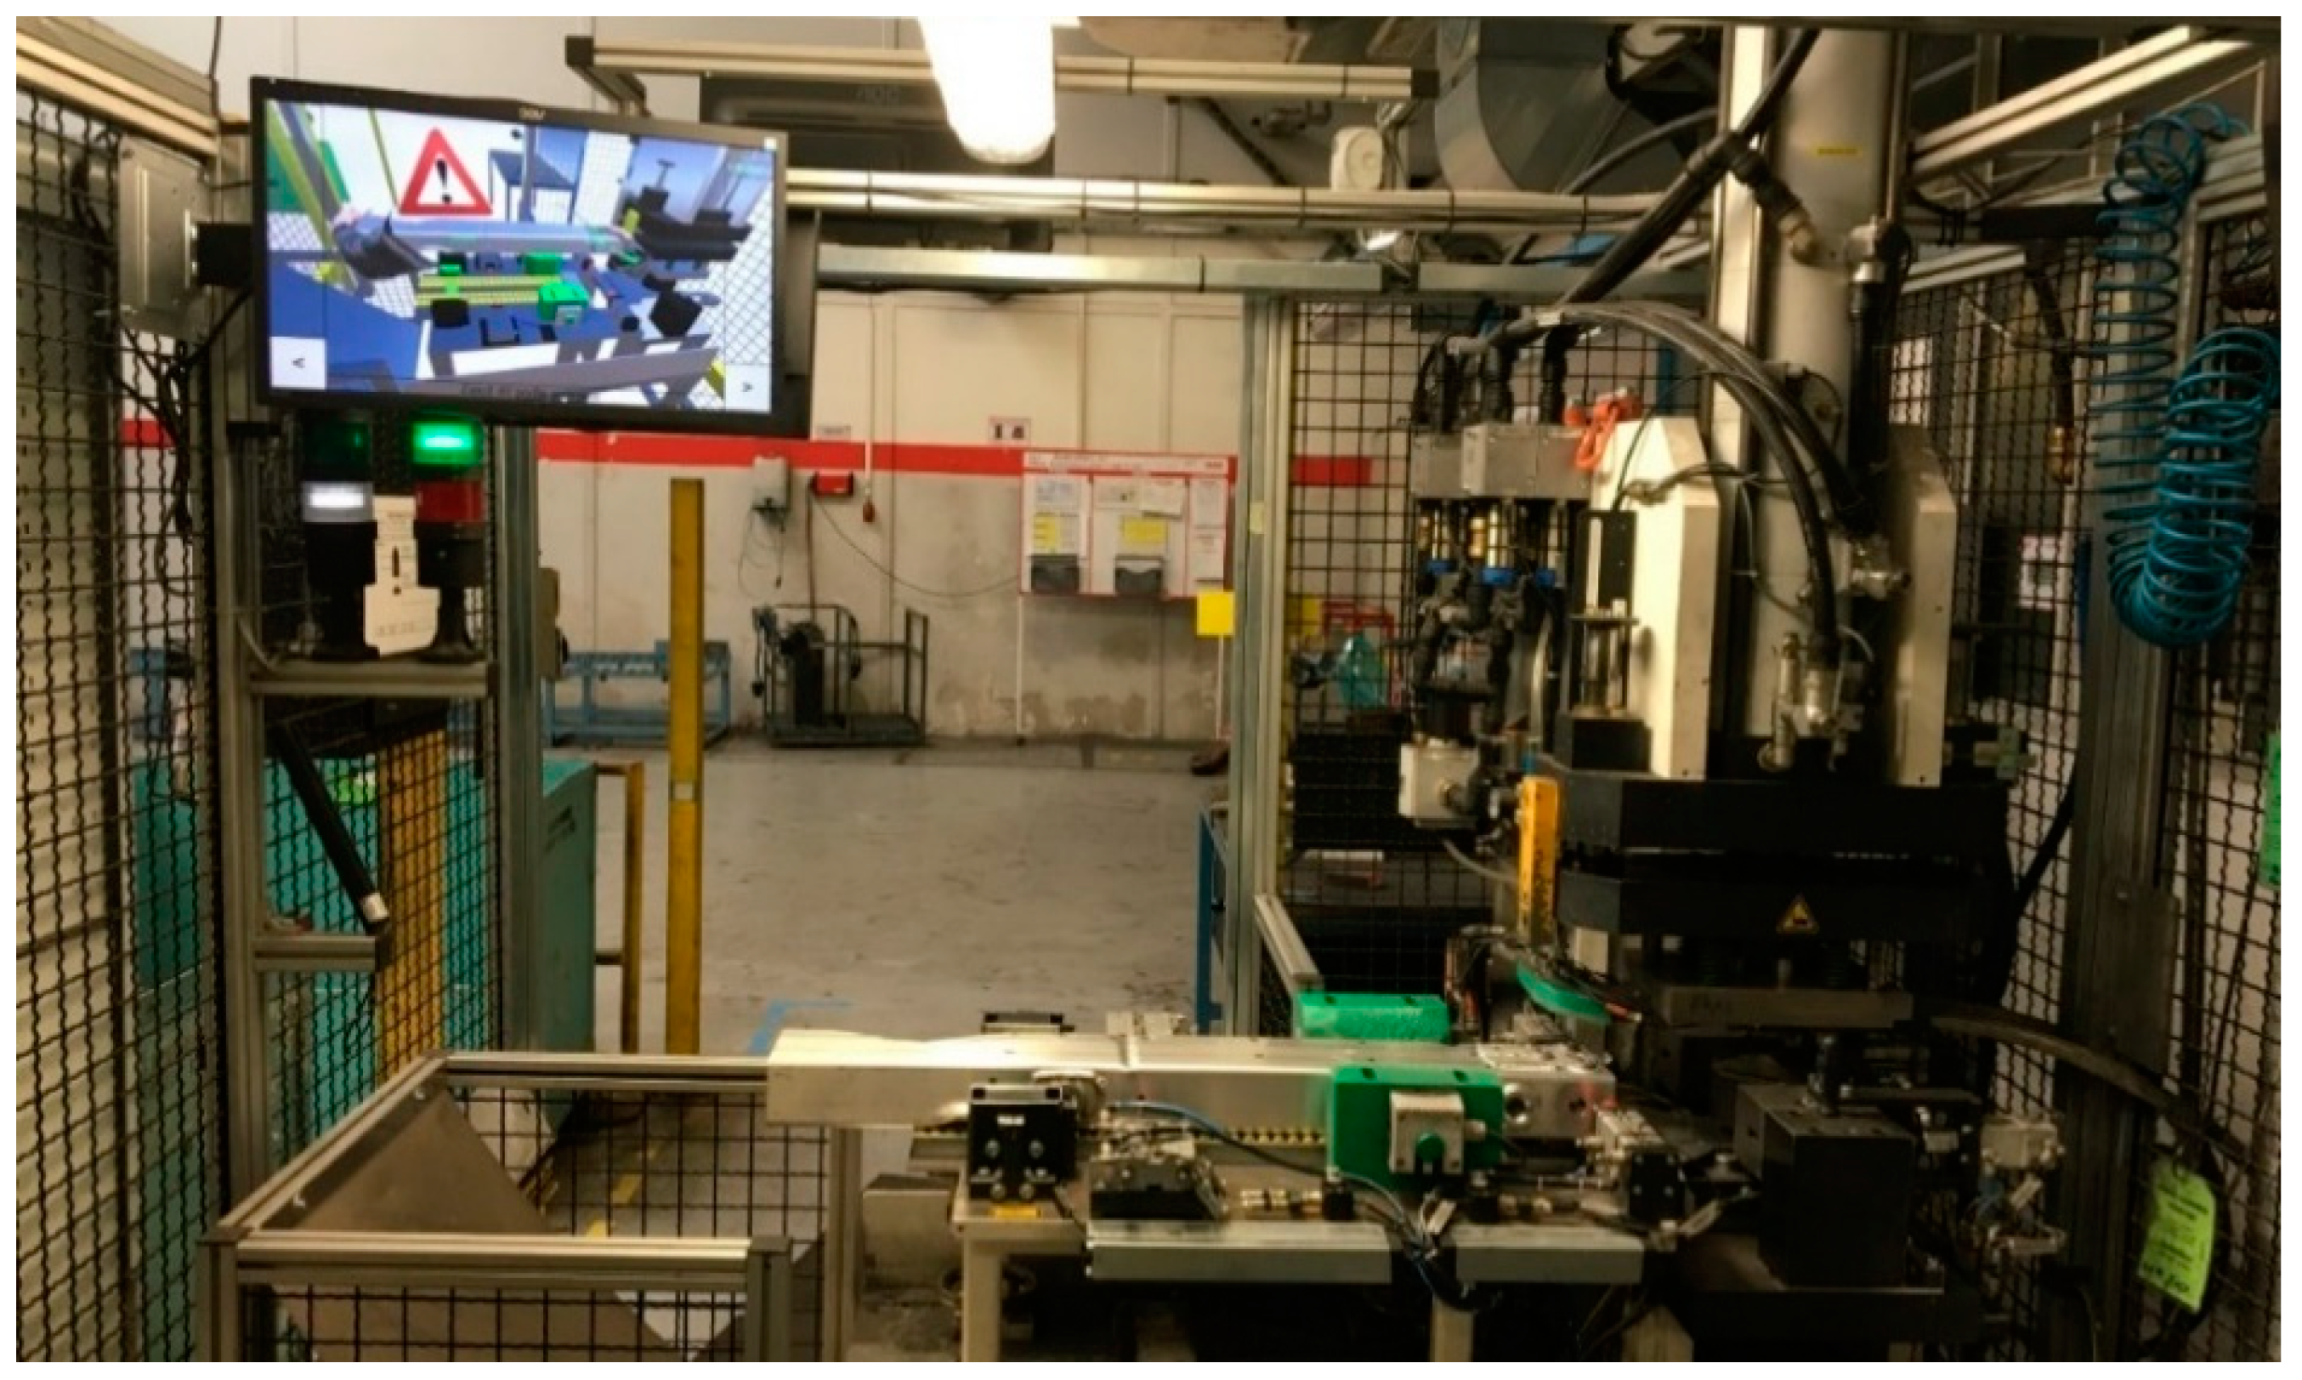
Figure 15 it can be seen that a portable AR headset has been selected for the given combination by the proposed methodology. It allows working with both hands simultaneously and complements the real world with virtual elements using a semi-transparent display. The virtual elements are displayed directly into the real world and help navigate the worker while performing the work. The navigation elements can take the form of various shapes or text labels. This combination can be used to clearly identify problem areas while the work is being performed. This solution also allows for the acceptance of demanding personnel flows along with parallel manual work. A key feature of the chosen AR headset is the ability to control it using gestures, so there is no need for additional hand controllers.
Figure 16 can be seen the recognition of production equipment by means of special markers that allow the equipment or production process to be uniquely identified. After loading the device after recognition, we gesture to the process to be executed. The next steps are carried out in a similar way as in the previous combinations, by means of arrow buttons that allow orientation in the process and its sub-steps.
The selected visualization tool was then deployed and tested in the real environment of an industrial enterprise. Production operators, machine operators and adjusters participated in the testing. The portable AR headset was judged by the expert group and company representatives to be suitable for this production process. However, an important finding is that AR technology does not yet allow workers to use the device for the entire work shift. The recommended AR time for this case was set at a maximum of 2 h per day.
4.8. Verification of the Combination P12P43P71P82
To verify the combination P12P43P71P82, a process corresponding to the characteristics of this variant was selected. However, this is not a manufacturing company, but a logistics centre where goods are packed into boxes in combination with work with an information system. This can be considered sufficient for the purpose of validating the methodology and assessing this sub-combination. The value of the resulting Z-score meets the conditions, as can be seen in
Table 17.
For this combination, the methodology selected a stationary video-guide as a suitable option. An important prerequisite is an almost constant presence at the workplace in order to be able to capture the individual steps by video recording. At the same time, it is necessary to ensure good visibility throughout the steps to be captured on video. This type of visualisation tool also assumes a small variation in products (in this case packaging methods). Recording a large number of products is not advisable due to the need to take a lot of footage and the complexity of making adjustments if any of the steps are changed.
The verification took place during real operation with representatives of the company. The solution was evaluated by the expert group as satisfactory. However, prerequisites for implementation are a good view of the workplace, the location of the individual steps and the worker’s hands.
4.9. Verification of the Combination P12P43P72P81
The P12P43P72P81 combination was validated on a production process with a modified Z-score of 14.80. This is an existing workplace, with a high emphasis on error prevention and the personnel flow around the workplace. This is reflected in the parameters in
Table 18.
For this combination, the methodology selected a portable VR 2D tool. In
Figure 17 an example implementation can be seen. The display was via a portable 2D industrial monitor. This is due to the high personnel flow with a relatively large distance of worker movement.
The example shows the output of a visualization tool focused on a semi-automated manufacturing process. The worker operates the machine and prepares the necessary material at the input, including material handling at the output.
As seen in
Figure 18, the VR 2D environment is made up of several auxiliary elements to make working with the selected tool as simple and efficient as possible. In the right part there is a window with a breakdown of the steps, where the step of the current process is also marked. The steps are again controlled by the arrows in the bottom corners. Each step has an additional text description. For some of the steps, the necessary protective equipment is also added to prevent possible work accidents. The result meets expectations and allows the worker to move freely around the workplace. The industrial display is thus available to the worker at all times. This also helps eliminate the risk of errors or incorrect sequencing of process steps.
4.10. Verification of the Combination P12P43P72P82
The last verified combination is P12P43P72P82. This is an example of mass production, which is characterized by low product variation and very fast production cycles. The validation took place at the company’s existing automotive site. According to
Table 19 the modified Z-score for this process is 14.80.
According to the methodology, a stationary VR 2D visualization tool is used. The implementation was carried out by creating a virtual reality application that is displayed on a screen directly at the workplace. All the elements necessary for the production process were modelled to correspond 1:1 to the real situation at the workplace.
In
Figure 19 it can be seen that the individual steps are accompanied not only by text descriptions but also by graphic elements that indicate the correct execution of the step or the risk of error. Orientation in the process is provided in the right column where all steps are displayed and the current step being performed is highlighted in green. To increase the efficiency of the designed variant, a connection between the visualization tool and the production equipment was created. This connection is provided by a Programmable Logic Control (PLC) unit that receives inputs from the production machine and transmits information to the visualization tool about the step of the production process. This communication makes it possible to eliminate the interaction of the worker with the visualization tool. Thus, the worker is oriented only by looking at the visualization tool, which displays the procedure for the step they are currently in.
The VR 2D solution was therefore connected directly to the production equipment (see
Figure 20) to synchronise the production steps and the visualisation tool. Testing was carried out under real production conditions. The suitability and functionality of the proposed type of visualisation tool for a given combination of parameters was demonstrated with company representatives and the expert group.
5. Implementation and Results
As already mentioned, verification was carried out in ten case studies. These case studies were carried out in parallel in cooperation between the academic and commercial spheres (University of West Bohemia in Pilsen and a start-up company that emerged from the university). The implementation time of each project was from 3 to 8 months from design through implementation. Each sub-project was quite different and involved a new innovative approach in implementation. Each project also involved many meetings at the managerial and executive level. For protection reasons, it is not possible to name specific companies at this point, nor to describe each implementation in detail.
The aim of the validation was to evaluate the functionality of the proposed methodology. In order to make the methodology complete, it was necessary to confirm the outputs of the methodology in real applications in industrial practice. Thus, the methodology must be satisfactory in terms of the selected characteristics of the production processes, the proposed multicriteria function and the matrix of the combinations of type and method of use. All this cannot be demonstrated by only one deployment. It was therefore necessary to validate at least three different combinations of type P11 and all possible combinations of type P12.
For the verification of the P11 combinations, three specific process variants were selected as far as possible. The condition for inclusion in the verification part was to meet a minimum Z-score of 14.
Individual combinations and outputs P11:
P11P42P71P82-VR 3D, field tested, verified;
P11P42P72P81-VR 3D, field tested, verified;
P11P43P71P82-VR 3D, field tested, verified.
Validation of the P12 combinations was carried out by testing all combinations in industrial practice. In total, there were eight possible combinations. Of these, seven combinations were successfully implemented and verified. One combination was not implemented due to not finding a suitable production process.
Individual combinations and outputs P12:
P12P42P71P81-VR 2D stationary, field tested, verified;
P12P42P71P82-VR 2D stationary, field tested, verified;
P12P42P72P81-VR 2D portable, field tested, verified;
P12P42P72P82-AR portable, field tested, verified;
P12P43P71P81-video guide, not tested, not verified;
P12P43P71P82-video tutorial, tested in practice, verified;
P12P43P72P81-VR 2D portable, field tested, verified;
P12P43P72P82-VR 2D stationary, field tested, verified.
The creation of each individual case study and the facilitation of this creation through the methodology has been made possible by a rare synergy of commercial and academic sector needs. The execution of the ten combinations is absolutely unique not only because of the huge amount of human and material resources used. Making a rigor and objective quantitative evaluation is difficult because many factors enter into it. Rather, it seems more appropriate to use qualitative evaluation based on descriptive research methodology [
67]. Based on this, production managers were interviewed six months after the deployment of each application. On the basis of these interviews, in all cases a positive benefit was expressed from a subjective point of view, even in nine cases (out of ten) there was an objective increase in productivity and in all cases a reduction in scrap rates.
From the above validations of both P11 and P12 based combinations, it was concluded that the methodology seems to be functional and has been successfully used by 10 implementations in real production processes. The time requirement for the implementation of the solution is very high and for this reason 10 such verifications were performed during the 2 years of the research. Although the P12P43P71P81 combination was not verified, the number of tests implemented was sufficient.
Thanks to the developed software support, it is also possible to use the proposed methodology without detailed knowledge of the individual components and algorithms contained in the methodology. This is also a key factor for the future application of this methodology in practice. For further applications, it is mainly assumed that the values of individual characteristics of the production process are correctly defined and that they are sufficiently known.
6. Discussion
An important part of this work is the verification of the proposed methodology in practice. A method of evaluation of the methodology was proposed by implementing 10 projects in real conditions of industrial enterprises. The aim of the projects was to verify the functionality and contribution of the methodology. To perform this, it was necessary not only to evaluate each project and select a suitable visualization tool, but also to build a complete solution that could be tested in real operation. Each sub-project was therefore thoroughly prepared and analysed. This was followed by the creation of models or recordings. In some cases, a completely new virtual environment with many interactive elements was created. The improvement of process efficiency by using modern visualisation elements compared with paper-based instructions has already been confirmed in previous research by the authors [
68].
Division of the methodology development process into phases
The process of developing a methodology consists of four phases: preparation, decision-making, evaluation, and implementation. In the first phase, the needs and objectives are analysed in detail and a basic framework is established. This is followed by decisions on the key elements and structure of the methodology, including the selection of appropriate methods and tools. The third phase involves the evaluation of the methodology against the established criteria, with emphasis on identifying gaps and opportunities for improvement. The last phase is dedicated to the implementation of the methodology, including implementation, staff training and performance monitoring. It is crucial to note that these phases are not isolated but interact, and harmonisation between them is essential for a successful outcome of the whole process.
The nature of manufacturing processes and visualization tools relationship
Relationship between the nature of manufacturing processes and visualization tools
The existence of a dependency between the choice of visualisation tools for the creation of instructions within the organisational preparation of production and the nature of the production processes was assured. A Likert scale was used to find the relationship between the manufacturing process and modern visualization tools, which was modified by the author to fit the focus of the research. The individual characteristics of the manufacturing processes were then examined to determine the impact on the choice of visualization tools and the strength of the relationship. The identification of the key characteristics is the focus of the same chapter in which the research and statistical evaluation of the modified Likert scale output is conducted. The relevant characteristics of manufacturing processes with a strong link to the choice of visualisation tools are retrieved
Figure 3 then evaluated and the results of the research can be seen.
It was found that it is possible to assess the suitability of using modern visualization tools for a given process according to its characteristics. The characteristics of the production processes that have a significant influence on the choice of visualization tools were divided into three groups according to whether they influence the choice of type, method of use of the visualization tool or both at the same time. In particular, the characteristics that are important for testing this hypothesis are those belonging to groups A and B in
Table 2.
Criterium function and parameters defining
The next step was the design of a multicriteria function based on Altman’s model, which was revised by the author in evaluation phase. Based on this model, the design of the multicriteria function resulted in a modified Z-score. The function accounts for the characteristics of groups A and B, which are represented in the calculation by their strength of association and the value of each parameter. Based on the resulting modified Z-score, the production processes are divided into three main zones. This division is based on the result of the simulations and the reliability test, which can be seen in
Figure 5. These are the zones of conventional tools, the grey zones and the zones of using modern visualization tools. It is the last mentioned zone, defined by 14 ≤ Z
MOD, that represents the zone where it is appropriate and efficient to use modern visualization tools. The methodology for selecting a visualization tool based on suitability has not yet been sufficiently developed in previous research [
69]. This paper shows that the proposed methodology can be used to select the appropriate type of visualization tool for a specific manufacturing process. The result function proposed in section evaluation phase characterized as a modified Z-score is an indicator of the suitability of deploying modern visualization tools. Furthermore, if the production process falls within the zone of use of modern visualization tools, it is necessary to decide which type of visualization tools will be selected and how they will be used. The inappropriateness of a combination of paper and digital manuals has already been demonstrated [
9]. The characteristics of manufacturing processes that influence the selection of a modern visualization tool belong to groups A and C.
Developing a methodology tool and verification
In section implementation phase it can be seen that combining these characteristics results in 24 possible combinations. The different combinations are further statistically evaluated, and the result can be seen in
Table 7 and
Table 8 The results were also examined in terms of meeting the rules of relevance of the data obtained. The output is a matrix combining the characteristics of the production processes and a suitable visualization tool. This is the last step of the proposed methodology, which has been completed for ease of use in section creation of the software support and then in validation of the method verified by implementing the individual combinations in industrial practice.
The proposed methodology seems to work within pre-set limits that indicate where the use of this methodology is appropriate. However, the methodology has not been designed and validated outside the pre-set limits. It is therefore uncertain how the methodology will behave in the event of exposure outside the defined limit constraints. Therefore, the future direction of this research should be to extend the limit constraints and verify the properties of the proposed methodology in this area. The survey was carried out on a sufficient number of respondents, but all the companies involved were based in the Czech Republic. It would therefore be useful to see if a similar situation applies in other countries. This would allow the attitude of enterprises abroad to be assessed and, if necessary, software support to be adapted for the purposes of a particular country. Another benefit could be to test the methodology and combinations on a larger number of implemented projects. This would allow validation on a larger number of implementations or possible adjustments resulting from practical experience. The validation also lacks the implementation of the combination P12P43P71P81, which could not be secured. Validation of this combination would then conclude the validation of all possible combinations mentioned in section validation of the method.
7. Conclusions
The main theoretical contribution of this paper is the development of a methodology for assessing the suitability of deployment and use of modern visualization tools. This is related to the identification of the current state of knowledge within the topics related to the product life cycle and technical preparation of production. This is followed by a section focusing on the use of modern visualization tools and linking them to the characterization of production process parameters. These tools are tutorials in the form of video, augmented reality, and virtual reality. The characteristics of the production processes that have a significant influence on the choice of visualization tools were divided into three groups according to whether they influence the choice of type, method of use of the visualization tool or both at the same time. A multicriteria function based on the modified Altman model was then proposed, resulting in a modified Z-score. The score is essential for grouping manufacturing processes according to their suitability for deploying modern visualization tools. Specifically, these are the conventional tool zones, the grey zones, and the modern visualization tool utilization zones. Another proposed tool is the basis for deciding what type of visualization tools will be chosen and how they will be used. The assumption is that the production process falls within the zone of use of modern visualization tools, which is defined by a multicriteria function from the characteristics of the production processes that influence the selection of a modern visualization tool. All conceivable combinations of the investigated parameters were compiled. The combinations were then statistically evaluated, and the research resulted in a matrix of combinations of production process characteristics and appropriate use of visualization tools. This step completed the methodology. The important part is the verification of the proposed methodology in practice. Here, a way of evaluating the methodology was proposed by implementing 10 projects in real conditions of industrial enterprises. The aim of the projects was to verify the functionality and contribution of the methodology. To perform this, it was necessary not only to evaluate each project and select a suitable visualization tool, but also to build a complete solution that could be tested in real operation. Each sub-project was therefore thoroughly prepared and analysed. This was followed by the creation of models or recordings. In some cases, a completely new virtual environment with many interactive elements was created. Everything was then communicated not only within the expert group, but also with the managers of the individual companies and the workers who then used the selected visualisation tool. This validation contributed to the verification and finalisation of the methodology. The result is a methodology that facilitates the choice of an appropriate visualization tool in the organizational preparation of production and serves as an aid in the decision-making of manufacturing companies for the deployment of modern visualization tools. Crucially, the effectiveness of the proposed methodology is not confined to theoretical constructs. The research goes a step further by introducing a robust validation process. Ten real industrial projects serve as the testing ground, allowing for the evaluation of the methodology’s functionality and contribution in practical, operational settings. Each project undergoes thorough preparation, analysis, and, in some cases, the creation of entirely new virtual environments with interactive elements. The methodology’s application is not limited to academic circles; it extends to interactions with managers and workers within industrial enterprises. This real-world validation contributes significantly to verifying and finalizing the methodology, ensuring its relevance and applicability in diverse industrial contexts. In conclusion, the result of this research is a methodology that transcends theoretical frameworks. It stands as a practical and valuable decision-making aid for manufacturing companies in the organizational preparation for production. By seamlessly integrating theoretical contributions and real-world validation, this methodology represents a holistic approach to addressing the challenges of deploying modern visualization tools in industrial settings. In future work, it would be advisable to focus on extending the multicriteria function based on the modified Altman model and possibly use and validate the proposed methodology in foreign markets outside the Czech Republic. Furthermore, it would be interesting to extend the application of the methodology to different industries or sectors, to assess its effectiveness in different contexts and to identify possible sector specificities.


 ,
, 


