1. Introduction
As deep space exploration advances, soft-landing exploration of extraterrestrial bodies has become one of the most important exploration methods. In recent years, several leading space powers have conducted soft landing explorations on the Moon and Mars, with notable examples being China’s Chang’E lunar exploration [
1,
2] and America’s Mars Science Laboratory [
3,
4]. The landing buffer mechanism (LBM), a core device in soft-landing exploration, plays a crucial role in these missions. According to aerospace exploration mission statistics, deep space probes are most likely to malfunction during the landing phase [
5]. Therefore, the reliability of the LBM is directly related to the success of the whole exploration mission.
As a common method to quantify the failure risk in complex aerospace products, reliability assessment helps engineers make more informed decisions during the design phase [
6]. The industrial sector demands the reliability assessment for the LBM and puts forward high-reliability index requirements. A reliability demonstration test (RDT) is essential to confirm that the actual reliability of the LBM meets these design indices [
7,
8]. The RDT has two key components: selecting the test program and determining the reliability assessment methodology. While the outcomes of the LBM’s actions are typically binary (success or failure), traditional binomial tests are impractical for practical engineering due to their requirement for a lot of samples. For instance, validating a reliability index of 0.9997 (assessed at a confidence of 0.9) would necessitate at least 7675 zero-failure tests. As such, there is an urgent need to develop more efficient and feasible RDT programs and assessment methods.
Contrary to traditional count tests that only count successes and failures, metrological tests offer more comprehensive reliability data and require much smaller sample sizes. On the other hand, the LBM with leg structure usually consists of subsystems such as primary and secondary struts. Considering these factors, this study proposes a metrological testing scheme to characterize the LBM’s buffering performance by measuring the performance data from primary and secondary struts. This test program significantly reduces the number of buffer tests, saves test costs, and makes assessing the LBM’s reliability possible.
During the landing buffer phase, the failure of buffering capability in either primary or secondary struts causes the entire LBM to fail [
9,
10]. Consequently, the LBM can be modeled as a series system composed of several subsystems. Such mathematical reliability models are typically presented in the form of block diagrams or fault trees [
11]. Theoretically, the LBM’s reliability can be assessed by combining the reliability series model and the statistical data of primary and secondary struts. However, the confidence limits assessment for series system reliability has always been challenging in reliability engineering [
12,
13]. In particular, buffer tests of the LBM face the problem of limited sample size and zero-failure data. On the one hand, aerospace machinery products are expensive and produced in limited batches, allowing only small-sample reliability tests [
14,
15,
16]. On the other hand, RDTs typically do not permit sample failures; otherwise, they would be judged as unqualified [
17].
The Lindstrom–Madden (LM) method [
18] and the modified maximum likelihood (MML) method [
19] are the main methods used in engineering to assess the lower confidence limit (LCL) for series systems reliability. The core idea behind these methods is to reduce the test results to a set of binomial tests with a pseudo-test number
and a pseudo-success number
(i.e., the system is considered to have passed
out of
tests). Then, the binomial distribution reliability theory is applied to estimate the confidence limits of the simplified system [
20]. However, the traditional methods are based on the maximum likelihood theory and therefore have large errors in small sample cases [
21]. These two methods are also inapplicable when zero-failure subsystems exist in a series system [
22,
23].
In recent years, the Bayesian and Bootstrap methods have been developed to estimate the confidence limit of system reliability in small sample cases [
24]. The Bayesian approach combines pre-test reliability with field-test information, which is advantageous for small sample data [
25,
26]. However, the subjective selection of the prior distribution limits its application [
27]. The Bootstrap method assumes that the empirical distribution fits the sample distributions well and extends the sample by resampling [
28,
29]. This method is intuitive and convenient, but the estimates are usually approximate.
Motivated by the realistic problems encountered in the reliability assessment of the LBM, this study makes two contributions: a novel small-sample test verification method for the LBM and a confidence limit theory for series systems. This small-sample test verification method transforms the traditional binominal tests into metrological tests by measuring the buffer strokes of the LBM’s subsystems. Assuming that the buffer strokes obey the normal distribution, the reliability of zero-failure subsystems is assessed based on the normal distribution tolerance limit theory. On this basis, the LBM can be modeled as a series system composed of several subsystems. To estimate the reliability confidence limit for such a series system, a confidence limit theory for the product of subsystem reliability is developed. This theory can assess the LCL of the LBM’s reliability with high confidence based on the reliability assessment results for primary and secondary struts.
The rest of the paper is organized as follows.
Section 2 describes the composition and working principle of the LBM and constructs the corresponding reliability model.
Section 3 defines the reliability of primary and secondary struts and introduces the assessment method for subsystems. In
Section 4, the reliability assessment methods for the LBM and its combinations are proposed, all including confidence limit calculation formulas. An engineering application is provided in
Section 5 to illustrate the practicality and effectiveness of the proposed method. Finally,
Section 6 summarizes the paper.
2. A Reliability Series Model for the LBM
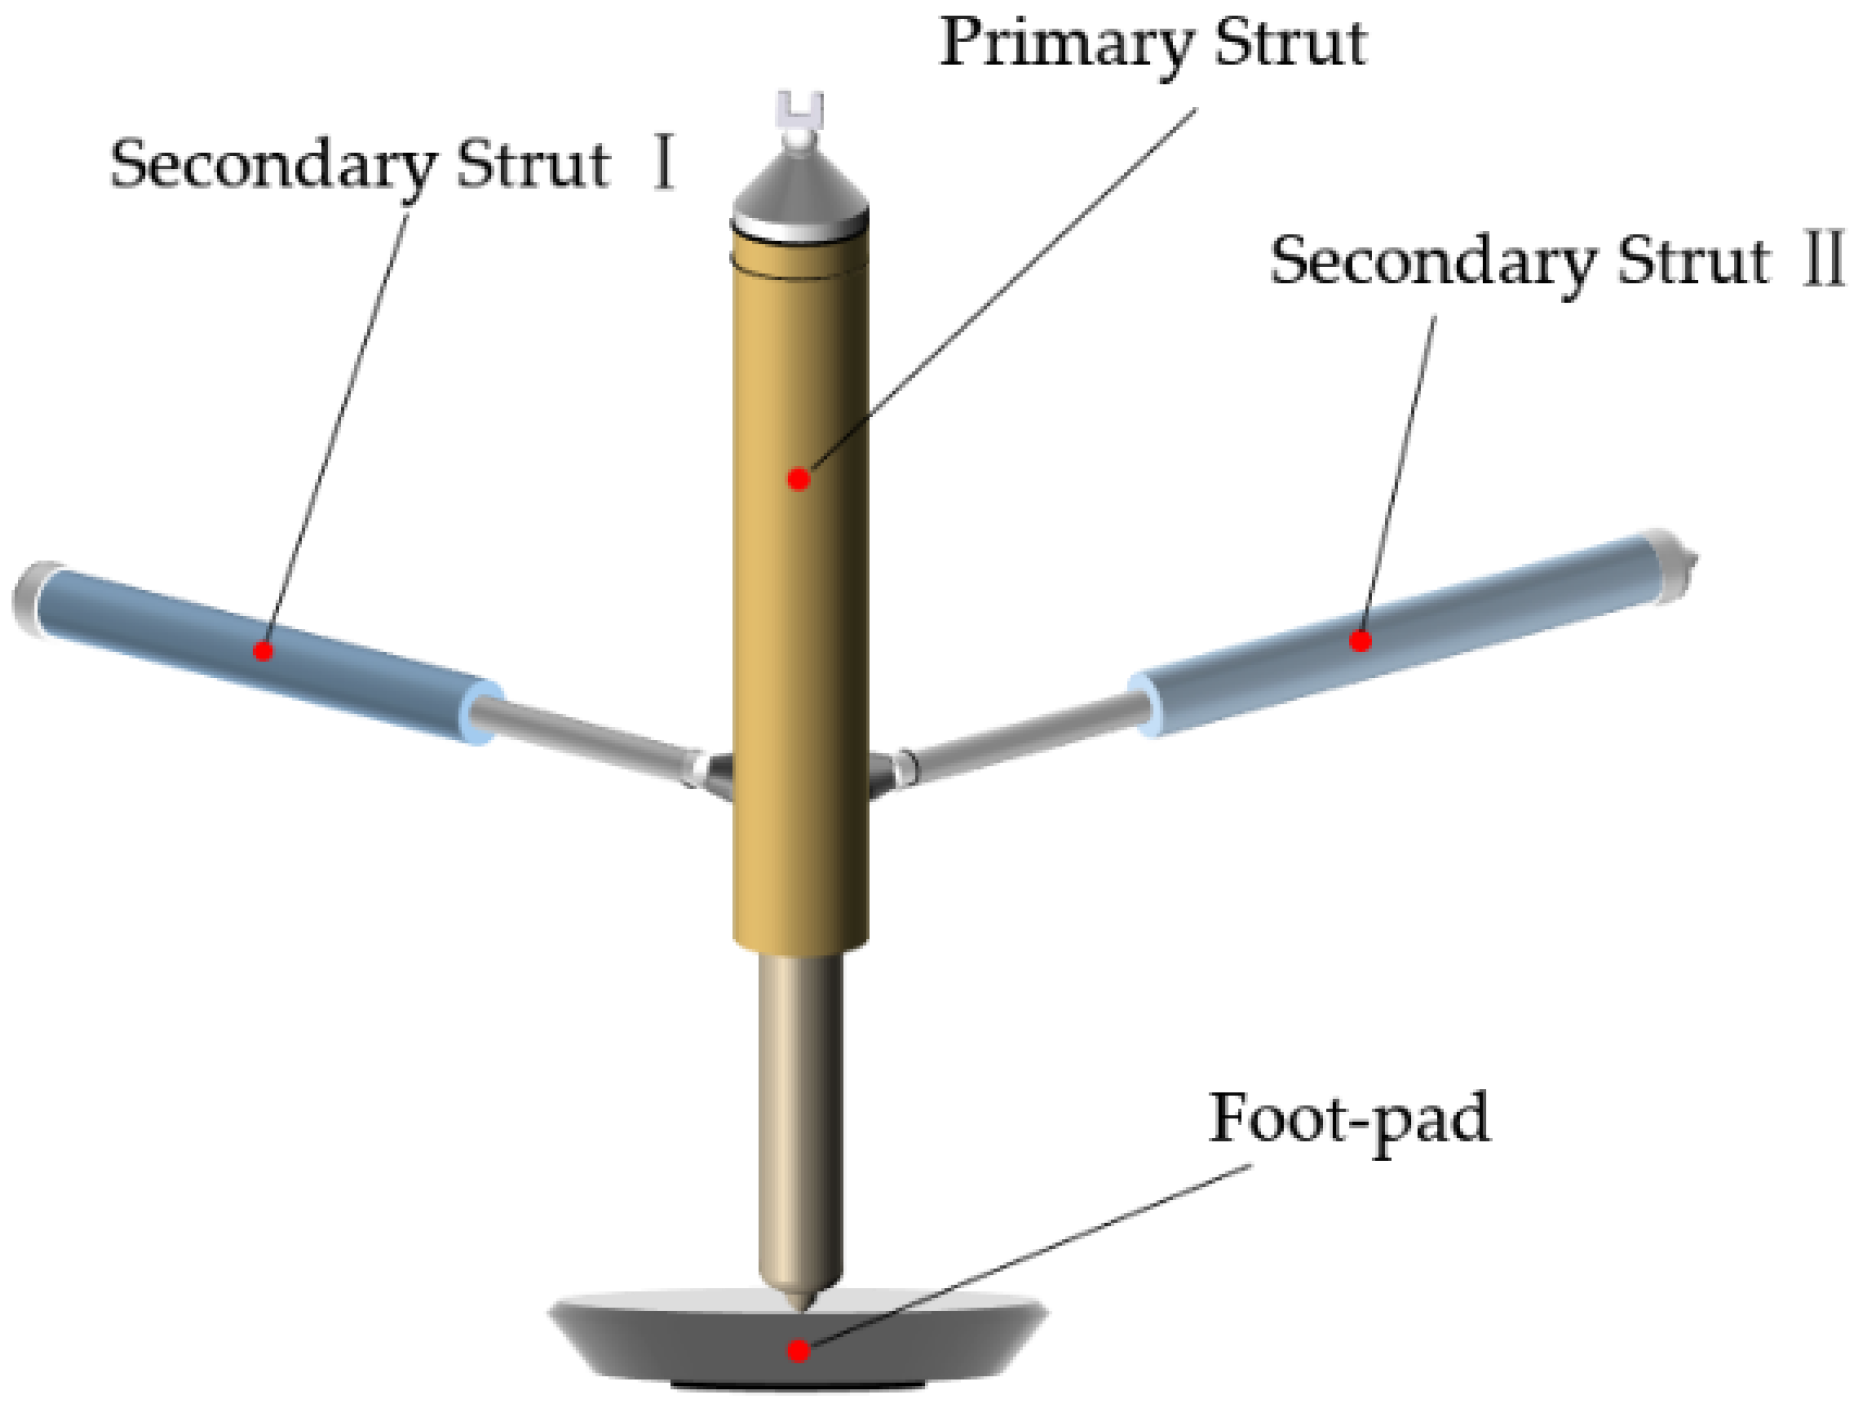
Figure 1 shows the typical design structure of the LBM from a Chinese lunar lander, which includes a primary strut, two secondary struts, and a foot-pad [
30,
31]. The primary strut cushions the longitudinal impact load, while two secondary struts cushion the transverse impact load. The foot-pad serves as the main support component [
32]. The primary and secondary struts are filled with aluminum honeycomb material as buffer elements [
33,
34], as shown in
Figure 2.
During the free-fall phase, the foot-pad first contacts the planetary surface to prevent the lander from sinking excessively. Simultaneously, the foot-pad transmits the impact load to the primary strut, pushing its inner cylinder to slide along the outer cylinder. This action deforms the aluminum honeycomb, absorbing the longitudinal impact load during a soft landing. The buffer elements of secondary struts provide a bi-directional buffer when the lateral load exceeds a certain threshold. The pull-rod element performs a tensile buffer, while the aluminum honeycomb element provides a compression buffer.
The composition and operation of the LBM reveal that its performance is determined by the primary strut, two secondary struts, and foot-pad. The foot-pad’s primary challenge is its strength, which can be ensured by increasing its strength margin, rendering its reliability as 1. In other words, the foot-pad does not influence the system state (success or failure) and is not included in the LBM’s reliability model. In addition, the inability of any one strut will lead to the failure of the LBM. Thus, the LBM can be regarded as a series system consisting of the primary strut, secondary strut I, and secondary strut II.
Figure 3 provides the LBM’s reliability block diagram.
The buffer reliability model of a single LBM can be expressed as
where
denote the reliability of a single LBM, primary strut, secondary strut I, and secondary strut II, respectively.
A spacecraft is equipped with four identical LBMs that collectively buffer and absorb energy upon landing [
35]. Since the failure of any one LBM will fail the lander cushion, the four LBMs constitute a series system. This combination of LBMs is called the landing buffer system (LBS) for ease of description. Then, the buffer reliability
of the LBS can be expressed as
In engineering practice, it is not easy to use Equations (1) and (2) directly to calculate the LBM and LBS’s buffer reliability because the actual value of
is unknown, and its LCL with the confidence
can only be obtained via the corresponding reliability tests, which satisfies
where
represents the probability that the actual value of reliability
is not less than its LCL
estimated from the test sample is
. Theoretically, the assessment results are safe and secure.
A spacecraft LBM adopts a metrological test scheme to obtain quantitative information on product performance. Compared to traditional count tests, the metrological test provides more information and requires significantly smaller sample sizes, thus classifying it as a small sample test. This paper presents a novel small-sample test verification method for the LBM, addressing the challenge of reliability assessment in small-sample scenarios. For a clear description,
Figure 4 illustrates the fundamental idea of the proposed method. Firstly, the buffer reliability of primary and secondary struts is assessed based on their performance data obtained from small sample buffer tests. Subsequently, the LBM’s buffer reliability is assessed with the whole product’s reliability series model.
3. Reliability Assessment Method for Subsystem
This section analyzes the reliability characteristic quantities (quantitative indicators that characterize the reliability level) of the primary and secondary struts according to the RDT scheme of the LBM. Then, the reliability assessment method for the subsystem is introduced.
3.1. Analysis and Determination of Reliability Characteristic Quantities
The buffer stroke is a performance parameter that characterizes the buffering capacity of primary and secondary struts. The buffering is deemed effective as long as the buffer strokes of struts remain within the maximum design value. Furthermore, the primary strut only has a one-way buffer capacity, while the two secondary struts can provide a bi-directional (tension or compression) buffer capacity. Consequently, the characteristic quantities of buffer test are determined as follows:
- (1)
The primary strut’s buffer stroke (i.e., aluminum honeycomb compression);
- (2)
The secondary struts’ buffer strokes and (i.e., aluminum honeycomb compression or pull-rod elongation).
Suppose the buffer stroke data obtained from buffer tests passes the normality examination. In that case, it can be inferred that the reliability characteristic quantities of primary and secondary struts all follow the normal distribution. In such a scenario, each subsystem’s buffer reliability can be assessed using the normal distribution tolerance limit theory in conjunction with the tolerance limits of characteristic quantities.
3.2. Reliability Assessment of Subsystem Based on Normal Distribution Tolerance Limit Theory
The buffer reliability of each subsystem decreases as the buffer stroke increases. Once the buffer stroke surpasses the standard, it exceeds the subsystem’s buffer capacity range. Therefore, the buffer strokes of primary strut, secondary strut I, and secondary strut II all have an upper limit.
Suppose the buffer strokes
of the primary strut, secondary strut I, and secondary strut II all obey the normal distribution. The tolerance limits of their characteristic quantities are defined as
,
, and
, where
,
, and
denote the maximum buffer stroke of each subsystem, respectively. Then, their buffer reliability can be characterized by the probability that the buffer stroke is less than its allowable upper limit under the specified environmental conditions, that is
where
are the means and standard deviations of the buffer stroke
, respectively, and
is the standard normal distribution function.
Assuming that the LBM has carried out
buffer reliability tests, the measured buffer travel data for primary strut, secondary strut I, and secondary strut II are
,
. According to these measurement data, the sample means
and sample standard deviations
of the three subsystems’ buffer strokes can be calculated, respectively as follows:
Based on the reliability theory of normal distribution complete data, the LCL
of primary strut, secondary strut I, and secondary strut II with the confidence
can be obtained using the following equation:
where
is the
quantile of the standard normal distribution and
is the distribution function of a non-central
t-distribution with degrees of freedom (the number of independent data in the sample)
and a non-central parameter
.
According to Equation (8), the LCL
of each subsystem reliability with confidence
is
where
is the inverse function of
obtained by Equation (8) for the non-central parameter
.
5. Application and Analysis of Small-Sample Reliability Assessment Method for the LBM
This section provides an implementation of the proposed small-sample reliability assessment method, carried out in an actual engineering project of the LBM. The industrial sector requires the RDTs to quantitatively verify that the LBM’s reliability meets the index of 0.9997, as assessed by the confidence of
. After reliability index allocation, the buffer reliability of primary strut, secondary strut I, and secondary strut II must be no less than 0.9999. The LBM’s buffer tests are completed on a specialized test bench, as shown in
Figure 6.
5.1. Reliability Test Data
The data utilized in this analysis originates from the buffer reliability tests conducted by a Chinese spacecraft LBM. Given that the landing state of the spacecraft cannot be determined prior to landing, buffer reliability tests were carried out under various working conditions [
38]. Three sets of LBMs are put into operation under each working condition, and each set of LBMs is tested once. Following the buffer tests, the primary strut and two secondary struts were disassembled and measured to obtain their buffer strokes.
Since the reliability of any landing state is not lower than that of the worst case, the minimum value of the LBM buffer reliability can be obtained via the buffer test data under the most severe conditions. The sample means and standard deviations of the primary strut, secondary strut I, and secondary strut II were calculated based on three groups of buffer strokes under the most severe conditions. The results are presented in
Table 1.
In addition, based on the statistical analysis of previous buffer stroke data (obtained from subsystem-level testing) and engineering experience, it is determined that the buffer strokes of primary and secondary struts are subject to the normal distribution, and their maximum buffer design stroke are , and , where and . The maximum buffer design stroke of secondary strut I and secondary strut II is identical.
5.2. Buffer Reliability of Subsystems
Applying the normal distribute tolerance limit theory in
Section 3.2, the sample means and standard deviations in
Table 1, along with the allowable upper limits of buffer stroke are substituted into Equation (7) to calculate
. Then, according to Equation (9), the LCLs of the reliability for primary strut, secondary strut I, and secondary strut II with the confidence of
are calculated as follows:
The reliability assessment results show that the reliability LCLs for primary strut, secondary strut I, and secondary strut II have reached above 0.9999, which can meet the buffer reliability index requirements of subsystems.
5.3. Buffer Reliability Assessment of the LBM and LBS
This section compares the proposed method with the commonly used reliability assessment method for engineering series systems to demonstrate the proposed approach’s rationality and effectiveness. Since the scenario where all subsystems are zero-failure is beyond the application scope of the MML method [
23], we select the LM method for comparison. The LM method is widely used for the reliability assessment of series systems in aerospace products due to its simplicity of calculation and easily comprehensible equations.
5.3.1. Buffer Reliability Assessment by the LM Method
Before using the LM method to assess the reliability of a series system, it is first necessary to convert the non-binomial data into binomial data. Let
and
be the pseudo-test and pseudo-success numbers of the
th subsystem converted from quantitative data to binomial data. Then,
and
can be obtained by solving the following equation
where
is the incomplete
-distribution function and
is the point estimate of each subsystem’s reliability. In particular, when
, the zero-failure binomial data is obtained. At this time, Equation (24) is simplified as
Substituting the reliability assessment results of each subsystem in
Section 5.2 into Equation (25), the equivalent test results of the primary strut, secondary strut I, and secondary strut II can be obtained as
,
and
.
After obtaining
and
, the pseudo-test number
and pseudo-failure number
of a single LBM can be obtained by the equation as follows:
Based on the binomial distribution reliability theory [
17], the reliability LCL of a single LBM with the confidence of
can be obtained as follows:
The LBS consists of four identical LBMs connected in series. The pseudo-test number
and the pseudo-failure number
of the LBS can also be obtained by the LM method as
Similarly, the LCL
of the LBS buffer reliability with the confidence of
is calculated as
The calculation results are summarized in
Table 2. As indicated in the table, when all subsystems have zero-failure data, the LM method equates the LCL of the LBM reliability to that of the secondary strut I. In other words, the LM method only utilizes test information from the secondary strut I, which is particularly wasteful in the case of small samples. Furthermore, the LM method gives the same LCL for the LBS reliability as that of a single LBM, assuming the reliability of the other LBMs is 1, which is dangerous and unreasonable in engineering applications.
5.3.2. Buffer Reliability Assessment by the Proposed Methodology
Substituting the reliability assessment results of each subsystem in
Section 5.2 into Equation (10), the initial approximation for calculating the reliability LCL of the LBM is
And according to Equation (13), the actual value of the confidence
of
is further obtained as
Accordingly, using the method in
Section 4.1, the reliability LCL of the LBM with the confidence of
is obtained as
where
, which is calculated from Equations (12)–(15).
Four sets of identical and independent LBMs form a series system. It can be seen from Equation (17) that the reliability LCL of the LBM with the confidence of
is
The calculation results are summarized in
Table 3. The table shows that the proposed method can estimate the reliability LCL of a single LBM using zero-failure data from all subsystems. When the required confidence is 0.9, the reliability LCLs of a single LBM and LBS are all not less than 0.9997, which meets the index requirements.
5.4. Comparison and Discussion
The LM method, based on maximum likelihood theory, is inapplicable to the instances where subsystems have zero-failure data. As evidenced by Equation (26), when the pseudo-test results of all subsystems exhibit no failure, the LM method equates the LCL of a single LBM’s reliability to that of the subsystem with the fewest pseudo-test number. This implies that the LM method only utilizes test information from one subsystem and discards the valuable data of other zero-failure subsystems, resulting in a large error in assessment results. This issue persists when the LM method is employed to assess the buffer reliability of the LBS. The calculation error gradually accumulates during the bottom-up information synthesis, ultimately leading to a dangerous system reliability assessment.
Based on the confidence limit theory for the product of subsystem reliability, the proposed method can assess the reliability confidence limit of a single LBM using zero-failure measurement data from subsystems. This approach fully utilizes all test information and considers the failure possibility in each subsystem, yielding assessment results that satisfy high-reliability indices. This method is simple to calculate for the combination of four LBMs, i.e., LBS. It considers the failure possibility in each LBM, ensuring that the reliability assessment results are sound and reliable.
It is worth noting that the proposed method employs the normal distribution tolerance limits theory, which restricts its applicability only to spacecraft mechanisms whose performance parameters obey the normal distribution. In principle, the fundamental idea of the small-sample test verification method is equally applicable to other distribution situations, but corresponding distribution models need to be established for further study.
6. Conclusions
A small-sample test verification method for the LBM is proposed to address the issue that the traditional binominal tests need a large sample size. This method transforms the RDTs of the LBM from binominal tests to metrological tests by measuring the performance data of primary and secondary struts. Given that the buffer stroke (compression amount or tension amount) is easily measurable and can visually express the buffer performance of the LBM, It is selected as the reliability characteristic quantity of primary and secondary struts. In conjunction with the maximum buffer design stroke, the small-sample reliability assessment of subsystems is realized using the normal distribution tolerance limit theory. This test method verifies that the reliability LCL for primary and secondary struts reaches more than 0.99999, which meets practical requirements.
By analyzing the operational principle of the LBM during soft landing, a reliability series model for the LBM is established. Subsequently, a confidence limit calculation theory for the product of subsystem reliability is proposed to assess the series system reliability. This theory can estimate the LCL of the LBM’s reliability based on the reliability of primary and secondary struts. The proposed method is compared with the LM method via a practical engineering application. The comparison results indicate that the LM method overlooks the failure possibility of all zero-failure subsystems, resulting in a dangerous system reliability assessment. Conversely, the proposed method can utilize all zero-failure test information and consider the failure possibility in each subsystem. After applying this method, it is verified that the LCL of the LBM’s reliability reaches above 0.9999 with a confidence of 0.9, satisfying the specified reliability Index of 0.9997.
In engineering practice, many aerospace mechanisms can be considered as a series system, including solid rockets, spacecraft connecting and separating mechanisms, and aero-engines with modular design. The proposed method can also be generalized to estimate the reliability confidence limits of such series systems. This approach saves test costs when samples are scarce and ensures the assessment results are safe and reliable.


