1. Introduction
Due to fast progress in technology, the manufacturing process in all domains is becoming more and more automated. With the increased requirements for productivity and recent developments in cobots’ ease of programming, industrial robots and cobots are becoming a reality in many manufacturing fields. Regardless of the job they have to perform, all robots require an end effector in order to accomplish their purpose. These end effectors are used in various applications, such as welding, cutting, spray-painting, pick-and-place operation, inspection, assembly, 3D printing, and so on. This paper only covers the grasping/ clamping systems, also known as grippers. All of these grippers need to handle a huge variety of objects with different shapes, dimensions and weights.
Prehension mechanisms are complex mechatronic structures used by industrial robots to perform clamping operations of parts in order to handle, transfer or assemble parts within a robotic technological process [
1], and are situated at the end of the robotic arm, as shown in
Figure 1.
The ability to grip and manipulate a variety of objects has been the main point in the advancement of robots [
2,
3,
4,
5].
Considering the large number of requirements, diverse workpieces, and the desire for a well-adapted and reliable gripping mechanism, various grippers have been developed and applied in many automatic applications. Prehension mechanisms can be divided into different categories according to different classification criteria. These criteria refer to the type of actuation, grip modes, number of jaws/fingers, etc. [
6,
7].
Another challenge in gripping designs is the inertia forces due to the high-speed movement of the robot arm [
8,
9,
10]. These inertial forces affect power consumption and make the system harder to stop on precise points. To decrease these effects, the gripper system needs to be compact or to use different materials to lower the weight [
11,
12].
One of the most easily available methods to reduce weight is to change the material used for gripper construction. For this purpose, in this research a composite material was used and tested for the construction of the newly developed gripper. To ease the manufacturing process, additive technology was used.
There are different 3D-printing technologies, such as Stereolithography (SLA), Selective Laser Sintering (SLS), PolyJet, Digital Light Process (DLP), Multi Jet Fusion (MJF), Fused Deposition Modeling (FDM), Direct Metal Laser Sintering (DMLS), Electron Beam Melting (EBM), and so on, that can print with a large variety of materials [
13].
The base principle of the 3D printing/additive technologies remains the same in all printing methods, namely, construction of the part layer by layer. This technology is more and more widely used for the manufacturing of unique parts and even the series production of parts in many production fields such as agriculture, automotive, aerospace, medicine, etc. [
14,
15,
16].
2. Materials and Methods
2.1. New Robot Gripper Solution
In this paper, a new gripper design is proposed by the authors, the design being based on a proprietary patent application. The main advantage of the new proposed design is the high level of configurability, with the gripper being able to grab/clamp, hold and manipulate a large variety of parts with different sizes and shapes, from the interior or from the exterior. The 3D model of this design is shown in
Figure 2.There is a very large number of constructive solutions. This is due to the complex shapes of the parts to be handled. Starting from finding a technical solution, we tried to capture several solutions in one. This was the basis for finding this solution. The gripping system was electrically actuated and was based on a four-jaw/finger parallel open-close action, which ensures a larger area of contact between the parts and system.
What is different about this gripper is its ability to transform from a four-finger mechanism into a two-finger one by introducing a secondary electric motor for the folding operation of the jaws, as shown in
Figure 3.
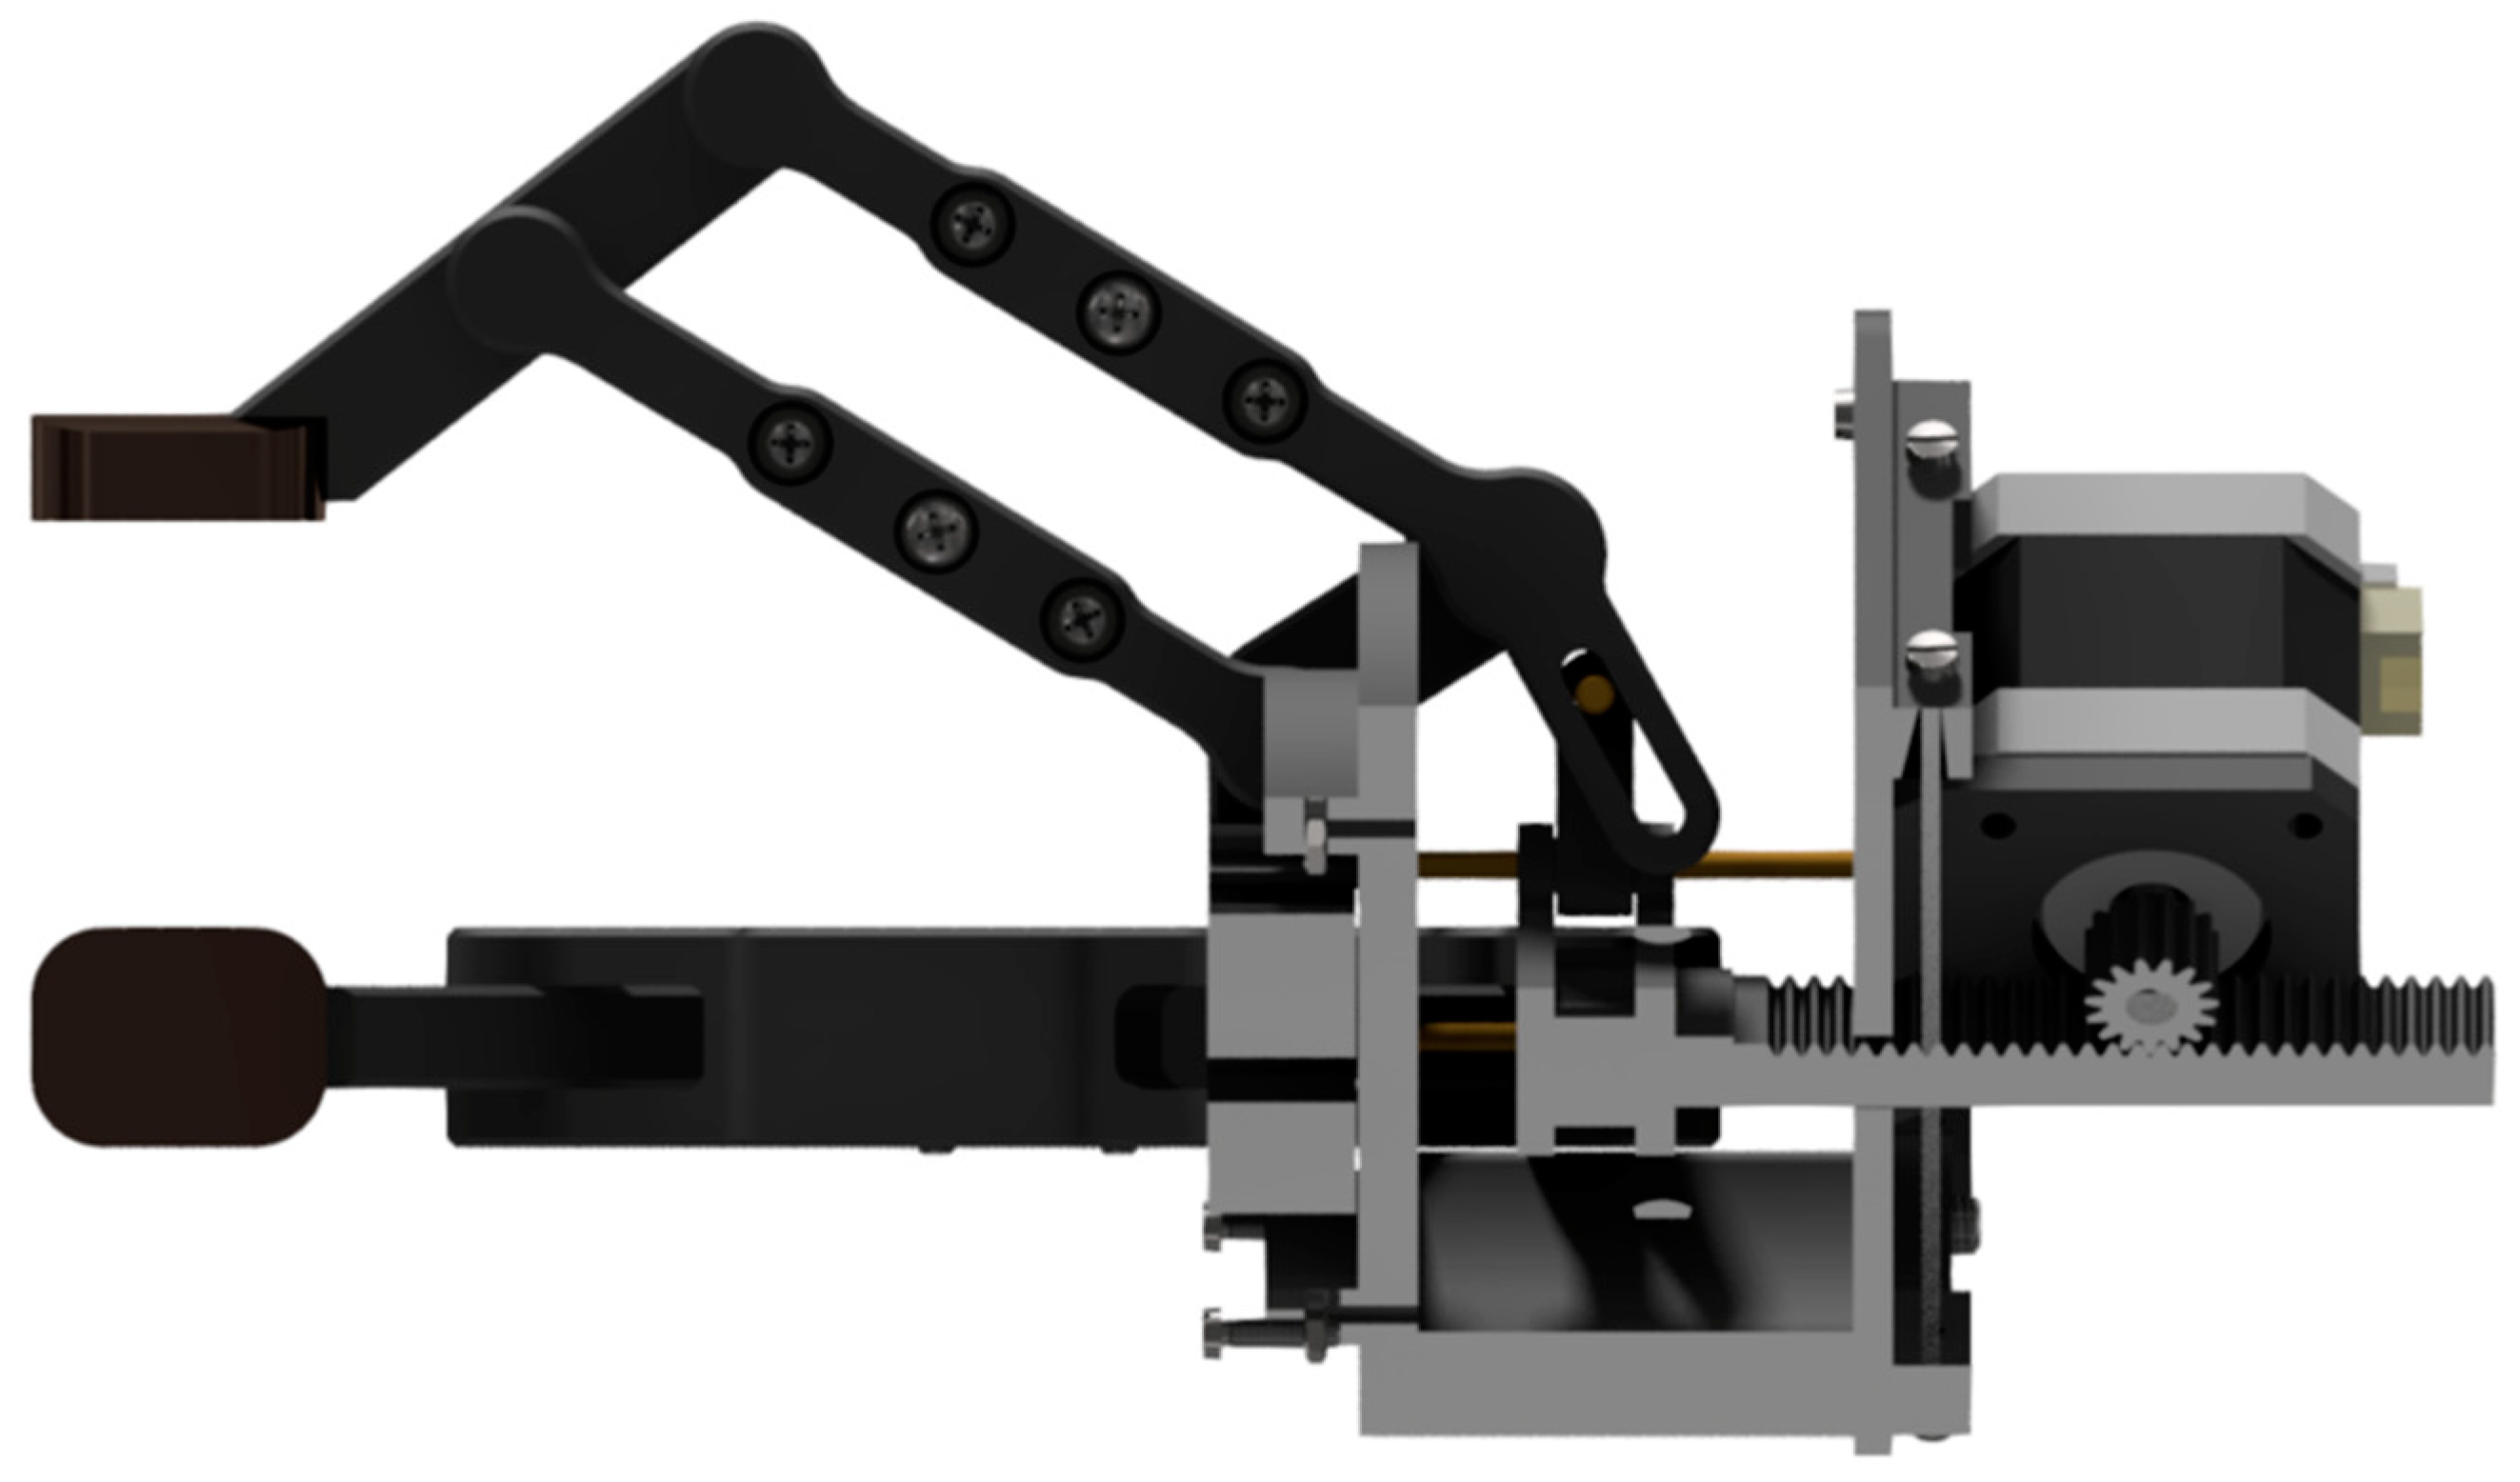
The operating principle of the mechanism is presented in
Figure 4, which show the two electric motors that are inside the system. The main motor (labelled with 1 in
Figure 4) is used for opening/unclamping and closing/clamping of the jaw fingers, ensuring the grasping of the parts. A detailed view of the principle is presented in
Figure 5,which is a section view of the system. The movement of the fingers is ensured by a pinion-rack mechanism.
The second electric motor (labelled with 2 in
Figure 4) allows the conversion from a four-finger to a two-finger grip, and vice versa. This motor displaces a rod that contains a gear segment, which engages with a gear segment mounted on the lower part of the jaw and can directly actuate the jaw.
The maximum dimension of apart that can be handled is 150 mm for the current gripper design. Overall dimensions of the gripper are 250 mm width by 250 mm length when open and in a 4-finger configuration (or 110 × 250 in a 2-finger configuration); and 300 mm height when the fingers are closed or 255 mm when open.
2.2. The 3D-Printing Methods
To obtain the physical model additive manufacturing was used, or 3D printing more specifically. The one used for this research was FDM. An FDM 3D printer works by depositing molten filament material over a build platform layer by layer until the parts are completed. FDM uses digital design files that are loaded onto the machine and translates them into physical dimensions. Materials for FDM include polymers such as ABS, PLA, PETG and PEI, which the machine feeds as wires through a heated nozzle [
16]. The principle of the printing head of this type of 3D printing is presented in
Figure 6.
2.3. Carbon Fiber Materials
In addition to the materials listed above, the 3D printers can use special materials such as composite materials. The material used for testing is a PET CF15, a polyethylene terephthalate reinforced with 15% carbon fiber [
17].
There are studies for the printability of the composite materials using additive manufacturing [
18,
19,
20,
21].
The main categories of fiber-reinforced composites are:
- -
Composites with a polymer matrix: Usually thermoset (epoxy, polyester or polyimide) or thermoplastic resins reinforced with carbon, glass, boron or aramid fibers (Kevlar), with ceramic monocrystals (or more recently with metal fibers). They are used especially in applications where the working temperatures are relatively low (for thermoplastics manufactured by injection, they can reach a maximum temperature of 400 °C) [
22].
- -
Composites with a metal matrix: Most frequently based on aluminum, magnesium, titanium or copper alloys, in which carbon (graphite), boron or ceramic (alumina or silicon carbide) fibers are introduced. The working temperature (often at most 800 °C) is limited by the melting or softening point level that characterizes the matrix material. The disadvantage is the high specific weight, leading to an increase in the massiveness of the final assembly [
22].
- -
Composites with a ceramic matrix: Developed for applications with very high working temperatures (over 1000 °C); the most used basic materials are silicon carbide (SiC), alumina (Al
2O
3) and glass, and the most used reinforcing fibers are also of a ceramic nature (usually in the form of discontinuous, very short fibers) [
22].
- -
“Carbon-carbon” composites: They are composed of carbon or graphite matrices and reinforced with fibers or fabrics of graphite fibers; they are very expensive, but also superior to other materials due to their resistance to high temperatures (up to 3000 °C), along with their low density and low coefficient of thermal expansion. The most common fiber-reinforced composites are carbon fiber, glass fiber and Kevlar [
22].
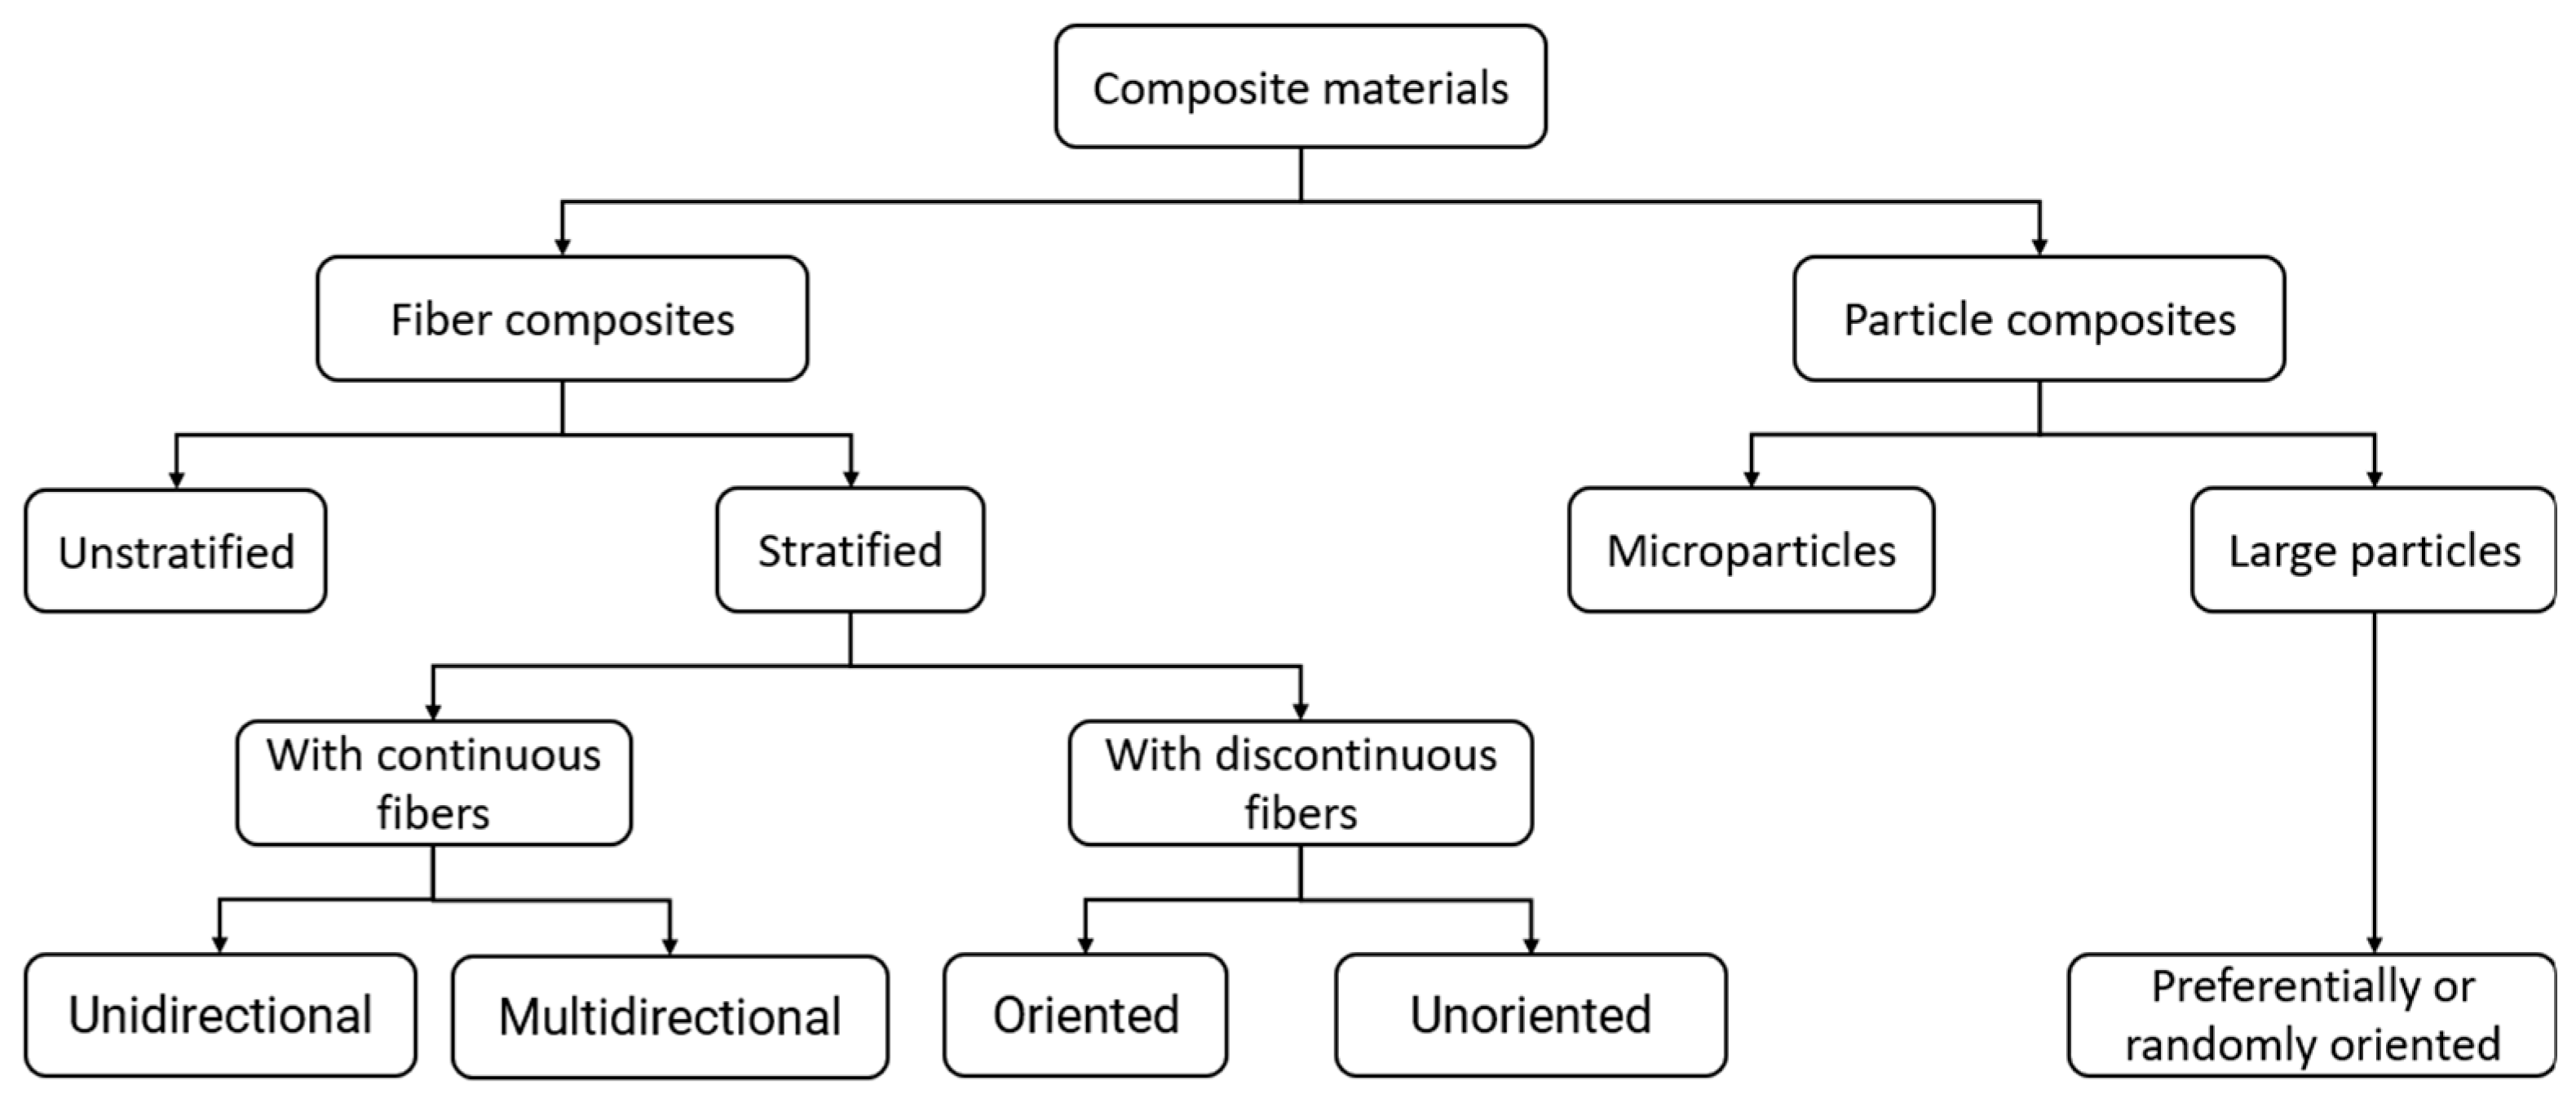
Another more general classification of composite materials is based on the simultaneous use of two criteria: the geometrical particularities of the complementary material and its orientation in the matrix [
23].
Analyzing
Figure 7, the material used in this paper is Composite material → Reinforcement type → Fiber-reinforcement → Short → Random.
2.4. Testing Probes
For testing, 3D-printed tensile test specimens were made from different materials (
Figure 8).
The tensile specimens/tests were made using standard D638-14 [
24]. Several types and sizes of specimens are shown in
Figure 8. It should be noted that type IV samples were used for this work. The dimensions indicated on the drawing are indicated by letters because the dimensions may vary from one type of specimen to another depending on the thickness of the specimen. The dimensions corresponding to the letters in the figure can be found in standard [
24] and the thicknesses of the samples are indicated in the first row of the table.
Knowing the specimen dimensions, the next step is to provide the 3D printer with some parameters. Three types of parameters were considered, each with 2 values:
- -
Infill percentage:
- -
Layer thickness:
- -
Raster angle:
Using these parameters, a factorial experiment was performed which had 2 levels and 3 factors, more specifically 2
3, totaling 8 possible combinations as shown in
Table 1.
For a more conclusive result, three copies were made for each of these eight types of specimens. Therefore, a total of 24 specimens were printed with carbon fiber reinforcement PETG.
Furthermore, for a comparison with classic 3D printing material, PLA and ABS P430 materials with exactly the same printing properties were used, resulting a total of 72 specimens to test.
These are the parameters that we tested, but there are numerous articles that combine different printing parameters or technologies with various types of materials to optimize the strength of the parts [
25,
26,
27,
28,
29].
For testing the specimen, a traction testing machine (Lloyd Instruments LRX Plus) was used to determine the force-displacement curve. In order for the test to meet the test standard, the distance between the two grippers of the traction device was set to 65 mm and the test speed was 5 mm/min at room temperature.
The machine was connected to a computer which used Nexigen Plus software v 3.0 to collect and process the results.
The setup for the specimen-traction machine-computer is presented in
Figure 15: the 3D-printed test specimen (1) is clamped between the testing machine jaws (2) (the lower one is fixed and the upper one pulls up at a constant speed); also indicated are the machine (3) and the monitor (4) where the results are shown in the form of graphs.
Figure 16 shows a print screen image from one of the specimen test.
3. Results
3.1. Results of the Specimen Testing
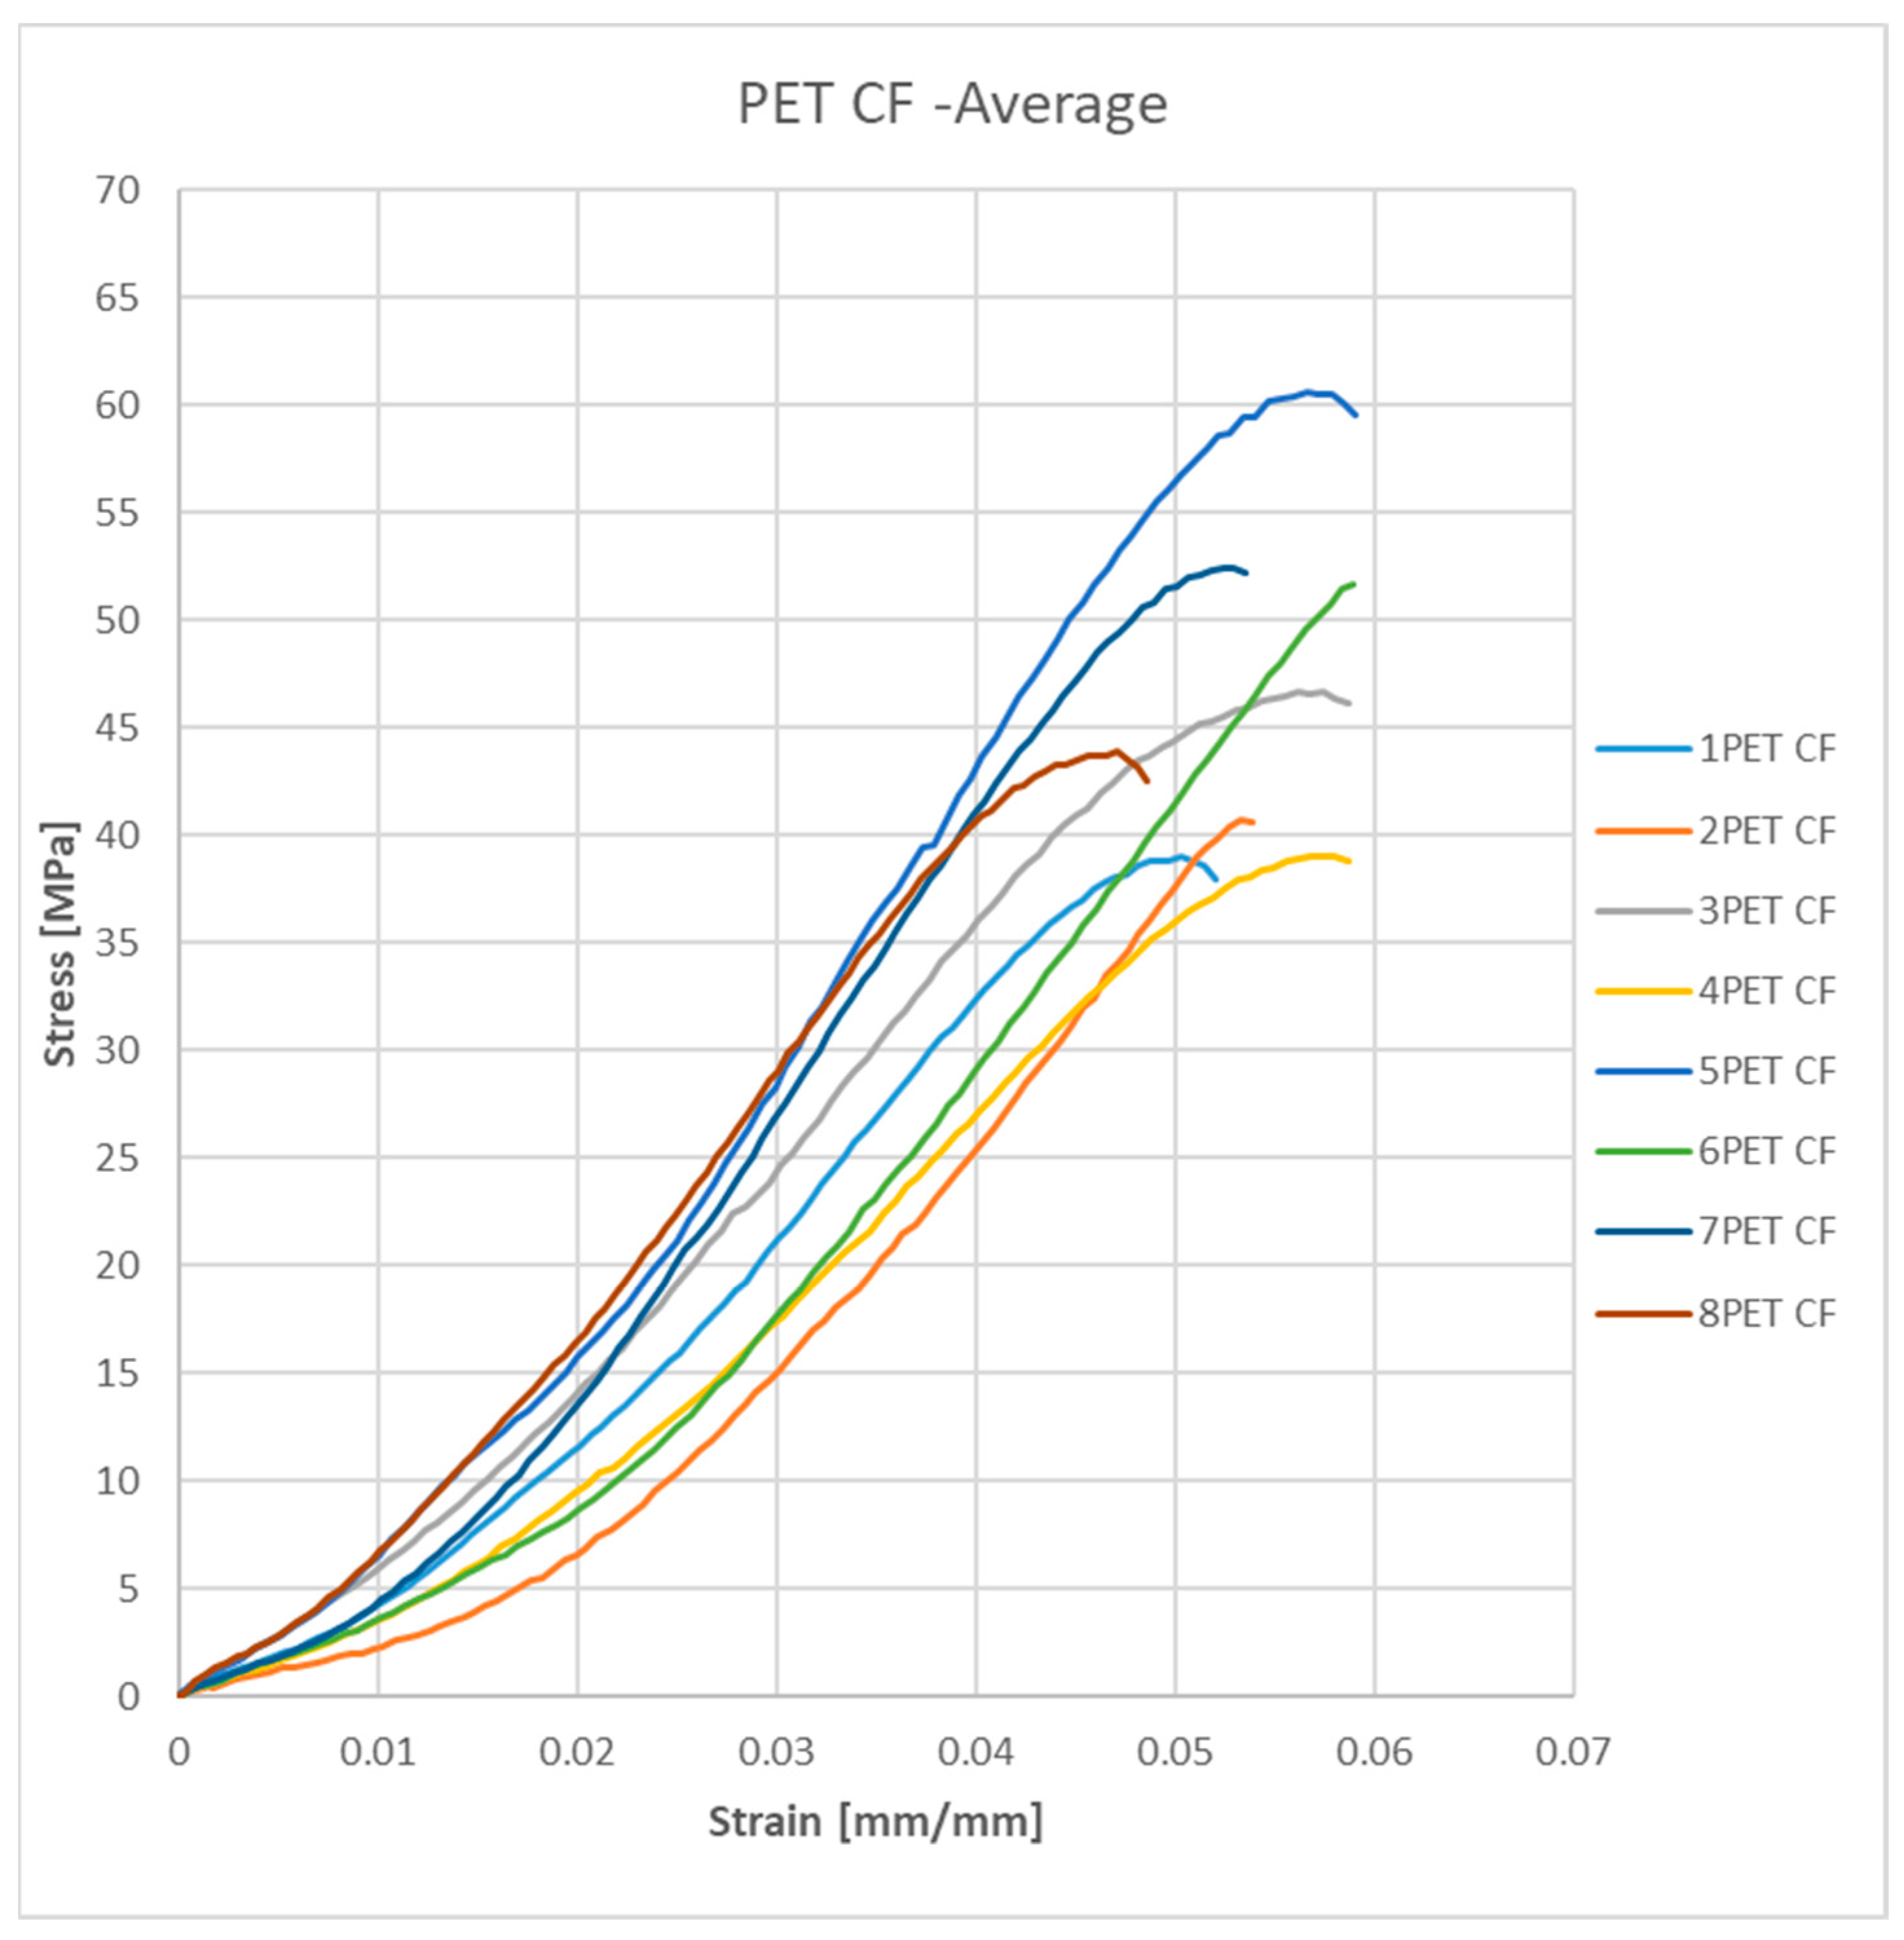
All 72 specimens were tested and the force-displacement curves were extracted. Knowing the force acting on the samples and their dimensions, with the help of Relation 1, stress (σ), expressed in MPa, can be determined. Additionally, with the help of Relation 2 and the displacements made by the traction machine, strain (ε) can be determined for each specimen, expressed in mm/mm.
Figure 17 shows the average results after specimen tests from the PET CF material. For example: 1PET CF is an average stress–strain curve of all three copies of specimens with the same print parameters (60% infill, 0.33 mm layer thickness and 90° raster angle). The numbers (from 1 to 8) represent the type of printing parameters which correspond with the column “Run” from
Table 1.
Table 2 presents the printing parameters for the PET CF test probe and the experimental results regarding Yield points (elastic limits).
Figure 18 shows the average stress–strain curves of the average results for the PLA material. The numbering is the same as the material above.
Table 3 presents the printing parameters for the PLA test probe and the experimental results regarding Yield points (elastic limits).
Figure 19 shows the average stress–strain curves of the average results for the ABS material. The numbering is also the same as the material above.
Table 4 presents the printing parameters for the ABS test probe and the experimental results regarding Yield points (elastic limits).
In
Figure 20 the differences between “the best” stress–strain curves for each material (PET CF, PLA, ABS) are presented.
It can be observed that the material with carbon fiber reinforcement is slightly more rigid, with a higher yield point and also a higher breaking point than the other two.
The regression equations to determine the yield point of materials are shown below (Equation (3) for PET, Equation (4) for PLA and Equation (5) for ABS):
Regression equations are used to describe the relationship between the response and the terms in the model. The regression equation is an algebraic representation of the regression line [
30].
Table 5 points out how well the model fits our data.
S is used to assess how well the model describes the response. S is measured in the units of the response variable and represents how far the data values fall from the fitted values. The lower the value of S, the better the model describes the response [
30].
R-sq is the percentage of variation in the response that is explained by the model. The higher the R2 value, the better the model fits the data. R2 is always between 0% and 100% [
30].
R-sq (pred) is used to determine how well the model predicts the response for new observations [
30].
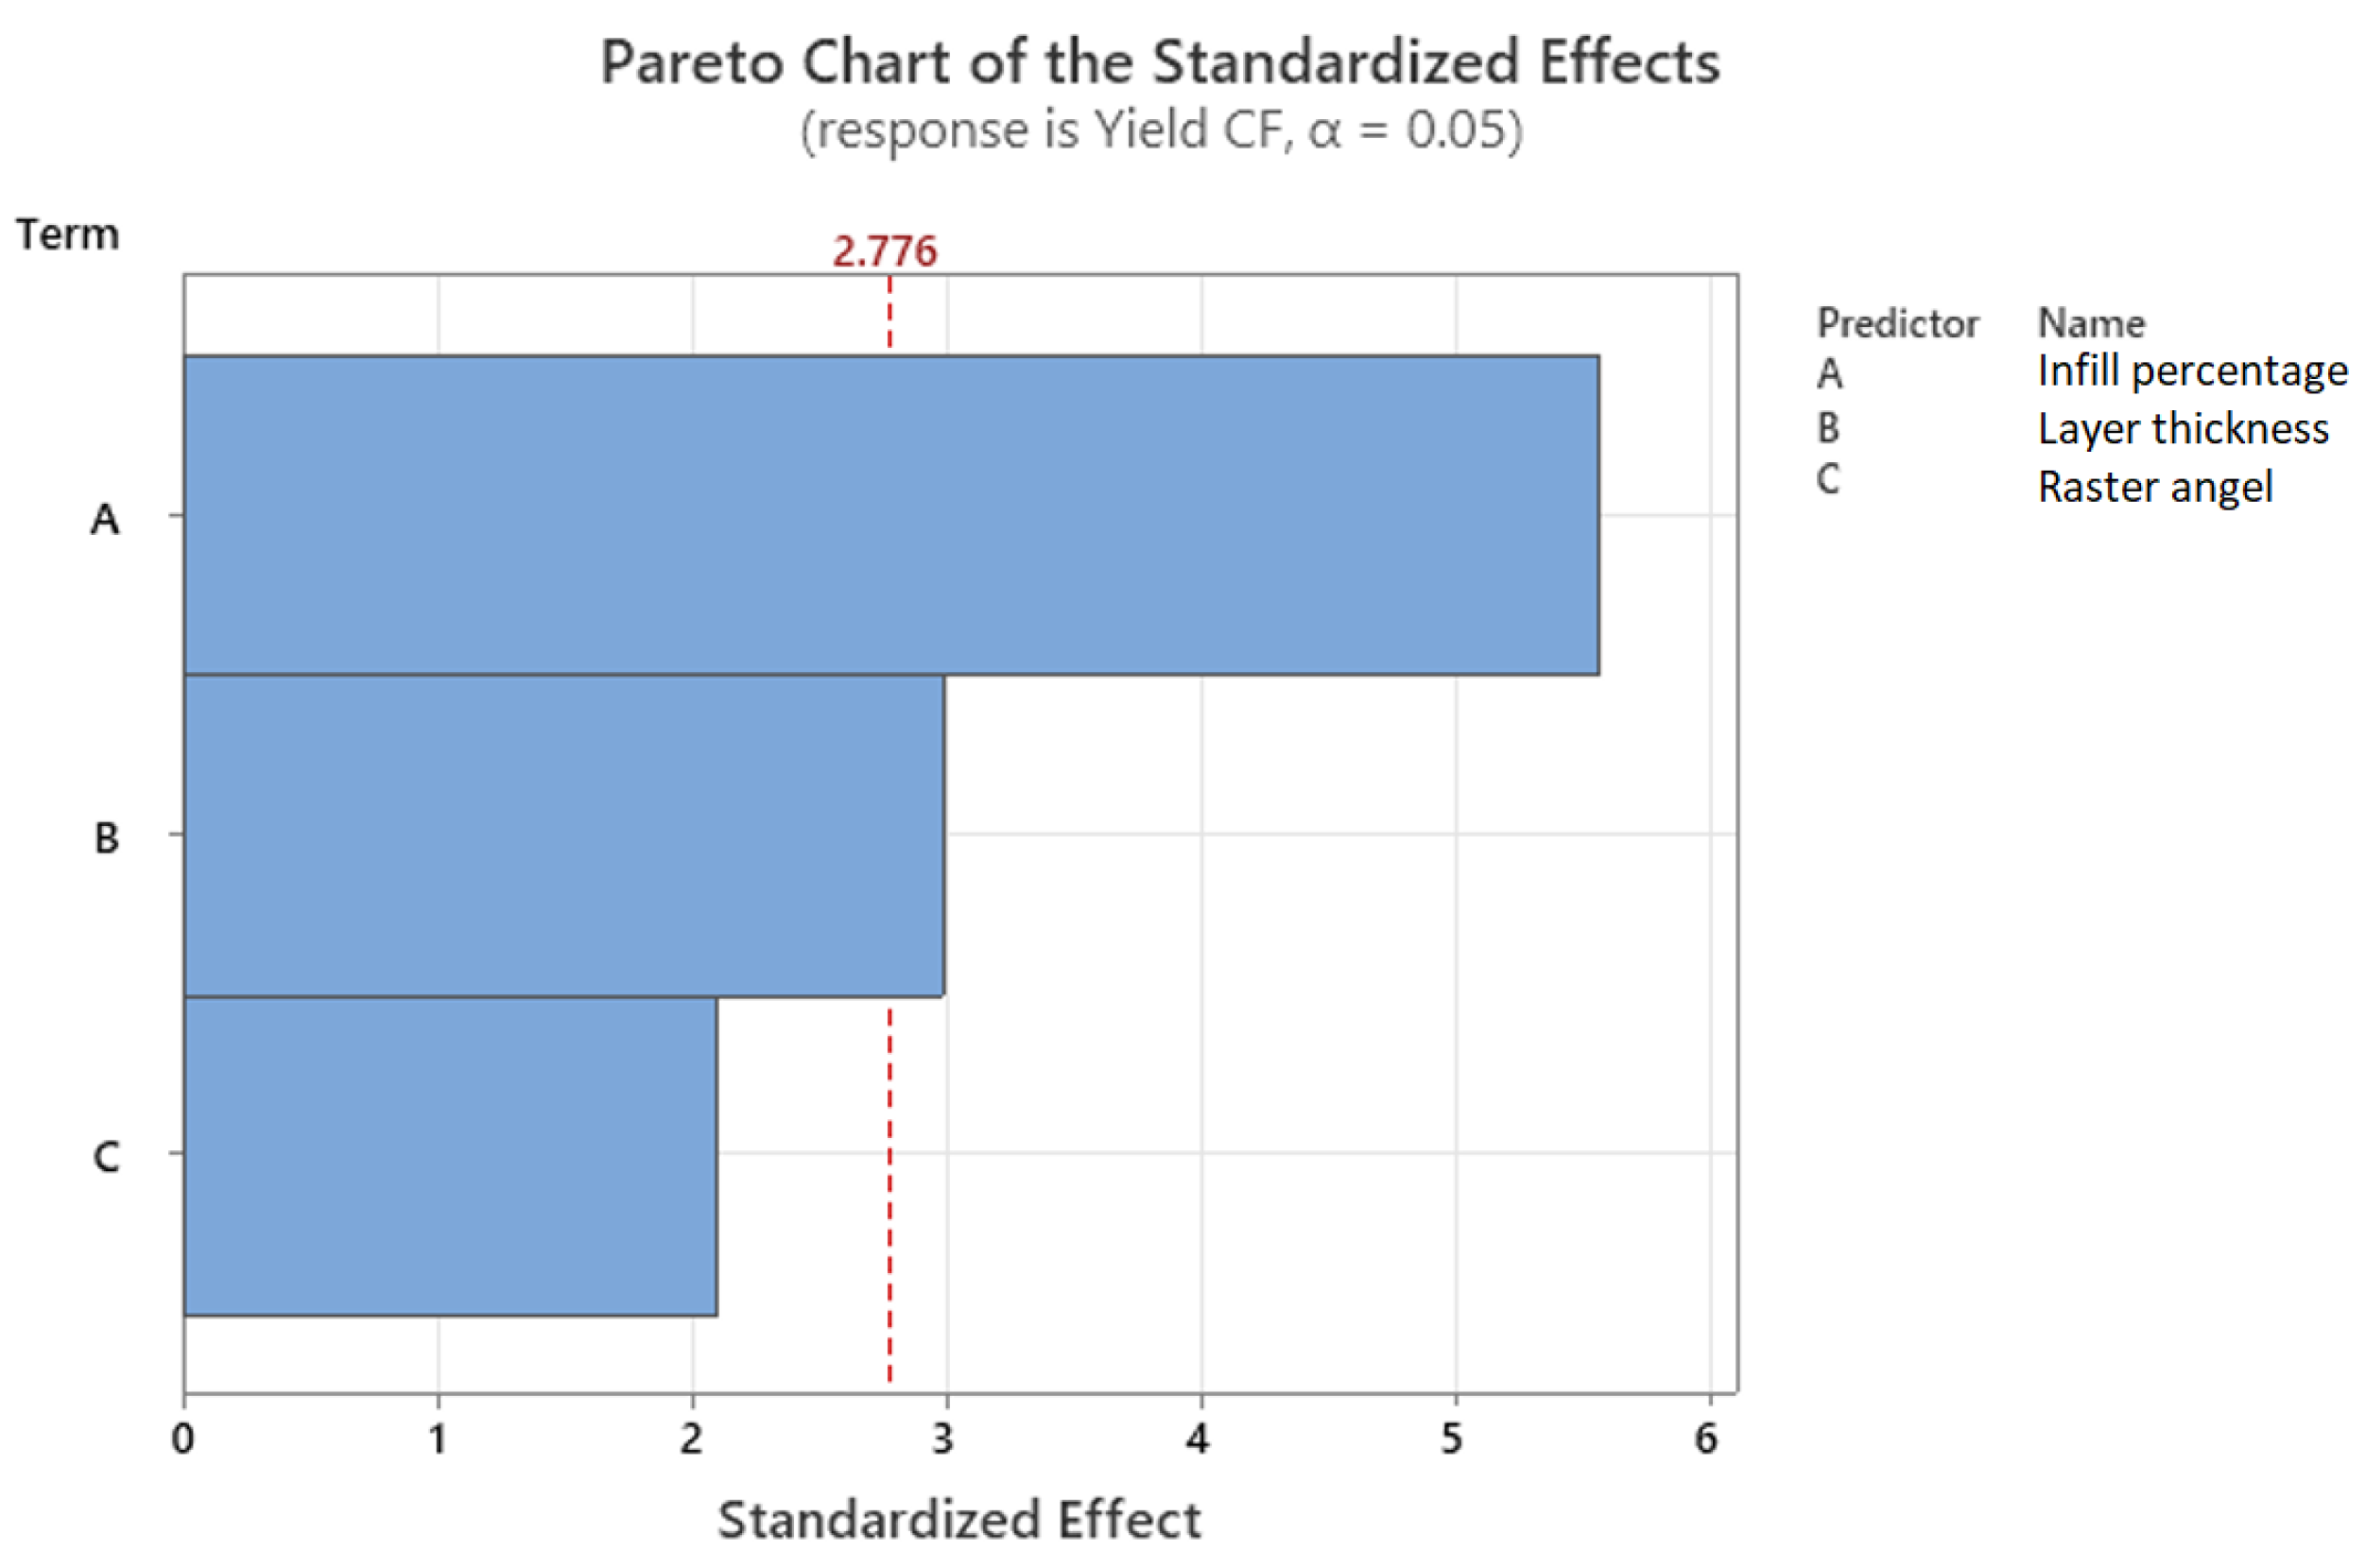
Figure 21 shows a Pareto diagram for the PET with carbon-fiber reinforcement, where the influence of each 3D printing parameter used (infill percentage, layers thickness and raster angle) can be observed. From this diagram, it can be concluded that the infill percentage has the greatest influence on probe test.
Figure 22 shows the main effects for the PET CF material, where the same 3D printing parameters were also introduced. The line connecting the means is interpreted as follows:
When the line is horizontal (parallel to the x-axis), there is no main effect present. The mean response is the same across all factor levels.
When the line is not horizontal, there is a main effect present. The mean response is not the same across all factor levels. The steeper the slope of the line, the larger the magnitude of the average effect.
Figure 23 shows the interaction diagram. This diagram is used to show how the relationship between a categorical factor and a continuous response depends on the value of the second categorical factor. This graph shows the means for the levels of one factor on the
x-axis and a separate line for each level of another factor. To understand how the interactions affect the relationship between the factors and the response, the lines should be evaluated as follows:
Parallel lines—no interaction takes place;
Non-parallel lines—an interaction occurs. The more non-parallel the lines, the stronger the interaction.
3.2. Finite Element Analysis Calibration of the Specimens
For material curve definition for finite element analysis programs, such as Ansys, the obtained curves were processed to be able to define the material as correctly as possible. Thus, the three material curves, the most resistant from a mechanical point of view, were defined, one for each individual material, as specified in
Figure 20.
A random material with random properties from all 24 was chosen to be studied and analyzed using finite element analysis. Furthermore, the ABS material with a 100% infill percentage, 0.17 mm layers thickness and 90° raster angle was considered (5ABS). The stress–strain curve was processed to obtain a curve that is suitable for the finite element analysis software, initially for the 5ABS material and then for all three types of materials. The stress–strain curve for 5ABS is shown in
Figure 24.
To verify the mechanical properties of the defined materials, finite element analysis simulations were performed on the specimens.
The first step was to define the geometry of the specimen. This used the same standardized geometry used to 3D-print them (presented in
Figure 9).
Figure 25 shows a screenshot of the geometry.
The model is meshed in small elements, with a total of around 9200 nods and around 42,000 elements as is shown in
Figure 26.
After meshing the geometry, the mechanical conditions were defined, such as embedding the model in a part (the blue part in
Figure 27) that mimics the clamping between the fixed jaws of the testing machine and establishing an
x-axis displacement in the opposite end of the model (the yellow part in
Figure 27), which imitates the movement of the upper gripper of the test machine.
It should be noted that the distance between the two conditions (or the distance between the blue-colored part and the yellow-colored part) was 65 mm, according to the standard.
Figure 28 shows the result of the simulation (stress–strain curve) compared to the previously defined material curve (
Figure 24).
It can be seen that the two overlap, which means that the simulation conforms to the actual specimen test.
The material 5ABS (with a 100% infill percentage, 0.17 mm layers thickness and 90° raster angle were considered) was randomly chosen. For further investigations, this material with the same printing parameters was used to 3D-print one finger of the proposed gripper solution and a finite element analysis was performed with the data obtained in the testing probe (the finger was subjected to mechanical tests).
In
Figure 29 (left) is the 5ABS 3D-printed finger, and on the right is the finite element analysis with NON-validated results for the moment (only generic material was used).
If the results from the finite element analysis on the entire finger with the same material definition as the probe above were similar to the real test on the 3D-printed finger, further investigations with other types of material and 3D-printing parameters were made.
4. Discussion
For this research work, a new four-jaw gripper constructive solution was designed, which fulfils the current requirements of the market of flexible manufacturing systems, using a 3D-printing process and composite plastic materials, from the most common ones (such as PLA and ABS), to a more special material with carbon-fiber inserts.
The fact that the current trend of gripper mechanisms is aimed towards finding a constructive solution that can perform multiple tasks, such as grabbing/manipulating parts of different shapes and sizes either for sorting or assembling the components of an assembly, has led to our attempt to find a constructive solution of our own in this research.
3D printing is becoming an increasingly widespread manufacturing process, and the research directions are aimed toward increasing precision and productivity. The types or processes of 3D printing are constantly evolving. Even if some are similar, each printing process has advantages and disadvantages and specific application fields, covering the printing of simple plastic parts on inexpensive 3D printers to the complex metal printing of parts in extremely complex and expensive machines. Obviously, depending on the complexity of the 3D printer and the precision when materializing the parts, the cost of purchasing such a printer or producing the parts is directly proportional to this.
In order to test and accurately rank the 3D-printing materials for intended applications, test parts were printed on different printers according to the D638-14 test standard for geometry of the specimens. The test machine used in own experiments was setup to the standard requirements.
Using physical tests of a tensile-compression testing machine, it was possible to determine material stress–strain curves, which, through transformation calculations, extracted the data needed to define the materials in the finite element analysis software. After defining them, it was possible to perform FEA simulations where the forces, respectively, the internal stresses, were validated in relation to the deformation of the samples.
From a cost perspective, the price ratio is the most favorable for the PLA material; however, this material, unlike PET-CF with carbon fiber inserts, is very susceptible to moisture and ultraviolet light, thus losing its original properties over time. Even if the cost is much higher for the material with carbon-fiber inserts, it does not pose moisture problems or other disadvantages that PLA presents, and maintains its mechanical properties for a long time. Overall, the most mechanically resistant material is PET with carbon-fiber reinforcement.
5. Conclusions
3Dprinting is a powerful manufacturing process that has the maximum flexibility in terms of the printed parts; almost every geometry designed can be obtained, with good mechanical properties, or good enough for the intended purpose. Considering that grippers are low-volume parts, 3D printing is a very good alternative to the conventional manufactured grippers that are usually CNC-machined and assembled. By using an FEA simulation, small enhancements can be made to the gripper prototype in order to achieve stronger parts or cheaper parts with the same rigidity. In this case, testing of the new parts can be performed in a matter of hours. Additionally, replacement parts for grippers can be printed in a short time, shorter than when completing an order for a conventional parts supplier.
Following the tests carried out, the elastic limit (yield) for carbon-fiber-reinforced PET material was around 19% higher than for the PLA material and 84% higher than for the ABS. Overall, raster angle had a low impact on strength with only 2% (90 degrees was better than a 45-degree angle), and the layer thickness had a slightly bigger impact with 7.2% (0.17 was better than 0.33 mm). The most important factor for the strength of the testing specimens was the infill percentage, which was 42.1% (100% was better than 60% infill).
FEA simulations allow the testing of complex parts in various situations, but without proper knowledge of the material properties, the results have only indicative values. By using physical tests with the tensile-compression testing machine, the real material stress–strain curves were determined for different test samples made form PLA, ABS P430, and PET-CF. Considering the ability of 3D printing to create parts with different properties derived from the printing parameters, the most relevant parameters were selected and used in our own experiments. For each selected parameter, namely infill percentage (%), layer thickness (mm), and raster angle (°), three relevant values were selected that could also be materialized on the available printers. Test parts were printed respecting D638-14standard geometry. All 72 specimens were tested and the force-displacement curves were extracted in order to obtain base information for the FEA simulation. FEA can be a powerful instrument in the simulation and validation of various constructive solutions for grippers, in this case. FEA and 3D printing can lead to a shorter time to make a prototype; moreover, 3D printing can be a standalone manufacturing process, albeit in low batches, where grippers are found in terms of production volume. The selection of relevant materials and the durability of the parts manufactured by 3D printing will be a continuous research subject. Currently, with the reduction in the lifespan of products and the increased capabilities of the manufacturing process in machinery manufacturing, 3D-printed parts can be considered satisfactory in terms of durability, which applies to the designed gripper as well.
The experimental data indicate similar behavior for the stress–strain curves of the PET and PLA materials. A better result would be in favor of the PET material. The presented tabular values for the experimental data can be used to fine-tune the FEA simulation in order to improve the accurate description of the behavior of a material.
For further research, we propose to test other composite materials and also more printing parameters to determine their influences on the rigidity of the parts.
Additionally, we will look to reduce the dimensions of the gripper body by replacing the current electric motors with ones of a smaller size but with the same or even greater power.
A different research direction would be to apply all of these material properties on a full-scale gripper mechanism, test it, measure it, and try to simulate those behaviors using finite element analysis software.
6. Patents
Păduraru E., Chitariu D. F., Dumitraș C. G., Horodincă M., Munteanu A., Chifan F., Hrib F. V., Patent Application, Modular Prehension Mechanism, 5734/06.06.2022.

 ,
, 


