Article

Study of Surface Integrity of SiCp/Al Composites Using High-Speed Milling under Cryogenic Liquid Nitrogen Conditions

School of Mechanical Engineering, Harbin University of Science and Technology, Harbin 150080, China
*
Author to whom correspondence should be addressed.
Machines 2023, 11(6), 608; https://doi.org/10.3390/machines11060608
Submission received: 23 March 2023 / Revised: 9 May 2023 / Accepted: 17 May 2023 / Published: 2 June 2023
(This article belongs to the Special Issue Recent Progress of Thin Wall Machining)

Abstract

:
In order to study surface roughness, surface morphology, surface microhardness, and surface residual stress, single-factor and central combination high-speed milling testing of SiCp/Al composites was carried out using a PCD tool under cryogenic liquid nitrogen cooling conditions. The test results show that the surface roughness value gradually increases with an increase in feed or milling depth, and the interaction between the two can make this phenomenon more serious. When the milling speed changes at 200~360 m/min, the surface microhardness and surface residual stress first increase, and then, become smaller, so it is recommended to use a speed above 240 m/min for milling under cryogenic liquid nitrogen cooling conditions. With an increase in milling depth and feed, the degree of surface microhardness is significantly improved, and the residual compressive stress also has a tendency to convert to residual tensile stress. In addition, it can be seen from the simulation results that as the milling depth and feed per tooth increase, the interference effect of the SiC particles on internal residual stress transfer also increases. Therefore, it is not recommended to use both high milling depths and high feed per tooth.

1. Introduction

SiCp/Al composites have high specific strength, high specific stiffness, and other excellent comprehensive properties, and are widely used in aerospace, advanced weapon systems, precision instruments, automobile manufacturing, electronics, and other fields [1,2,3,4,5]. However, the two constituent materials contained in SiCp/Al composites are typically difficult-to-machine materials that show high cutting temperatures, large cutting forces, difficult chip control, and easy work hardening during the cutting process [6,7,8,9]. By milling SiCp/Al composites, Bian et al. observed that dislodged SiC particles, if they do not leave the workpiece surface in time, will form scratches on the surface whether they are pressed into the surface or pushed against it by the tool [10]. Zhou Li and other scholars carried out residual stress simulation of SiCp/Al composites under dry conditions, and established a microplane strain model, which made the simulated process closer to real cutting [11].
In recent years, a lot of research on the surface integrity of SiCp/Al composites has been conducted by scholars around the world. Xiang J and other scholars have found that a better surface can be obtained by using a larger arc radius of the tool tip [12]. Muthukrishnan used PCD tools to cut SiCp/Al composites, and concluded that when the cutting speed is high, an increase in tool flank wear has little effect on the surface roughness [13]. Huang Shutao et al. of Shenyang University of Technology used PCD tools with different particle sizes for the high-speed milling of SiCp/Al composites, and found that the larger the diamond particle size, the better the wear resistance of the PCD tools and the smaller the corresponding cutting forces and surface roughness [14,15]. Mengfei Li and other scholars found, through SiCp/A356Al end milling tests, that under dry cutting conditions, because broken SiC particles cannot be eliminated in time, serious scratches will appear on the surface [16]. Kaynak et al. compared the effects of liquid nitrogen, dry and micro lubrication, and conventional wet and cold conditions on a series of indicators of surface integrity, and the results showed that liquid nitrogen low-temperature auxiliary cooling had a good effect on cutting force, heat, and surface roughness [17]. Zhou et al. found that a stable low temperature of liquid nitrogen greatly inhibited the occurrence of brittle particle fracture during processing when grinding SiCp/Al composites under low-temperature auxiliary cooling of liquid nitrogen [18]. Ruxin Shi carried out end milling tests on SiCp/6063Al under low-temperature minimum lubrication and dry conditions, and the results showed that low-temperature minimum lubrication technology had a good lubrication effect, and at the same time, reduced the influence of cutting heat and cutting force on surface microhardness [19]. Xiaohui Jiang et al. verified experimental data on residual stress in the feed direction and vertical feed direction through finite element simulation, and found that the residual stress distribution in different circular processing areas was uneven [20]. Masmiati N et al. optimized their cutting data during inclined end milling, and concluded that the inclination angle of the machined surface increased, the microhardness increased, and the residual stress became more tensile [21]. Shuang Li and other scholars compared the surface and chip morphology of a SiCp/Al composite after end milling under low-temperature dry and liquid nitrogen conditions. The results show that the low-temperature effect of liquid nitrogen effectively suppresses the high temperature of the cutting zone, and a better machining surface can be obtained. However, this paper does not further explore the influence of changes in milling parameters on the three-dimensional topography of the surface under the low-temperature auxiliary cooling of liquid nitrogen [22].
Based on the existing research, in the current paper, the surface roughness, surface microhardness, and residual stress of SiCp/Al composites after milling are studied by changing the milling parameters under the low-temperature assisted cooling of liquid nitrogen, and a surface roughness regression model is established. In addition, a simplified two-dimensional milling model, defined separately for the matrix material and the granular material, is established; a low-temperature heat transfer coefficient is assigned to the model, the residual stress generated by the low-temperature end milling process of liquid nitrogen is numerically simulated, and the influence of SiC particles and different milling parameters on the residual stress distribution law is explored. This paper provides a theoretical basis for subsequent research on the liquid nitrogen milling of SiCp/Al composites.

2. Test Conditions and Scheme

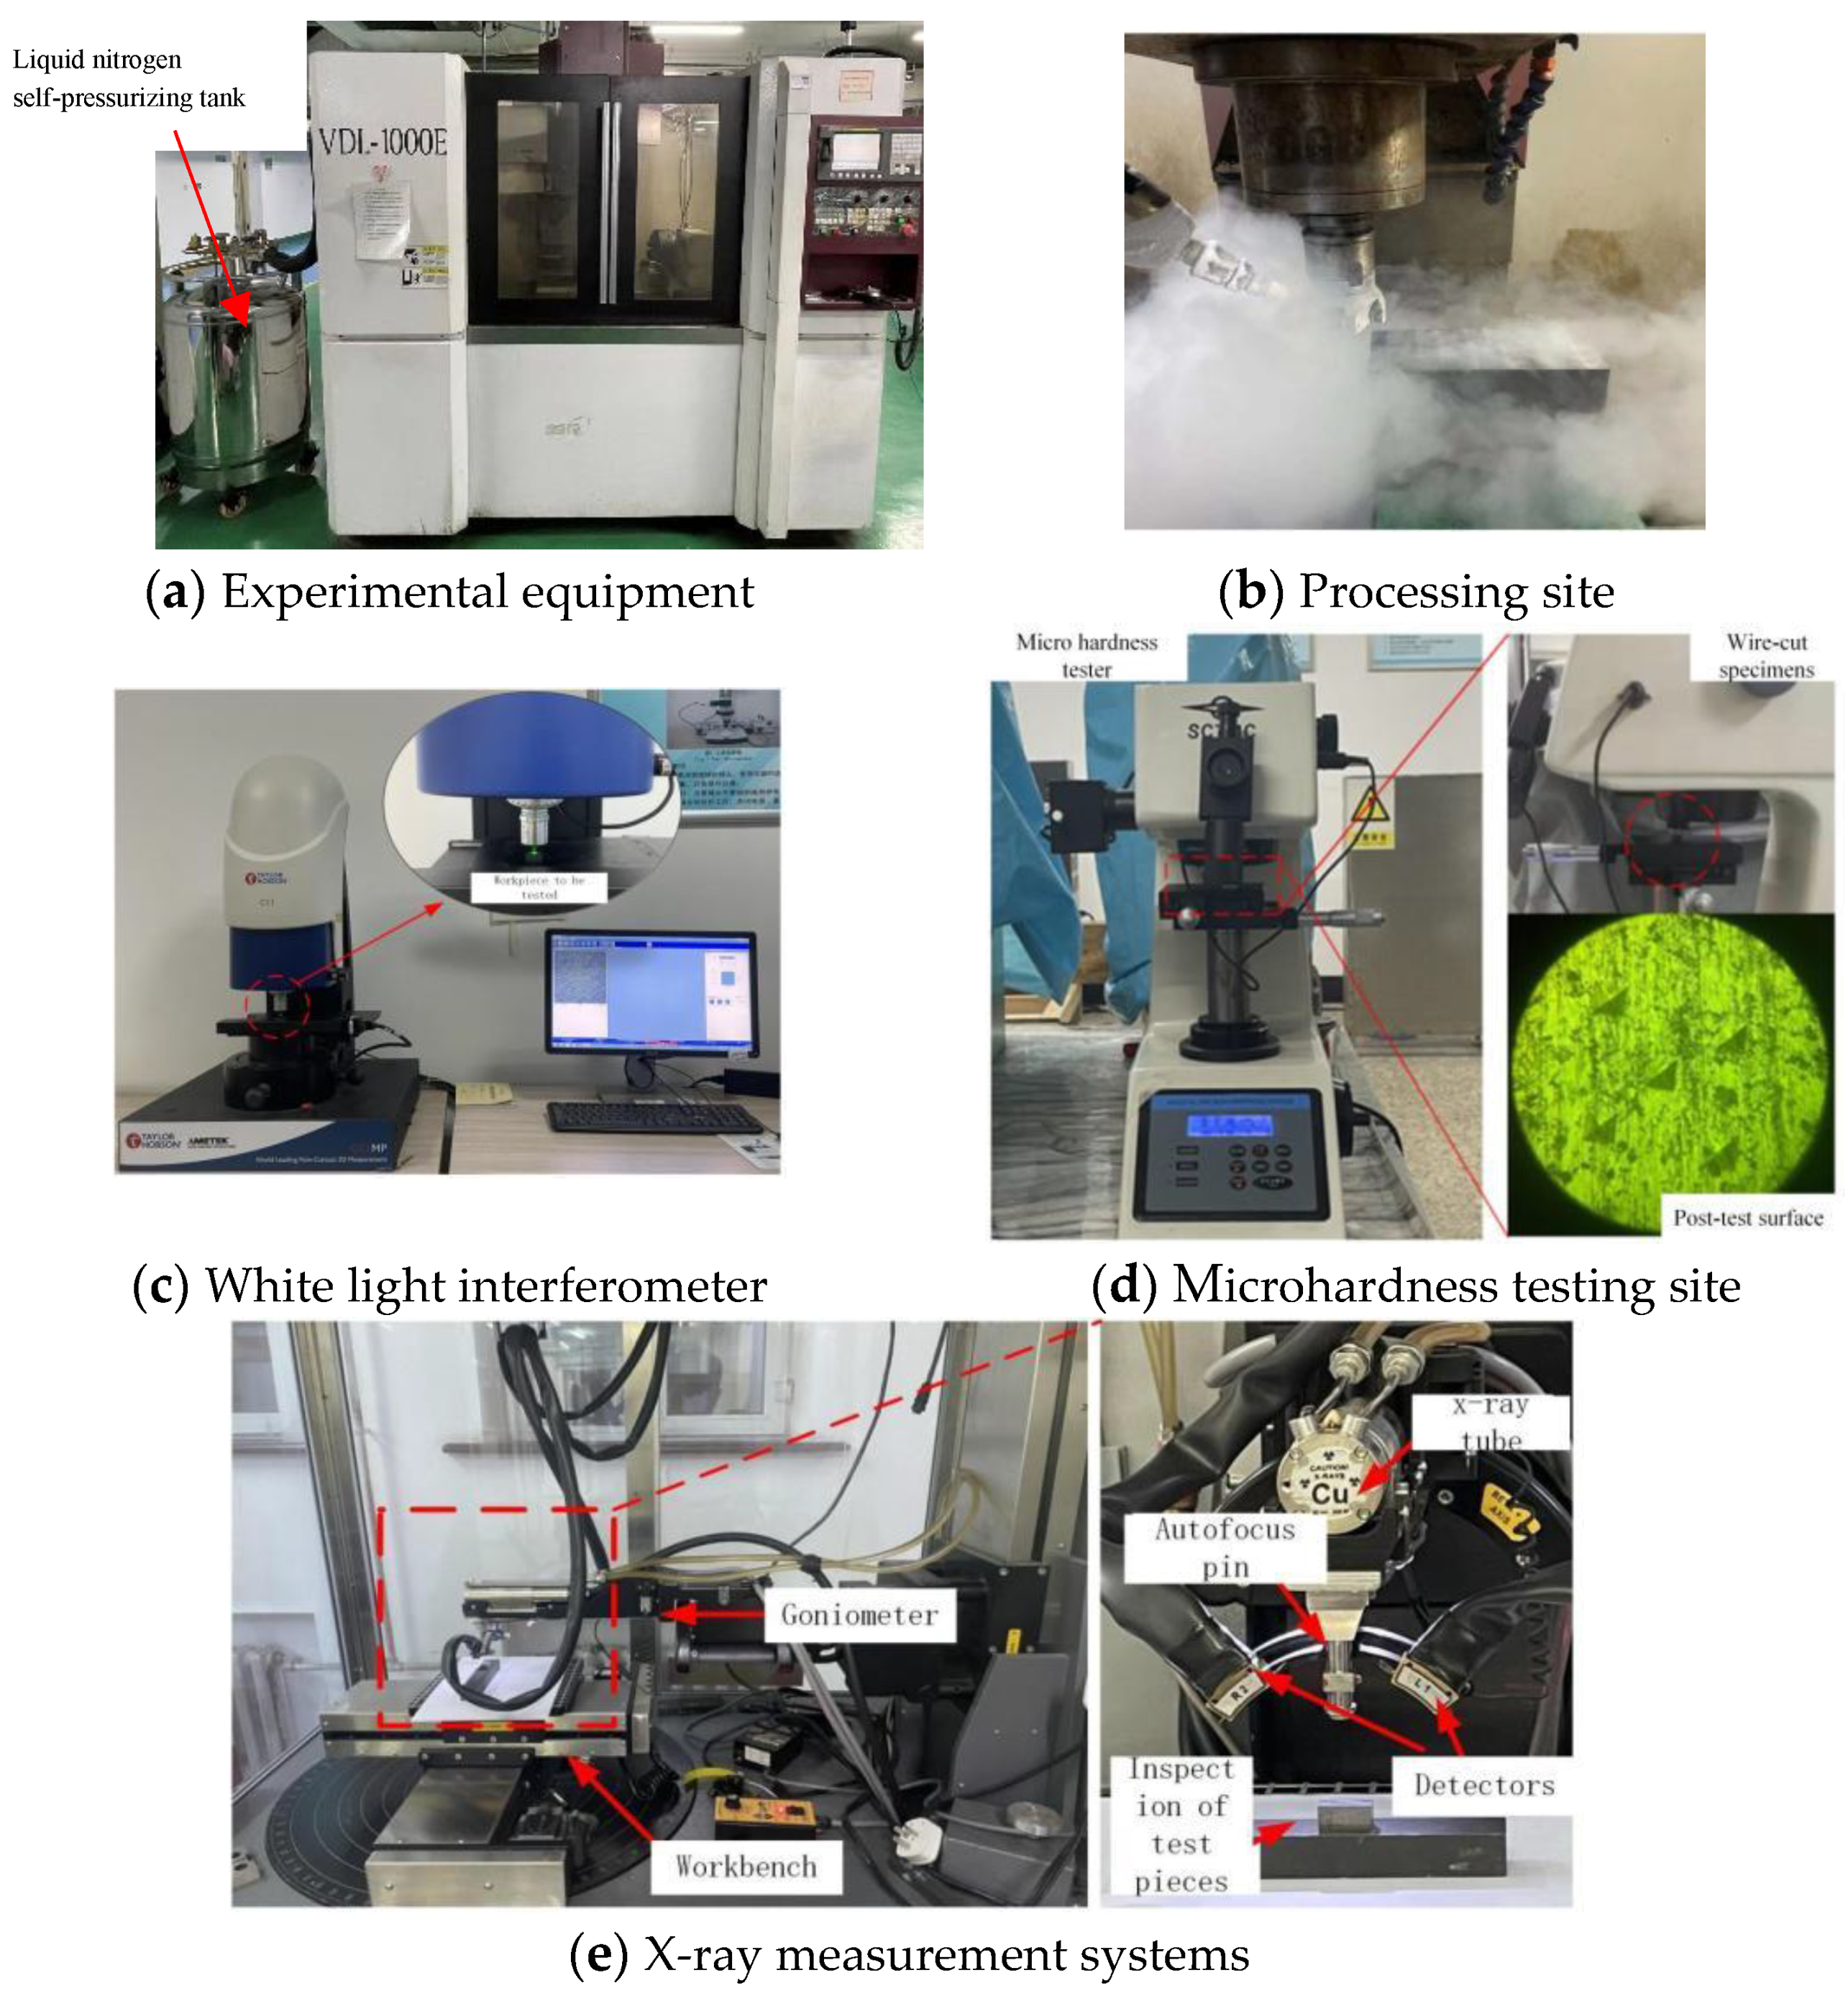
2.1. Test Conditions

The test material was a SiCp/Al composite material with a volume fraction of 45%, and its specific size was 200 × 150 × 90 mm3. Its main components were C, Mg, Al, Si, and Cu, and its chemical composition is shown in Table 1.
The machine tool used in this test was a VDL-1000E three-axis vertical machining center from the Dalian Machine Tool Group, and the liquid nitrogen storage equipment was a YDZ-100G self-pressurized liquid nitrogen tank with a “built-in heat insulation layer”, and the tank body was equipped with a pressure gauge, booster valve, and relief valve. A liquid nitrogen nozzle with a diameter of 3.0 mm enabled the stable injection of liquid nitrogen; the injection pressure was 0.04 Mpa, and the liquid nitrogen injection angle was 30°, as shown in Figure 1a. A clearer picture of the processing site is shown in Figure 1b. In this test, a BAP400R 80-27-6T model indexable milling cutterhead produced by Sweden’s SANDVIK company was selected; the diameter of the cutterhead was D = 80 mm and up to six inserts could be installed. With the cutterhead selected, a SANDVIK PCD polycrystalline diamond milling insert was applied, and the front and back angles of the blade were 2° and 10°, respectively.

2.2. Test Scheme

The first test was to perform face milling of the SiCp/Al composites through a single-factor test with three main milling parameters as test variables [12]. The variables that needed to be fixed during the experiment were vc = 280 (m/min), fz = 0.16 (mm/tooth), and ap = 0.6 (mm), as shown in Table 2.
Test 2 adopted the Box–Behnken experimental design, for which the levels of the milling parameters selected for the test and their factor coding are shown in Table 3.
The surface roughness and surface topography were measured using the SuperView W1 model white light interferometer, five surface roughness parameters at different positions on the surface of the sample were taken, and the average value was taken to calculate the surface roughness value and obtain the three-dimensional morphology, as shown in Figure 1c. The selected detection method for microhardness was the more commonly used indentation method, and the selected testing equipment was the HDV-1000A Vickers microhardness tester, as shown in Figure 1d. We selected five microhardness values at different positions on the surface of the sample, and took the average. The surface of the specimen did not undergo any treatment. The applied load was set at F = 2.942 N, and the time was 15 s. An X-350A X-ray stress tester was used for residual stress detection. The Bragg angle was 2θ = 139 crystal faces (311), and the counting time was 0.50 s (Figure 1e). For the measurement of milling force, we choose a Kistier 9253B23 three-way piezoelectric dynamometer, a Kistier5070A charge amplifier, and a PCIMDAS1602/16 data acquisition card.

3. Analysis of Surface Roughness and Surface Morphology

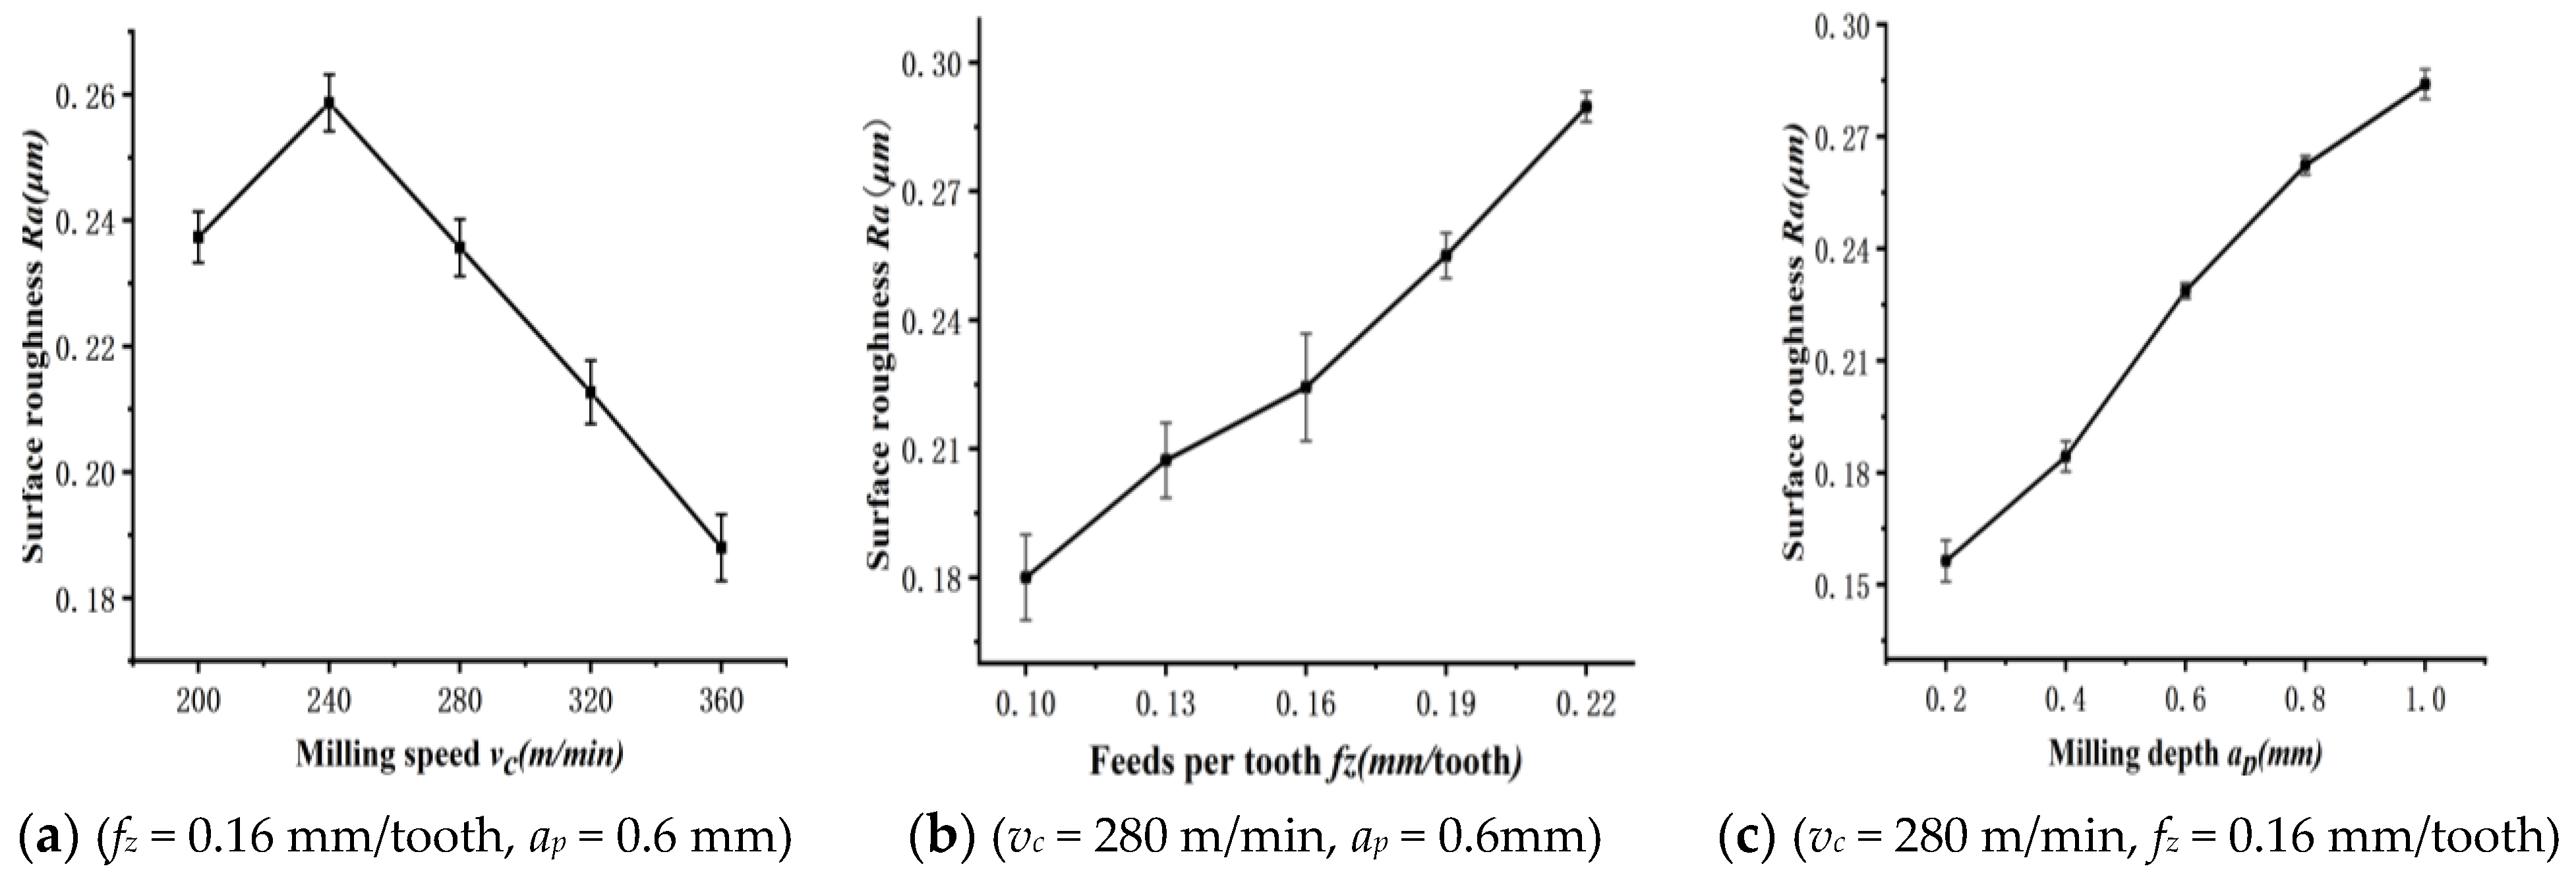
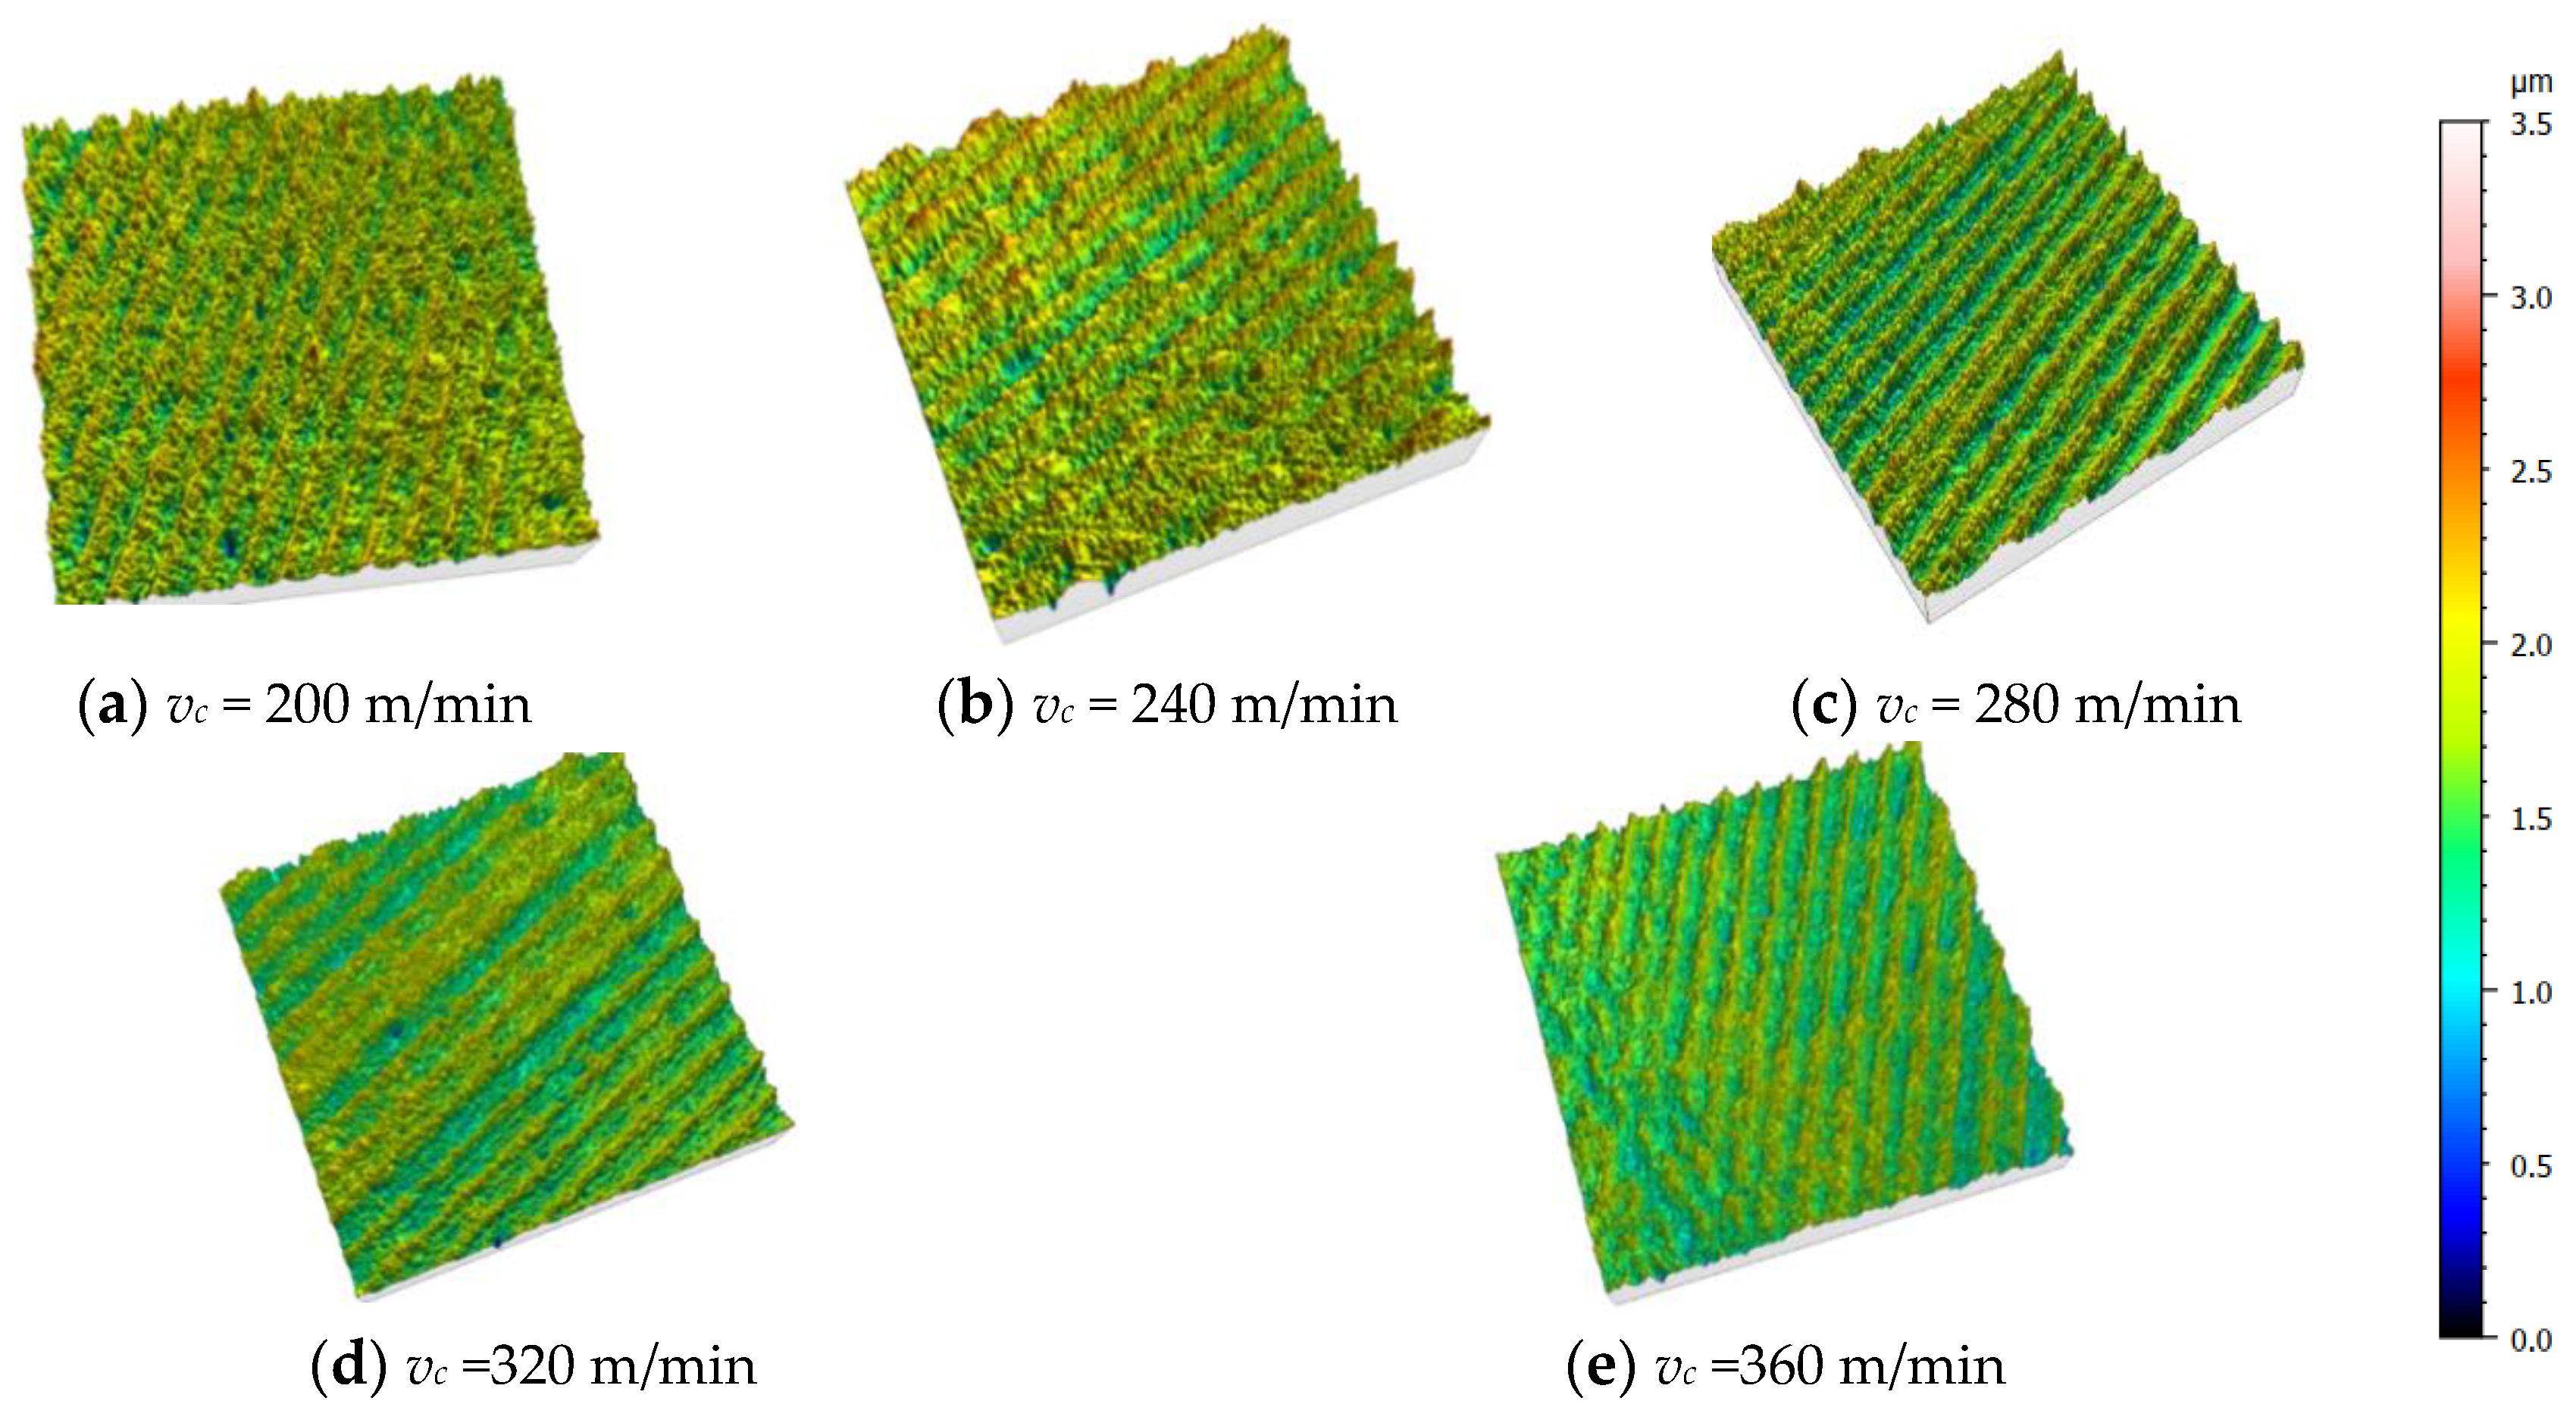
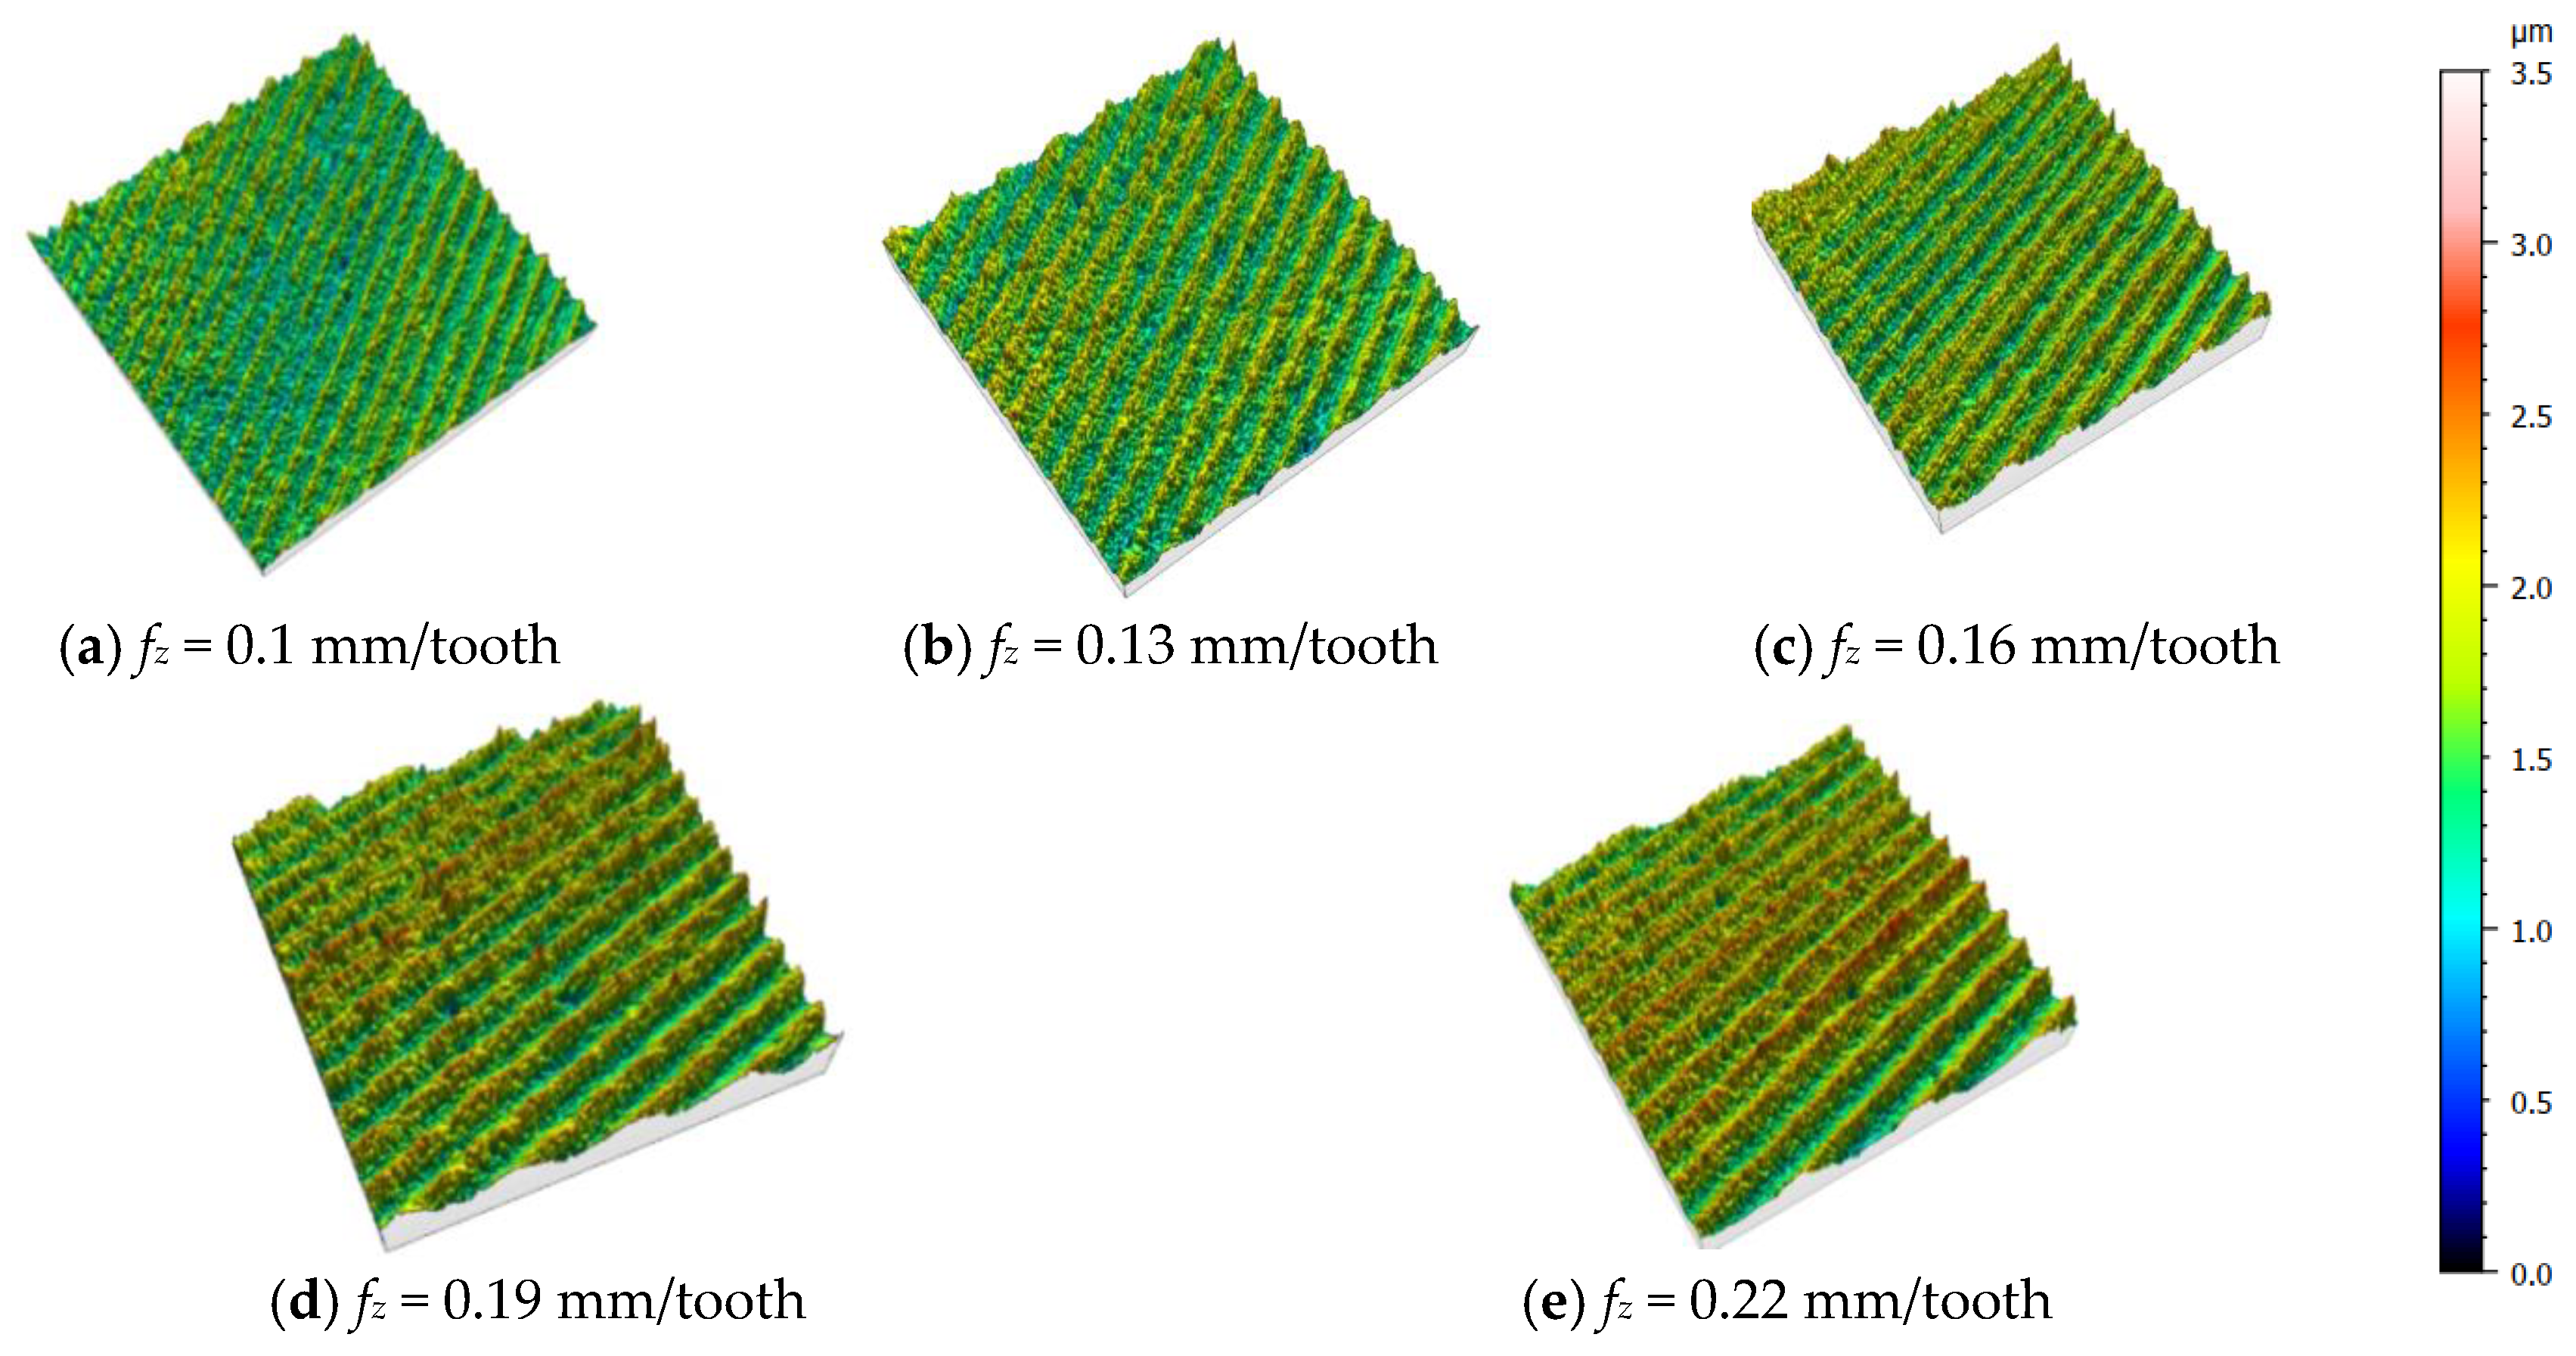
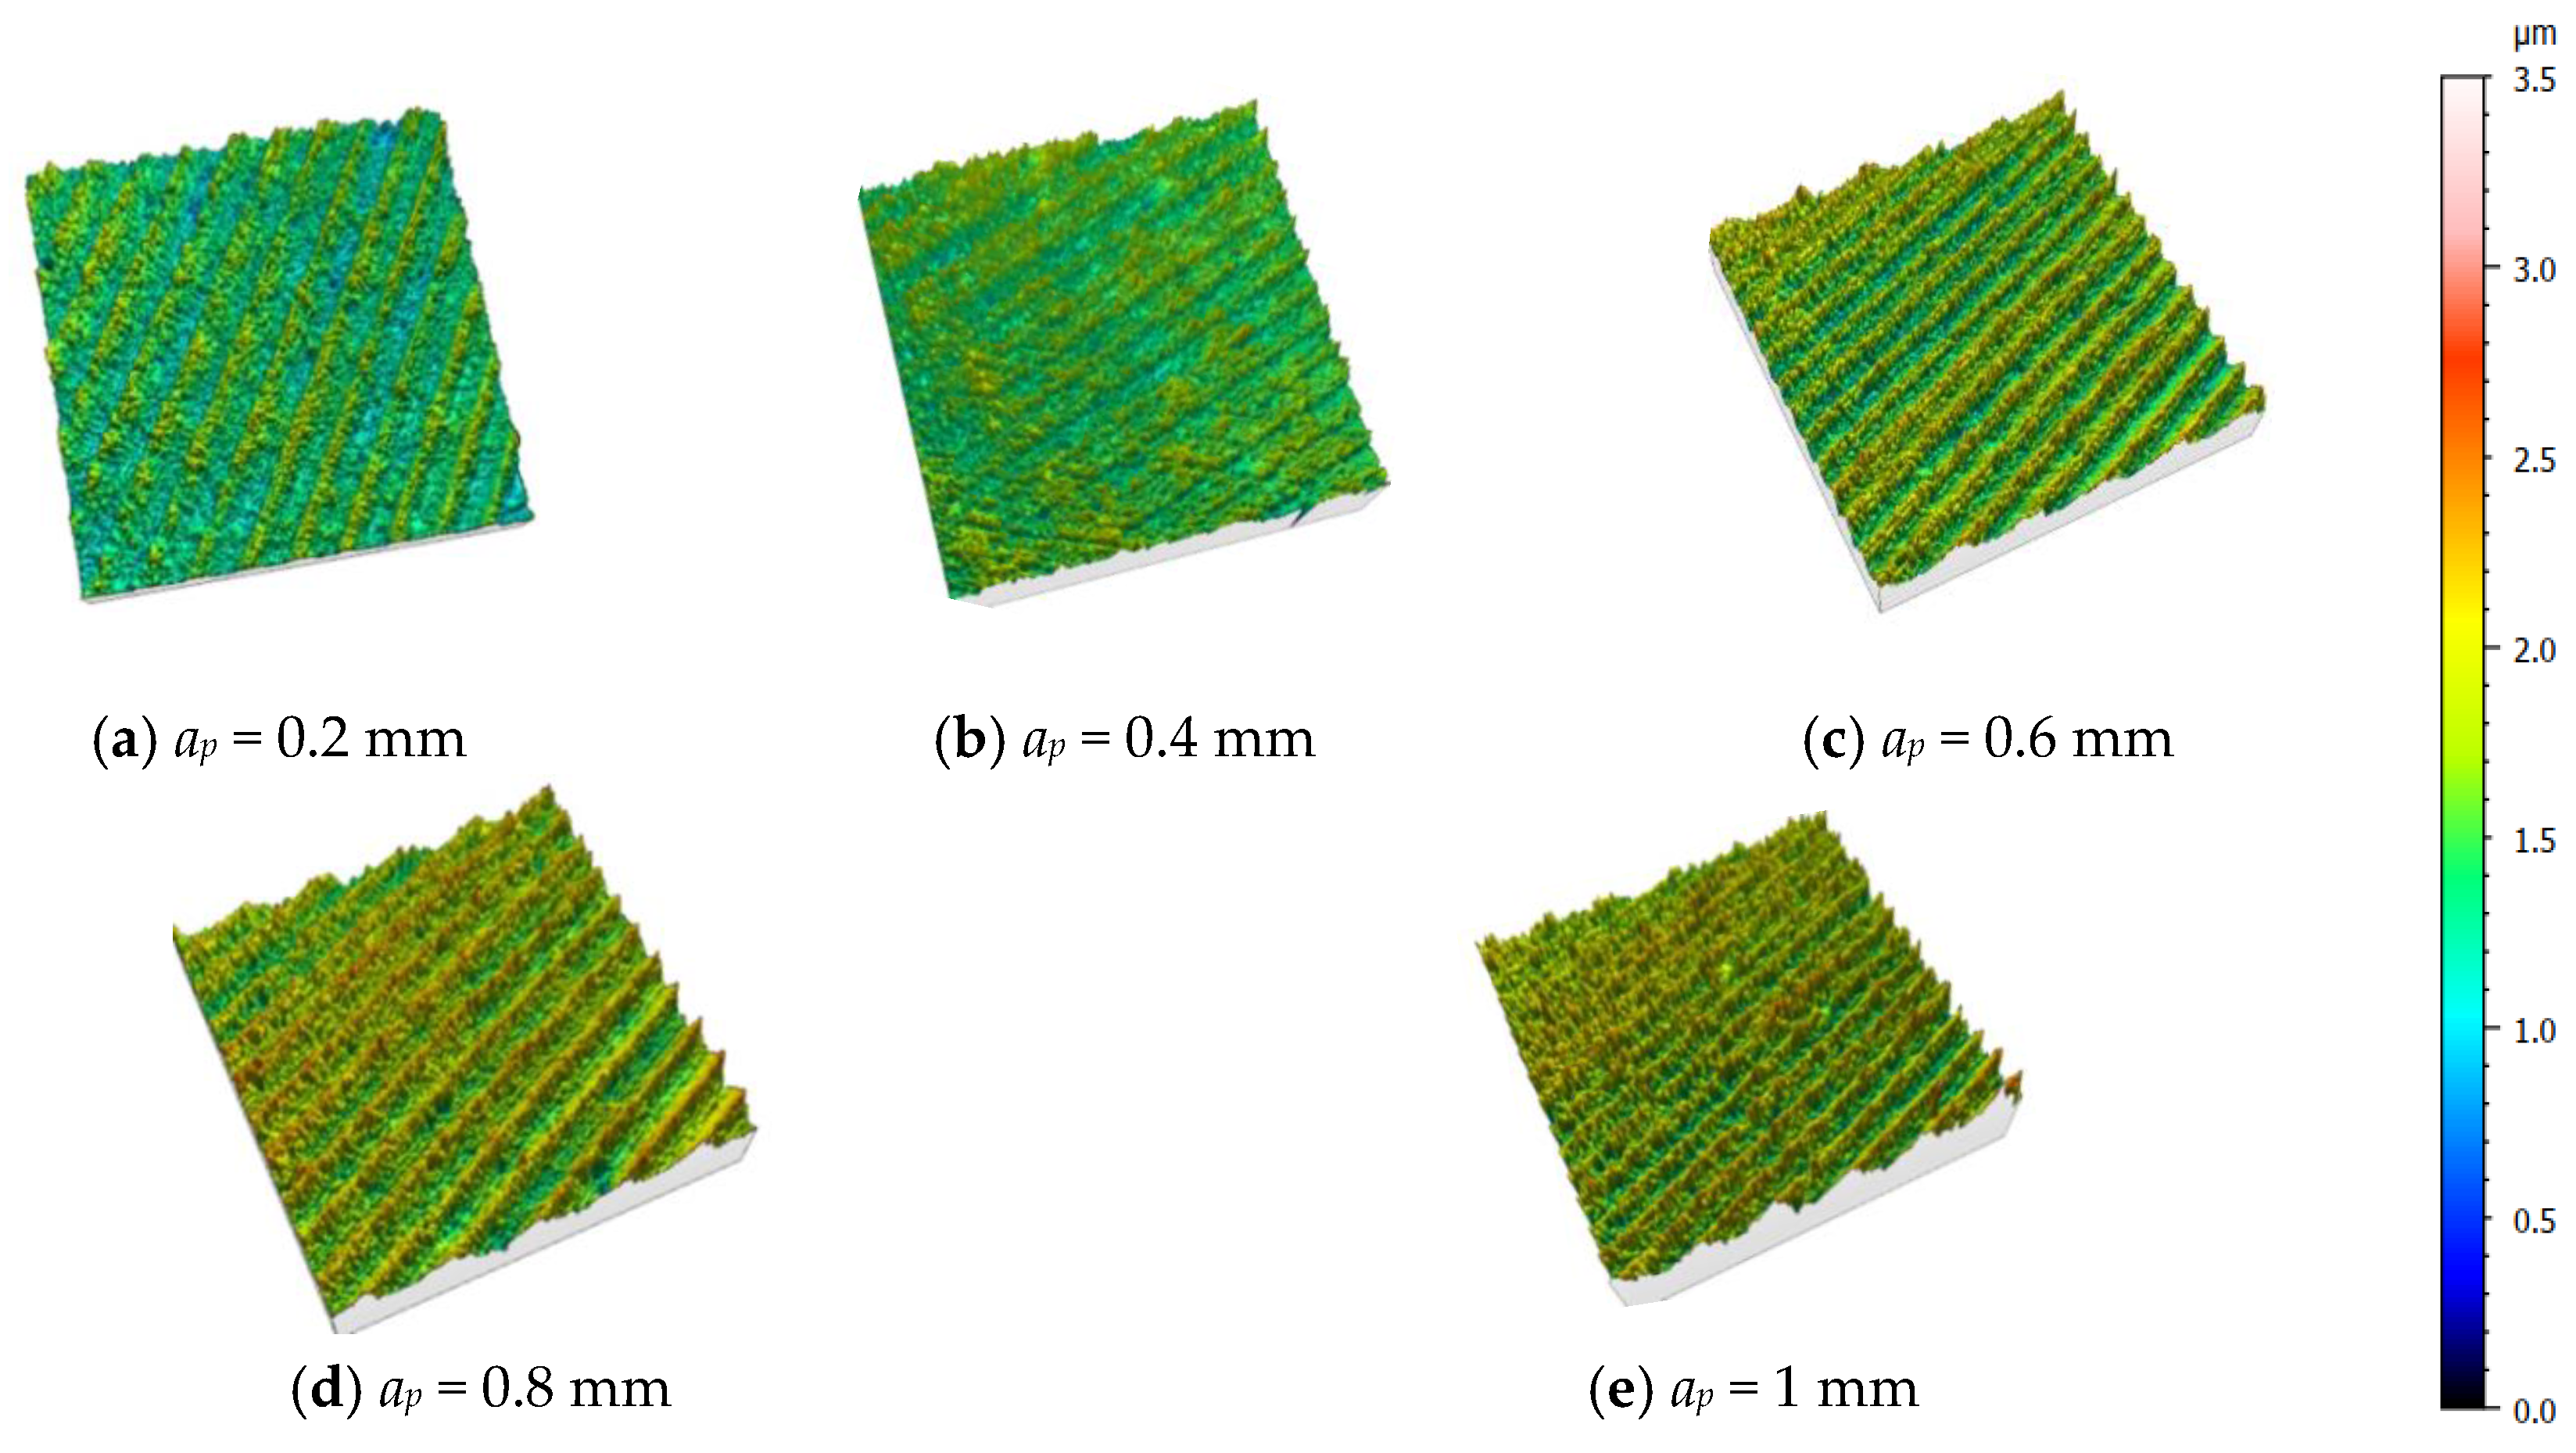
3.1. Effects of Milling Speed, Feed Rate, and Milling Depth on Surface Roughness and Surface Morphology

Figure 2 shows a graph of surface roughness variation with milling speed vc, feed rate fz, and milling depth ap. Figure 2a and Figure 3 show the surface roughness and microscopic morphology of the specimen after milling with cryogenic liquid nitrogen-assisted cooling when the milling speed vc was varied from 200 to 360 m/min. From the results, it can be seen that when the vc increases in the range of 200~240 m/min, the peak–valley spacing on the surface of the machined specimen tends to be obvious, and the height difference between the peaks and valleys in some areas becomes extremely large. Additionally, micro-cracks, or even a cracking phenomenon, occur on the surface of the workpiece; this is due to the increase in milling speed and the increase in the number of broken and fractured SiC particles, prompting an increase in milling force, which makes the plastic aluminum matrix flow and causes the peak–valley spacing to increase. In addition, when the milling speed is low, the machining tool is prone to generating irregularly shaped chyloma, resulting in higher surface roughness values. When the milling speed vc is increased from 240 m/min to 360 m/min, the surface roughness shows a decreasing trend and the surface peak–valley spacing tends to level off. This is mainly due to the increased milling speed, through which the strain hardening of the plastic aluminum matrix reduces its mobility, cutting off the main form of removal of surface particles, while the reduced mobility of the aluminum matrix has an inhibitory effect on the expansion of cracks.
Figure 2b and Figure 4 show the surface roughness variation curves and microscopic morphology of the specimen after milling with cryogenic liquid nitrogen-assisted cooling when the feed rate fz was varied from 0.1 to 0.22 mm/tooth. As shown in the results, when the feed amount fz = 0.1 mm/tooth, the surface is relatively smooth and the roughness is low, which is due to the narrow overlapping trajectory when the two adjacent blades are crossed, so that the residual height is small. Yanling Tang [23] also found a similar phenomenon. When the feed amount fz = 0.22 mm/tooth, the surface peak–valley spacing increases, and the surface roughness also becomes higher. This is due to the fact that the overlapping trajectory distance between the two cutting edges becomes larger, which makes the residual height gradually increase. At the same time, as the feed rate increases, the disc milling cutter undergoes serious contact friction with more particles in a single feed rate, especially when the dislodged and broken particles are difficult to exclude between the cutter and the work; this will cause boundary wear on the tool, and then, cause the defect of a “serrated tip” on the machined workpiece, as shown in Figure 4d,e.
Figure 2c and Figure 5 show the surface roughness and micromorphology of the specimen after milling with cryogenic liquid nitrogen-assisted cooling when the milling depth ap was varied from 0.2 to 1 mm. As seen in the results, when the milling depth increases in the range of 0.2~0.6 mm, the surface roughness value increases sharply, while the surface roughness value increases relative to the slowdown when the milling depth is greater than 0.6 mm. It can be seen that when ap increases in the range of 0.2~1 mm, the material removal rate also increases, prompting a rise in resistance between the disc milling cutter and the workpiece and resulting in plastic flow of the aluminum substrate. This makes the number of surface cracks larger or even triggers cracking, leading to an increase in the roughness value and an increase in the surface peak–valley height difference. In addition, when the ap increases in the range of 0.2 to 1 mm, the contact area between the tool and the particles is raised, leading to a large number of dislodged SiC particles and the occurrence of contact friction between the sub-rear tool surface and prompting an increase in their boundary wear. This eventually leads to the appearance of a large area of defects with serrated tips, as shown in Figure 5d,e.

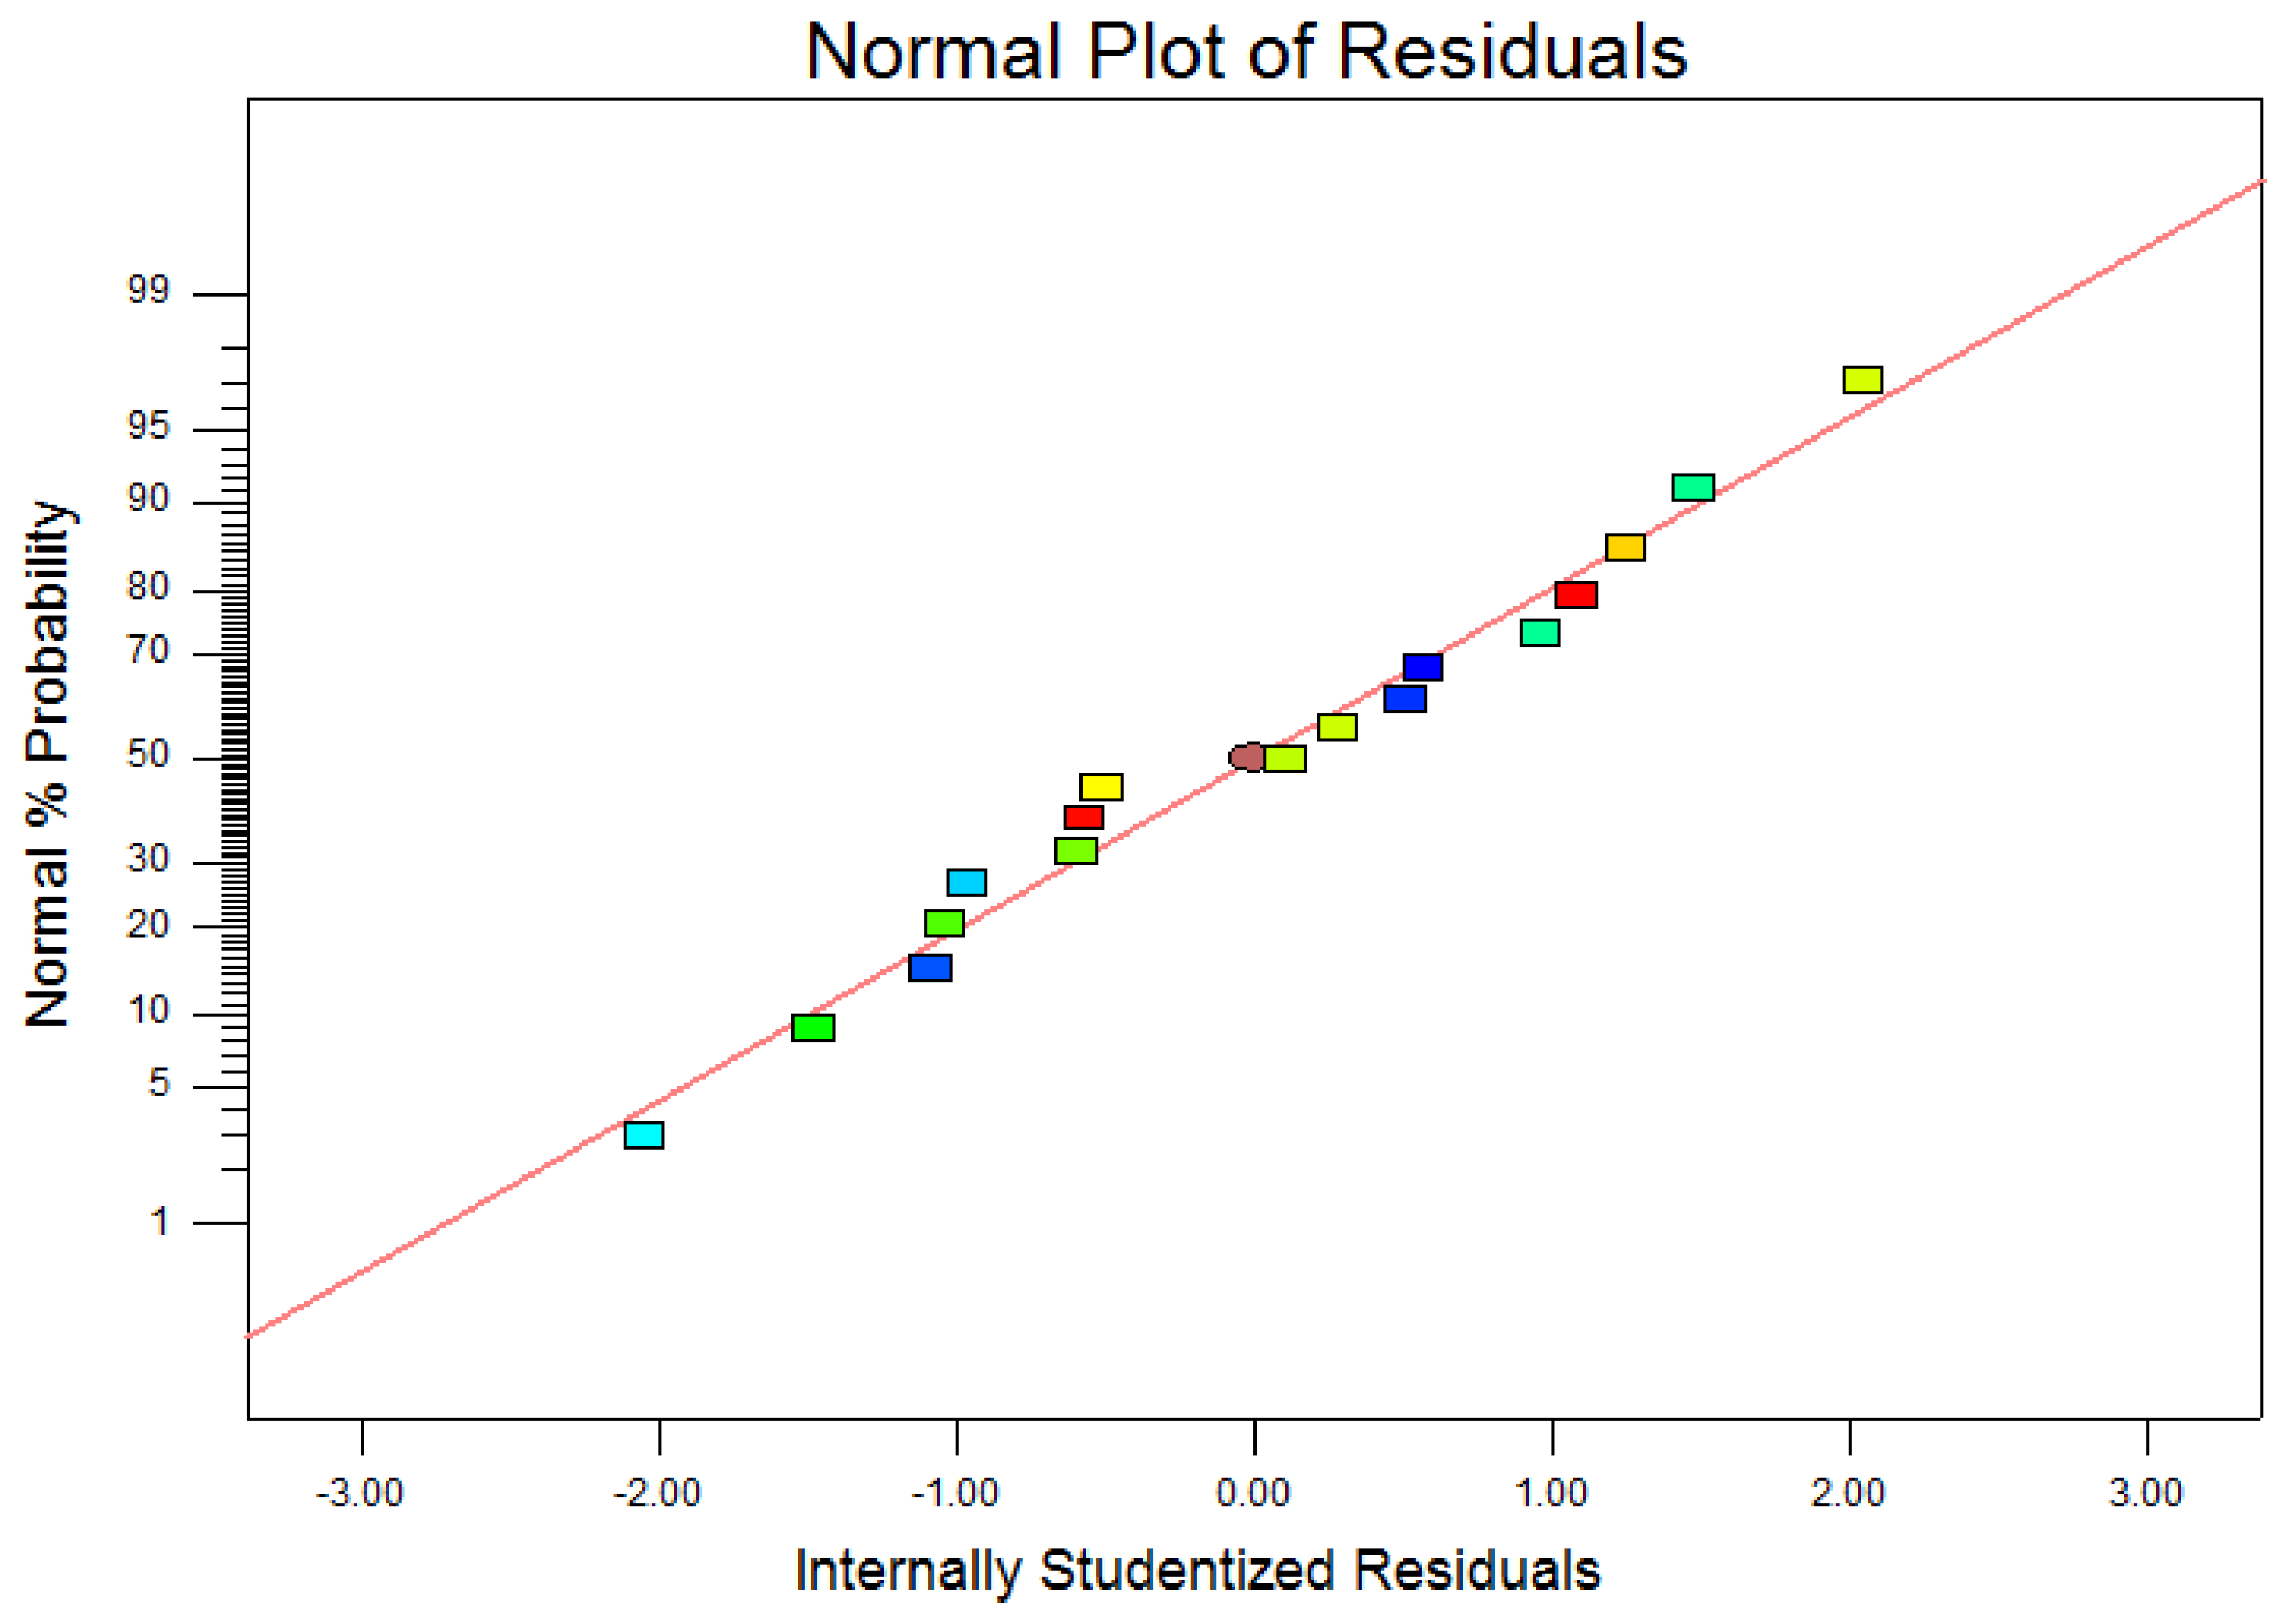
3.2. Construction of Response Surface Method-Based Surface Roughness Prediction Model

In this test, the milling speed, feed and milling depth were used as independent variables, and the Box–Behnken test was designed using the Design Expert software; the levels of the milling parameters selected and their factor codes are shown in Table 3. The test results are shown in Table 4.
The formula for predicting surface roughness fitted by the Design Expert software is as follows:
Ra = 0.64598 + 0.00186 v c + 5.55667 f z + 0.24052 a p 0.00433 v c f z + 0.00033 v c a p + 2.16667 f z a p 0.000003 v c 2 13.08333 f z 2 0.47563 a p 2
The Design Expert software obtained a model F value of 45.33, indicating that this equation is significant, indicating that the experimental design is reliable. The model correlation coefficient R2 is 0.9832, R2-adj is 0.9615, and R2-predicted is 0.8219. The model can explain the surface roughness values obtained by 98.31% of the experiments. It was tested using a normal distribution plot of the residuals, as shown in Figure 6. It can be observed from the picture that the residuals are roughly distributed along the diagonal line, the residuals of some data points tend to be close to zero, and the overall distribution is normal, so the mathematical model established has a high degree of fit.
The degree of influence of the milling parameters and their interaction on surface roughness was obtained using the Design Expert software, and the specific order of influence of each factor, from largest to smallest, is:
(1)
Single-factor effect: fz, ap, vc;
(2)
Interaction: fzap interaction, vcfz interaction, vcap interaction;
(3)
Secondary effects: ap2, fz2, vc2.

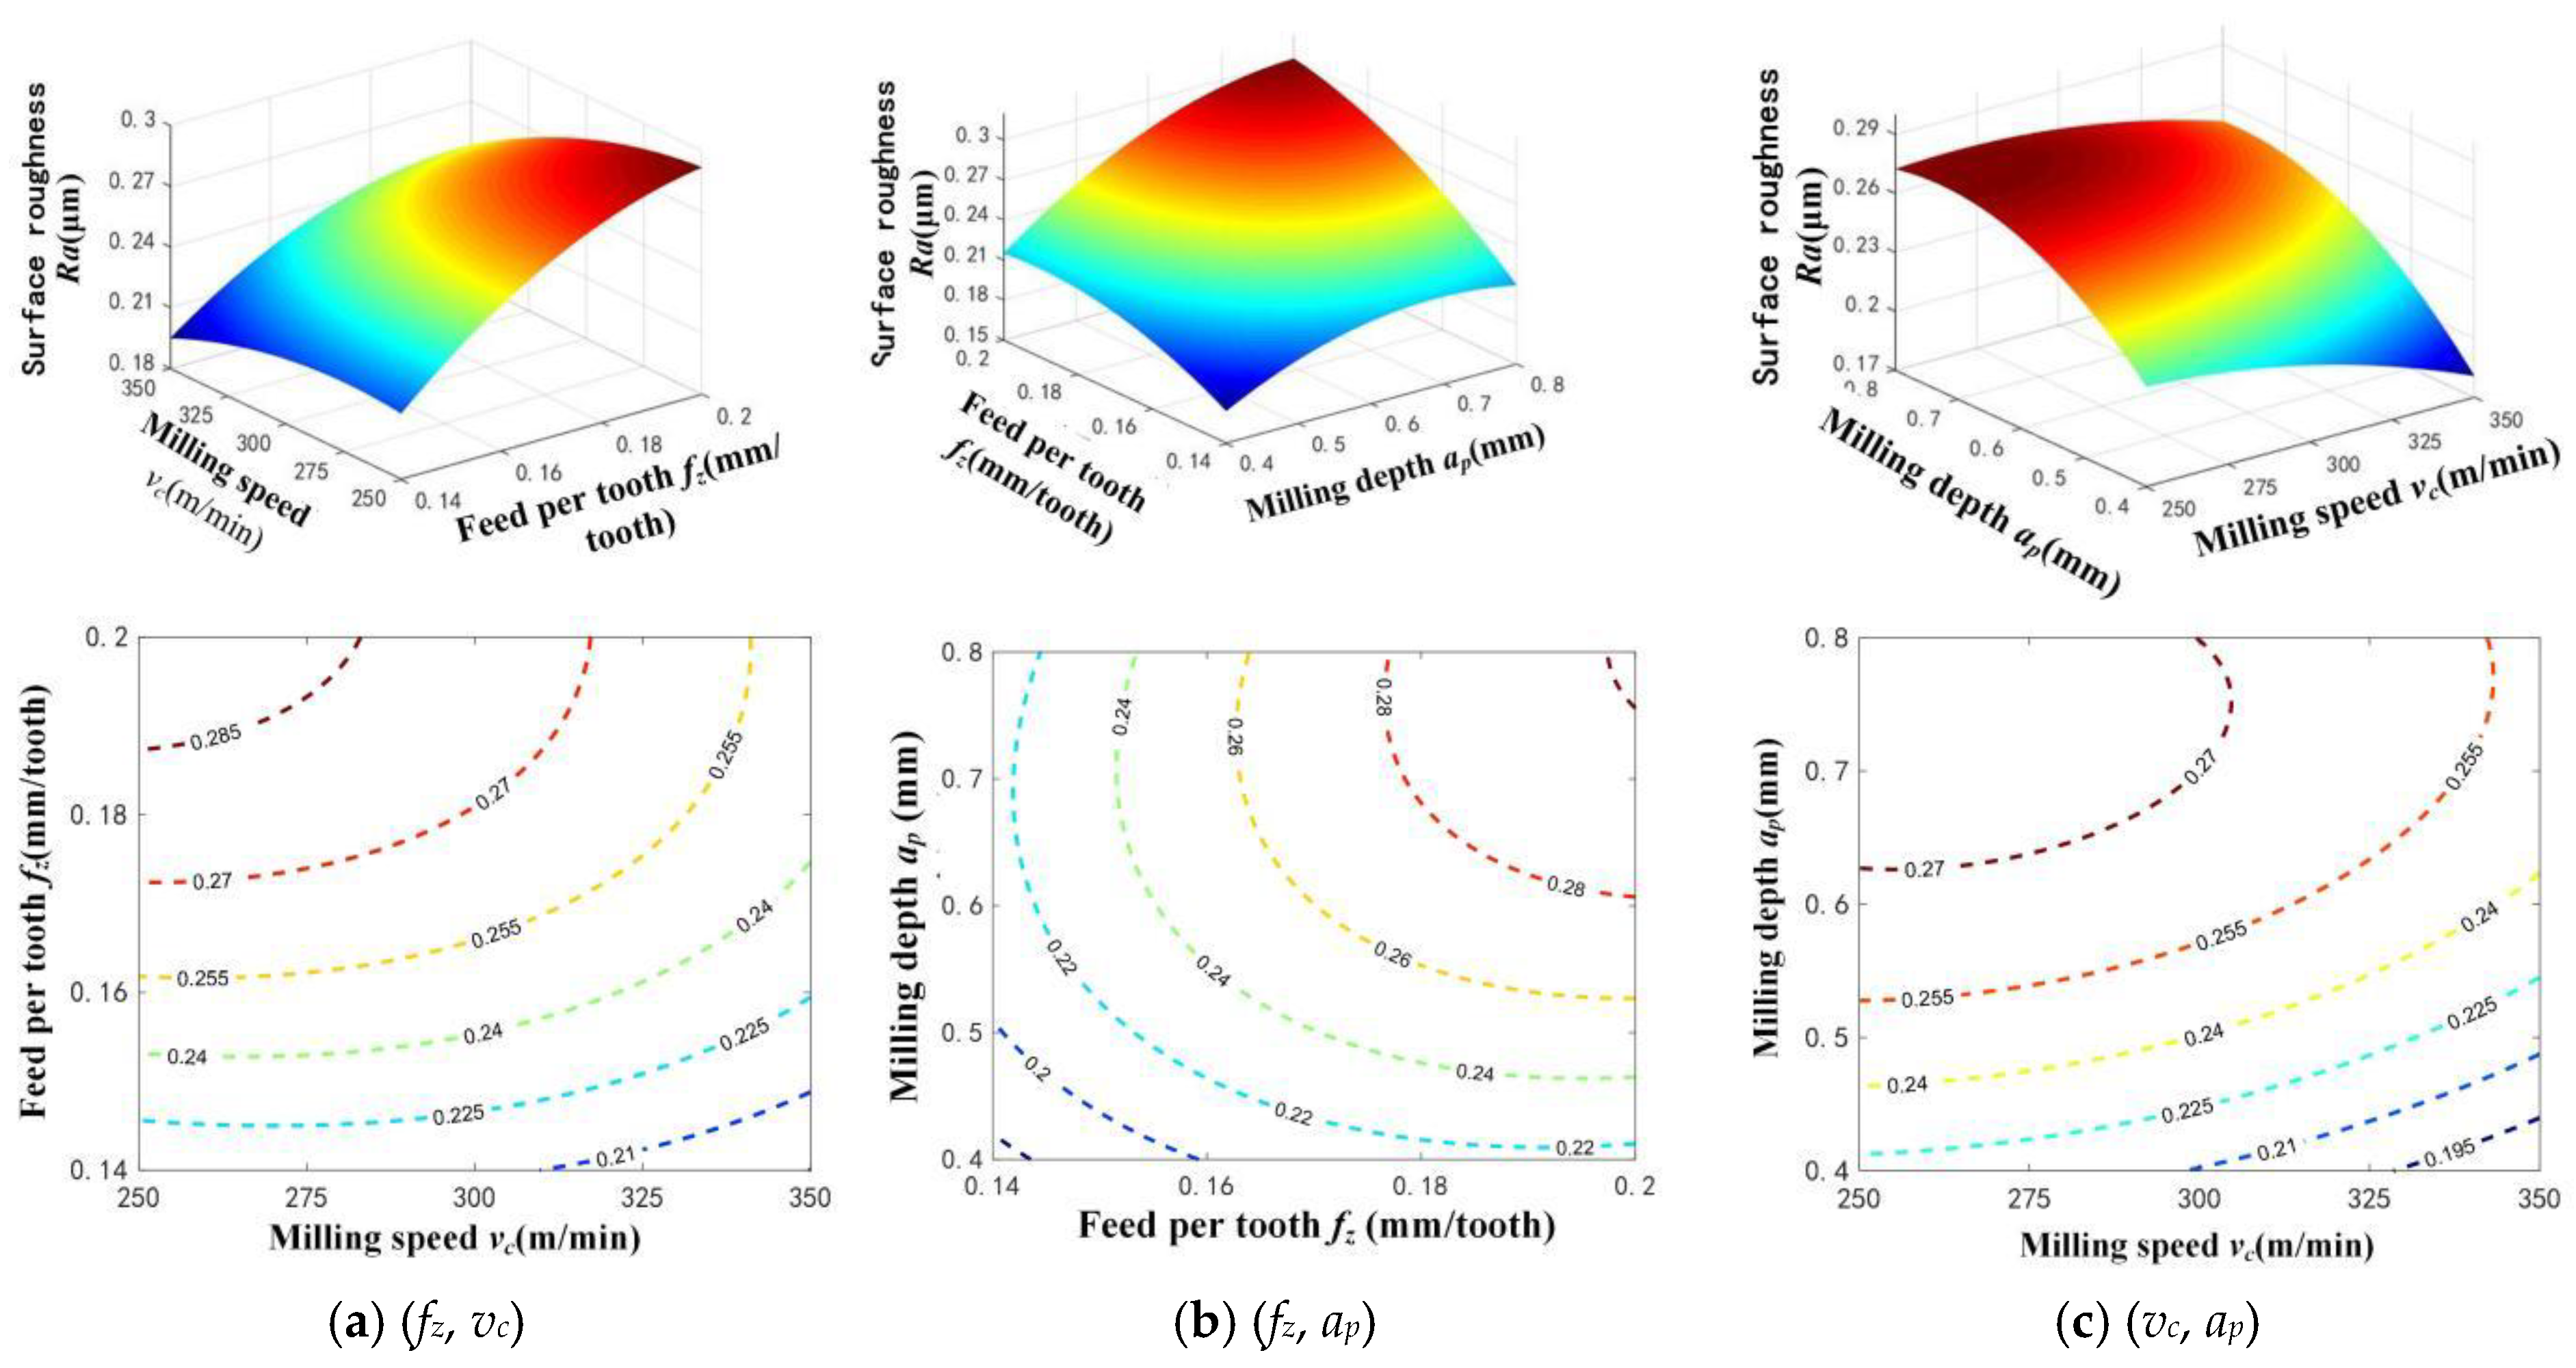
3.3. Effect of the Interaction of Feed Rate, Milling Speed, and Milling Depth on Surface Roughness

3.3.1. Effect of Feed Rate fz and Milling Speed vc on Surface Roughness

From the response surface plot in Figure 7a, when vc = 250 m/min, the number of contours of the surface roughness value is 5; when vc = 350 m/min, the number of contours is 3, which is relatively sparse. Since the density of the contour line when a certain factor changes indicates the rate of change of surface roughness with this factor, when the milling speed increases from 250 m/min to 350 m/min, the degree of surface roughness affected by the milling speed decreases significantly. If finishing is the goal, the preferred value areas are “higher milling speed vc” and “lower feed per tooth fz”.

3.3.2. Effect of Feed Rate fz and Milling Depth ap on Surface Roughness

From Figure 7b, it can be seen that when the feed per tooth increases from 0.14 mm/z to 0.2 mm/z, the rate of change of the surface roughness value with feed increases abruptly, and when the milling depth increases from 0.4 mm to 0.8 mm, the rate of change of the surface roughness value with milling depth also shows an increasing trend. If finishing is the goal, the optimal value areas for both are “small feed per tooth fz” and “low milling depth ap”.

3.3.3. Effect of Milling Speed vc and Milling Depth ap on Surface Roughness

From the response surface plot in Figure 7c, it can be observed that the density of contours varies less at different levels of ap or vc, which means that even though the milling depth parameter level is constantly changing, the surface roughness value changes very little with vc, and similarly, when the milling speed parameter level is constantly changing, the surface roughness has a similar rate of change. If finishing is the goal, the preferred values are “higher milling speed vc” and “lower milling depth ap”.

4. Analysis of Surface Microhardness

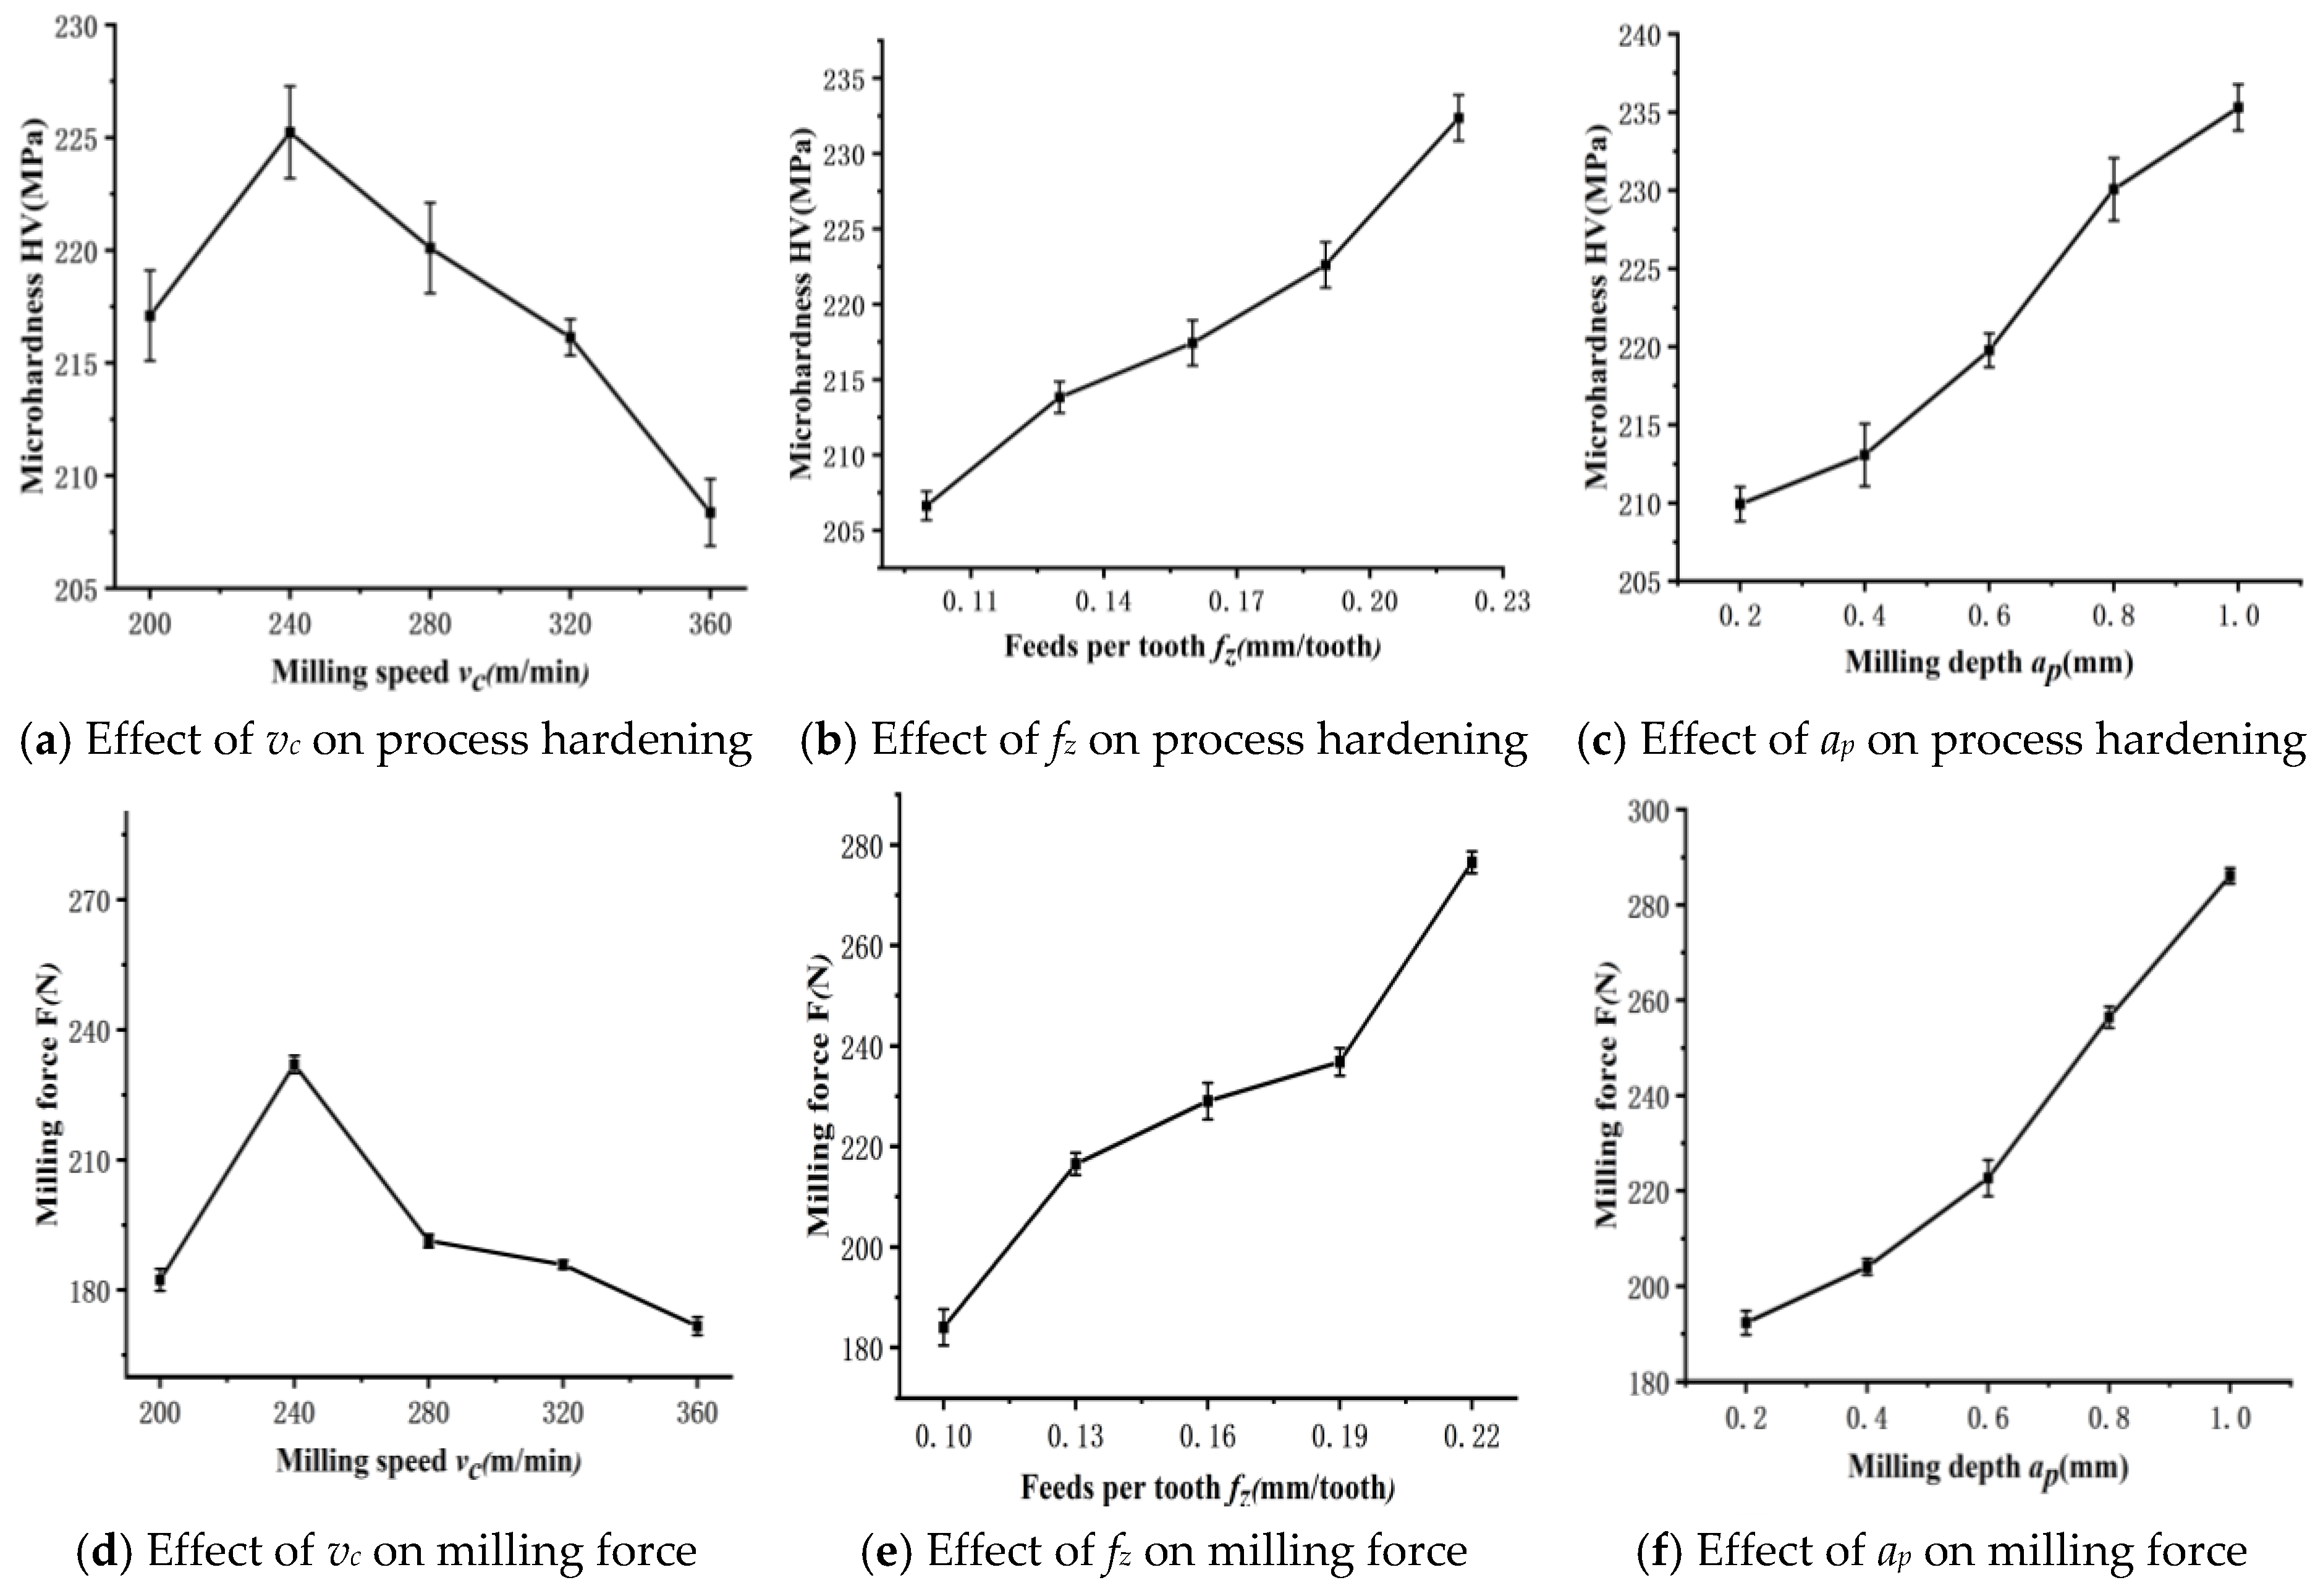
4.1. Effects of Milling Speed, Feed Rate, and Milling Depth on Surface Microhardness

Figure 8 shows graphs of the changes in surface microhardness and milling force with milling speed vc, feed rate fz,, and milling depth ap.

4.1.1. Effect of Milling Speed vc on Surface Microhardness

As shown in Figure 8a,d, according to the results, the milling speed vc increases in the range of 200~240 m/min. Due to the low milling speed in this range, the increase in speed makes the milling force rise, resulting in the dominance of plastic deformation of the material, while the weakening effect caused by the rise in temperature does not play a full role, ultimately leading to an increase in microhardness. When the milling speed increases in the range of 240~360 m/min, the surface microhardness gradually decreases. Due to the high milling speed, the disc milling cutter passes through the workpiece surface at high speed, plastic deformation of the material occurs in a very short time, and thus, the degree of plastic deformation is small. In addition, the sharp increase in milling temperature accompanied by the increase in milling speed has a significant weakening effect on the surface microhardness of the machined specimen.

4.1.2. Effect of Feed Rate fz on Surface Microhardness

As shown in Figure 8b,e, according to the results, it can be observed that the surface microhardness values of the specimen show an increasing trend with the increase in the feed rate amount, and the feed rate amount is increased from fz = 0.1 mm/tooth to fz = 0.22 mm/tooth. This is because the milling force shows a linear increasing trend with the increase in feed rate, and the large milling force causes the specimen to undergo serious plastic deformation, so the degree of surface microhardness of the specimen also becomes more and more serious.

4.1.3. Effect of Milling Depth ap on Surface Microhardness

As shown in Figure 8c,f, according to the results, it can be observed that the effect of milling depth ap on the degree of surface microhardness is also more significant. When the milling depth ap increases from 0.2 mm to 1 mm, the removal rate of the material increases significantly, leading to an increase in milling force during machining and serious plastic deformation of the material, so the surface microhardness value also becomes larger and larger.

5. Analysis of Surface Residual Stresses

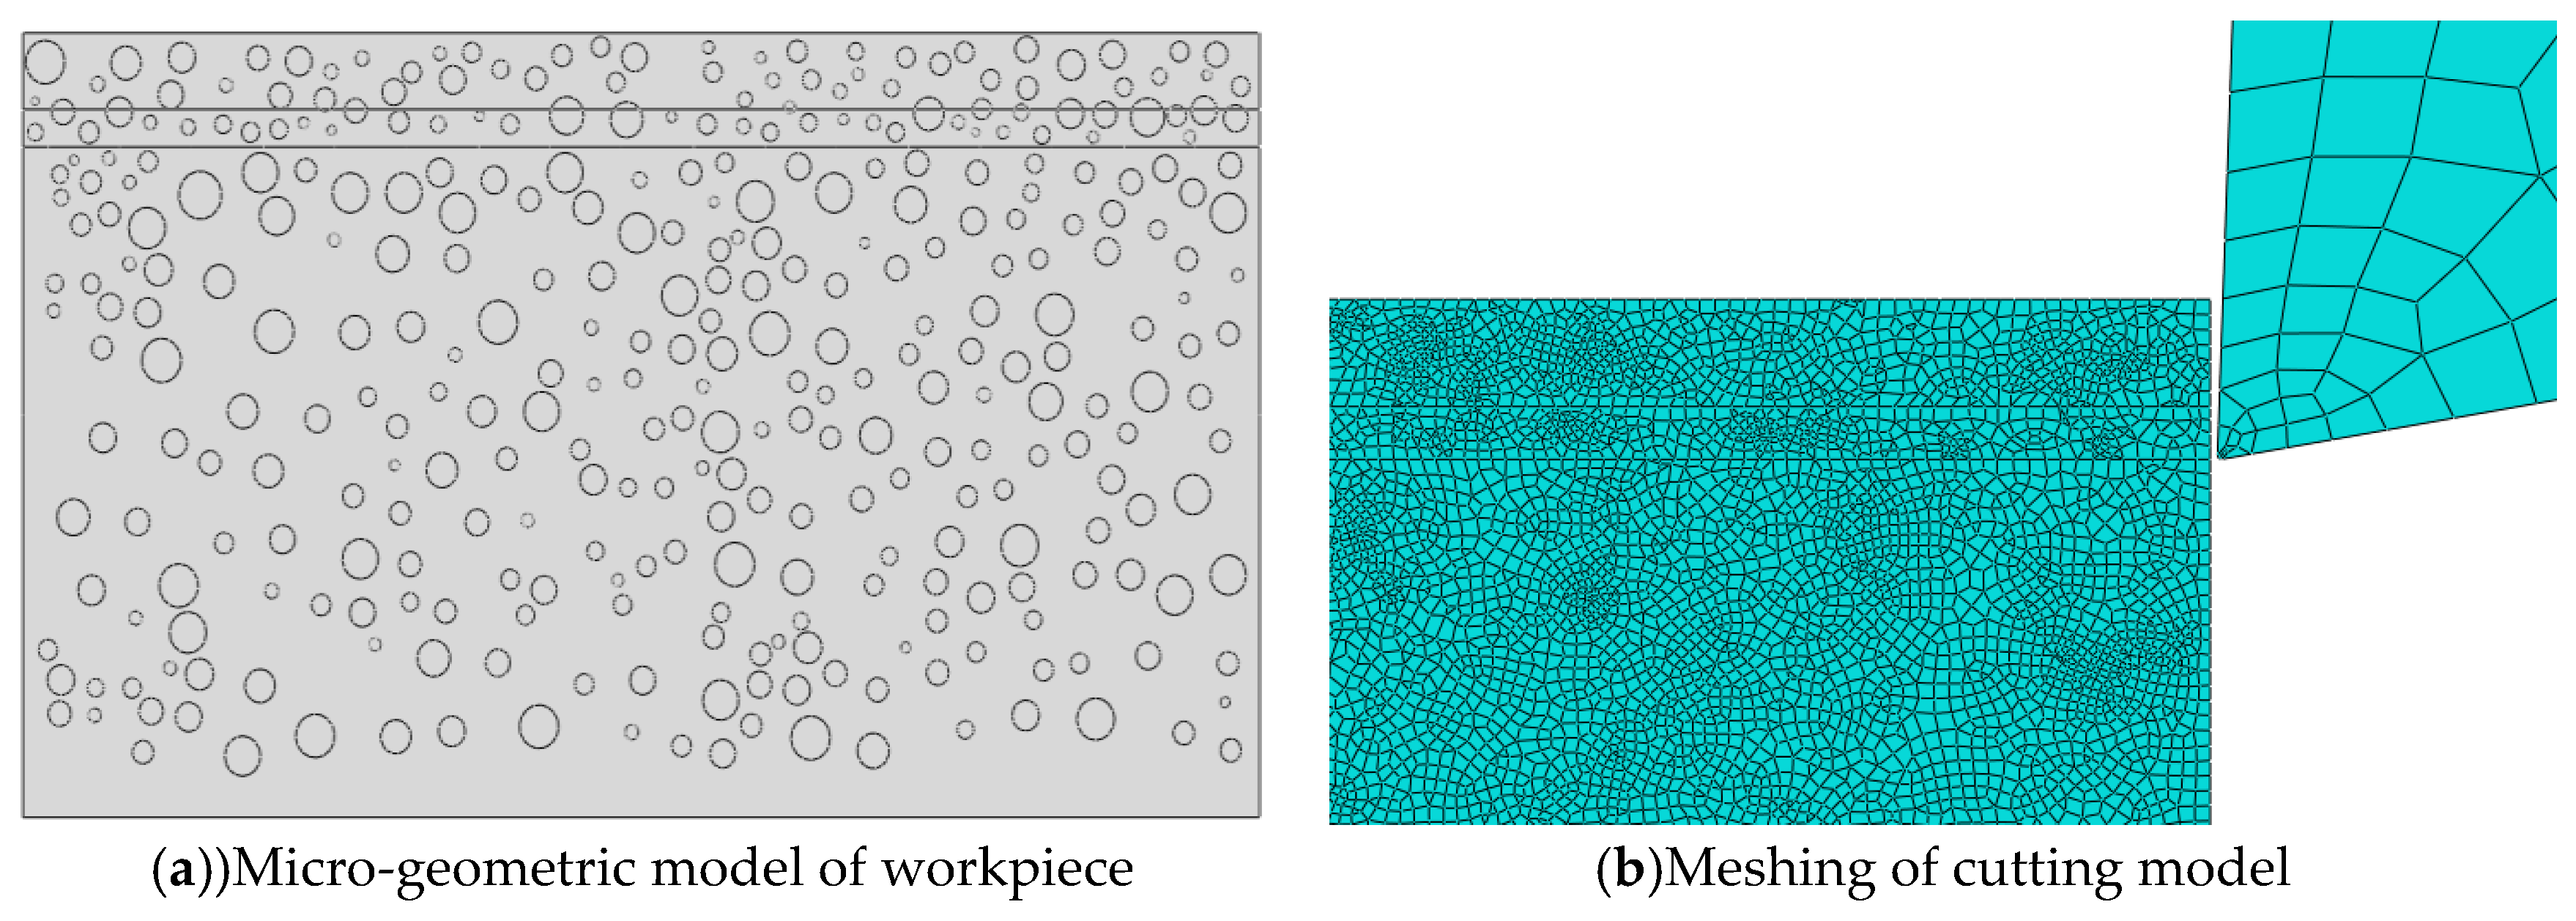
5.1. Building of a Residual Stress model Based on Finite Element Simulation

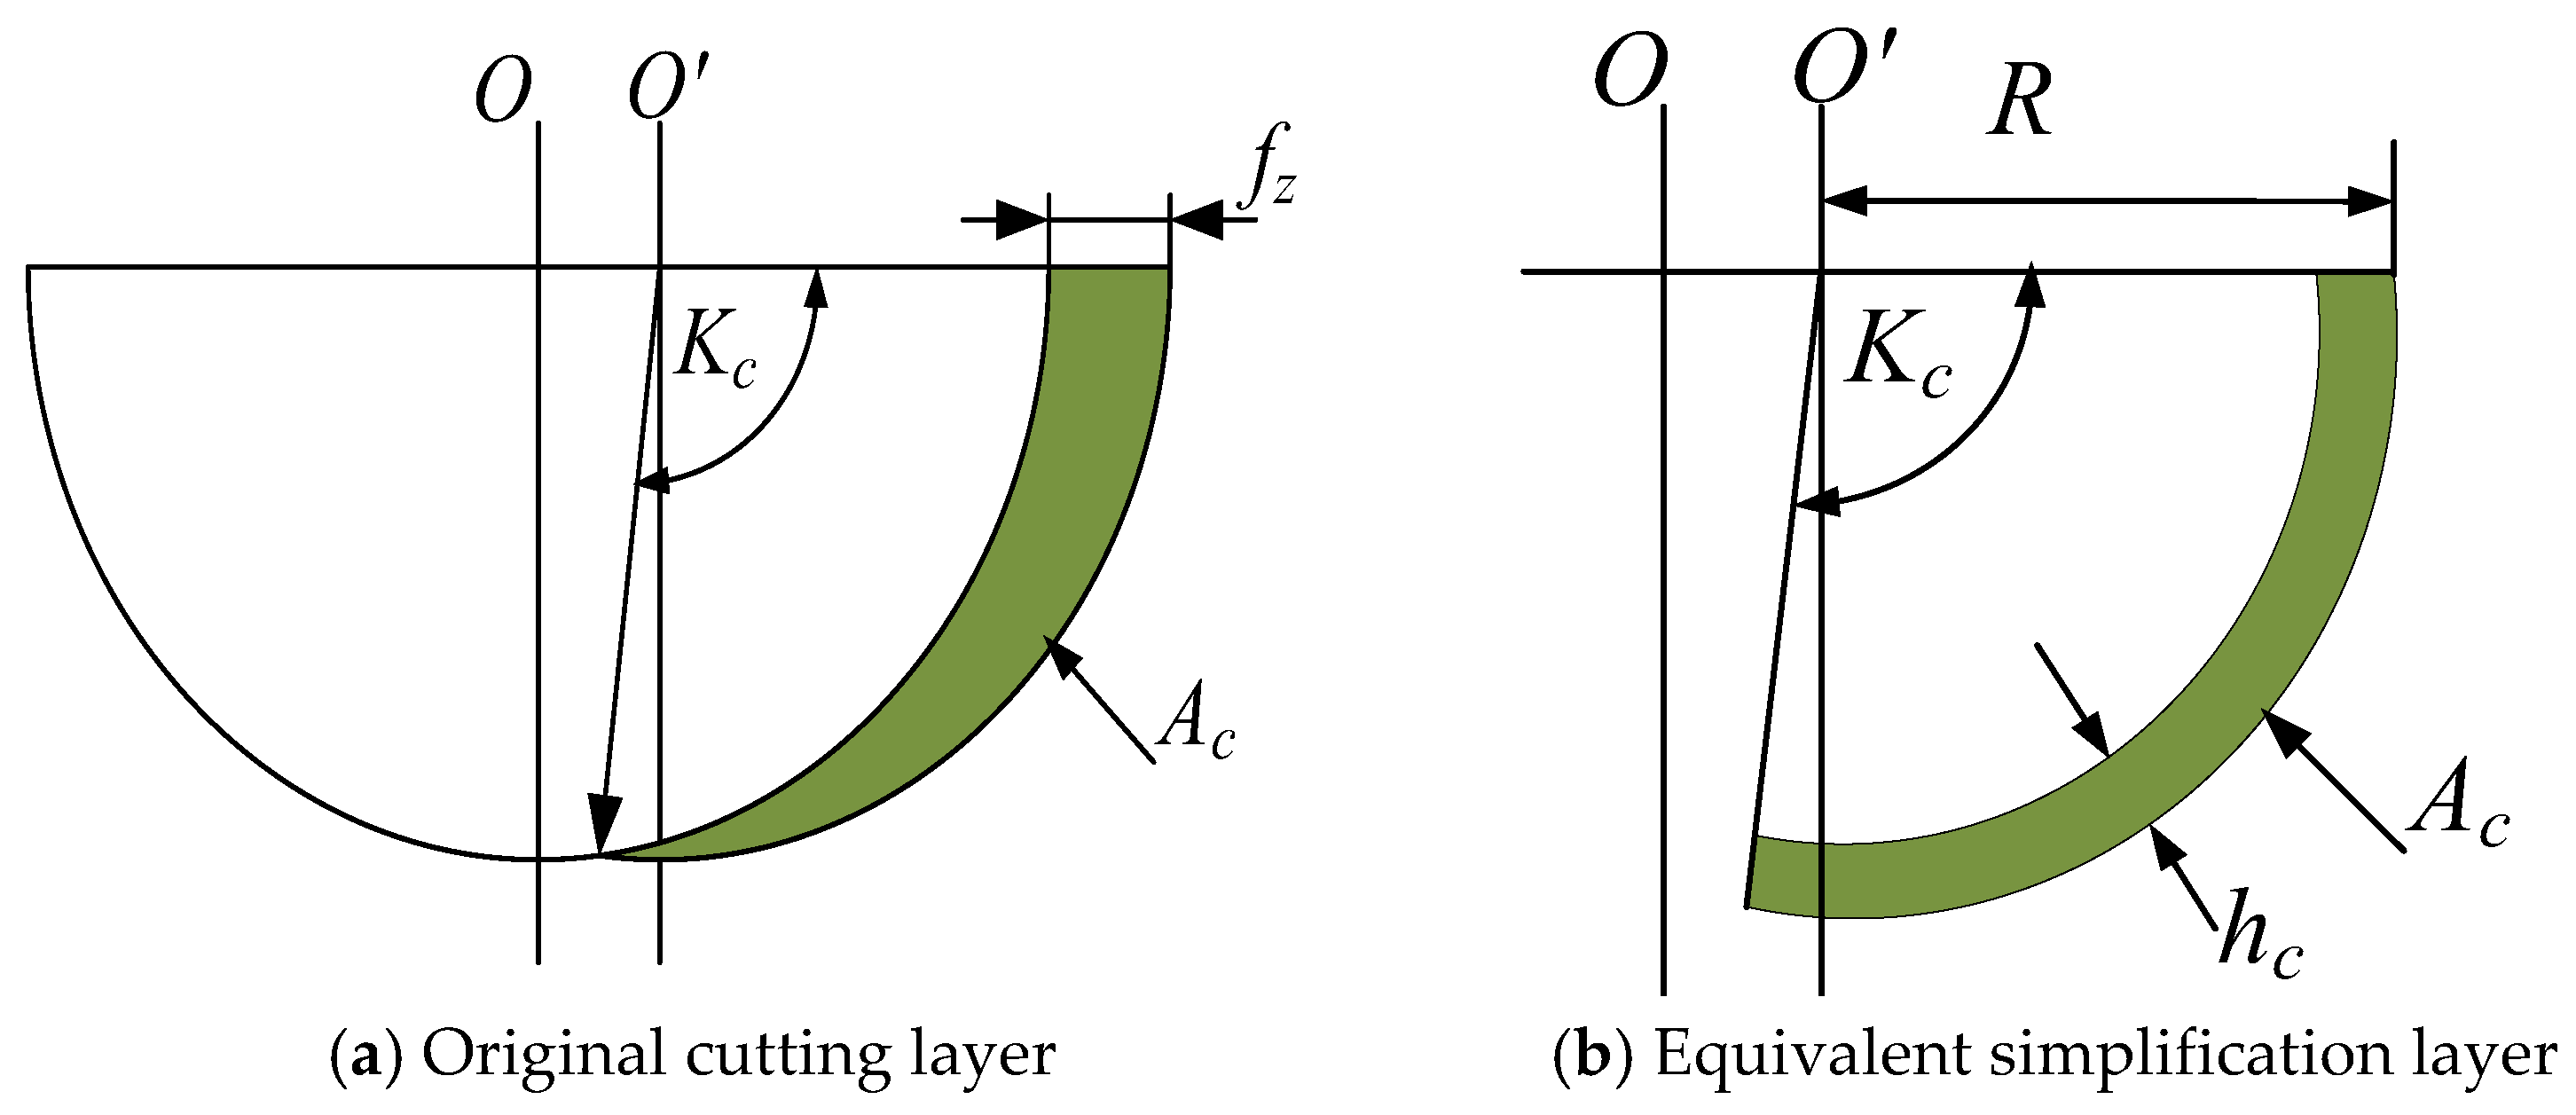
5.1.1. Equal Cutting Thickness Model

In this end cutting process, because the thickness of the cutting layer is much smaller than the cutting width (less than five times), the plastic deformation of the material in the direction perpendicular to the cutting edge can be regarded as a plane of plastic flow, so the end milling process with variable cutting thickness can be simplified, as shown in Figure 9. In this paper, the end milling process is simplified to a right-angle cutting process with equal cutting thickness, which not only ensures simulation accuracy, but also avoids the phenomenon whereby the results caused by meshing cannot converge and the residual stress is difficult to extract during 3D modeling. The following equation is the formula for calculating the equivalent chip thickness for continuous milling; r is the radius of the milling cutter, and fz is the feed per tooth.
h c = R R { cos 1 ( f s 2 R ) sin [ 2 cos 1 ( f s 2 R ) ] π cos 1 ( f s 2 R ) } 1 2

5.1.2. Equal Cutting Thickness Model

In this paper, a microscopic two-phase model is established and Abaqus software is used to model the particles and substrates separately. The enhanced phase particles are simplified to spherical particles, and in order to reduce the discrete distribution effect of the particles, a Python language is written to achieve random distribution of the SiC particles, as shown in Figure 10a. The CPE4RT grid cell type is used for meshing tools and workpieces, and hourglass control is introduced. The stress in the machining process is mainly concentrated at the point of contact between the tool and the workpiece, so the meshing of the chip and of the machining surface part of the simulation model is dense, and the meshing of the part where the material does not participate in cutting is sparse, to improve the simulation efficiency and accuracy (Figure 10b).
Since the Johnson–Cook constitutive equation has good nonlinear problem handling ability and can accurately map the plastic deformation of the aluminum matrix at high temperatures and under high strain, this simulation adopts the constitutive model and its function expression for the aluminum matrix. The parameters are shown in Table 5 [24]. When setting the heat transfer boundary, the heat transfer coefficient is set as hcryo = 50,000 W/(m2K), and the liquid nitrogen temperature is set to −196 °C [25].
σ = [ A + B ε n ] [ 1 + c ln ( ε ε 0 ) ] [ 1 ( T T r T m T r ) ] m
The average size of the reinforced phase SiC particles in this test material is 5 μm, and the material property parameters of SiC particles are shown in Table 6 [26]. The tool adopted is a polycrystalline diamond (PCD) tool. The tool is set to analyze the rigid body, and its front angle and rear angle are consistent with the test tool (2° and 10°, respectively), and the tool material parameters are shown in the following table.
In machining, the workpiece material is continuously destroyed and removed, turned into chips, and separated from the workpiece, so it is necessary to select reasonable chip separation criteria to ensure finite element simulation accuracy. This paper adopts the physical fracture criterion in line with the real cutting situation. Element damage in the J-C model is defined as:
D = Δ ε ¯ p l ε 0 ¯ p l
where D—the stiffness degradation factor; Δ ε ¯ p l —the material strain increment; and ε 0 ¯ p l —the equivalent effect change when the material fails, which can be expressed as:
ε 0 ¯ p l = [ d 1 + d 2 exp ( d 3 σ m σ ¯ ) ] × [ 1 + d 4 ln ( ε ¯ ε ¯ ) ] ( 1 + d 5 T T R T m e l t T R )
σ m σ ¯ is the stress triaxiality d1~d5-material constant, as shown in Table 7

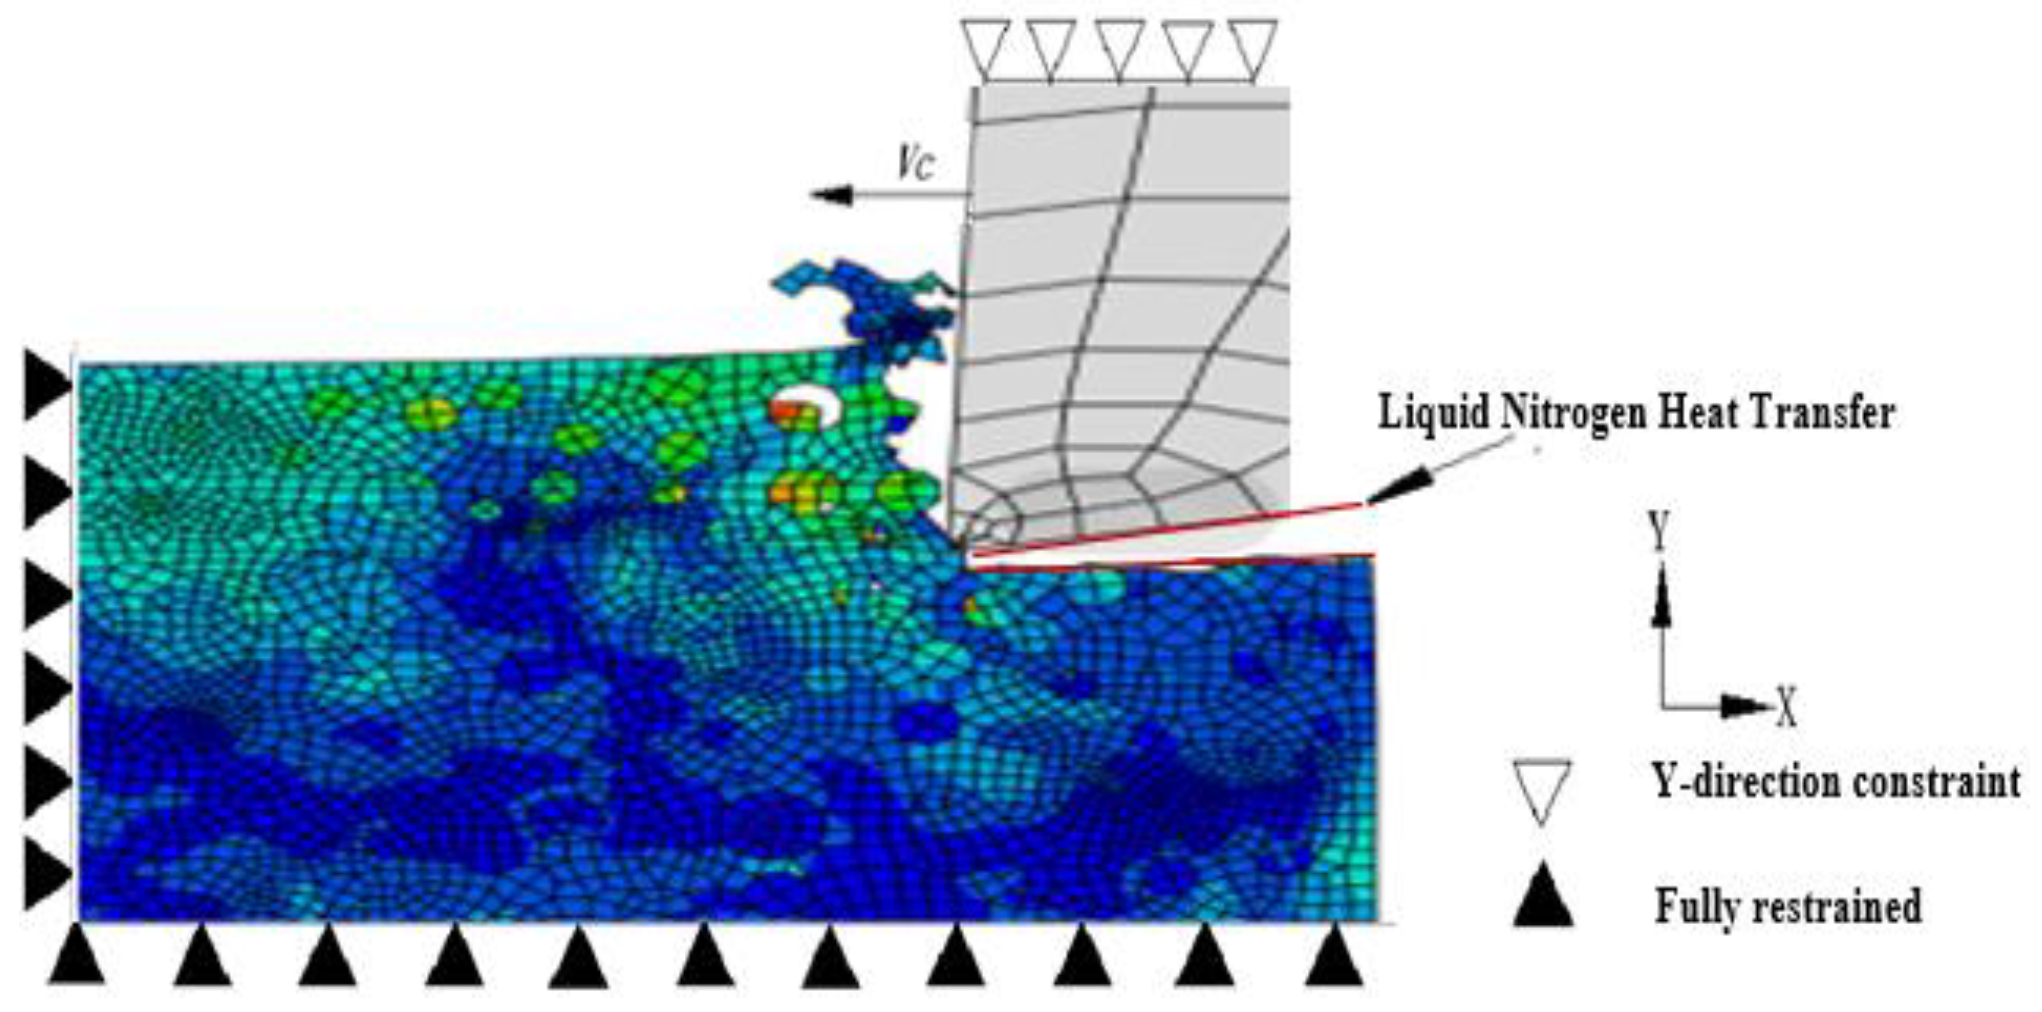
5.1.3. Boundary Conditions and Friction Models

For the boundary conditions, this model aims to fix the workpiece and move the tool to achieve cutting, so the left and bottom edges of the workpiece part are completely fixed (x = y = 0), the tool is constrained (y = 0) in the vertical direction (Y direction), and the horizontal direction has a cutting speed of Vc. For the heat transfer boundary, this test is carried out under low-temperature liquid nitrogen conditions, and the core difference between this method and dry cutting is the low-temperature processing environment. Therefore, when simulating the milling process with the low-temperature auxiliary cooling of liquid nitrogen, the machined surface needs to be set to transfer heat with liquid nitrogen, the thermal boundary coefficient is set as hcryo = 50,000 W/(m2K), and the liquid nitrogen temperature is −196 °C. Under the low-temperature auxiliary cooling of liquid nitrogen, the machined surface gradually comes into contact with the low-temperature medium when milling, so the thermal boundary conditions should be gradually added when setting the machined surface; otherwise, it will cause a certain degree of adverse effects on the stress release process of the surface stress field (This is shown in Figure 11).
The contact friction of the knife–chip contact surface is a key factor that cannot be ignored, and a reasonable friction model needs to be set to ensure the accuracy of the output result. According to actual machining, most SiCp/Al composite chips are agglomerated chips and jagged chips, so this simulation model uses Coulomb’s friction law to define the friction between the tool and the workpiece. As shown below, the Coulomb coefficient of friction μ in this paper is 0.5.
τ f = μ n

5.2. Analysis of Residual Stress Simulation Results

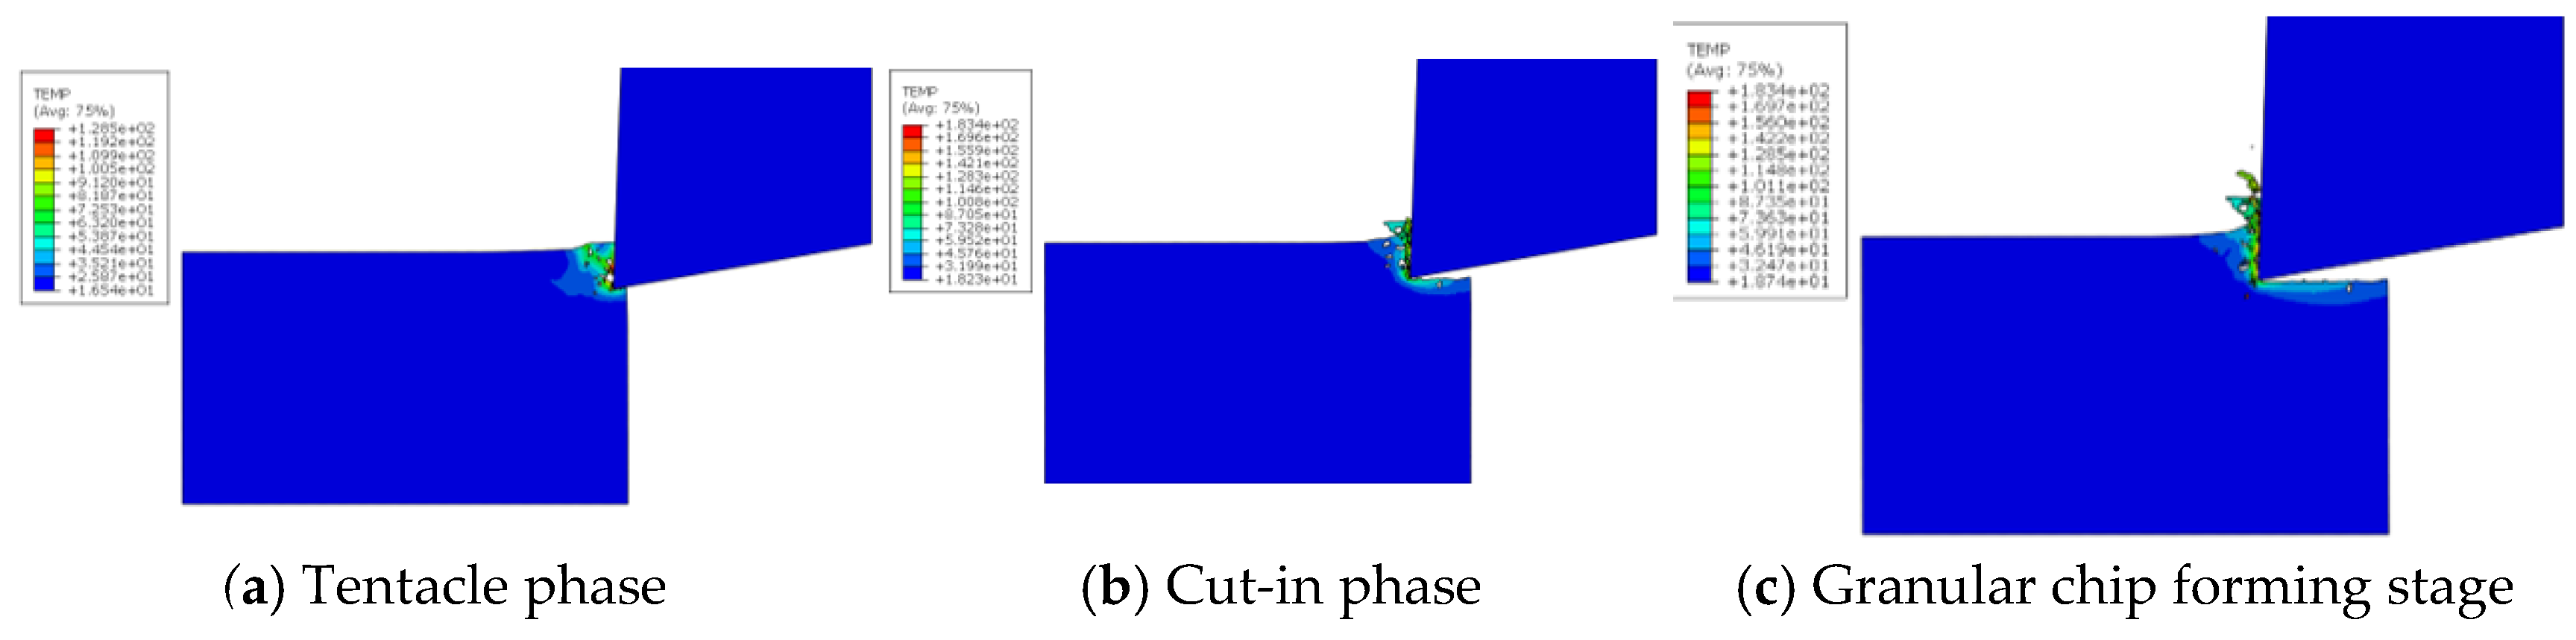
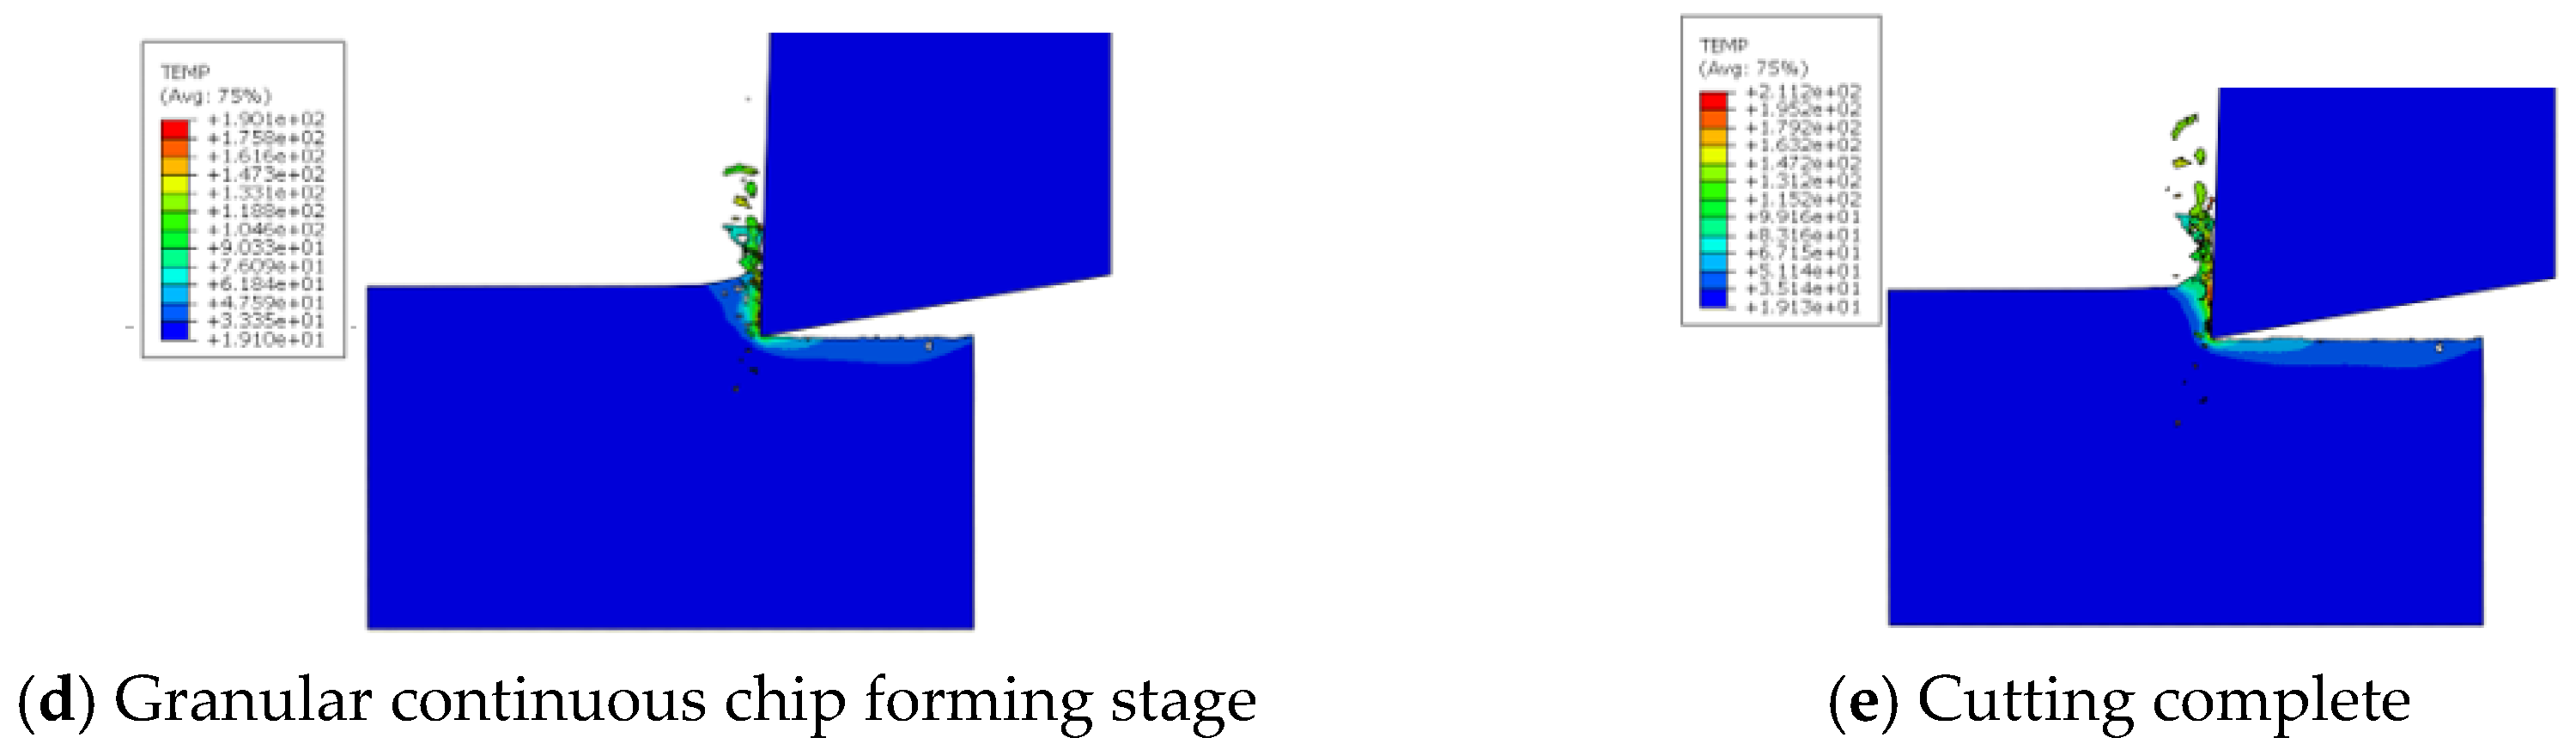
5.2.1. Chip Forming Process and Analysis

Figure 12 shows the simulation results of the temperature of the cutting zone and chip forming in the whole process of the workpiece, from the contact load with the tool to the separation and unloading with the tool (Vc = 360 mm/s, fz = 0.1 mm/tooth).
In Figure 12a–e, as the tool continues to rub and extrude with the cutting layer, the material in the deformation zone produces drastic thermal changes inside and outside, the bearing capacity of the material and the deformation zone decreases. Additionally, shear-slip deformation occurs under the action of cutting force, and gradually produces damage cracks. With the progress of cutting, the cracks also continue to expand, and the material finally develops brittle fractures, which form chips. In Figure 12d, which shows the cutting process, shear-slip deformation of the first deformation zone occurs, followed by brittle fracture. It is only when this happens that granular chips continue to form.

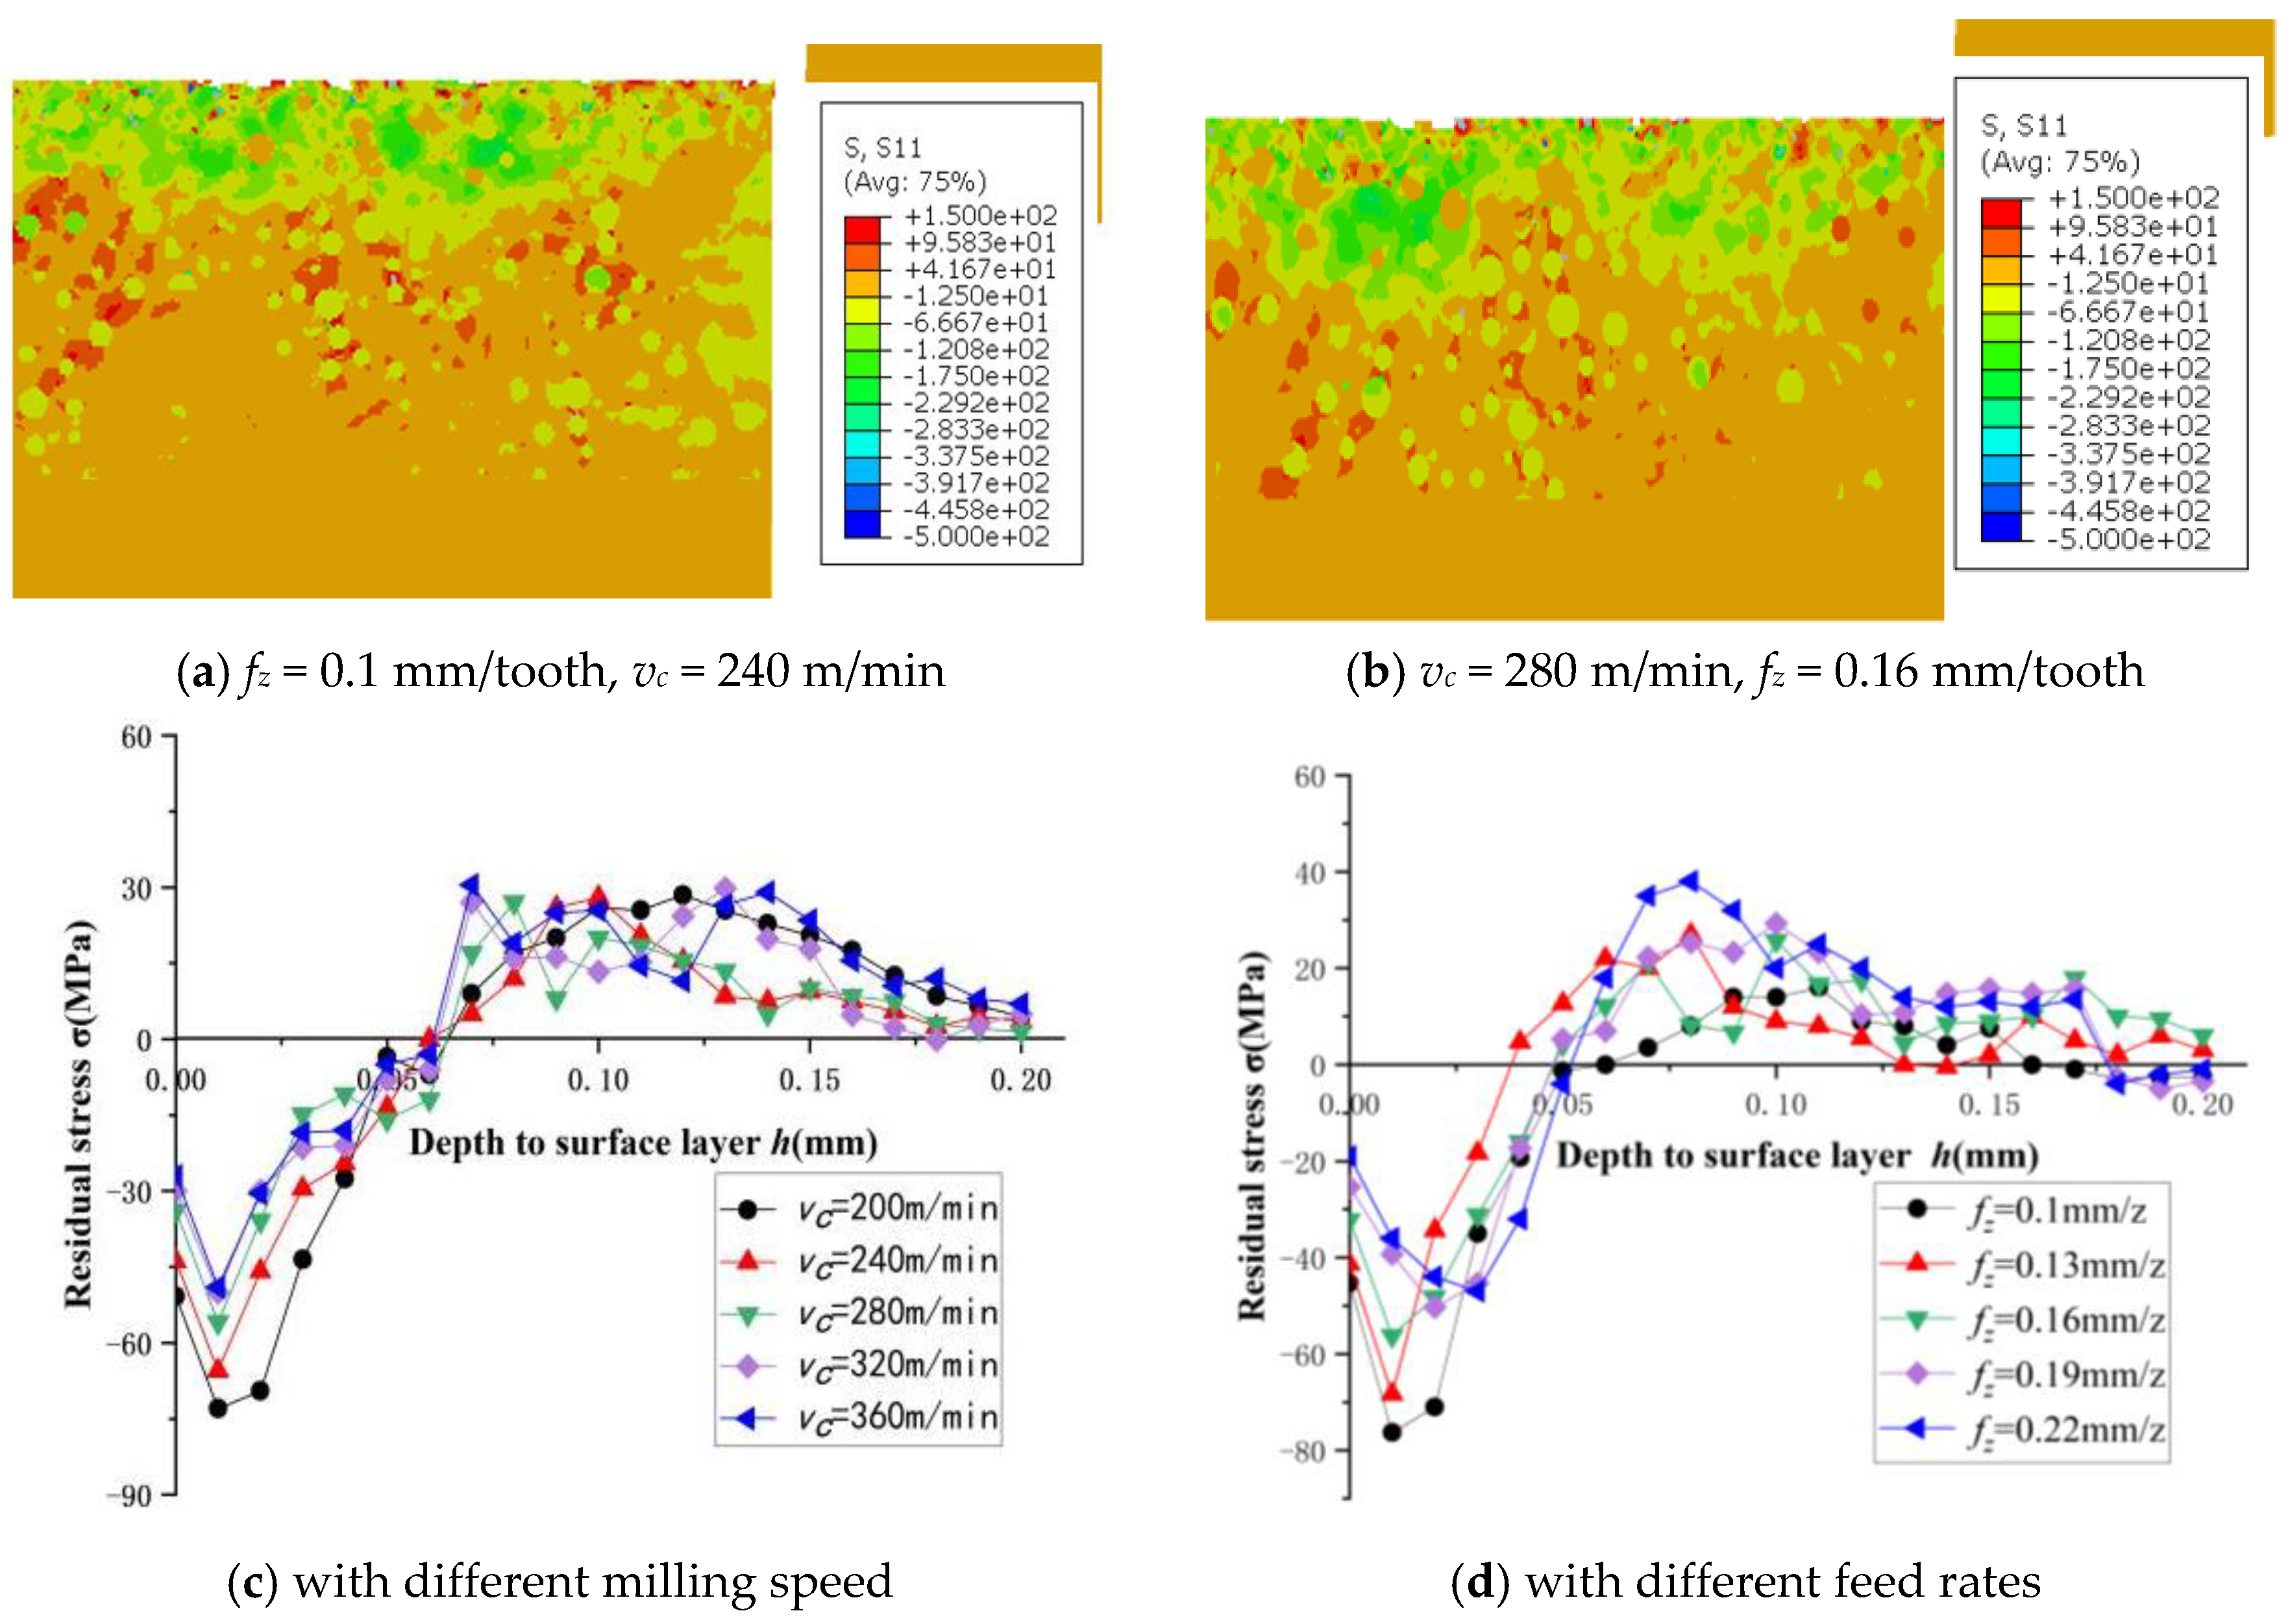
5.2.2. Effects of Milling Speed and Feed per Tooth on Residual Stress

Figure 13a shows the residual stress region extracted at fz = 0.1 mm/tooth and vc = 240 m/min, and Figure 13b shows the residual stress region extracted at vc = 280 m/min and fz = 0.16 mm/tooth.
Figure 13c shows the distribution of surface residual stresses in the surface layer at different milling speeds. The parameters selected for the simulation were: fz = 0.1 mm/tooth, and vc = 200, 240, 280, 320, and 360 m/min. After the simulation was completed, 20 sets of surface residual stress values were extracted along the surface layer of the workpiece. The results show that the surface residual stresses in the range of 0~0.06 mm from the machined surface are presented as compressive stresses, and gradually change to surface residual tensile stresses with an increase in h (extraction depth); the value of surface residual tensile stresses is smaller and finally returns to nearly 0 MPa, which is due to the high temperature of the subsurface layer of the workpiece during the cutting process, and cannot be transferred out in time; and the effect of thermal stresses is obviously enhanced. Pengfei Zhang also found this phenomenon through a simulation analysis of milling residual stress in SiCp/Al composites [27]. At the same time, in the current paper, it is observed that as the milling speed increases, the residual stress distribution inside the workpiece becomes very uneven. The reason is that the cutting process becomes unstable due to the increase in milling speed, coupled with the discrete distribution of a large number of SiC particles in SiCp/Al composites, which obviously interferes with the transfer of residual stress.
Figure 13d shows the distribution of surface residual stresses in the surface layer at different feed rates. The parameters selected for the simulation were: vc = 280 m/min, and fz = 0.1, 0.13, 0.16, 0.19, and 0.22 mm/tooth. After the simulation was completed, the data set was extracted using the same method. The results show that the surface residual compressive stresses on the workpiece surface at different feed rates gradually change to surface residual tensile stresses with an increase in h (extraction depth), and finally return to around 0 MPa. When the feed rate increases from 0.1 mm/tooth to 0.22 mm/tooth, the surface residual compressive stress and the maximum compressive stress in the surface layer show a gradual decrease, and both values change very obviously at different feed rates. At the same time, the maximum surface residual tensile stress value of the surface layer increases more obviously when the feed rate increases, which is due to the increase in the equivalent cutting thickness with the increase in the feed rate, resulting in an increase in the tool–workpiece contact area and an increase in the frictional heat between the two.

5.3. Effects of Milling Speed, Feed Rate, and Milling Depth on Surface Residual Stress

SiCp/Al composites have opposite two−phase characteristics, and if they are modeled in 3D milling, it is difficult to guarantee good meshing due to the irregular shape of SiC particles. Therefore, a two-dimensional orthogonal model was established to estimate the residual stress. This inevitably leads to deviations from the actual residual stress detection data, and the influence of different milling depths on residual stress cannot be obtained through this model, so this section presents the results of a liquid nitrogen low-temperature milling test to verify and supplement it.
Figure 14 shows graphs of the variation in surface residual stress with milling speed vc, feed rate fz, and milling depth ap.

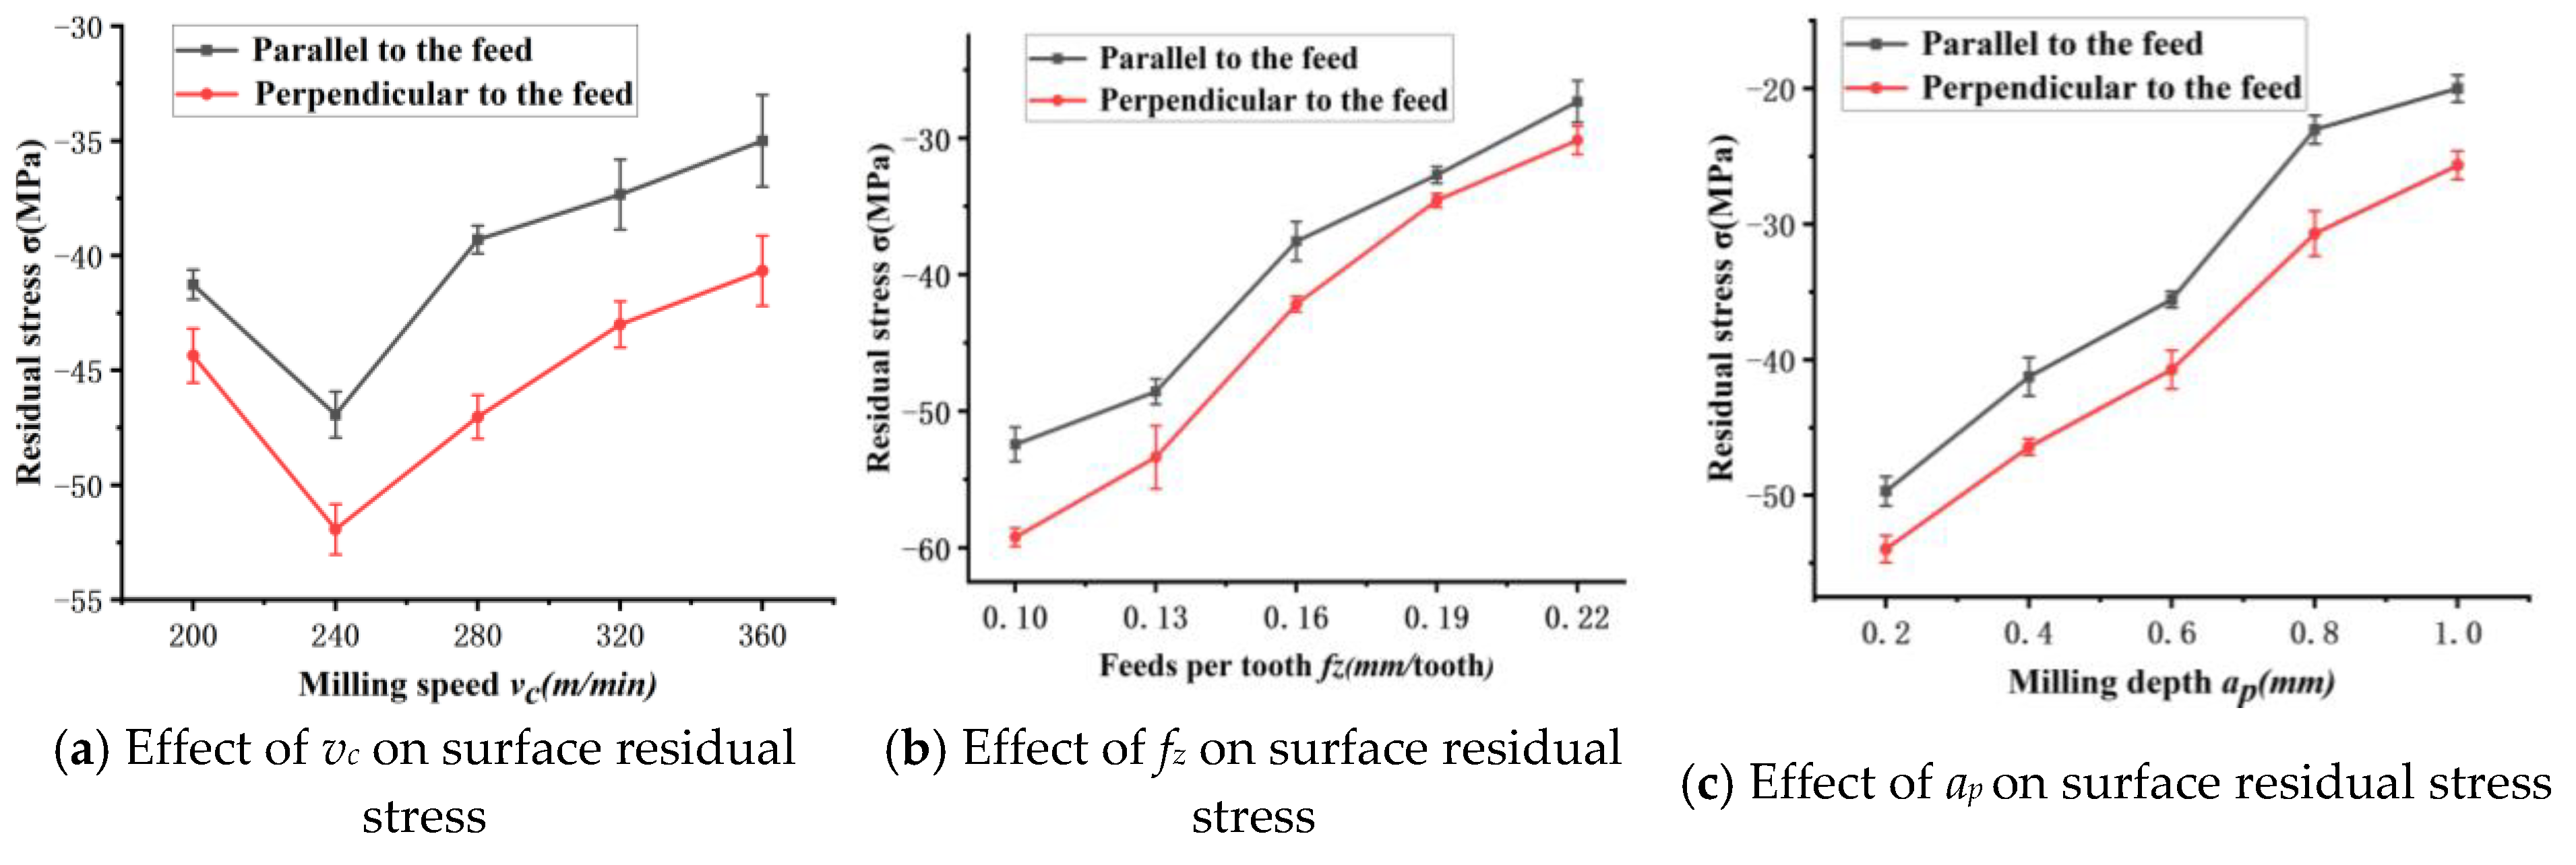
5.3.1. Effect of Milling Speed vc on Surface Residual Stress

The plotted surface residual stress versus milling speed vc with fixed test parameters of fz = 0.16 mm/tooth and ap = 0.6 mm are shown in Figure 14a. The test results show that the surface of the machined specimen shows surface residual compressive stresses in both the vertical and parallel feed rate directions, and both have similar trends of change, but the latter has somewhat smaller stress values overall. When the milling speed increases from 200 m/min to 240 m/min, the residual compressive stress reaches its maximum value, which is due to the increase in milling force causing the surface material to undergo serious plastic deformation, causing the compressive stress to rise. When the milling speed increases in the range of 240~360 m/min, the thermal effect dominates due to the rise in cutting heat, while the excessive temperature causes softening of the aluminum substrate, which makes the milling force decrease, leading to a gradual decrease in residual compressive stress under the combined effect of both. However, under liquid low-temperature nitrogen-assisted cooling conditions, −196 °C liquid nitrogen is injected steadily into the processing area, which can have a suppressing effect on the temperature rise, resulting in a more moderate rising trend of compressive stress.

5.3.2. Effect of Feed Rate fz on Surface Residual Stress

A relationship curve of surface residual stress plotted against feed rate fz for the fixed test parameters of vc = 280 m/min and ap = 0.6 mm is shown in Figure 14b. An analysis of the test results show that the residual compressive stress on the surface of the machined specimen varies more significantly at different feed rates fz, and the residual compressive stress is smaller in the parallel feed rate direction compared to the perpendicular feed rate direction, but both have a similar variation patterns. When the feed rate increases in the range of 0.1~0.22 mm/tooth, the residual compressive stress gradually decreases. This is due to the increase in the material removal rate with the increase in feed rate, which leads to an obvious increase in contact friction between the disc milling cutter and the workpiece; this causes a large amount of cutting heat generation and the dominance of the thermal effect, which eventually causes the conversion of residual compressive stress to tensile stress.

5.3.3. Effect of Depth ap on Surface Residual Stress

The fixed test parameters are vc = 280 m/min and fz = 0.16 mm/tooth. The plotted surface residual stresses versus milling depth ap are shown in Figure 14c. An analysis of the test results shows that the change in milling depth also has a significant effect on the surface residual stress. With in increase in milling depth ap, the stress value in both directions shows a decreasing trend. When ap increases from 0.2 mm to 1 mm, the material removal area increases, which increases the frictional resistance between the disc milling cutter and the machined specimen and generates a large amount of cutting heat, making the residual compressive stress gradually decrease.

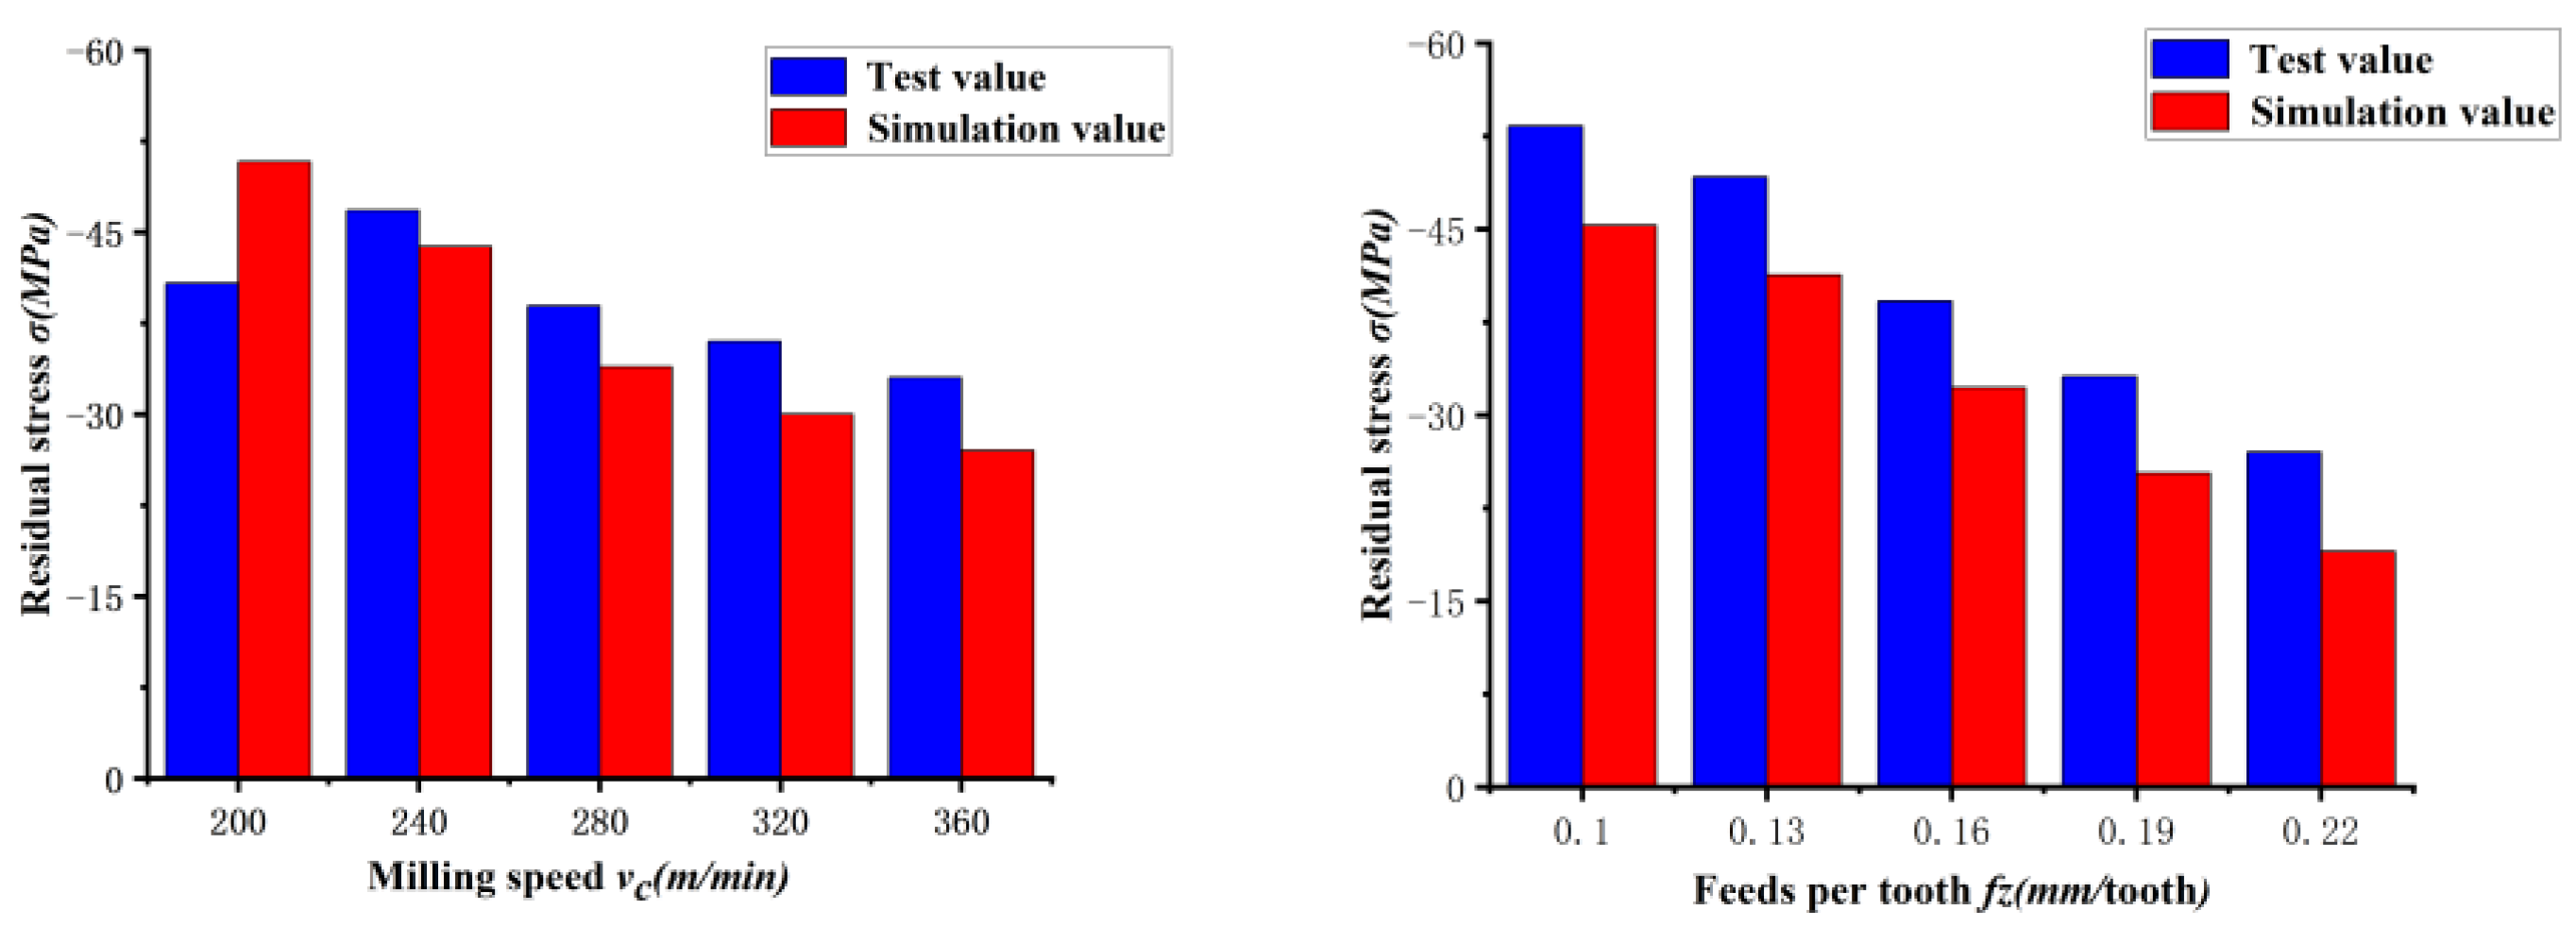
5.4. Simulation vs. Experiment

Looking at Figure 15, it can be seen that although the simulated values at a few points show large deviation from the experimental values, the overall trend is close. Under different milling parameters, the simulation value is generally small compared to the inspection data, which is mainly due to uncontrollable factors that occur in the milling process; for example, the wear belt of the tool face after the insert is applied will increase with an increase in milling distance, as will the tremor of the machine tool. However, our comparative analysis of the two still ensures that the simulation is reliable.

6. Conclusions

  • The surface roughness end milling test was carried out under the low-temperature auxiliary cooling of liquid nitrogen, and the three-dimensional topography of the machined surface was observed. It was found that the number of surface pits could be significantly reduced with an increase in milling speed. Moreover, higher milling depths can cause defects with large areas of jagged tips on the surface.
  • By conducting a central combination test, a second-order surface roughness prediction model was established and tested based on the test data, in which the model and coefficients were significant, the maximum error was 7.91%, the average error was 3.25%, and the model was more reliable. The results of the interaction analysis show that a high level of both feed rate and milling depth is not recommended for cryogenic liquid nitrogen-assisted cooling conditions.
  • Surface microhardness measurements were performed on the specimens, and the results show that as the milling speed increased, the surface microhardness value first increased, and then, became smaller, and its maximum value was obtained at 240m/min. Therefore, under low-temperature liquid nitrogen conditions, it is recommended to use a speed of more than 240 m/min for milling. When the milling depth increases in the range of 0.2~1 mm, the degree of work hardening will increase, and the feed rate will be the same as the trend.
  • By simulating the surface residual stresses, it was found that when a larger feed rate or higher milling speed is used, higher surface residual tensile stresses appear in the surface layer. The surface of the specimen after end milling undergoes surface residual compressive stresses, and when the milling speed increases in the range of 240 mm/tooth~360 mm/tooth, the surface residual compressive stresses show a trend of first increasing, and then, decreasing. There is a tendency for surface residual compressive stresses to convert to tensile stresses as a result of increased milling depth or feed rates. In addition, as the milling depth and the feed per tooth increase, the interference effect of the SiC particles on internal residual stress transfer also increases. Therefore, it is not recommended to use both a high depth of cutting and high feed per tooth. Upon using test data to verify the simulation values, we found that the trends of the two are basically the same, and that they have high reliability.

Author Contributions

All authors contributed to the study conception and design. Material preparation and data collection and analysis were performed by H.Z., L.Q. and C.D. All authors commented on previous versions of the manuscript. All authors have read and agreed to the published version of the manuscript.

Funding

This work was supported by the National Natural Science Foundation of China (Grant nos. 52275417 and 52075135).

Conflicts of Interest

The authors declare no conflict of interest.

References

  1. Wang, C.; Zhou, L.; Wang, Y.; Ding, H. The effect of microstructure on mechanical properties of SiCp/Al composites was simulated numerically. J. Mater. Sci. Eng. 2015, 33, 122–126. [Google Scholar] [CrossRef]
  2. Zhou, Y.; Zhang, D.; Wang, W.; Li, L. Research status and aerospace application of sic particle reinforced aluminum matrix composites formed by selective laser melting. Aeronaut. Manuf. Technol. 2018, 61, 68–73. [Google Scholar] [CrossRef]
  3. Bao, Y.; Zhang, X.; Lu, S.; Zhang, H. Investigation on the removal characteristics of single-point cutting high-volume fraction SiCp/Al composites. Int. J. Adv. Manuf. Technol. 2021, 118, 881–894. [Google Scholar] [CrossRef]
  4. Zhu, W. Microstructure and Interface Characterization of Aluminum-Based Silicon Carbide Composites with Medium and High Volume Fraction. Master’s Thesis, Shenyang University, Shenyang, China, 2021. [Google Scholar]
  5. Ouyang, L.; Luo, C. Application of composite materials and its progress. Automot. Technol. Mater. 2000, 28–31. [Google Scholar]
  6. Liu, J.; Cheng, K.; Ding, H.; Chen, S.; Zhao, L. An Investigation of Surface Defect Formation in Micro Milling the 45% SiCp/al Composite. Procedia CIRP 2016, 45, 211–214. [Google Scholar] [CrossRef] [Green Version]
  7. Li, Z.; Hou, S. Research progress in cutting of sic reinforced aluminum matrix composites. Tool Eng. 2017, 51, 9–13. [Google Scholar] [CrossRef]
  8. Zhou, Y. Silicon carbide particle reinforced aluminum matrix composites. Tool Eng. 2017, 51, 7–10. [Google Scholar] [CrossRef]
  9. Wang, T.; Xie, L.; Wang, X.; Jiao, L.; Shen, J.; Xu, H.; Nie, F. Surface Integrity of High Speed Milling of Al/SiC/65p Aluminum Matrix Composites. Procedia CIRP 2013, 15, 475–480. [Google Scholar] [CrossRef] [Green Version]
  10. Bian, R.; He, N.; Li, L.; Zhan, Z.B.; Wu, Q.; Shi, Z.Y. Precision Milling of High Volume Fraction SiCp/Al Composites with Monocrystalline Diamond end Mill. Int. J. Adv. Manuf. Technol. 2013, 71, 411–419. [Google Scholar] [CrossRef]
  11. Zhou, L.; Zhang, D.; Wang, C.; Liu, D. Microstate SiCp/Al composite milling residual stress simulation analysis. Chin. J. Mater. Sci. Eng. 2016, 16, 5–10. [Google Scholar] [CrossRef]
  12. Xiang, J.; Pang, S.; Xie, L.; Hu, X.; Peng, S.; Wang, T. Investigation of Cutting Forces Surface Integrity, and Tool Wear when High-Speed Milling of High-Volume Fraction SiCp/Al6063 Composites in PCD Tooling. Int. J. Adv. Manuf. Technol. 2018, 98, 1237–1251. [Google Scholar] [CrossRef]
  13. Muthukrishnan, N.; Murugan, M.; Rao, K.P. Machinability Issues in Turning of Al-SiC (10p) Metal Matrix Composites. Int. J. Adv. Manuf. Technol. 2008, 39, 211–218. [Google Scholar] [CrossRef]
  14. Huang, S.; Guo, L.; Yang, H.; Su, Y.; Xu, L. Study on characteristics in high-speed milling SiCp/Al composites with small particles and high volume fraction by adopting PCD cutters with different grain sizes. Int. J. Adv. Manuf. Technol. 2019, 102, 9–12. [Google Scholar] [CrossRef]
  15. Huang, S.; Guo, L.; He, H.; Yang, H.; Su, Y.; Xu, L. Experimental study on SiCp/Al composites with different volume fractions in high-speed milling with PCD tools. Int. J. Adv. Manuf. Technol. 2018, 97, 5–8. [Google Scholar] [CrossRef]
  16. Li, M. Surface Quality Study of SiCp/Al Composites by High-Speed Milling. Master’s Thesis, Harbin Institute of Technology, Harbin, China, 2020; pp. 39–46. [Google Scholar] [CrossRef]
  17. Kaynak, Y.; Lu, T.; Jawahir, I.S. Cryogenic Machining-Induced Surface Integrity: A Review and Comparison with Dry, MQL, and Flood-Cooled Machining. Mach. Sci. Technol. 2014, 18, 149–198. [Google Scholar] [CrossRef]
  18. Zhou, L.; Huang, S.; Yu, X. Machining Characteristicsin Cryogenic Grinding of SiCp/Al Composites. Acta Metall. Sin. 2014, 27, 869–874. [Google Scholar] [CrossRef] [Green Version]
  19. Shi, R. Study on the Surface Characteristics of SiCp/Al Composites Machined by High-Speed Milling with Low-Temperature Trace Lubrication. Master’s Thesis, Harbin University of Science and Technology, Harbin, China, 2020; pp. 35–39. [Google Scholar] [CrossRef]
  20. Jiang, X.; Li, B.; Yang, J.; Zuo, X.; Li, K. An approach for analyzing and controlling residual stress generation during high-speed circular milling. Int. J. Adv. Manuf. Technol. 2013, 66, 1439–1448. [Google Scholar] [CrossRef]
  21. Masmiati, N.; Sarhan, A.A. Optimizing cutting parameters in inclined end milling for minimum surface residual stress-Taguchi approach. Measurement 2015, 60, 267–275. [Google Scholar] [CrossRef]
  22. Li, S.; Niu, Q.; Li, C.; Yu, Z.; TaeJo, K. Study on surface quality of SiCp/Al composites for low-temperature milling of coated tools. Aerosp. Mater. Technol. 2021, 51, 68–72. [Google Scholar]
  23. Tang, L. Study on the Surface Quality and Tool Wear of SiCp/Al Composites for Milling. Master’s Thesis, Hunan University of Science and Technology, Xiangtan, China, 2017; pp. 35–41. [Google Scholar]
  24. Zhang, D. Study on Milling Residual Stress of SiCp/Al Composites. Master’s Thesis, Shenyang Ligong University, Shenyang, China, 2016; pp. 35–40. [Google Scholar]
  25. Chen, H. Study on the Preparation of Ultrafine Crystalline Strip from Low-Temperature Cutting Aluminum Alloy 7075 and Its Properties. Master’s Thesis, South China University of Technology, Guangzhou, China, 2020; pp. 19–23. [Google Scholar] [CrossRef]
  26. Zhang, P.; Cui, C.; Zhang, D.; Zhou, L. Finite element analysis of milling residual stress of SiCp/Al composites. Tool Technol. 2017, 51, 52–56. [Google Scholar] [CrossRef]
  27. Jin, J. Optimization of SiCp/Al Composite Milling Tool Parameters and Low Temperature Minimum Lubrication Test Study. Harbin University of Science and Technology, Harbin, China, 2021. [Google Scholar] [CrossRef]
Figure 1. Experimental equipment and test equipment.
Machines 11 00608 g001
Figure 2. Variation in surface roughness with cutting parameters.
Machines 11 00608 g002
Figure 3. Variation in surface microtopography with milling speed (fz = 0.16 mm/tooth, ap = 0.6 mm).
Machines 11 00608 g003
Figure 4. Variation in surface morphology with feed rate (vc = 280 m/min, ap = 0.6mm).
Machines 11 00608 g004
Figure 5. Variation in surface morphology with milling depth (vc = 280 m/min, fz = 0.16 mm/tooth).
Machines 11 00608 g005
Figure 6. Normal probability diagram of residual.
Machines 11 00608 g006
Figure 7. Response graphs of surface roughness with the interaction of milling parameters.
Machines 11 00608 g007
Figure 8. Surface microhardness variation with cutting parameters.
Machines 11 00608 g008
Figure 9. Equivalent cutting thickness model.
Machines 11 00608 g009
Figure 10. Two-phase model.
Machines 11 00608 g010
Figure 11. Boundary conditions.
Machines 11 00608 g011
Figure 12. Chip forming process.
Machines 11 00608 g012aMachines 11 00608 g012b
Figure 13. Simulation curve of surface residual stresses with different milling speeds and different feed rates.
Machines 11 00608 g013
Figure 14. Surface residual stress changes with cutting parameters.
Machines 11 00608 g014
Figure 15. Comparison of test and simulation values.
Machines 11 00608 g015
Table 1. Chemical compositions of SiCp/Al composite material.
The Element TypeCMgAlSiCu
Weight ratio (%)9.430.5143.1345.131.80
Proportion of atomic number (%)19.590.4734.744.340.9
Table 2. Test factors and levels.
FactorsHorizontal ParametersProcessing Environment
Milling speed vc (m/min)200, 240, 280, 320, 360Cryogenic liquid nitrogen
Feed per tooth fz (mm/tooth)0.1, 0.13, 0.16, 0.19, 0.22
Milling depth ap (mm)0.2, 0.4, 0.6, 0.8, 1
Milling width ae (mm)8
Liquid nitrogen flow rate (g/s)6
Table 3. The cutting parameters and their levels.
FactorUnitSymbolLevel
−101
Milling speedm/minvc250300350
Feed per tooth mm/toothfz0.140.170.2
Milling depthmmap0.40.60.8
Milling widthmmae8
Table 4. Test design and results.
Trial
Serial Number
Canonical VariablesActual ParametersRa
(μm)
×1×2×3Milling SPEEDFeed Per Tooth Milling Depth
1−1−10250.000.140.600.222
2000300.000.170.600.252
31−10350.000.140.600.188
4−110250.000.20.600.299
5110350.000.20.600.239
6000300.000.170.600.253
7−10−1250.000.170.400.218
810−1350.000.170.400.184
9−101250.000.170.800.269
10000300.000.170.600.263
11101350.000.170.800.248
120−1−1300.000.140.400.178
1301−1300.000.20.400.221
140−11300.000.140.800.203
15011300.000.20.800.298
16000300.000.170.600.261
17000300.000.140.600.250
Table 5. 6063 Aluminum J-C model parameters.
AluminumA (Mpa)B (Mpa)Cmn
Parameters176.563.990.00360.8590.183
Table 6. The physical property parameters of workpieces and tools.
Material PropertiesAluminum AlloySiC ParticlesPCD Cutter
Density (g/cm3)2.73.134.25
Young’s modulus (Gpa)71.94201147
Poisson’s ratio0.340.140.07
Thermal conductivity (W/m/°C)180812100
Specific heat capacity (J/kg/°C)880427525
Coefficient of thermal expansion (10−6°C−1)23.521.84
Table 7. J-C model material failure parameters.
d1d2d3d4d5
0.0740.089−2.441−4.760
Disclaimer/Publisher’s Note: The statements, opinions and data contained in all publications are solely those of the individual author(s) and contributor(s) and not of MDPI and/or the editor(s). MDPI and/or the editor(s) disclaim responsibility for any injury to people or property resulting from any ideas, methods, instructions or products referred to in the content.

