1. Introduction
The overall scope of any engineering challenge is to design and produce a product with optimal CAPEX for minimizing OPEX. The same applies to wind turbine blades, where the LPS design coordination must respect the electrical aspects of the blade structural layout (carbon fibres, balance chambers, conductive pins in split blades, etc.) and potential conductive additional features of the blade (heating systems, power cables, metallic sensor cables, etc.).
To achieve this, engineers rely on a well-defined set of design constraints, such that all impacts on the final product can be addressed in the design phase. For transparency, the important aspects are not identified for every new development project but described in international product standards like the IEC 61400-24 [
1]. In such standards, the industry has come together to describe sensible design processes and guidelines in informative sections, as well as strict requirements for testing and validation in normative parts of the document. The standard therefore serves as a common platform for the seller and buyer of a wind turbine when it comes to reasonable lightning protection designs.
Input to the international standards is industry experience from OEM and the end users and scientific results within the relevant technical fields. All this information is then condensed into a document which enlightens turbine designers about the latest LPS insight, with the ultimate goal of providing stronger blade and turbine designs for a more reliable power system.
Although all stakeholders are keen to preserve confidential information, it also turns out that a certain openness in such fora is essential to draft strong standards. Everyone understands that business sensitive information is secret, but also that insight and experience is the key to improving requirements for product design and performance.
This paper publishes measured lightning data collected from different stakeholders, which shows that a collaboration between them can exist. The purpose of the publication is to compare the parameters obtained with existing lightning statistics and discuss how the parameters affect future blade designs.
1.1. Lightning Measurements
An important feature of the IEC 61400-24 is the definition of the lightning environment, which the turbine and blade must withstand. The definition is inspired by the lightning protection standards for buildings [
2], which is based upon measurements performed on tall towers on mountains [
3]. The application in [
1] assumes that the data can be extrapolated to also cover the lightning environments on tall turbines with revolving rotors installed either offshore at zero elevation or in mountainous regions of various topographies.
Over the last decade, industry has started to appreciate the valuable insights provided by direct lightning measurements in turbines. The benefits are many; lowering OPEX, targeting maintenance and focusing the effort on those turbines and blades which were exposed to lightning parameters exceeding threshold values documented in IEC61400-24 Ed2 [
1]. Secondly, a different and more complex picture has emerged, where sites are clearly exposed differently, and the difference in exposure between turbines within a single wind farm can be remarkable.
The level of maturity in the industry is progressing, and alongside that a range of vendors of suitable lightning monitoring systems have targeted lowering operational expenses. The quality of the measurements may vary, and also the objectiveness of the input targeting maintenance, which is why this topic has been deemed pressing by the IEC MT24 group revisiting the Annex L [
1].
1.2. Knowledge Sharing
A second very interesting trend beyond the increased interest in lightning monitoring in actual turbines, is the willingness from the industry to share data. Historically OEMs have been very keen to protect information about lightning exposure and potential damage, and obviously blade performance in the field is something that is still kept confidential. However, regarding recording the lightning itself, all acknowledge that neither R&D engineers, lawyers, nor blade designs can affect the current parameters. Hence, it is considered valuable for everyone to start sharing lightning measurements in actual turbines, so the new knowledge can be reflected in future standards, to ultimately start designing blades for actual Wind Turbine lightning exposure.
This is a very important step forward, to again consolidate as an industry that needs to learn and collaborate on understanding this new level of knowledge, and collectively draft tomorrow’s guidelines for stronger blades and wind turbines compliant with the actual lightning environment.
1.3. Objective of This Paper
The aim of this paper is to facilitate knowledge sharing of measured lightning data on wind turbines collected from several stakeholders (manufacturers, operators, wind turbine owners) which will effectively benefit the entire industry. The presented data are directly compared to the design parameters documented in the current version of the lightning protection standard [
1]. With this approach, the existing reference dataset for standardization can be compared to a dataset with different geographical and climatological origin which reveals where design critical maximum lightning parameters need to be adjusted and where they are sufficiently described in the current standard.
The intention of the paper is also to demonstrate why lightning data can, and should be shared, within the lightning community, to learn from actual and more recent exposure and enable stronger and more durable blade and turbine designs.
2. Materials and Methods
Active lightning measurement systems for wind turbines have been commercially available for more than a decade, and since 2015, the LKDS™ (Lightning Key Data System [
4]) has been implemented in offshore and onshore turbines at different elevations across the globe. The implementation has sped up, especially during the last couple of years, such that more than 1000 turbines offshore and onshore are equipped with a system enabling a more tailored inspection and maintenance plan. The LKDS is a laboratory grade measurement system implemented in industrial housing located in the hub, enabling 16 bit resolution up to +/−240 kA, and consecutive measurements of 1.5 s sampled in 10 MS/s (0.1 us time resolution). A current sensor is located in the root of each blade. They monitor the current flow in the down conductor and are connected via a coaxial cable to the main processing unit. The minimum detectable trigger threshold can be as low as 300 A which enables the capture of many smaller upward lightning events also. The raw data is then processed by algorithms to calculate the current magnitude, the specific energy, the charge transfer, and the time derivative of the current, the current gradient, being the fourth relevant Key Data.
3. Results
The measurement systems have been installed in wind farms across Europe and Asia, onshore and offshore, with the addition of a few single installations in the Americas as well. The full overview of the measurement statistics will be targeted to future publications, and will also address geographical variations, seasonal variations and variations affected by the actual turbine geometry and local terrain topography.
A total of 2603 strikes measured in actual turbines are included in the analysis, and the following subsection presents the statistical distribution of the key parameters compared to the existing LPL1 from IEC 61400-24 Ed2. For this coarse analysis, the strikes are classified with respect to polarity (positive and negative) and the direction of initiation (upward initiated or downward initiated), see
Table 1. The upward and downward classification is performed with a self-developed algorithm which uses a set of conditions related to the peak current, front time, fall time, and charge of the impulse to determine the type. The classification of the 2603 strikes resulted in the following distribution, for consideration when evaluating the cumulative distributions in
Figure 1,
Figure 2,
Figure 3 and
Figure 4.
Other-lightning events are characterized by a charge magnitude of less than 0.3C and do not show characteristic lightning waveform patterns of either downward or upward lightning. They are therefore not included in the following assessment.
3.1. Peak Current
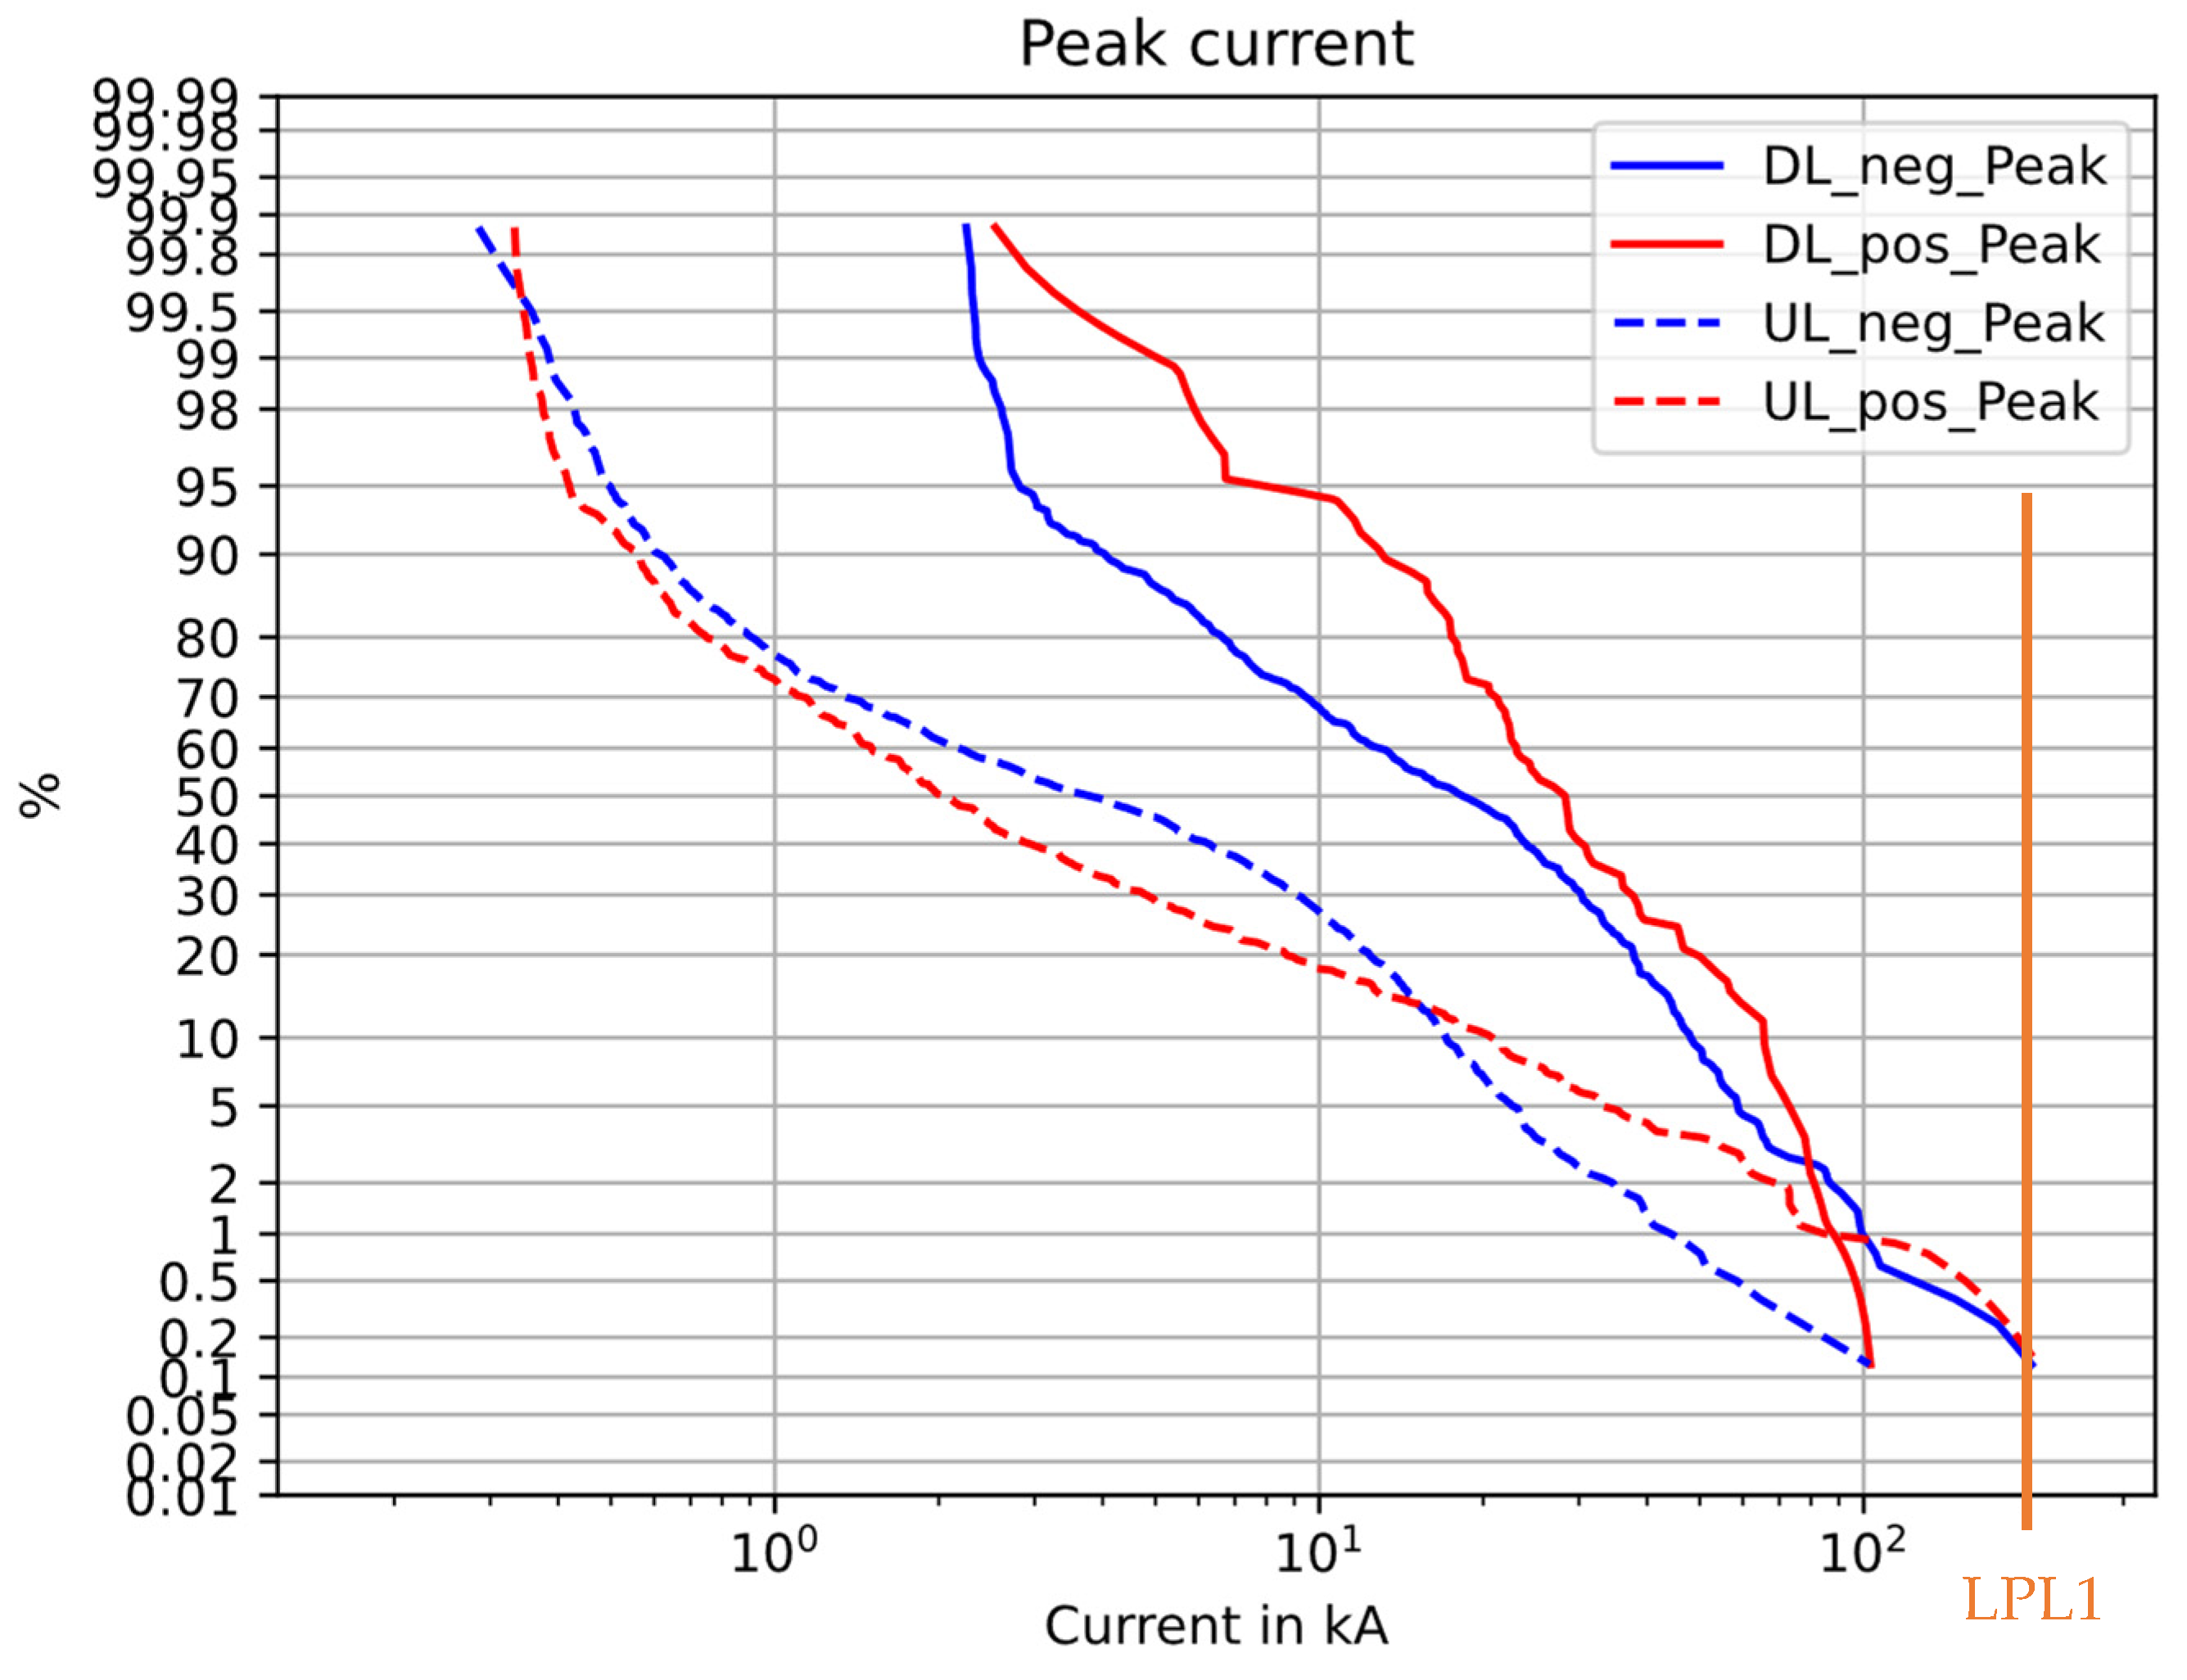
The current magnitude is the most common measure for the severity of a lightning strike, although it is often a combination of peak current, specific energy and charge that provides the actual threat to the turbine. In
Figure 1, the cumulative distribution of current magnitude is provided for the five different classifications of strikes.
Figure 1.
Cumulative distribution of current magnitude.
Figure 1.
Cumulative distribution of current magnitude.
Compared to the LPL1 current magnitude used for wind turbine design and verification, it is safe to say that we are well below the 200 kA magnitude level. Although less than 1% of the total number of events exceeded 200 kA in the dataset, the coarse evaluation shows that the median current magnitude of DW lightning is between 20 kA and 30 kA and the 1% percentile is reached at approximately 100 kA. A more careful look at the statistics of each of the different types of lightning, may reveal specific distributions for the different types of lightning. The size of the data set may also influence the distribution, in particular for positive downward lightning.
According to the dataset of Berger [
3], the highest peak current amplitudes were reported for positive downward lightning flashes. This dataset does not support the same conclusion but downward negative together with upward lightning positive showed the highest peak current amplitudes.
3.2. Specific Energy
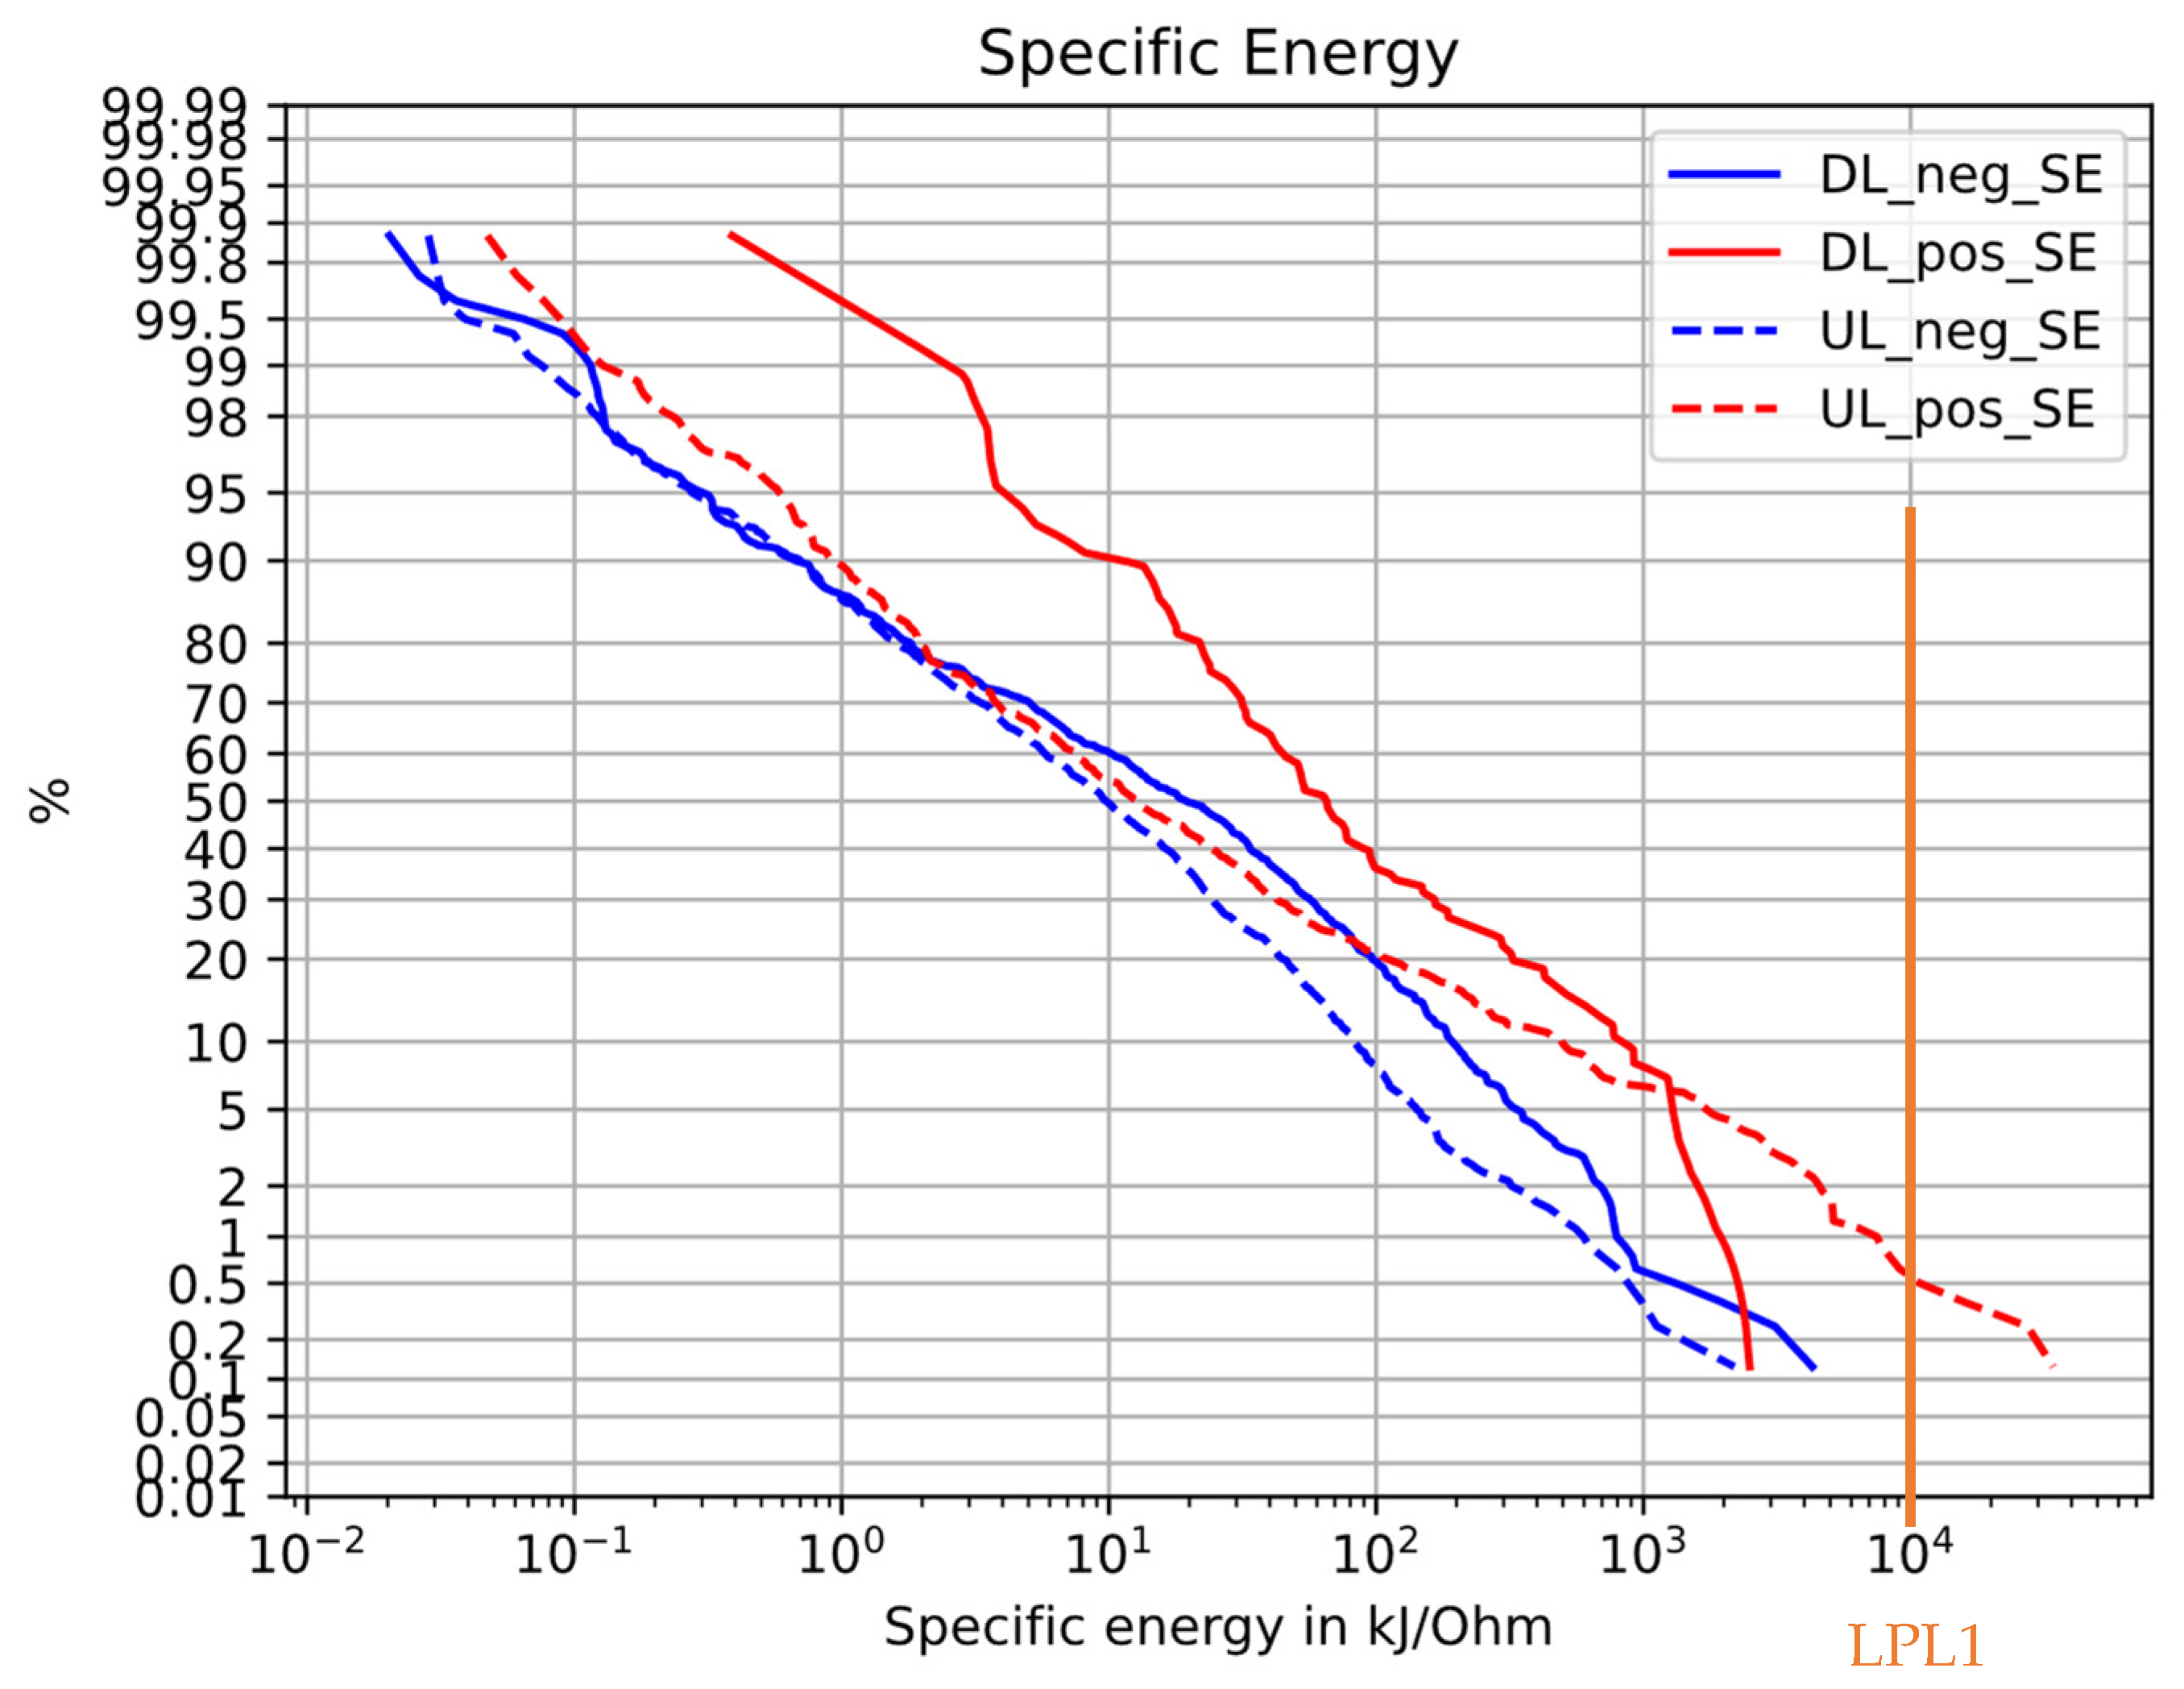
Concerning the specific energy, it is noted that the vast majority of the events transfer limited amounts of specific energy. The cumulative distribution of the parameters split into the different types is found in
Figure 2.
Figure 2.
Cumulative distribution of specific energy.
Figure 2.
Cumulative distribution of specific energy.
The median value of the specific energy contained within a DW lightning flash is found to be between 10 kJ/Ohm and 30 kJ/Ohm, whereas the 1% percentile is reached at 1000 kJ/Ohm. For UW lightning flashes, in particular the positive polarity shows the possibility of larger energy transfer, where the 1% percentile is located at 8000 kJ/Ohm.
3.3. Charge Transfer
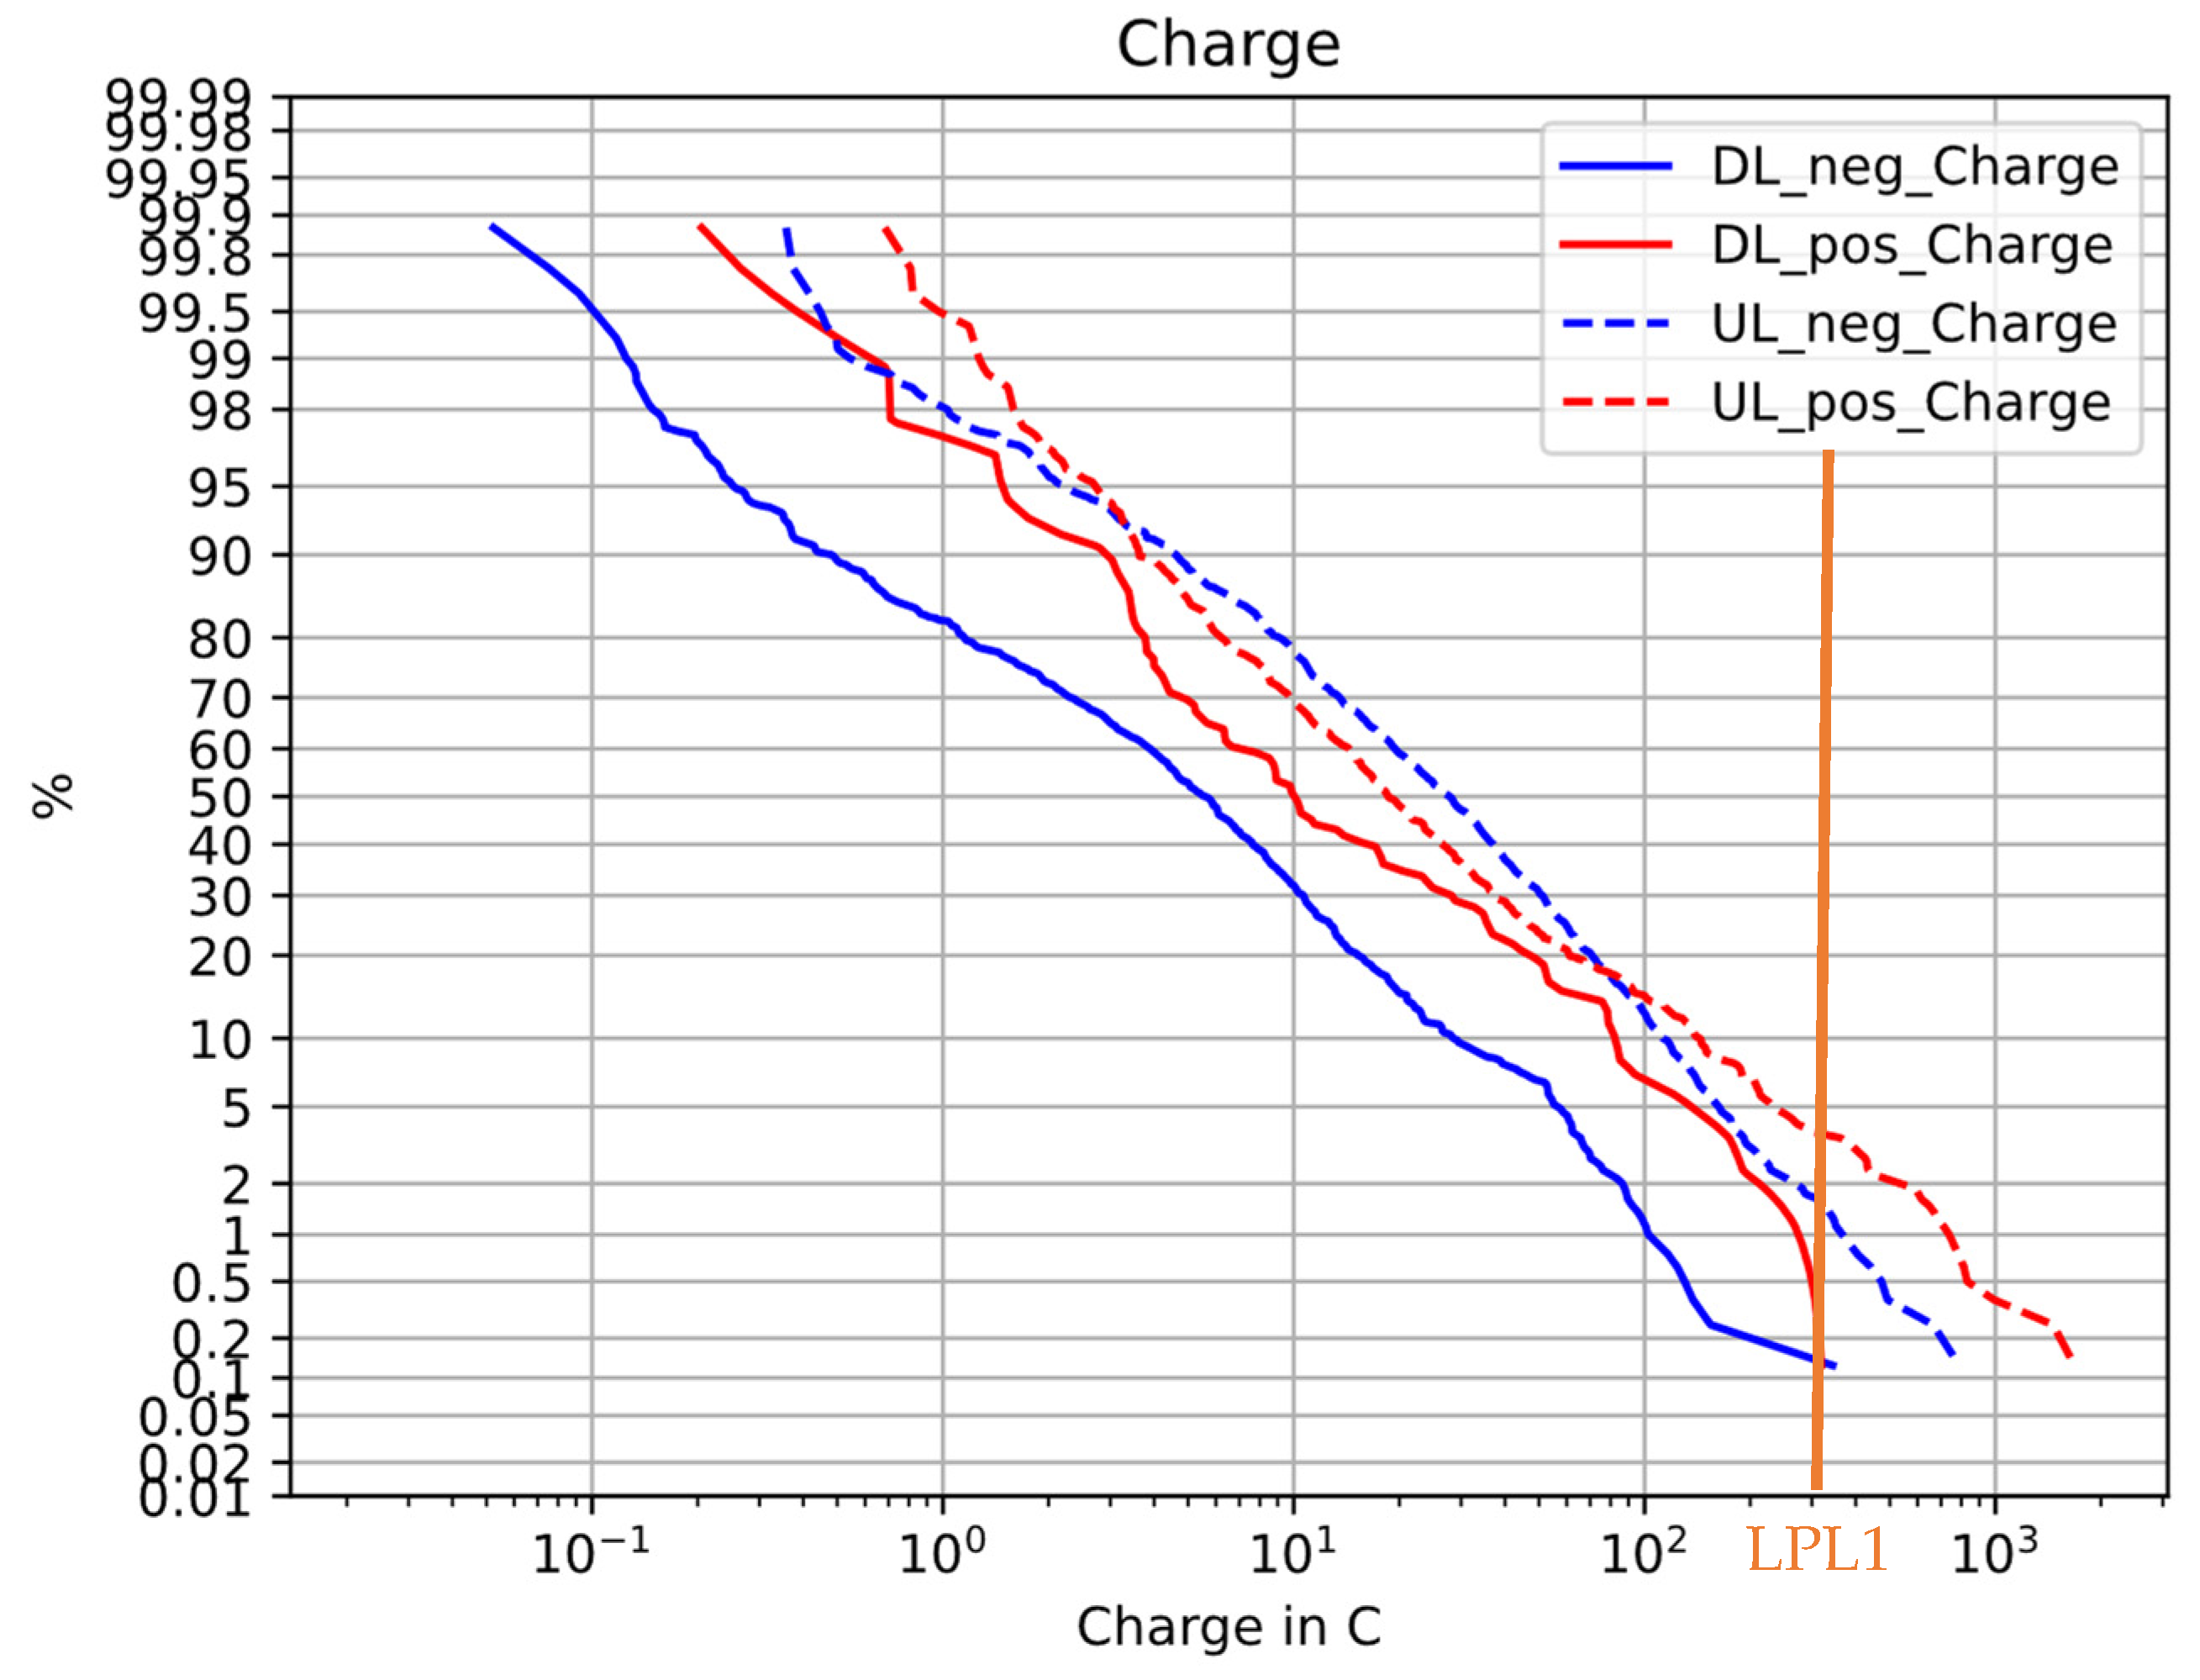
The charge transfer in a lightning flash is very much dependent on the type of strike observed. Downward strikes are often seen as a single and short current pulse with a fast rise time, whereas upward strikes are associated with a slower risetime. Upward strikes are also often associated with Initial Continuous Current with or without superimposed pulses but providing substantial amount of charge relative to the current magnitude. The third type are bipolar events where significantly larger total charge transfer is observed. The total charge transfer is in this respect calculated as the sum of absolute values, since the current direction will not directly impact the degree of erosion on a wind turbine blade with a tip velocity of 80–100 m/s.
A median value for negative DW lightning is found to approach 6C, whereas the 1% percentile is reached at roughly 300C for positive and 100C for negative downward lightning and roughly 700C for upward positive and 400C for upward negative lightning. The distribution is seen in
Figure 3.
Figure 3.
Cumulative distribution of total charge transfer.
Figure 3.
Cumulative distribution of total charge transfer.
3.4. Current Gradient
The current gradient together with the current magnitude is probably the combination that challenges most blade designs with additional conductive components such as carbon spar caps, conductive sensors or power cables, etc. The guidelines in IEC 61400-24 [
1] explain how numerical modelling of the entire blade, and injection of the IEC waveforms must be conducted to verify the design adequacy. If this is done properly, it is evident that electrical equipotential bonding between the LPS and additional conductive elements is needed, and that the load of these bondings can be minimised by a careful design of the down conductor. The current gradient and magnitude used for these assessments are given by the first negative short stroke and the subsequent short stroke, characterised by the 1/200 us@100 kA and the 0.25/100 us@50 kA waveforms.
Considering actual field measurements, the picture is more scattered. Firstly, because real lightning waveforms rarely look like the Heidler function [
2], and secondly because it is the combination of magnitude and current gradient that will drive differential voltages within the blade design. Hence there is a need for a unique definition of current gradient for a sensible evaluation of blade design performance.
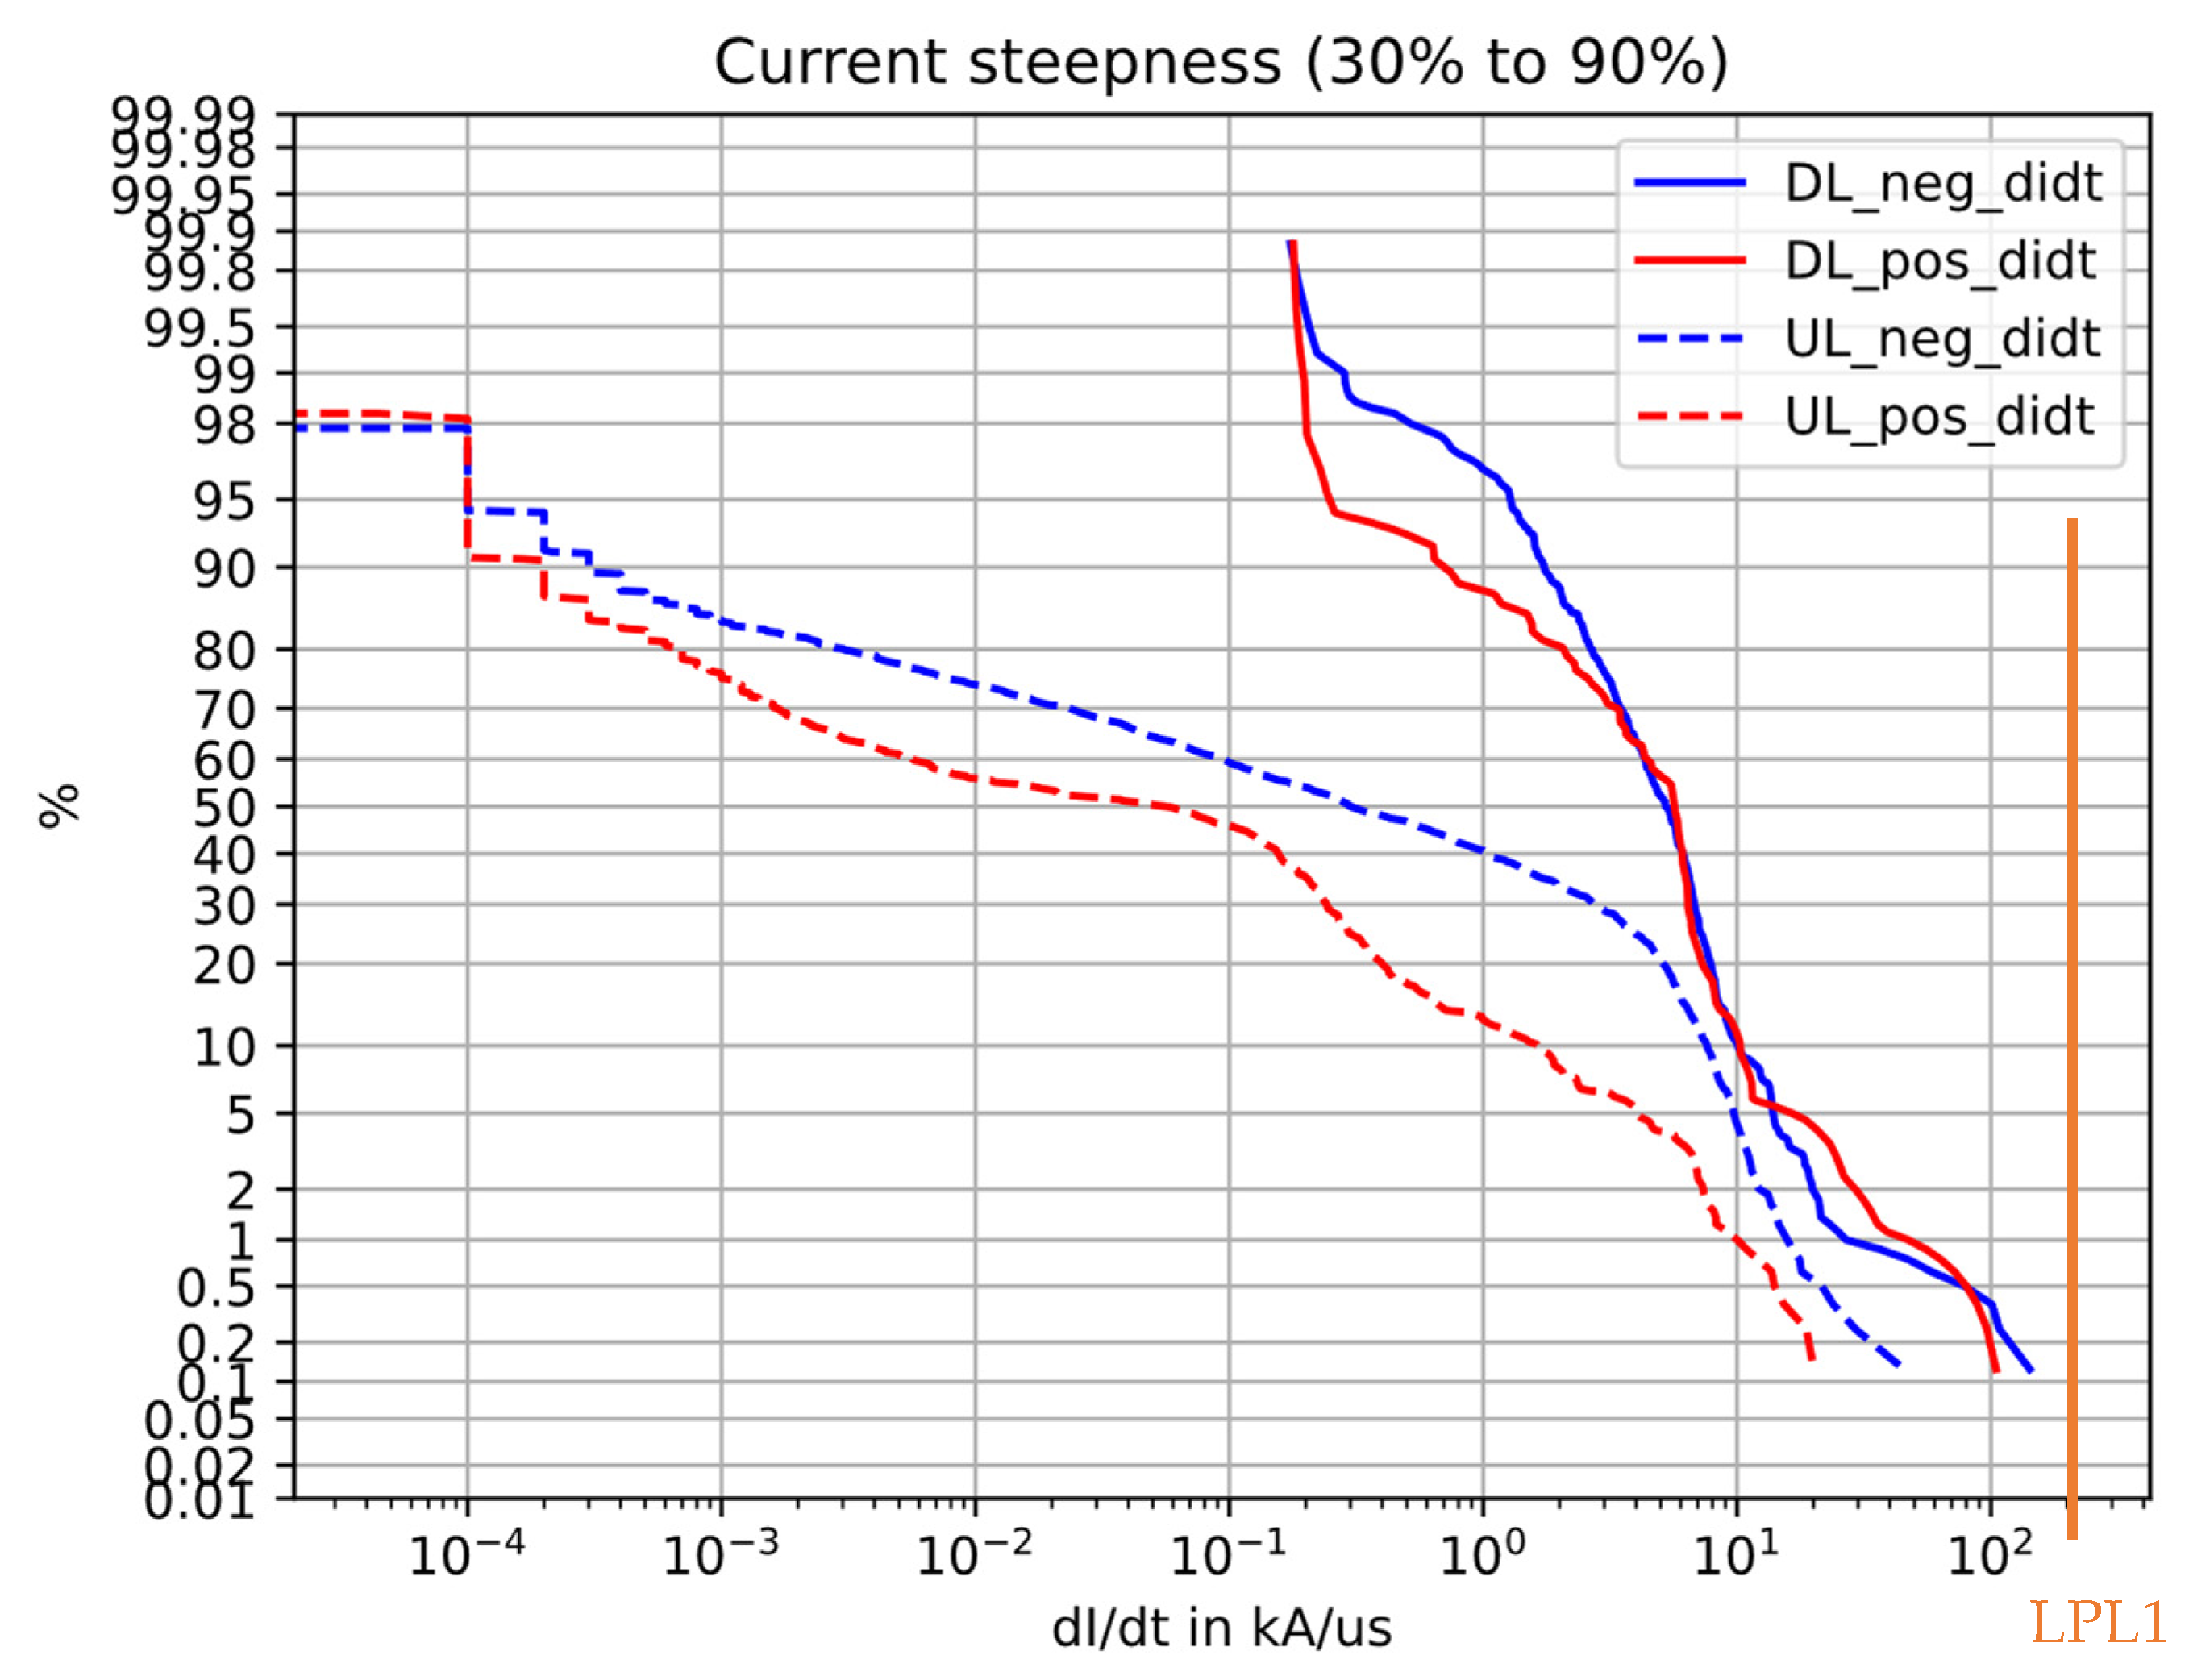
Defining the criterion for the gradient as the slope of the secant between 30% and 90% of the current magnitude, the resulting cumulative distribution is found in
Figure 4.
Figure 4.
Cumulative distribution of current gradient, 30%–90% secant.
Figure 4.
Cumulative distribution of current gradient, 30%–90% secant.
Using the 30–90% criterion for defining the current gradient, it is seen that the highest current gradient measured is approximately 100–150 kA/us, which is lower than the 200 kA/us required for LPL1.
However, reviewing specific waveforms also questions whether the 10–90% criteria, a 30–90% criteria, a pointwise evaluation of the dI/dt, or something else is the smartest way of evaluating current gradient. The data calls for a discussion on how to process and derive meaningful parameters, which is the scope of a future publication on the topic.
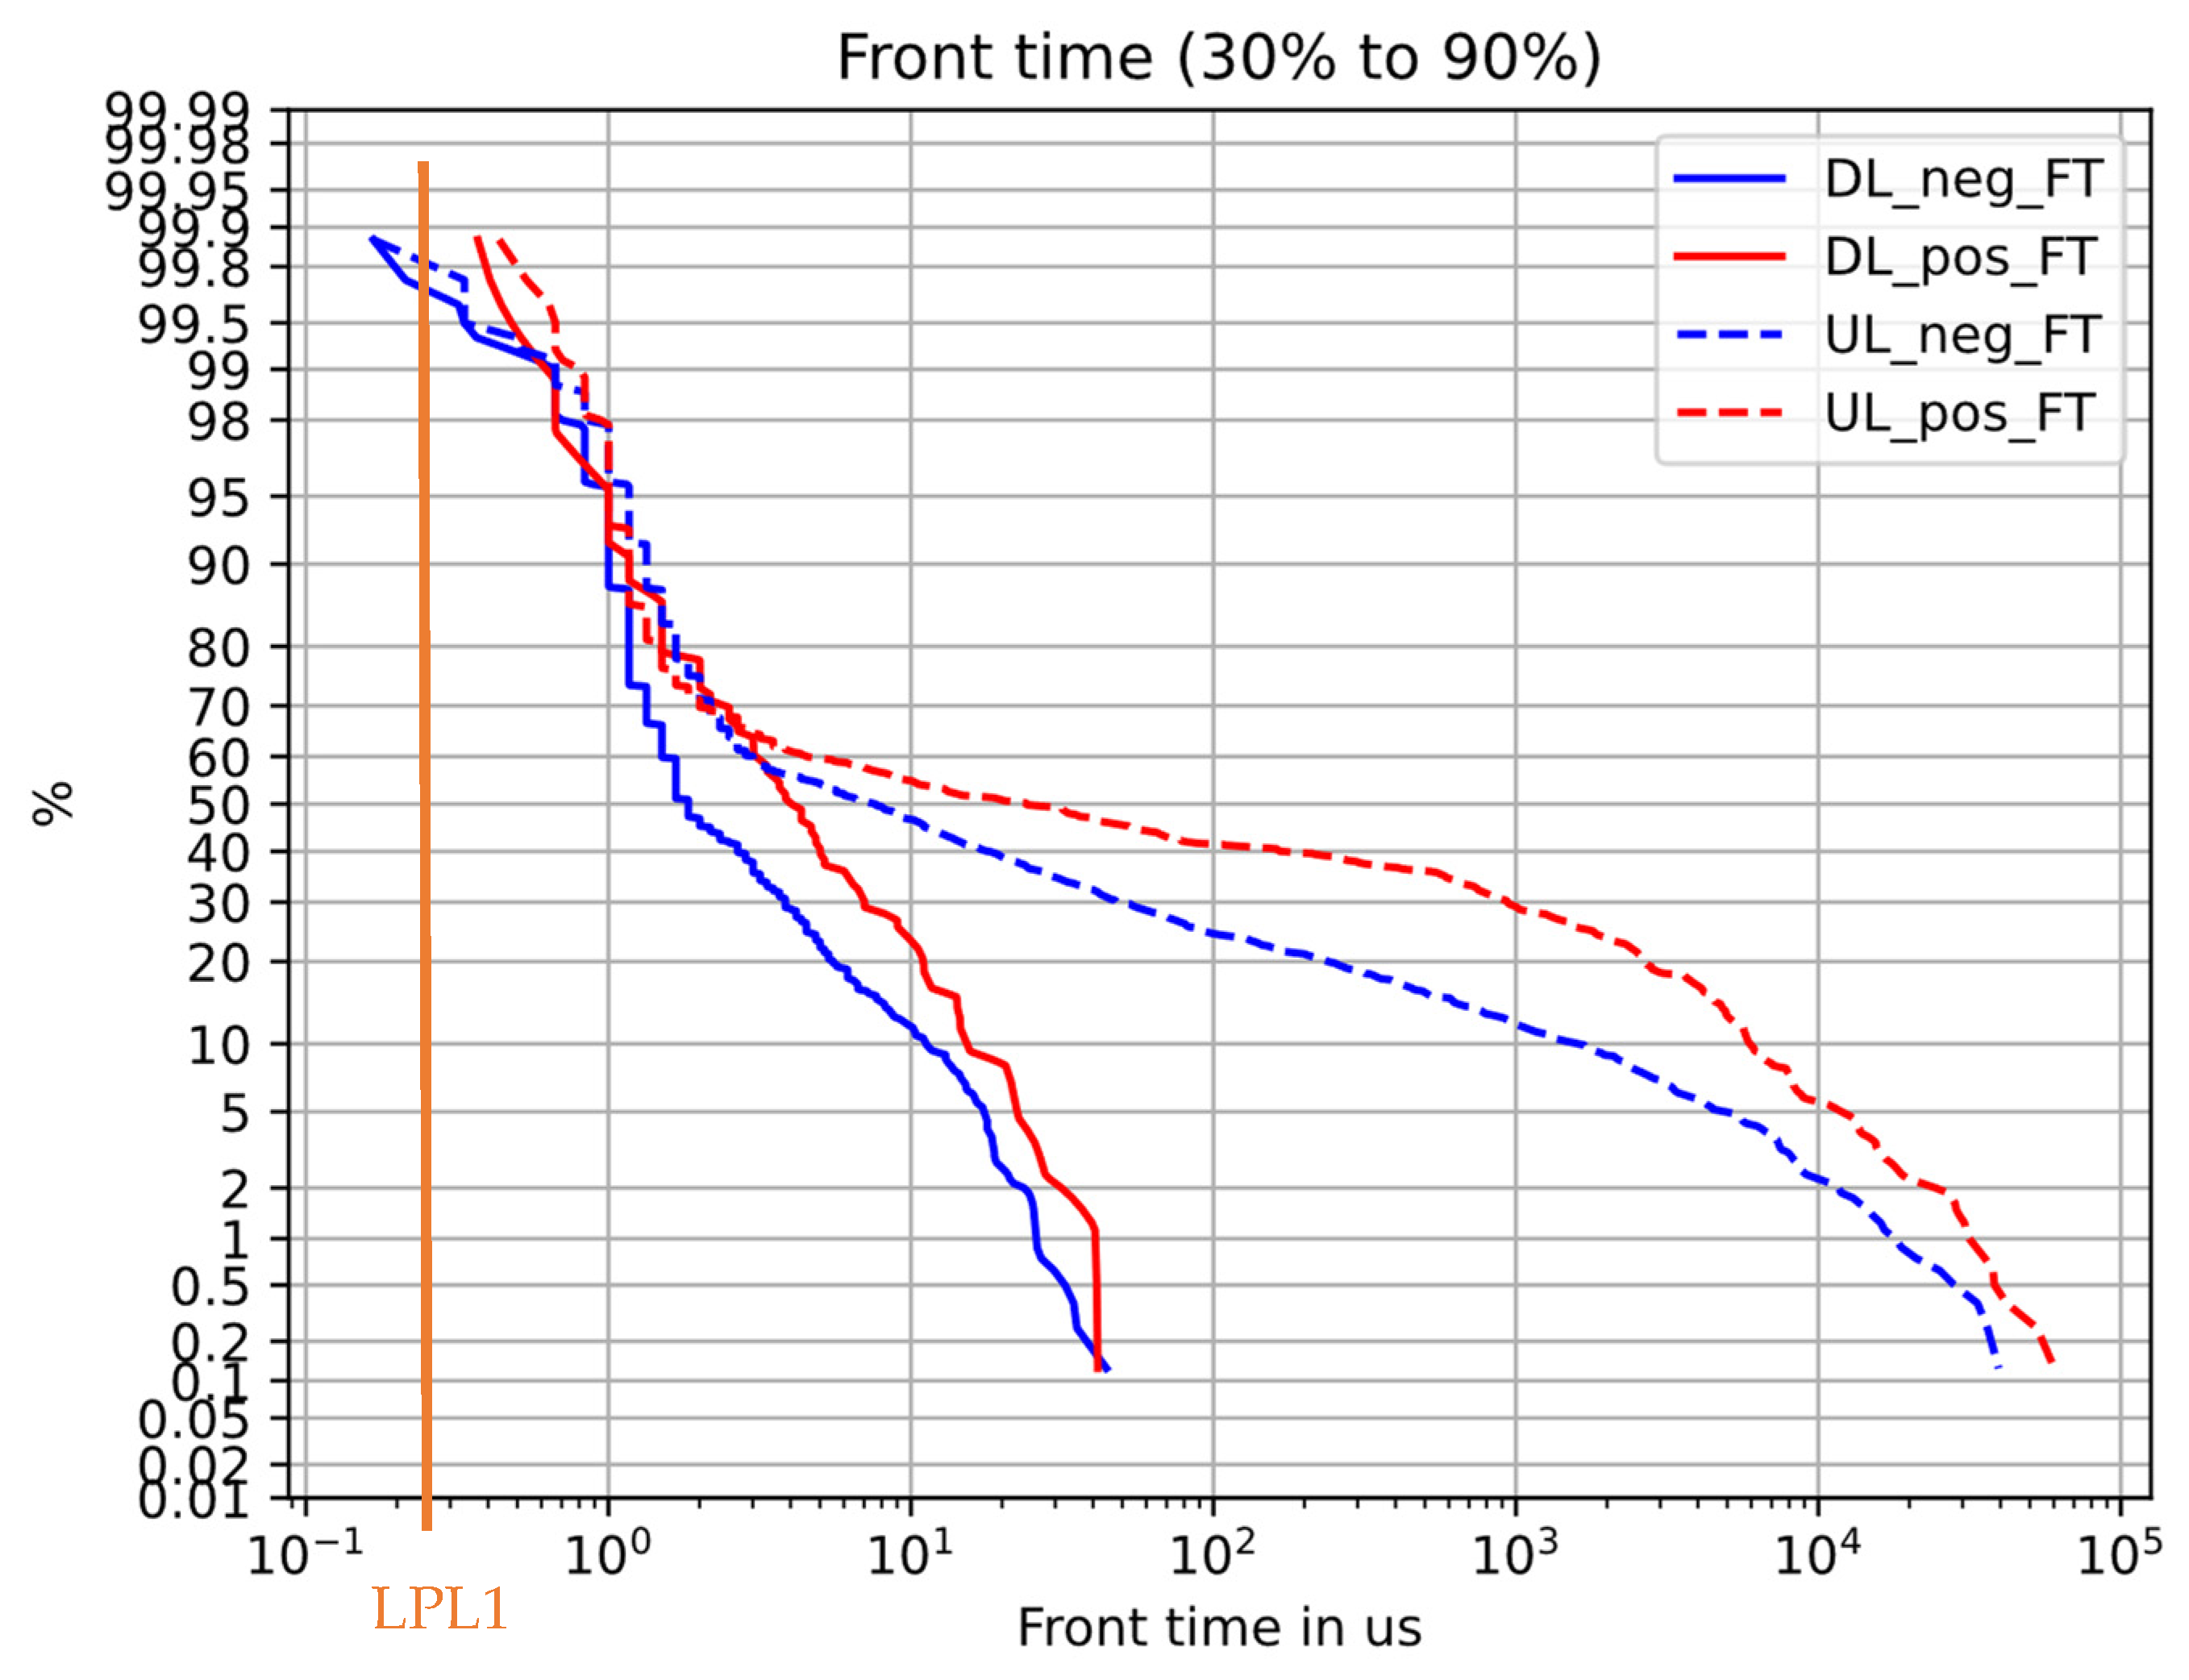
3.5. Front Time
Another parameter describing the steepness of the current is the front time
T1. Opposed to the current gradient, the front time does not contain any information about the peak current. In
Figure 5, the front time is calculated by using the 30% and 90% crossing of the current waveform. Analogous to the IEC 60060-3 High-voltage test techniques, Part 3: Definitions and requirements for on-site testing [
5], the front-time
T1 is calculated as:
where
T90 and
T30 indicate the time when the current crosses the 90% and 30% threshold of the absolute peak current of the stroke.
Figure 5.
Cumulative distribution of front time.
Figure 5.
Cumulative distribution of front time.
3.6. Occurrence vs. Severity
Besides the severity of the events which basically define the threshold test paradigm in the IEC 61400-24, another point to consider is the occurrence. It has been recognised that lightning exposure is a matter of wear on some components, like air terminations, sliding brushes, spark gaps, SPDs etc., hence the number of events occurring at a specific site should be considered when targeting inspection and maintenance cycles.
The occurrence is seen to vary considerably from site to site, such that some onshore sites experience 0.5 strikes per blade per year, while other sites exceed 20 strikes per blade per year. Onshore turbines are accessible, whereas the consequence of lightning damage to offshore turbines increases the cost of repair by several orders of magnitude.
3.7. UW vs. DW Lightning
Another observation is the difference in the UW/DW lightning ratio, traditionally dealt with using the empirical relationship by Eriksson and Meal [
6,
7]. For sites featuring similar turbines, i.e., similar tip height, there is a significant difference in the percentage of UW triggered lightning. It appears to be more linked to the topography of the terrain and the weather variables (cloud base height and −10 deg isotherm [
8])—which is analysed further in a companion publication [
9].
Given the difference in upward and downward lightning parameters illustrated in the previous section, and the difference in the location along the blade of the lightning initiation, the lightning protection design should also take into account the relative distribution of upward and downward strokes.
3.8. General Perception
The general perception of the lightning environment for wind turbines is that more events than traditionally experienced occur, but that the events are less severe. Given the large data set, a few outliers are observed transferring significant amounts of charge and specific energy, but in statistical terms, these are still outliers.
Processing of the large and growing data set on lightning strikes on wind turbines is an ongoing task, in which the criteria for classifying the events, the definitions of rise time and “lightning” in general are important parts. Future publications will aim at a more precise statistical overview than provided in this conference paper.
4. Discussion
Wind turbine blade designs and associated verification measures have been the subject of many discussions since the experience of lightning damage to modern type blades became available in the mid 1990′s [
10]. At that time, it was recommended for long blades (>20 m) to install air terminations at the tip and every 5 m, as a natural extension of the design principles for building LPS.
The recommendations in the standards have changed significantly since then, starting with IEC TR 61400-24 (2002), IEC 61400-24 Ed1 (2010) and the latest IEC 61400-24 Ed2 (2019). Blades have become longer, more complex, wind sites have become more remote, and the costs of blade failures have therefore exploded.
Overall, the scope of any blade design is to acknowledge the lightning exposure and risk, to accept a certain CAPEX, since it is known how an intelligent investment in a proper design and verification process will greatly reduce the OPEX.
Field measurements on blades (strain, acceleration, pressure, etc.) are pushing the boundaries for blade designs every day, since only a proper resolution of the measurements and understanding of the actual environment and boundary conditions will provide the necessary foundation of optimized designs. Lightning measurements are also playing a larger role, and the present paper is an example of the amount and quality of the data that is harvested.
The benefits are obviously largest for those OEMs and operators who understand how to drive the inspection and maintenance cost down based on facts and actionable information, but even the coarse statistics in this paper lead to some conclusions.
4.1. Known Failure Mechanisms
Fundamentally, lightning protection for wind turbine blades is failing either during the attachment process, or during the current conduction phase. Once these failure modes are fully acknowledged, it is possible to investigate the lightning measurements and the features to be considered in future design and verification methods.
4.1.1. Attachment Process
When the lightning air terminations fail in intercepting the lightning strike, an interception failure appears. Here the upward connecting leader is incepted outside the air terminations (typically from internally conducting parts such as the down conductor or CFRP structural components), and the result is a puncture of the blade laminate with damage dependent on the specific energy of the flash.
The attachment process is challenged by downward strikes with low current magnitude, as discussed in the research leading to the blade zoning concept [
11], which is also why the major effort in designing for a proper interception efficiency is done at the blade tip area (outer 5–10 m).
4.1.2. Current Conduction—Specific Energy
The second failure mode concerns the transfer of lightning current through the designated current path, the down conductor, connection components at the down conductor, interfaces to other conductive elements, etc. If the current path is too resistive (limited cross section of conductors, or inadequate means of connecting two conductors) the specific energy of the lightning current will release too much absolute energy, driving a risk of damaging the current path.
Breaking conductors or connection components and ruptured equipotential bonding interfaces to CFRP laminates could be a few examples where an excess of current conducted through limited resistance creates conflicts.
4.1.3. Current Conduction—Differential Voltage
The third failure mode arises when several conductive elements are present within the blade, and when the lightning protection coordination has not controlled the differential voltage distribution properly. As required by the latest version of the standard [
1], it is mandatory for the blade designer to verify and document the blade design performance. By analysis and testing, the designer must demonstrate the use of insulation, separation and equipotential bonding of all conductive elements within the blade, including the LPS. By a decent engineering design effort, even the LPL1 subsequent negative strokes can be managed.
4.1.4. Current Conduction—Arc Root Erosion
The final important effect is regarded as a natural cause of wear, and not a specific failure mode. The strike point of the lightning strike (preferably the air termination) will erode substantial amounts of material from the air termination as the current enters or exits the metal surface. Although it can be shown how different current direction will affect the molten volume differently, the reality—with a blade tip moving 80–100 m/s—makes the polarity effect less important.
However, air terminations will wear out faster if they are exposed to a higher number of strikes transferring a larger accumulated amount of charge. Hence the benefit of measuring accumulated charge transfer and comparing it with test performance from the lightning laboratory is obvious.
4.2. Current Parameters for Lightning Testing
The 200 kA events are even rarer than expected, since only 1% of measured current magnitude exceeds 100 kA, and only a single recording out of 2603 strikes exceeded the LPL1 parameter of 200 kA. It should be discussed whether the current method of ‘threshold testing’ including 3 × 200 kA is relevant, since the magnitude of events is far less, but the number of events appears to be very high. One of the turbines in the data set used in this presentation has seen as many as 66 strikes in less than five months, and the average annual number of strikes per blade per year for that site is exceeding 20.
In 2007, a lifetime exposure of 20 strikes per blade was presented [
12] and used intensively in the following years. It may be that the latest data would call for a revision of that definition of a lifetime test.
Considering the charge transfer, we have seen that 5% of all positive and bipolar UW lightning transfer more than 300C as defined for LPL1, and that 1.5% of UW negative lightning will exceed the 300C. Taking the number of lightning events into consideration, it definitely emphasizes the need for testing with extended charge levels to investigate and document design lifetime, and then monitor the charge transfer on site by lightning monitoring systems.
4.3. Rise Time Definition
IEC specifies how blade designs must be capable of handling first positive strokes, first negative strokes and subsequent strokes, defined by the magnitude for the different lightning protection levels and the three different current gradients.
The mathematical expressions and the key data from which the standardised current components are designed are of course chosen to enable analytical assessment of LPS performance, whereas the reality reveals a more scattered landscape of combined magnitudes and gradients.
In this respect, it is important to acknowledge the combination of peak current and gradient and which criteria to use in deriving the gradient should be discussed. Eventually, the entire waveform containing information on current magnitude and gradient should be injected into blade models, both in design phases, but also in the real time evaluation using lightning CMS, where an actual lightning measurement is injected into a numerical model of the blade electrical components. The results of this digital twin analysis will then suggest the actions which need to be taken—during and after every single lightning event.
4.4. Relative Distance to Cloud Base
The work conducted on correlating lightning measurements in turbines with actual weather conditions on site [
8] has revealed that the likelihood of upward lightning depends not only on structure height but on the relative distance between the turbine and the cloud base.
Such information should lead to the revision of the ratio of UW and DW lighting for a particular installation and is hence beneficial as a means of calibrating the pre site erection risk assessments.
The skilled operator would similarly start to optimise turbine inspection and maintenance schemes, not only by which turbines have been struck during specific thunderstorms, but in advance by processing weather forecasts.
If a low hanging storm during the cold season is approaching a site, it is known to result in upward lightning from predominantly the first turbines met by the storm front. This is observed by operators of offshore and onshore wind farms. If the altitude of the cloud base height is larger during the warm season, the lightning distribution among the turbines will be more evenly distributed, even in mountainous regions with turbines at different altitudes.
4.5. Onshore vs. Offshore Blade Design
Onshore and offshore blade designs should not be remarkably different since they are certified to operate in the same lightning environment. The only difference is the ease and cost of access during maintenance and repair, and this is where different principles of blade operation could be considered.
Most OEMs claim that it would be too costly to design and maintain two LPS designs for the same blade, so the optimal solution is a single strong and verified design and a graduated inspection interval based on measurements and accumulated lightning exposure.
5. Standardisation
The IEC 61400-24 Ed2 [
1] was issued in July 2019, building upon the successful use of the Ed1 from 2010. Guidelines and best practices were improved, the use of lightning monitoring systems as an active means to target inspection and maintenance were proposed, and the lightning verification testing was made mandatory.
All in all, the Ed2 has experienced being a stronger and more mature standard than its predecessor, but still some areas need further improvements. One of the weaknesses is that the lighting environment still relies on the lightning current components derived from the original Berger’s data [
3], and hence describes a similar lightning environment as the building lightning protection series [
2]. Secondly, the concept of lightning protection levels (LPL I-IV) has been directly inherited, although all modern turbines are default designed and verified with respect to LPL I
Fundamentally, it calls for a discussion on whether 200 m tall structures installed at remote locations, featuring a rotating wingspan of 200 m, will in fact produce a different lightning environment than buildings on flat terrain, and hence whether we should consider defining a special environment for turbines. The discussion will rely on qualified lightning measurements, which is also why the MT24 has joined to initially specify the necessary parameters of a functional lightning measurement system.
Following the amendment of Annex L on lightning measurement systems, MT24 will start the formal process of reviewing the Ed2 of the standard towards a discussion on necessary updates in Ed3.
Reviewing the data presented in this paper, some initial conclusions can be drawn which may impact the standardization. Peak current and front time values of lightning events are in line with values presented in current standards. The highest average current steepness tends to be lower by approximately 25%, resulting in a potential reduction in the value from 200 kA/us to 150 kA/us. The maximum specific energy and charge values appear to be larger than previously reported with values occasionally exceeding 1000C and 30 MJ/Ohm. Certainly, the frequency of attachment and accumulated charge transfer on single turbines will also need to be assessed in order to decide on lifetime exposure of lightning currents.
6. Conclusions
Lightning monitoring systems for wind turbines have matured significantly recently, such that the quality of the measurements can actually be used for assessing the blade conditions after a strike. Secondly, since the industry is willing to share the lightning data under specific circumstances, there is great opportunity to learn as an industry and to update international standards and guidelines on LPS designs.
The coarse analysis of 2603 strikes shows how turbines are affected very differently depending on the site at which they are installed, and that the exposure to some extent can be foreseen by a thorough weather analysis [
9]. The sites are remarkably different in the type of strikes the turbines observe (UW/DW), the magnitude, seasonal variations, and how many strikes they experience. For onshore sites, the lightning exposure can vary from less than 0.5 strike per blade per year, to more than 30 strikes per blade per year.
The observations lead to the following recommendations on the use of lightning data and considerations of the blade design process:
- -
The definition of ‘lightning’ is ever important, since proper LMS can detect electrical events with magnitude down to a few hundreds of Amperes. Some of these events are considered aborted leaders, some are clearly induced current by nearby lightning, and yet some are classic low magnitude lightning strikes. Are these events to be categorized as ‘lightning’ or just ‘electrical activity’ on blades?
- -
Consider revising the lifetime exposure test previously suggested [
12]. Some turbines see many strikes, and the principle of measuring field exposure and correlating with test performance is still largely recommended [
1].
- -
The impact and likelihood of large charge transfer must be further evaluated, to assess whether it should be included as a standard test, and not just for winter lightning prone areas as suggested by IEC [
1]
- -
Revisit the definition of rise time and its use, since the current application of risetime for design verification is too simple. The quality of lightning measurements, the level of details of electromagnetic blade models, and the real time modelling capability, calls for a more thorough assessment of strike consequence using the actual lightning waveforms.
- -
Improve risk assessment tools and implement recent knowledge of weather variables such as cloud base height vs. lightning exposure. This information can lead to a revision of fundamental analytical design principles, and aid in the further understanding of lighting exposure for specific sites. For example, combining the measured LKDS database with readily available meteorological or satellite data may lead to novel warning methods or risk maps which could indicate high risk areas with special lightning protection requirements. A calibration of any risk assessment tool using actual on-site measurements will improve the validity and accuracy of such models.
The growing population of recorded lightning events to turbines is a target for a more thorough analysis in future publications, and the MT24 team within IEC TC88 would welcome any source of quality lightning data added to the database.


