Article

Early Wildfire Smoke Detection Using Different YOLO Models

1
Computer Science Department, Faculty of Information Technology, Zarqa University, Zarqa 13110, Jordan
2
Department of Information Security, Faculty of Information Technology, University of Petra, Amman 11196, Jordan
3
College of Computing and Information Technology, Shaqra University, Riyadh 11911, Saudi Arabia
4
Department of Business Intelligence and Data Analytics, University of Petra, Amman 11196, Jordan
5
Faculty of IT, Kingdom University, Riffa 40434, Bahrain
6
Artificial Intelligence and Sensing Technologies (AIST), University of Tabuk, Tabuk 71491, Saudi Arabia
7
Faculty of Computers & Information Technology, University of Tabuk, Tabuk 71491, Saudi Arabia
*
Author to whom correspondence should be addressed.
Machines 2023, 11(2), 246; https://doi.org/10.3390/machines11020246
Submission received: 22 January 2023 / Revised: 4 February 2023 / Accepted: 5 February 2023 / Published: 7 February 2023
(This article belongs to the Special Issue Recent Trends and Interdisciplinary Applications of AI & Robotics)

Abstract

:
Forest fires are a serious ecological concern, and smoke is an early warning indicator. Early smoke images barely capture a tiny portion of the total smoke. Because of the irregular nature of smoke’s dispersion and the dynamic nature of the surrounding environment, smoke identification is complicated by minor pixel-based traits. This study presents a new framework that decreases the sensitivity of various YOLO detection models. Additionally, we compare the detection performance and speed of different YOLO models such as YOLOv3, YOLOv5, and YOLOv7 with prior ones such as Fast R-CNN and Faster R-CNN. Moreover, we follow the use of a collected dataset that describes three distinct detection areas, namely close, medium, and far distance, to identify the detection model’s ability to recognize smoke targets correctly. Our model outperforms the gold-standard detection method on a multi-oriented dataset for detecting forest smoke by an mAP accuracy of 96.8% at an IoU of 0.5 using YOLOv5x. Additionally, the findings of the study show an extensive improvement in detection accuracy using several data-augmentation techniques. Moreover, YOLOv7 outperforms YOLOv3 with an mAP accuracy of 95%, compared to 94.8% using an SGD optimizer. Extensive research shows that the suggested method achieves significantly better results than the most advanced object-detection algorithms when used on smoke datasets from wildfires, while maintaining a satisfactory performance level in challenging environmental conditions.

1. Introduction

We must protect forests to keep the planet healthy. Forest fires are uncontrollable disasters. Forest fires have increased in frequency and damage. Forest fires destroy millions of acres of forest and cause a cascade of environmental disasters, including global warming, costing governments USD tens of billions [1]. Forest fires harm the ecosystem and threaten human lives and progress [2]. Forest fires spread swiftly and randomly. Forest fires can develop swiftly without early warning, endangering the environment, and firefighters [3]. Smoking debris starts forest fires. Smoke precedes forest fires. Smoke detection early and accurately reduces forest firefighting response times and damage.
Forest-fire smoke-detection procedures need urgent improvements. One smoke puff from a forest fire’s smoke angle indicates the wind direction and the fire’s origin. Horizontal detection boxes missed details and were not accurate, mistaking non-smoke for smoke. In the dynamic, ever-changing forest, smoke-like phenomena such as shifting clouds and fog are widespread. These occurrences are similar to smoke, making standard feature extraction networks difficult to differentiate. Smoke is too far away to see. When the burning point is far from the camera, the detection box’s confidence drops, filtering out smoke and making smoke detection harder.
L Tian et al.’s [4] smoke tilt detection system uses an image augmentation module and a dense feature-reuse module to handle distant sensing objects’ densely ordered properties. W. Huang et al. [5] suggested a cross-scale feature-fusion pyramid network and a multioriented detection box for remote sensing tilted ships. The remote sensing scene’s multioriented detection strategy was encouraging, and the multioriented detection box captured smoke drifting in the wind well. Thus, we propose a multioriented detection method where the target box adaptively describes smoke direction and is used to determine the fire source direction. The forest-fire multioriented detection dataset uses PolyIOU to evaluate anchor box overlap as an adaptation to multioriented detection.
Delayed wildfire identification and suppression can cause severe forest damage. Forest monitoring systems must promptly and correctly detect fire and smoke. Early fire-monitoring systems focused on flame detection. Smoke detection is better than fire detection in forest monitoring systems because fires develop slowly and are hard to detect early. Thus, smoke-based security monitoring systems outperform fire-based ones. Thus, forest-fire monitoring algorithms are better at smoke detection than fire detection [4].
Sensor-based smoke detectors detect particulate particles from smoke ionization. A sensor-based smoke detector cannot be used in woodlands due to their size and geography [5]. Therefore, numerous computer vision-based smoke-detection algorithm efforts have addressed this issue.
Early smoke detectors could not locate smoke and firefighting devices can deliver more precise signals if smoke is confined. Thus, precise smoke localization has become a computer vision task in recent years and smoke detectors are the focus of this article. Most early vision-based smoke detectors used inference techniques with simple feature representations [4,6]
These methods show smoke’s hue, velocity, opacity, and orientation graphically. Due to the lack of feature representation-based procedures for characterizing smoke motion and exterior morphology, conventional smoke-detection algorithms perform poorly when the running environment changes [2]. Thus, smoke-detection algorithms can improve generality and interference suppression.
Some forest objects resemble smoke, rendering the model open to misinterpretation under typical settings. Smoke contains distinct visual properties at different combustion phases, making it hard for detection models to acquire high-dimensional features adaptable to different stages. A reliable wildfire smoke-detection technology should be able to locate smoke sources. 
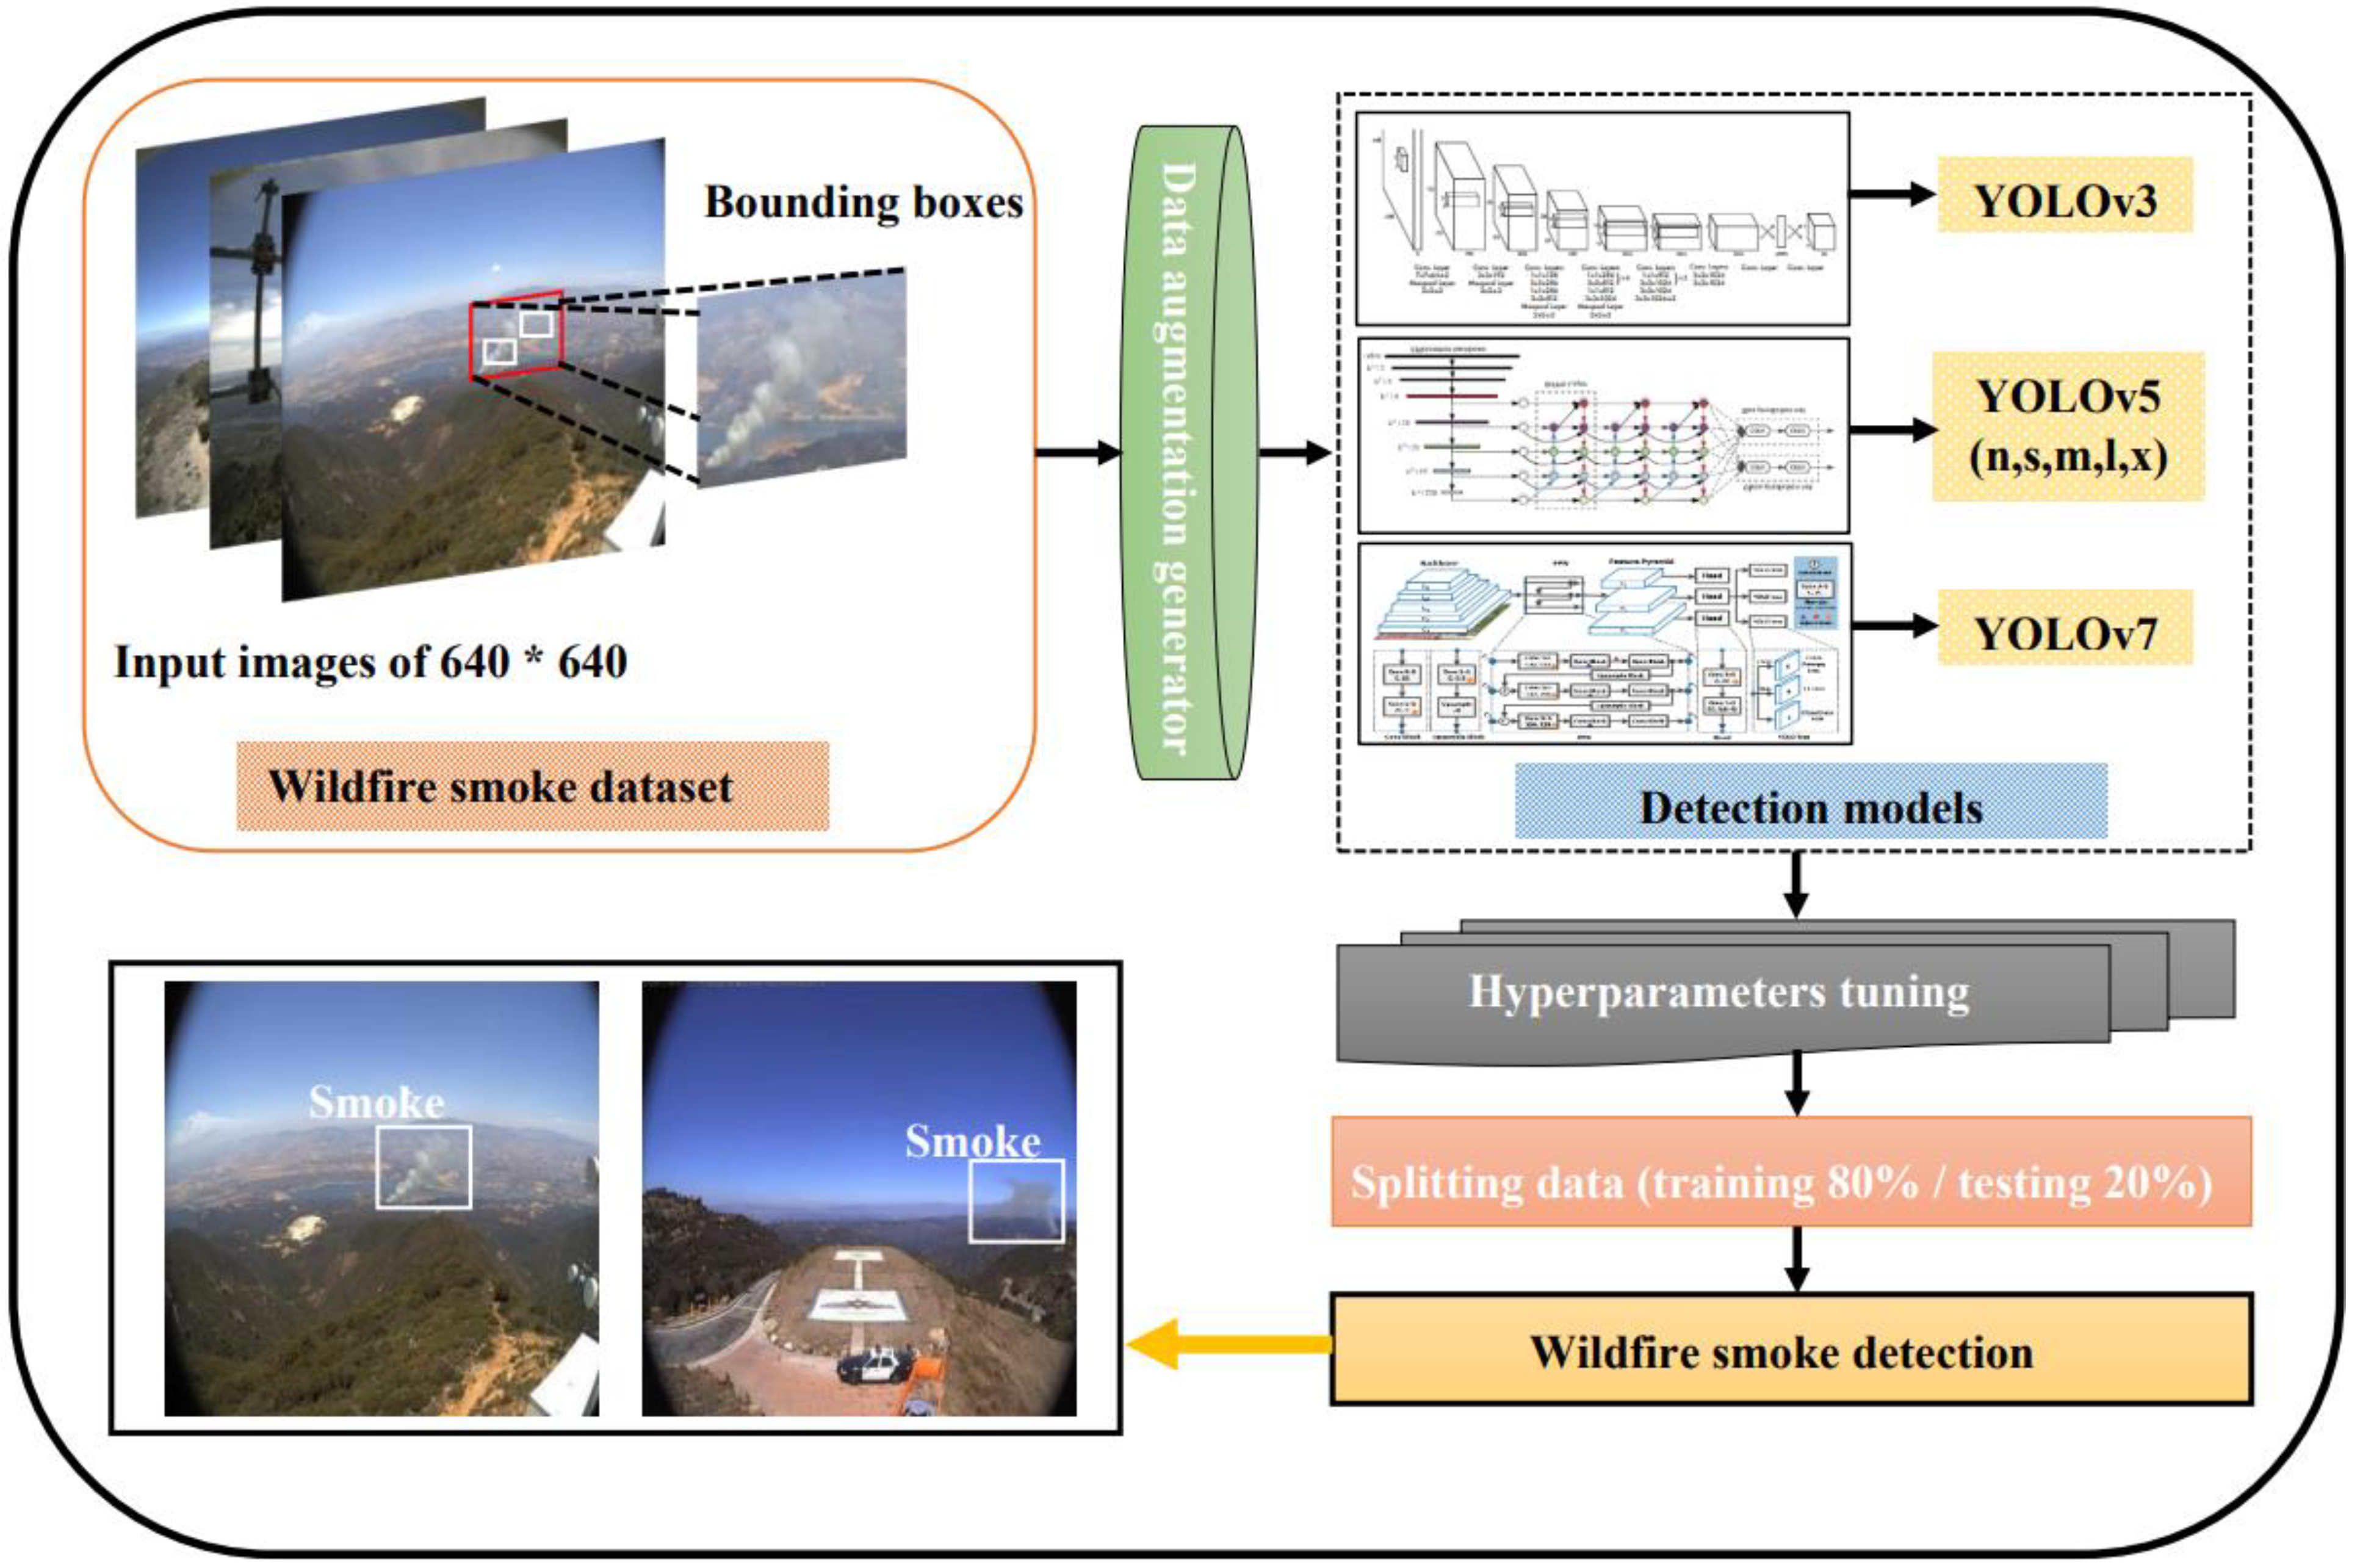
Figure 1 shows a general wildfire smoke-detection operation using deep learning.
The key contributions are as follows: (1) Comparing the performance and detection accuracy of different YOLO models, such as YOLOv3, YOLOv5n, YOLOv5s, YOLOv5m, YOLOv5l, YOLOv5x, and YOLOv7, for wildfire smoke detection from different detection ranges; (2) Using several data-augmentation techniques to reduce the sensitivity of detection models; (3) Comparing YOLO models with other detection models such as Fast R-CNN, Faster R-CNN, and YOLOv4; (4) Improving performance and shortening detection times using the stochastic gradient descent optimizer.
The rest of the paper is organized as follows: Section 2 shows the state-of-the-art related works in the area. Section 3 illustrates the proposed wildfire smoke-detection methodology, data gathered, used detection models, and data-augmentation techniques. Section 4 shows the evaluation metrics used for detection model assessment. Moreover, Section 5 discusses the experimental results, shows the hyperparameter tuning process, and simulation device setup. Lastly, Section 6 concludes the study and suggests future directions.

2. Review of Related State-of-the-Art Works

In the event that there is a forest fire in an area, massive plumes of smoke will be sent into the atmosphere. A smoke alarm that is in good working order is essential for avoiding loss in the case of a fire. If they are not located and contained in a timely manner, rapidly spreading wildfires, which are made worse by climate change, have the potential to have far-reaching repercussions on human populations, ecosystems, and the economy. Two different methods may be used to monitor wildfires to detect smoke and flames. The presence of smoke is the primary indicator of a wildfire nearby. Consequently, an early warning and detection system for wildfires, such as deep-learning models, have to be sensitive to the smoke in the environment in which it operates. However, with the development of technology, previous studies presented many modern methods that can be used to detect smoke and fires in light of the availability of many processed data. Swin-YOLOv5, a novel framework that enhances feature extraction in the original YOLOv5 architecture, was suggested in [7].
The designed framework can detect fire and smoke to a satisfactory degree. The notion of Swin-fundamental YOLOv5 is to employ a transformer across three headers. A dataset of 16,503 photos from two target classes was used for comparative reasons. Additionally, seven hyperparameters were modified. According to the statistics, Swin-YOLOv5 beat the original with a 0.7% mean average accuracy improvement at an IOU of 0.5 and a 4.5% mean average precision improvement for an IOU of 0.5 to 0.95.
In [8], an improved version of YOLOv5, including dynamic anchor learning using the K-means++ algorithm, was produced. The suggested strategy aimed to reduce fire damage by enhancing detection speed and performance. In addition, loss functions including CIOU and GIOU were applied to three separate YOLOv5 models: YOLOv5 small, YOLOv5 medium, and YOLOv5 big. A self-created dataset of 4815 photos was subjected to a synthetic system to raise the number of images to 20,000. According to the results, the improved model beat the original YOLOv5 by 4.4% in mean average accuracy. In addition, it was revealed that YOLOv5 performs better when utilizing the CIoU loss function, with a recall of 78% and an average mean accuracy of 87%.
The study in [9] presented a novel approach for identifying flames using aerial images. The equivalent of 6000 photographs illustrating forest fires and smoke were gathered from Kaggle and Google libraries. Furthermore, the developed technique intended to employ the YOLOv5 model with the K-means++ algorithm to find the anchor squares. To improve detection accuracy, procedures such as rotation and flipping were developed, reducing the sensitivity of detection models in future detection operations. The assessment criteria application demonstrated that the provided technique beat several other methods, such as upleNet and SSD, with an average accuracy of 73.6%. However, it is worth mentioning that the described technique has several drawbacks, such as misclassifying clouds as smoke from flames. In [6], the researchers highlighted the issue of a lack of sufficient and high-quality data for detecting fires and smoke in research archives. One of the most serious issues is a shortage of labeled data suitable for development and utilization. As a result, a novel approach was given to create NEMO (Nevada Smoke Detection Benchmark), a first-of-its-kind data repository that comprises a set of aerial pictures gathered from detection stations to identify forest fires. NEMO provides data sets with 7023 fire detection photos taken using many cameras at various times and places. Various detection models were utilized to evaluate the data, including Faster R-CNN and RetinaNet. The results revealed an average detection accuracy of 42.3% and a detection rate of 98.4% within 5 min. It is worth mentioning that NEMO was designed for photographs of various sizes, including horizontal, distant, and medium.
In [2], a novel framework was presented to identify forest fires using ensemble learning. In the first layer, the suggested technique employs Yolov5 and EfficientDet as the primary learners, followed by the introduction of EfficientNet, which is in charge of detection and classification based on publicly available data. Furthermore, a collection of 10,581 images was compiled from well-known datasets such as FD-dataset and VisiFire. When compared to other models such as the Yolov4, the findings revealed an improvement in fire detection accuracy, with an average precision of 79.7% at an intersection over the union of 50%. However, several of the study’s constraints suggest that the suggested model defines the sun as a fire at sunset.
Other studies focused on using detection models to develop special methods for detecting and classifying internal and external objects that can be developed and used to detect fires and smoke. In [10], a novel framework for recognizing interior occupancy objects was introduced. The proposed framework maximizes using YOLOv5 by using the anchor-free method for parameter reduction and VariFocal loss for data balancing. In addition, a newly constructed dataset including 11,367 samples was provided, which was separated into training, testing, and validation sets. In addition, Pascal-VOC2012, a well-known dataset, was used throughout the experiment. As part of the YOLOv5 upgrade, the head’s layer was decoupled to improve detection precision and performance. A 640-by-640 pixel resolution is also employed. Eleven prior models using YOLO in various forms were compared with the new framework’s outcomes. The test results determined the model’s average accuracy of 93.9 at an intersection over union (IOU) of 0.9.
In the study in [3], a real-time experiment was carried out to recognize inside and outside things by building an engineering system that uses camera sensors such as OS1-64 and OS0-128 that are used in the Lidar gadget. On the other hand, the primary contribution was made using complete 360-degree images with a resolution of 2048 x 128. In the developed system, the performance of FasterR-CNN, MaskRCNN, YOLOx, and YOLOv5 was compared. Sensor pictures identified four target kinds for indoor and outdoor applications, including a person, bicycle, chair, and automobile. YOLOx outperformed the competition, detecting over 80% of indoor and outdoor items with 100% accuracy and 95.3% recall. Furthermore, they claimed that YOLOx exceeds YOLOv5 in detection performance and speed.
The study in [4] presented a novel approach based on the enhanced YOLOv3 model, to detect fires in the day and night with the least amount of time and the broadest detection area feasible. Furthermore, the research highlighted the lack of high-quality data to identify fires. As a result, a data collection of 9200 photos was gathered and built from Google repositories and remotely accessible resources, in addition to gathering a collection of photos derived from video clips. Moreover, data-augmentation methods such as image rotation were used to make new copies of current data and enhance the size of the data set. Furthermore, the given technique was based on employing a unique collection of cameras coupled to the YOLOv3 model for real-time fire detection. Compared to other detection methods, the experimental investigation yielded an average accuracy of 98.9. The identification of certain factors on flames that are not truly fire, such as strong light and high-beam lamp light, is a hindrance to the research.
Other studies revealed techniques for detecting objects using satellites, which is one of the fire-detection stations used in conjunction with video cameras and drones. As a result, these technologies may be utilized and refined to identify large-area fires. A technique for locating suitable landing spots for unmanned aerial vehicles was presented in [5]. The established framework compared the effectiveness of several YOLO versions, including YOLOv3, YOLOv4, and YOLOv5, in pinpointing optimal landing locations to reduce flying system failure and increase safety. Yet, the DOTA, a database of 11,268 satellite photos with a maximum image resolution of 20,000 by 20,000 pixels and a total of 15 labels, was used. With a 70% accuracy rate, a 61% recall rate, and a 63% mean average accuracy rate, the results show that YOLOv5 with big network weights performs better than its competitors.
On top of that, YOLOv4 outperforms YOLOv3 with a recall of 57% and an average accuracy of 60%. In addition, additional research has shown the capability and efficacy of YOLO models in detecting illnesses such as cancer by image processing. The research in [11] suggested a different approach to enhancing YOLOv5′s capacity to detect breast cancer. All four YOLOv5 weight models (small, medium, big, and extra-large) were evaluated for their usefulness in the context of this study. Furthermore, 10,239 unique 1000 × 2000-pixel photos from the CBIS-DDSM collection were used. It indicated whether or not the breast cancer was malignant. The results of the tests showed that modified YOLOv5x is superior to the small, medium, and big weights, with an MCC of 93.6%. In addition, competing models such as YOLOv3 and quicker RCNN were compared to the anticipated YOLOv5m upgrade. With an accuracy of 96.5% and mAP of 96%, it was shown that modified YOLOv5m beat YOLOv3 and faster RCNN. Table 1 summarizes the state-of-the-art related works.

3. Proposed Wildfire Smoke-Detection Methodology

The next sections go through the methodology presented for detecting forest fire smoke, the data set utilized, the methods used to analyze it, and the detection models employed. In this paper, we aim to find the best detection models for fire detection in the smallest amount of time and with the ability to detect from various detection areas such as close, medium, and distant. Figure 2 shows a flowchart of the proposed framework. The designed methodology has the potential to reduce the sensitivity of detection models using prospective data by combining data-augmentation methods. Data augmentation and approaches such as cropping, resizing, and modifying the colors of photos were utilized to triple the number of training samples in the data set. In addition, to improve detection stability, we reserved 20% of the data for evaluating and testing detection findings. In addition, we applied a comprehensive, reusable technique to any dataset other than those specified for usage. In terms of adjusting the parameters of the detection models, we employed the stochastic gradient descent (SGD) optimizer to lower detection time while also adjusting the rest of the fundamental parameters of the detection processes. Comparing detection models is vital, particularly in light of the release of certain current models such as YOLOv7, but it is insufficient to search for the best models. As a result, this work aims to compare recent detection methods to other models such as Fast R-CNN, Faster R-CNN, and YOLOv4 using the same dataset utilized by prior contributions. The designed approach may be used to monitor warning signals in the case of a fire breakout by connecting them with detection models utilizing detection stations such as video cameras and drones, in addition to the early identification of fires by smoke detection.

3.1. Dataset Collection and Processing

The detection areas and their surroundings in meters must be considered to create accurate models with the highest performance for forest-fire smoke detection. Where distant locations are prone to erroneous detection, such as detecting the sun at sunset or detecting a particularly brilliant light and mistaking it for forest fires, must also be considered as it results in false alarms. As a result, in this work, we used an online accessible data set obtained from Kaggle archives, which describes 737 distinct photos with varying placements and detecting zones such as close, medium, and distant. The dataset is publicly available at https://www.kaggle.com/datasets/ahemateja19bec1025/wildfiresmokedataset. The dataset was accessed online on 19 December 2022. However, we discovered that the amount of data was inadequate to obtain reliable detection results. As a result, we used data-augmentation methods such as picture cropping and grayscale to increase the number of training samples in the data, while decreasing the sensitivity of detection models to future data and maintaining a consistent level of accuracy. Data-augmentation strategies create new copies of the original data set differently, resulting in new training components. As a result, the data-augmentation process entailed making a new copy of the data set and increasing the number of training items from the new photos by three times, bringing the total number of images to 1723. Additionally, all images were resized to 640 × 640 to accelerate detection. Figure 3 shows a selection of samples from the data set and the additional items resulting from the data-augmentation processes. In addition, 20% of the data was saved as new data to test detection models. Table 2 contains a description of the dataset. Moreover, data analysis shows that the dataset was free from missing labels.

3.2. Detection Models

3.2.1. YOLOv3

The third iteration of the idea developed by Joseph Redmon and Ali Farhadi [12] was published in 2018: YOLOv3. The updated version has a 22 ms inference time and an average mean accuracy of 28.2 percent. Dimension clusters are used to handle the problem of anticipating ground-truth bounding bounds for anchor boxes. Unfortunately, the performance of YOLOv3 is so poor that it employs logistic regression rather than softmax to minimize the confidence score (the network classification layer). The greater the confidence level, the more probable it is that the item in question may be found in that specific grid cell. It employs darknet-53, a more convolutional foundation layer than YOLOv5. YOLOv5 employs a route aggregation network to extract features at the neck layer. Redmon discovered that the YOLOv3 detection model outperforms both the YOLOv2 and single-shot detector models in terms of effectiveness and speed (SSD). Even today, YOLOv3 may be used as a reliable detection model in several applications. Magnuska et al. [13] used YOLOv3 to detect malignancies in breast cancer patients. When the intersection over union performance measurements were compared, the findings showed that YOLOv3 outperforms Viola–Jones. Furthermore, further variants, such as tiny-YOLOv3, were derived from YOLOv3. In their experiment, Yi Zhang et al. [14] advised employing a K-means cluster to enhance tiny-YOLOv3 pedestrian identification.

3.2.2. YOLOv5

It was initially planned to release YOLOv5 [15] in May 2020. It is a way to find items in many photographs simultaneously. Figure 4 displays the three layers comprising the backbone, neck, and head. All of the layers are conventional network designs. The backbone layer is first used to extract crucial and recognizable information from incoming pictures. In this YOLO variation, the cross-stage partial network CSPNet is employed as the basic learner in the foundation layer for feature extraction. Second, the feature pyramids created above the neck layer aid in identifying the same objects in varied sizes and places. YOLOv5 also uses a route aggregation network to generate a features pyramid (PANet). Lastly, the YOLO layer (or “head layer”) is used for object detection and prediction. A vector is created with probability and bounding boxes for the supplied class. Bounding boxes offer object coordinates in terms of x, y, height, and width. This layer improves detection accuracy and performance by estimating the area of overlapping boxes. Then, calculating the intersection over union (IoU) makes it feasible to discover which overlapping boxes have the best limits [16]. We chose YOLOv5 for this study due of its high throughput, low latency, and great accuracy. However, the following are some key differences between YOLOv5 and its predecessors: (1) the network’s basic technology is CSPDarknet53, and the PANet is employed in the neck layer. (2) It employs cross-loss functions that are both logistic and binary. (3) It can discriminate between local and distant objects within the same input image.

3.2.3. YOLOv7

YOLOv7, designed by Chien-Yao Wang et al. [17], was released in July 2022. In terms of speed and accuracy, the YOLOv7 version is a substantial advance over its predecessors. The average accuracy for real-time item identification, in particular, is between 51.4% and 56.8%. The architecture of YOLOv7, in addition, is based on the original YOLOv4 and scaled versions of that notion. Figure 5 depicts the YOLOv7 architecture.
The foundation layer of the system is an implementation of the unique extended efficient layer aggregation network (E-ELAN). The E-ELAN was developed to answer the requirement for a faster and more accurate detection system. In contrast to previous networks, such as the first iteration of the ELAN and the CSPVoVNet, the E-ELAN adds three extra components to the training layer. These portions are known as shuffle, merge, and expand. YOLOv7′s basic premise is to enhance detection accuracy and performance while simultaneously minimizing the number of parameters and processing required. However, when it comes to the detecting layer, YOLOv7 employs not one, but two heads: the lead head and the auxiliary head. Because of their interaction, these two layers give a more detailed portrayal of the data’s correlation and distribution. Trials conducted by the authors reveal that YOLOv7 beats rival models such as the modest YOLOv4, YOLOv4, and YOLOR. The present version of YOLOv7 has been validated for use in the diagnosis of a spectrum of disorders and illnesses. Bayram et al. [18] discovered that YOLOv7 had the highest mean average accuracy of 85% at an IoU of 50% in an experimental study on identifying renal diseases.

4. Evaluation Metrics

Accuracy, recall and mean average precision (mAP) are the metrics we use to assess the YOLO models. Our purpose is to determine the right size and weight of YOLO networks, which is our primary focus. The mean of the average accuracy of the whole data class with reference to the intersection over union (IoU) value [19] is used as an alternate method to evaluate how successful object detection is. On the other hand, the mAP value is calculated by utilizing the IoU matrix in conjunction with the accuracy matrix, the recall matrix, and the confusion matrix. Depending on the bounding box representing the ground truth, the confusion matrix displays the results of classification and detection in the form of objects that have been correctly classified and incorrectly categorized. The definition of precision is the ratio of true positive predictions to the sum of all true positive and false positive samples. The number of times a prediction was accurate (the number of true positives) out of all relevant samples is what is counted for each label’s recall. The four fundamental qualities of a confusion matrix may be utilized to construct a variety of evaluation measures:
True Positive (TP): Indicates the number of smoke objects appropriately detected.
True Negative (TN): Number of accurately identified non-smoke objects.
False Positive (FP): The number of misclassified non-smoke objects that are smoke.
False Negative (FN): The number of smoke objects misclassified as non-smoke.
Calculated and generated from the confusion matrix are the following metrics:
M e a n   a v e r a g e   p r e c i s i o n   m A P   =   1 n k = 1 k = n A v e r e a g e   p r e c i s i o n   o f   c l a s s   k
P r e c i s i o n = T r u e   P o s i t i v e T r u e   P o s i t i v e   +   F a l s e   P o s i t i v e
R e c a l l = T r u e   P o s i t i v e T r u e   P o s i t i v e   +   F a l s e   N e g a t i v e
I n t e r s e c t i o n   o v e r   u n i o n   I o U = O v e r l a p e d   a r e a   b e t w e e n   t h e   p r e d i c t e d   a n d   g r o u n d   t r u t h   b o x e s A r e a   o f   u n i o n
We further apply three loss functions for reduction and evaluation, including the bounding box regression score (loss), which may be used to quantify non-overlapping bounding boxes [20]. The class probability score may be used to determine how well a bounding box matches the class of an object [21]. The objectness score (confidence score/GIoU) may be used to calculate the likelihood of a certain object being present in a given grid cell [22].

5. Experimental Results and Discussion

Detecting forest fires is a delicate procedure with enormous economic consequences. Furthermore, it is important to note the persistence of climate change, which significantly impacts the spread and intensification of flames. In this section, we compare several YOLO models and their performance in detecting forest-fire smoke with the shortest feasible detection time. However, this is not considered adequate for determining the optimum fire-detection model, particularly given several competing models based on very efficient neural networks, such as Faster R-CNN. As a result, one of the objectives of this study is to evaluate the performance of YOLO models compared to earlier models.
Furthermore, in terms of detection speed, it is fully dependent on the speed of image processing to identify its constituents such as smoke and flames. Detection stations play a vital role in this case by delivering high-quality images such as satellite or drone photos. Here, the problem of the inequality of comparisons of the different YOLO detection models with previous models such as fast R-CNN and faster R-CNN appears. In order to properly overcome this problem, we suggest in this study that high-quality simulation devices be provided to boost detection. However, in this paper, we confine ourselves to the parameters of the device employed in this study, as shown in Table 3. Additionally, the most significant factors of fire smoke-detection activities, which are centered on the difficulty of detecting distant areas based on the size of the detection zones, should be underlined. On the other hand, some components with intense light are among the most notable obstacles in erroneous detections. As a result, the objective of this study is to provide light on the variations in performance amongst YOLO models for identifying faraway regions.
YOLO models include roughly 29 different parameters for hyperparameter adjustment. However, we set up twelve parameters, as shown in Table 4. The parameters are loss gain functions, learning rates, optimizers, and IoU threshold. All pictures were downsized to 640 × 640 as the input image size for all models. However, because of the low weight of networks such as nano and small models, we increased the number of epochs in YOLOv5 to 100 iterations to boost detection results. To make the comparison more realistic, we set all other YOLOv5 models to 100 epochs, including medium, large, and x-large. As with YOLOv5, we picked 100 epochs to train the YOLOv3 model and 100 epochs to train the YOLOv7 model. However, all models were built up in 16 batches compatible with the tiny, selected learning rates and device qualifications in terms of RAM and GPU. In each iteration, just four photos were input into the model once for clarity. In the YOLOv3 and YOLOv5 models, we applied the stochastic gradient descent (SGD) optimizer. To our knowledge, the SGD optimizer outperformed the ADAM optimizer, despite the Adam optimizer converging quicker [23].
The findings from our experiments demonstrate that the YOLOv5x model is superior, since it has a detection accuracy of 96.8% at a threshold of 50% higher than the union intersection. In addition, the model’s accuracy was 95%, earning it the best grade possible on scales measuring precision and recall. This should not come as a surprise considering that the YOLOv5x model is the most comprehensive of all the models and achieves an average accuracy rate of 68.9% on the COCO dataset. In addition, YOLOv5 models are differentiated from their predecessors by their ability to recognize three-dimensional objects inside a single picture. The speed of detection, on the other hand, has to be considered since we found that the extremely large (YOLOv5x) model had the slowest rate of detection compared to the other models. The findings of the experiment as well as a comparison of several detection models are shown in 
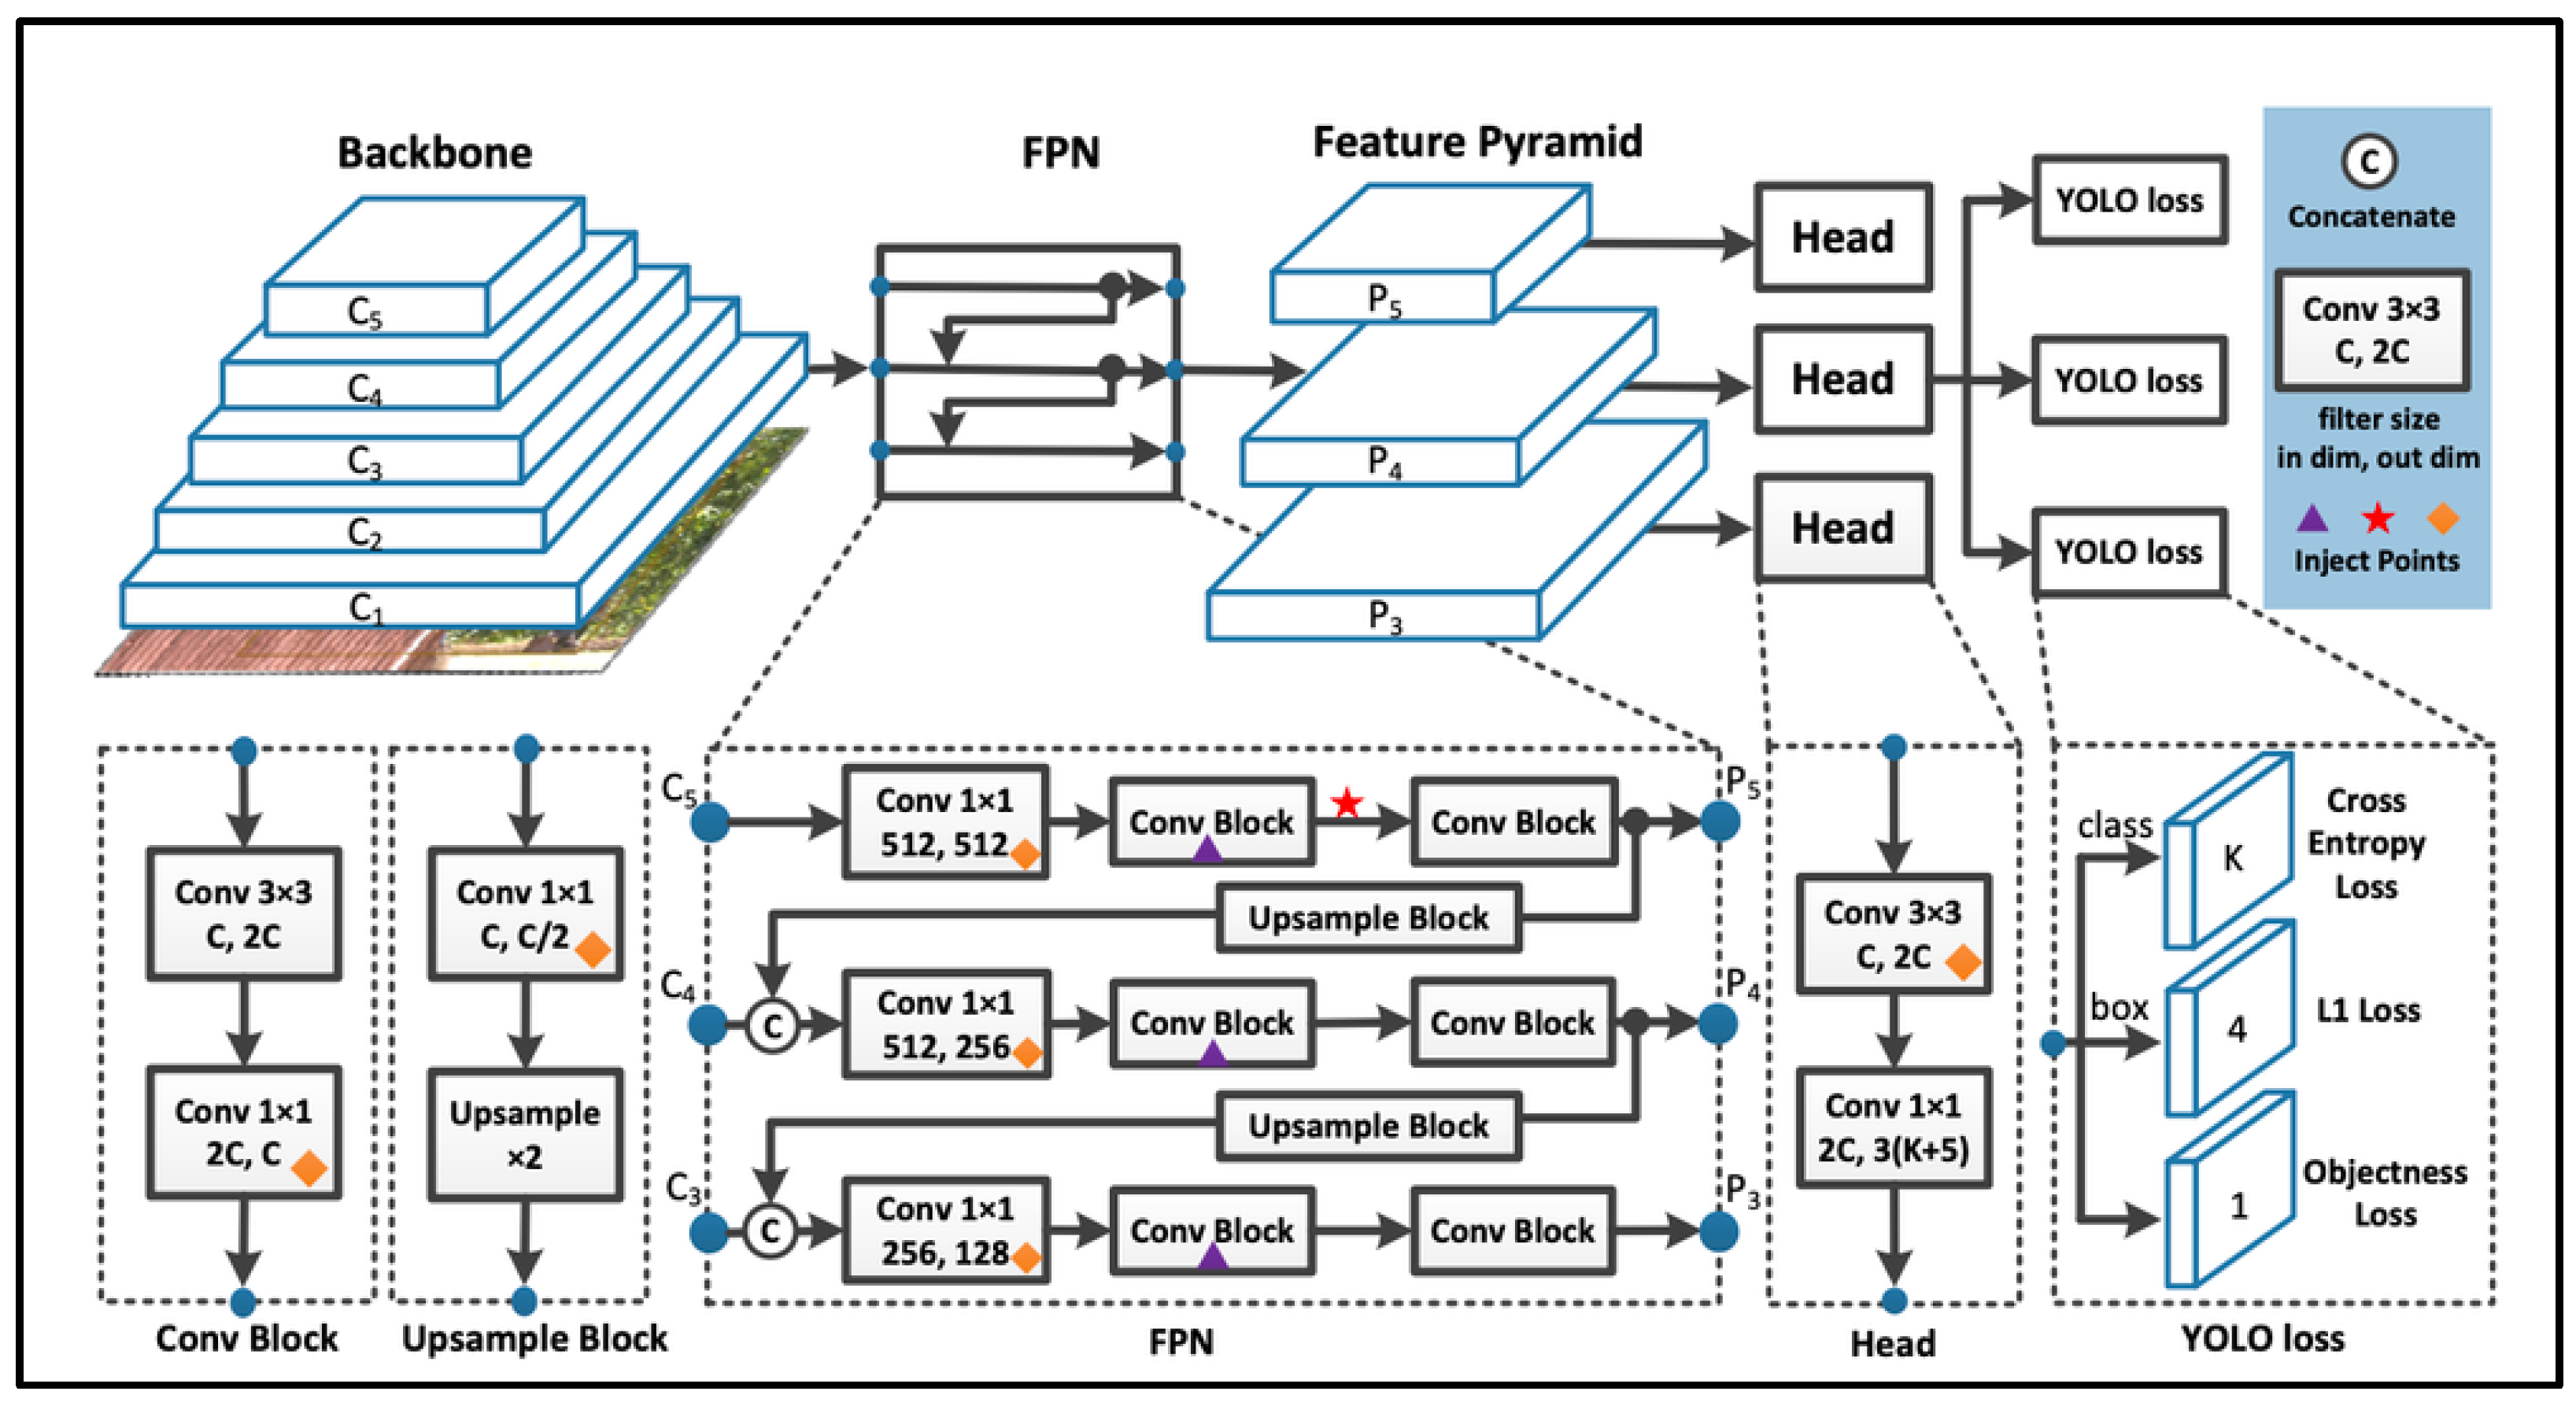
Table 5. When the intersection over union was set at 50%, the YOLOv7 model, on the other hand, revealed comparable results with an average accuracy of 95%. When contrasted with the YOLOv5x model, however, we discovered that this one achieves the best results by cutting down on the number of loss functions. This is due to the fact that YOLOv7 has the benefit of lowering the number of computing operations required since it uses just a single stage rather than numerous stages like RCNN does. Because of the new network architecture, also known as the extended efficient layer aggregation network (E-ELAN), the computational speed has decreased, while the accuracy rate has increased [24]; this is due to the YOLOv7 mechanism, which aims to reduce the number of parameters that are used.
On the other hand, the YOLOv5n model showed precise detection results, with an average detection accuracy of 95% at an intersection over a union of 50%. This should not come as a surprise considering that only one entry in the data set corresponds to the goal, which stands for smoke. This is where the power of this model becomes apparent, as it can perform well in detecting operations even in areas with little space and components. On the other hand, when the size of the YOLOv5 models increased, the model’s capacity to identify more items in more image dimensions also increased. This is because the size of the neural networks increased.
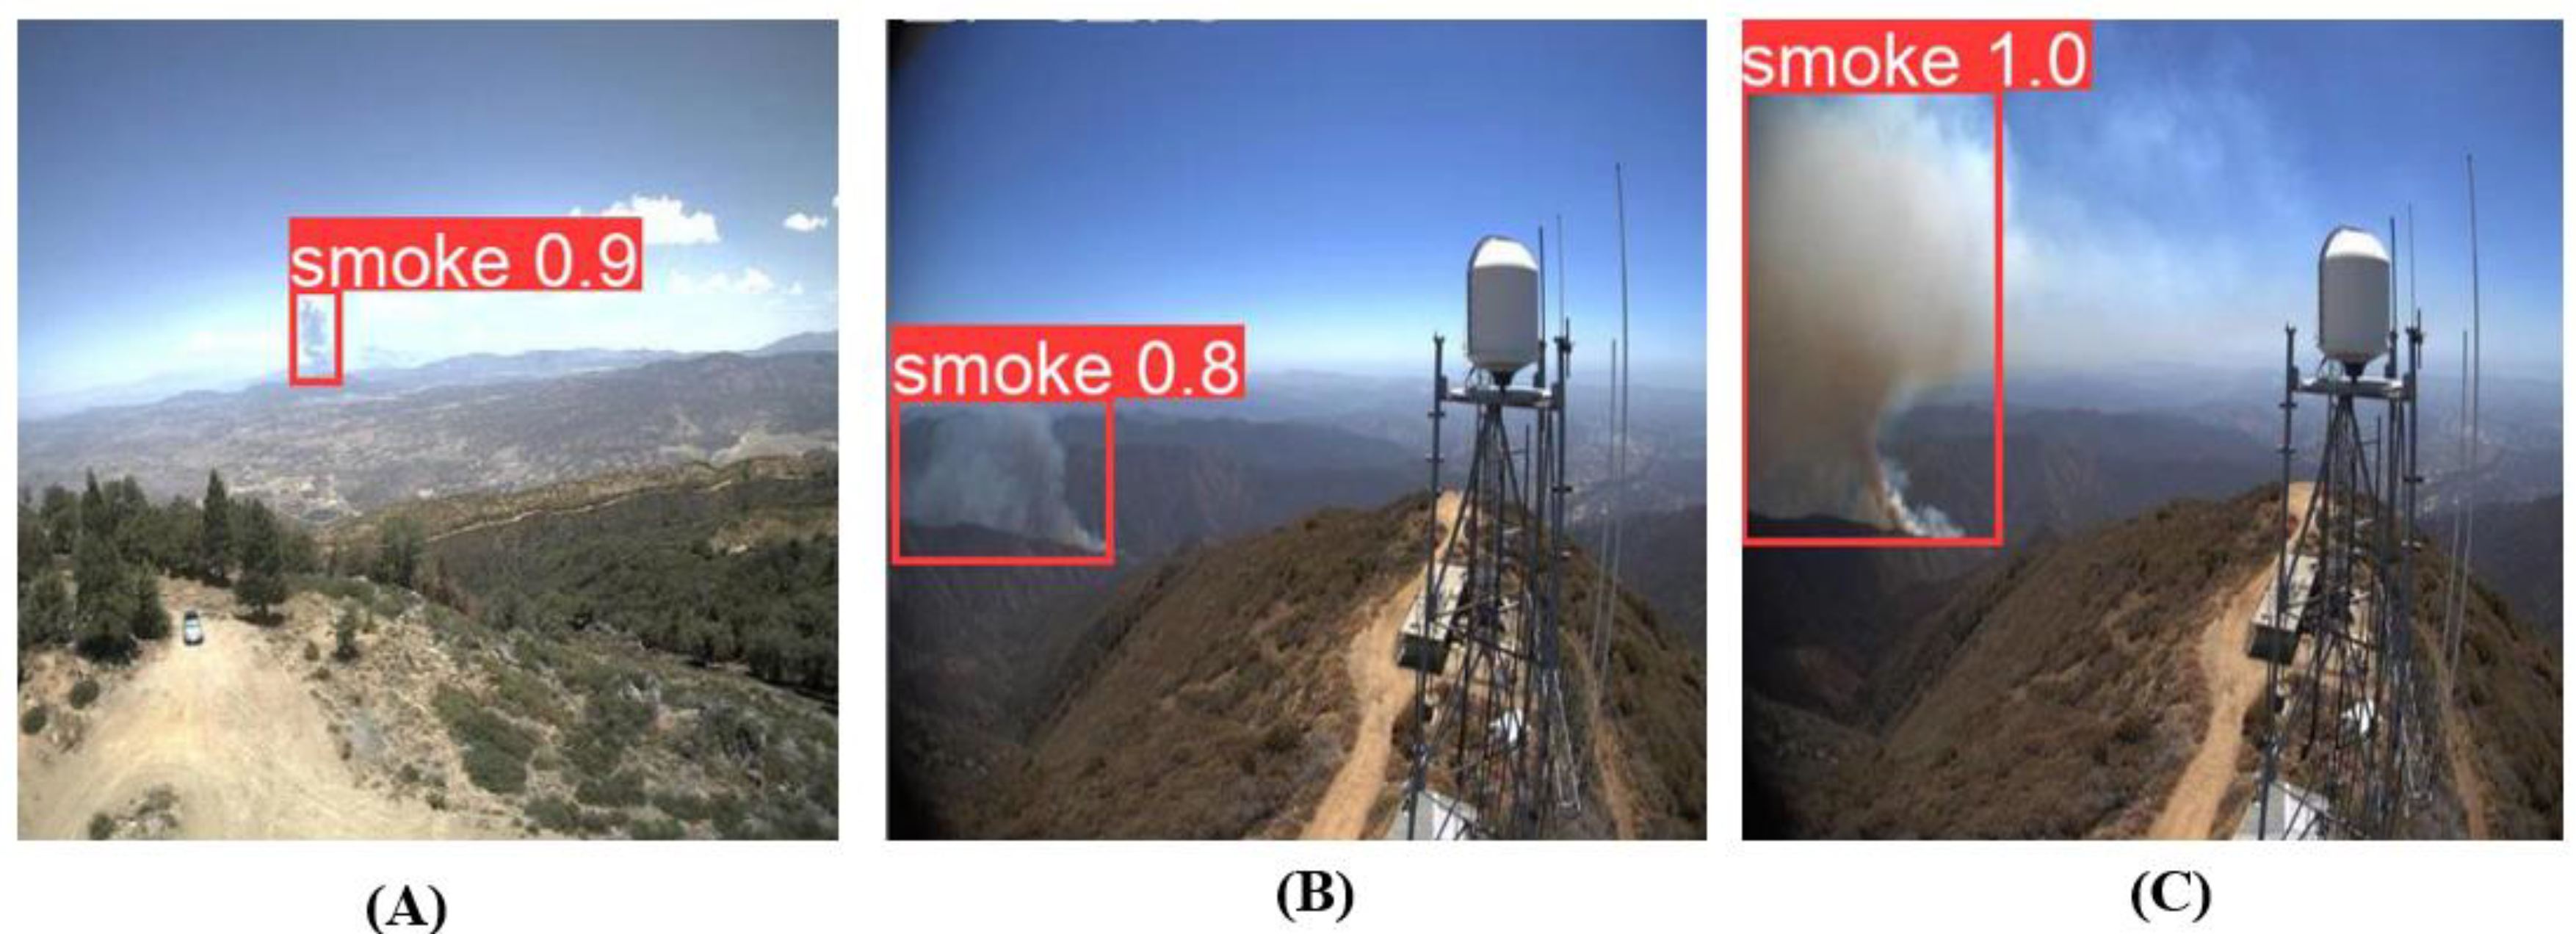
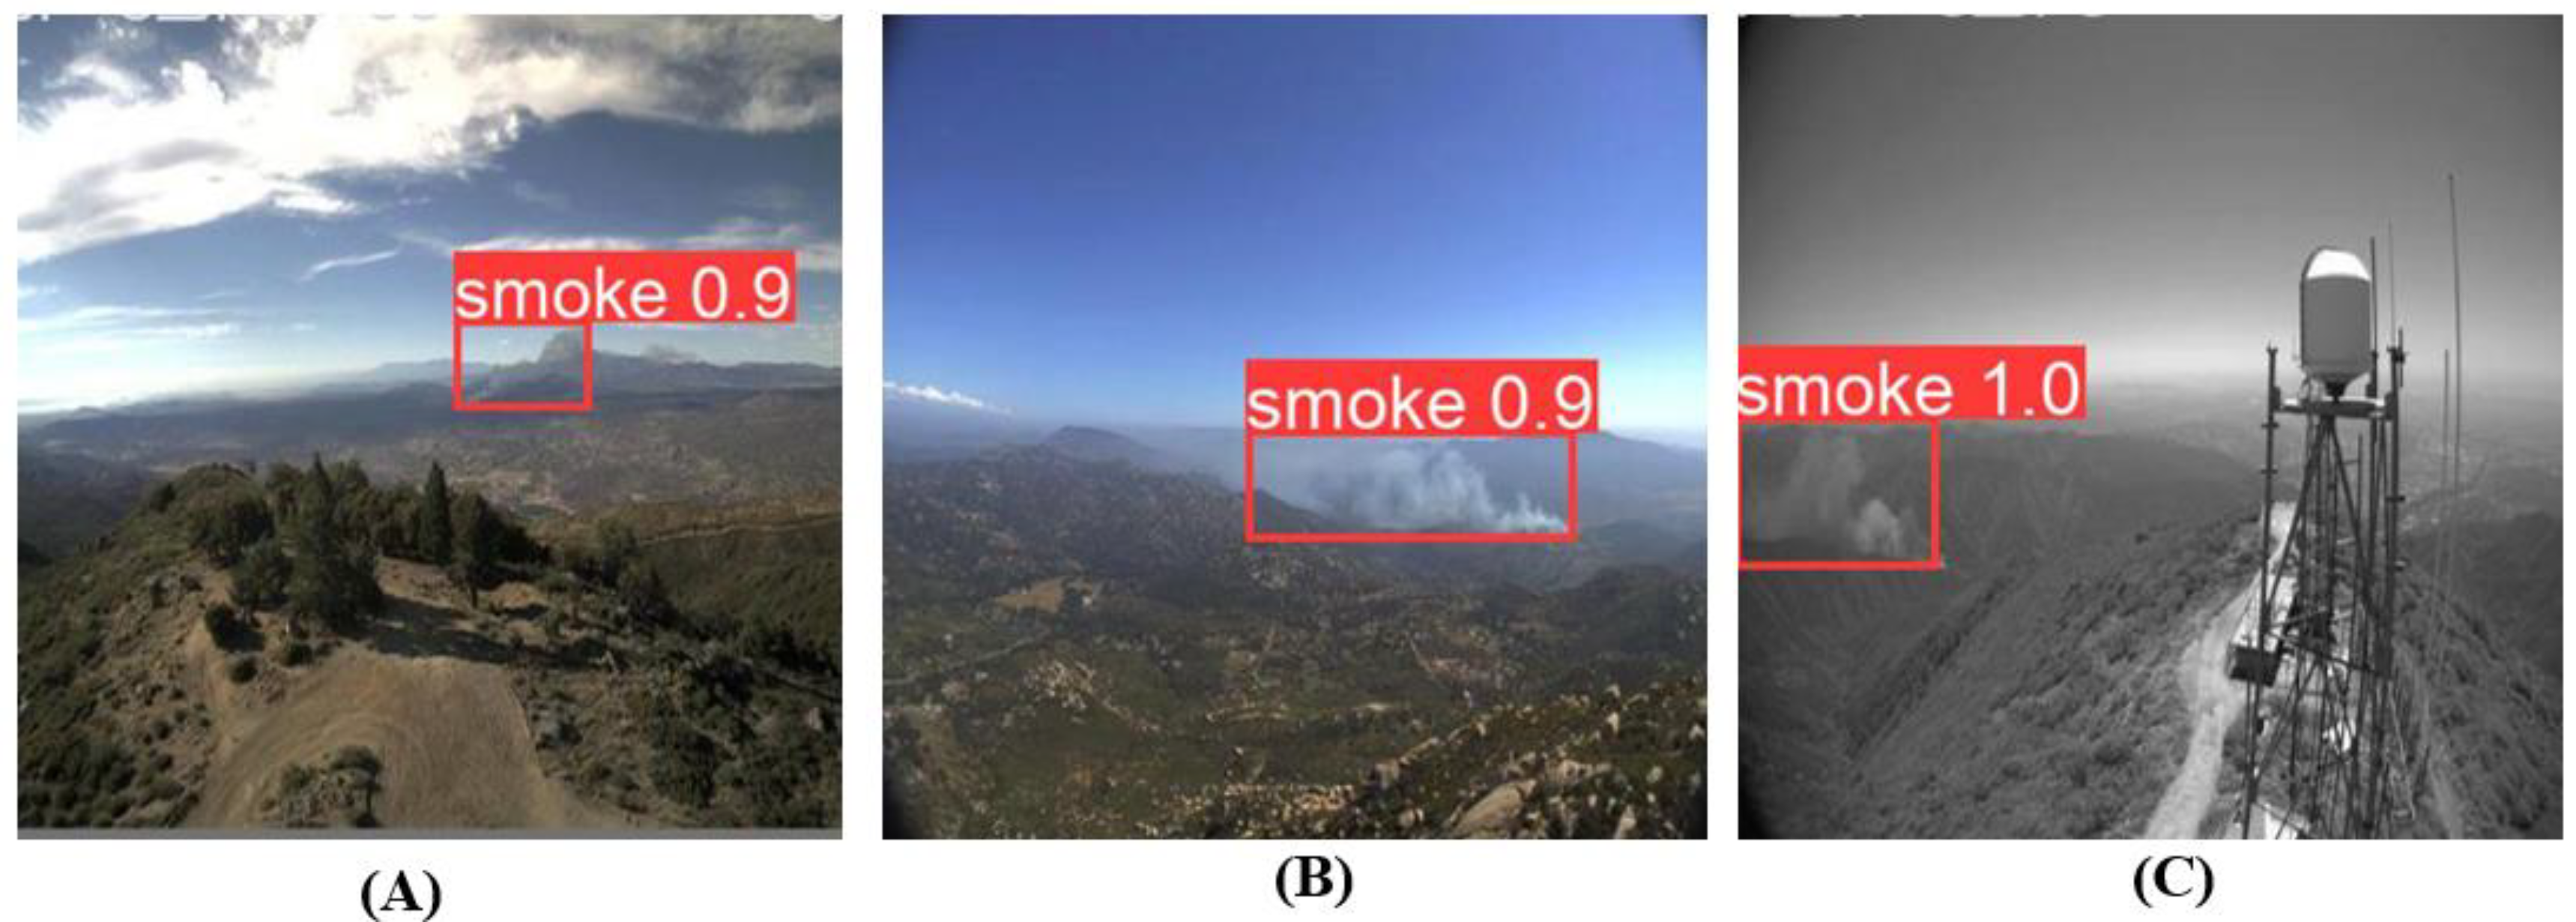
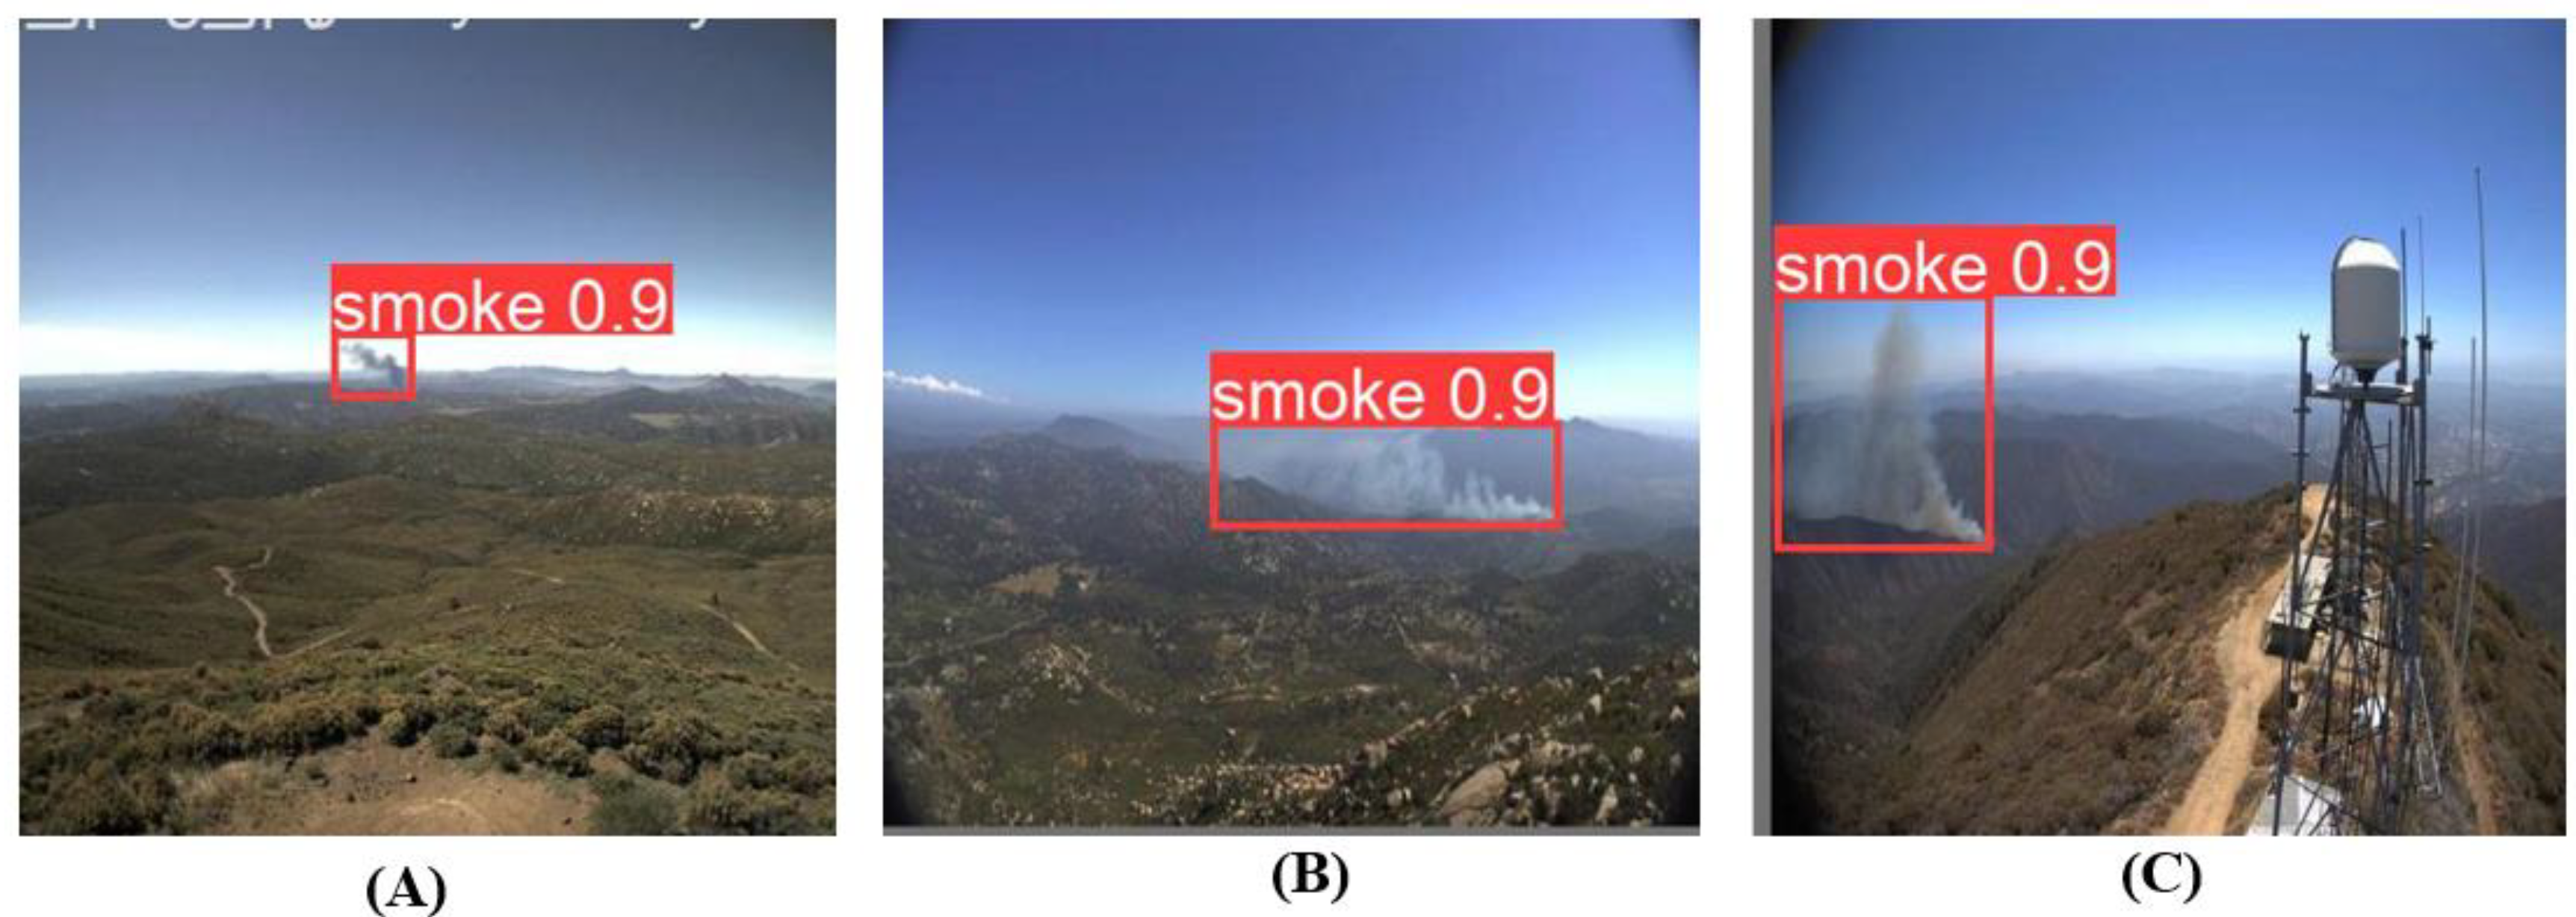
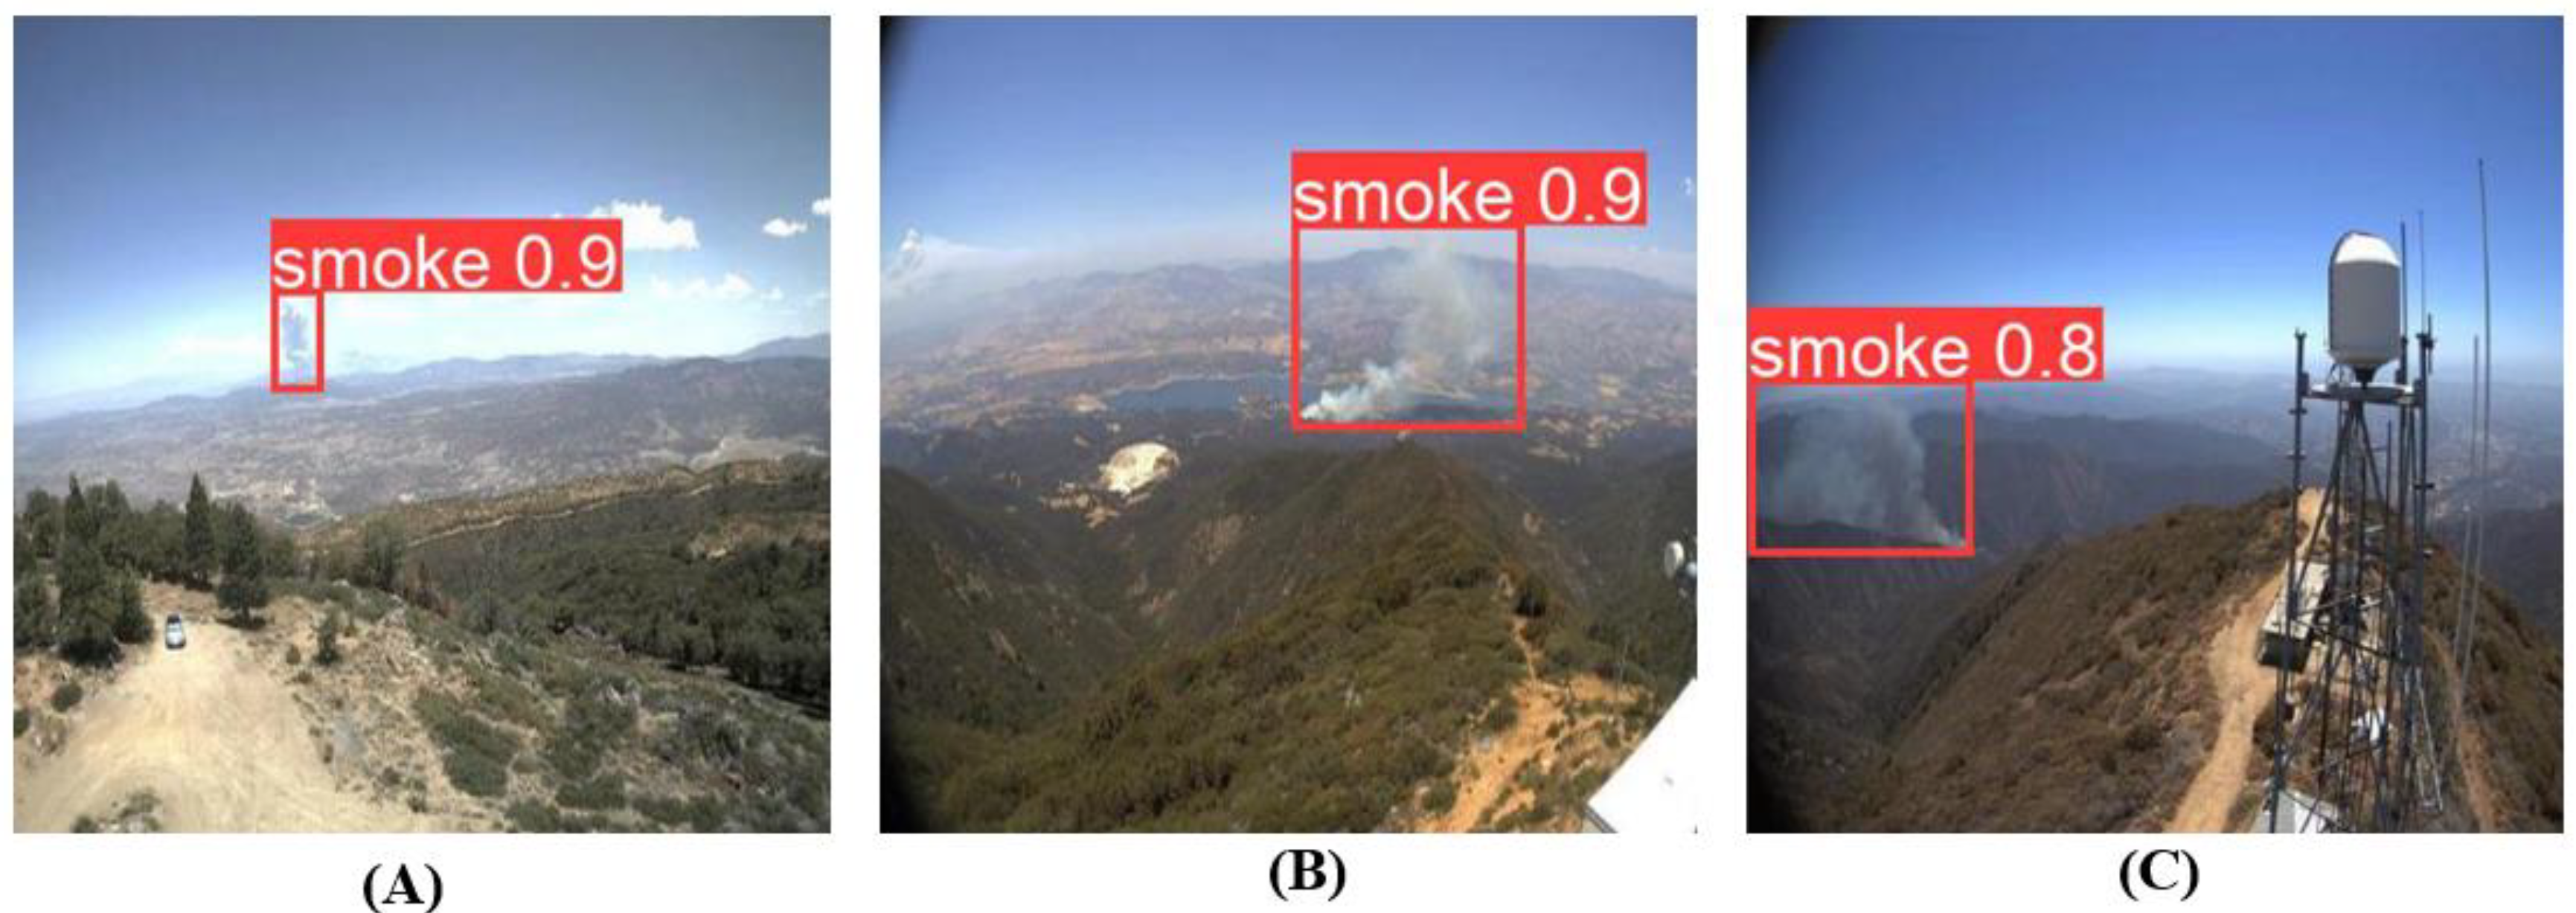
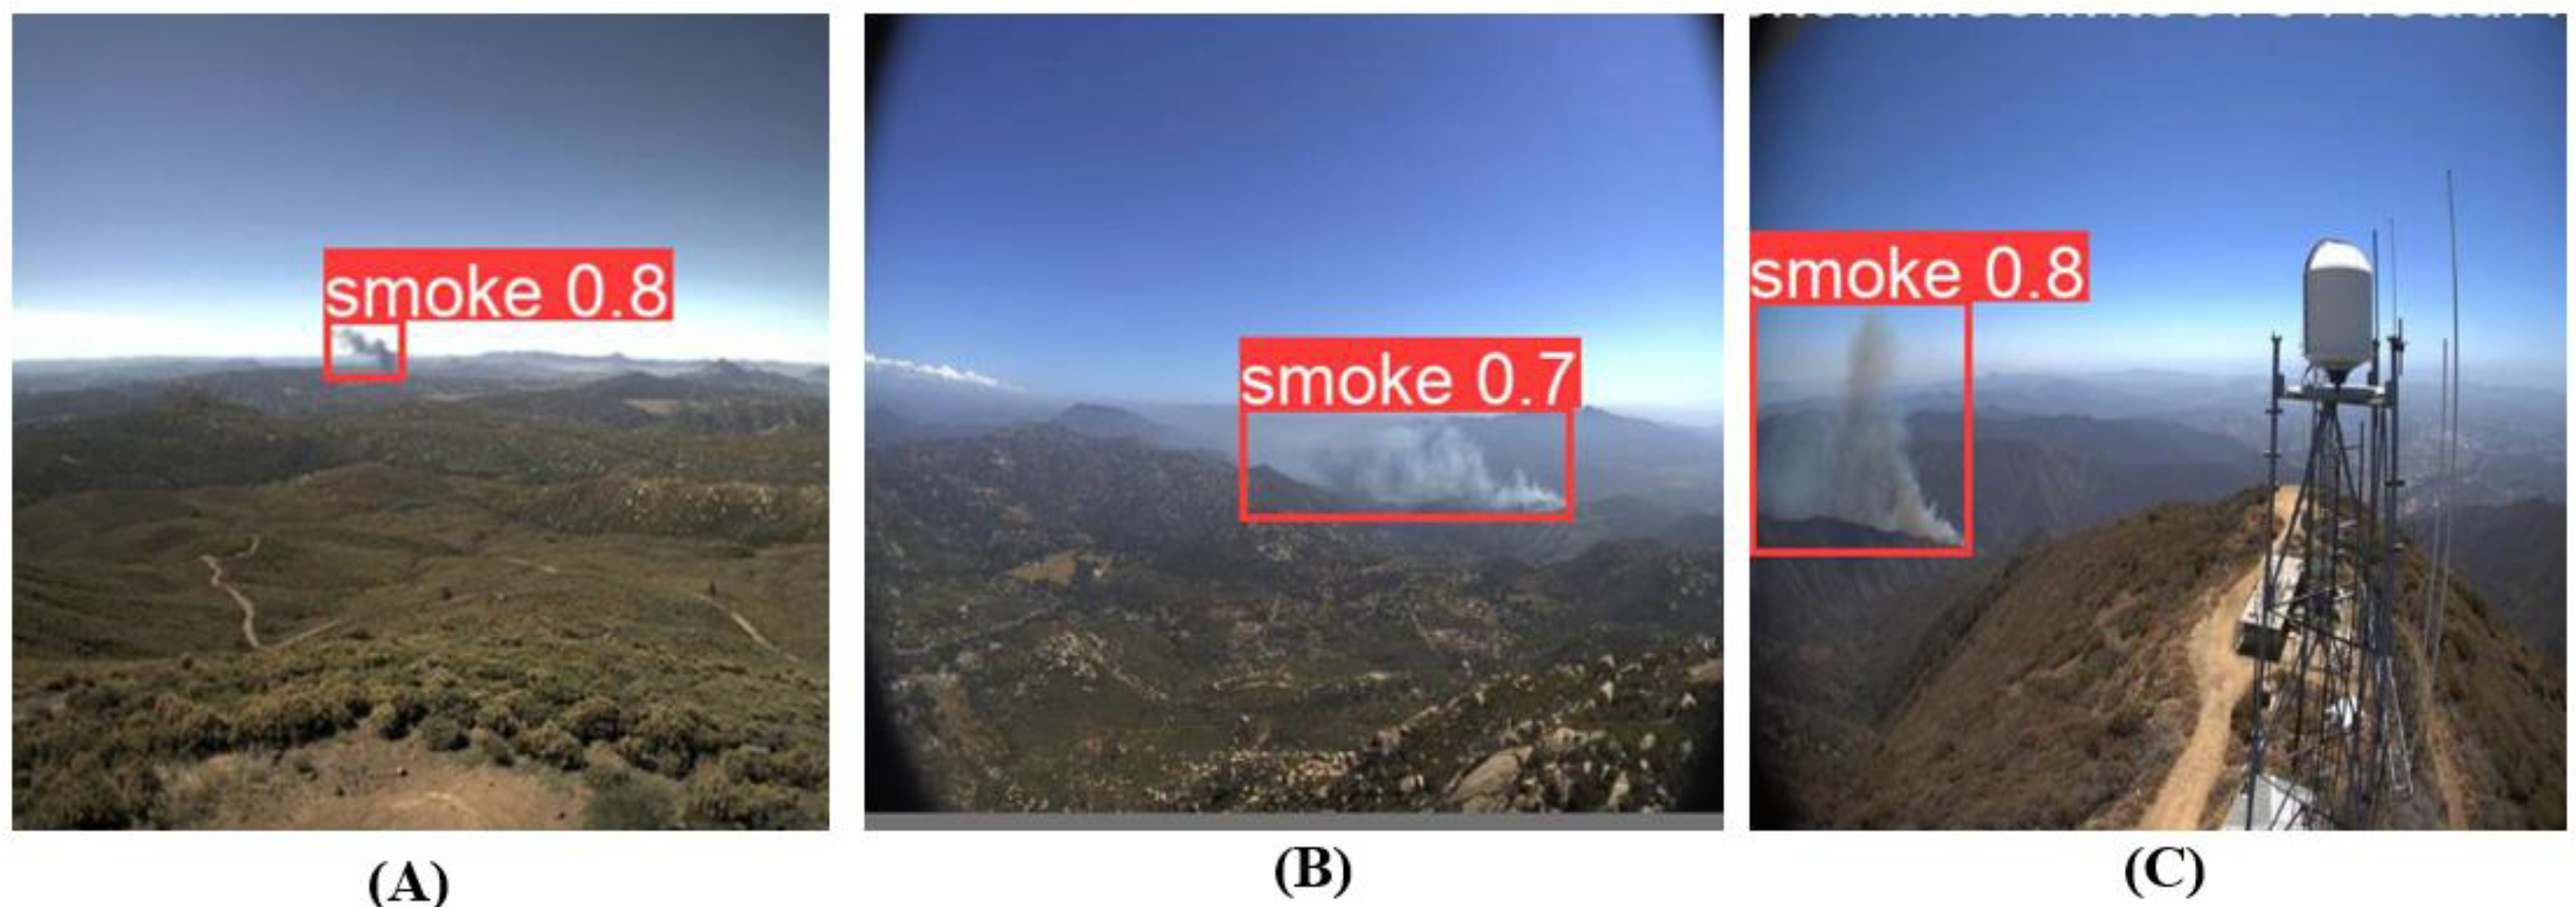
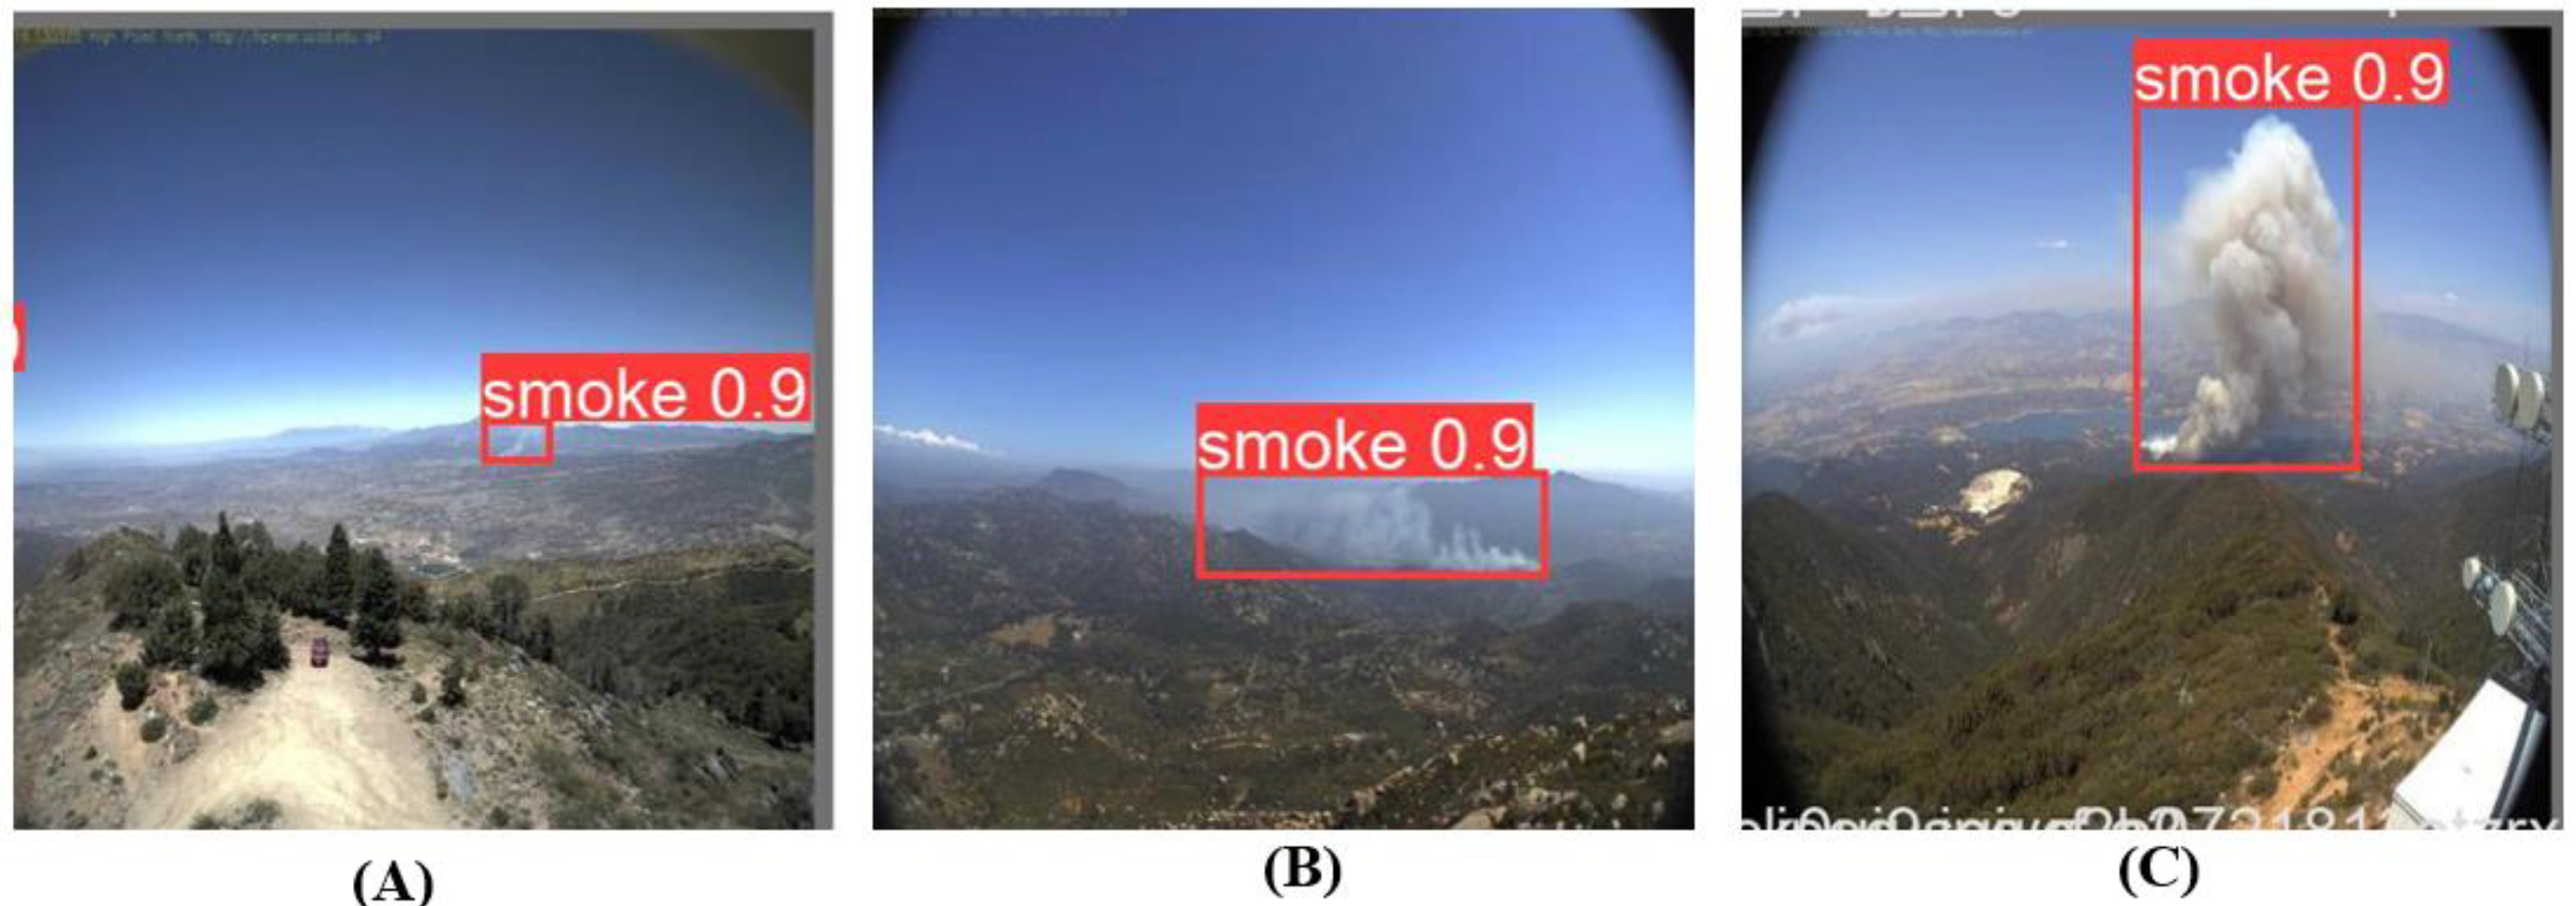
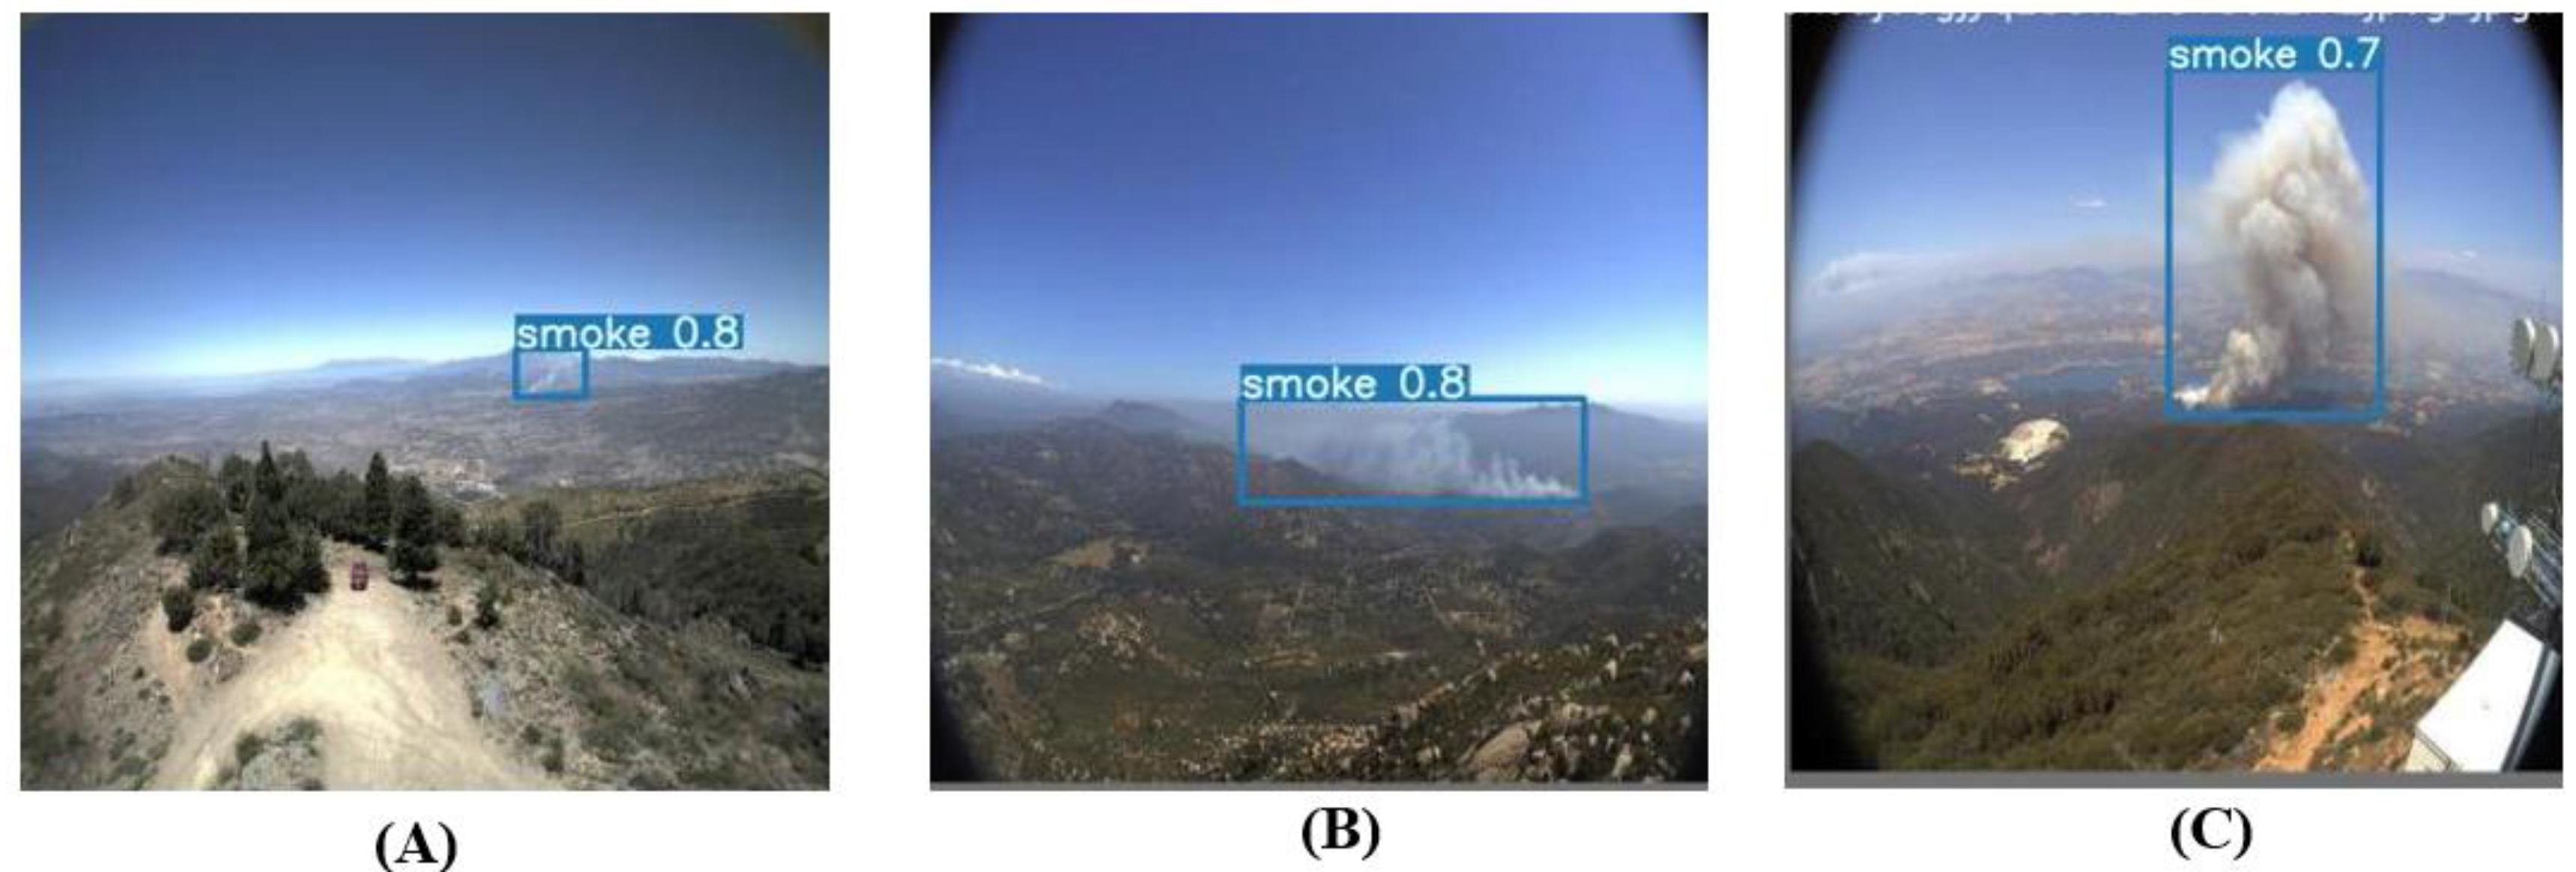
Illustrating the feasibility of smoke-detection models from various detection areas, the detection accuracy varied between 70% and 100%. Figure 6, Figure 7, Figure 8, Figure 9, Figure 10, Figure 11 and 
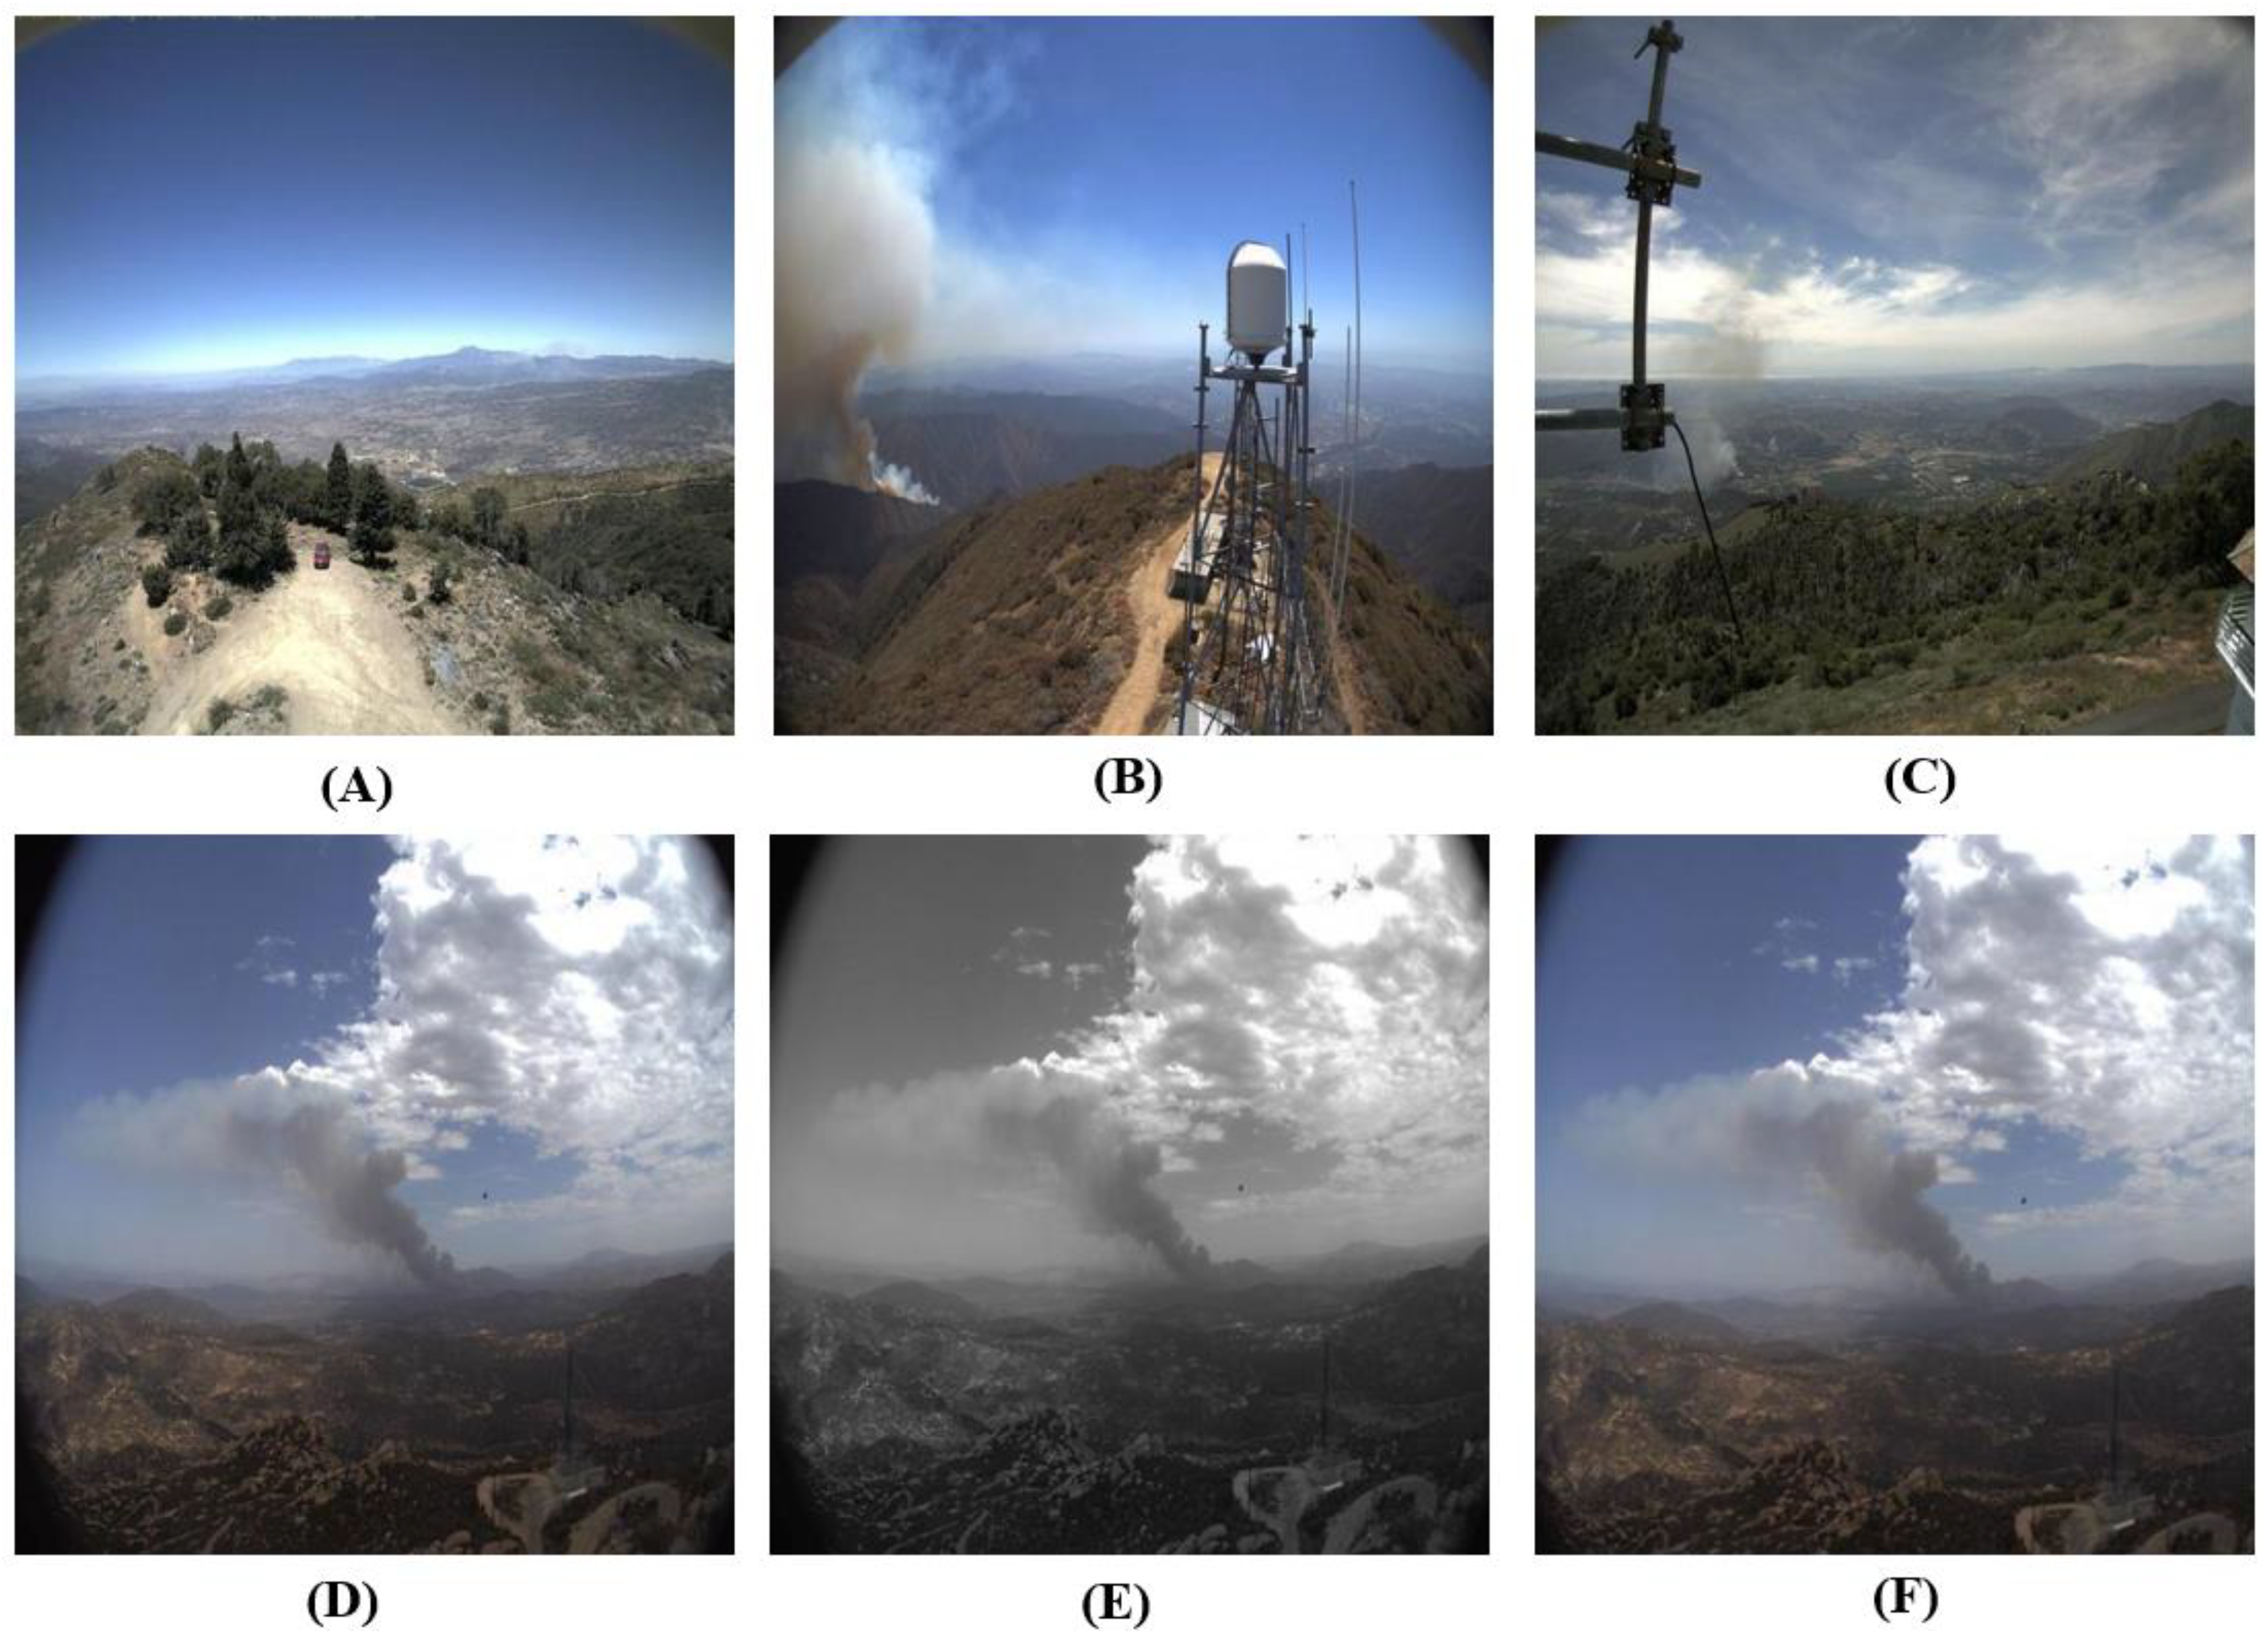
Figure 12 show samples of YOLO model detection findings in three dimensions: close, medium, and distance. In addition, this study aims to minimize the sensitivity of detection models to future data while increasing detection accuracy in different locations and dimensions. Consequently, in this work, we used data-augmentation methods such as cropping images and altering their color tone, which increased the capacity of models to recognize distinct scenarios properly.
To emphasize the state-of-the-art of the recommended proposed methodology in comparison to the methodologies used in prior research, this study aims to evaluate and contrast the capabilities of various YOLO models in terms of how quickly and accurately they can spot smoke from forest fires. We have found that some of the data sets that are accessible online have certain issues. These issues include a lack of data labels and a disorganization of the data, making it very time-consuming to generate a new data set. As a result, in this study, we used a set of methods to increase the data, which ultimately led to an increase in the number of training elements in the data set that was used, a decrease in the classification sensitivity of the detection models, and a decrease in the proportion of overfitting. Additionally, we highlighted one of the most prominent challenges in detecting smoke and forest fires, which is represented by the appearance of some elements with high illumination that can be detected as fires or smoke, but in reality, are not fires or smoke. As a result, we adhered to using a dataset from the Kaggle repository. This dataset describes three distinct detection zones, including proximal, middle, and distant.
On the other hand, given the presence of a large number of previously developed detection models using a variety of neural network types, one of the goals of this work is to identify the kind of detection model that is most effective for the early detection of fires. Consequently, we compared the performance results of several detection models with the findings of the study technique that was devised and carried out on an altered data set to detect fire smoke. The findings of prior detection models are compiled in Table 6, along with a comparison of those results with those of YOLO detection models. With this due consideration, the YOLO models demonstrated superior performance in terms of both accuracy and speed.
The finite detection approach in the Fast R-CNN model being a static method sheds light on the reasons why YOLO detection models outperform some prior models. As a result, no simultaneous learning takes place, which may result in the generation of poor proposals for the bounding box [25]. Moreover, in the Faster R-CNN detection model, detecting many components with comparable characteristics in the same picture is a time-consuming procedure for neural networks, which may result in detection delays and incorrect classification processes [26]. It is, nevertheless, still quite effective for real-time detection. Nonetheless, neural networks do not generate enough features in the SSD detection model to detect small items [27], for example, detecting smoke from flames, if the data sets contain one or two target items for detection, such as fires and smoke. As a result, we proposed in this study to employ numerous data-augmentation strategies to increase the amount and quality of training objects. On the other hand, several prior YOLO detection models, such as YOLOv4 and YOLOv2, lack the capacity to identify many small objects in one location [28]. Yolo models, for example, partition a picture into grids and then identify the components within each grid. As a result, the problem arises in recognizing little or distant features if there are many inside the image’s single grid.
Table 6. Performance of YOLOv3, YOLOv5, and YOLOv7 compared to prior models.
Detection ModelMean Average Precision (mAP) at IoU of 50%
Fast R-CNN [25]68.3%
Faster R-CNN [26]70.6%
YOLOv4 [29]77.5%
EfficientDet [30]77.4%
SSD [31]71.3%
YOLOv5n95.04%
YOLOv5s94.9%
YOLOv5m93.5%
YOLOv5l94.3%
YOLOV5x96.8%
YOLOv394.8%
YOLOv795.08%
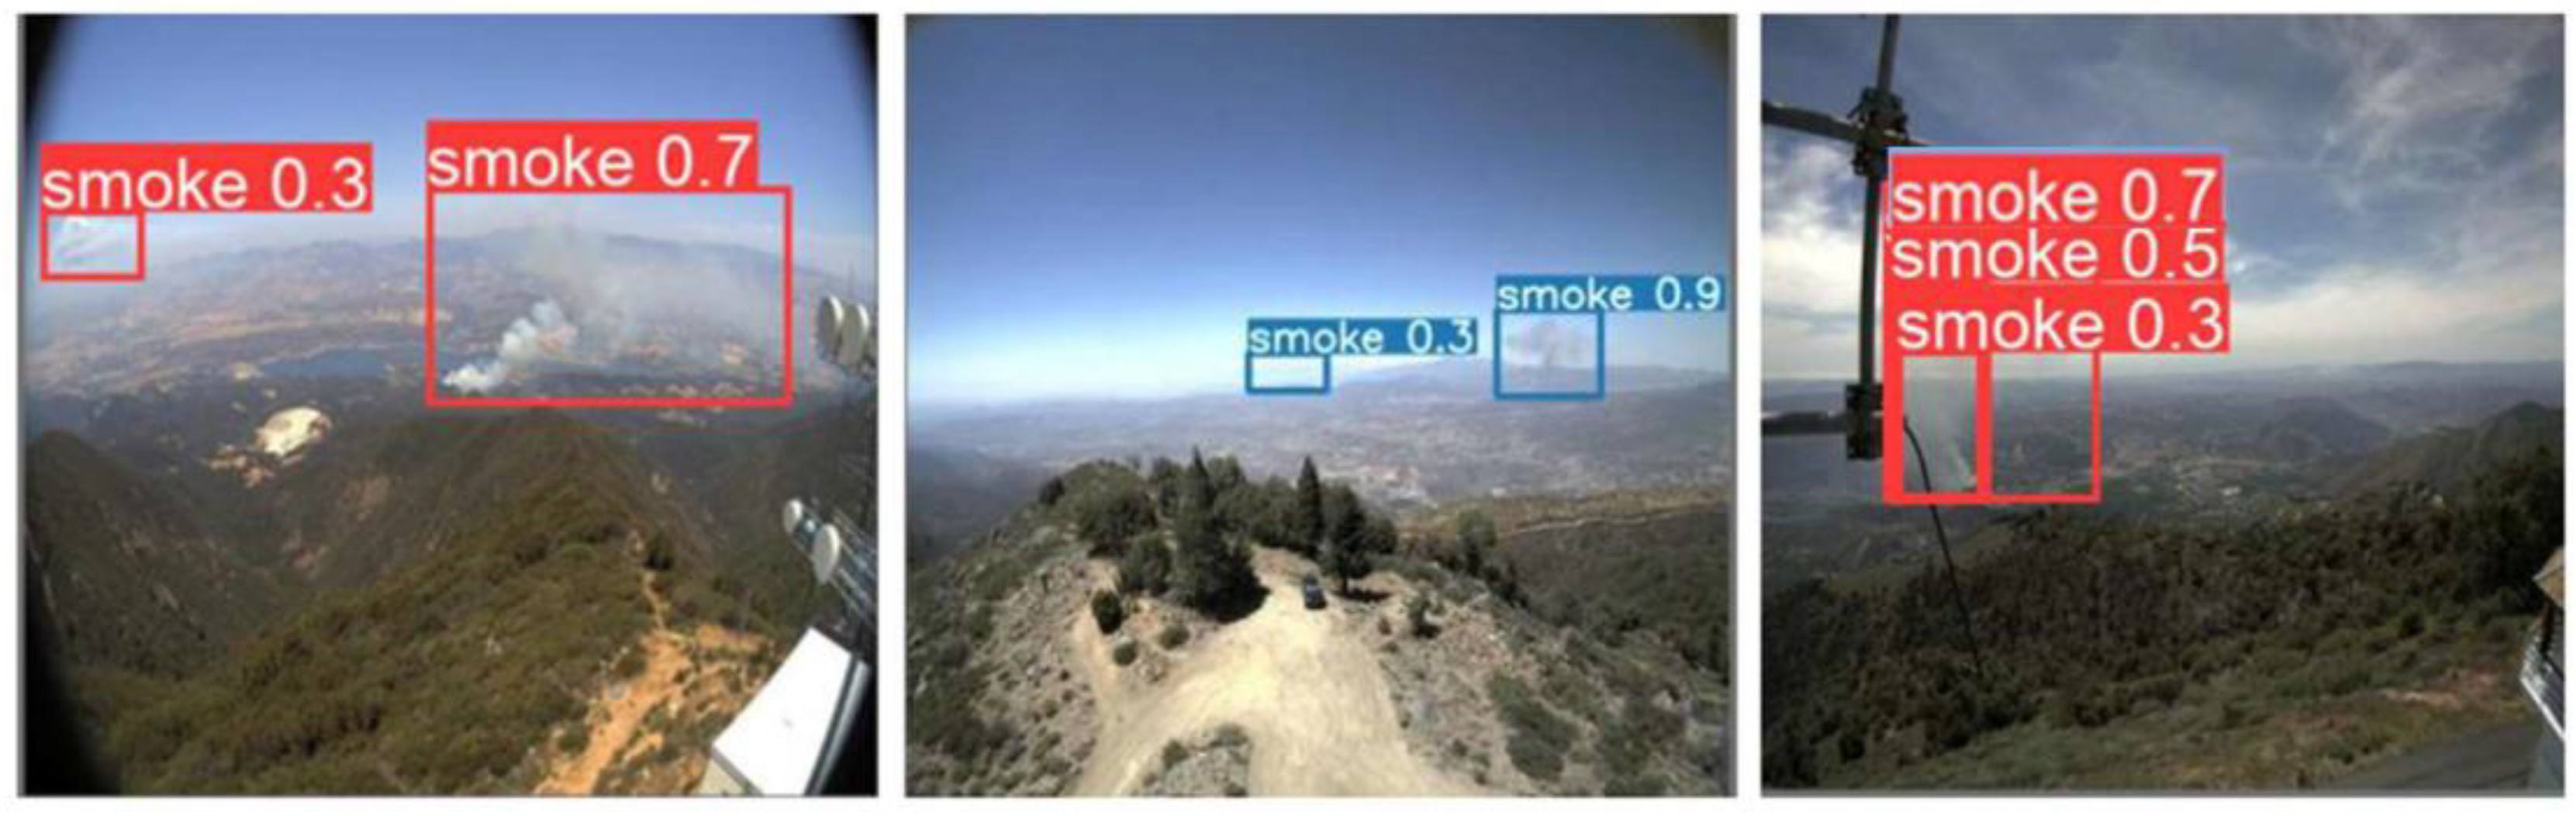
Now, some light will be shed on the study’s shortcomings. Some reduction functions, such as the classification loss gain function, whose value was zero in all models, were not utilized to compare detection models. This is due to the dataset only having one classification class. We also note that a small sample of forest-fire smoke detection data is erroneous. Figure 13 shows where the clouds were recognized as smoke from fires in daylight mode. The detection models’ power rests in their ability to be trained on additional data sets representing fire smoke in day and night modes and extracts from climate change in the areas. Furthermore, altering the parameters in the detection models may vary from experiment to experiment depending on the amount and quality of the data collected and the speed of the detectors employed. However, to solve the problem of misclassifying clouds as smoke, it is suggested to add another distinct element to the data set that represents clouds. Although this solution will be effective, some physical properties of the common substance between smoke and clouds will be specified in the detection operations and it is an expensive process. Therefore, we shed light on the problem of detecting fire smoke, especially smoke from fires, which tends to be white, as opposed to black, which will be easier to distinguish from clouds. Additionally, we noticed that the number of clouds in the images of the available and used dataset is not sufficient in all cases to redefine a new discrimination element. However, a radical solution to this problem is to develop fractional detection models to analyze smoke properties and separate them from elements that have similar properties.
On the other hand, it should be noted that searching for the optimum detection model might be challenging, if not impossible. This is owing to the numerous constraints, such as a lack of appropriate labeled data sets to conduct experiments on assessing the effectiveness of many detection models to identify smoke from fires in various conditions, such as internal and outdoor flames, daylight fires, and nocturnal fires [31]. This is due to the high expense of addressing data sets [
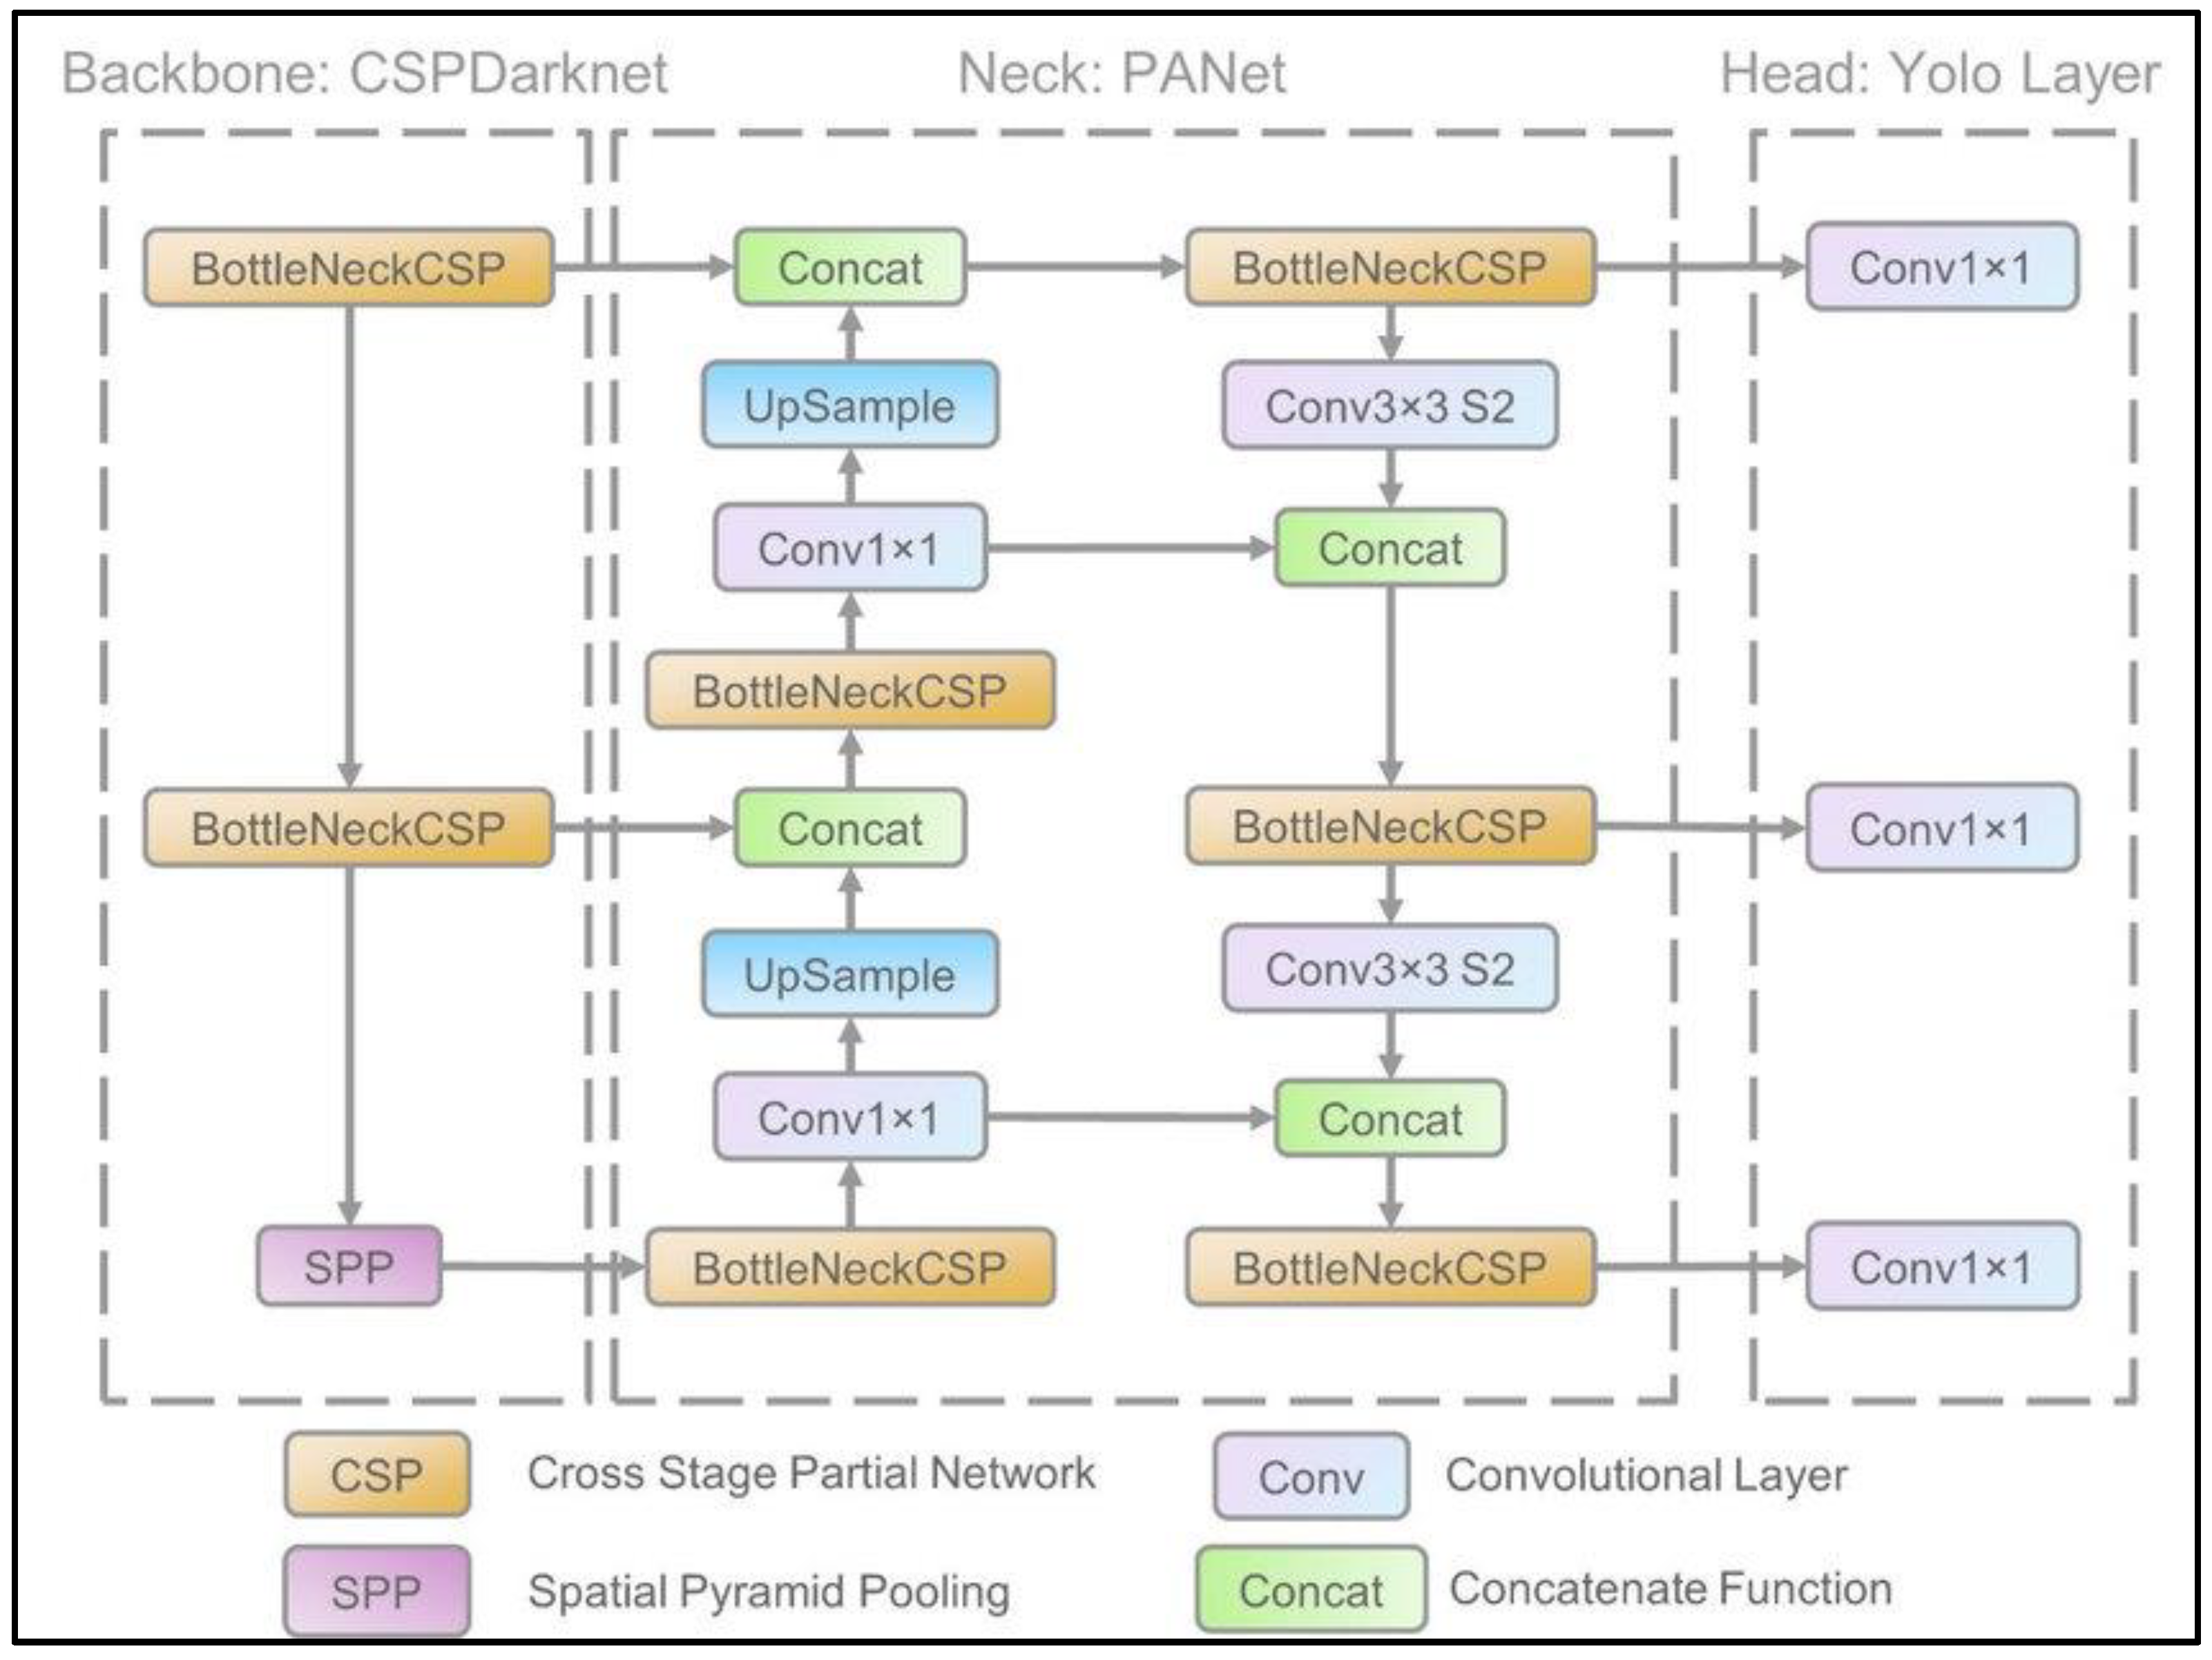
32], as well as the technology required to detect fire smoke early and distinguish it under climate change circumstances. In this paper, however, we described the distinctions between common technologies, such as optimization algorithms, which can be utilized in all sorts of detection models and play a key role in enhancing and modifying detection speed. Furthermore, the comparisons in this paper aim to highlight the molecules and components of detection model networks that differ from one detection model to another, such as YOLOv5 that uses the PANet network and YOLOv7 that uses the E-ELAN network, and to demonstrate the differences in performance in forest fire detection operations. As a result, determining the best detection model is entirely dependent on the state of the available environment, the detection areas and their dimensions, the speed of polarization of the detection devices and their effectiveness, the quality of the collected data, and the accuracy of the data set.

6. Conclusions

Forest fires are a particularly concerning environmental problem since smoke may serve as an early warning indicator. A very minute portion of the total smoke might be seen in initial photographs. Due to the unpredictability of smoke’s dissemination and the ever-changing nature of the surrounding environment, identifying smoke is made more difficult by minor pixel features. In this paper, we described a novel framework that, when applied to various YOLO detection models, resulted in a decreased level of sensitivity. In addition, we examined how well and how quickly various YOLO models identify anomalies compared to earlier versions. In addition, to determine whether or not the detection model was capable of accurately recognizing targets, we used a gathered dataset that outlines three separate detection zones. When applied to a home-grown multi-oriented dataset, our model surpasses the gold-standard detection approach for identifying forest fires by a margin of 96.8%, with an mAP of 50 and FPS of 122, respectively. Extensive research shows that the suggested method achieves significantly better results than the most advanced object-detection algorithms when applied to smoke datasets from wildfires, while maintaining a satisfactory performance level in challenging environmental conditions. This was discovered by comparing the results of the suggested method with those of the most advanced object-detection algorithms.

Author Contributions

Conceptualization, Y.A.-S. and A.A.-Q.; methodology, Y.A.-S., A.A.-Q, M.A. and A.A.; resources, Y.A.-S., F.A., K.M. and R.Q.; writing—original draft preparation, Y.A.-S. and A.A.-Q.; writing—review and editing, Y.A.-S., A.A.-Q, M.A., A.A. and T.A.; project administration, Y.A.-S.; funding acquisition, A.A. All authors have read and agreed to the published version of the manuscript.

Funding

This research received no external funding.

Data Availability Statement

Not applicable.

Acknowledgments

The authors would like to thank the Deanship of Scientific Research at Shaqra University (KSA).

Conflicts of Interest

The authors declare no conflict of interest.

References

  1. Chaturvedi, S.; Khanna, P.; Ojha, A.J.; Sensing, R. A survey on vision-based outdoor smoke detection techniques for environmental safety. ISPRS J. Photogramm. Remote Sens. 2022, 185, 158–187. [Google Scholar] [CrossRef]
  2. Xu, R.; Lin, H.; Lu, K.; Cao, L.; Liu, Y. A Forest Fire Detection System Based on Ensemble Learning. Forests 2021, 12, 217. [Google Scholar] [CrossRef]
  3. Xianjia, Y.; Salimpour, S.; Queralta, J.P.; Westerlund, T.J. Analyzing general-purpose deep-learning detection and segmentation models with images from a lidar as a camera sensor. arXiv 2022, arXiv:2203.04064. [Google Scholar]
  4. Abdusalomov, A.; Baratov, N.; Kutlimuratov, A.; Whangbo, T.K. An Improvement of the Fire Detection and Classification Method Using YOLOv3 for Surveillance Systems. Sensors 2021, 21, 6519. [Google Scholar] [CrossRef] [PubMed]
  5. Nepal, U.; Eslamiat, H. Comparing YOLOv3, YOLOv4 and YOLOv5 for Autonomous Landing Spot Detection in Faulty UAVs. Sensors 2022, 22, 464. [Google Scholar] [CrossRef] [PubMed]
  6. Yazdi, A.; Qin, H.; Jordan, C.B.; Yang, L.; Yan, F. Nemo: An Open-Source Transformer-Supercharged Benchmark for Fine-Grained Wildfire Smoke Detection. Remote. Sens. 2022, 14, 3979. [Google Scholar] [CrossRef]
  7. Zhang, S.G.; Zhang, F.; Ding, Y.; Li, Y. Swin-YOLOv5: Research and Application of Fire and Smoke Detection Algorithm Based on YOLOv5. Comput. Intell. Neurosci. 2022, 2022, 1–8. [Google Scholar] [CrossRef]
  8. Wang, Z.; Wu, L.; Li, T.; Shi, P. A Smoke Detection Model Based on Improved YOLOv5. Mathematics 2022, 10, 1190. [Google Scholar] [CrossRef]
  9. Mukhiddinov, M.; Abdusalomov, A.B.; Cho, J. A Wildfire Smoke Detection System Using Unmanned Aerial Vehicle Images Based on the Optimized YOLOv5. Sensors 2022, 22, 9384. [Google Scholar] [CrossRef]
  10. Wang, C.; Zhang, Y.; Zhou, Y.; Sun, S.; Zhang, H.; Wang, Y. Automatic detection of indoor occupancy based on improved YOLOv5 model. Neural Comput. Appl. 2022, 35, 2575–2599. [Google Scholar] [CrossRef]
  11. Mohiyuddin, A.; Basharat, A.; Ghani, U.; Peter, V.; Abbas, S.; Bin Naeem, O.; Rizwan, M. Breast Tumor Detection and Classification in Mammogram Images Using Modified YOLOv5 Network. Comput. Math. Methods Med. 2022, 2022, 1–16. [Google Scholar] [CrossRef] [PubMed]
  12. Redmon, J.; Farhadi, A. Yolov3: An incremental improvement. arXiv 2018, 1804, 20. [Google Scholar]
  13. Magnuska, Z.A.; Theek, B.; Darguzyte, M.; Palmowski, M.; Stickeler, E.; Schulz, V.; Kießling, F. Influence of the Computer-Aided Decision Support System Design on Ultrasound-Based Breast Cancer Classification. Cancers 2022, 14, 277. [Google Scholar] [CrossRef] [PubMed]
  14. Yi, Z.; Yongliang, S.; Jun, Z. An improved tiny-yolov3 pedestrian detection algorithm. Optik 2019, 183, 17–23. [Google Scholar] [CrossRef]
  15. Yan, B.; Fan, P.; Lei, X.; Liu, Z.; Yang, F. A Real-Time Apple Targets Detection Method for Picking Robot Based on Improved YOLOv5. Remote. Sens. 2021, 13, 1619. [Google Scholar] [CrossRef]
  16. Rahman, M.A.; Wang, Y. Optimizing intersection-over-union in deep neural networks for image segmentation. In Proceedings of the International Symposium on Visual Computing, Las Vegas, NV, USA, 12–14 December 2016; Springer: Berlin/Heidelberg, Germany, 2016. [Google Scholar]
  17. Wang, C.-Y.; Bochkovskiy, A.; Liao, H.-Y.M. YOLOv7: Trainable bag-of-freebies sets new state-of-the-art for real-time object detectors. arXiv 2022, arXiv:2207.02696. [Google Scholar]
  18. Bayram, A.F.; Gurkan, C.; Budak, A.; Karataş, H. A Detection and Prediction Model Based on Deep Learning Assisted by Explainable Artificial Intelligence for Kidney Diseases. Eur. J. Sci. Technol. 2022, 40, 67–74. [Google Scholar]
  19. Henderson, P.; Ferrari, V. End-to-end training of object class detectors for mean average precision. In Proceedings of the Computer Vision–ACCV 2016: 13th Asian Conference on Computer Vision, Taipei, Taiwan, 20–24 November 2016. Revised Selected Papers, Part V 13. [Google Scholar]
  20. Lee, S.; Kwak, S.; Cho, M. Universal bounding box regression and its applications. In Proceedings of the Asian Conference on Computer Vision, Salt Lake City, UT, USA, 18–23 June 2018; Springer: Berlin/Heidelberg, Germany, 2018. [Google Scholar]
  21. Redmon, J.; Divvala, S.; Girshick, R.; Farhadi, A. You only look once: Unified, real-time object detection. In Proceedings of the IEEE Conference on Computer Vision and Pattern Recognition, Las Vegas, NV, USA, 27–30 June 2016. [Google Scholar]
  22. Wenkel, S.; Alhazmi, K.; Liiv, T.; Alrshoud, S.; Simon, M. Confidence Score: The Forgotten Dimension of Object Detection Performance Evaluation. Sensors 2021, 21, 4350. [Google Scholar] [CrossRef]
  23. Gupta, A.; Ramanath, R.; Shi, J.; Keerthi, S.S. Adam vs. SGD: Closing the generalization gap on image classification. In Proceedings of the OPT2021: 13th Annual Workshop on Optimization for Machine Learning, New Orleans, LA, USA, 13 December 2021. [Google Scholar]
  24. Chen, J.; Liu, H.; Zhang, Y.; Zhang, D.; Ouyang, H.; Chen, X. A Multiscale Lightweight and Efficient Model Based on YOLOv7: Applied to Citrus Orchard. Plants 2022, 11, 3260. [Google Scholar] [CrossRef]
  25. Girshick, R. Fast r-cnn. In Proceedings of the IEEE International Conference on Computer Vision, Santiago, Chile, 7–13 December 2015. [Google Scholar]
  26. Ren, S.; He, K.; Girshick, R.; Sun, J. Faster R-CNN: Towards real-time object detection with region proposal networks. IEEE Trans. Pattern Anal. Mach. Intell. 2017, 39, 1137–1149. [Google Scholar] [CrossRef]
  27. Liu, W.; Anguelov, D.; Erhan, D.; Szegedy, C.; Reed, S.; Fu, C.-Y.; Berg, A.C. Ssd: Single shot multibox detector. In Proceedings of the Computer Vision–ECCV 2016: 14th European Conference, Amsterdam, The Netherlands, 11–14 October 2016; Springer: Berlin/Heidelberg, Germany, 2016. Part I 14. pp. 21–37. [Google Scholar]
  28. Lee, J.; Hwang, K.-I. YOLO with adaptive frame control for real-time object detection applications. Multimedia Tools Appl. 2021, 81, 36375–36396. [Google Scholar] [CrossRef]
  29. Bochkovskiy, A.; Wang, C.-Y.; Liao, H.-Y.M. Yolov4: Optimal speed and accuracy of object detection. arXiv 2020, arXiv:2004.10934. [Google Scholar]
  30. Tan, M.; Pang, R.; Le, Q.V. Efficientdet: Scalable and efficient object detection. In Proceedings of the IEEE/CVF Conference on Computer Vision and Pattern Recognition, Seattle, WA, USA, 13–19 June 2020; pp. 10781–10790. [Google Scholar]
  31. Diwan, T.; Anirudh, G.; Tembhurne, J.V. Object detection using YOLO: Challenges, architectural successors, datasets and applications. Multimedia Tools Appl. 2022, 81, 1–33. [Google Scholar] [CrossRef] [PubMed]
  32. Loh, Y.P.; Chan, C.S. Getting to know low-light images with the Exclusively Dark dataset. Comput. Vis. Image Underst. 2018, 178, 30–42. [Google Scholar] [CrossRef] [Green Version]
Figure 1. Wildfire smoke-detection operation flowchart using deep learning.
Machines 11 00246 g001
Figure 2. Flowchart of the Proposed Wildfire Smoke-Detection Methodology.
Machines 11 00246 g002
Figure 3. Wildfire smoke-detection samples of dataset. (A) Shows a far detection area. (B) Shows a close detection area. (C) Shows a medium detection area. (D) Shows another sample before data augmentation. (E) Shows grayscale of 50%. (F) Shows cropped sample of 10% maximum zoom.
Machines 11 00246 g003
Figure 4. YOLOv5 Network Architecture.
Machines 11 00246 g004
Figure 5. YOLOv7 Network Architecture.
Machines 11 00246 g005
Figure 6. YOLOv5n detection areas results. (A) Far. (B) Medium. (C) Close.
Machines 11 00246 g006
Figure 7. YOLOv5s detection areas results. (A) Far. (B) Medium. (C) Close.
Machines 11 00246 g007
Figure 8. YOLOv5m detection areas results. (A) Far. (B) Medium. (C) Close.
Machines 11 00246 g008
Figure 9. YOLOv5l detection areas results. (A) Far. (B) Medium. (C) Close.
Machines 11 00246 g009
Figure 10. YOLOv5x detection areas results. (A) Far. (B) Medium. (C) Close.
Machines 11 00246 g010
Figure 11. YOLOv3 detection areas results. (A) Far. (B) Medium. (C) Close.
Machines 11 00246 g011
Figure 12. YOLOv7 detection areas results. (A) Far. (B) Medium. (C) Close.
Machines 11 00246 g012
Figure 13. A sample of wrongly detected clouds as fire smoke.
Machines 11 00246 g013
Table 1. Summary of related state-of-the-art works.
PaperDatasetTaskDetection ModelsFindings
[2]Self-built dataset of 10,581 images of wildfire from FD-dataset and VisiFire.Forest fire detectionYOLOv5, EfficientNet, EfficientDetThe findings revealed an improvement in fire-detection accuracy, with an average precision of 79.7% at an intersection over the union of 50%.
[3]Full 360-degree images with a resolution of 2048 × 128 were collected by Lidar sensors.Indoor and outdoor detection.YOLOx and YOLOv5YOLOx outperforms others with a precision of 100% and a recall of 95.3%.
[4]Collected dataset of 9200 images from cameras and video clips that describe night and day flames.Fire detection.YOLOv3Enhanced YOLOv3 outperforms others with an average precision of 98.9%.
[5]DOTA dataset including 11,268 satellite photos with a resolution of 20,000 × 20,000 and 15 target classifications.Landing sweet spots detection.YOLOv3, YOLOv4, YOLOv5With an accuracy of 70% and a recall of 61%, YOLOv5 exhibits an improvement in performance.
[6]NEMO datasetWildfire smoke detection.Faster R-CNN, RetinaNetThe results revealed an average detection accuracy of 42.3% and a detection rate of 98.4% within 5 min.
[7]Dataset of 16,503 images of two target classes.Fire and smoke detection.YOLOv5Swin-YOLOv5 outperforms others with an mAP improvement of 0.7 at an IOU of 0.5.
[8]Self-built dataset of 4815 images of fires and smoke.Fire detection.YOLOv5The improved model of YOLOv5 using K-means++ outperforms others in mAP by 4.4%.
[9]Collected aerial wildfire smoke dataset of 6000 images from Kaggle and google repositoriesWildfire smoke detection.YOLOv5YOLOv5 and K-means++ for anchor boxes have the best accuracy of 73.6% mean average precision.
[10]Newly constructed dataset with 11,367 samples and Pascal-VOC2012 with 640 × 640.Indoor and outdoor detection.YOLOv5The best average accuracy of 93.9 at an intersection over the union of 0.9.
[11]10,239 breast cancer images from CBIS-DDSM.Breast cancer detectionYOLOv5, YOLOv3YOLOv5x exceeds other models with 93.6% MCC. Its 96.5% accuracy and 96% mAP beat YOLOv3.
Table 2. Description of dataset following data-augmentation techniques.
DatasetTraining Set (80%)Testing Set (20%)Total AnnotationsAverage Image SizeImage RatioTarget Classes
Kaggle wildfire smoke-detection dataset159013317230.41 megapixel640 * 640Smoke
Table 3. Simulation Device Qualifications.
Device SpecificationDescription
ProcessorIntel(R) Core i7 10th generation.
Random access memory (RAM)8 Gigabits.
Operating systemWindows ×64
Central processing unit (CPU)1.50 GHz
Graphical processing unit (GPU)NVIDIA GeForce MX230
Table 4. Hyperparameter Tuning and Data-Augmentation Processing.
ParametersDetection Models
YOLOv3YOLOv5YOLOv7
Initial learning rate (lr0)0.010.010.01
Final learning rate (lrf)0.10.010.1
Momentum0.9370.9370.937
Box loss gain0.050.050.05
Classification loss gain0.50.50.3
Objectness loss gain1.01.00.7
IoU training threshold0.20.20.2
OptimizerSGDSGDSGD
Anchors per output layer6.146.146.02
Image input size640 × 640640 × 640640 × 640
Batches161616
Epochs100100100
Data AugmentationFor images (Grayscale by 50% and cropping by 10% maximum zoom).
Table 5. YOLO models performance and detection accuracy results.
ModelPrecisionRecallmAP 50mAP 50–95Obj LossBox Loss
YOLOv5n0.954040.936440.950470.565360.00510950.03299
YOLOv5s0.919670.962410.949030.558560.00535460.033172
YOLOv5m0.917150.932330.935640.548750.0064990.034107
YOLOv5l0.92860.917290.943790.542990.00699560.034483
YOLOv5x0.960270.954890.968630.542660.00500510.031649
YOLOv30.91910.939850.948170.53450.00609990.034607
YOLOv70.93090.91730.95080.50740.0034010.02954
Average0.929280.937350.949340.539140.00555920.032926
Disclaimer/Publisher’s Note: The statements, opinions and data contained in all publications are solely those of the individual author(s) and contributor(s) and not of MDPI and/or the editor(s). MDPI and/or the editor(s) disclaim responsibility for any injury to people or property resulting from any ideas, methods, instructions or products referred to in the content.

