Article

Study on Aerodynamic Drag Reduction at Tail of 400 km/h EMU with Air Suction-Blowing Combination

1
School of Locomotive and Rolling Stock Engineering, Dalian Jiaotong University, Dalian 116028, China
2
School of Electronic Information and Automation, Civil Aviation University of China, Tianjin 300300, China
3
Traction Power State Key Laboratory, Southwest Jiaotong University, Chengdu 610031, China
*
Author to whom correspondence should be addressed.
Machines 2023, 11(2), 222; https://doi.org/10.3390/machines11020222
Submission received: 5 January 2023 / Revised: 30 January 2023 / Accepted: 31 January 2023 / Published: 3 February 2023
(This article belongs to the Special Issue Advances in Intelligent Fault Diagnosis of Rotating Machinery)

Abstract

:
In order to further reduce the aerodynamic drag of High-speed Electric Multiple Units (EMU), an active flow control drag reduction method combining air suction and blowing is proposed at the rear of the EMU train. A numerical calculation method based on realizable k-ε is used to investigate the aerodynamic drag characteristics of a three-car EMU with a speed of 400 km/h. The influence of different suction-blowing mass flow rates, the position and number of suction and blowing ports on the aerodynamic drag and surface pressure of the EMU tail are analyzed. The results demonstrate that suction and blowing at the tail reduce the pressure drag of EMU. And with the growth of air suction-blowing mass flow rate, the aerodynamic drag reduction rate of the tail car gradually increases, but the increment of drag reduction rate gradually decreases. Under the same mass flow rate of the suction and blowing, the closer the ports are to the upper and lower edges of the windscreen, the lower the pressure drag of the tail car is. At the same flow flux of air suction and blowing, the more the number of ports, the better the pressure drag reduction effect of the tail car. This study provides a reference for the next generation of EMU aerodynamic drag reduction and is of great significance for breaking through the limitations of traditional aerodynamic drag reduction.

1. Introduction

Improving the running speed of trains is the symbol and goal of railway science and technology development [1,2,3]. Whether for the development of higher-speed wheel-rail trains or maglev trains, aerodynamics has always been a subject of concern. At present, the traditional aerodynamic drag reduction optimization, namely, streamlined design of trains and components and smooth design of train surface, has become increasingly mature, and the space for optimization has become narrower and narrower [4,5,6,7,8,9]. In order to further reduce the aerodynamic resistance of the EMU in steady-state operation, the flow control drag reduction technology is applied to the EMU by referring to aerospace, fluid machinery, ships, and other fields [10,11,12,13]. As an emerging development direction, this technology has great application prospects.
Based on the mode of energy consumption and control loop, flow control technology can be divided into active flow control and passive flow control [14,15,16,17,18]. Passive flow control has no auxiliary energy consumption and is mainly achieved by adjusting the optimized geometric surface. However, such control is basically pre-installed at a specific position and only for specific operating conditions [19,20,21]. When the flow field deviates from the design state, it will increase additional resistance. Active flow control achieves local or even global flow field improvement through local energy input, with the advantage that flow control can be adjusted according to different operating conditions. As one of the active flow control methods, the combination of suction and blowing has a positive effect on improving the aerodynamic performance of wind turbine airfoils in the aviation field [22,23,24,25,26,27,28]. Based on the S809 wind turbine airfoil, Luo et al. [29] proposed a drag reduction method of suction and blowing combined with jet and studied the control effect of this method at different angles of attack, jet momentum coefficient, and opening positions to achieve the purpose of increasing lift and reducing drag. Xu and Zha [30] found that the flow separation at the trailing edge of the wing was significantly suppressed by a combination of blowing and suction. In ground vehicles, the research on the application of active flow control technology to achieve vehicle drag reduction is still in the preliminary stage. Aubrun et al. [31] set micro jet holes between the top and the tail slope of the 25°Ahmed model and used steady jet flow to reduce the drag coefficient by 9~14%. Zhang et al. [32] used the position of the jet holes and the jet velocity as variables to achieve the best drag reduction effect of more than 6% on the tail of the 35°Ahmed model. Yang et al. [33] added a jet device to the central region of the tail airflow rotation in addition to the non-smooth surface arranged at the tail of the MIRA straight-back model, which improved the tail airflow structure of the model and reduced the aerodynamic resistance by combining active and passive flow control. For rail vehicles, the method of aerodynamic drag reduction based on active flow control is still in the exploratory stage, and the existing literature only considers suction drag reduction or jet drag reduction without combining the two. Lin et al. [34] put forward the drag reduction scheme of suction boundary layer control for high-speed trains and set suction holes at the boundary layer separation points of the head car and the tail car, respectively, reducing the aerodynamic drag coefficient of the whole vehicle, with the maximum drag reduction rate reaching 6%. Huang et al. [35] set jet slits in the transition area between the uniform section body and the streamlined tail of high-speed trains, using 0.05 times the train speed as the jet speed, and the drag reduction rate of the whole train was up to 4.88%. Based on the principle of supercavitation drag reduction technology, Liang et al. [36] set up multiple rows of jet holes above the window area of the head train and sprayed different densities of gas on the surface of the high-speed train. The simulation results show that spraying low-density gas will reduce the friction resistance of the train, and spraying air and high-density gas will increase the friction resistance of the train. E.O.Shkvar et al. [37] proposed the method of micro-blowing drag reduction on the surface of high-speed trains, establishing the relationship between the drag reduction effect and micro-blowing area as well as strength. When micro-blowing is 70% of the surface area of a carriage, the drag reduction effect can reach 5.25%. Mitsuru Ikeda et al. [38] applied the blowing flow control technology to the pantograph of high-speed trains and arranged the blowing holes in rows at the trailing edge of the pantograph head to improve the aerodynamic characteristics of the pantograph during high-speed operation. In addition, some other methods are also proposed in recent years [39,40,41,42,43,44,45,46,47,48,49,50].
When the speed of EMU trains reaches 400 km/h, the aerodynamic drag accounts for more than 90% of the total drag, so it is necessary to reduce the aerodynamic drag through flow control technology on trains of this speed level [51,52,53,54,55,56,57,58]. In the previous studies on drag reduction by blowing and suction of trains, the source of gas is rarely considered in blowing, and the flow direction of gas is rarely considered in suction. In this paper, it is proposed that the suction ports are arranged in the streamlined body transition area at the upper edge of the windscreen at the rear of the train, and the air-blowing ports are arranged in the area below the windshield and above the coupler deflector. The gas can be transferred through the built-in flow channel. Taking the mass flow of air blowing and suction, the distance and number of air ports as variables, the drag reduction effect of the tail car is explored, and the influence mechanism and drag reduction characteristics are analyzed and summarized to provide a reference for the aerodynamic drag reduction mode of the next generation EMU.

2. Calculation Model and Method

2.1. Calculation Model and Parameters

In this paper, a 1:1 non-scale aerodynamic model of EMU is established based on a certain type of high-speed EMU train. It consists of three cars, which are composed of head car, middle car, and tail car. According to the general treatment of train aerodynamics, the EMU model is simplified. On the basis of the symmetry of the EMU structure, the longitudinal central surface of the car body is taken as the symmetry surface, and the semi-car body model of the EMU is selected as the object of study. The details of the roof pantograph components, air conditioning equipment, doors and windows, and windshields at the body are omitted and replaced with curved surfaces during modeling. As this paper mainly studies the influence of air blowing and suction at the rear of the train on the aerodynamic resistance of the EMU, the structure of the bogie is deleted, and the treatment method in the reference is used to seal the cavity where the bogie is located with a cover plate and coincide with the edge of the body. The simplified model retains the large slenderness ratio of the EMU and the aerodynamic shape of the head and tail, as shown in Figure 1. The number of grids is reduced, and the period of numerical calculation is shortened. The height of the EMU is selected as the characteristic length, H = 3.89 m. The semi-body model has a length of L = 20 H, a width of W = 1.63 m and a maximum cross-sectional area of A = 5.5 m2.

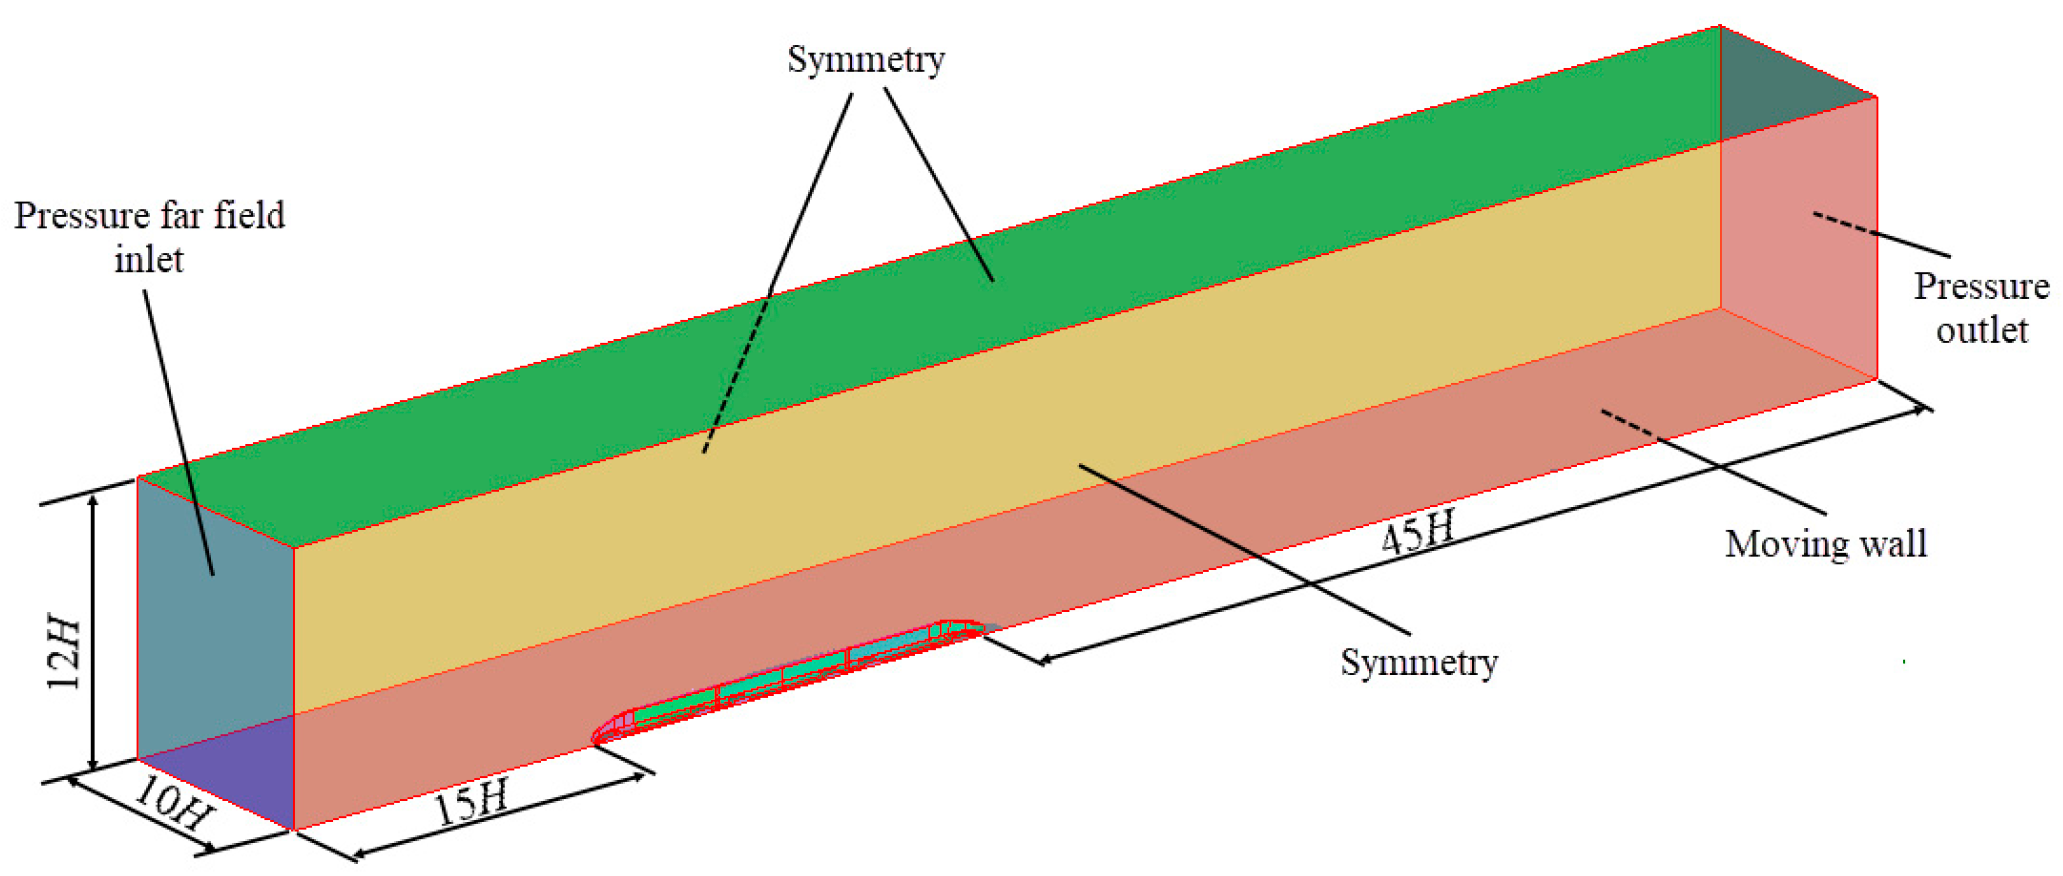
2.2. Calculation Domain and Boundary Conditions

The geometric dimensions and boundary conditions of the calculation domain are shown in Figure 2. The multiple units are located in front of the center of the calculation domain. the distance between the nose end and the inlet of the calculation domain is 15 H, and the distance between the nose end and the outlet of the calculation domain is 45 H. In this paper, the three-dimensional compressible Navier-Stokes equations are used to describe the flow field. The inlet condition is set to the pressure-far-field boundary, and the outlet condition is set to the pressure-outlet boundary. Reference analyzed the train surface roughness has little effect on the aerodynamic drag, so its surface is set to zero roughness of the fixed wall without slip. The bottom surface of the computational domain is set as a moving wall to simulate the relative motion between the EMU and the track during operation, and the speed is equal to the airflow velocity. The top surface, the side surface, and the longitudinal section central plane of the computational domain are set as symmetrical planes to ensure that the normal velocity of the wall is 0 and eliminate the influence of the wall on the flow field.

2.3. Meshing

The calculation mesh is divided by ICEM CFD. In order to make the mesh have a good fit, triangular mesh elements are used on the car body surface because there are a large number of complex surfaces on both sides of the head and tail of the EMU. Tetrahedral element meshes are adopted in the enriched grids region, and the hexahedral element meshes are used in the sub-enriched grids region and the external region, as shown in Figure 3a. In order to more accurately calculate the aerodynamic drag on the train body surface, as shown in Figure 3b, boundary layer grids (prismatic layer) are set close to the body wall, with a total of 20 layers, and the mesh growth rate is 1.15 per layer to facilitate the capture of the shear layer and the separated flow near the wall surface of the EMU. The mesh height of the first layer of the body wall is set to 0.001 m to ensure that y+ is within the appropriate range of the corresponding turbulence model.

2.4. Calculation Method and Turbulence Model

The aerodynamic drag characteristics of EMU with a speed of 400 km/h are studied in this paper. Mach number exceeds 0.3, so the air compressibility effect should be considered. The numerical simulation of this steady flow field is carried out in ANSYS Fluent. The implicit solution method of density-based solver (DBS) is selected as the solver type. The turbulence model realizable k-ε is selected for numerical simulation, and the enhanced wall function method is used. In addition, least squares cell based is used for gradient discretization, and second order upwind scheme is used for convection and dissipation terms. The residuals are set to 10−5 to ensure that the drag coefficient of each car is stable in the iterations. The drag coefficient of the EMU is expressed by the dimensionless coefficient as follows:
C d = F d 0.5 ρ U 2 S
where Fd is the drag of the EMU in operation, ρ is air density, U is the speed of the EMU, and S is the cross-sectional area of the EMU.

2.5. Reliability Analysis

In order to eliminate the influence of grid density on the calculation results and ensure calculation accuracy under the condition of limited computing resources, three different mesh densities-coarse, medium, and fine mesh-are discretized. Table 1 shows the aerodynamic drag coefficients of each car under three meshes with different densities.
It can be seen from Table 1 that the aerodynamic drag coefficients obtained by the middle car and the tail car in the three density grids are not much different, but the aerodynamic drag coefficient of the head car is relatively large. When the total number of grids exceeds 10.55 million, the aerodynamic drag coefficient of each car is stable, and the number meets the grid independence requirements. The subsequent numerical simulation of the EMU will be carried out on the basis of medium-density grids.
In order to verify the accuracy of the numerical method and the car body model, the semi-car body model, medium grid strategy and numerical calculation method described in this paper are compared with the wind tunnel test in reference. The 1:25 scale model of CRH2 EMU is selected for the test, and the test section of the wind tunnel is 14 m, and the cross-section is 3 m × 3 m. The numerical verification model is consistent with the wind model, as shown in Figure 4. The wind tunnel wall is used as the train floor, and the balance is installed at the bottom of the train center. The entrance of the test section is 5 m away from the train head, and the exit of the test section is 9 m away from the train head.
Two data of wind tunnel test with external balance measurement and numerical calculation without external balance of a three-car EMU are selected and compared with the data obtained by the numerical calculation method in this paper when the wind speed is 40 m/s, 60 m/s, and 80 m/s, shown in Figure 5.
Through the comparison of the data in Figure 5, the maximum error rate between the numerical simulation results of the external balance in this paper and the wind tunnel test data in the reference is 3.50%. Additionally, the maximum error rate between the numerical simulation results without the external balance in this paper and the numerical simulation results without the external balance in the reference is 5.61%, indicating that the algorithm and the half-car body model in this paper are correct and credible, and can accurately solve the aerodynamic drag of the EMU.

3. Airflow Disturbance Characteristics and Setting of Suction and Blowing Ports

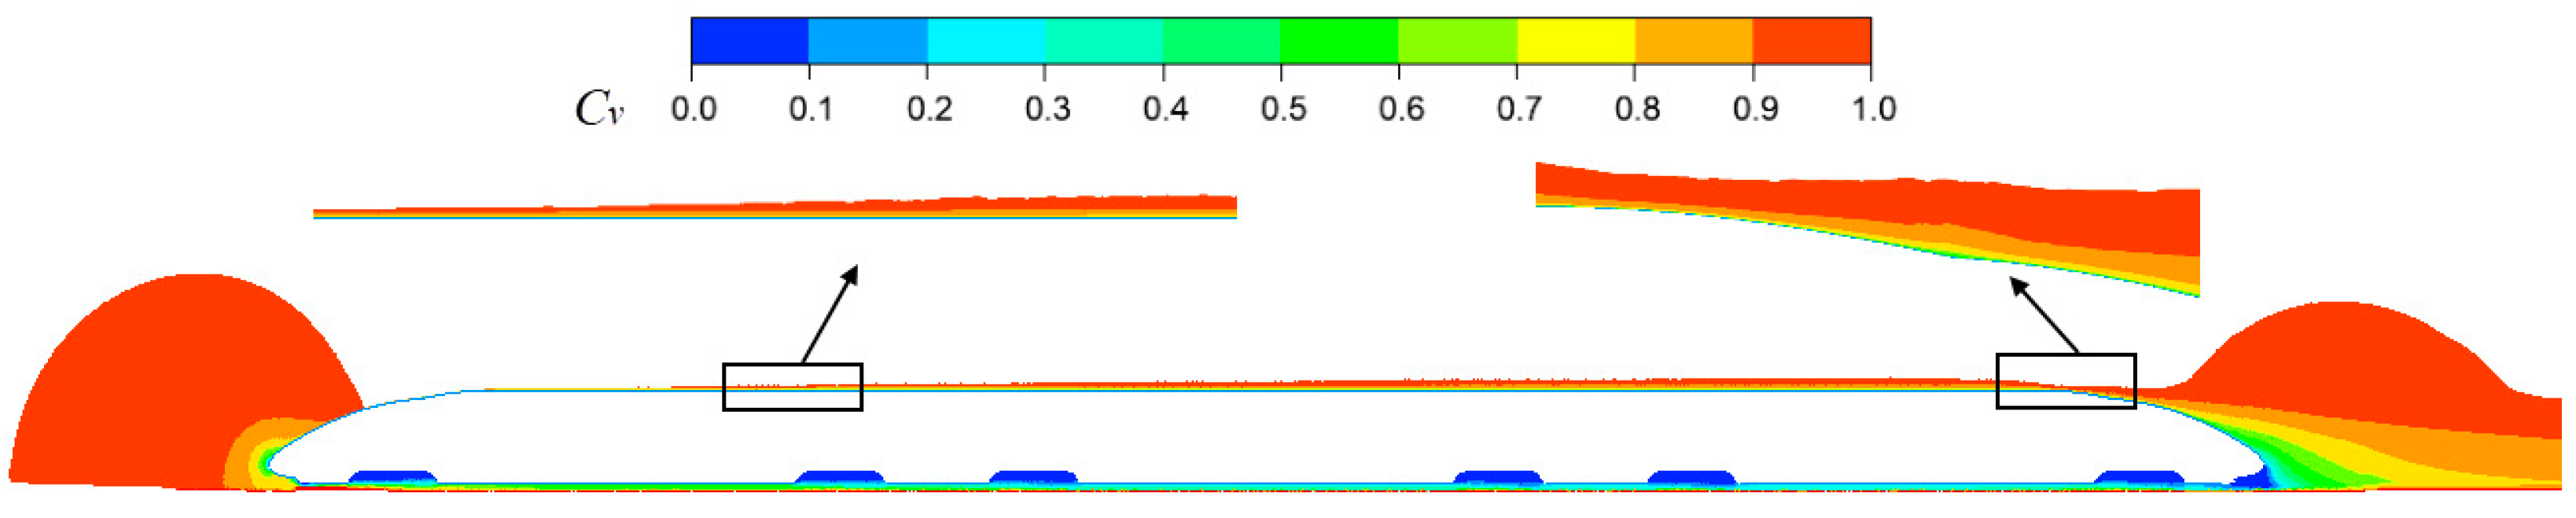
3.1. Surface Boundary Layer and Pressure Distribution of EMU

The analysis of boundary layer development law is the key to studying the drag reduction of EMU with an air suction-blowing combination. As a viscous fluid, when air flows through the side wall of the car body, a thin flow layer with an obvious velocity gradient is formed near the wall, which is called the boundary layer. Its thickness is defined as the vertical distance between the wall and the position where the wall’s tangential flow velocity in the normal direction is 0.99 times the incoming flow velocity. The dimensionless velocity Cv and pressure coefficient Cp are defined as follows:
C v = V V
C p = 2 ( p p ) ρ V 2
where V is the velocity of any point in the flow field, V is the inlet flow velocity (that is, the running speed of the EMU, which is 111.11 m/s), p is the pressure at any point in the flow field, and p is atmospheric pressure, p = 101,325 Pa.
The boundary layer cloud map distributed along the train length on the central longitudinal section of the multiple units with a speed of 400 km/h is colored with Cv, as shown in Figure 6. Additionally, the pressure coefficient cloud diagram is colored by Cp, as shown in Figure 7. Combined with two figures for analysis, the aerodynamic excitation characteristics around the train are as follows.
(1)
High-speed air strikes at the nose tip of the head car and forms a block. The speed drops sharply, and the pressure rises rapidly. Near the tip of the nose, Cv is close to 0, and Cp is about 1 at the maximum, where a strong positive pressure zone appears;
(2)
Due to the effect of pressure difference, on the one hand, the compressed air moves backward along the car body, forming a negative pressure zone in the transition area between the streamlined curve of the head car and the body of the equal section, and forming a boundary layer with a large velocity gradient. On the other hand, the compressed air moves to the bottom of the train, accelerating the movement between the bottom of the body and the ground to form a strong negative pressure zone, and the minimum Cp is about −1.2;
(3)
The airflow moves backward along the uniform section of the car body, and the pressure rises slowly and is slightly lower than the atmospheric pressure. At this time, the boundary layer gradually develops and thickens along the car body;
(4)
In the sudden change area where the airflow just flows through the tail section, the local vacuum above the streamlined tail causes the airflow to accelerate and form a negative pressure zone again;
(5)
After the airflow passes through the sudden change of the tail transverse section, the speed becomes smaller, and the pressure returns to normal, causing the boundary layer to separate from the wall surface of the EMU and forming a positive pressure near the nose end of the tail.

3.2. Setting of Suction and Blowing Ports

According to the distribution of boundary layer and pressure during the steady-state operation of the EMU, air ports are set in the two areas of the tail of the train to reduce the aerodynamic drag. A suction zone is arranged in the boundary layer separation area of the train tail to remove the low momentum fluid and suppress the flow separation. A blowing zone is set in the nose tip area of the tail car to control the wake flow to improve the tail airflow structure.
For the semi-body model, the number of air ports in the two regions and the number of air holes in each port is set to be the same (3 ports × 8 holes). The diameter of the air hole is 60 mm, and the spacing of the air holes in each port is 120 mm. Taking the upper edge of the windscreen as the starting position of the first suction port, extending to the direction of the equal section body with a fixed spacing; the lower edge of the windscreen is the starting position of the first row of blowing ports, extending to the tip of the nose according to a fixed spacing. The position of the suction port of the semi-body model is symmetrically displayed through the longitudinal section center plane, as shown in Figure 8b,c.
In addition, the airflow between the suction holes and the blowing holes can be transferred through the compressor device, and the entire suction-blowing process does not require an additional air source, as shown in Figure 8a. In order to simplify the calculation, the internal flow channel in the optimization simulation model can be omitted. The suction hole is set as the mass-flow-outlet boundary, and the blowing hole is set as the mass-flow-inlet boundary. The mass flow of the inhaled gas is equal to the mass flow of the blown gas. The blowing direction is consistent with the incoming flow direction, and the remaining conditions are consistent with those in the original model. The main factors affecting the drag reduction effect of the rear end of the EMU include the position distribution, arrangement mode, number of air ports, mass flow rate of blowing and suction gas, etc., and a certain factor will be analyzed step by step as a single variable.

3.3. Expression of Related Physical Quantities

To facilitate the analysis, mass flow rate and mass flux are introduced to express the intensity of suction and blowing, where the mass flux is the rate of mass flow rate, as follows:
q j = A V j ρ
G j = q j A
where qj refers to the mass flow rate of air suction and blowing, Gj refers to the mass flux of air suction and blowing, Vj refers to the speed of air-blowing and suction ports, A refers to the total cross-sectional area of all air-blowing holes or suction holes, and ρ represents the air density, which is 1.225 kg/m3.
The drag reduction rate of the EMU is defined as the following expression:
α = F d ( n S B ) F d ( S B ) F d ( n S B )
where α represents the drag reduction rate, Fd(n−S−B) represents the aerodynamic drag of EMU without blowing and suction, and Fd(S−B) represents the aerodynamic drag of EMU under a certain suction-blowing condition.

4. Results Analysis

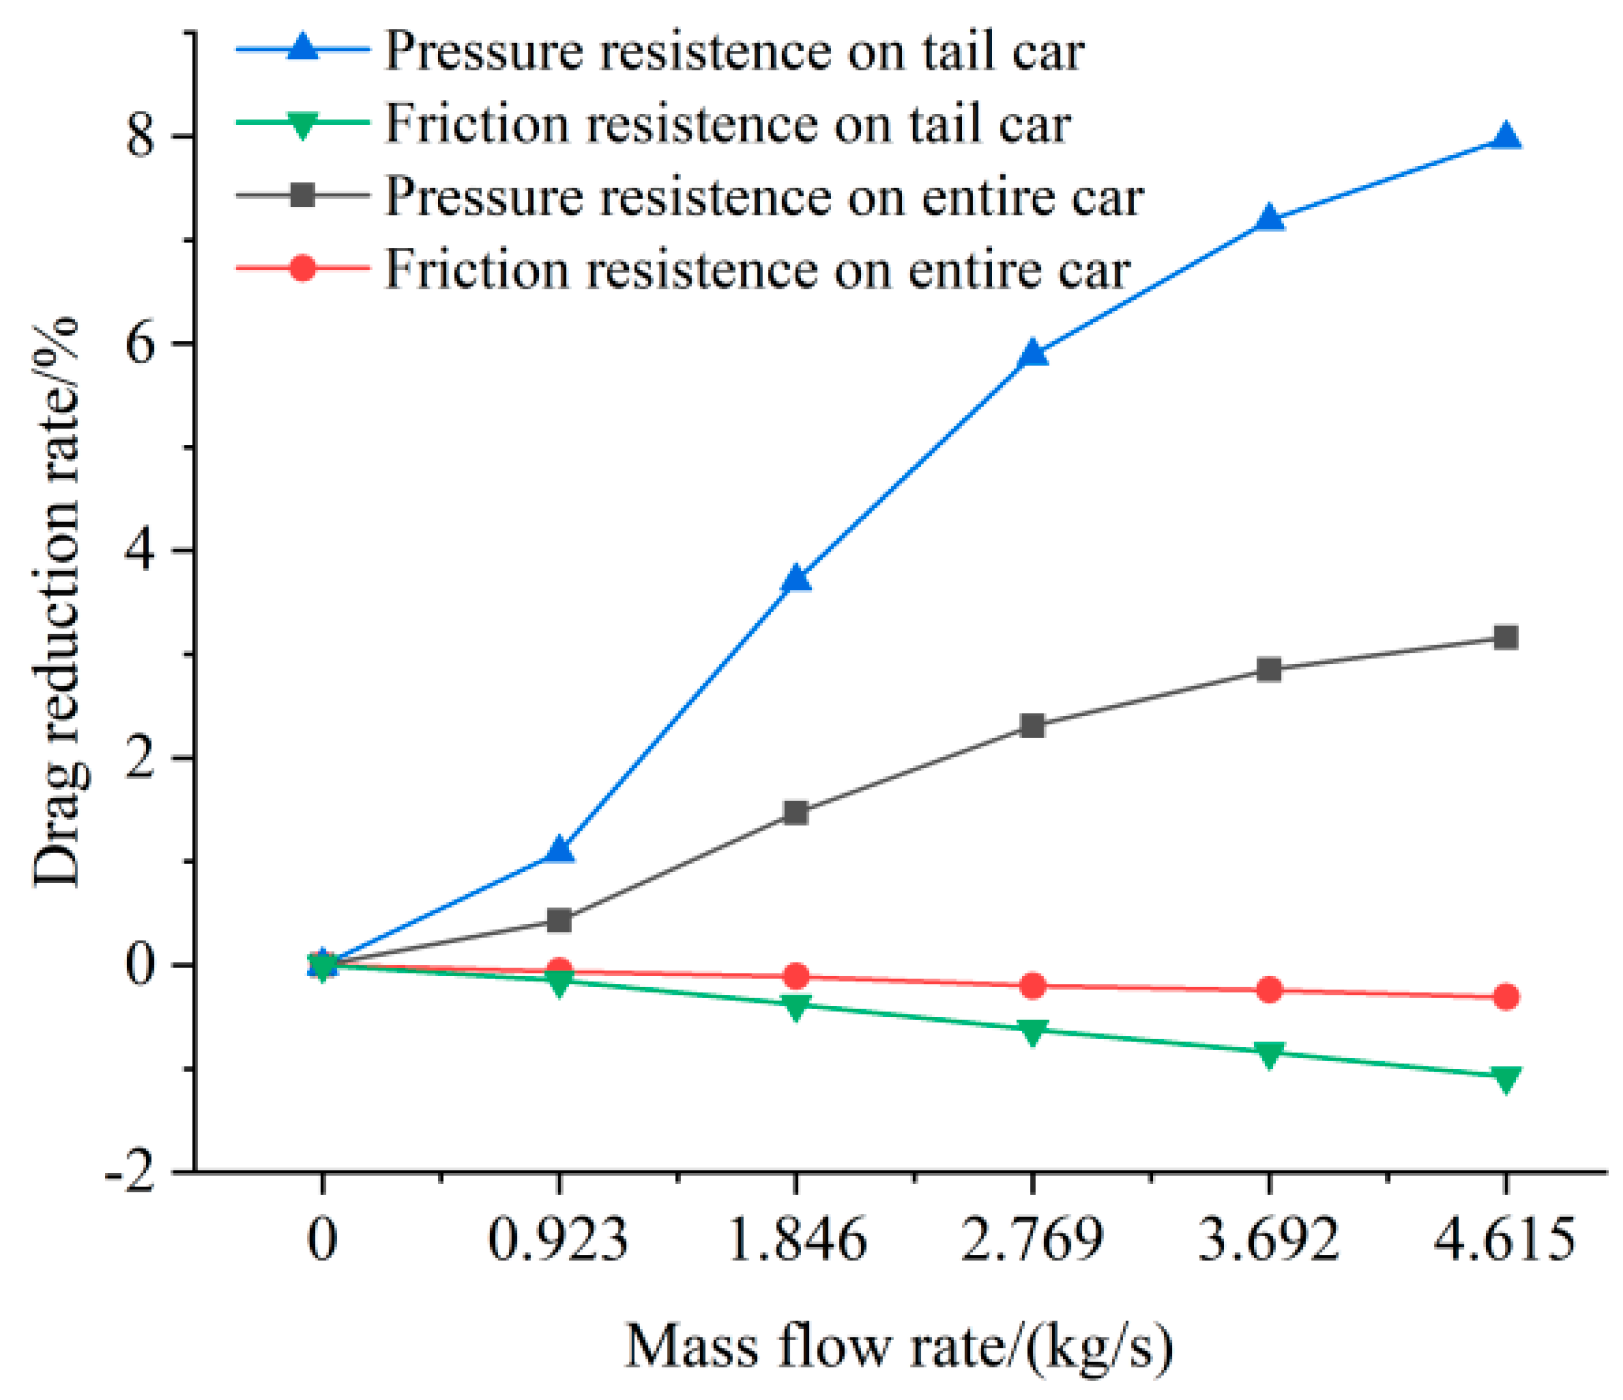
4.1. The Influence of Different Mass Flow Rate on the EMU Aerodynamic Drag

In order to study the effect of the mass flow rate of air suction and blowing on the aerodynamic drag of the EMU, numerical simulation is carried out for 6 working conditions of the optimized model. The air suction-blowing mass flow rate is set as 0, 0.923, 1.846, 2.769, 3.692, and 4.615 (kg/s), respectively; corresponding air blowing and suction speeds are 0, 0.1 U, 0.2 U, 0.3 U, 0.4 U, 0.5 U (U represents the speed of EMU, which is 111.11 m/s). The distance between the suction ports along the surface of the car body is set to 1060 mm, and the vertical distance between the blowing ports is set to 150 mm. Additionally, based on the above combination parameters, the aerodynamic drag coefficient and drag reduction rate of each car are analyzed.
According to the drag coefficient obtained at each position in Table 2, it can be observed that the setting of the suction and blowing ports at the tail of the EMU only has a great influence on the aerodynamic drag of the tail car, and has little influence on the aerodynamic drag of head car, the middle car and the windshield area. As shown in Figure 9, when the mass flow rate is between 0 and 4.615 kg/s, the aerodynamic drag coefficients of the tail car and the whole car raise with the increase in the mass flow rate, and the two physical quantities are positively correlated; When the mass flow rate exceeds 1.846 kg/s compared with the previous working condition, the drag reduction rate increment of whole car and tail car decreases with the increase in the mass flow rate. This shows that when the mass flow rate is greater than 1.846 kg/s, if the same unit drag reduction increment is attained, more energy will be consumed than before.
In the following, the differential pressure resistance and friction resistance of the EMU are analyzed, respectively. From Figure 10, it can be seen that the setting of blowing and suction ports at the tail of the EMU mainly reduces the differential pressure resistance and has no drag reduction effect on the friction resistance. When the mass flow rate is 0~4.615 kg/s, the pressure difference drag reduction rate of the tail car and entire car raises with the increase in the mass flow rate of the suction and blowing, and the two physical quantities are also positively correlated. The friction drags reduction rate of the tail car and the entire car decreases slightly with the increase in the mass flow rate of air suction and blowing, which indicates that the drag reduction method of combining air suction and blowing at the rear of the train has a drag reduction effect only on the differential pressure resistance of the tail car, and has no drag reduction effect on the friction resistance, but will slightly increase the friction resistance.
Figure 11 shows the pressure coefficient nephogram of the train tail end when the mass flow rate of the optimized model is 0, 0.923, 2.769, and 4.615 (kg/s). With the increase in mass flow rate, the area of positive and negative pressure areas on the tail surface of the train does not change much, and the actual effect of drag reduction is the amplitude of positive and negative pressure areas. From the perspective of the suction area at the top of the train tail, the increase in mass flow will lead to a large negative pressure gradient around the suction port, and the farther the suction port is from the upper edge of the windscreen, the greater the negative pressure gradient. For the air-blowing area at the nose tip of the train tail end, the increase in the mass flow rate will lead to a large positive pressure gradient above the air-blowing port. Combining Figure 10 with the cloud diagram changes of the positive and negative pressure areas at the tail end of the train, it can be shown that the drag reduction increment of the pressure difference resistance of the tail car will decrease with the increase in the mass flow rate of the blowing and suction.

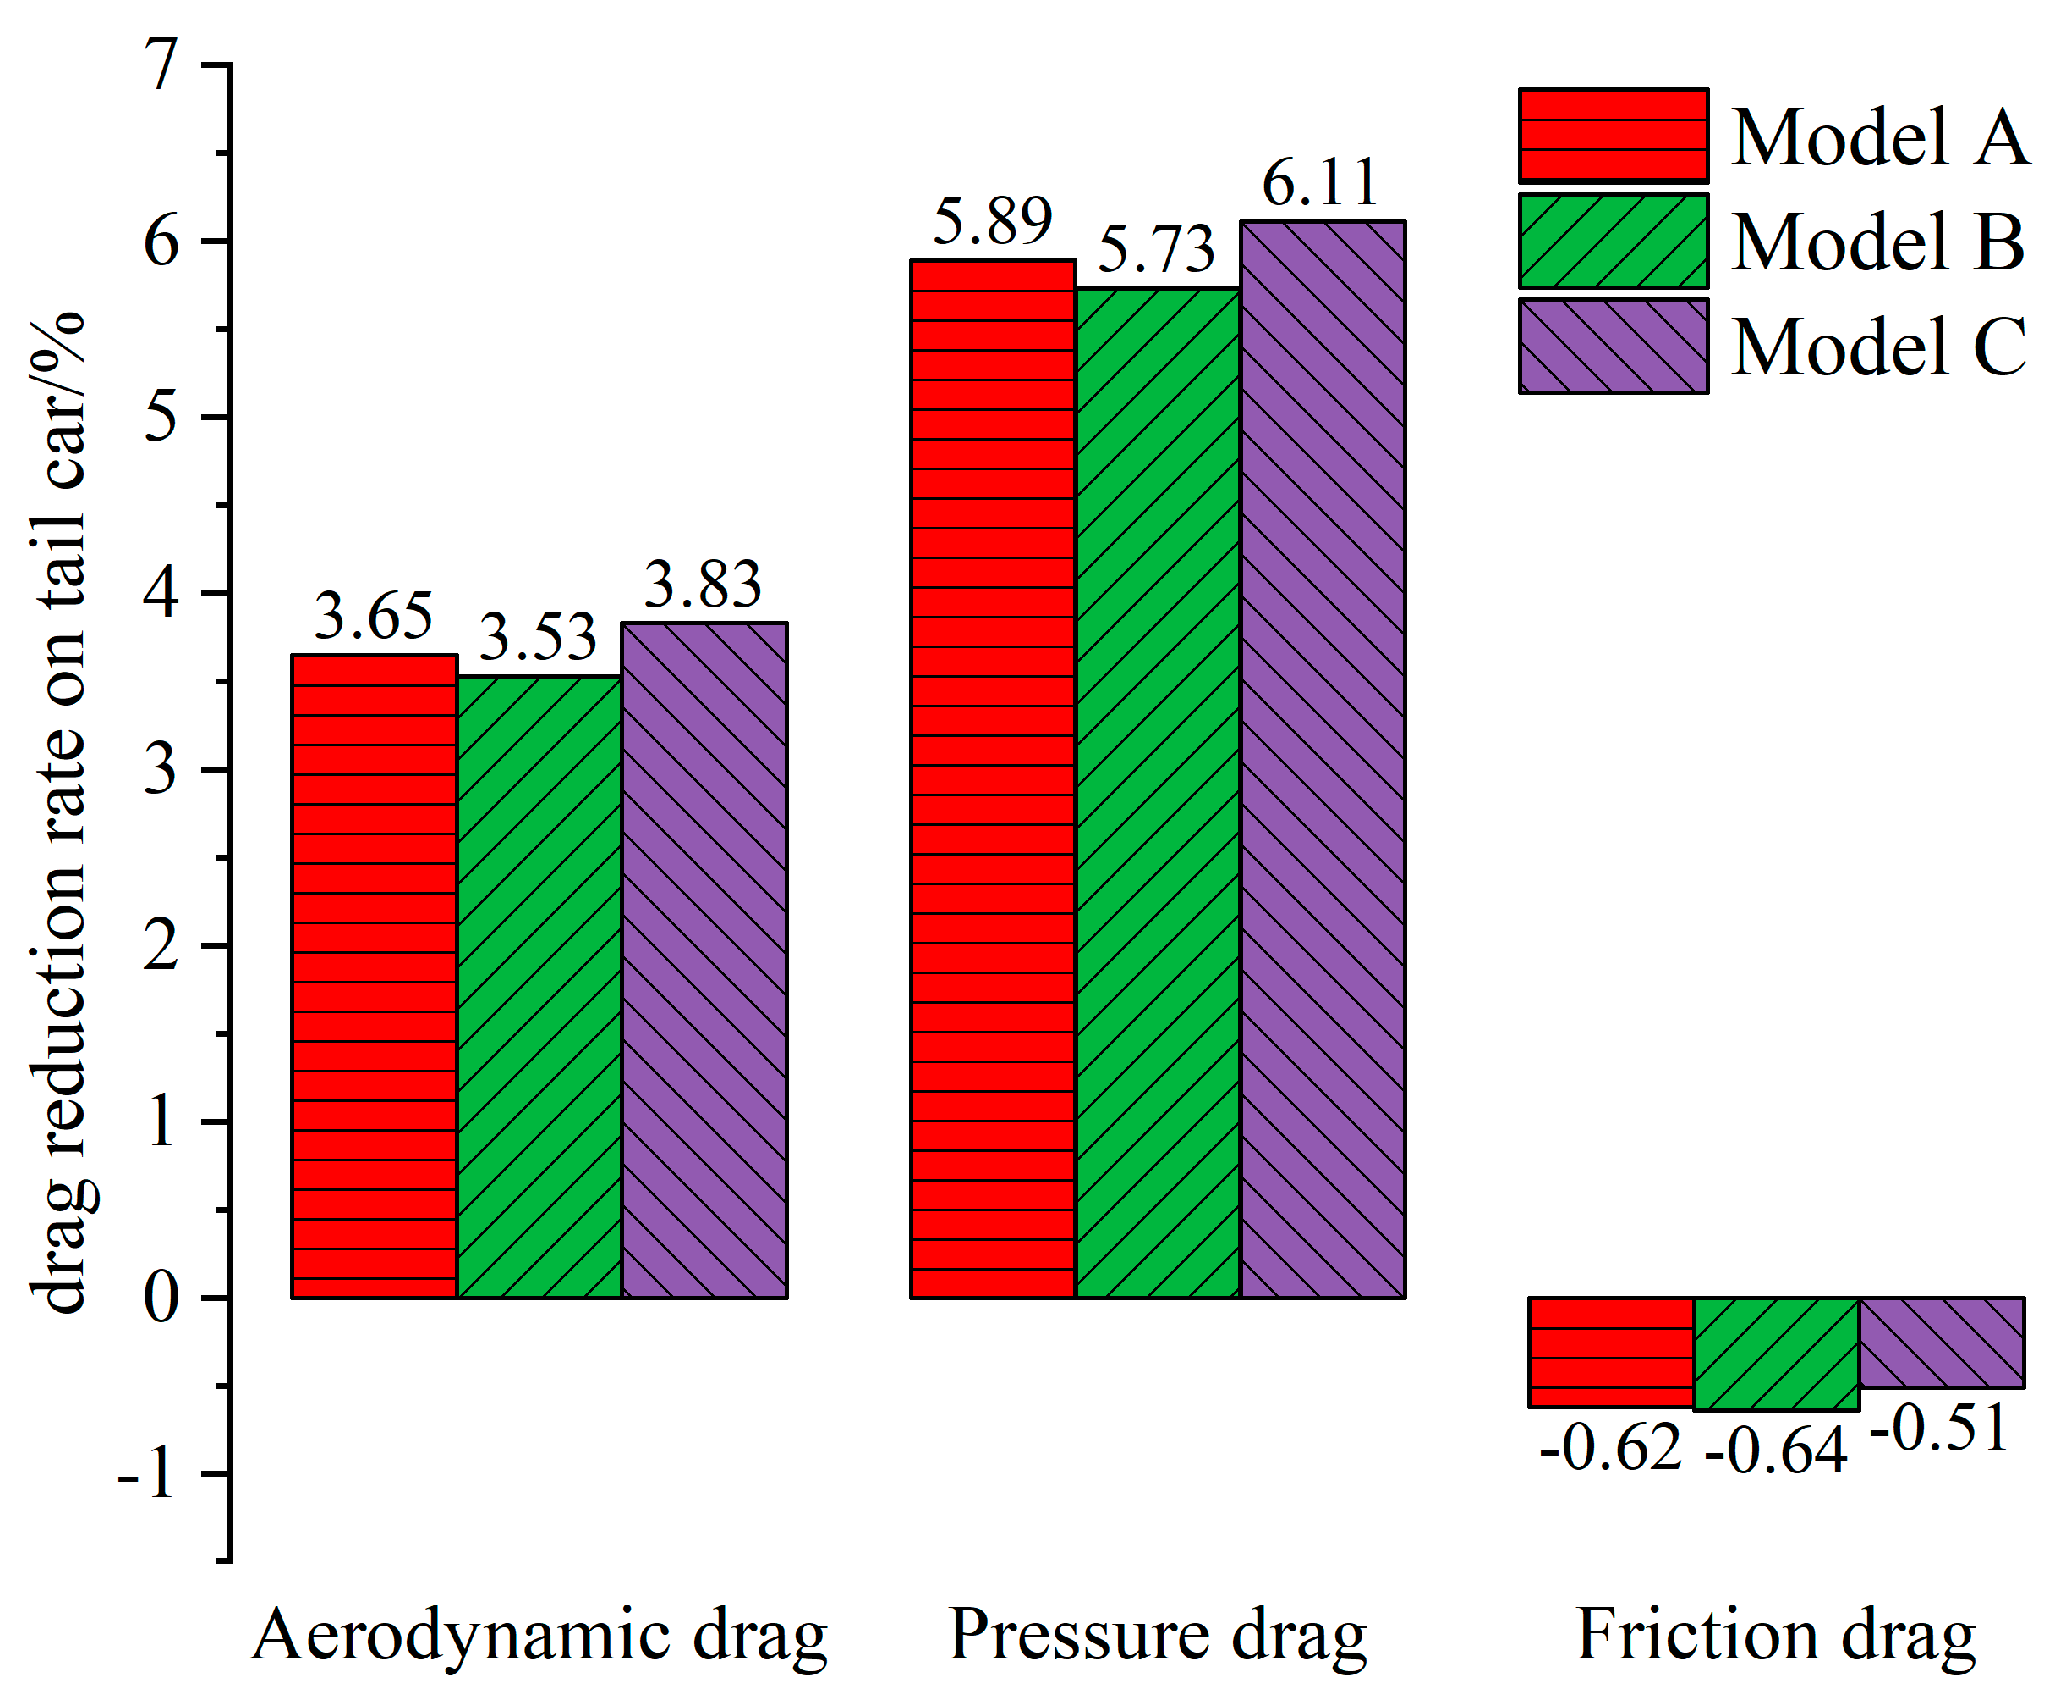
4.2. The Influence of the Distance between the Ports on the Aerodynamic Drag

In order to compare the influence of the distance between the suction and blowing ports on the aerodynamic resistance of the EMU, two different spacing air ports are set up in the blowing and suction areas, respectively, without considering the interference between the blowing ports and the coupler deflector. The fixed variable method is used for analysis. The spacing of each port is used as a variable, and the spacing and aperture of the holes in each port are used as constants. The number of air ports and holes in each model is the same (for semi-body models, the total number of suction holes and blow holes is 3 × 8), and the drag reduction is carried out at a mass flow rate of 2.769 kg/s. The parameter settings of the models are shown in Table 3.
The drag reduction method of combining blowing and suction in the tail car does not affect the drag coefficient of the head car and the middle car, so only the aerodynamic drag (including differential pressure drag and friction drag) of the tail car of the four models is analyzed. In Figure 12, comparing models A and B, it can be seen that when the distance between the suction ports along the surface of the car body is constant, the smaller the distance between the blowing ports along the vertical direction, the greater the drag reduction rate. Comparing models A and C, it can be seen that when the distance between air-blowing ports in the vertical direction is fixed, the smaller the distance between air suction ports along the car body surface, the greater the drag reduction rate. This shows that although the three models have the effect of drag reduction, the more concentrated the suction ports are near the upper edge of the tail windscreen, and the more concentrated the blowing ports are near the lower edge of the tail windscreen, the better the effect of drag reduction on the differential pressure resistance of the tail car.
Combined with Figure 13 and the aerodynamic drag reduction rate of the tail car, it can be seen that in the suction area above the windscreen, the area of the surface negative pressure where the suction ports are densely arranged (model C) and sparsely arranged (models A and B) are located is approximately the same, but the amplitude of the negative pressure between them is quite different. The farther the sparsely arranged suction ports are from the upper edge of the windscreen, the greater the negative pressure intensity around the suction ports. On the contrary, since the densely arranged suction ports are concentrated at the upper edge of the windscreen, the negative pressure value of their positions in the original model is smaller than that far from the upper edge, so arranging suction ports here can achieve a better drag reduction effect. In the blowing area at the lower edge of the windscreen, the surface positive pressure area of the dense arrangement (models A and C) and the sparse arrangement (model B) of the blowing ports are approximately the same, but the positive pressure amplitude of the two is quite different. The closer the blowholes are arranged to the lower edge of the windscreen, the greater the positive surface pressure value of the lower part of the windscreen due to the airflow disturbance. Therefore, it is better to arrange blowholes centrally at the lower edge of the windscreen for drag reduction.

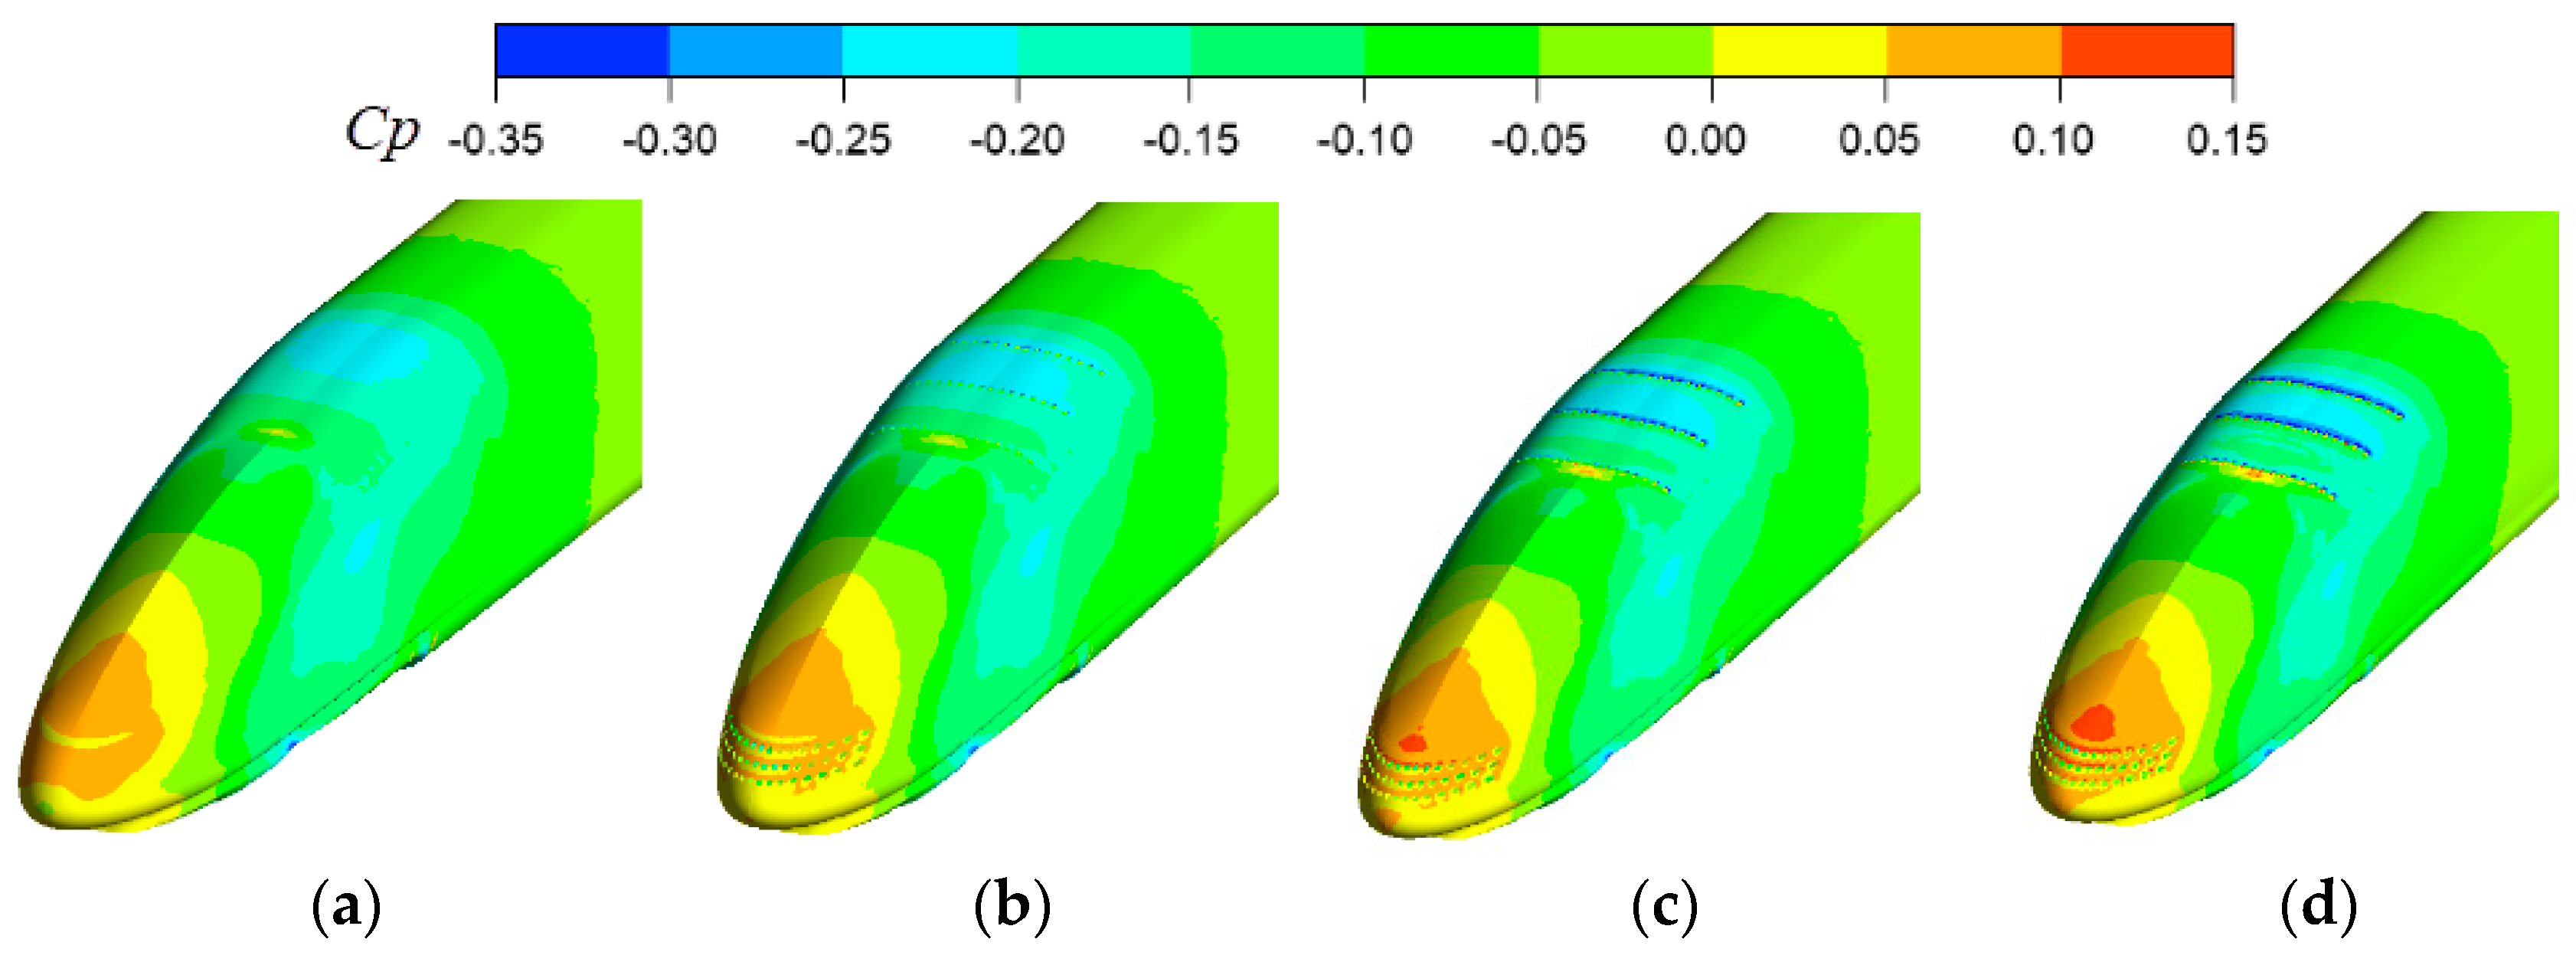
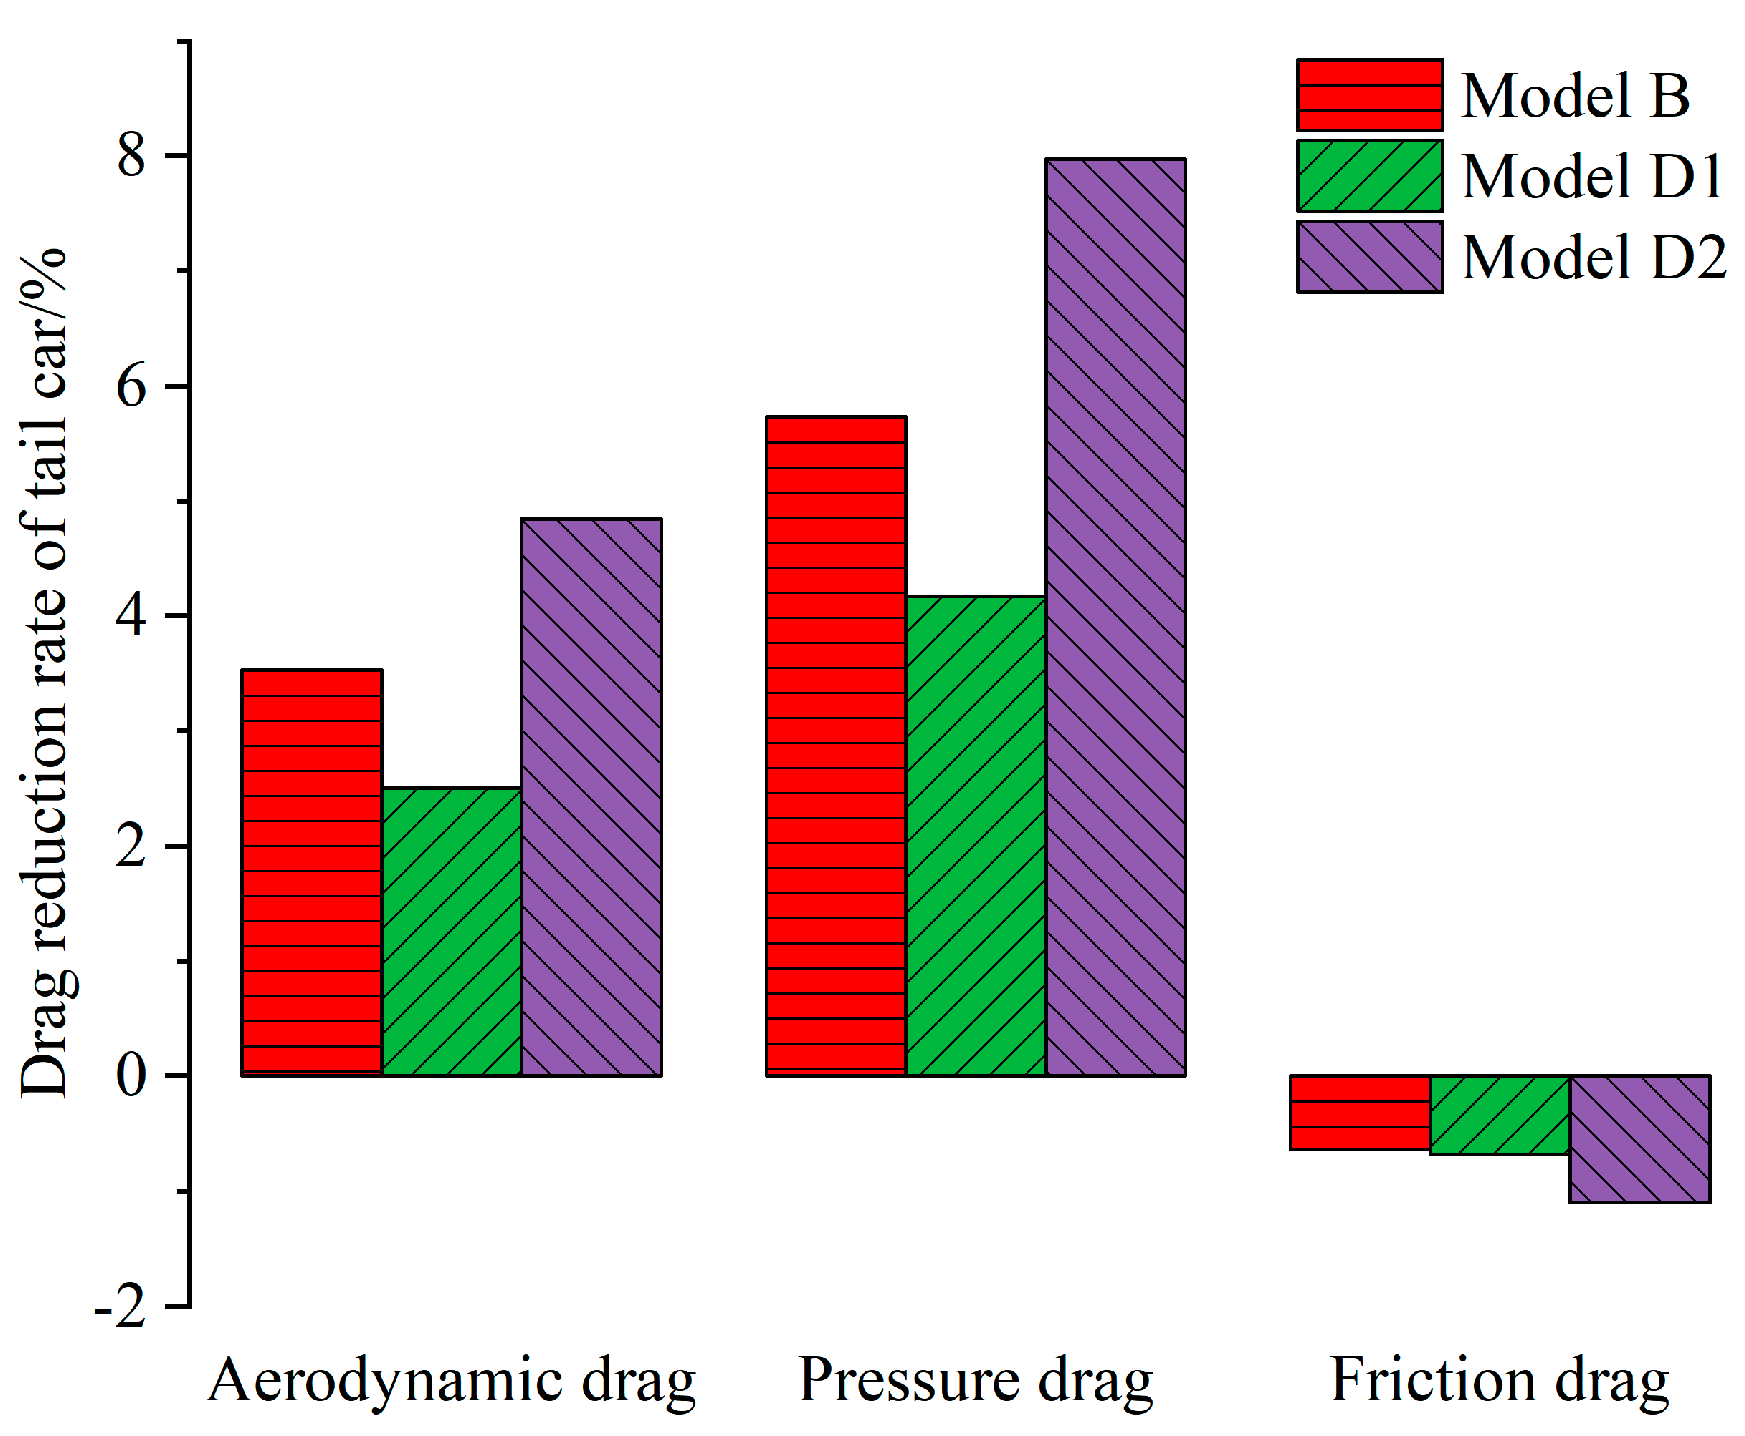
4.3. The Influence of the Number of Ports on the Aerodynamic Drag

In order to compare the influence of the number of air suction and blowing ports on the aerodynamic drag of EMU, the ports at the tail of model D are, respectively, set as five rows, and the interference between the air-blowing holes and the coupler deflector is not considered. The difference between model B and model D is only the number of ports and other physical quantities are set the same for a single port. As shown in Table 4, model D is divided into two working conditions (later represented by models D1 and D2), and the mass flow rate and mass flux of the two working conditions are calculated according to the formula. When the EMU trains are running at the same speed, the aerodynamic drag reduction characteristics of model B and model D1 are compared and analyzed under the same mass flow rate of blowing and suction; then compare and analyze the aerodynamic drag reduction characteristics of model B and model D2 under the same mass flux of air blowing and suction.
Figure 14 shows the aerodynamic drag reduction rate, differential pressure drag reduction rate, and friction drag reduction rate of the tail car of three kinds of car body models at the same speed as the multiple units. Comparing model B with model D1, it can be seen that at the same mass flow rate, the fewer the number of air-blowing and suction ports at the rear of the EMU, the better the drag reduction effect of its aerodynamic resistance and differential pressure resistance. Comparing model B with model D2, it can be seen that at the same mass flow rate, the more the number of air blowing and suction ports at the rear of the EMU, the greater the aerodynamic drag reduction rate and differential pressure drag reduction rate, but the corresponding friction drag increase rate also increases. However, the corresponding friction drag reduction rate also increases negatively.
Figure 15 depicts the rear surface pressure of three train models. In the case of the same total mass flow rate (model B and model D1), the increase in the number of suction and blowing ports means that the speed of air flowing through each hole becomes slower, which weakens the intensity of air suction or blowing of a single hole, and the positive pressure at the tip of the tail nose does not amplify significantly. At the same mass flow rate (models B and D2), the increase in the number of suction and blowing ports means that the ability to transfer the airflow will become stronger, and the positive pressure value at the nose of the EMU is also more obvious, reducing the overall pressure difference of the tail car, thereby reducing the aerodynamic resistance.

4.4. Analysis of Drag Reduction Mechanism

The aerodynamic resistance of EMU is generated by the viscous effect of airflow and vortex field, which is mainly divided into pressure drag and friction drag. In the simulation calculation, it is found that the differential pressure resistance is mainly concentrated in the head and tail cars of the EMU and accounts for 63% and 66% of the aerodynamic drag of the head and tail cars, respectively. This is because the head car is on the windward side and receives a large air resistance, while the tail car brings negative pressure due to the wake vortex. The combination of suction and blowing can effectively reduce the pressure difference on the vehicle body surface, reduce the energy dissipation of turbulent kinetic energy at the tail end, and thus reduce the aerodynamic resistance of the tail vehicle.
On the one hand, when the airflow flows through the variable cross-section area at the top of the tail, the intake holes located here will draw part of the airflow into the built-in flow passage. As shown in Figure 16, when the holes are not working, the boundary layers at different speed levels in this area are smooth and stable. After the holes start to inhale, the part of the boundary layer at the lower speed level from the surface of the EMU is pulled and thinned by the suction, which can delay the boundary layer separation. It can be predicted that the effect of delaying boundary layer separation is more obvious by increasing the number of suction ports and mass flux.
On the other hand, the airflow from the air-blowing ports at the lower edge of the windscreen converges with the tail vortex of the EMU. As shown in Figure 17, when the air-blowing port is not working, the tail vortex is generated by the confluence of the air from the side, top, and bottom of the train at both sides below the nose of the rear of the EMU. When the blowing ports are in operation, the wake flows into a stream of air ejected from the air-blowing port before it is formed, providing kinetic energy for the wake not to fall off. However, the jet flow rate at the air-blowing port cannot be increased all the time, which will damage the structure of the tail vortex. Additionally, on the contrary, it will reduce the differential pressure drag reduction rate of the tail car and increase the friction resistance, affecting the drag reduction effect of the tail car.

5. Conclusions and Prospects

In this paper, the numerical calculation method based on realizable k-ε is used to analyze the aerodynamic drag reduction characteristics of a simplified EMU model at 400 km/h. By setting the suction-blowing area at the special flow part of the tail of the EMU, the effects of different suction-blowing mass flow rates, the number and spacing of air ports, blow-suction mass flux on the aerodynamic drag, friction drag, pressure drag, and surface pressure are explored. The conclusions and prospects are summarized as follows:
(1)
Suction at the upper edge of the rear windscreen and blowing at the lower edge of the rear windscreen can significantly reduce the pressure drag of the tail car. The suction can remove the low-momentum fluid and transfer it to the blowing area, and the blowing can improve the vortex structure in the near wake region of the EMU. When the mass flow rate is relatively low, the aerodynamic drag reduction effect of the tail car is better. When the mass flow rate increases too much, it will reduce the drag reduction efficiency of the tail car and consume more energy;
(2)
Under a certain blowing and suction flow rate, the more the number of blowing and suction ports concentrated on the upper and lower edges of the windscreen, and the smaller the spacing, the better the drag reduction effect. If five ports are set, respectively, for the suction and blowing area at the EMU tail, when the suction-blow mass flow rate is 40.826 kg m−2 s−1, the pressure drag reduction rate of the tail car can reach 7.97%;
(3)
Due to the simplification of the model and the omission of the bogie structure, the total aerodynamic drag of the EMU is smaller, and the corresponding drag reduction rate is larger. However, it is determined that the drag reduction method combining suction and blowing is arranged at the tail of the EMU, which can effectively reduce the differential pressure drag of the tail car. In the subsequent research, the same drag reduction method can be applied to the head car, bogie cavity, and other areas of the EMU to further reduce the differential pressure of the entire car;
(4)
In view of different types of train heads, the setting of air-blowing and suction ports shall be analyzed according to specific conditions.

Author Contributions

Conceptualization, H.C. and G.C.; methodology, Y.G.; software, G.C.; validation, H.C. and Y.G.; investigation, G.C.; data curation, W.D.; writing—original draft preparation, H.C. and W.D. All authors have read and agreed to the published version of the manuscript.

Funding

This research was funded by the Science Researching Plans of Liaoning Provincial Education Department under Grant No. LJKZ0509 and No. LJKFZ20220203. The research was funded by Science and Technology Project of Liaoning Provincial Transportation Department under Grant No. 202242.

Data Availability Statement

Not applicable.

Acknowledgments

We would like to thank the Liaoning Provincial Department of Education and the Liaoning Provincial Department of Transportation for providing financial support for this research. Meanwhile, we would like to thank Dalian Jiaotong University for providing the thermal engineering laboratory for this research and all the laboratory teachers for their hard work.

Conflicts of Interest

The authors declare no conflict of interest.

Nomenclature

SymbolDescriptionSymbolDescription
CdDrag coefficientpPressure at any point in flow field
FdAerodynamic dragpAtmospheric pressure
ρAir densityqjMass flow rate
USpeed of EMUVjSpeed of air blowing and suction
SCross-sectional area of EMUATotal cross-sectional area of all air-blowing holes or suction holes
CvDimensionless velocityGjMass flux
VVelocity of any point in flow fieldαDrag reduction rate
VInlet flow velocityFd(n−S−B)Aerodynamic drag of EMU without blowing and suction
CpPressure coefficientFd(S−B)Aerodynamic drag of EMU under a certain suction-blowing condition.

References

  1. Tian, H. Train Aerodynamics; China Railway Publishing House: Beijing, China, 2007; pp. 1–3. [Google Scholar]
  2. Li, T.; Dai, Z.; Liu, J.; Wu, N.; Zhang, W. Review on aerodynamic drag reduction optimization of high-speed trains in China. J. Traff. Transp. Eng. 2021, 21, 59–80. [Google Scholar]
  3. Wei, Y.Y.; Zhou, Y.Q.; Luo, Q.F.; Deng, W. Optimal reactive power dispatch using an improved slime Mould algorithm. Energy Rep. 2021, 7, 8742–8759. [Google Scholar] [CrossRef]
  4. Huang, C.; Zhou, X.; Ran, X.J.; Liu, Y.; Deng, W.Q.; Deng, W. Co-evolutionary competitive swarm optimizer with three-phase for large-scale complex optimization problem. Inf. Sci. 2022, 619, 2–18. [Google Scholar] [CrossRef]
  5. Chen, H.; Miao, F.; Chen, Y.; Xiong, Y.; Chen, T. A Hyperspectral Image Classification Method Using Multifeature Vectors and Optimized KELM. IEEE J. Sel. Top. Appl. Earth Obs. Remote Sens. 2021, 14, 2781–2795. [Google Scholar] [CrossRef]
  6. Zhang, X.; Wang, H.; Du, C.; Fan, X.; Cui, L.; Chen, H.; Deng, F.; Tong, Q.; He, M.; Yang, M.; et al. Custom-molded offloading footwear effectively prevents recurrence and amputation, and lowers mortality rates in high-risk diabetic foot patients: A multicenter, prospective observational study. Diabetes Metab. Syndr. Obes. Targets Ther. 2022, 15, 103–109. [Google Scholar] [CrossRef]
  7. He, Z.Y.; Shao, H.D.; Wang, P.; Janet, L.; Cheng, J.S.; Yang, Y. Deep transfer multi-wavelet auto-encoder for intelligent fault diagnosis of gearbox with few target training samples. Knowl.-Based Syst. 2020, 191, 105313. [Google Scholar] [CrossRef]
  8. Zhao, H.; Liu, J.; Chen, H.; Chen, J.; Li, Y.; Xu, J.; Deng, W. Intelligent Diagnosis Using Continuous Wavelet Transform and Gauss Convolutional Deep Belief Network. In IEEE Transactions on Reliability; IEEE: Toulouse, France, 2022. [Google Scholar] [CrossRef]
  9. Deng, W.; Zhang, L.; Zhou, X.; Zhou, Y.; Sun, Y.; Zhu, W.; Chen, H.; Deng, W.; Chen, H.; Zhao, H. Multi-strategy particle swarm and ant colony hybrid optimization for airport taxiway planning problem. Inf. Sci. 2022, 612, 576–593. [Google Scholar] [CrossRef]
  10. Jin, T.; Zhu, Y.; Shu, Y.; Cao, J.; Yan, H.; Jiang, D. Uncertain optimal control problem with the first hitting time objective and application to a portfolio selection model. J. Intell. Fuzzy Syst. 2022, Preprint, 1–15. [Google Scholar] [CrossRef]
  11. Song, Y.; Cai, X.; Zhou, X.; Zhang, B.; Chen, H.; Li, Y.; Deng, W.; Deng, W. Dynamic hybrid mechanism-based differential evolution algorithm and its application. Expert Syst. Appl. 2022, 213, 118834. [Google Scholar] [CrossRef]
  12. Li, W.; Zhong, X.; Shao, H.; Cai, B.; Yang, X. Multi-mode data augmentation and fault diagnosis of rotating machinery using modified ACGAN designed with new framework. Adv. Eng. Inform. 2022, 52, 101552. [Google Scholar] [CrossRef]
  13. Yu, Y.; Liu, T.; Xia, Y.; Yang, M.; Liu, H. Development and prospect of aerodynamic drag-reduction technologies for trains at higher speed (400+ km/h). Acta Aerodyn. Sin. 2021, 39, 83–94. [Google Scholar]
  14. Zhao, H.M.; Zhang, P.P.; Zhang, R.C.; Yao, R.; Deng, W. A novel performance trend prediction approach using ENBLS with GWO. Meas. Sci. Technol. 2023, 34, 025018. [Google Scholar] [CrossRef]
  15. Yu, Y.; Hao, Z.; Li, G.; Liu, Y.; Yang, R.; Liu, H. Optimal search mapping among sensors in heterogeneous smart homes. Math. Biosci. Eng. 2023, 20, 1960–1980. [Google Scholar] [CrossRef]
  16. Deng, W.; Xu, J.J.; Gao, X.Z.; Zhao, H.M. An enhanced MSIQDE algorithm with novel multiple strategies for global optimization problems. IEEE Trans. Syst. Man Cybern. Syst. 2022, 52, 1578–1587. [Google Scholar] [CrossRef]
  17. Ren, Z.; Han, X.; Yu, X.; Skjetne, R.; Leira, B.J.; Sævik, S.; Zhu, M. Data-driven simultaneous identification of the 6DOF dynamic model and wave load for a ship in waves. Mech. Syst. Signal Process. 2023, 184, 109422. [Google Scholar] [CrossRef]
  18. Zhang, Z.; Huang, W.G.; Liao, Y.; Song, Z.; Shi, J.; Jiang, X.; Shen, C.; Zhu, Z. Bearing fault diagnosis via generalized logarithm sparse regularization. Mech. Syst. Signal Process. 2022, 167, 108576. [Google Scholar] [CrossRef]
  19. Jin, T.; Gao, S.; Xia, H.; Ding, H. Reliability analysis for the fractional-order circuit system subject to the uncertain random fractional-order model with Caputo type. J. Adv. Res. 2021, 32, 15–26. [Google Scholar] [CrossRef]
  20. Zhu, H.; Hao, W.; Li, C.; Ding, Q.; Wu, B. A critical study on passive flow control techniques for straight-bladed vertical axis wind turbine. Energy 2018, 165, 12–25. [Google Scholar] [CrossRef]
  21. Cai, J.; Gao, Z. Numerical study on drag reduction by micro-blowing/suction compounding flow control on supercritical airfoil. Procedia Eng. 2015, 99, 613–617. [Google Scholar]
  22. Chen, H.Y.; Fang, M.; Xu, S. Hyperspectral remote sensing image classification with CNN based on quantum genetic-optimized sparse representation. IEEE Access 2020, 8, 99900–99909. [Google Scholar] [CrossRef]
  23. Zhao, H.M.; Zhang, P.P.; Chen, B.J.; Chen, H.Y.; Deng, W. Bearing fault diagnosis using transfer learning and optimized deep belief network. Meas. Sci. Technol. 2022, 33, 065009. [Google Scholar] [CrossRef]
  24. Collis, S.S.; Joslin, R.D.; Seifert, A.; Theofilis, V. Issues in active flow control: Theory, control, simulation, and experiment. Prog. Aeronaut. Sci. 2004, 40, 237–289. [Google Scholar] [CrossRef]
  25. Zhong, K.; Zhou, G.; Deng, W.; Zhou, Y.; Luo, Q. MOMPA: Multi-objective marine predator algorithm. Comput. Methods Appl. Mech. Eng. 2021, 385, 114029. [Google Scholar] [CrossRef]
  26. Jin, T.; Yang, X. Monotonicity theorem for the uncertain fractional differential equation and application to uncertain financial market. Math. Comput. Simul. 2021, 190, 203–221. [Google Scholar] [CrossRef]
  27. Yu, C.; Zhou, S.; Song, M.; Chang, C.-I. Semisupervised Hyperspectral Band Selection Based on Dual-Constrained Low-Rank Representation. IEEE Geosci. Remote Sens. Lett. 2022, 19, 5503005. [Google Scholar] [CrossRef]
  28. Luo, S.; Miao, W.; Liu, Q.; Li, C. Research on lift increase and drag reduction of S809 airfoil based on Suction-Blow Combined Jet. J. Chin. Soc. Power Eng. 2021, 41, 883–891. [Google Scholar]
  29. Xu, K.; Zha, G. Investigation of coflow jet active flow control for wind turbine airfoil. In AIAA Aviation 2020 Forum; AIAA: Reston, VA, USA, 2020; p. 2942. [Google Scholar]
  30. Aubrun, S.; Mcnally, J.; Alvi, F.; Kourta, A. Separation flow control on a generic ground vehicle using steady microjet arrays. Exp. Fluids 2011, 51, 1177–1187. [Google Scholar] [CrossRef]
  31. Zhang, Y.; Du, G.; Tian, S.; Zhang, Z. Active flow control of 35°Ahmed model to reduce aerodynamic drag with steady jet. J. Jilin Univ. Eng. Technol. Ed. 2019, 49, 351–358. [Google Scholar]
  32. Yang, Y.; Zheng, M.; Huang, J.; Nie, Y. Aerodynamic drag reduction method of vehicle body based on non-smooth surface and vortex interference. China Mech. Eng. 2016, 27, 982–988. [Google Scholar]
  33. Lin, P.; Li, G. Numerical study on the aerodynamic drag reduction characteristics of high speed train suction based on the drag reduction theory of boundary layer. China Railw. 2020, 10, 71–77. [Google Scholar]
  34. Huang, S.; Yu, Y.; Li, Z.; Che, Z. Study of aerodynamic drag reduction of high-speed train based on tail jet-flow control. J. China Railw. Soc. 2021, 43, 38–46. [Google Scholar]
  35. Liang, X.; Luo, Z.; Li, X.; Xiong, X.; Zhang, X. Drag reduction of high-speed trains via low-density gas injection. AIP Adv. 2022, 12, 065115. [Google Scholar] [CrossRef]
  36. Shkvar, E.O.; Jamea, A.E.S.-J.; Cai, J.-C.; Kryzhanovskyi, A.S. Effectiveness of blowing for improving the high-speed trains aerodynamics. Thermophys. Aeromech. 2018, 25, 675–686. [Google Scholar] [CrossRef]
  37. Ikeda, M.; Yoshida, K.; Suzuki, M. A Flow Control Technique Utilizing Air Blowing to Modify the Aerodynamic Characteristics of Pantograph for High-speed Train. J. Mech. Syst. Transp. Logist. 2008, 1, 264–271. [Google Scholar] [CrossRef]
  38. Chen, H.L.; Li, C.Y.; Mafarja, M.; Heidari, A.A.; Chen, Y.; Cai, Z.N. Slime mould algorithm: A comprehensive review of recent variants and applications. Int. J. Syst. Sci. 2023, 54, 204–235. [Google Scholar] [CrossRef]
  39. Xu, J.J.; Zhao, Y.L.; Chen, H.Y.; Deng, W. ABC-GSPBFT: PBFT with grouping score mechanism and optimized consensus process for flight operation data-sharing. Inf. Sci. 2023, 624, 110–127. [Google Scholar] [CrossRef]
  40. Bi, J.; Zhou, G.; Zhou, Y.; Luo, Q.; Deng, W. Artificial Electric Field Algorithm with Greedy State Transition Strategy for Spherical Multiple Traveling Salesmen Problem. Int. J. Comput. Intell. Syst. 2022, 15, 5. [Google Scholar] [CrossRef]
  41. Duan, Z.; Song, P.; Yang, C.; Deng, L.; Jiang, Y.; Deng, F.; Jiang, X.; Chen, Y.; Yang, G.; Ma, Y.; et al. The impact of hyperglycaemic crisis episodes on long-term outcomes for inpatients presenting with acute organ injury: A prospective, multicentre follow-up study. Front. Endocrinol. 2022, 13, 1057089. [Google Scholar] [CrossRef]
  42. Li, X.; Zhao, H.; Yu, L.; Chen, H.; Deng, W.; Deng, W. Feature extraction using parameterized multi-synchrosqueezing transform. IEEE Sens. J. 2022, 22, 14263–14272. [Google Scholar] [CrossRef]
  43. Li, T.Y.; Shi, J.Y.; Deng, W.; Hu, Z.D. Pyramid particle swarm optimization with novel strategies of competition and cooperation. Appl. Soft Comput. 2022, 121, 108731. [Google Scholar] [CrossRef]
  44. Deng, W.; Ni, H.; Liu, Y.; Chen, H.; Zhao, H. An adaptive differential evolution algorithm based on belief space and generalized opposition-based learning for resource allocation. Appl. Soft Comput. 2022, 127, 109419. [Google Scholar] [CrossRef]
  45. Yao, R.; Guo, C.; Deng, W.; Zhao, H. A novel mathematical morphology spectrum entropy based on scale-adaptive techniques. ISA Trans. 2022, 126, 691–702. [Google Scholar] [CrossRef] [PubMed]
  46. Li, T.; Qian, Z.; Deng, W.; Zhang, D.Z.; Lu, H.; Wang, S. Forecasting crude oil prices based on variational mode decomposition and random sparse Bayesian learning. Appl. Soft Comput. 2021, 113, 108032. [Google Scholar] [CrossRef]
  47. Li, S.; Chen, H.; Wang, M.; Heidari, A.A.; Mirjalili, S. Slime mould algorithm: A new method for stochastic optimization. Future Gener. Comput. Syst. 2020, 111, 300–323. [Google Scholar] [CrossRef]
  48. Jin, T.; Xia, H.; Deng, W.; Li, Y.; Chen, H. Uncertain Fractional-Order Multi-Objective Optimization Based on Reliability Analysis and Application to Fractional-Order Circuit with Caputo Type. Circuits Syst. Signal Process. 2021, 40, 5955–5982. [Google Scholar] [CrossRef]
  49. Liu, Y.; Heidari, A.A.; Cai, Z.N.; Liang, G.X.; Chen, H.L.; Pan, Z.F.; Alsufyani, A.; Bourouis, S. Simulated annealing-based dynamic step shuffled frog leaping algorithm: Optimal performance design and feature selection. Neurocomputing 2022, 503, 325–362. [Google Scholar] [CrossRef]
  50. Tian, C.; Jin, T.; Yang, X.; Liu, Q. Reliability analysis of the uncertain heat conduction model. Comput. Math. Appl. 2022, 119, 131–140. [Google Scholar] [CrossRef]
  51. Li, B.; Xu, J.; Jin, T.; Shu, Y. Piecewise parameterization for multifactor uncertain system and uncertain inventory-promotion optimization. Knowl.-Based Syst. 2022, 255, 109683. [Google Scholar] [CrossRef]
  52. Liu, H.; Zhang, X.W.; Tu, L.P. A modified particle swarm optimization using adaptive strategy. Expert Syst. Appl. 2020, 152, 113353. [Google Scholar] [CrossRef]
  53. Silva, Y.; Herthel, A.B.; Subramanian, A. A multi-objective evolutionary algorithm for a class of mean-variance portfolio selection problems. Expert Syst. Appl. 2019, 133, 225–241. [Google Scholar] [CrossRef]
  54. Jin, T.; Xia, H. Lookback option pricing models based on the uncertain fractional-order differential equation with Caputo type. J. Ambient. Intell. Humaniz. Comput. 2021, 1–14. [Google Scholar] [CrossRef]
  55. Wang, L.; Yu, D.; Ding, Y. Feasibility study on raising the operation speed of EMU from 350 km/h to 400 km/h. Electr. Drives Locomot. 2020, 2, 17–22. [Google Scholar]
  56. Pan, Y.; Yao, J.; Liu, T.; Li, C. Discussion on the wake vortex structure of a high speed train by vortex identification methods. Chin. J. Mech. 2018, 50, 667–676. [Google Scholar]
  57. Zhu, H.; Zhang, Y.; Zhao, H.; Wu, P.; Shao, X. Drag reduction on technology of high-speed train based boundary layer control. J. Traff. Transp. Eng. 2017, 17, 64–72. [Google Scholar]
  58. Zhou, J.; Ou, P.; Liu, P.; Guo, H. Numerical study of ground effects on high speed train aerodynamic drag. J. Exp. Fluid Mech. 2016, 30, 26–31&55. [Google Scholar]
Figure 1. Simplified model of EMU.
Machines 11 00222 g001
Figure 2. Simulation calculation domain.
Machines 11 00222 g002
Figure 3. Distribution of grids: (a) grids distribution of EMU body and domain; (b) local grids at the rear.
Machines 11 00222 g003
Figure 4. Numerical calculation area compared with wind test (Unit: m).
Machines 11 00222 g004
Figure 5. Data comparison between this paper and the reference.
Machines 11 00222 g005
Figure 6. Boundary layer of central longitudinal section.
Machines 11 00222 g006
Figure 7. Pressure coefficient of central longitudinal section.
Machines 11 00222 g007
Figure 8. Setting of blowing and suction ports at the tail: (a) internal flow channel diagram; (b) suction ports position; (c) blowing ports position.
Machines 11 00222 g008
Figure 9. Drag reduction rate and increment at different mass flow rates.
Machines 11 00222 g009
Figure 10. Pressure and friction resistance reduction rate under different mass flow rates.
Machines 11 00222 g010
Figure 11. Surface pressure coefficient at rear under four mass flow rates: (a) qj = 0; (b) qj = 0.923 kg/s; (c) qj = 2.769 kg/s; (d) qj = 4.615 kg/s.
Machines 11 00222 g011
Figure 12. Drag reduction rate of tail car with different air ports spacing.
Machines 11 00222 g012
Figure 13. Surface pressure coefficient at rear with different air ports spacing: (a) model A; (b) model B; (c) model C.
Machines 11 00222 g013
Figure 14. Drag reduction rate of tail car with different numbers of air ports.
Machines 11 00222 g014
Figure 15. Surface pressure coefficient at rear with different number of air ports: (a) model B; (b) model D1; (c) model D2.
Machines 11 00222 g015
Figure 16. Boundary layer near the suction ports. (a) No suction, (b) suction.
Machines 11 00222 g016
Figure 17. Streamlines around the EMU body and near the tail. (a) No blowing, (b) Blowing.
Machines 11 00222 g017
Table 1. Aerodynamic drag coefficients of three density meshes.
Mesh DensityMesh Number (106)Aerodynamic Drag Coefficient
Head CarMiddle CarTail Car
coarse5.410.1200.0510.092
medium10.550.1150.0500.090
fine16.000.1140.0500.090
Table 2. Drag coefficient of each position of EMU under different mass flow rate.
PositionDrag Coefficient Under Different Mass Flow Rate
00.923 kg/s1.846 kg/s2.769 kg/s3.692 kg/s4.615 kg/s
Entire car0.25710.25650.25510.25390.25310.2527
Head car0.11510.11510.11510.11510.11510.1151
Middle car0.05020.05030.05020.05030.05020.0502
Tail car0.08970.08910.08760.08640.08570.0853
Windshield0.00210.00200.00220.00210.00210.0021
Table 3. Spacing parameters of air blowing and suction ports.
ModelSpacing of Suction Ports along the Surface of Car Body (mm)Spacing of Blowing Ports in Vertical Direction (mm)
A1060150
B1060300
C265150
Table 4. Quantity, total mass flow rate and mass flux of suction and blowing ports.
ModelTotal Mass Flow Rate
(kg s−1)
Mass Flux
(kg m−2 s−1)
Ports × Holes
(for Semi-Body Model)
B2.76940.8263 × 8
D12.76924.4965 × 8
D24.61540.826
Disclaimer/Publisher’s Note: The statements, opinions and data contained in all publications are solely those of the individual author(s) and contributor(s) and not of MDPI and/or the editor(s). MDPI and/or the editor(s) disclaim responsibility for any injury to people or property resulting from any ideas, methods, instructions or products referred to in the content.

