Article

Impact Performance Prediction and Optimization of a Circumferentially Corrugated Tube with Variable Wall Thickness Using Support Vector Machine

1
Key Laboratory of Traffic Safety on Track, Ministry of Education, School of Traffic & Transportation Engineering, Central South University, Changsha 410075, China
2
Joint International Research Laboratory of Key Technology for Rail Traffic Safety, Central South University, Changsha 410075, China
*
Author to whom correspondence should be addressed.
Machines 2023, 11(2), 217; https://doi.org/10.3390/machines11020217
Submission received: 27 December 2022 / Revised: 26 January 2023 / Accepted: 31 January 2023 / Published: 2 February 2023
(This article belongs to the Section Vehicle Engineering)

Abstract

:
Based on the hypothesis that multi-corner and multi-cell structures can effectively improve energy absorption behavior, this paper designed a multi-cell circumferentially corrugated tube (MCCT) for energy absorption. The MCCT was designed as a variable thickness form to study the influence of the materials distribution on the cross section on energy absorption. The energy absorption performance of the MCCT was investigated under impact condition with finite element simulation validated by a drop hammer test. Support vector machine, a machine learning technique, was used to predict the energy absorption performance and was further used for optimization of the MCCT. The results show that under the same mass, the MCCT with variable decreasing wall thickness (corners thicker than other regions) shows 4.81%, 30.67% and 37.70% improvement, respectively, in PCF, SEA and CFE, compared to the MCCT with variable increasing wall thickness (corners thinner than other regions). Moreover, the optimization results show that most samples in Pareto front lie in the region of tc > tm. These results all indicate that the MCCT with variable decreasing wall thickness performs better than with increasing wall thickness with regards energy absorption. In conclusion, arranging more materials in the corner element area can effectively improve the energy absorption characteristics of the thin-walled tube. This paper highlights the importance of designing thin-walled tubes as multi-corner and variable thickness configurations for energy absorption.

1. Introduction

Passive safety protection is an important issue in the field of transportation [1,2,3]. In order to achieve a good passive safety protection capability, energy absorbing structures are widely applied in vehicles [4,5,6]. Thin-walled tube is considered to be a good energy absorbing structure and is widely applied in the field of transportation because it has the advantages of stable deformation mode, moderate cost, high manufacturability, etc. [7,8].
Cross-section configuration is the most important factor affecting the energy absorption characteristics of thin-walled tubes [9,10]. Reasonable design and optimization of cross-section configuration for thin-walled tubes can make them achieve better energy absorption. In recent decades, this topic has attracted a large number of researchers [11,12,13,14]. Pirmohammad [15] evaluated the crashworthiness capability of five multi-cell tubes with square, hexagonal, octagonal, decagonal and circular cross sections, and found that the octagonal multi-cell structure is the best cross-sectional configuration among the studied cross sections. Sun [16] and Luo [17] investigated the energy-absorbing efficiency of hierarchical lattice structures derived from triangular, rectangular or hexagonal tubes. The results of their studies all indicated that the hierarchical structures are more weight-efficient energy absorbers. It has been proven that the energy consumption of the thin-walled tubes is dissipated mainly in the form of bending energy and membrane energy during deformation, especially in the corner elements [18,19]. Therefore, designing the cross section of the thin-walled tubes as a multi-corner configuration is an effective method to improve its energy absorption performance. To this end, many thin-walled multi-corner tubes have been designed and tested, such as polygonal tubes [20,21,22], star-shaped tubes [23,24] and concave tubes [25,26,27], etc. These studies show that the multi-corner configuration increases the axial stiffness of tubes, but it will also increase the instability of deformation. To ensure stable deformation, some induced features have been adopted in the above-mentioned multi-corner tubes. On the premise of stable deformation, the multi-corner configuration indeed improves the energy absorption performance of tubes. In fact, the intersections formed by more than two edges can also be regarded as a corner element. This kind of corner element can improve both energy absorption efficiency and deformation stability [28]. For example, Eyvazian et al. [29] designed a circumferentially sinusoidal corrugation and found that circumferential corrugations induced the tube to deform in the Concertina mode, which is favorable for energy absorption. Deng et al. [30,31] comprehensively studied the effect of corrugation number, corrugation amplitude and wall thickness on the energy absorption of circumferentially corrugated circular tubes and concluded that the sandwich sinusoidal circumferentially corrugated tubes had a more effective crushing displacement and better stability during compression than sandwich starshaped tubes. In addition, researchers also used some mathematical expressions, such as sine or cosine functions [23] and Fourier series expansion [14], to realize a series of tubes with multi-corrugation configurations to achieve stable deformation. However, straight corners are always too sharp to cause stress concentration, sometimes leading to fractures during deformation, which result in the unstable deformation of the tubes. Fortunately, this problem can be solved easily when the straight corners are replaced by corrugated corners.
In addition to the cross-section configuration, the wall thickness also has a great influence on the energy absorption characteristics of thin-walled structures [32,33]. Commonly, thin-walled energy absorbing tubes are designed with uniform thickness. However, recent studies have shown that uniform thickness design may cause material waste, meaning that the energy absorption efficiency of the energy absorbing structure cannot reach the highest level [34,35,36,37]. This idea can actually be explained by things in nature, such as honeycombs [38]. Honeycomb in nature is of variable thickness, and the thickness at the corner element is thicker than the wall thickness at other regions. Such a structural feature can help the honeycomb to resist external impact. The variable wall thickness has been successfully applied in some thin-walled energy absorbing structures along the axial [39,40,41,42] and circumferential direction [37,43] of the tube. The results all show that the variable wall thickness design can effectively reduce the initial peak crushing force and increase the energy absorption efficiency compared to uniform wall thickness design, indicating that the variable wall thickness design can improve the crashworthiness of thin-walled tubes. Moreover, the improvement in energy absorption performance by adopting variable wall thickness is proved under axial [35,37], oblique [41,44] and bending loading conditions [45,46]. These studies also show that changing the distribution of materials on the cross section of the structure can improve energy absorption and also effectively save mass, as well as achieving the goal of improving the lightweight quality.
As mentioned above, both the multi-corrugated corner design and variable wall thickness design have outstanding effect in improving the energy absorption performance of thin-walled tubes, but, at present, there is no structure combining the two designs.
In addition, when a new structure is designed, it is necessary to optimize its performance [47]. Before implementing crashworthiness optimization, it is necessary to first determine which energy absorption indicators will be used as the optimization objectives and the weight of each optimization objective in the optimization. Many works have been conducted on this issue [48,49]. Another important issue is how to achieve high-precision response prediction models, because good prediction models are crucial for attaining accurate optimization [50]. However, the accuracy of traditional fitting methods such as Kriging and RBF is often not high enough when dealing with complex and non-linear responses. In recent years, machine learning has become more and more popular, because it can deal with some very complex problems [51,52,53]. Machine learning has an outstanding performance in prediction, so its application in structural optimization can effectively improve the accuracy.
This paper proposes a thin-walled tube, which combines multi-corner and variable thickness designs, for improving the energy absorption performance. The multi-corner configuration is achieved by a cosine expression. In addition, some inner ribs are introduced into the structure to stabilize the deformation. The energy absorption performance of the proposed tube is investigated with impact experiment and FE simulation. The support vector machine, a machine learning method, is adopted to predict the energy absorption responses. Based on the predictions, a multi-objective optimization is performed to find the best configuration of the tube.

2. Methods

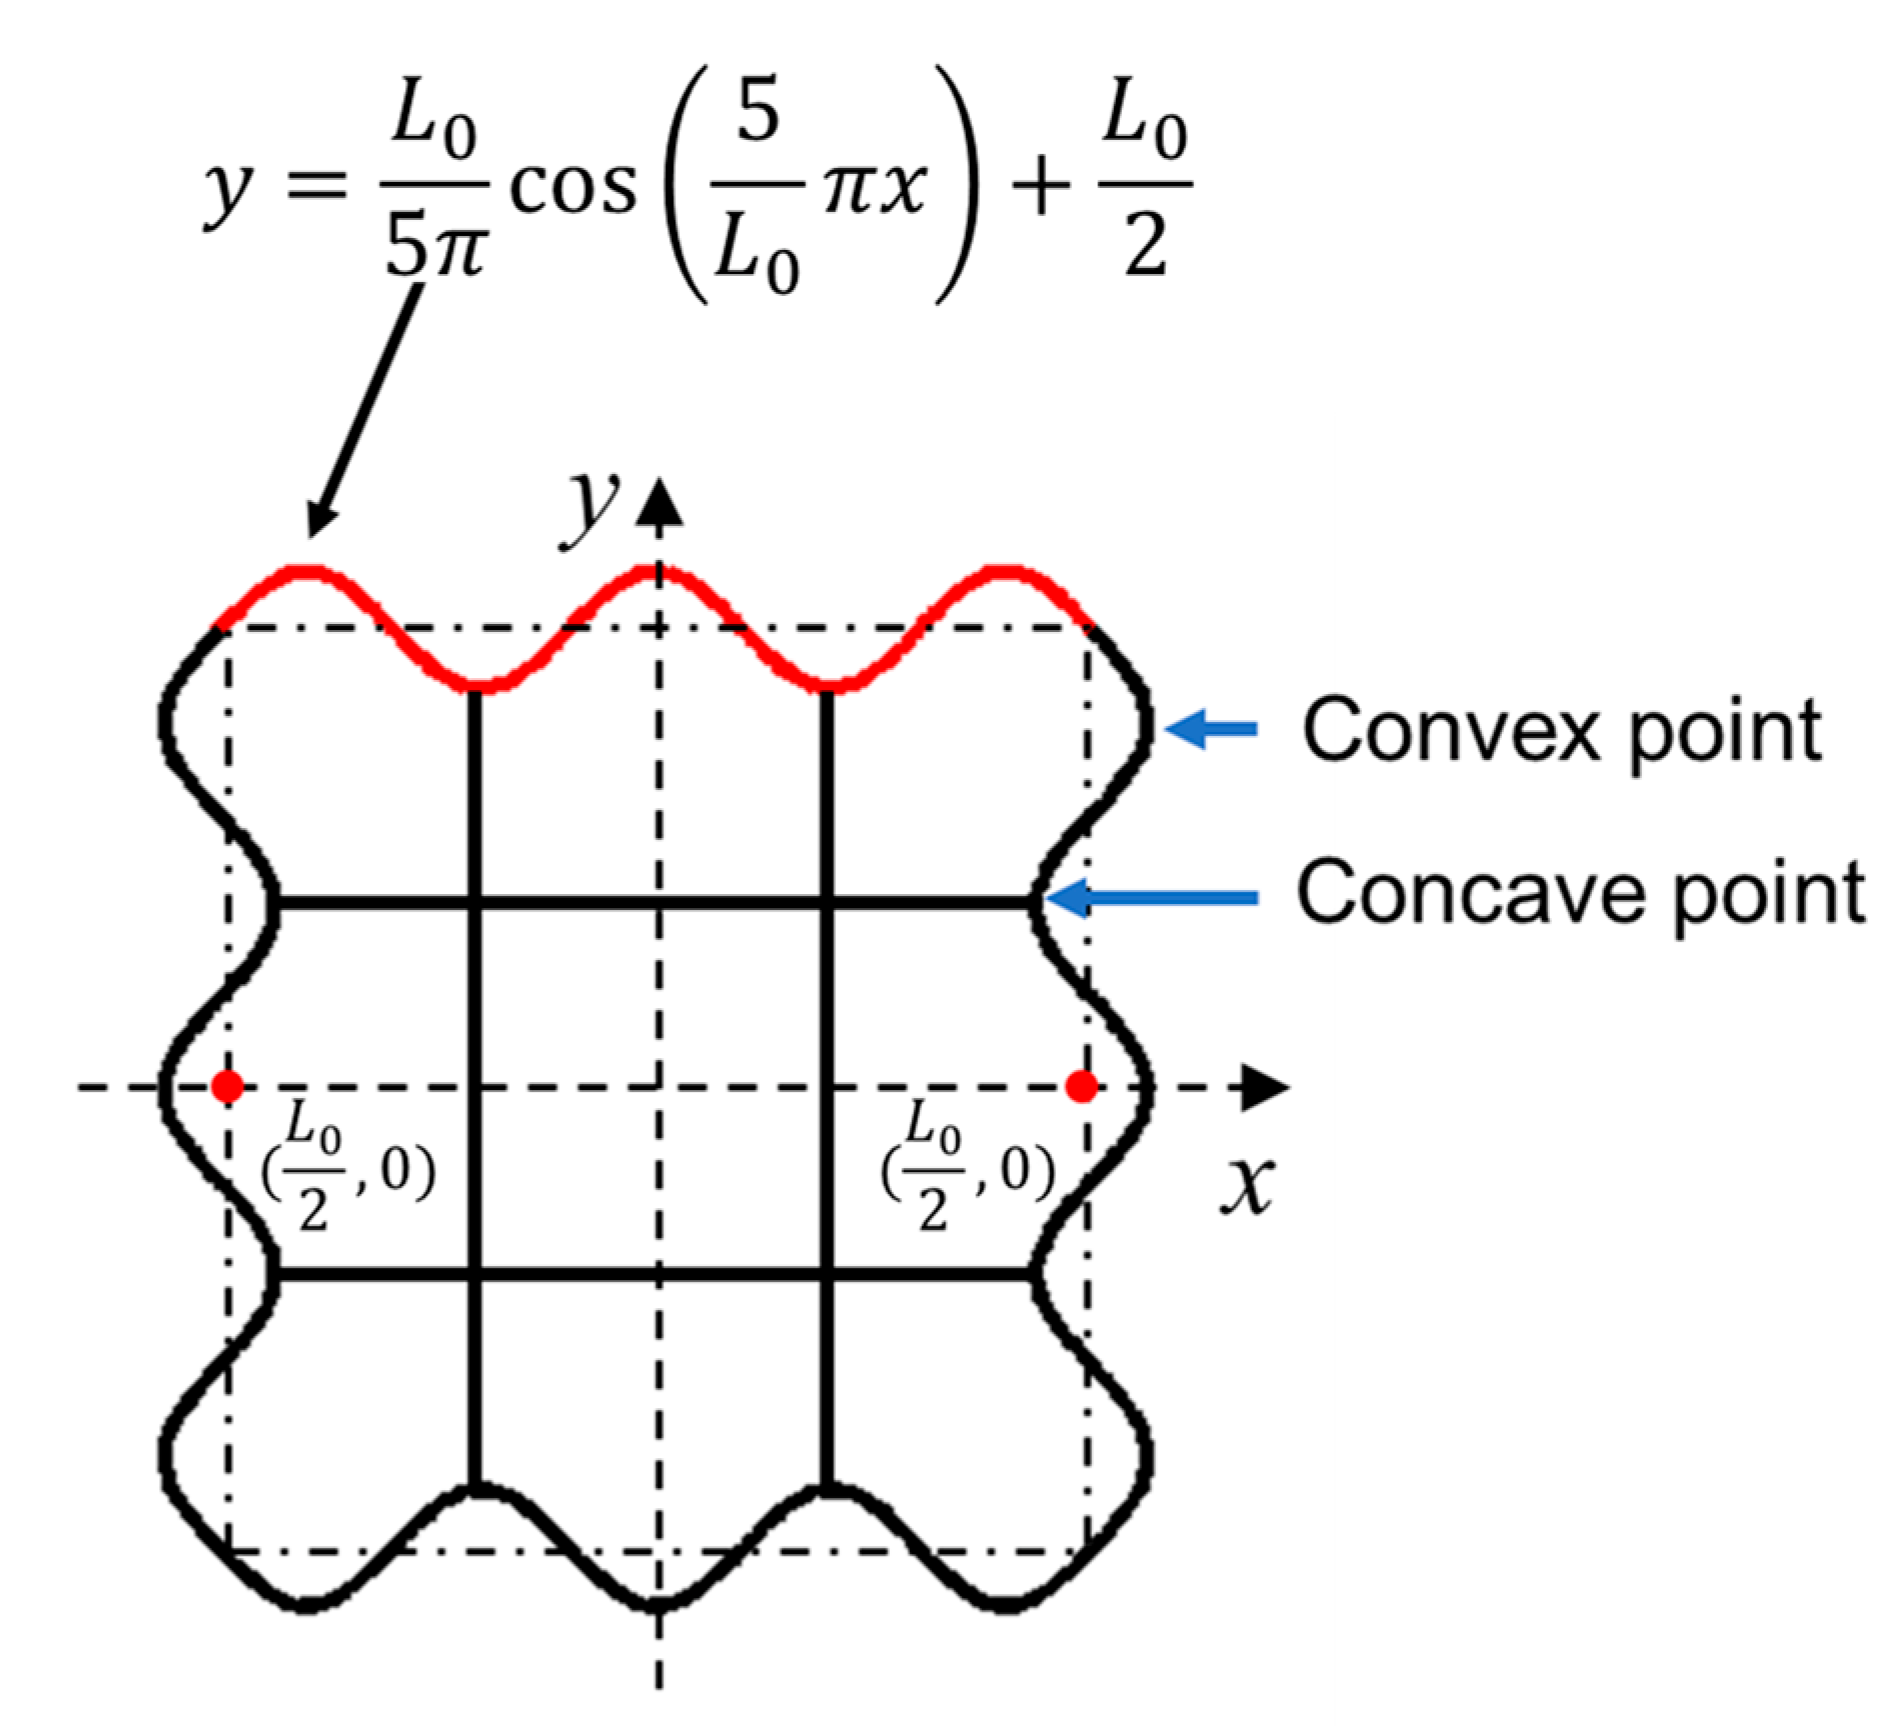
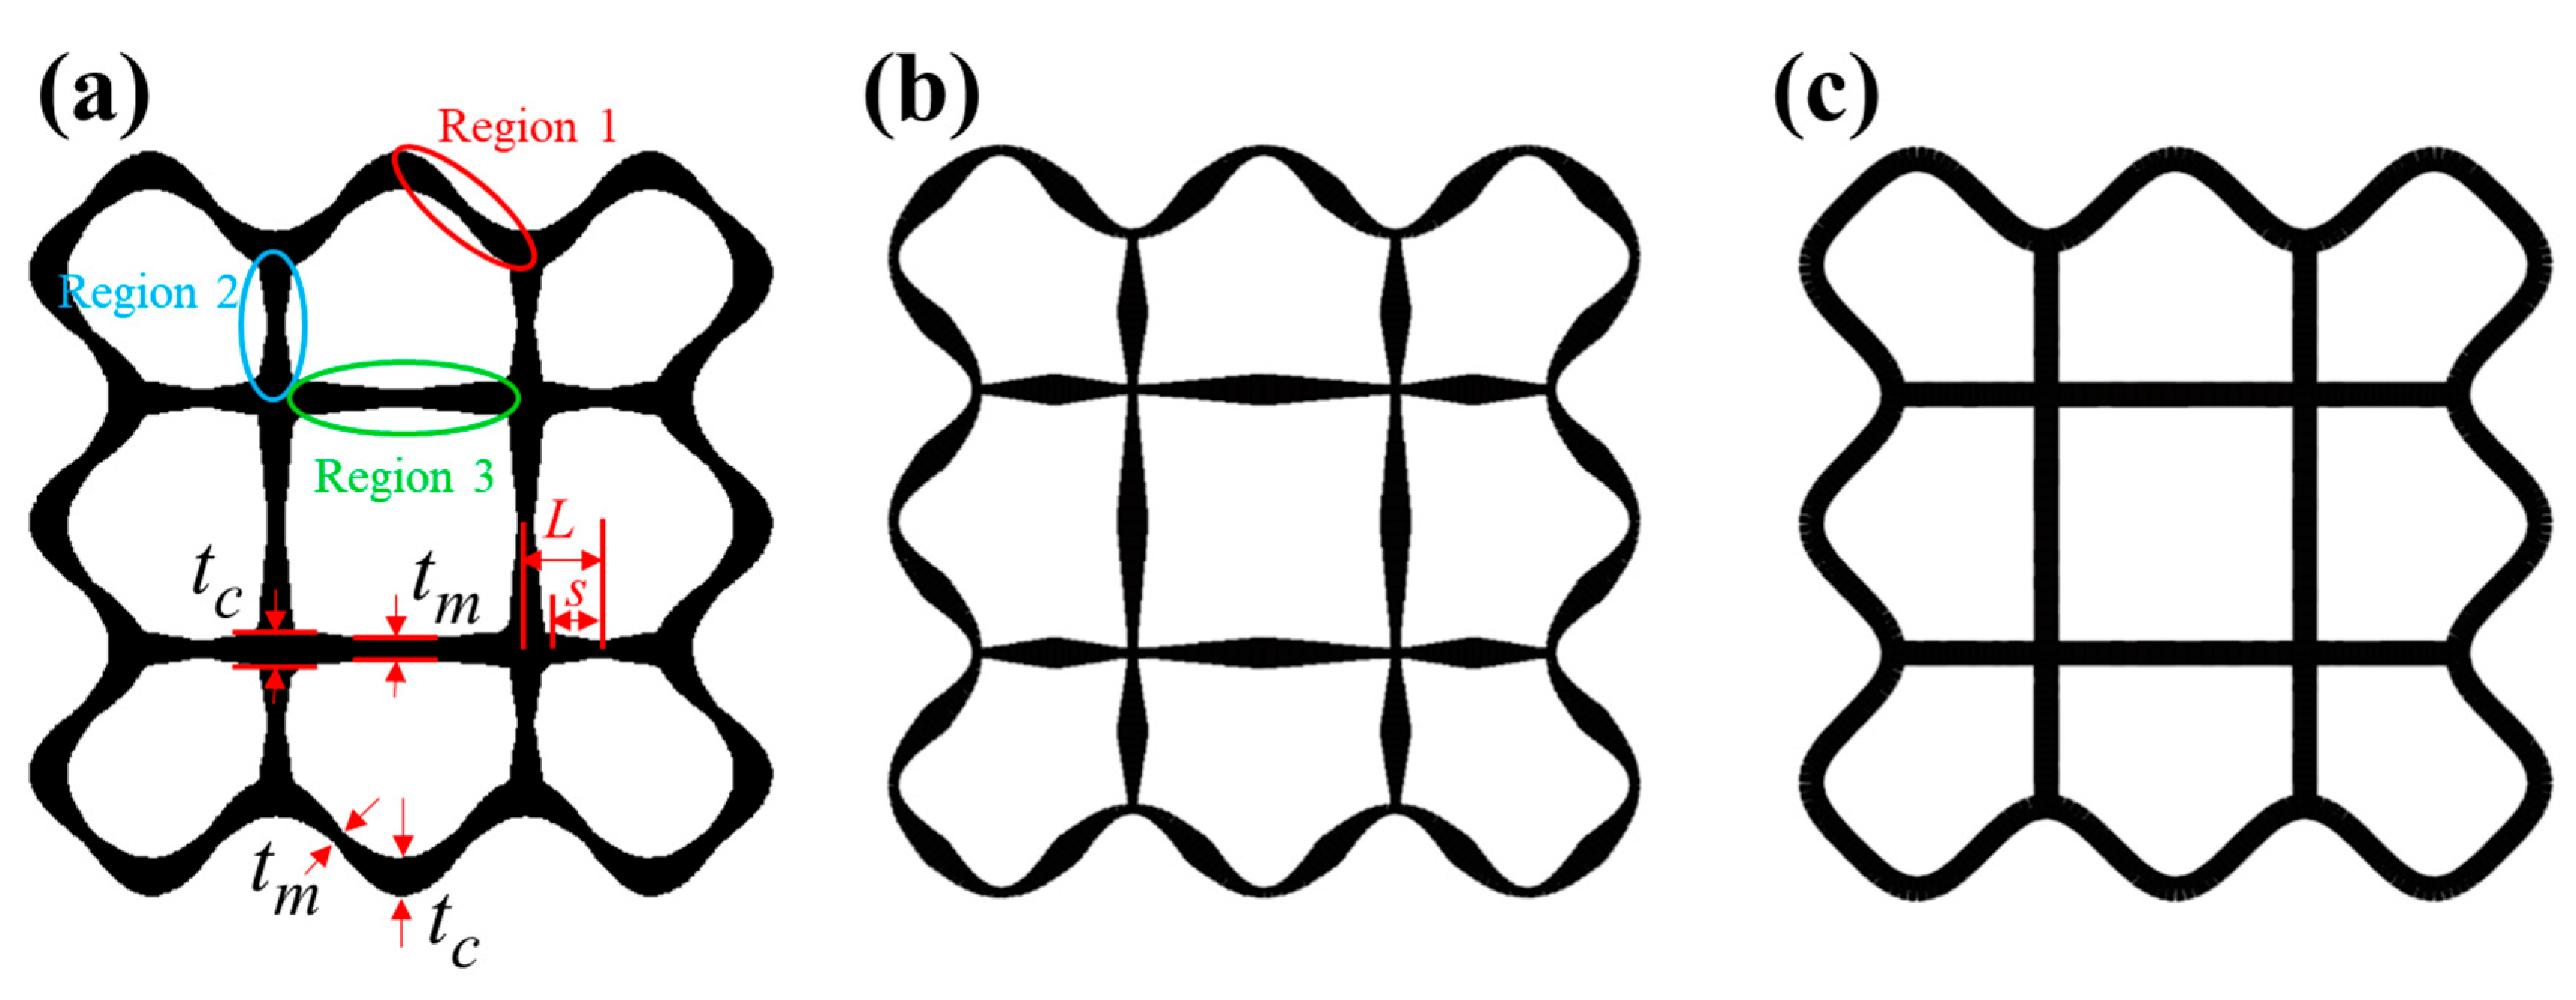
2.1. Structural Design

A multi-cell corrugated tube (MCCT), which combines multi-corner and multi-cell configurations, is proposed in this study. The multi-corner feature is realized with a cosine expression, as shown in Equation (1):
y = L 0 5 π cos ( 5 L 0 π x ) + L 0 2
where L0 is the normalized side length of the cross section.
Figure 1 displays the cross-sectional configuration of the MCCT. The MCCT is designed as variable wall thickness (Figure 2), which is achieved by introducing a control function as follows:
t = t c t c t m L s L n
The cross section consists of three different regions, as shown in Figure 2a. Region 1 is a corrugated edge, and Region 2 and Region 3 are straight edges. L is half the lengths of each region. The L value is 4.86 mm, 4.73 mm and 8 mm for Region 1, Region 2 and Region 3, respectively. The parameter s is the distance from the midpoint of the region in which it is located. tc is the thickness of each region end and tm is the thickness in the middle of each region. The parameter n is the normalized gradient exponent that controls the thickness variation.
Here, we consider two thickness variation conditions, i.e., tm < tc and tm > tc, as shown in Figure 2a,b, respectively. The corresponding thickness variation versus normalized distance s/L for the two conditions is displayed in Figure 3a,b, respectively. It can be seen that for tm > tc, the tube wall in each region defined in Figure 2a is concave when n < 1, whereas it is convex when n > 1. This phenomenon is the opposite when tm < tc. When tm = tc, the tube wall thickness becomes uniform no matter what the value of n is. The MCCT with uniform wall thickness is shown in Figure 2c.

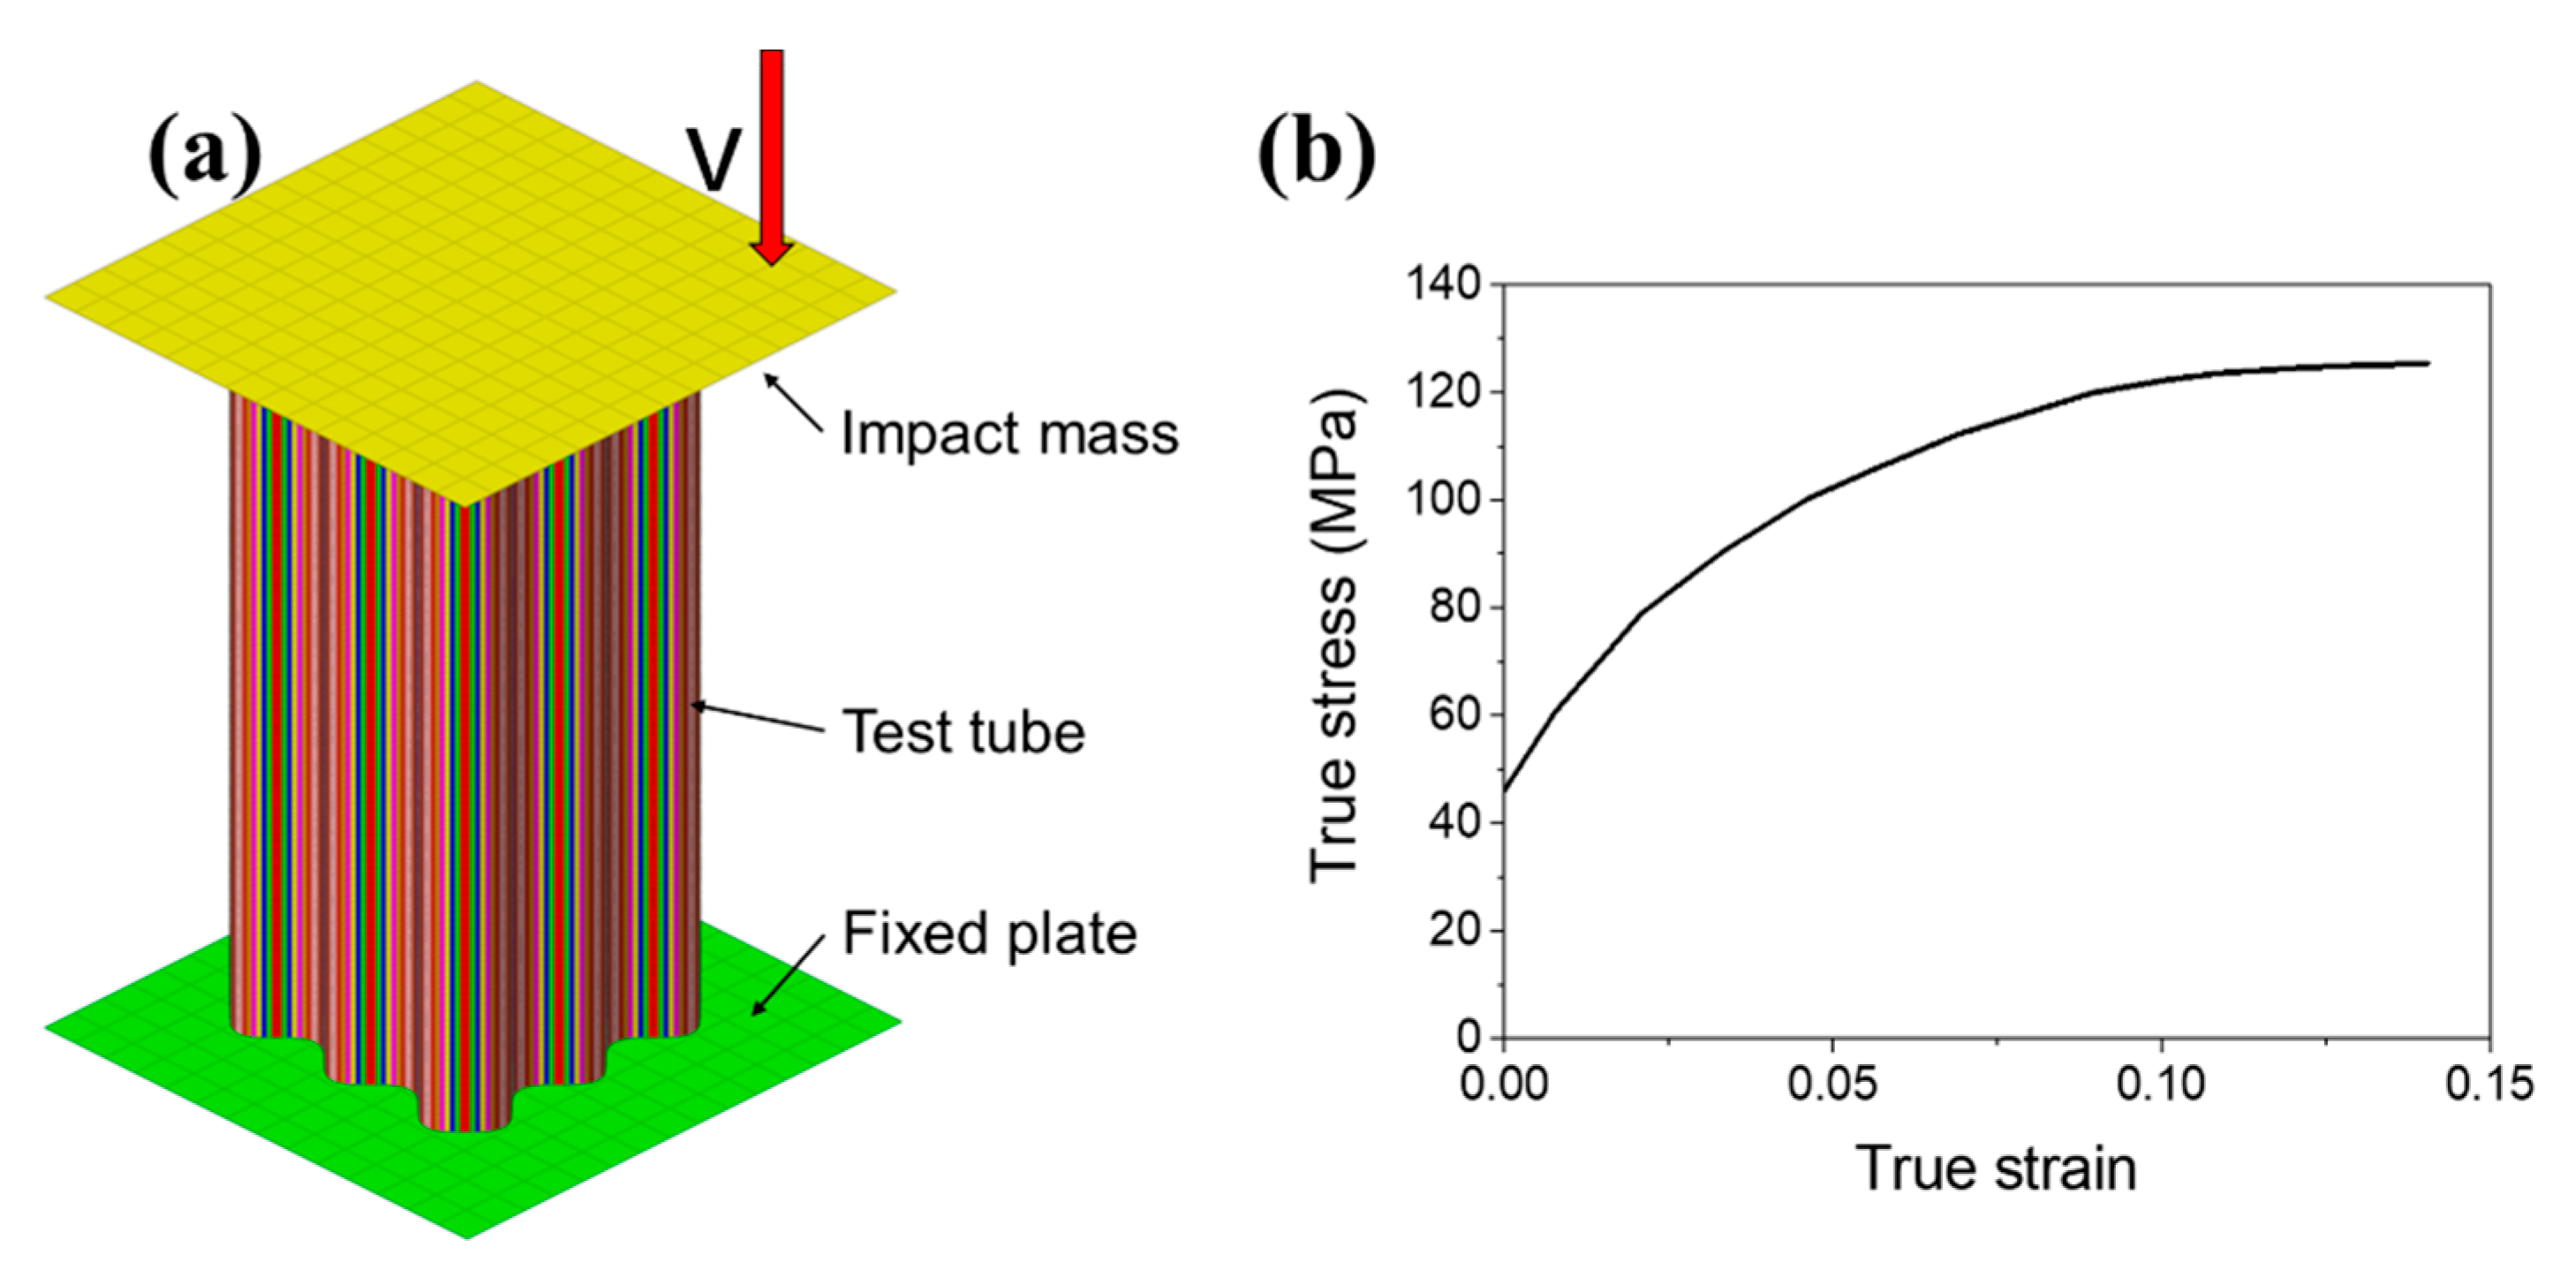
2.2. Finite Element Model

Finite element (FE) simulation is constructed in Ls_dyna to investigate the energy absorption characteristics of the MCCT. The FE model is shown in Figure 4a. The test tube is placed on a fixed rigid plate, and another rigid plate is loaded with an initial velocity to impact the tube. The two plates are modelled with the material model MAT_RIGID to ensure they will not show any deformation when impacted. The material used in the test tube is aluminum alloy AA 6061O, whose stress-strain curve is shown in Figure 4b. The material properties of the AA 6061O are as follows: density ρ = 2700 kg/m3, Young’s modulus E = 70.04 GPa, yield stress σy = 46.15 MPa, ultimate stress σu = 125.32 MPa and Poisson’s ratio ν = 0.33. The test tube is modeled using the material model MAT_PIECEWISE_LINEAR_PLASTICITY because it is an elasto-plastic material model with an arbitrary stress as a function of strain curve. This characteristic of the material model makes it very convenient and accurate in engineering applications. The Belytschko-Tsay shell element is adopted to model the test tube because (1) it is the default integration formula with high efficiency, and (2) it is usually the most stable formula for large deformation problems. In addition, considering the calculation accuracy and cost, the number of center integration points and of the through-thickness integration points are set at 1 and 5, respectively, for the test tube element. The nonuniform thickness option is selected, in which the four nodes of an element can be defined with different thicknesses. In order to determine the most appropriate mesh size of the test tube, mesh convergence analysis is performed. The mean crushing force (MCF) of MCCT with uniform thickness of 0.5 mm under different mesh size is calculated and displayed in Figure 5. The result shows that the test tube when modeled with 0.6 mm × 0.6 mm size element can ensure the accuracy of the current FE simulation. On the basis of this mesh size, Region 1, 2 and 3 are divided into 16, 16 and 26 layers, respectively. The thickness of the nodes of each layer is controlled with Equation (2). By doing so, the variable wall thickness can be achieved. In addition, the “AUTOMATIC_SINGLE_SURFACE” contact algorithm is used to model the self-contact of the test tube, and the “AUTOMATIC_SURFACE_TO_SURFACE” algorithm is defined between the test tube and the two rigid plates to account for their contact with each other. The friction coefficients of all contacts are defined as 0.15 [54].

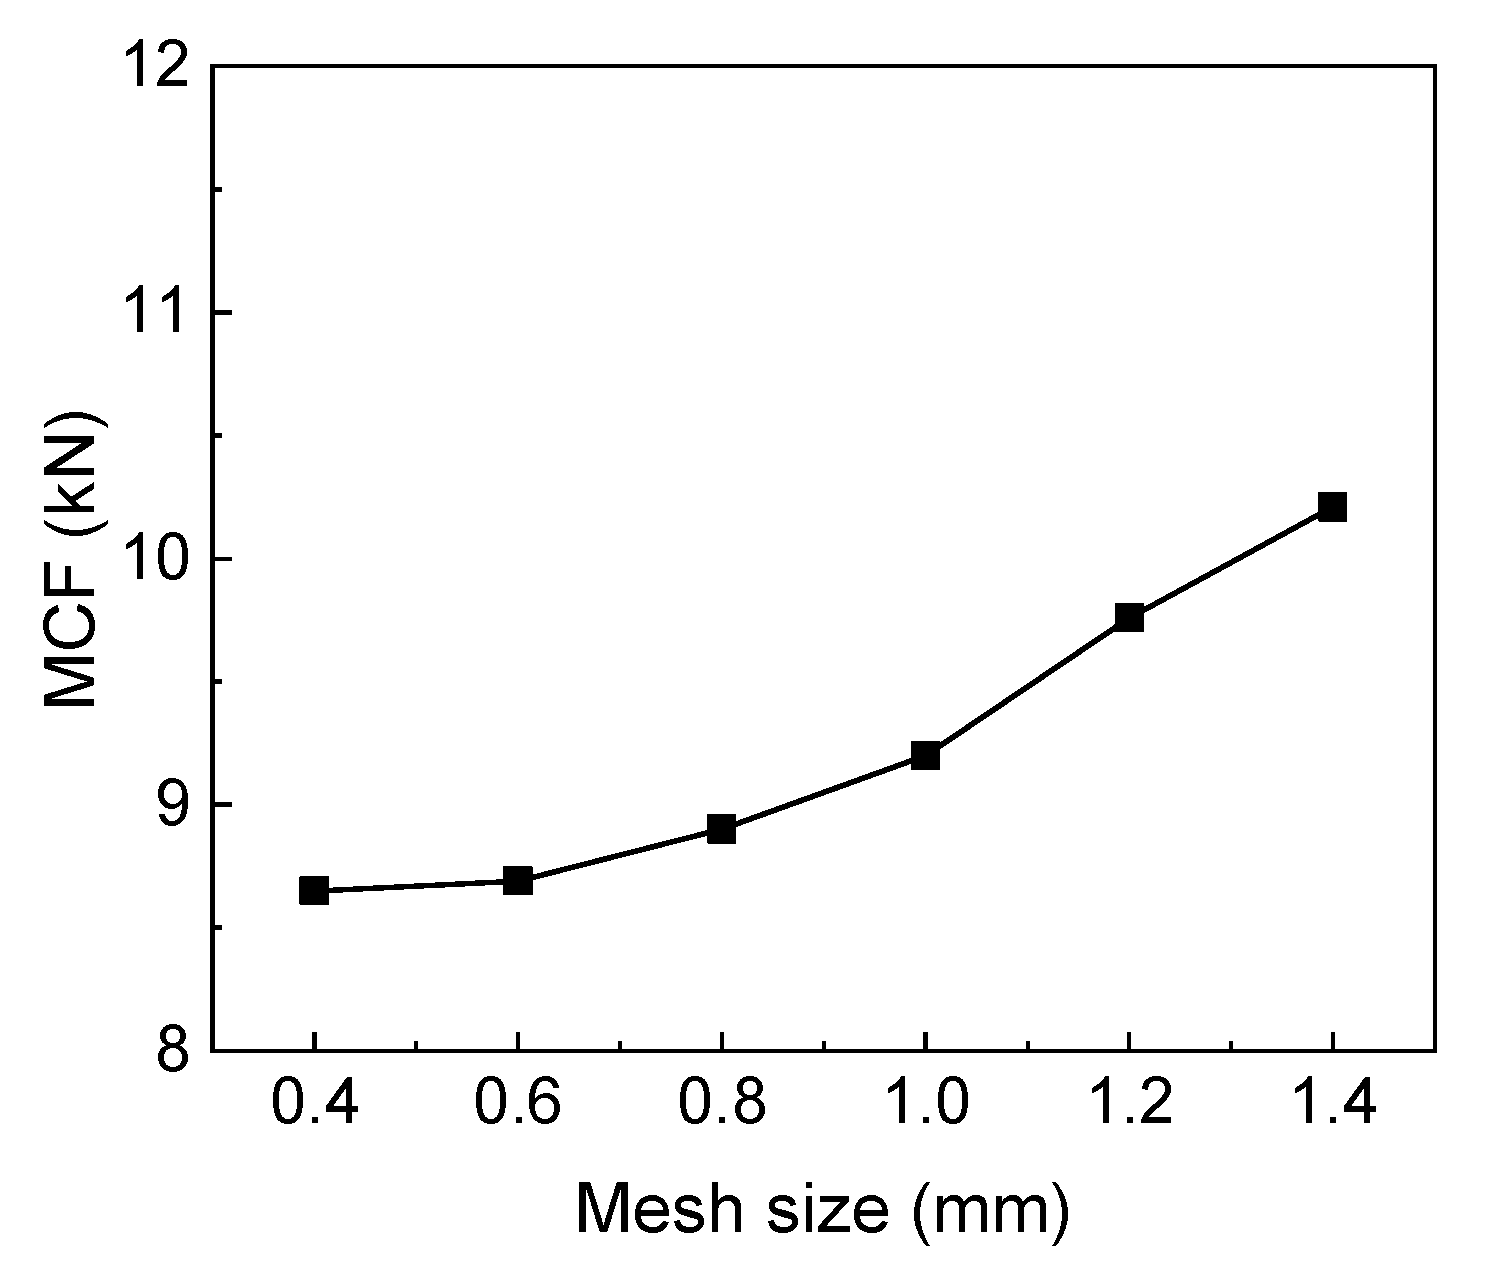
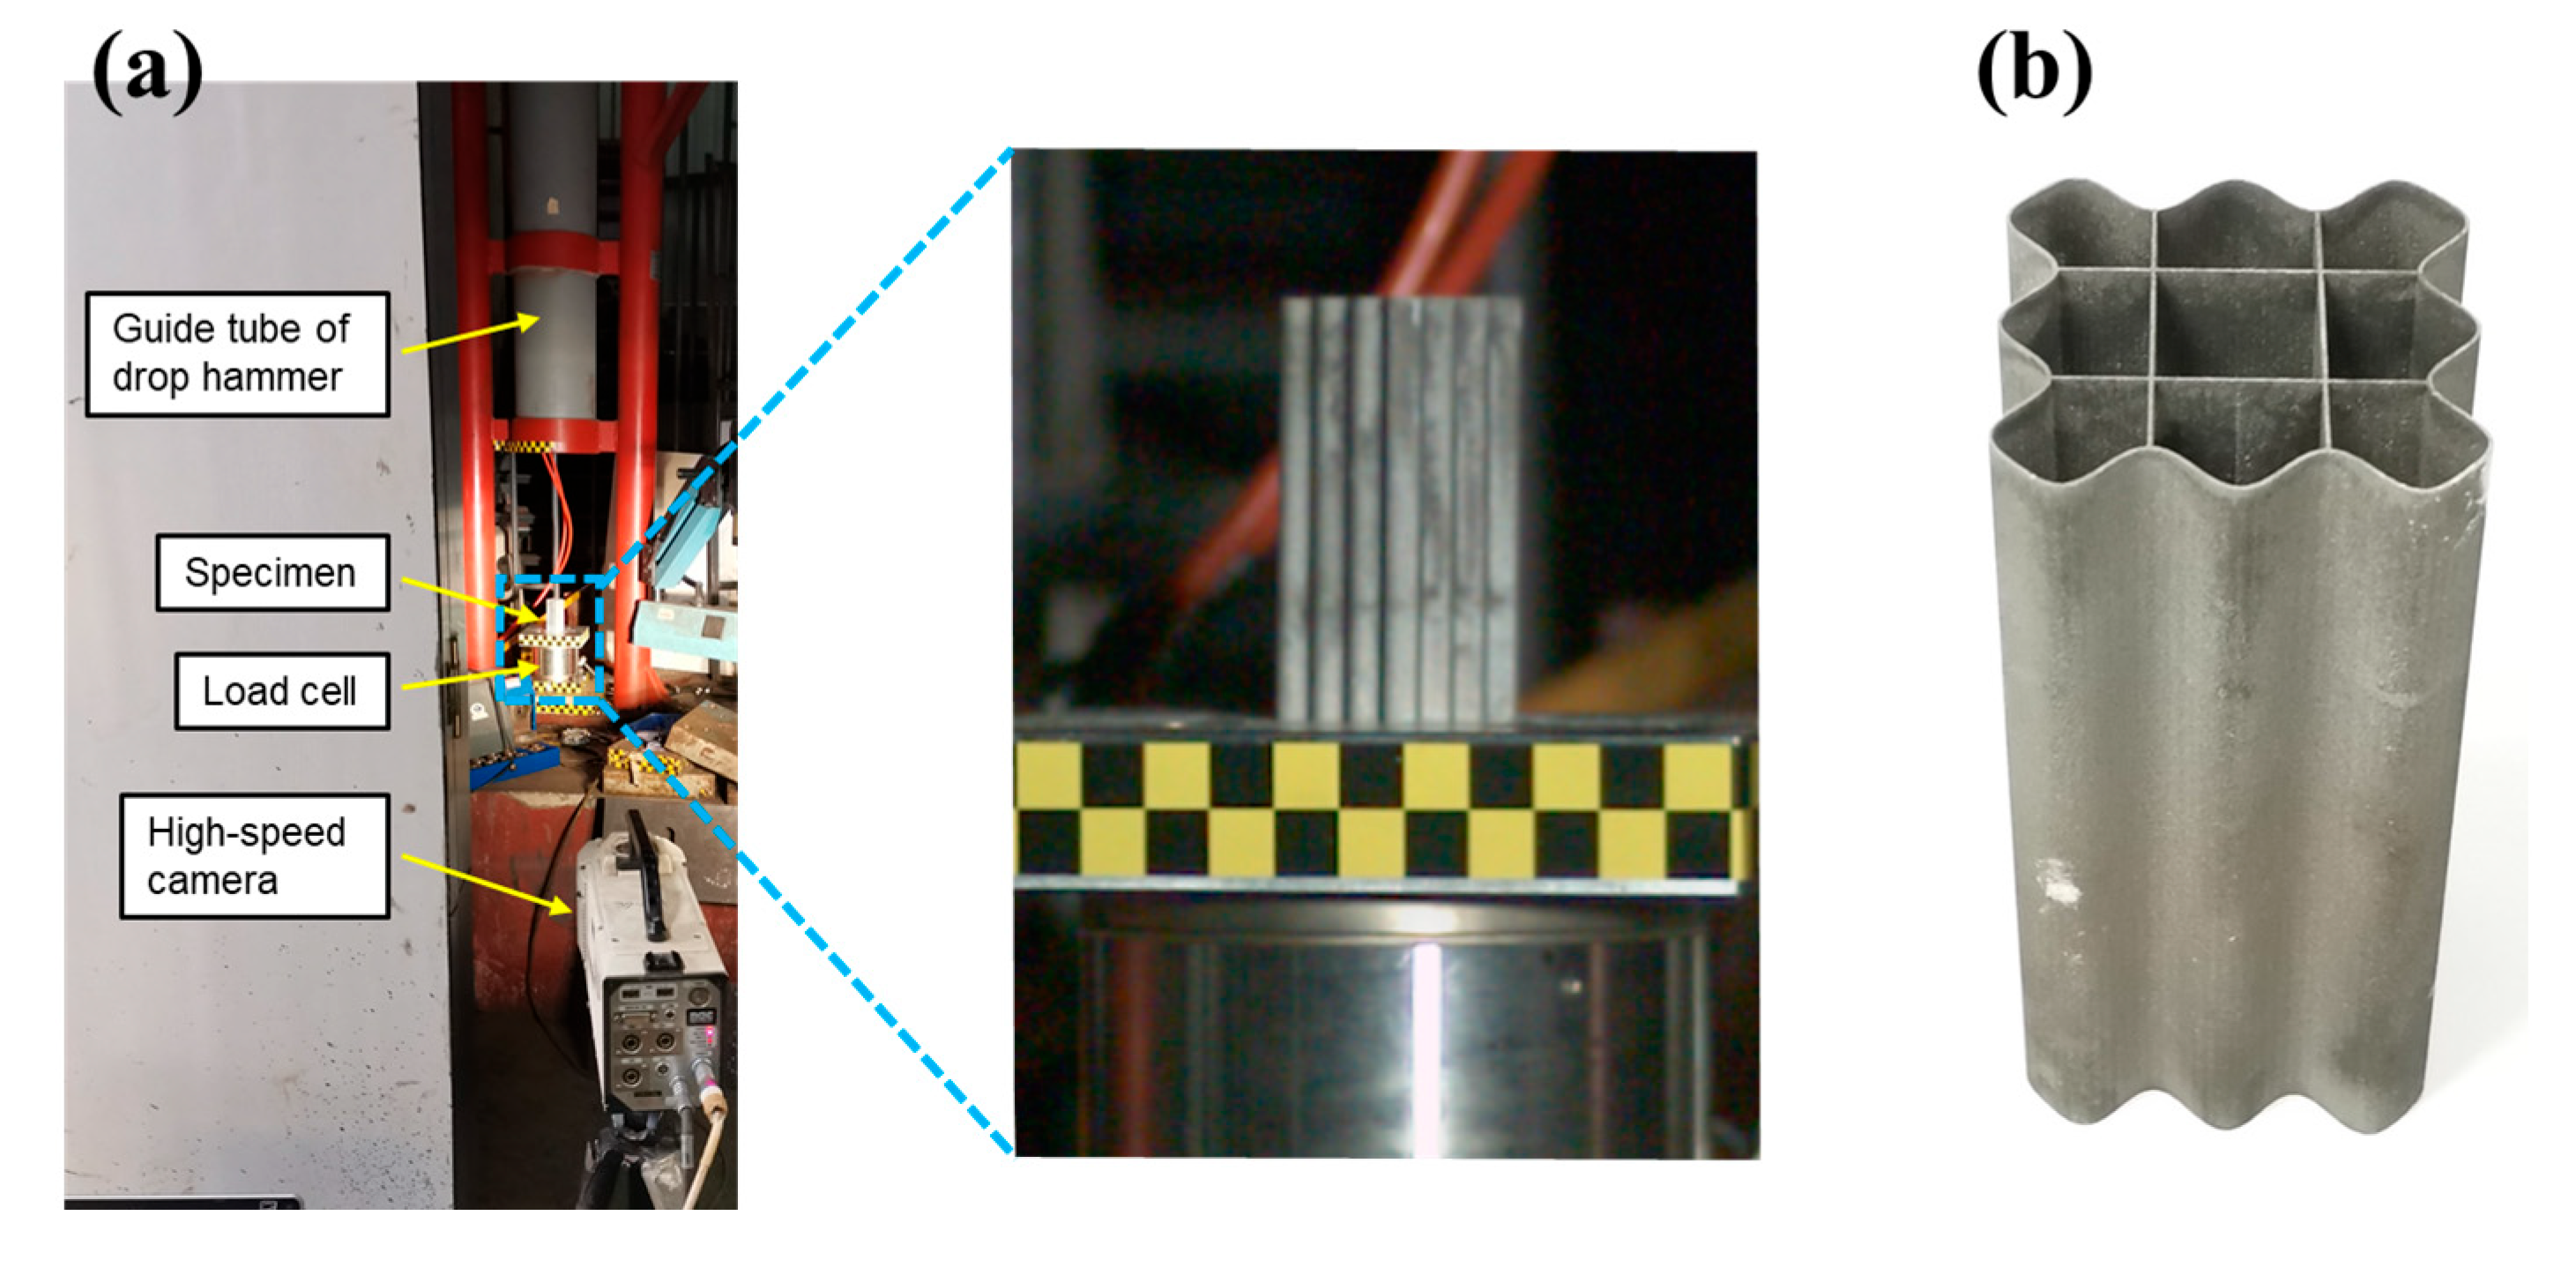
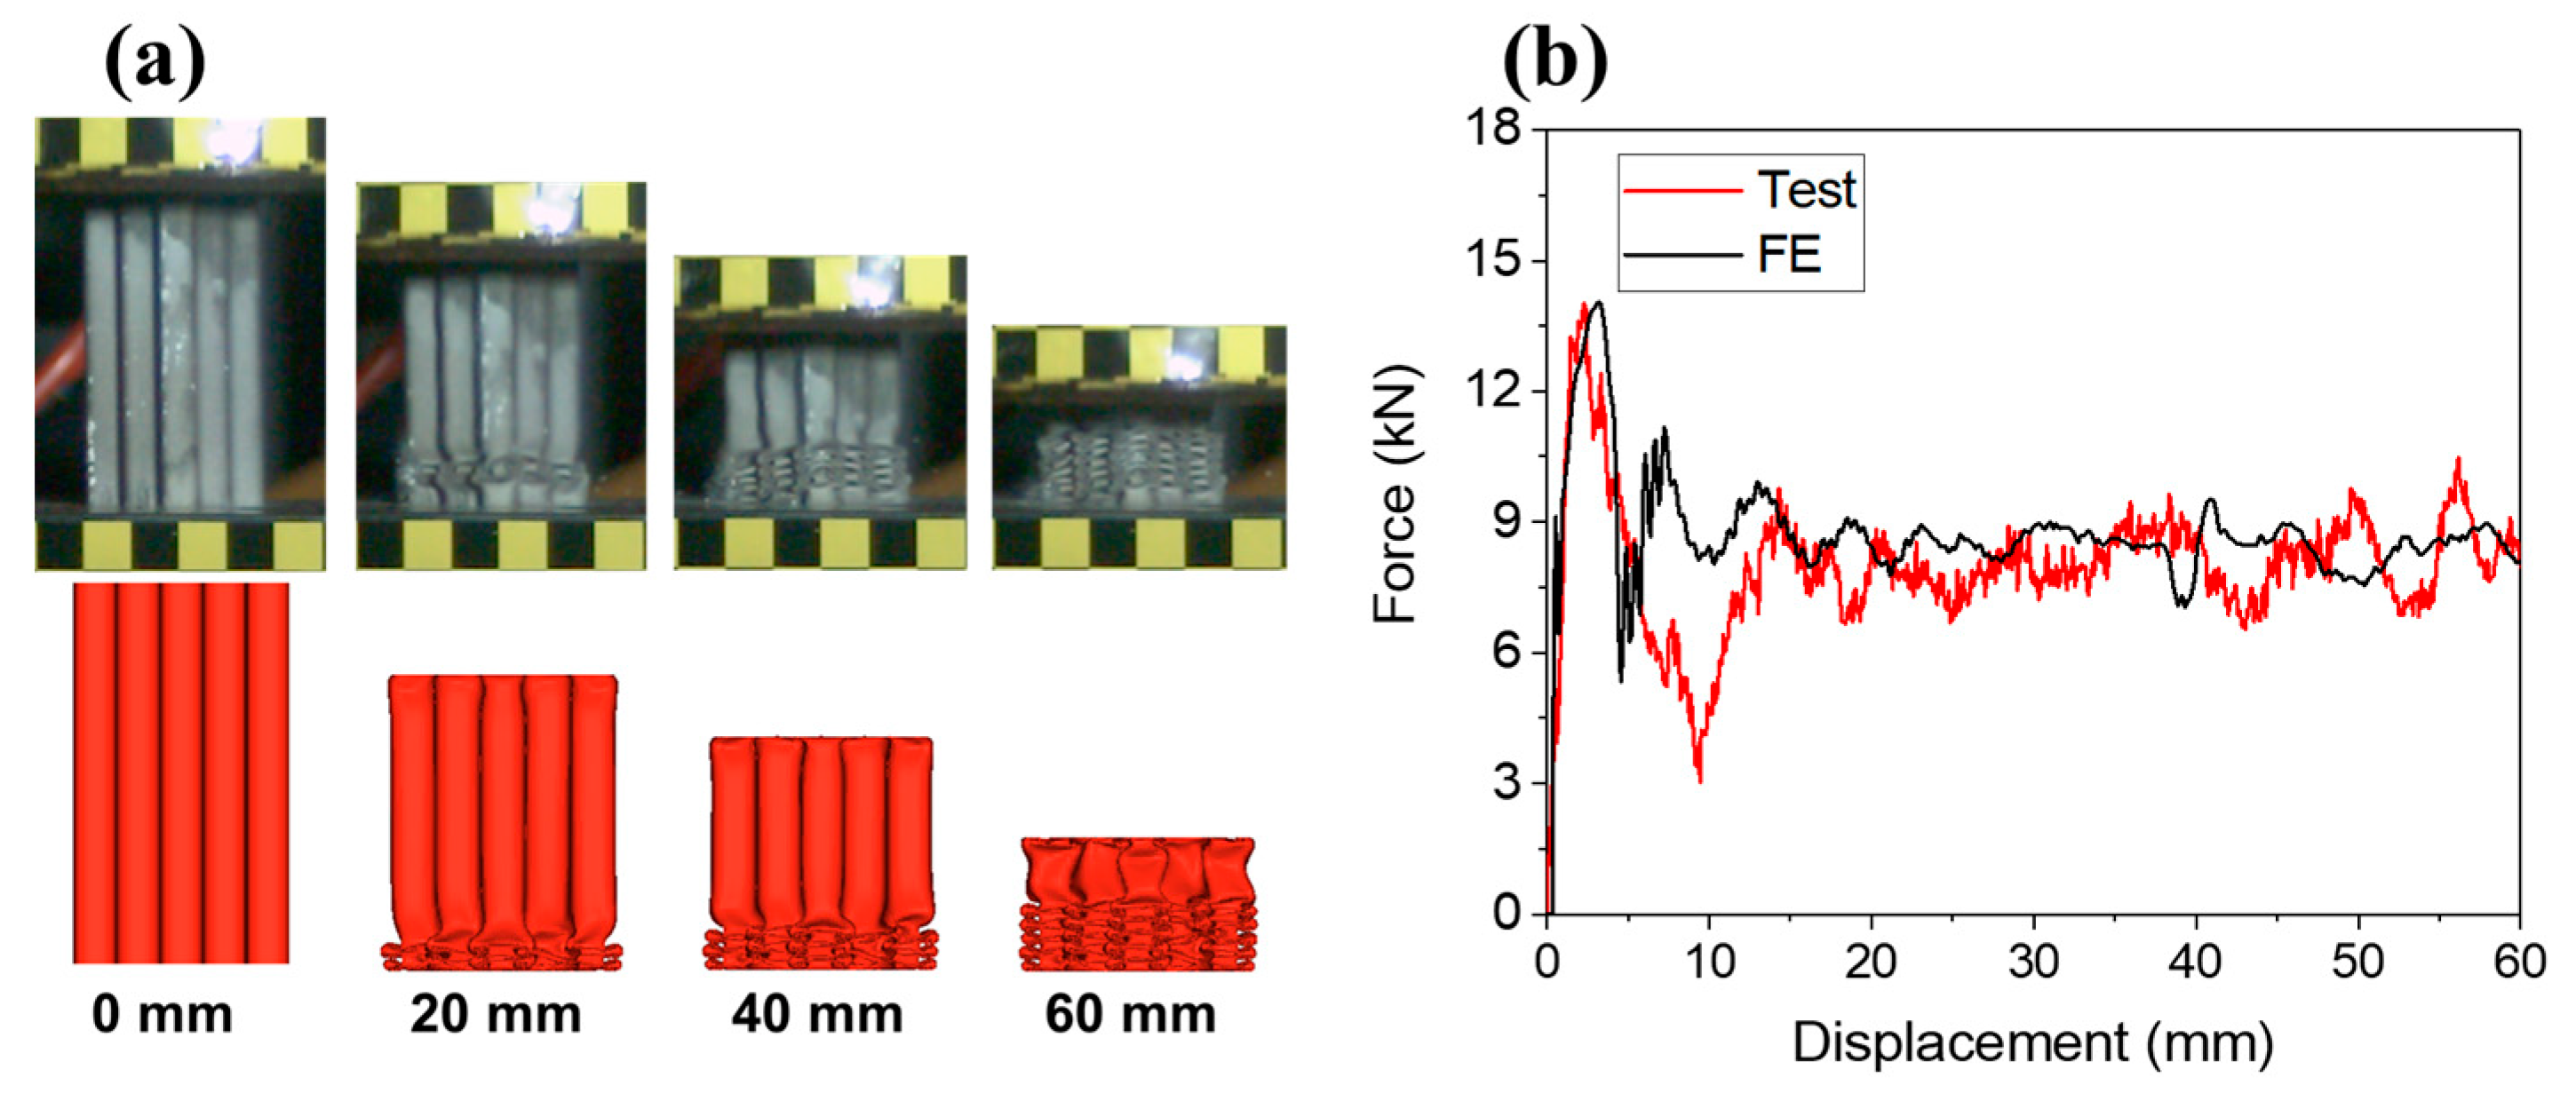
2.3. Validation of the FE Model

In order to verify the FE model, a drop hammer test is performed, as shown in Figure 6. The MCCT with a uniform wall thickness of 0.5 mm and axial length of 100 mm is tested. The test specimen is manufactured using the wire cutting electrical discharge method with a machining accuracy of 0.001 mm, which is suitable for a structure with a complex cross section. The test tube is placed on a load cell, and a 181 kg hammer is released from a height of 1.8 m to impact the tube. The impact process is recorded using a high-speed camera placed in front of the tube. After analyzing the video, the velocity of the hammer at the moment of impact was about 5.75 m/s. The same impact mass and velocity as in the experiment are used in the finite element model established in Section 2.2.
Figure 7 shows the comparison of the deformation process and force-displacement curve between the experiment and FE simulation. It can be seen that the FE results are basically consistent with the experimental results. In addition, some energy absorption assessing criteria, i.e., peak crushing force (PCF), mean crushing force (MCF), energy absorption (EA), specific energy absorption (SEA) and crushing force efficiency (CFE) [20], were calculated for further comparison, as shown in Table 1. The results show that the maximum difference is 9.05%, which lies in an acceptable region. Theses comparisons all indicate that the FE model has a good accuracy.

2.4. Support Vector Machine

The support vector machine (SVM) was selected from many machine learning algorithms and used in the present study because it has outstanding performance both in classification and regression [55] and has been proven to be superior to many other machine learning methods due to the good generalization capability of its produced prediction model [56]. In addition, compared with other learning algorithms, the SVM does not need a large number of complete training data, and needs less free parameters to optimize, which makes its application more convenient [55].
SVM theory was originally developed for classification problems, but later, researchers began to expand its algorithm and apply it to regression problems [57]. The application of SVM on regression problems is known as SVR. The main goal of SVR is to seek a function which produces at most ε deviation from the targets of the training data, and the function should be as flat as possible. SVR utilizes the structural risk minimization (SRM) principle rather than empirical risk minimization (ERM) principle, which is adopted by other machine learning algorithms, such as artificial neural network (ANN). The ERM principle usually only reduces the error of training when set to the greatest extent, and it is easier to over fit. The SRM principle can minimize the empirical risk and maximize the generalization ability of the prediction model simultaneously, which makes the SRM superior to ERM [58,59]. SVR adopts ε-insensitive loss function developed by Vapnik [60]. The ε-insensitive loss function performs better in generalization than other loss functions.
The SVR can be mathematically described as follows:
F p r e d x = i = 1 N s v α i α i * Φ x i , x + b
where Φ(xi, x) is the kernel function and Nsv is the number of support vectors. The parameters αi and αi* are non-negative real numbers, and the optimized αiαi* and b are obtained through minimizing the regularized risk function as follows:
R = C 1 n i = 1 n s L o s s x i + 1 2 w 2
where ns is the number of samples, and C is a positive constant which controls the trade-off between the complexity of the model and the allowable deviation greater than ε in the optimization formula. The parameter ∥w2 is related to the flatness of function.
The loss function is expressed as
L o s s x = a n d 0 i f F o b s e r v e d F p r e d ε ; a n d F o b s e r v e d F p r e d ε , other .
where Fobserved and Fpred are observed and predicted values, respectively. The parameter ε determines the width of the insensitive region and ε > 0.
There are several kernel functions for SVR. The typical and most commonly used are linear, polynomial and Gaussian radial basis function kernels. They are formulated as follows:
Linear :   Φ x i , x = x i x
Polynomial :   Φ x i , x j = x i x + 1 d
RBF :   Φ x i , x j = e x p x i x 2 2 σ 2
where xi and x are training and test data, respectively, d is the dimension of a support vector and σ is the width of the global basis function. γ = 1/2σ2 is a free parameter to be optimized.

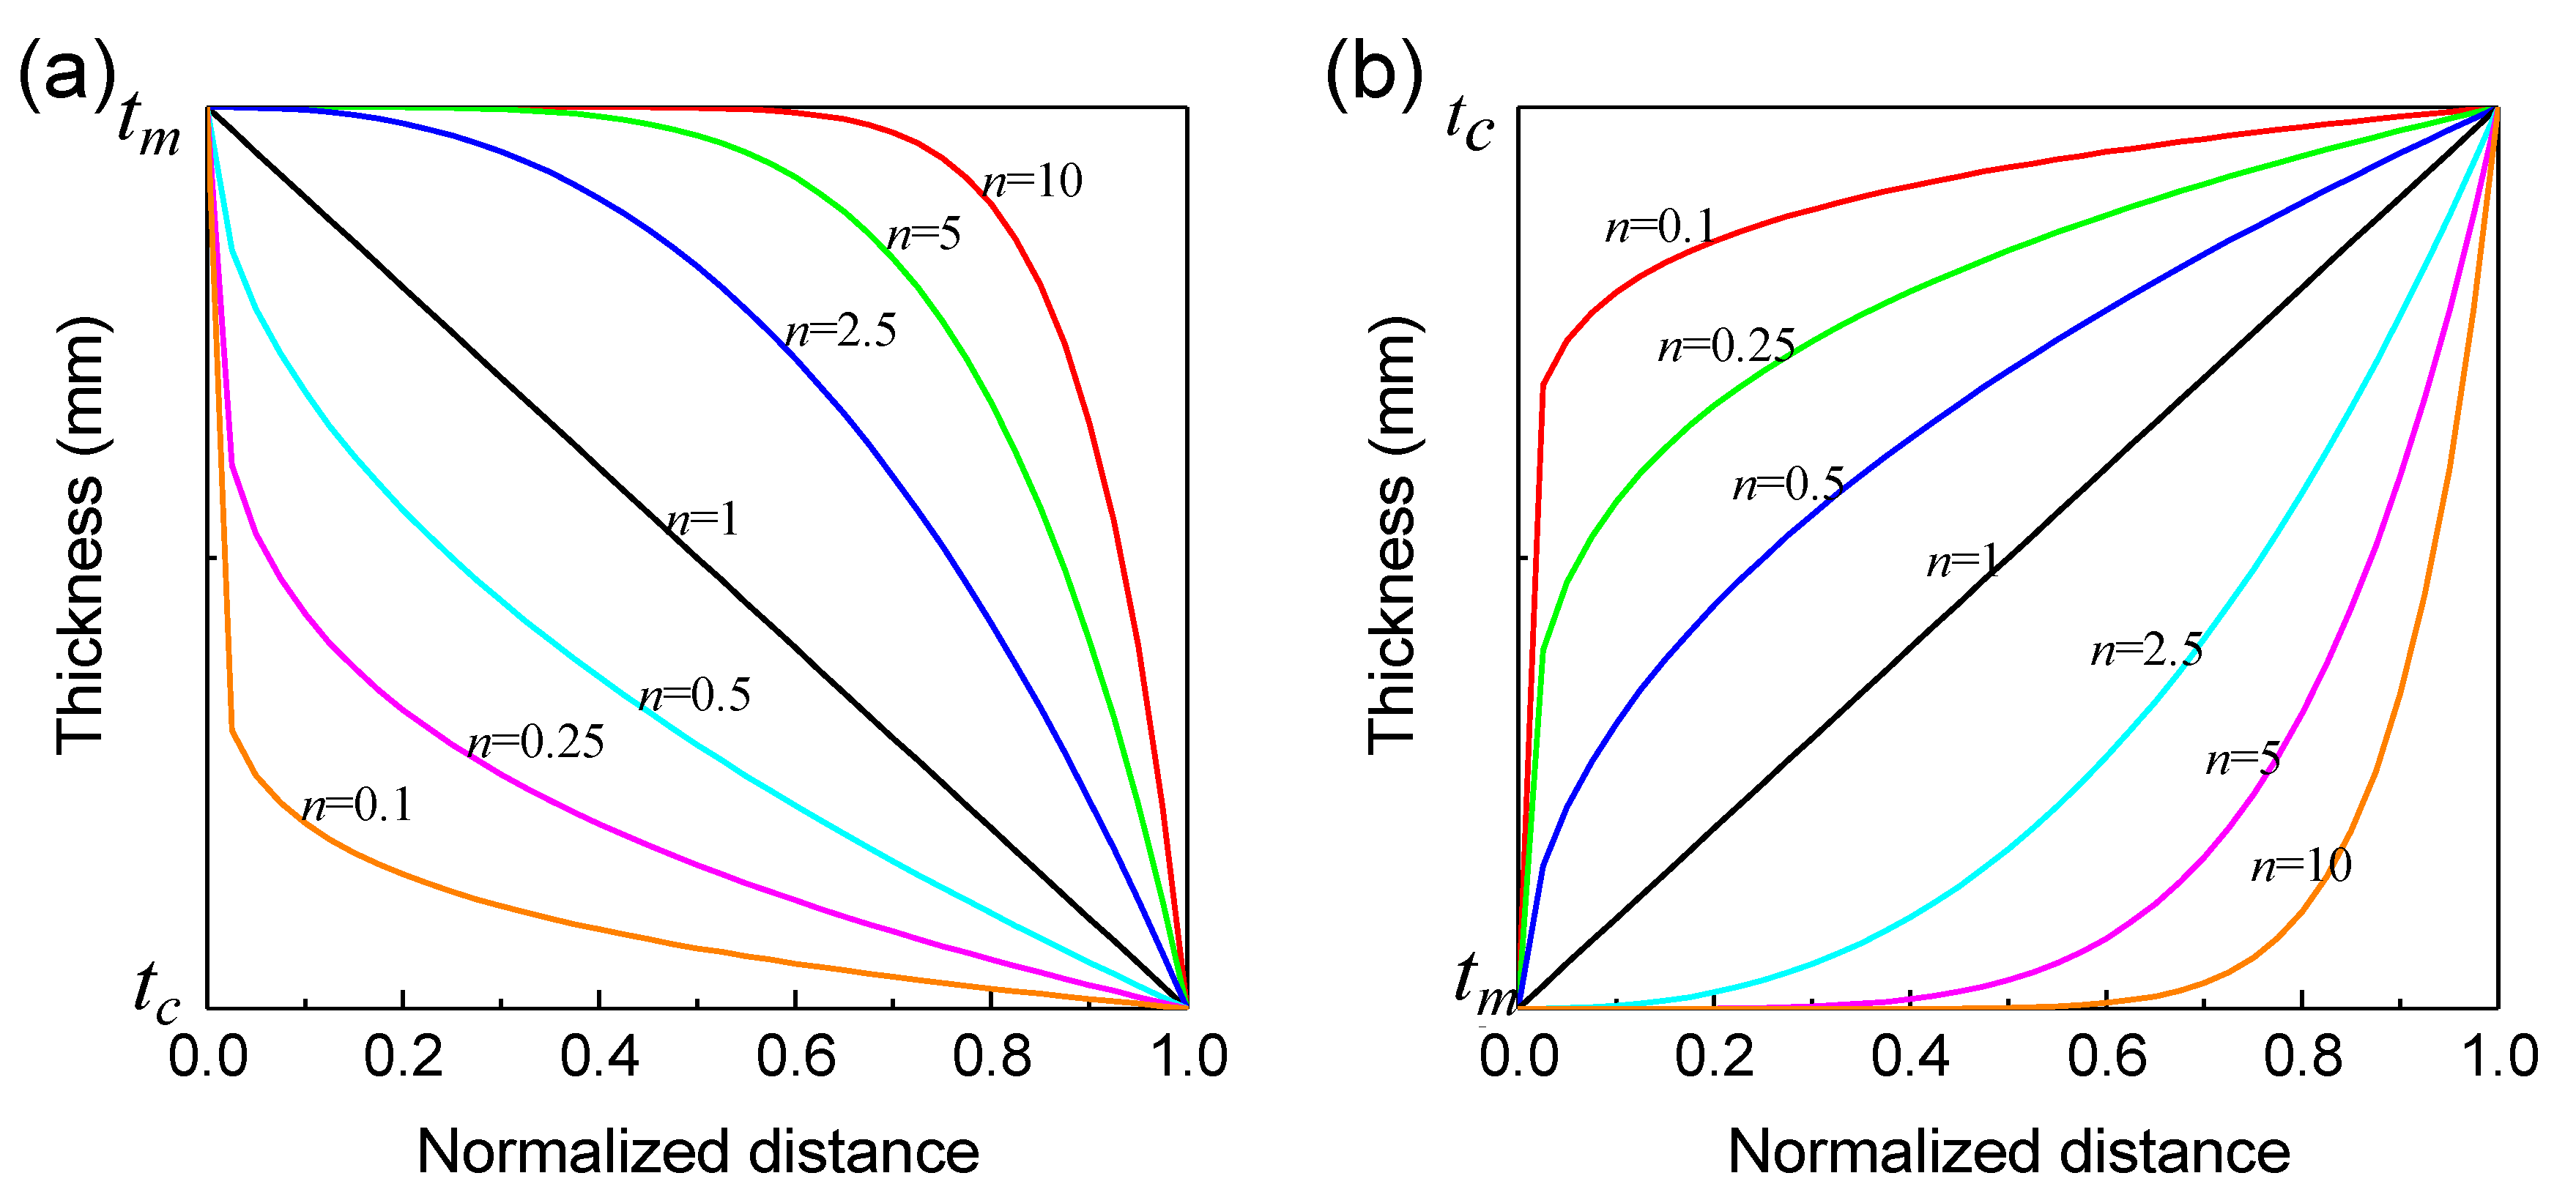
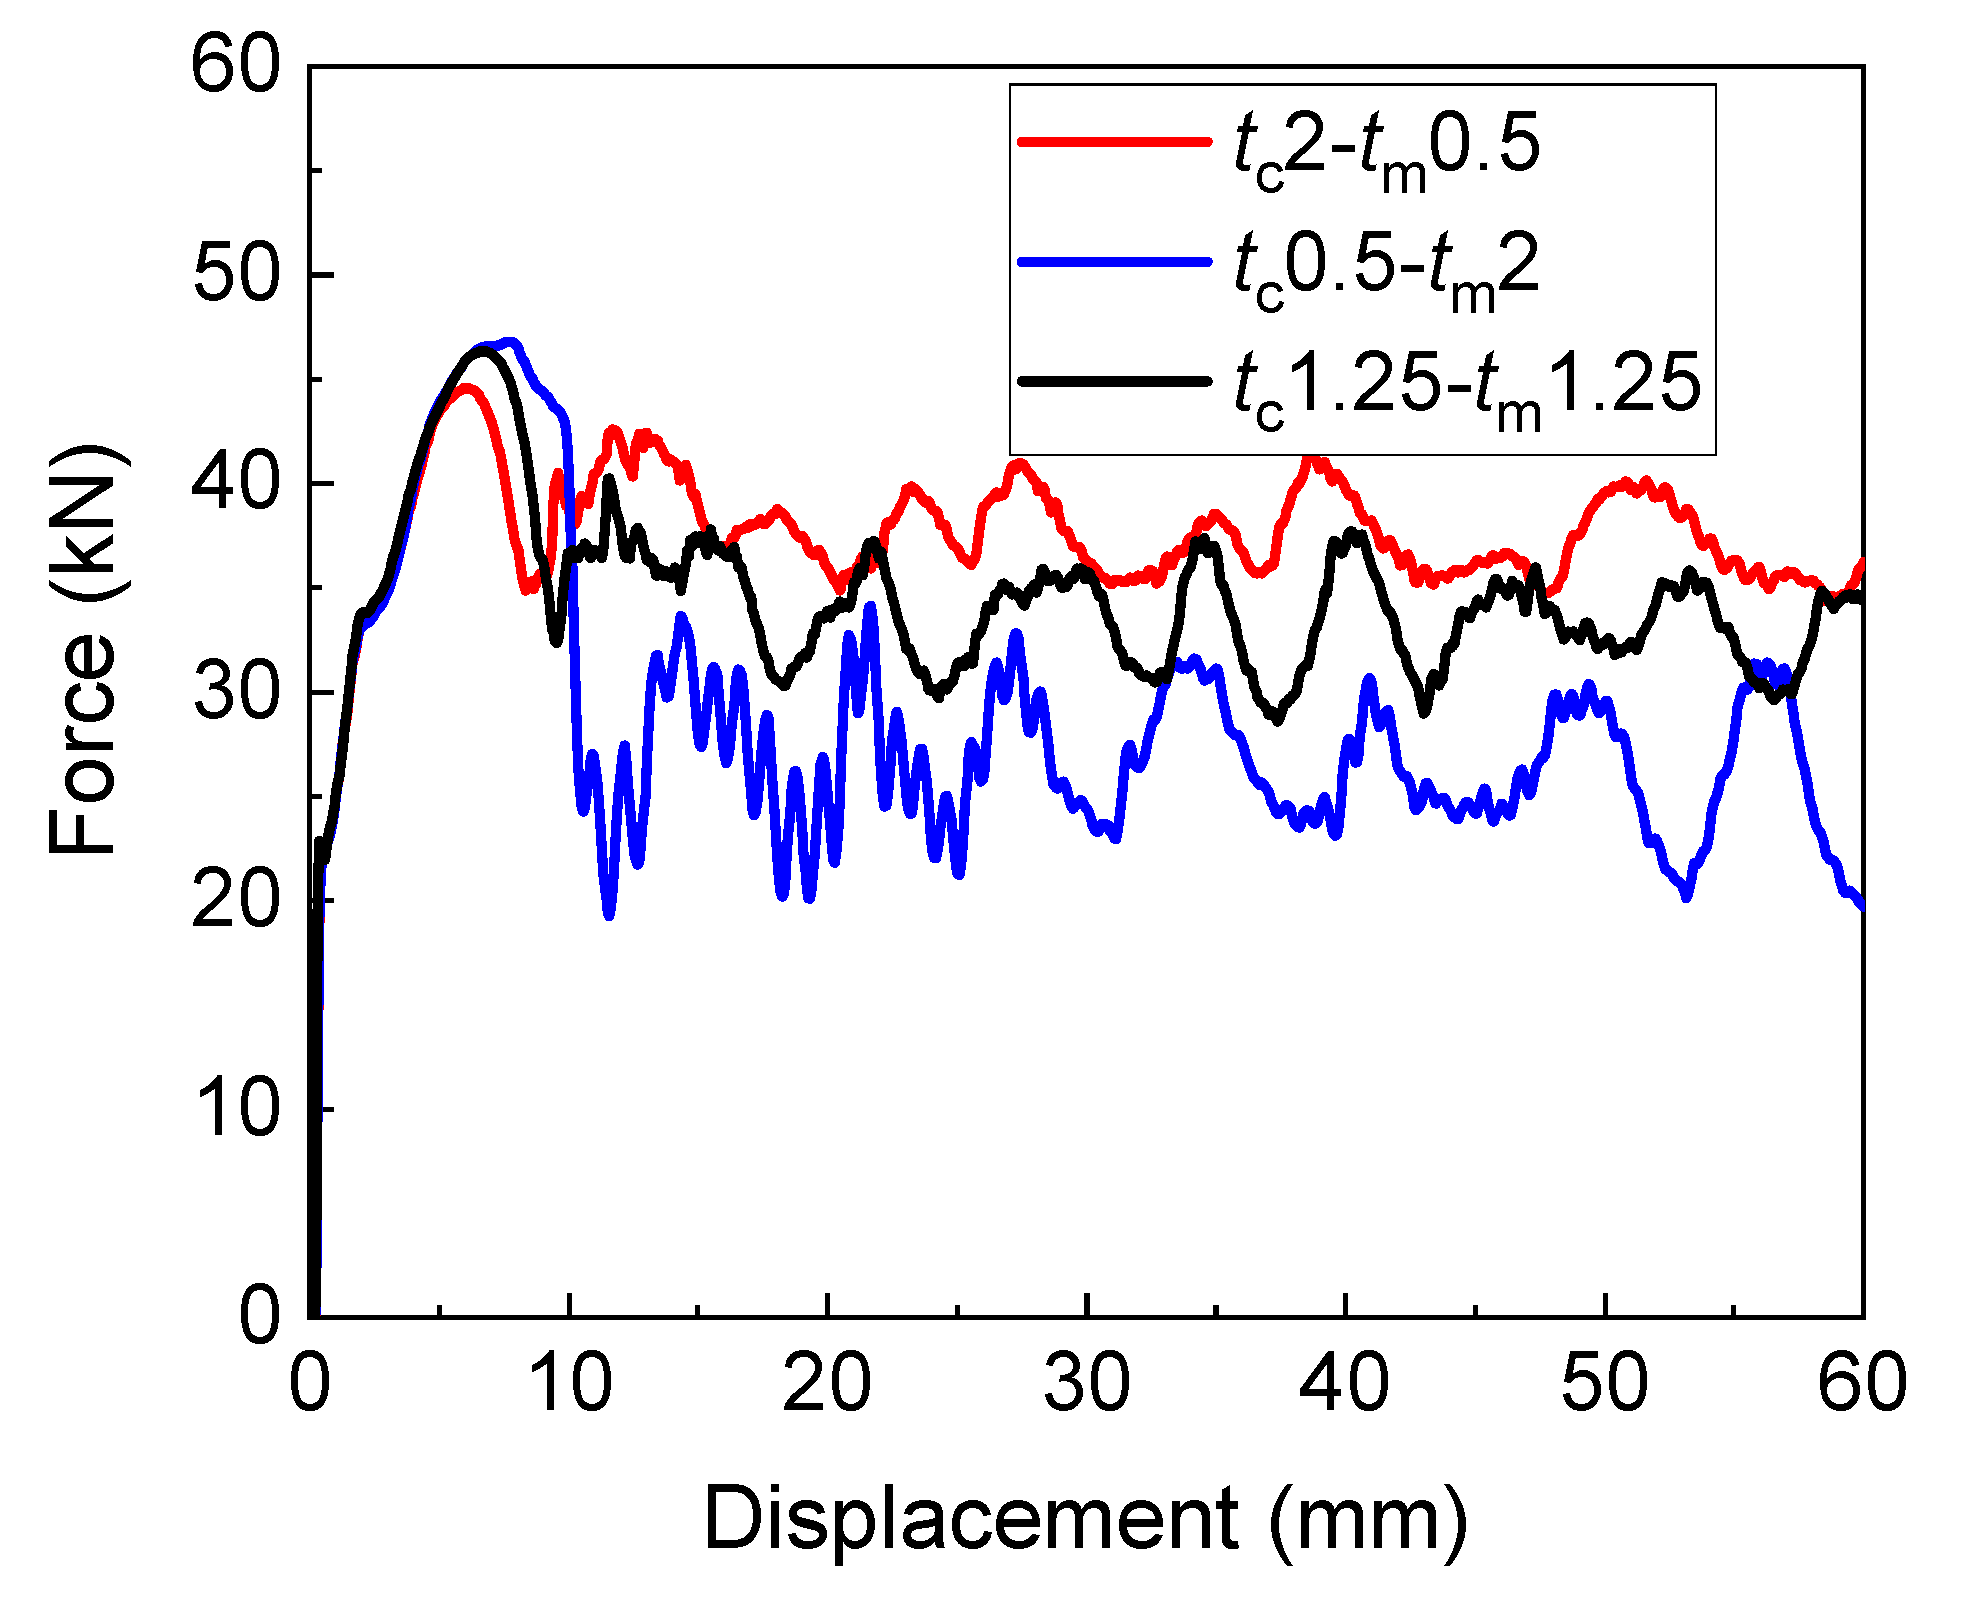
3. Comparison of Three Wall Thickness Variation

As shown in Figure 2, three wall thickness variations of the MCCT are considered in the present study. Here, we first give a simple comparison of the energy absorption performance of the three configurations. To do so, three tubes were established, i.e., a decreasing thickness tube with tc = 2 mm and tm = 0.5 mm, an increasing thickness tube with tc = 0.5 mm and tm = 2 mm, and a tube with uniform thickness of 1.25 mm, in Ls_dyna. For simplicity, the parameter n of both the decreasing thickness tube and the increasing thickness tube were set to one. In addition, the three tubes had the same mass of 112.72 g.
The force-displacement curves of the three tubes are plotted in Figure 8. Based on the force-displacement curves, the values of three important energy absorption assessing criteria were calculated and are listed in Table 2. Apparently, the three tubes all developed a stable force plateau, resulting from their stable deformation. However, their energy absorption performances had obvious differences. The tube tc2-tm0.5 had the largest SEA and CFE and the smallest PCF; while the tube tc0.5-tm2 had the largest PCF, but the smallest SEA and CFE. The PCF of tc2-tm0.5 was 4.81% smaller than that of tc0.5-tm2, and the SEA and CFE of tc2-tm0.5 were 30.67% and 37.70% higher than that of tc0.5-tm2. It can be concluded that the MCCT with decreasing wall thickness performs the best, and the increasing wall thickness performs the worst, in energy absorption. This fully shows that arranging more materials in the corner element area can effectively improve the energy absorption characteristics of the thin-walled tube.

4. Prediction

In the present study, the energy absorption performance of the MCCT was evaluated with SEA, CFE and PCF. Three parameters, tc, tm and n, were considered as variables, and the design intervals were set as 0.5 mm ≤ tc ≤ 2 mm, 0.5 mm ≤ tm ≤ 2 mm and 0.1 ≤ n ≤ 10. The Latin hypercube DOE method was adopted to generate 125 samples. Then, these samples were sent to Ls_dyna for calculation.

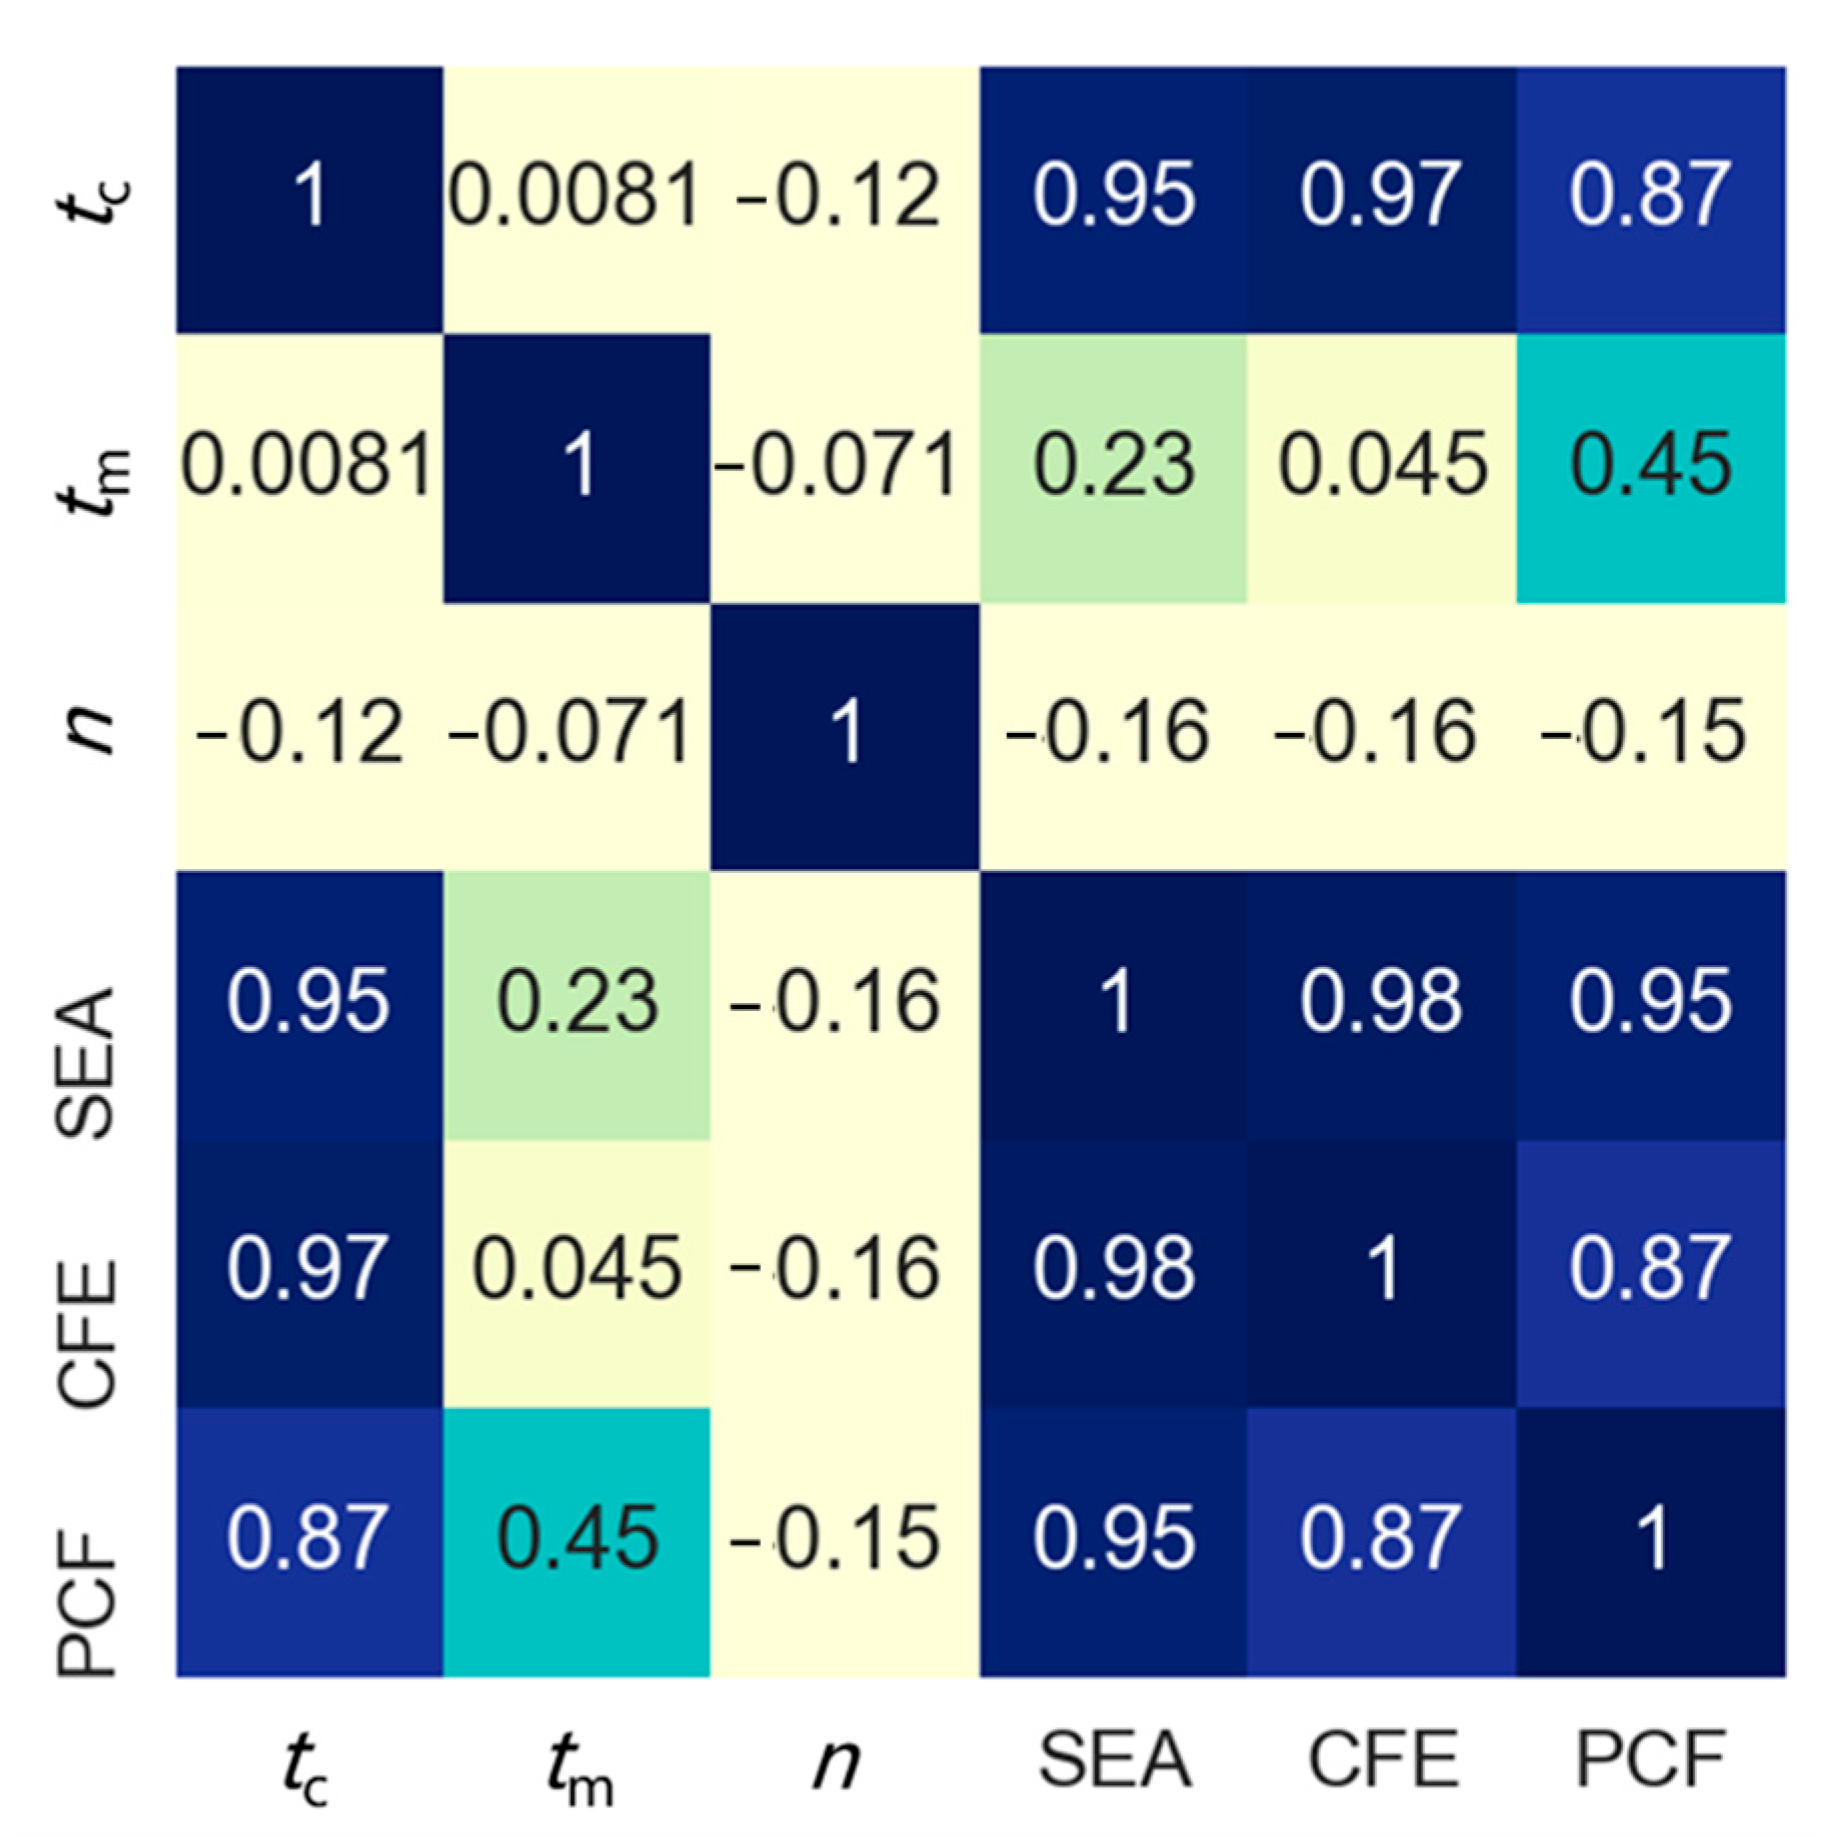
4.1. Correlation Analysis

Based on the dataset obtained from the 125 samples, a correlation analysis [55] was performed. Correlation measures the strength and direction between associated variables. Correlation coefficients can have a value from minus one to one; minus one indicates a strong but negative correlation and one indicates a strong and positive correlation. The correlation matrix displayed in Figure 9 shows not only the correlation between variables, but also the correlation between responses and variables. The correlation coefficients between the variables are very small, which shows that the three variables basically do not affect each other. The correlation between a response and a variable can reflect the importance of the variable on the response. It is clear that for all the three responses, the variable tc had the largest positive importance among the three variables. The variable tm also had a certain positive effect on PCF and SEA, but it had a very small impact on CFE. The parameter n had very little influence on the three responses, and all of them were negative. Therefore, we can obtain the same conclusion as the previous section: that arranging more materials in the corner area is very important for improving the energy absorption performance of tubes.

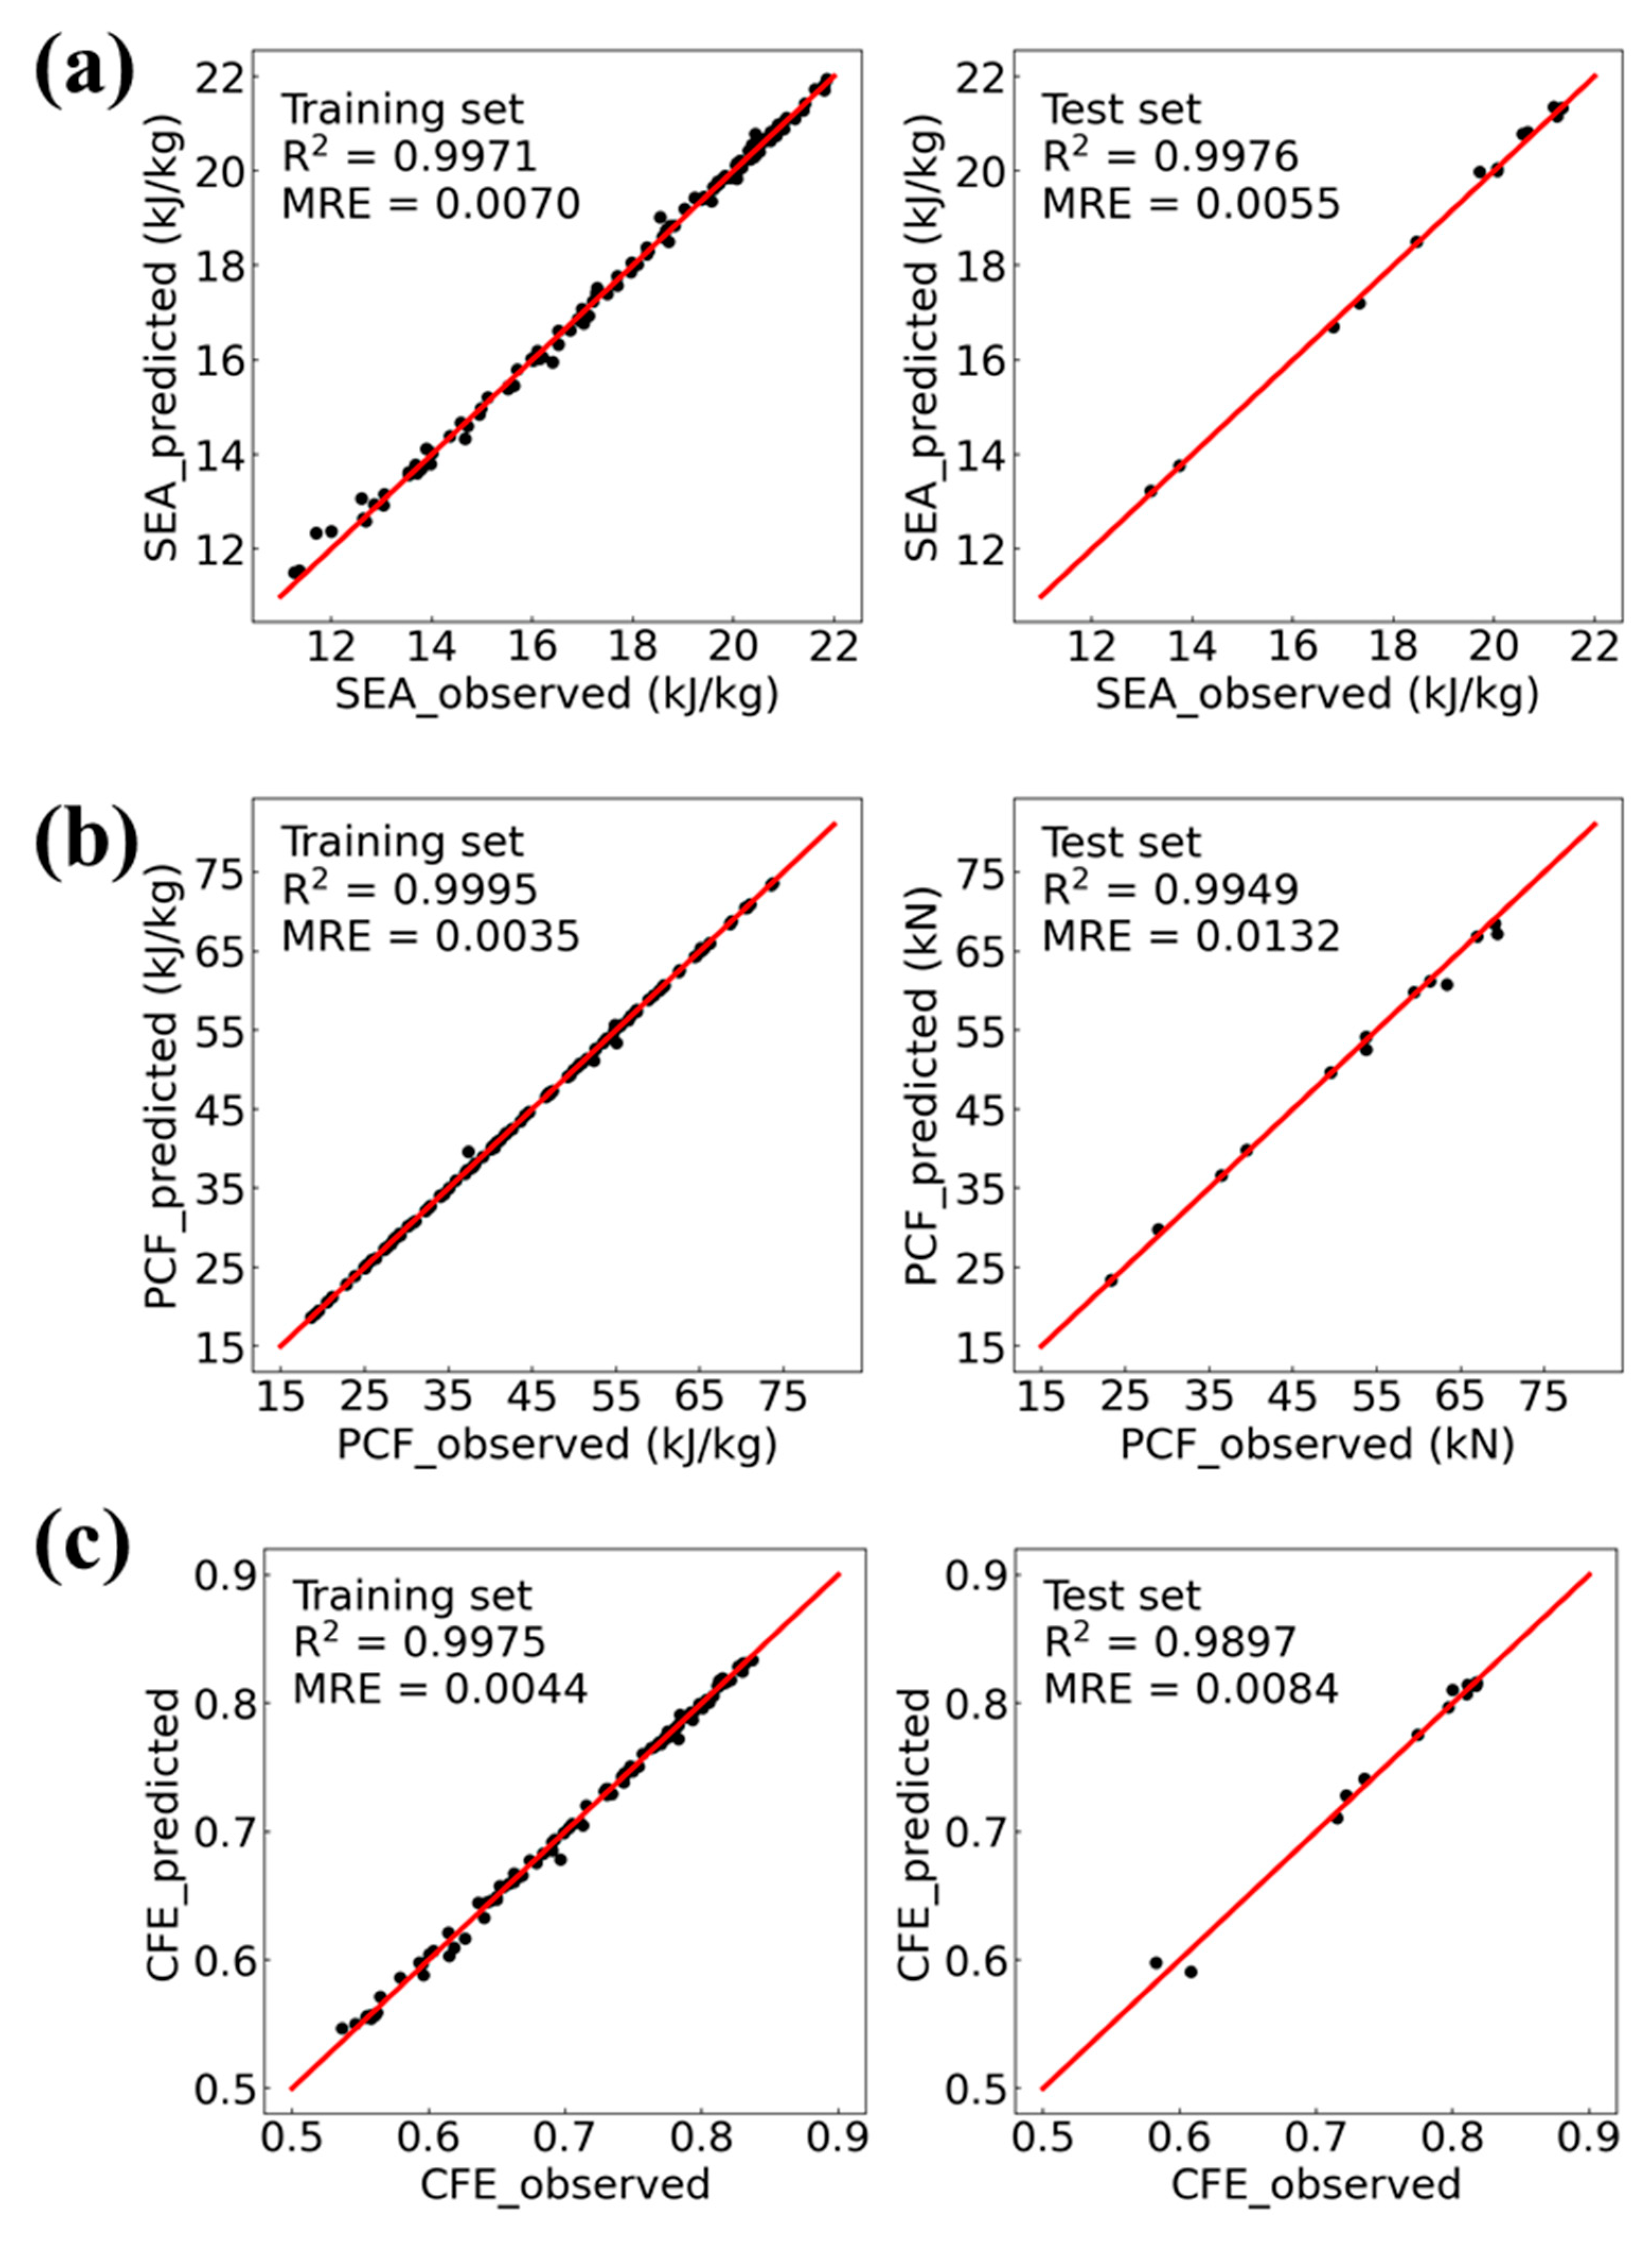
4.2. Prediction of the Energy Absorption Responses
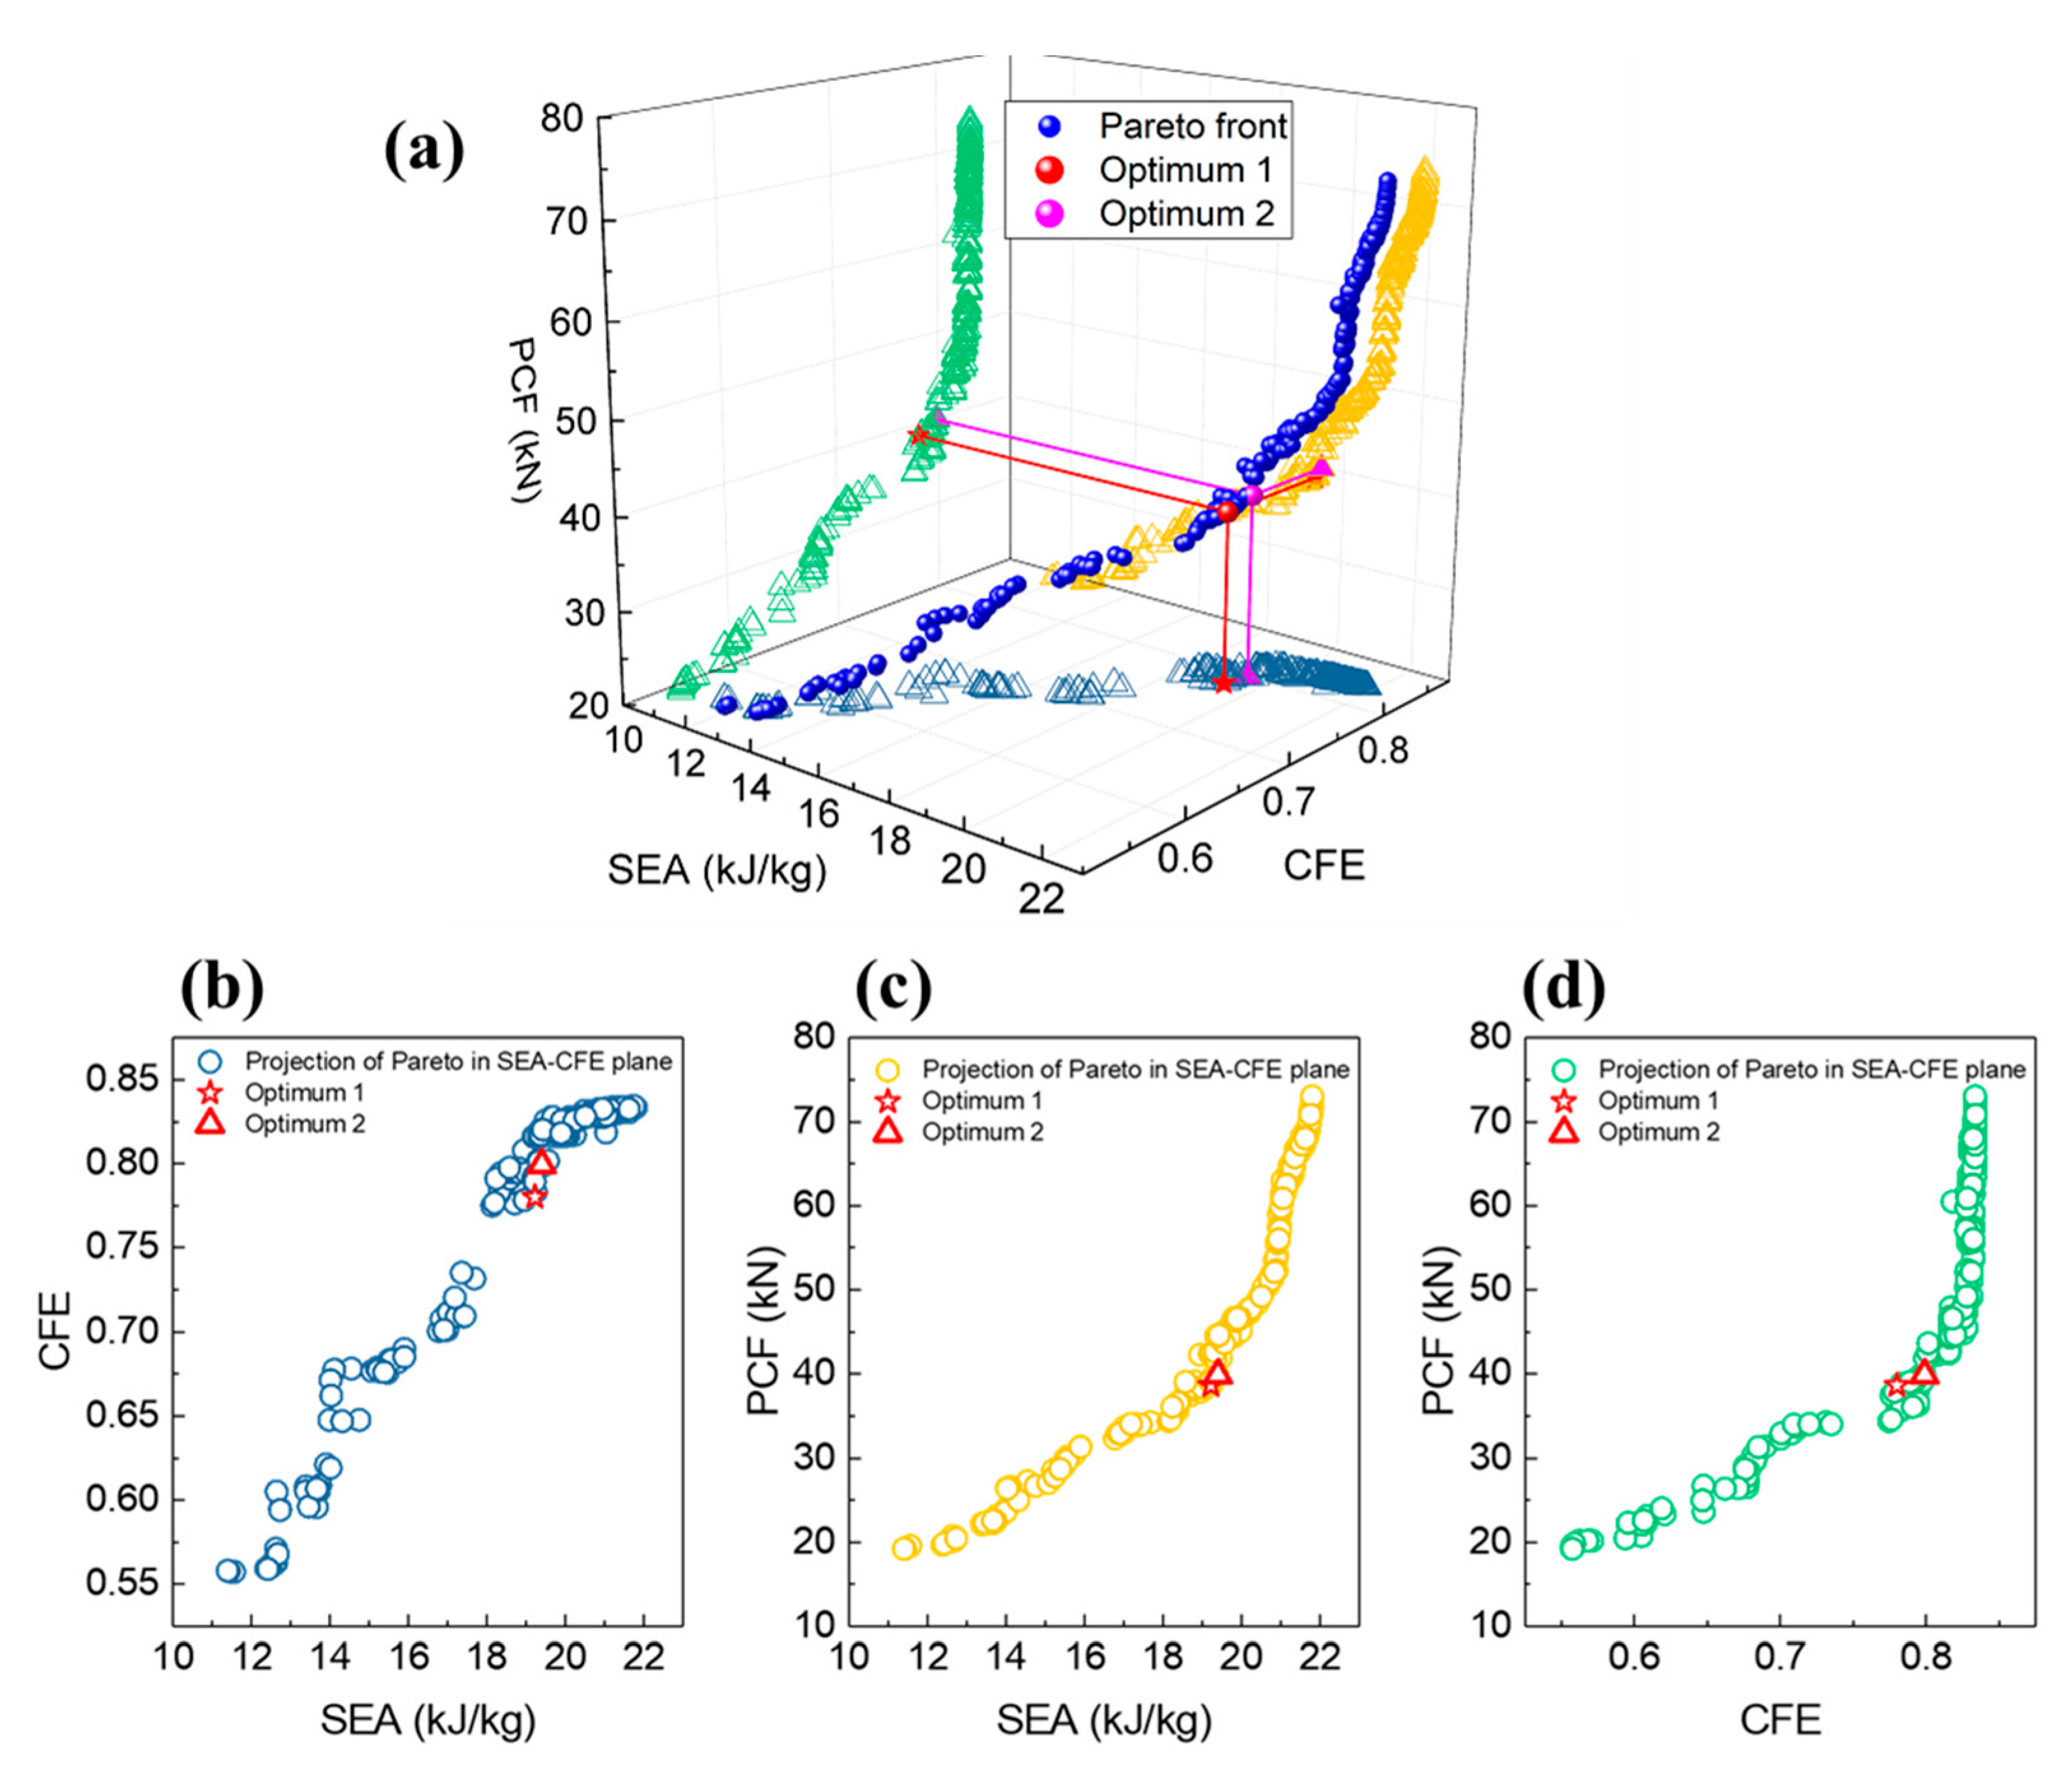
The 125 samples constitute the dataset used for the machine learning prediction. The dataset was split into 80% training set and 20% test set. The SEA, CFE and PCF were predicted using SVR. The RBF kernel was selected as the kernel function in SVR because RBF kernel has good flexibility and accuracy, and is also the most commonly used kernel function [61]. When the RBF kernel was selected, the values of the two parameters, i.e., C and γ, needed to be determined. C was the penalty coefficient, that is, tolerance for error. The higher the C value, the less error can be tolerated and the easier to overfit. The smaller the C value, the easier to underfit. No matter whether the C value was too large or too small, the generalization ability became worse. The parameter γ implicitly determined the distribution of the data after mapping to the new feature space. The larger the γ value, the fewer support vectors; the smaller the γ value, the more support vectors. Therefore, whether the optimal C and γ values can be selected is of vital importance to the accuracy of prediction [55,62]. Cross validation is good method to find the optimal parameters [57], and after a 10-fold cross validation, the optimum C and γ of SEA, CFE and PCF, respectively, could be obtained.
The comparison between the actual and predicted values for the three responses is shown in Figure 10. In order to assess the performances of the prediction models, two indicators, namely, the coefficient of determination (R2) and mean relative error (MRE), are introduced here. The two evaluation indicators are defined as follows [63,64]:
R 2 = 1 i = 1 N y i y i ¯ 2 i = 1 N y i y ¯ 2
M R E = 1 N i = 1 N y i y i ¯ y i × 100 %
where N is the number of sample points, yi is the actual value, y i ¯ is the predicted value for the ith sample, and y ¯ is the mean of the true values of n sample points. R2 and MRE both lie between zero and one. The closer R2 is to one and the closer MRE is to zero, the higher the accuracy of the prediction model.
It is found from Figure 10 that for the training set and test set of the three responses, the R2 of the prediction model is greater than 0.98 and the MRE is less than 0.02, indicating that the prediction models have high accuracies.
Figure 11 shows the responses distribution under different geometers combinations. It is already known that the variable n has very small effect for the three responses, so the responses distribution figures are only plotted under n = 1 for simplicity. It can be found that with the increase in tc, the SEA, CFE and PCF increase dramatically. However, as tm increases, the SEA and PCF can increase to a certain extent, but the CFE hardly changes. Apparently, tc has the dominant positive influence on SEA, PCF and CFE, and tm also has some effects on SEA and PCF, but almost has no effect on CFE.

5. Optimization

Multi-objective optimization was performed to find the optimum configuration of the MCCT. The optimization problem is defined as maximizing the SEA and CFE and minimizing the PCF in the design space as follows:
a n d M i n ( P C F , S E A , C F E ) a n d s t . a n d 0.5 m m t c , t m 2 m m a n d 0.1 n 10
There is no constraint imposed between tc and tm. Therefore, the increasing wall thickness, decreasing wall thickness and uniform wall thickness configurations all can be considered.
The Nondominated Sorting Genetic algorithm III (NSGA-III) [65] is utilized to perform the optimization. The NSGA-III is developed based on NSGA-II by improving the selection strategy, which can reduce the computational cost.
The Pareto fronts obtained from the multi-objective optimization is shown in Figure 12, which shows that any two objectives are conflicted with each other. Since the Pareto fronts contain many alternatives and involve three criteria, selecting an optimal result becomes a multi-criterion decision problem. Herein, the TOPSIS method [33] is adopted to deal with the multi-criterion decision problem. In the selection, each criterion must be given a weight, depending on the importance of the criterion. The SEA and PCF are more important than CFE according to engineering experience, so we set the weights as 0.4, 0.4 and 0.2 for SEA, PCF and CFE, respectively. For comparison, another selection case is performed under the condition that the three indicators are given equal weights. The selected two optimum alternatives are labelled with Optimum 1 and Optimum 2 in Figure 12. In addition, the energy absorption performances of the two optimum alternatives are compared to that of the initial design with uniform wall thickness, i.e., tc = tm = 1.25 mm, as displayed in Table 3. The result shows that the two optimum alternatives increase the benefit criteria (SEA and CFE) and decrease the cost criterion (PCF).
In addition, the distribution of tc v.s. tm of the Pareto fronts was analyzed, as shown in Figure 13. Most of the samples lie in the region tc > tm, and are basically distributed on two lines, i.e., tm = 0.5 and tc = 2. This means that the multi-objective optimization needs to be performed under two conditions, i.e., searching for suitable tc when tm is minimum, and searching for suitable tm when tc is maximum. This result also shows that better energy absorption is achieved when the corner elements are thicker than the other areas.

6. Conclusions

This paper proposes a multi-cell corrugated tube (MCCT) with circumferentially variable wall thickness for energy absorption. Three different configurations, i.e., increasing wall thickness, decreasing wall thickness and uniform wall thickness, were considered. An FE model for the MCCT under impact loading was established in Ls_dyna, which was validated by a drop hammer test, to investigate its energy absorption behavior. The comparison of the three configurations shows that the MCCT with decreasing wall thickness performs the best, and the MCCT with increasing wall thickness performs the worst, with regards energy absorption. Support vector machine (SVM), a machine learning method, was adopted to predict the energy absorption responses SEA, PCF and CFE of the MCCT under different combinations of geometric parameters (i.e., tc, tm and n). The dataset was obtained by a Latin Hypercube DOE. The prediction models for the three responses all show very high accuracies. Based on the prediction models, the distributions of the three responses were obtained. The distribution figures show that tc has the largest effect on the energy absorption behavior of the MCCT, followed by tm and then n. The prediction models were then used for multi-objective energy absorption optimization of the MCCT. The optimization was calculated by NSGA-III. Pareto fronts were then obtained and the TOPSIS method was utilized to select the optimum alternatives. Compared to the initial design, the energy absorption performance of the optimum alternatives improved clearly. In addition, the results of the comparison of the different configurations, DOE, responses distribution and optimization all show that arranging more material at the corner regions can dramatically improve the energy absorption performance of thin-walled tubes. This work highlights the importance of designing thin-walled tubes as multi-corner and variable thickness configurations for energy absorption.
This study mainly focuses on the analysis and optimization of the influence of the distribution of wall thickness on the energy absorption performance of corrugated multi-cell tubes under axial loading. However, the probability of the vehicle being subjected to oblique load in the collision is greater, so the study of the energy absorption performance of this structure under various loading conditions should be one of the focuses of future work. In addition, this work mainly focuses on the experimental and numerical research of the new proposed structures. Theoretical research will dramatically improve this study and should be another research direction in the future.

Author Contributions

Conceptualization, Z.L.; methodology, Z.L., S.Y. and C.Y.; investigation, Z.L. and S.Y.; resources, Z.L. and S.Y.; data curation, Z.L. and C.Y.; writing—original draft preparation, Z.L. and C.Y.; writing—review and editing, Z.L. and C.Y.; project administration, S.Y.; funding acquisition, S.Y. All authors have read and agreed to the published version of the manuscript.

Funding

This research was funded by the National Natural Science Foundation of China, grant number 51675537.

Institutional Review Board Statement

Not applicable.

Informed Consent Statement

Not applicable.

Data Availability Statement

Not applicable.

Conflicts of Interest

The authors declare no conflict of interest.

References

  1. Xie, S.; Zhou, H. Impact characteristics of a composite energy absorbing bearing structure for railway vehicles. Compos. Part B Eng. 2014, 67, 455–463. [Google Scholar] [CrossRef]
  2. Zhang, H.; Peng, Y.; Hou, L.; Wang, D.; Tian, G.; Li, Z. Multistage Impact Energy Distribution for Whole Vehicles in High-Speed Train Collisions: Modeling and Solution Methodology. IEEE Trans. Ind. Inform. 2020, 16, 2486–2499. [Google Scholar] [CrossRef]
  3. Hou, L.; Peng, Y.; Sun, D. Dynamic analysis of railway vehicle derailment mechanism in train-to-train collision accidents. Proc. Inst. Mech. Eng. Part F J. Rail Rapid Transit 2020, 235, 1022–1034. [Google Scholar] [CrossRef]
  4. Liu, J.; Chen, W.; Hao, H.; Wang, Z. Numerical study of low-speed impact response of sandwich panel with tube filled honeycomb core. Compos. Struct. 2019, 220, 736–748. [Google Scholar] [CrossRef]
  5. Yang, C.; Xu, P.; Yao, S.; Xie, S.; Li, Q.; Peng, Y. Optimization of honeycomb strength assignment for a composite energy-absorbing structure. Thin-Walled Struct. 2018, 127, 741–755. [Google Scholar] [CrossRef]
  6. Sun, G.; Tian, J.; Liu, T.; Yan, X.; Huang, X. Crashworthiness optimization of automotive parts with tailor rolled blank. Eng. Struct. 2018, 169, 201–215. [Google Scholar] [CrossRef]
  7. Zhou, J.; Qin, R.; Chen, B. On the Folding Mechanics of Square Columns with Double-Surfaced Gradients. Math. Probl. Eng. 2019, 2019, 4706563. [Google Scholar] [CrossRef]
  8. Li, Z.; Ma, W.; Yao, S.; Xu, P.; Hou, L.; Deng, G. A machine learning based optimization method towards removing undesired deformation of energy-absorbing structures. Struct. Multidiscip. Optim. 2021, 64, 919–934. [Google Scholar] [CrossRef]
  9. Ma, W.; Xie, S.; Li, Z.; Feng, Z.; Jing, K. Crushing behaviors of horse-hoof-wall inspired corrugated tubes under multiple loading conditions. Mech. Adv. Mater. Struct. 2021, 29, 3263–3280. [Google Scholar] [CrossRef]
  10. Ma, W.; Xie, S.; Li, Z. Mechanical performance of bio-inspired corrugated tubes with varying vertex configurations. Int. J. Mech. Sci. 2020, 172, 105399. [Google Scholar] [CrossRef]
  11. Xie, S.; Yang, W.; Wang, N.; Li, H. Crashworthiness analysis of multi-cell square tubes under axial loads. Int. J. Mech. Sci. 2017, 121, 106–118. [Google Scholar] [CrossRef]
  12. Li, Z.; Ma, W.; Xu, P.; Yao, S. Crashworthiness of multi-cell circumferentially corrugated square tubes with cosine and triangular configurations. Int. J. Mech. Sci. 2020, 165, 105205. [Google Scholar] [CrossRef]
  13. Sun, G.; Liu, T.; Huang, X.; Zheng, G.; Li, Q. Topological configuration analysis and design for foam filled multi-cell tubes. Eng. Struct. 2018, 155, 235–250. [Google Scholar] [CrossRef]
  14. Wu, S.; Sun, G.; Wu, X.; Li, G.; Li, Q. Crashworthiness analysis and optimization of fourier varying section tubes. Int. J. Non-Linear Mech. 2017, 92, 41–58. [Google Scholar] [CrossRef]
  15. Pirmohammad, S.; Marzdashti, S.E. Crushing behavior of new designed multi-cell members subjected to axial and oblique quasi-static loads. Thin-Walled Struct. 2016, 108, 291–304. [Google Scholar] [CrossRef]
  16. Sun, F.; Lai, C.; Fan, H.; Fang, D. Crushing mechanism of hierarchical lattice structure. Mech. Mater. 2016, 97, 164–183. [Google Scholar] [CrossRef]
  17. Luo, Y.; Fan, H. Energy absorbing ability of rectangular self-similar multi-cell sandwich-walled tubular structures. Thin-Walled Struct. 2018, 124, 88–97. [Google Scholar] [CrossRef]
  18. Zhou, J.; Qin, R.; Chen, B. Energy absorption properties of multi-cell thin-walled tubes with a double surface gradient. Thin-Walled Struct. 2019, 145, 106386. [Google Scholar] [CrossRef]
  19. Abramowicz, W.; Jones, N. Dynamic progressive buckling of circular and square tubes. Int. J. Impact Eng. 1986, 4, 243–270. [Google Scholar] [CrossRef]
  20. Xiang, Y.; Yu, T.; Yang, L. Comparative analysis of energy absorption capacity of polygonal tubes, multi-cell tubes and honeycombs by utilizing key performance indicators. Mater. Des. 2016, 89, 689–696. [Google Scholar] [CrossRef]
  21. Zhang, X.; Huh, H. Crushing analysis of polygonal columns and angle elements. Int. J. Impact Eng. 2010, 37, 441–451. [Google Scholar] [CrossRef]
  22. Yao, S.; Tian, Y.; Li, Z.; Yang, F.; Xu, P. Crushing characteristic of polygonal tubes with hierarchical triangular cells. Thin-Walled Struct. 2020, 157, 107031. [Google Scholar] [CrossRef]
  23. Fan, Z.; Lu, G.; Liu, K. Quasi-static axial compression of thin-walled tubes with different cross-sectional shapes. Eng. Struct. 2013, 55, 80–89. [Google Scholar] [CrossRef]
  24. Liu, W.; Lin, Z.; He, J.; Wang, N.; Deng, X. Crushing behavior and multi-objective optimization on the crashworthiness of sandwich structure with star-shaped tube in the center. Thin-Walled Struct. 2016, 108, 205–214. [Google Scholar] [CrossRef]
  25. Li, Y.; You, Z. Origami concave tubes for energy absorption. Int. J. Solids Struct. 2019, 169, 21–40. [Google Scholar] [CrossRef]
  26. Liu, S.; Tong, Z.; Tang, Z.; Liu, Y.; Zhang, Z. Bionic design modification of non-convex multi-corner thin-walled columns for improving energy absorption through adding bulkheads. Thin-Walled Struct. 2015, 88, 70–81. [Google Scholar] [CrossRef]
  27. Tang, Z.; Liu, S.; Zhang, Z. Energy absorption properties of non-convex multi-corner thin-walled columns. Thin-Walled Struct. 2012, 51, 112–120. [Google Scholar] [CrossRef]
  28. Li, Z.; Ma, W.; Xu, P.; Yao, S. Crushing behavior of circumferentially corrugated square tube with different cross inner ribs. Thin-Walled Struct. 2019, 144, 106370. [Google Scholar] [CrossRef]
  29. Eyvazian, A.; Habibi, M.K.; Hamouda, A.M.; Hedayati, R. Axial crushing behavior and energy absorption efficiency of corrugated tubes. Mater. Des. 2014, 54, 1028–1038. [Google Scholar] [CrossRef]
  30. Deng, X.; Liu, W. Experimental and numerical investigation of a novel sandwich sinusoidal lateral corrugated tubular structure under axial compression. Int. J. Mech. Sci. 2019, 151, 274–287. [Google Scholar] [CrossRef]
  31. Deng, X.; Liu, W. Multi-objective optimization of thin-walled sandwich tubes with lateral corrugated tubes in the middle for energy absorption. Thin-Walled Struct. 2019, 137, 303–317. [Google Scholar] [CrossRef]
  32. Li, Z.; Yao, S.; Ma, W.; Xu, P.; Che, Q. Energy-absorption characteristics of a circumferentially corrugated square tube with a cosine profile. Thin-Walled Struct. 2019, 135, 385–399. [Google Scholar] [CrossRef]
  33. Li, Z.; Ma, W.; Yao, S.; Xu, P. Crashworthiness performance of corrugation- reinforced multicell tubular structures. Int. J. Mech. Sci. 2021, 190, 106038. [Google Scholar] [CrossRef]
  34. Yao, S.; Xing, Y.; Zhao, K. Crashworthiness analysis and multiobjective optimization for circular tubes with functionally graded thickness under multiple loading angles. Adv. Mech. Eng. 2017, 9, 1687814017696660. [Google Scholar] [CrossRef]
  35. Pang, T.; Zheng, G.; Fang, J.; Ruan, D.; Sun, G. Energy absorption mechanism of axially-varying thickness (AVT) multicell thin-walled structures under out-of-plane loading. Eng. Struct. 2019, 196, 109130. [Google Scholar] [CrossRef]
  36. Duan, S.; Tao, Y.; Lei, H.; Wen, W.; Liang, J.; Fang, D. Enhanced out-of-plane compressive strength and energy absorption of 3D printed square and hexagonal honeycombs with variable-thickness cell edges. Extreme Mech. Lett. 2018, 18, 9–18. [Google Scholar] [CrossRef]
  37. Fang, J.; Gao, Y.; Sun, G.; Zheng, G.; Li, Q. Dynamic crashing behavior of new extrudable multi-cell tubes with a functionally graded thickness. Int. J. Mech. Sci. 2015, 103, 63–73. [Google Scholar] [CrossRef]
  38. Qin, R.; Zhou, J.; Chen, B. Crashworthiness Design and Multiobjective Optimization for Hexagon Honeycomb Structure with Functionally Graded Thickness. Adv. Mater. Sci. Eng. 2019, 2019, 8938696. [Google Scholar] [CrossRef]
  39. Sun, G.; Pang, T.; Xu, C.; Zheng, G.; Song, J. Energy absorption mechanics for variable thickness thin-walled structures. Thin-Walled Struct. 2017, 118, 214–228. [Google Scholar] [CrossRef]
  40. Song, J.F.; Xu, S.C.; Wang, H.X.; Wu, X.Q.; Zou, M. Bionic design and multi-objective optimization for variable wall thickness tube inspired bamboo structures. Thin-Walled Struct. 2018, 125, 76–88. [Google Scholar] [CrossRef]
  41. Chen, Y.; Bai, Z.; Zhang, L.; Wang, Y.; Sun, G.; Cao, L. Crashworthiness analysis of octagonal multi-cell tube with functionally graded thickness under multiple loading angles. Thin-Walled Struct. 2017, 110, 133–139. [Google Scholar] [CrossRef]
  42. Sun, G.; Xu, F.; Li, G.; Li, Q. Crashing analysis and multiobjective optimization for thin-walled structures with functionally graded thickness. Int. J. Impact Eng. 2014, 64, 62–74. [Google Scholar] [CrossRef]
  43. Zheng, G.; Pang, T.; Sun, G.; Wu, S.; Li, Q. Theoretical, numerical, and experimental study on laterally variable thickness (LVT) multi-cell tubes for crashworthiness. Int. J. Mech. Sci. 2016, 118, 283–297. [Google Scholar] [CrossRef]
  44. Mohammadiha, O.; Ghariblu, H. Crush response of variable thickness distribution inversion tubes under oblique loading. Thin-Walled Struct. 2016, 109, 159–173. [Google Scholar] [CrossRef]
  45. Sun, G.; Tian, X.; Fang, J.; Xu, F.; Li, G.; Huang, X. Dynamical bending analysis and optimization design for functionally graded thickness (FGT) tube. Int. J. Impact Eng. 2015, 78, 128–137. [Google Scholar] [CrossRef]
  46. Yu, K.; Liu, Y.; Zhang, Z. Energy-absorbing analysis and reliability-based multiobjective optimization design of graded thickness B pillar with grey relational analysis. Thin-Walled Struct. 2019, 145, 106364. [Google Scholar] [CrossRef]
  47. Fang, J.; Sun, G.; Qiu, N.; Kim, N.H.; Li, Q. On design optimization for structural crashworthiness and its state of the art. Struct. Multidiscip. Optim. 2016, 55, 1091–1119. [Google Scholar] [CrossRef]
  48. Fang, J.; Gao, Y.; Sun, G.; Qiu, N.; Li, Q. On design of multi-cell tubes under axial and oblique impact loads. Thin-Walled Struct. 2015, 95, 115–126. [Google Scholar] [CrossRef]
  49. Qiu, N.; Gao, Y.; Fang, J.; Feng, Z.; Sun, G.; Li, Q. Crashworthiness analysis and design of multi-cell hexagonal columns under multiple loading cases. Finite Elem. Anal. Des. 2015, 104, 89–101. [Google Scholar] [CrossRef]
  50. Fu, J.; Liu, Q.; Liufu, K.; Deng, Y.; Fang, J.; Li, Q. Design of bionic-bamboo thin-walled structures for energy absorption. Thin-Walled Struct. 2019, 135, 400–413. [Google Scholar] [CrossRef]
  51. Kim, Y.; Yang, C.; Kim, Y.; Gu, G.X.; Ryu, S. Designing an Adhesive Pillar Shape with Deep Learning-Based Optimization. ACS Appl. Mater. Interfaces 2020, 12, 24458–24465. [Google Scholar] [CrossRef] [PubMed]
  52. Zhang, H.; Fu, H.; He, X.; Wang, C.; Jiang, L.; Chen, L.-Q.; Xie, J. Dramatically Enhanced Combination of Ultimate Tensile Strength and Electric Conductivity of Alloys via Machine Learning Screening. Acta Mater. 2020, 200, 803–810. [Google Scholar] [CrossRef]
  53. Bessa, M.A.; Glowacki, P.; Houlder, M. Bayesian Machine Learning in Metamaterial Design: Fragile Becomes Supercompressible. Adv. Mater. 2019, 31, e1904845. [Google Scholar] [CrossRef] [PubMed]
  54. Li, Z.; Ma, W.; Hou, L.; Xu, P.; Yao, S. Crashworthiness analysis of corrugations reinforced multi-cell square tubes. Thin-Walled Struct. 2020, 150, 106708. [Google Scholar] [CrossRef]
  55. Li, X.; Yao, R. A machine-learning-based approach to predict residential annual space heating and cooling loads considering occupant behaviour. Energy 2020, 212, 118676. [Google Scholar] [CrossRef]
  56. Çevik, A.; Kurtoğlu, A.E.; Bilgehan, M.; Gülşan, M.E.; Albegmprli, H. Support vector machines in structural engineering: A review. J. Civ. Eng. Manag. 2015, 21, 261–281. [Google Scholar] [CrossRef]
  57. Li, Q.; Meng, Q.; Cai, J.; Yoshino, H.; Mochida, A. Predicting hourly cooling load in the building: A comparison of support vector machine and different artificial neural networks. Energy Convers. Manag. 2009, 50, 90–96. [Google Scholar] [CrossRef]
  58. Zhu, P.; Pan, F.; Chen, W.; Zhang, S. Use of support vector regression in structural optimization: Application to vehicle crashworthiness design. Math. Comput. Simul. 2012, 86, 21–31. [Google Scholar] [CrossRef]
  59. Wang, W.; Xu, Z.; Lu, W.; Zhang, X. Determination of the spread parameter in the Gaussian kernel for classification and regression. Neurocomputing 2003, 55, 643–663. [Google Scholar] [CrossRef]
  60. Vapnik, V.; Golowich, S.; Smola, A. Support Vector Method for Function Approximation, Regression Estimation, and Signal Processing. In Advances in Neural Information Processing Systems; MIT Press: Cambridge, MA, USA, 1996. [Google Scholar]
  61. Shao, M.; Wang, X.; Bu, Z.; Chen, X.; Wang, Y. Prediction of energy consumption in hotel buildings via support vector machines. Sustain. Cities Soc. 2020, 57, 102128. [Google Scholar] [CrossRef]
  62. Mozumder, R.A.; Roy, B.; Laskar, A.I. Support Vector Regression Approach to Predict the Strength of FRP Confined Concrete. Arab. J. Sci. Eng. 2016, 42, 1129–1146. [Google Scholar] [CrossRef]
  63. Yang, C.; Li, Q. Structural optimisation for the collapse zone of a railway vehicle. Int. J. Mech. Sci. 2020, 165, 105201. [Google Scholar] [CrossRef]
  64. Peng, Y.; Hou, L.; Che, Q.; Xu, P.; Li, F. Multi-objective robust optimization design of a front-end underframe structure for a high-speed train. Eng. Optim. 2018, 51, 753–774. [Google Scholar] [CrossRef]
  65. Deb, K.; Jain, H. An Evolutionary Many-Objective Optimization Algorithm Using Reference-Point-Based Nondominated Sorting Approach, Part I: Solving Problems with Box Constraints. IEEE Trans. Evol. Comput. 2014, 18, 577–601. [Google Scholar] [CrossRef]
Figure 1. Cross-sectional configuration of the MCCT.
Machines 11 00217 g001
Figure 2. Three different cross sections of the MCCT: (a) decreasing thickness, (b) increasing thickness and (c) uniform thickness.
Machines 11 00217 g002
Figure 3. Thickness variation versus normalized distance x/L for (a) tm > tc and (b) tm < tc.
Machines 11 00217 g003
Figure 4. FE model of the MCCT under axial loading: (a) FE model and (b) stress-strain curve of the material aluminum alloy AA 6061O.
Machines 11 00217 g004
Figure 5. MCF for different mesh sizes.
Machines 11 00217 g005
Figure 6. Drop hammer test for the MCCT: (a) test scene and (b) test tube.
Machines 11 00217 g006
Figure 7. Comparison between the experiment and FE simulation: (a) deformation process and (b) force-displacement curve.
Machines 11 00217 g007
Figure 8. Force-displacement curves comparison of the three MCCT with different wall thickness variations.
Machines 11 00217 g008
Figure 9. Correlation matrix of the considered variables and responses.
Machines 11 00217 g009
Figure 10. Performances of the prediction models for (a) SEA, (b) PCF and (c) CFE.
Machines 11 00217 g010
Figure 11. Energy absorption responses distribution under n = 1 for (a) SEA, (b) CFE and (c) PCF.
Machines 11 00217 g011
Figure 12. Pareto fronts of the multi-objective optimization: (a) three-dimensional view, (b) projection in CFE-SEA plane, (c) projection in PCF-SEA plane and (d) projection in PCF-CFE plane.
Machines 11 00217 g012
Figure 13. Distribution of tc v.s. tm of the Pareto fronts.
Machines 11 00217 g013
Table 1. Comparison of various energy absorption criteria between the test and FE simulation.
 PCF (kN)MCF (kN)EA (J)SEA (kJ/kg)CFE
Test14.027.97478.3210.610.57
FE14.038.69521.6211.570.62
Difference (%)0.079.039.059.058.77
Table 2. Energy absorption assessing criteria comparison of the three MCCT with different wall thickness variations.
TubePCF (kN)SEA (kJ/kg)CFEMass (g)
tc2-tm0.544.5519.940.84112.72
tc0.5-tm246.8015.260.61112.72
tc1.25-tm1.2546.3318.300.74112.72
Table 3. Comparison of the energy absorption performance between the optimum solutions selected from Pareto fronts with the TOPSIS method and the initial design.
WeightsGeometric ParametersResponses
w-SEAw-CFEw-PCFtctmnSEACFEPCF
Initial design1.251.2518.300.7446.33
Optimum 1SVR0.40.20.41.500.590.4519.230.7838.65
FE20.110.8238.41
Difference (%)4.384.880.62
Improvement (%)5.085.41−16.58
Optimum 2SVR0.330.330.331.630.650.719.390.839.83
FE20.120.8538.89
Difference (%)3.465.882.42
Improvement (%)5.968.11−14.03
Disclaimer/Publisher’s Note: The statements, opinions and data contained in all publications are solely those of the individual author(s) and contributor(s) and not of MDPI and/or the editor(s). MDPI and/or the editor(s) disclaim responsibility for any injury to people or property resulting from any ideas, methods, instructions or products referred to in the content.

