Article

Structural Optimization Design and Strength Test Research of Connecting Rod Assembly of High-Power Low-Speed Diesel Engine

College of Power and Energy Engineering, Harbin Engineering University, Harbin 150001, China
*
Author to whom correspondence should be addressed.
Machines 2022, 10(9), 815; https://doi.org/10.3390/machines10090815
Submission received: 20 August 2022 / Revised: 9 September 2022 / Accepted: 13 September 2022 / Published: 16 September 2022
(This article belongs to the Section Electrical Machines and Drives)

Abstract

:
The connecting rod assembly of a high-power low-speed diesel engine has high quality and high cost. If the connecting rod component is damaged, the whole machine may be paralyzed, resulting in serious economic losses and safety problems, so it is necessary to carry out strength analysis and structure optimization, reduce the failure rate, and increase its life. This paper takes the connecting rod of a low-speed diesel engine as the research object, builds the crank connecting rod mechanism model, and carries on the strength simulation analysis through professional simulation software. During this period, the accurate S-N curve of connecting rod material is obtained through a fatigue test, and the static strength test of the connecting rod assembly is carried out by an electro-hydraulic servo universal testing machine. The numerical modeling is validated based on the test results. Therefore, the influence of the structural parameters of the cross-section and the large end transition fillet on the stress of the connecting rod is analyzed. The results show that optimizing matching between the large end fillet of the connecting rod and the long diameter of the rod section not only reduces the mass but also improves the safety factor. After optimizing the structure of the connecting rod, the mass of the connecting rod is reduced by 5.85%, the maximum stress is reduced by 13.7%, and the safety factor is increased by 16.0%. In addition, due to the low-speed diesel engine connecting rod assembly weight is big, and the simulation computation efficiency is low, this paper by studying the influence of the cross-section parameters of the rod body and the large end transition fillet on the stress of the connecting rod, fitted the empirical formula calculating the maximum stress of connecting rod, for this model and similar type in the conceptual design, technology design provides a new analysis method, improved the efficiency of structural optimization and strength analysis of connecting rod assembly, filled the research gap of strength analysis and structural optimization of low-speed diesel engine connecting rod.

1. Introduction

As a moving part, the connecting rod of the low-speed diesel engine connects the crosshead assembly and the crankshaft. Its main function is to convert reciprocating motion into rotary motion, and it always bears compressive stress in the working process, and the magnitude of pressure changes periodically [1]. Especially in low-speed diesel engines, it has a large size and mass; therefore, it is necessary to optimize the structure of the connecting rod to increase its service life and reduce its mass so as to improve its economy [2].
Related scholars have studied the strength analysis of connecting rods. For example, Mirsadegh et al. [3] took the connecting rod of a heavy marine diesel engine as the research object, conducted preliminary modeling through CATIA software, and used Abaqus for finite element analysis to obtain the stress distribution of the connecting rod under the condition of burst pressure. Based on the stress diagram, the rod body is modified to meet the design and work requirements. However, the scholar did not verify the simulation results with tests but demonstrated them through the tests of similar models, which lacked some authenticity. Jung et al. [4] conducted strength analysis and fatigue calculations of connecting rods and finally came to the conclusion that the Ruiz Criterion is simpler and more practical for fatigue failure prediction. Wilarso et al. [5] took the connecting rod of a marine diesel engine as the research object, conducted strength analysis, and finally came to the conclusion that the poor match between connecting rod and bushing leads to serious friction, which leads to the failure of the bushing and affects the normal operation of the diesel engine. Slavko et al. [6] took the connecting rod as the research object. The multi-flexible body dynamic analysis was carried out through ANSYS, and the stress distribution of the connecting rod was obtained. It is concluded that the position where the stress of the connecting rod is greater generally occurs at the sudden change of the cross-sectional area or the poor processing. Lucjan et al. [7] took the connecting rod of the supercharged diesel engine as the research object and established the connecting rod model for finite element analysis and obtained the maximum stress position of the connecting rod as the contact position between the connecting rod and the bolt. In addition, the scholar found cracks in the thread of the connecting rod through microscopic detection, verified the simulation results, and finally concluded that the bolt preload of the connecting rod is too large, and the preload value should be adjusted. He et al. [8] studied the stress concentration of the connecting rod of diesel generators on offshore platforms, and the results showed that the crack location was consistent with the high-stress point. It was concluded that the stress concentration or the low yield strength of the material were the main reasons for the failure of the connecting rod. In the field of connecting rod strength analysis, most scholars obtained the corresponding stress distribution through simulation analysis of connecting rods, but basically did not carry out experimental verification, so the simulation results need to be verified. Additionally, most scholars simply analyzed the stress distribution of the connecting rod and did not carry out structural optimization work. In this paper, not only the precise boundary conditions and connection relationship are set, but also the static strength test and fatigue test of the connecting rod are carried out, which verifies the correctness of the simulation. Additionally, this thesis carried out an in-depth structural optimization analysis on the connecting rod and finally obtained the optimized connecting rod parameters.
In the field of linkage optimization design, relevant scholars have conducted research. For example, Lee et al. [9] proposed that in the optimal design of connecting rods, yield characteristics and fatigue characteristics are the evaluation criteria for the performance of engine connecting rods. The scholar evaluated the yield characteristics of connecting rods through finite element analysis and analyzed the stress sensitivity of reducing the cross-sectional area of the rod from the yield perspective. Griza et al. [10] took the connecting rod of the diesel engine as the research object, analyzed the force of the connecting rod bolt, and finally proposed the optimization measures for the connecting rod, increasing the torque of the connecting rod bolt assembly to reduce the stress amplitude. There are few researches related to the optimization of connecting rod structures. In this paper, the key structural optimization work of connecting rods is deeply studied, which fills the research gap in this part.
As for the connecting rod of a low-speed diesel engine, there are few studies at home and abroad, and they mainly focus on strength analysis [11,12]. Moreover, due to the large mass of the connecting rod of a low-speed diesel engine, it is difficult to test, so there is almost no research on structure optimization. The low-speed machine connecting rod size is large, and the cost is high. Once the damage may lead to the whole diesel engine scrapping, it then causes huge economic losses. Therefore, it is very necessary to carry out strength analysis and structural optimization [13,14] to improve its economy and reliability. The purpose of this paper is to optimize the structure of the low-speed diesel engine connecting rod to maximize the economy on the premise of ensuring reliability. Through the research of simulation and experiment, the research gap of strength analysis and structural optimization of low-speed diesel engine connecting rods are filled. As shown in Figure 1, on the basis of verifying the correctness of the simulation through tests, this paper concluded that the structural parameters of the cross-section of the rod body and the large end transition fillet of the connecting rod have a great influence on the stress of the connecting rod. Therefore, this paper took them as variables to optimize the structure of the connecting rod and summarized a set of empirical formulas to calculate the maximum stress of the connecting rod, which provided a new analysis method for the model and similar models in the conceptual design, technical design, and improved the efficiency of structural optimization and strength analysis of the connecting rod components.

2. Establishment of Simulation Model of the Connecting Rod

2.1. Building the Model

The research object of this paper is the connecting rod assembly of a high-power low-speed diesel engine. The main parameters are shown in Table 1. The crank and connecting rod mechanism model (as shown in Figure 2) is built by UG. The model retains the internal cooling oil channel and simplifies the positioning pin of the connecting rod, so as to reduce the simulation workload. According to the dynamic simulation, the piston is located at 17°CA after TDC under the maximum burst pressure condition; therefore, the assembly relationship is adjusted in the assembly process of pre-treatment to simulate the real stress state of the connecting rod. The material of the connecting rod assembly in this simulation is 42CrMoA. The basic parameter attributes of the material can be obtained by referring to the material manual.

2.2. Determination of Grid

Due to the large model of the crank connecting rod mechanism, the grid is too small to make the calculation efficient, so it is necessary to conduct a grid independent analysis. When selecting the mesh type, the hexahedral mesh should be adopted to improve the simulation accuracy. Therefore, in this simulation, the small end cover and the large end cover of the connecting rod assembly adopt a hexahedral-dominated mesh, while the hexahedral mesh cannot be divided due to the internal flow channel and other detailed features of the rod body, so the tetrahedral mesh is used instead (as shown in Figure 3). The mesh of other components is also tetrahedral (as shown in Figure 4) to reduce the simulation computation cost. After grid independence analysis (as shown in Table 2), the maximum stress of the connecting rod assembly converges to a stable value, so the overall grid size is determined to be 16 mm, the grid size of connecting rod assembly is determined to be 6 mm, and the final overall grid number is 3662194.

2.3. Determination of Connection Relation and Boundary Condition

In the simulation calculation, the connection relationship set is shown in Table 3.
In the simulation calculation, the setting of boundary conditions is shown in Table 4.
Reciprocating inertial force, as follows:
F j = m j a = m j C ω 2 cos α m j C ω 2 λ cos 2 α
Centrifugal inertia force, as follows:
F r = m r C ω 2
The action surface of the combustion pressure is the piston fire surface, and the direction is the vector direction of the fire surface. Because the connecting rod speed of a two-stroke diesel engine is low, the working frequency is low, the transverse load is small, and the lateral load of a two-stroke diesel engine is borne by the crosshead assembly, the connecting rod assembly basically does not bear the lateral load, so this paper does not study the influence of the lateral load on the connecting rod.

2.4. Fatigue Test of Material

The material fatigue testing machine is an 8801 electro-hydraulic servo fatigue testing machine. The purpose of the test is to obtain the S-N curve of the material through the fatigue test of the sample rod, import it into the nCode material library, and then obtain the more accurate safety factor of the connecting rod through ANSYS and nCode co-simulation.
Equipment preparation: The equipment required for the test is 15 42CrMoA rods (as shown in Figure 5), one 8801 electro-hydraulic servo fatigue testing machine (as shown in Figure 6), and one computer. The specification of the sample rod is φ16 × φ10 × 170 mm. To obtain the material yield limit, the sample rod was clamped on the test machine for the tensile test, and the final yield limit of the material was 950 MPa. Start fatigue test: The yield limit of the material was known, so the load of this fatigue test was divided into 7 groups, which were 90%, 85%, 80%, 77.5%, 75%, 50%, and 40%, respectively. Two sample rods were made for each group to improve the accuracy and reduce the test error. The load was applied in the form of a sine ratio, and the ratio was −1. After the test, 7 groups of 14 data were sorted out and fitted to obtain the 42CrMoA accurate S-N curve (as shown in Figure 7 and Figure 8).
The main purpose of this fatigue test is to obtain the exact S-N curve of the connecting rod material. Due to the high quality, high cost, and difficult operation of the connecting rod of the two-stroke low-speed machine, a fatigue test of the real model could not be carried out. Moreover, this test focused on materials without a comprehensive consideration of shape, holes, small ratios, surface finishing, and so on.

3. Results and Discussion

3.1. Connecting Rod Strength Calculation Results

Figure 9 shows the stress distribution diagram of the connecting rod assembly, the stress is mainly concentrated in the connecting rod shaft, the stress of the small end cover and the large end cover is small. As can be seen from Figure 10, due to bolt preloading, the maximum stress of the small end bearing cover appears at the contact position between the bearing cover and the bolt [15,16,17,18], which is 24.45 MPa. The stress distribution at the bolt hole position is uniform and between 12 and 24 MPa. The other positions are basically not affected by gas pressure and bolt preload and are basically between 5 and 10 MPa. As shown in Figure 11, the maximum stress of the large end bearing cover also appears at the contact position between the bearing cover and the bolt, which is 13.2 MPa. Because the low-speed diesel connecting rod mainly bears compressive stress, there is almost no tensile stress, and the crankshaft has almost no influence on the large end bearing cover, the rest of the large end bearing is basically free of stress, and the stress distribution is relatively uniform [19,20].
This simulation is mainly to study the stress at the position of the connecting rod body. According to the stress diagram of the connecting rod body (as shown in Figure 12), gas pressure has an obvious effect on the stress distribution of the rod body, while in contrast, bolt preload and inertia force have little effect on the stress distribution. The stress distribution at the position of the rod body is relatively uniform, between 90 and 120 MPa, and the stress at the lower ends of the rod body is the smallest, except for the 15–24 MPa at the bolt position. The rest of the positions are basically below 15 MPa. According to the stress diagram of the large end of the connecting rod body (as shown in Figure 13), the maximum stress of the connecting rod body appears at the fillet position where the large end of the connecting rod connects with the crankshaft, and the value is 179.42 MPa, which also provides the direction for subsequent optimization ideas [21,22].
As shown in Figure 14, the deformation of the connecting rod assembly gradually decreases from the small end cover to the large end cover. Due to the simultaneous action of the bolt pre-tightening force and the gas pressure in the cylinder, the deformation of the small end bearing cap of the connecting rod is 0.56 mm. For the large end bearing cover of the connecting rod, since the connecting rod of the two-stroke, low-speed diesel engine mainly bears compressive stress, the crankshaft has little influence on the large end cap [23,24], so the deformation of the large end position can be basically ignored. As shown in Figure 15, due to the action of gas pressure, the small end of the connecting rod has the largest deformation, which is 0.55 mm. Since the position of the large end of the rod body is far away from the piston and the crankshaft has little influence on it, the deformation is very small, 0.08 mm. By consulting the two-dimensional drawings of the model, the maximum allowable deformation is 1.5 mm, so the deformation is qualified, and there is a certain margin, which provides ideas for subsequent optimization.
Considering that the combustion pressure is not constant, the fatigue simulation analysis of the entire working cycle of the connecting rod is required, so this paper carries out a transient simulation analysis of the connecting rod. The exact S-N curve of 42CrMoA was obtained through the fatigue test, and then the safety factor diagram of the connecting rod was obtained through ANSYS and nCode co-simulation. As shown in Figure 16, the safety factor of the small end position of the connecting rod and the large end position of the connecting rod is basically more than 10. Due to the abrupt change in the cross-sectional area between the large end of the connecting rod and the rod body, the stress increases and the safety factor decreases [25,26], which is basically within 5–9. The same is true for the small end of the connecting rod. Because the stress at the fillet of the large end transition position is the largest, the safety factor is the smallest, which is 2.78.
The Kirasu Shveli method is a standard to measure whether the connecting rod meets the requirements. According to Table 5, the minimum allowable safety factor of the rod body is 1.5, so the model meets the standard. Since the safety factor has a large design redundancy, the model can be optimized to improve its economy.

3.2. Structural Optimization of Connecting Rod

Through the above, the connecting rod has a large design margin. Now the structure of the connecting rod is optimized by optimizing the cross-sectional area of the connecting rod and the transition fillet of the large end position in order to improve the economy of the connecting rod. In this optimization, the long diameter of the connecting rod section is L, and the fillet of the transition position of the large end is R, as shown in Figure 17.
In this optimization, since the R of the original connecting rod is 6 mm and L is 180 mm, the variable range of R is 4–18 mm and the variable range of L is 158–180 mm, the optimal solution for the connecting rod structure is found through joint optimization. After the simulation results are obtained, the relationship diagram between R, L, and the maximum stress of the connecting rod is drawn. As can be seen from Figure 18, R and L are inversely proportional to the maximum stress of the connecting rod. The stress of R at 15–18 mm is basically unchanged, and the increase in the stress is small when L is in the range of 164–180 mm. When L is less than 164 mm, the main reason for the stress surge is that the rod body area is too small [27], which makes the maximum stress appear at the transition position between the small end of the connecting rod and the rod body. Therefore, the case of L less than 164 mm is not considered in the optimization here.
The principle of this optimization is to reduce the maximum stress while keeping the weight of the connecting rod as small as possible (L as small as possible) [28] and ensuring that the structure does not change much [29]. Based on the optimization principle and considering the processing error, the value of R should be greater than or equal to 15 mm. Considering the cost savings, 15 mm is selected as the final scheme. L should be greater than or equal to 164 mm. Considering the machining error and reducing the weight of the connecting rod as much as possible [30], L is set at 166 mm.
According to the analysis of Figure 19 and Figure 20, the maximum stress of the optimized connecting rod is 154.91 MPa, and the stress distribution of the rod body is uniform, which is about 90–100 MPa. The minimum safety factor of the connecting rod body is 3.2221, which is located in the fillet position, and the safety factor of the rod body is about 4.93, which is evenly distributed. Compared with the original connecting rod, the mass of the connecting rod is reduced by 30.76 kg (5.85%), the maximum stress of the connecting rod is reduced from 179.42 MPa to 154.91 MPa (13.7%), and the safety factor is increased from 2.78 to 3.2221 (16.0%). This optimization meets the requirements.

3.3. Influence of Variable on Maximum Stress of Connecting Rod

3.3.1. Influence of the Fillet Radius on Maximum Stress of Connecting Rod

Taking the radius of the fillet as a variable, parametric modeling was carried out for the connecting rod assembly, and then the relationship between the radius of the fillet and the maximum stress of the connecting rod was summarized after the simulation analysis (as shown in Figure 21). Combined with the distribution law of the data points, we found that the relationship between the radius of the fillet and the maximum stress of the connecting rod is a nonlinear relationship, and the curve style is in line with the polynomial type, so this curve fitting using nonlinear curve fitting in the form of a polynomial function, in the selection of the order of the fitting formula, as far as possible, select the higher order to reduce the fitting error; therefore, the fifth order is selected as the fitting target, and the form is as follows:
σ max = A 0 + A 1 R + A 2 R 2 + A 3 R 3 + A 4 R 4 + A 5 R 5
Through iterative calculation, the value of the undetermined coefficient is obtained. After substituting them into Formula (3), the Formula (4) that meets the requirements is finally fitted, and the relationship diagram between the radius of the fillet and the maximum stress of the connecting rod is drawn by using the fitting formula. As shown in Figure 21, the radius of the fillet is inversely proportional to the maximum stress of connecting rod, and the fitted formula curve is very close to the curve of the influence of the radius of the fillet on the maximum stress of connecting rod.
σ max = 251.9 25.7 R + 3.7 R 2 0.3 R 3 + 0.01 R 4 1.44 × 10 4 R 5

3.3.2. Influence of the Long Diameter of Connecting Rod Body Section on Maximum Stress of Connecting Rod

Taking the long diameter of the rod body section as a variable, the relationship between it and the maximum stress of the connecting rod is studied. Similarly, combined with the distribution law of data points, it is found that the relationship between the long diameter of the rod section and the maximum stress of the connecting rod also belongs to the nonlinear relationship. The curve trend conforms to the polynomial type, so the fitting uses the nonlinear curve in the form of the polynomial function, as follows:
σ max = B 0 + B 1 L + B 2 L 2 + B 3 L 3 + B 4 L 4 + B 5 L 5
Through iterative calculation, the value of the undetermined coefficient is obtained. After substituting it into Formula (5), the Formula (6) that meets the requirements is finally fitted, and the relationship diagram between the long diameter of the rod body section and the maximum stress of the connecting rod is drawn using the fitting formula. As shown in Figure 22, when the long diameter of the rod body section is 158–165 mm, the maximum stress of the connecting rod has a great influence, and when it is 165–180 mm, the influence is small. The relationship between L and σmax is also inversely proportional, and the fitting formula curve is very close to the original curve.
σ max = 5.01 128062 R + 1284 R 2 6.3 R 3 + 0.015 R 4 1.32 × 10 4 R 5
Through the analysis of Figure 21 and Figure 22, it can be seen that the fillet has a great influence on the maximum stress of the connecting rod, which is the main way to improve the safety factor of the connecting rod, while the cross-section parameters of the rod body mainly have a great influence on the stress distribution of the rod body, which is the main way to reduce the quality of the connecting rod. Therefore, by optimizing the match between the fillet and the long diameter of the connecting rod body section, the quality of the connecting rod can be reduced, and the safety factor can be improved.

3.3.3. The Influence of Two Variables Acting Simultaneously on the Maximum Stress of Connecting Rod

Through R and L bivariate to study the influence on the maximum stress of the connecting rod and set up a relevant database in order to facilitate the conceptual design and technical design of the connecting rod of this type and similar types. As shown in Figure 18, R and L are correlated with the maximum stress of the connecting rod, according to the distribution law of the data points. It can be found that the distribution law of the data presents a nonlinear surface. Referring to the distribution law of univariate and maximum stress of the connecting rod, this fitting uses nonlinear surface fitting in the form of a polynomial function. The highest order of the fitting formula is also five, to reduce the fitting error, and the formula form is as follows:
σ max = σ 0 + A 1 R + A 2 R 2 + A 3 R 3 + A 4 R 4 + A 5 R 5 + B 1 L + B 2 L 2 + B 3 L 3 + B 4 L 4 + B 5 L 5
The formula coefficients in the polynomial form are initialized (as shown in Figure 23), and the values of the 11 undetermined coefficients are determined by the Levenberg-Marquardt optimization iterative algorithm through the programming software fitting tool. After the iterative calculation is completed, according to the corresponding graph of the data points and the formula surface after iteration (as shown in Figure 24), the surface corresponding to the formula after iteration basically contains the data points, and the calculated undetermined coefficients are imported into Formula (7).
σ max = 5.024 × 10 6 0.7 R 1.59 R 2 + 0.22 R 3 0.013 R 4 + 2.75 × 10 4 R 5 128387.7 L + 1287.6 L 2 6.29 L 3 + 0.15 L 4 1.32 × 10 5 L 5
Since the empirical formula is fitted with the connecting rod of a low-speed diesel engine with a 340-mm cylinder diameter as the research object, the independent variables in the formula have the domain of definition. That is, the range of R is 4–18 mm, and the range of L is 158–180 mm.
By analyzing the strength results of the original connecting rod assembly, the structure of the connecting rod assembly was optimized, and the empirical formula for calculating the maximum stress of the connecting rod was fitted, which provided a new analysis method for the conceptual design and technical design of the model and similar models and improved the efficiency of structural optimization and strength analysis of the connecting rod assembly.

4. Connecting Rod Static Strength Test

The static measurement method generally uses the static simulation loading resistance strain measurement method, which has the advantages of convenient measurement, simple measuring equipment, and sufficient measurement accuracy. The basic principle of the electrical measurement method is that when the resistance strain gauge deforms during the load, the deformation amount can be obtained by analyzing the signal tester, and then the stress value of the measurement point can be calculated according to the strain-stress relationship. The purpose of this test is to verify the correctness of the simulation results by comparing the test results with the simulation results.

4.1. Test Device and Scheme

The length of the object studied in this paper is 2137 mm, and its mass is about 530 kg. If the actual model is directly used for the static strength test, it will not only waste equipment but also affect the test operation; therefore, the 1/4 scaled model of the actual connecting rod is used in this test. In order to verify the accuracy of this simulation, the 1/4 scaled model was also simulated with the same process, and the test value of the scaled model was compared with the simulation value. In this test, a total of 9 measuring points were selected, different loads were applied by the WAW-2000 universal testing machine, and the data of strain gauges were recorded by the DH5922D dynamic signal tester.
Preparation of test equipment: one scaled connecting rod model (as shown in Figure 25), several strain gauges, one WAW-2000 universal testing machine (as shown in Figure 26), and one DH5922D dynamic signal tester (as shown in Figure 27). Type and paste of strain gauge: BE120–3AA-P500 strain gauge was used in this test. On the premise that the strain gauge can be used normally, the surface of the point to be measured is polished with fine sandpaper, and then the strain gauge is pasted at the specified position with constant temperature glue (as shown in Figure 28). Finally, the lead is isolated from the connecting rod with transparent glue to prevent interference. Determination of bridge road type: The tester can support the following three connection modes: full-bridge, half-bridge, and 1/4-bridge. The connection mode adopted in this test is a half-bridge connection, which not only ensures no waste of strain gauge but also ensures test accuracy (as shown in Figure 29). Assemblage installation and line connection: After connecting the strain gauge with the tester through the wire, indicate the serial number and fix the connecting rod on the test bench through the fixture. Starting and data processing of the test bench: this test set a total of 8 gear loads, respectively: 50 kN, 100 kN, 150 kN, 200 kN, 225 kN, 250 kN, 275 kN, and 300 kN. When the predetermined load is reached, it is suspended for 1 min, and 5 results are selected to take the average value to reduce the test error.

4.2. Analysis of Experimental Results

Taking the position of the measurement point as a reference, the test results were compared with the simulation results (as shown in Table 6), and the error curve (as shown in Figure 30) was obtained.
As can be seen from Figure 30, when the load is small, the micro-strain at the measuring point of the connecting rod is small, and the test results will be affected by external factors. With the increase in the load, the external factors have less and less influence on the test results, and the error is smaller and smaller, which is concentrated within 10%. Points 3, 4, 5, 6, 8, and 9 are located in the flat position of the rod body. By analyzing the error curves of the six points, it can be concluded that the error trend is similar and gradually decreases, concentrating between 5% and 10%. Points 1, 2, and 7 are located in the transition zone of the connecting rod surface, that is the stress mutation position, so the error between the test value and the simulation value fluctuates, but the overall trend of the error gradually tends to 10%. To sum up, by comparing the test value of the connecting rod with the simulation value, the error of the main key points is within 10%. The good consistency proves that the selection of simulation, boundary conditions, and simulation results in this paper is feasible.

5. Conclusions

This paper took the connecting rod assembly of a low-speed diesel engine as the research object, obtained the accurate S-N curve of the material through the fatigue test, through the professional simulation software and nCode co-simulation, and through the static strength test verification, obtained the accurate simulation results. The structure of the connecting rod was optimized, the relevant structural parameters of the optimized connecting rod were obtained, and the empirical formula for calculating the maximum stress of the connecting rod was fitted. Additionally, the main conclusions obtained in this paper are as follows:
  • The accurate S-N curve of 42CrMoA was obtained through a material fatigue test. The simulation results were verified by the static strength test of connecting rod, and the error was less than 10%;
  • Through the joint optimization of “fillet radius” and “section parameters of the connecting rod body”, the final conclusion is that when the fillet radius(R) is 15 mm and the long diameter (L) of the rod body section is 166 mm, the connecting rod structure is optimal. At this time, the mass of the connecting rod is reduced by 5.85%, the maximum stress is reduced by 13.7%, and the safety factor is increased by 16.0%. By studying the influence of the structural parameters of the cross-section of the connecting rod body and the fillet of the large end of the connecting rod on the maximum stress of the connecting rod, it is concluded that through the optimization of the fillet of the large end of the connecting rod and the long diameter of the rod section, it can not only reduce the quality of the connecting rod but also improve the safety factor;
  • With structural parameters of connecting rod shaft section and connecting rod large end fillet dimension as the independent variables and the maximum stress of connecting rod as the dependent variable, the empirical formula for calculating the maximum stress of connecting rod is fitted, which provides a new analytical method for the conceptual design and technical design of this machine and similar machines, and improves the efficiency of structural optimization and strength analysis of connecting rod assembly;
  • Due to the development of science and technology, the simulation efficiency gradually improves, and people will have a deeper understanding of the connecting rod structure, and then this makes the low-speed diesel engine connecting rod toward the development of a lightweight, higher strength, longer life direction, which will greatly improve its economy.

Author Contributions

Conceptualization, methodology, software, data analysis, writing-Original draft preparation, W.G.; Writ-ing-review and editing, Experimental analysis, G.W.; Investigation, validation, J.Z.; Investigation, val-idation, Z.F.; Investigation, Supervision, X.L.; Investigation, Supervision, W.W. All authors have read and agreed to the published version of the manuscript.
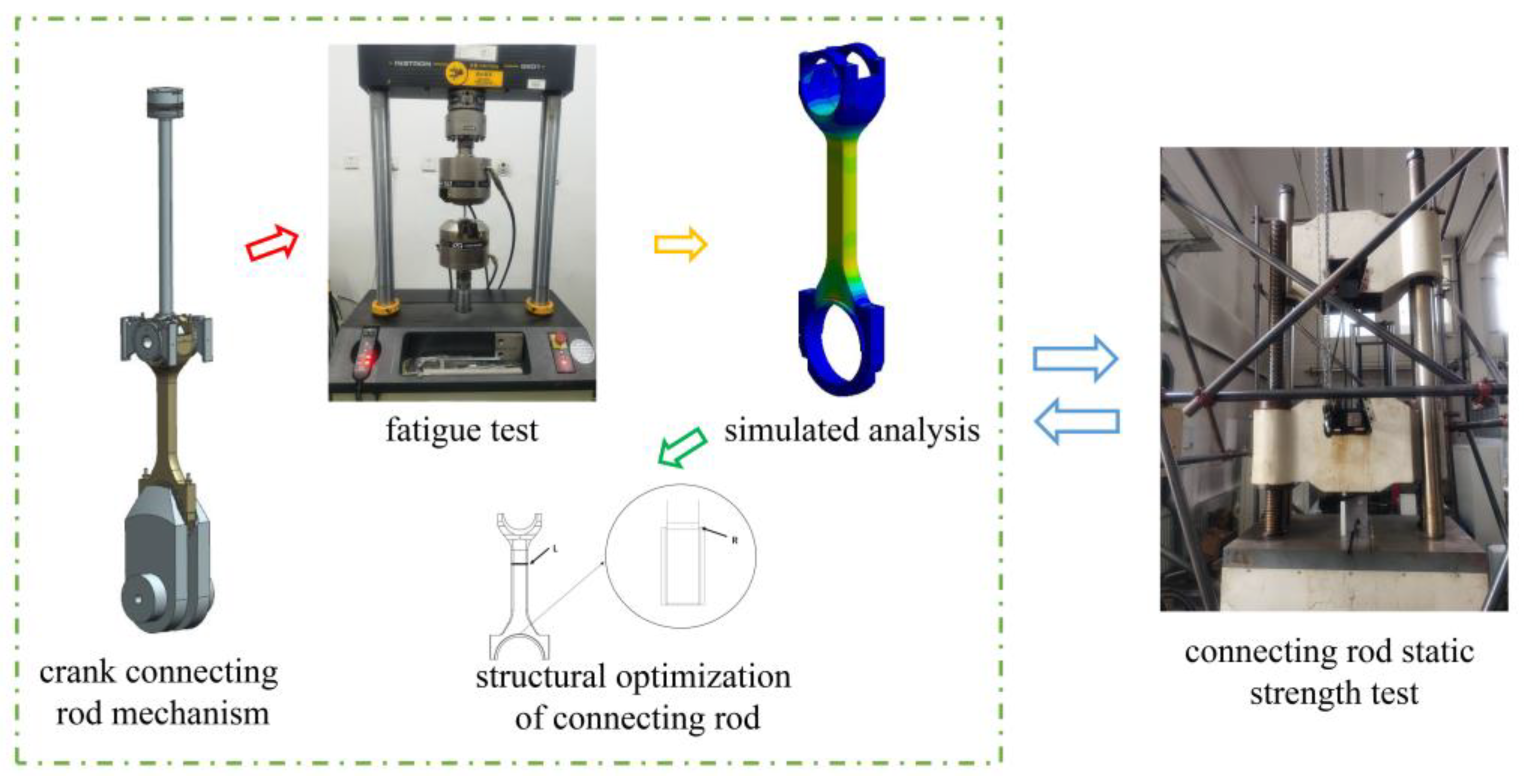
Funding

This research received no external funding.

Institutional Review Board Statement

Not applicable.

Informed Consent Statement

Not applicable.

Data Availability Statement

Not applicable.

Conflicts of Interest

The authors declare no conflict of interest.

Nomenclature

R The fillet of the transition position of the large end [mm]
LThe long diameter of the connecting rod section [mm]
mj The equivalent mass of the large end of the connecting rod [kg]
mrThe equivalent mass of the small end of the connecting rod [kg]
CThe radius of rotation of the crankshaft [mm]
ωThe angular velocity of the crankshaft [rad/s]
λThe ratio between the radius of crank and the length of the connecting rod
αThe crank angle [rad]
σmaxThe maximum stress of the connecting rod [MPa]
σ0, A1–A5, B1–B5Undetermined coefficients

References

  1. Jia, D.W.; Li, Y.P.; Deng, X.W.; Lei, J.; Deng, W. Design research on forging mark of connecting rod. Eng. Fail. Anal. 2020, 113, 104537. [Google Scholar] [CrossRef]
  2. Shi, Z.; Kou, S.Q. Inverse Reconstruction of Fracture Splitting Connecting Rod and its Strength and Fatigue Life. J. Fail. Anal. Prev. 2018, 18, 619–627. [Google Scholar] [CrossRef]
  3. Seyedzavvar, M.; Seyedzavvar, M. Design of high duty diesel engine connecting rod based on finite element analysis. J. Braz. Soc. Mech. Sci. Eng. 2018, 40, 59. [Google Scholar] [CrossRef]
  4. Son, J.H.; Ahn, S.C.; Bae, J.G.; Ha, M.Y. Fretting damage prediction of connecting rod of marine diesel engine. J. Mech. Sci. Technol. 2011, 25, 441–447. [Google Scholar] [CrossRef]
  5. Surya, A.; Adnyana, D.N. Damage Analysis of the Electric Generator Diesel Engine Connecting Rod; IOP Publishing Ltd.: Tangerang, Indonesia, 2020. [Google Scholar]
  6. Rakic, S.; Bugaric, U.; Radisavljevic, I.; Bulatovic, Z. Failure analysis of a special vehicle engine connecting rod. Eng. Fail. Anal. 2017, 79, 98–109. [Google Scholar] [CrossRef]
  7. Witek, L.; Zelek, P. Stress and failure analysis of the connecting rod of diesel engine. Eng. Fail. Anal. 2019, 97, 374–382. [Google Scholar] [CrossRef]
  8. He, B.-Y.; Shi, G.-D.; Sun, J.-B.; Chen, S.-Z.; Nie, R. Crack analysis on the toothed mating surfaces of a diesel engine connecting rod. Eng. Fail. Anal. 2013, 34, 443–450. [Google Scholar] [CrossRef]
  9. Lee, M.K.; Lee, H.; Lee, T.S.; Jang, H. Buckling sensitivity of a connecting rod to the shank sectional area reduction. Mater. Des. 2010, 31, 2796–2803. [Google Scholar] [CrossRef]
  10. Griza, S.; Bertoni, F.; Zanon, G.; Reguly, A.; Strohaecker, T. Fatigue in engine connecting rod bolt due to forming laps. Eng. Fail. Anal. 2009, 16, 1542–1548. [Google Scholar] [CrossRef]
  11. Ivanov, V.; Botko, F.; Dehtiarov, I.; Kočiško, M.; Evtuhov, A.; Pavlenko, I.; Trojanowska, J. Development of Flexible Fixtures with Incomplete Locating: Connecting Rods Machining Case Study. Machines 2022, 10, 493. [Google Scholar] [CrossRef]
  12. Gu, Y.-K.; Fan, C.-J.; Liang, L.-Q.; Zhang, J. Reliability calculation method based on the Copula function for mechanical systems with dependent failure. Ann. Oper. Res. 2022, 311, 99–116. [Google Scholar] [CrossRef]
  13. Liu, J.L.; Xiang, J.H.; Qin, W.J.; Zuo, Z. Effect of temperature increase on the looseness of connecting rod small end bushing. Eng. Fail. Anal. 2022, 138, 106195. [Google Scholar] [CrossRef]
  14. Li, R.; Meng, X.H.; Liu, R.C.; Muhammad, R.; Li, W.; Dong, J. Crosshead bearing analysis for low-speed marine diesel engines based on a multi-body tribo-dynamic model. Int. J. Engine Res. 2021, 22, 2442–2463. [Google Scholar] [CrossRef]
  15. Pan, Z.; Zhang, Y. Numerical investigation into high cycle fatigue of aero kerosene piston engine connecting rod. Eng. Fail. Anal. 2021, 120, 105028. [Google Scholar] [CrossRef]
  16. Carjova, K.; Priednieks, V.; Klaucans, R.; Irbe, I.; Urbahs, A. Fractographic study of marine diesel engine connecting rod stud bolt crack. Latv. J. Phys. Tech. Sci. 2021, 58, 28–42. [Google Scholar] [CrossRef]
  17. Helal WM, K.; Zhang, W.P.; Li, X.B.; Wang, G.X. A Study on the Fatigue Strength of a Low-Speed Diesel Engine Connecting Rod Made of 42CrMoA. Int. J. Eng. Res. Afr. 2020, 49, 139–151. [Google Scholar] [CrossRef]
  18. Ismail, I.; Abdelrazek, S.M.; Ismail, M.; Emara, A. Enhancing the Durability of Connecting Rod of a Heavy-Duty Diesel Engine. Int. J. Automot. Mech. Eng. 2021, 18, 8728–8737. [Google Scholar] [CrossRef]
  19. He, Q.; Jiang, Y.X.; Jing, X.W.; Jiang, Y.; Zhou, H.; Fu, B. Research and Optimization of Process Parameters for Internal Thread Forming Based on Numerical Simulation and Experimental Analysis. Materials 2022, 15, 3160. [Google Scholar] [CrossRef]
  20. Cihan, O.; Bulut, M. A Comparative Fatigue Analysis of GFRP, CFRP and Structural Steel for Connecting Rod Using ANSYS. Int. Polym. Processing 2021, 36, 144–155. [Google Scholar] [CrossRef]
  21. Basavaraj, Y.; Joshi, R.; Setty, G.R.; Samiullah, M.; Museb, M.; Tayab, M.; Banu, H. FEA of NX-11 unigraphics modeled connecting rod using different materials. In Proceedings of the 2nd International Conference on Smart and Sustainable Developments in Materials, Manufacturing and Energy Engineering (SME), Nitte, India, 22–23 December 2020; pp. 2807–2813. [Google Scholar]
  22. Pani, A.R.; Kumar, P.R.; Kumar, G.G. Buckling analysis and material selection of connecting rod to avoid hydro -lock failure. In Proceedings of the International Conference on Materials and Manufacturing Methods (MMM), Tamilnadu, India, 8–9 March 2019; pp. 2121–2126. [Google Scholar]
  23. Zhou, H.G.; Liu, S.; Li, G.C.; Tian, G.; Wang, Z.; Wang, C. Machining Stress Analysis and Deformation Prediction of Connecting Rod Based on FEM and GRNN. Iran. J. Sci. Technol.-Trans. Mech. Eng. 2020, 44, 183–192. [Google Scholar] [CrossRef]
  24. Petrova, I.M.; Filimonov, M.A. Computational and Experimental Study of the Stress State of the Opposed Compressor Connecting Rod to Assess the Probability of Failure-Free Operation. Inorg. Mater. 2021, 57, 1505–1510. [Google Scholar] [CrossRef]
  25. Yildiz, A.R.; Kilicarpa, U.A.; Demirci, E.; Doğan, M. Topography and topology optimization of diesel engine components for light-weight design in the automotive industry. Mater. Test. 2019, 61, 27–34. [Google Scholar] [CrossRef]
  26. Seralathan, S.; Mitnala, S.V.; Reddy, R.S.K.; Venkat, I.G.; Reddy, D.R.T.; Hariram, V.; Premkumar, T.M. Stress analysis of the connecting rod of compression ignition engine. In Proceedings of the International Conference on NanoTechnology—Ideas, Innovation and Industries, Uttarakhand, India, 18–19 March 2019; pp. 3722–3728. [Google Scholar]
  27. Sun, J.; Li, B.; Zhu, S.Y.; Miao, E.; Wang, H.; Zhao, X.; Teng, Q. Lubrication Performance of Connecting-Rod and Main Bearing in Different Engine Operating Conditions. Chin. J. Mech. Eng. 2019, 32, 23. [Google Scholar] [CrossRef]
  28. Muhammad, A.; Ali, M.A.H.; Shanono, I.H. Design optimization of a diesel connecting rod. In Proceedings of the 2nd International Conference on Materials Manufacturing and Modelling (ICMMM), Tamilnadu, India, 8–9 March 2019; pp. 1600–1609. [Google Scholar]
  29. Li, R.; Meng, X.H.; Li, W.D.; Dong, J. A new comprehensive tribo-dynamic analysis for lubricated translational joints in low-speed two-stroke marine engines. Int. J. Engine Res. 2020, 21, 1336–1361. [Google Scholar] [CrossRef]
  30. Winiarski, G.; Dziubinska, A. Analysis of a New Process of Forging a 2017A Aluminum Alloy Connecting Rod. J. Manuf. Sci. Eng. Trans. Asme 2021, 143, 081006. [Google Scholar] [CrossRef]
Figure 1. Overall diagram of structural optimization design and strength test of connecting rod assembly of high-power low-speed diesel engine.
Machines 10 00815 g001
Figure 2. Crank connecting rod mechanism model.
Machines 10 00815 g002
Figure 3. Meshing of connecting rod assembly.
Machines 10 00815 g003
Figure 4. Meshing of the rest of the components.
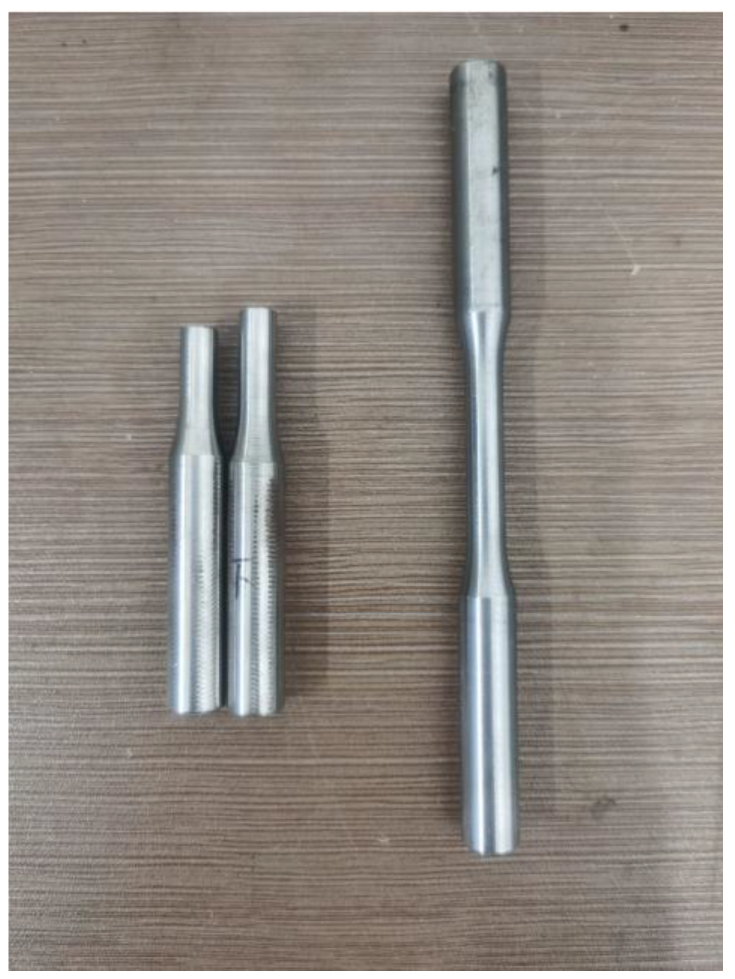
Machines 10 00815 g004
Figure 5. Sample rod for fatigue test.
Machines 10 00815 g005
Figure 6. Electro-hydraulic servo fatigue testing machine.
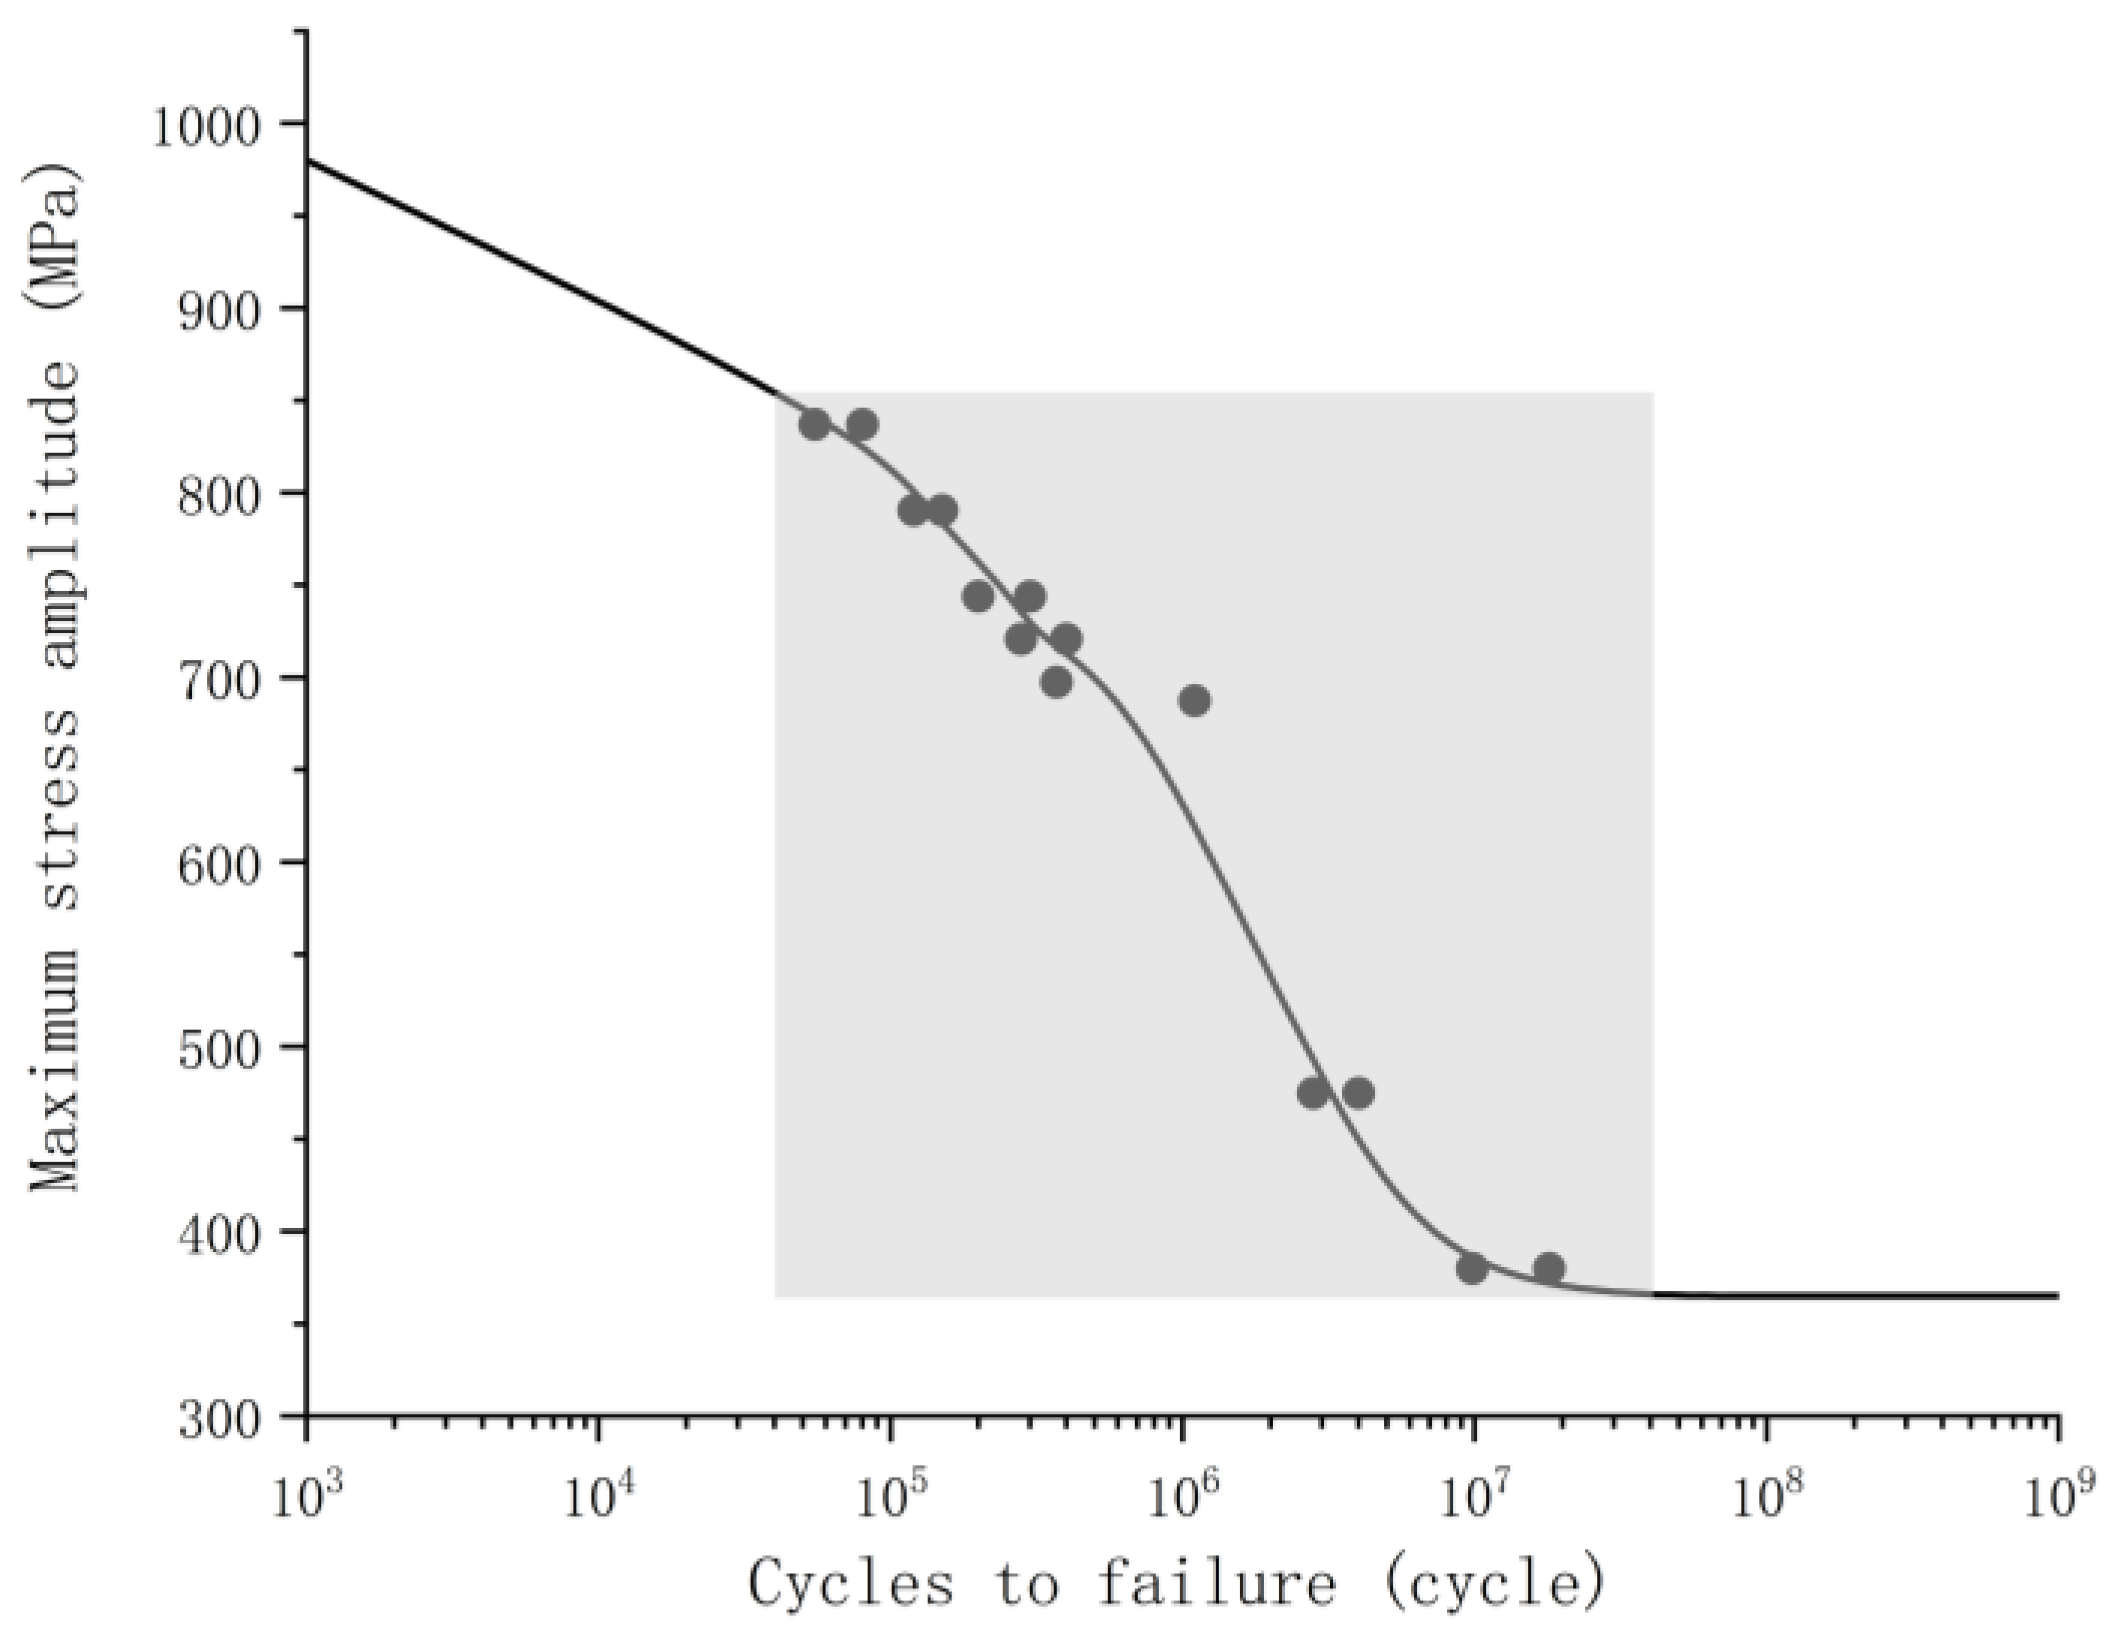
Machines 10 00815 g006
Figure 7. S-N curve of 42CrMoA.
Machines 10 00815 g007
Figure 8. Local magnification of S-N curve.
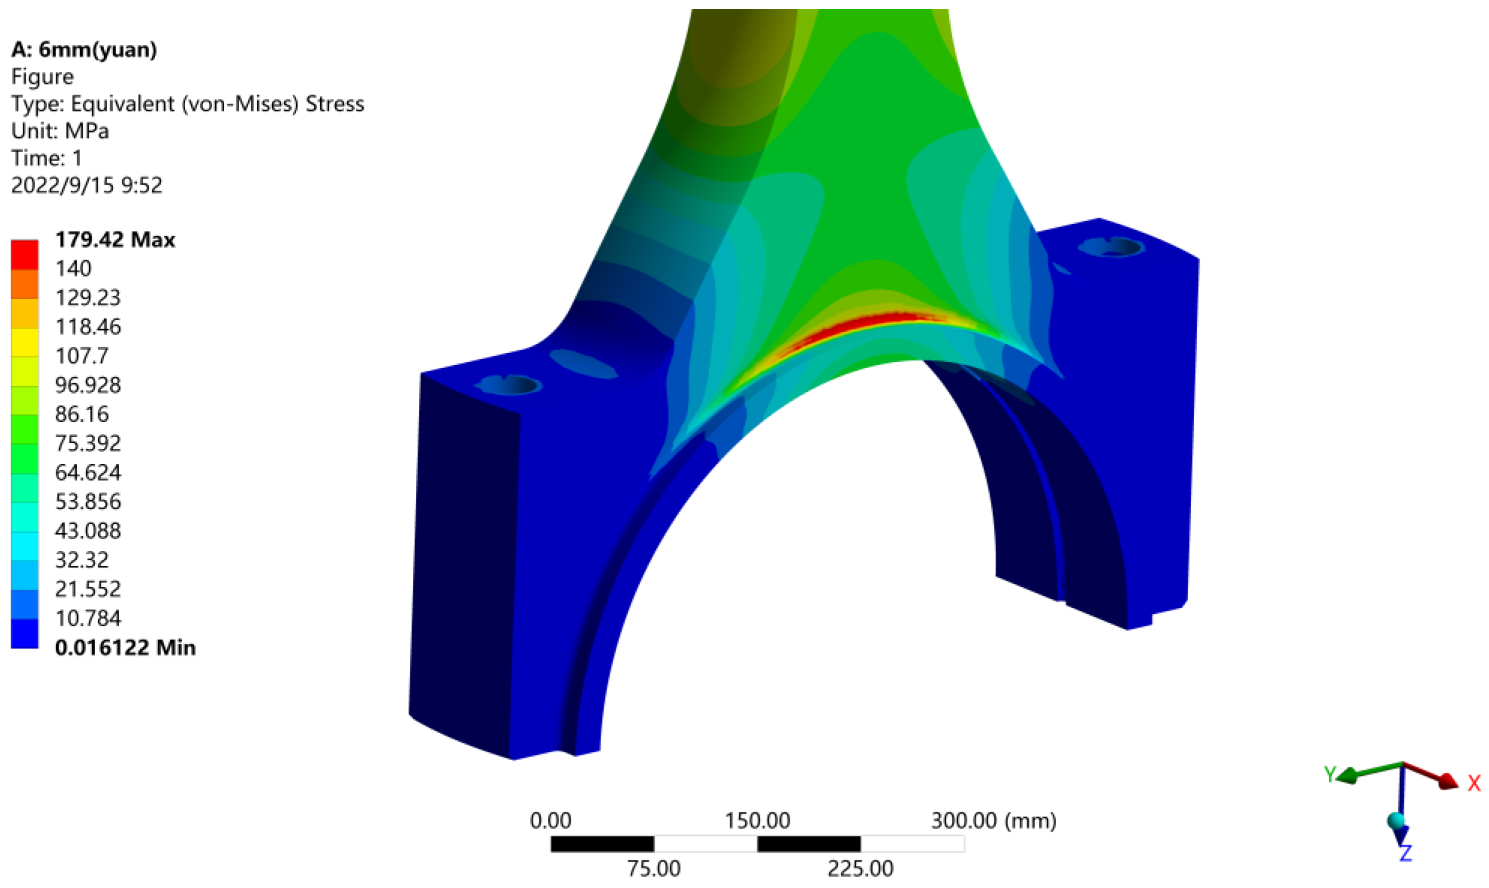
Machines 10 00815 g008
Figure 9. Stress diagram of the connecting rod assembly.
Machines 10 00815 g009
Figure 10. Stress diagram of small end bearing cover of connecting rod.
Machines 10 00815 g010
Figure 11. Stress diagram of large end bearing cover of connecting rod.
Machines 10 00815 g011
Figure 12. Stress diagram of connecting rod body.
Machines 10 00815 g012
Figure 13. Stress diagram at the large end of the connecting rod body.
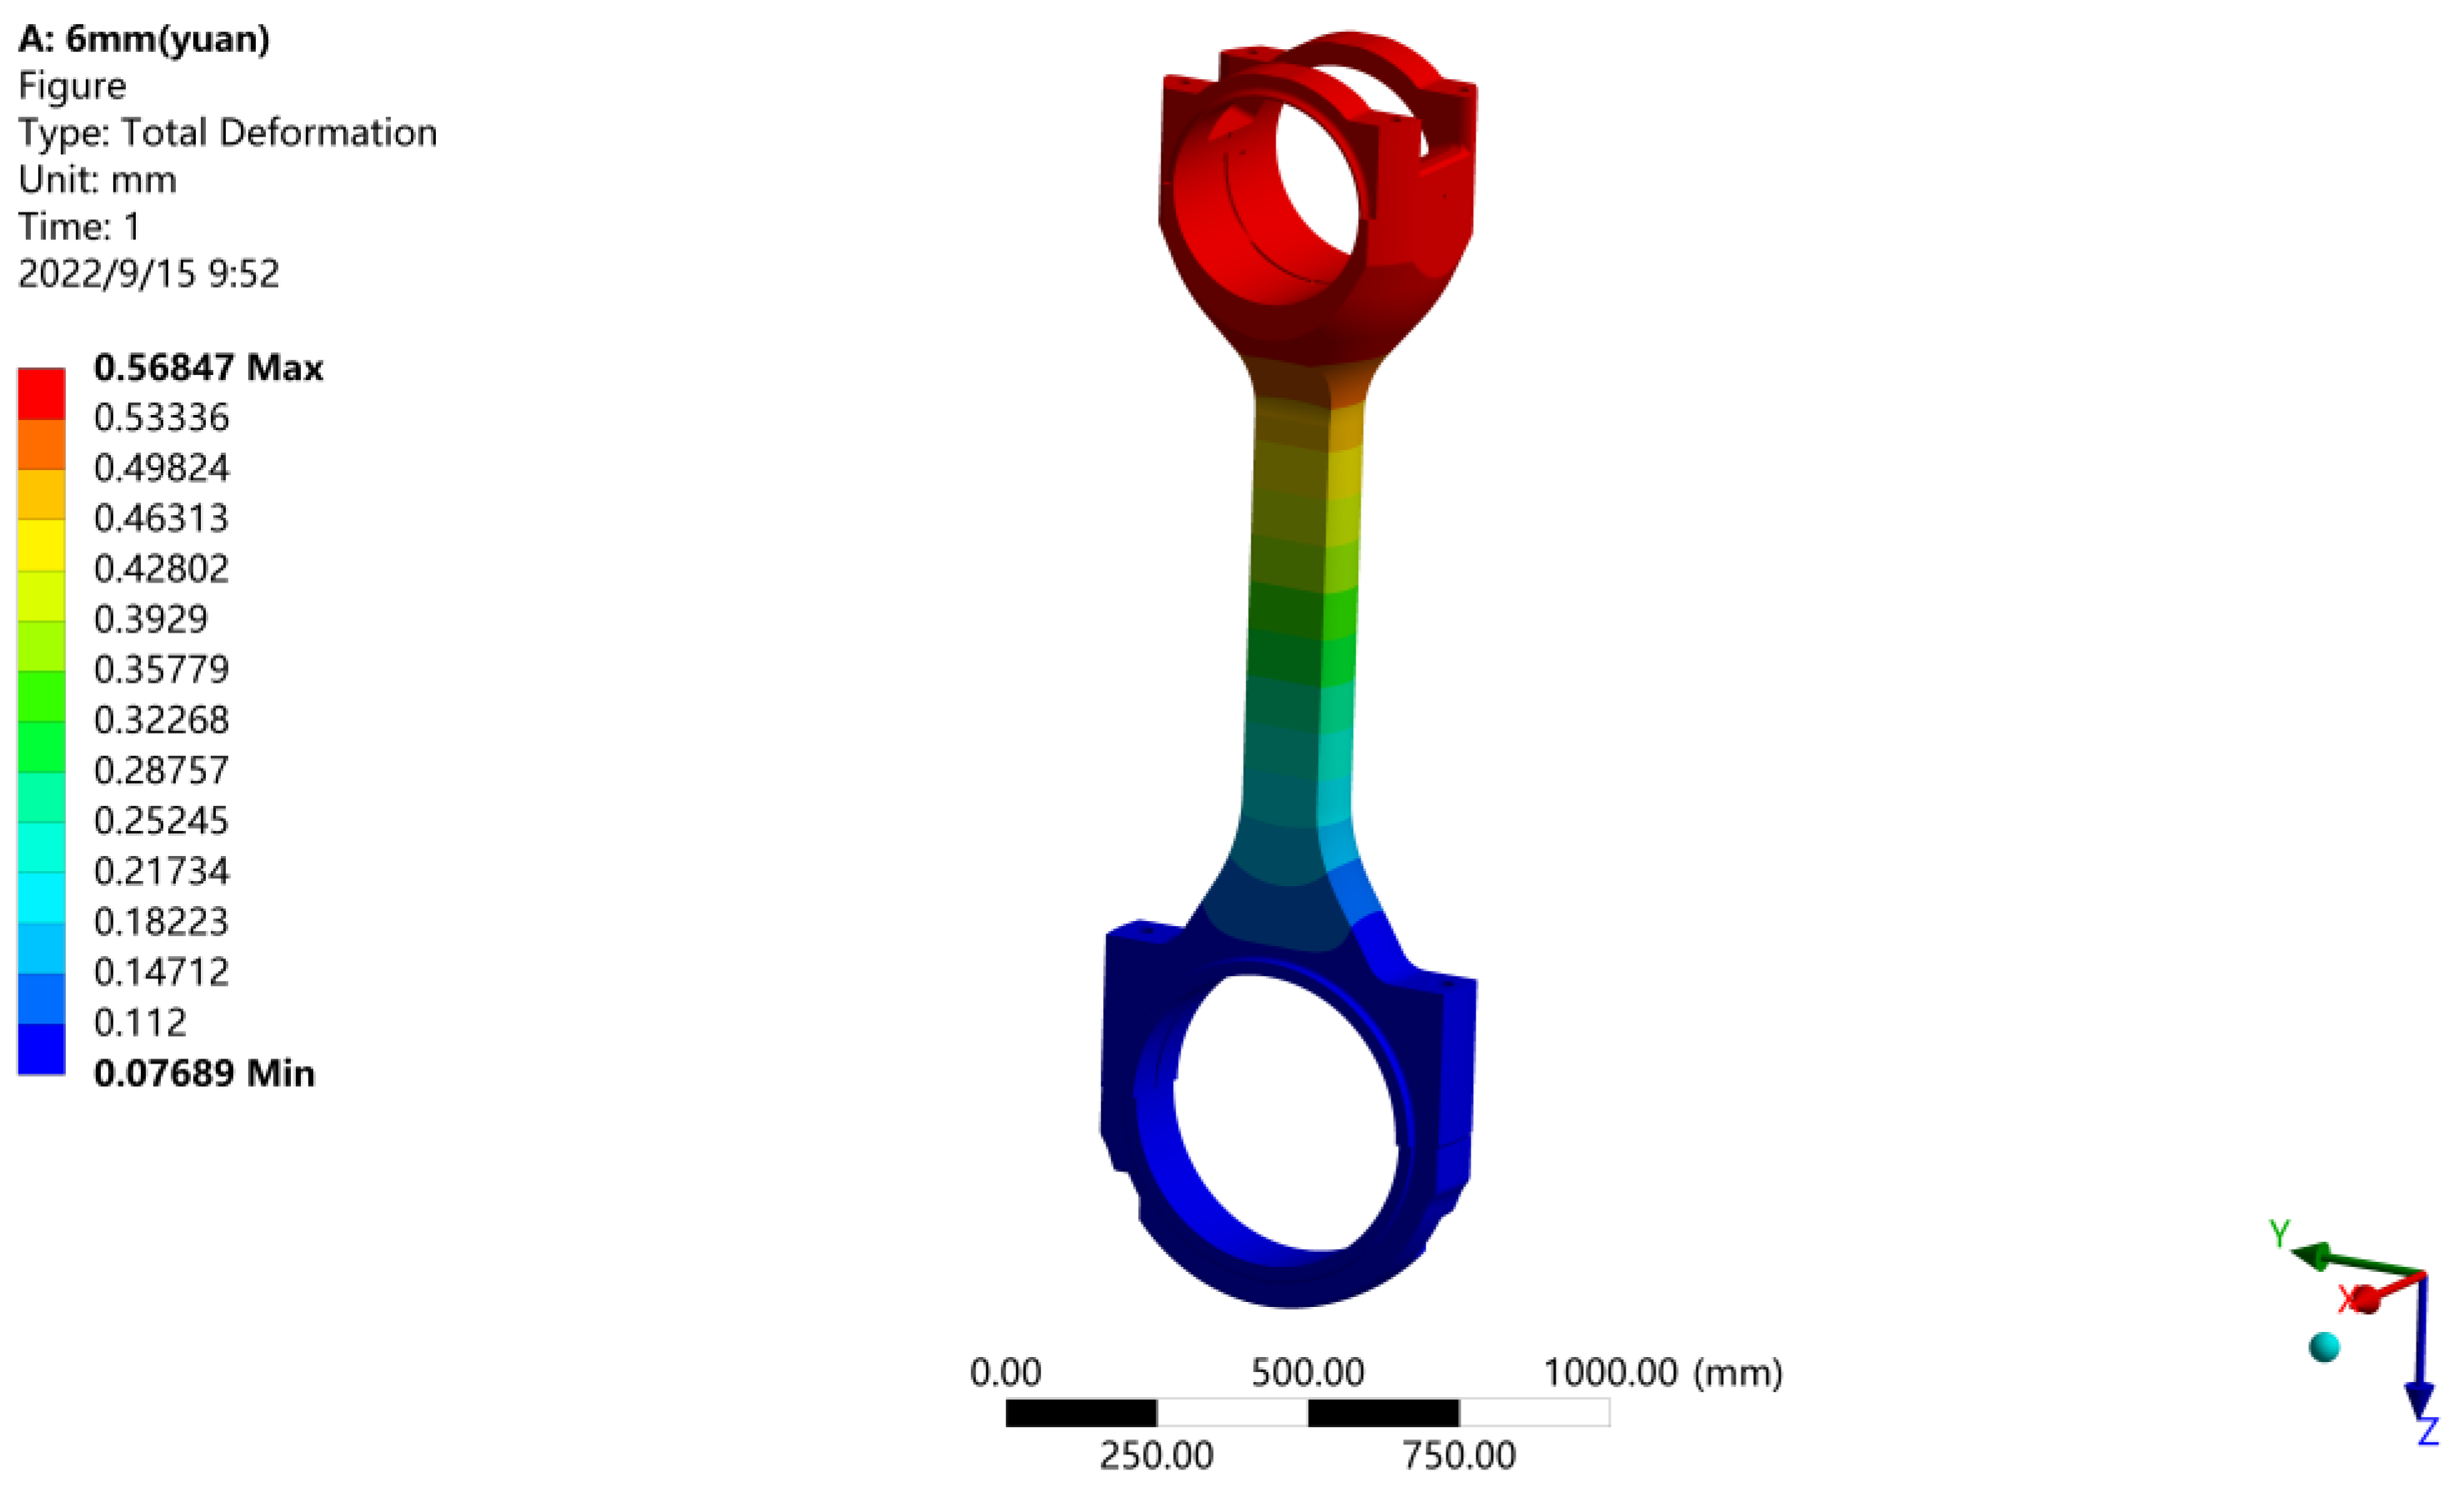
Machines 10 00815 g013
Figure 14. Deformation diagram of connecting rod.
Machines 10 00815 g014
Figure 15. Deformation diagram of connecting rod body.
Machines 10 00815 g015
Figure 16. Safety factor diagram of connecting rod body.
Machines 10 00815 g016
Figure 17. Schematic diagram of optimization.
Machines 10 00815 g017
Figure 18. Relation diagram of R, L, and maximum stress of connecting rod.
Machines 10 00815 g018
Figure 19. Stress diagram of optimized connecting rod body.
Machines 10 00815 g019
Figure 20. Safety factor diagram of optimized connecting rod body.
Machines 10 00815 g020
Figure 21. Comparison between the curve of influence of fillet radius on maximum stress of connecting rod and the formula curve after iteration.
Machines 10 00815 g021
Figure 22. The influence curve of the long diameter of rod section on the maximum stress of connecting rod is compared with the formula curve after iteration.
Machines 10 00815 g022
Figure 23. Formula coefficient initialization.
Machines 10 00815 g023
Figure 24. Corresponding graph of data points and formula surface after iteration.
Machines 10 00815 g024
Figure 25. 1/4 scale model.
Machines 10 00815 g025
Figure 26. WAW-2000 universal testing machine.
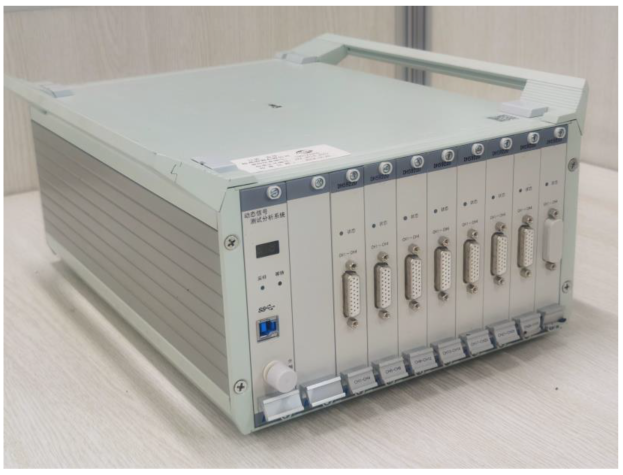
Machines 10 00815 g026
Figure 27. DH5922D dynamic signal tester.
Machines 10 00815 g027
Figure 28. Pasting position of strain gauge.
Machines 10 00815 g028
Figure 29. Half-bridge connection.
Machines 10 00815 g029
Figure 30. Error diagram of test and simulation.
Machines 10 00815 g030
Table 1. Main parameters of connecting rod model construction.
NameValueNameValue
Cylinder diameter (mm)340Rated speed (r/min)167
Maximum burst pressure (MPa)18.94Mass of connecting rod (kg)525.9
Connecting rod length (mm)2137Crankshaft radius of gyration (mm)800
Connecting rod materials42CrMoACrank radius-connecting rod length ratio0.5
Table 2. Grid independence analysis in simulation calculation of connecting rod assembly.
Connecting Rod Assembly Mesh Size (mm)Maximum Stress of Connecting Rod Assembly (MPa)
5179.35
6179.42
7182.67
9197.58
12205.79
15237.52
Table 3. Construction of connection relation in simulation calculation of connecting rod assembly.
Connection Relationship Sets ObjectsConnected Relation
Piston assembly and crosshead assemblyFriction contact (μ = 0.2)
Bushing and crosshead pinFriction contact (μ = 0.15)
Connecting rod large, small end, and rod bodyAsperity contact
Connecting rod and bolt threadsBonded contact
Connecting rod and bolt headFriction contact (μ = 0.2)
Bearing bush and crankshaftFriction contact (μ = 0.2)
Table 4. Setting of boundary conditions in simulation calculation of connecting rod assembly.
Boundary ConditionsValue
Preload of bolt at small end of connecting rod21,000 N
Preload of bolt at large end of connecting rod26,000 N
Maximum burst pressure18.94 MPa
End face of crankshaftFixed support
Inertia forceSee Formulas (1) and (2)
Table 5. Safety factors of Kirasu Shveli method.
Position of Connecting RodMinimum Safety Factor Requirements
Connecting rod body≥1.5–2.5
Connecting rod large and small end≥2.5
Table 6. Comparison of test and simulation results (MPa).
Position of Measuring Point of Connecting Rod50 kN100 kN150 kN200 kN225 kN250 kN275 kN300 kN
1Test value2.353.845.369.3115.1222.4226.9330.87
Simulation value3.856.166.8912.9216.6119.3223.5226.72
2Test value7.4218.0531.5254.3669.7281.2895.73108.34
Simulation value10.5823.2846.4570.3397.15111.89137.59154.65
3Test value17.6346.9475.2699.15108.67126.67138.91156.73
Simulation value25.0363.2992.04118.19130.80146.26150.45173.60
4Test value15.6353.1372.6497.76126.61125.03125.48131.37
Simulation value20.7165.2685.75111.03134.05135.86132.89139.09
5Test value16.1349.3672.4897.39125.95136.05127.89135.91
Simulation value25.3569.6686.54115.09142.42148.87140.01151.52
6Test value33.0669.4895.28148.39180.36200.07235.49250.63
Simulation value45.2791.80108.82160.05193.53216.09247.72271.21
7Test value18.6538.7460.8379.1393.81120.57132.71140.89
Simulation value28.8255.2985.17105.03120.78157.44175.94156.84
8Test value16.8450.4965.5697.97140.13155.94173.94193.75
Simulation value23.6757.1680.13108.82157.53166.64179.01204.02
9Test value25.4357.4875.93103.57115.91125.10140.51170.89
Simulation value35.8268.6092.24116.05122.48140.95152.13179.75
Publisher’s Note: MDPI stays neutral with regard to jurisdictional claims in published maps and institutional affiliations.

