Correlation Study between the Mechanical Property of the Square Cone Energy-Absorbing Structure and Collision Energy Distribution for Urban Rail Trains

Abstract
:1. Introduction
2. Train Collision Energy Distribution and Square Cone Energy-Absorbing Structure
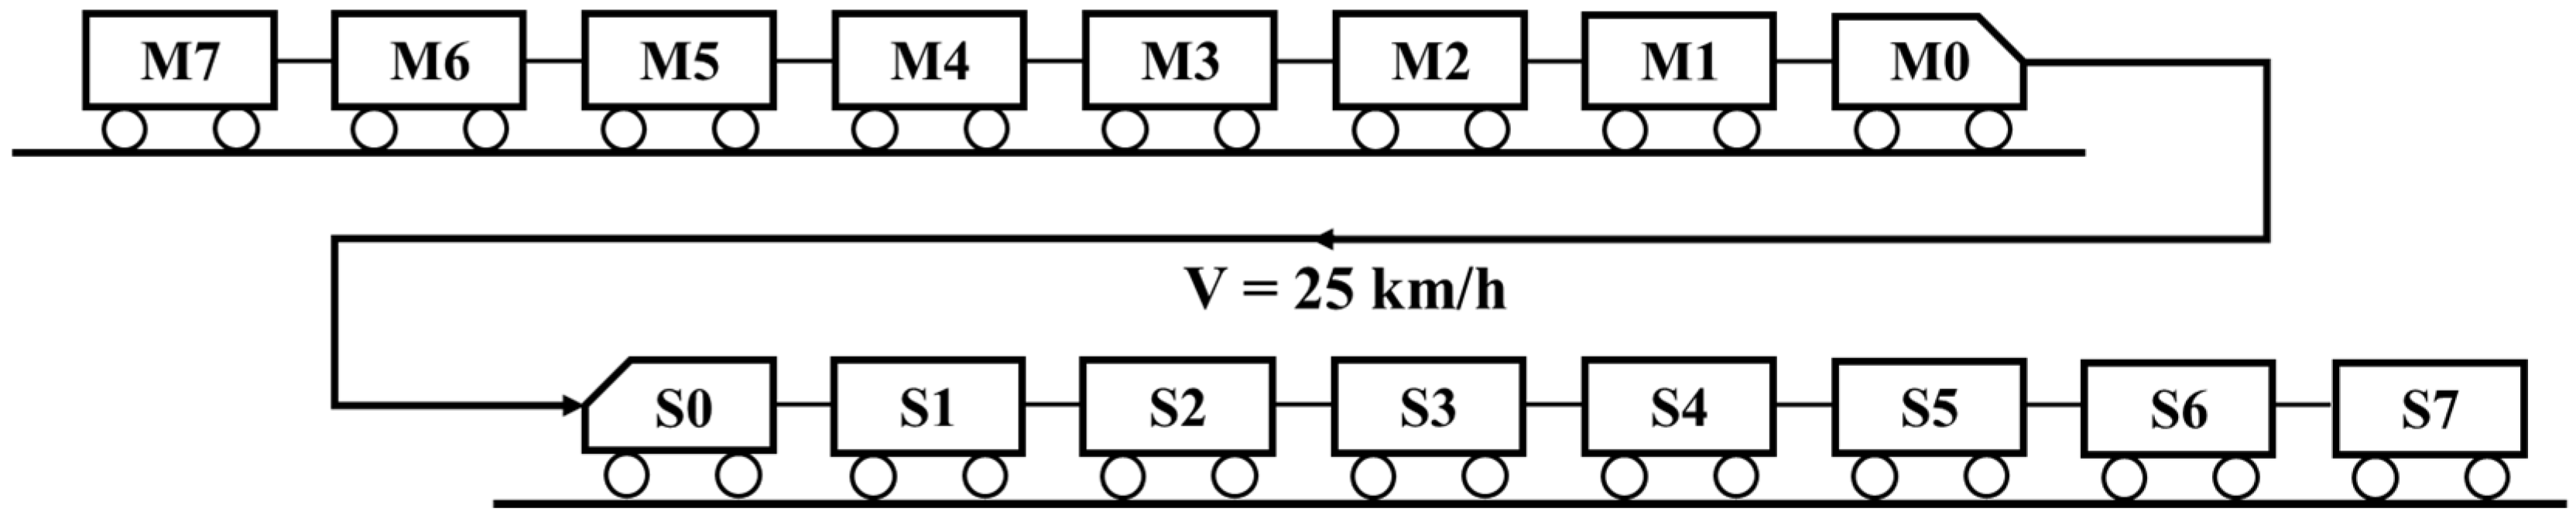
2.1. Train Collision Energy Distribution
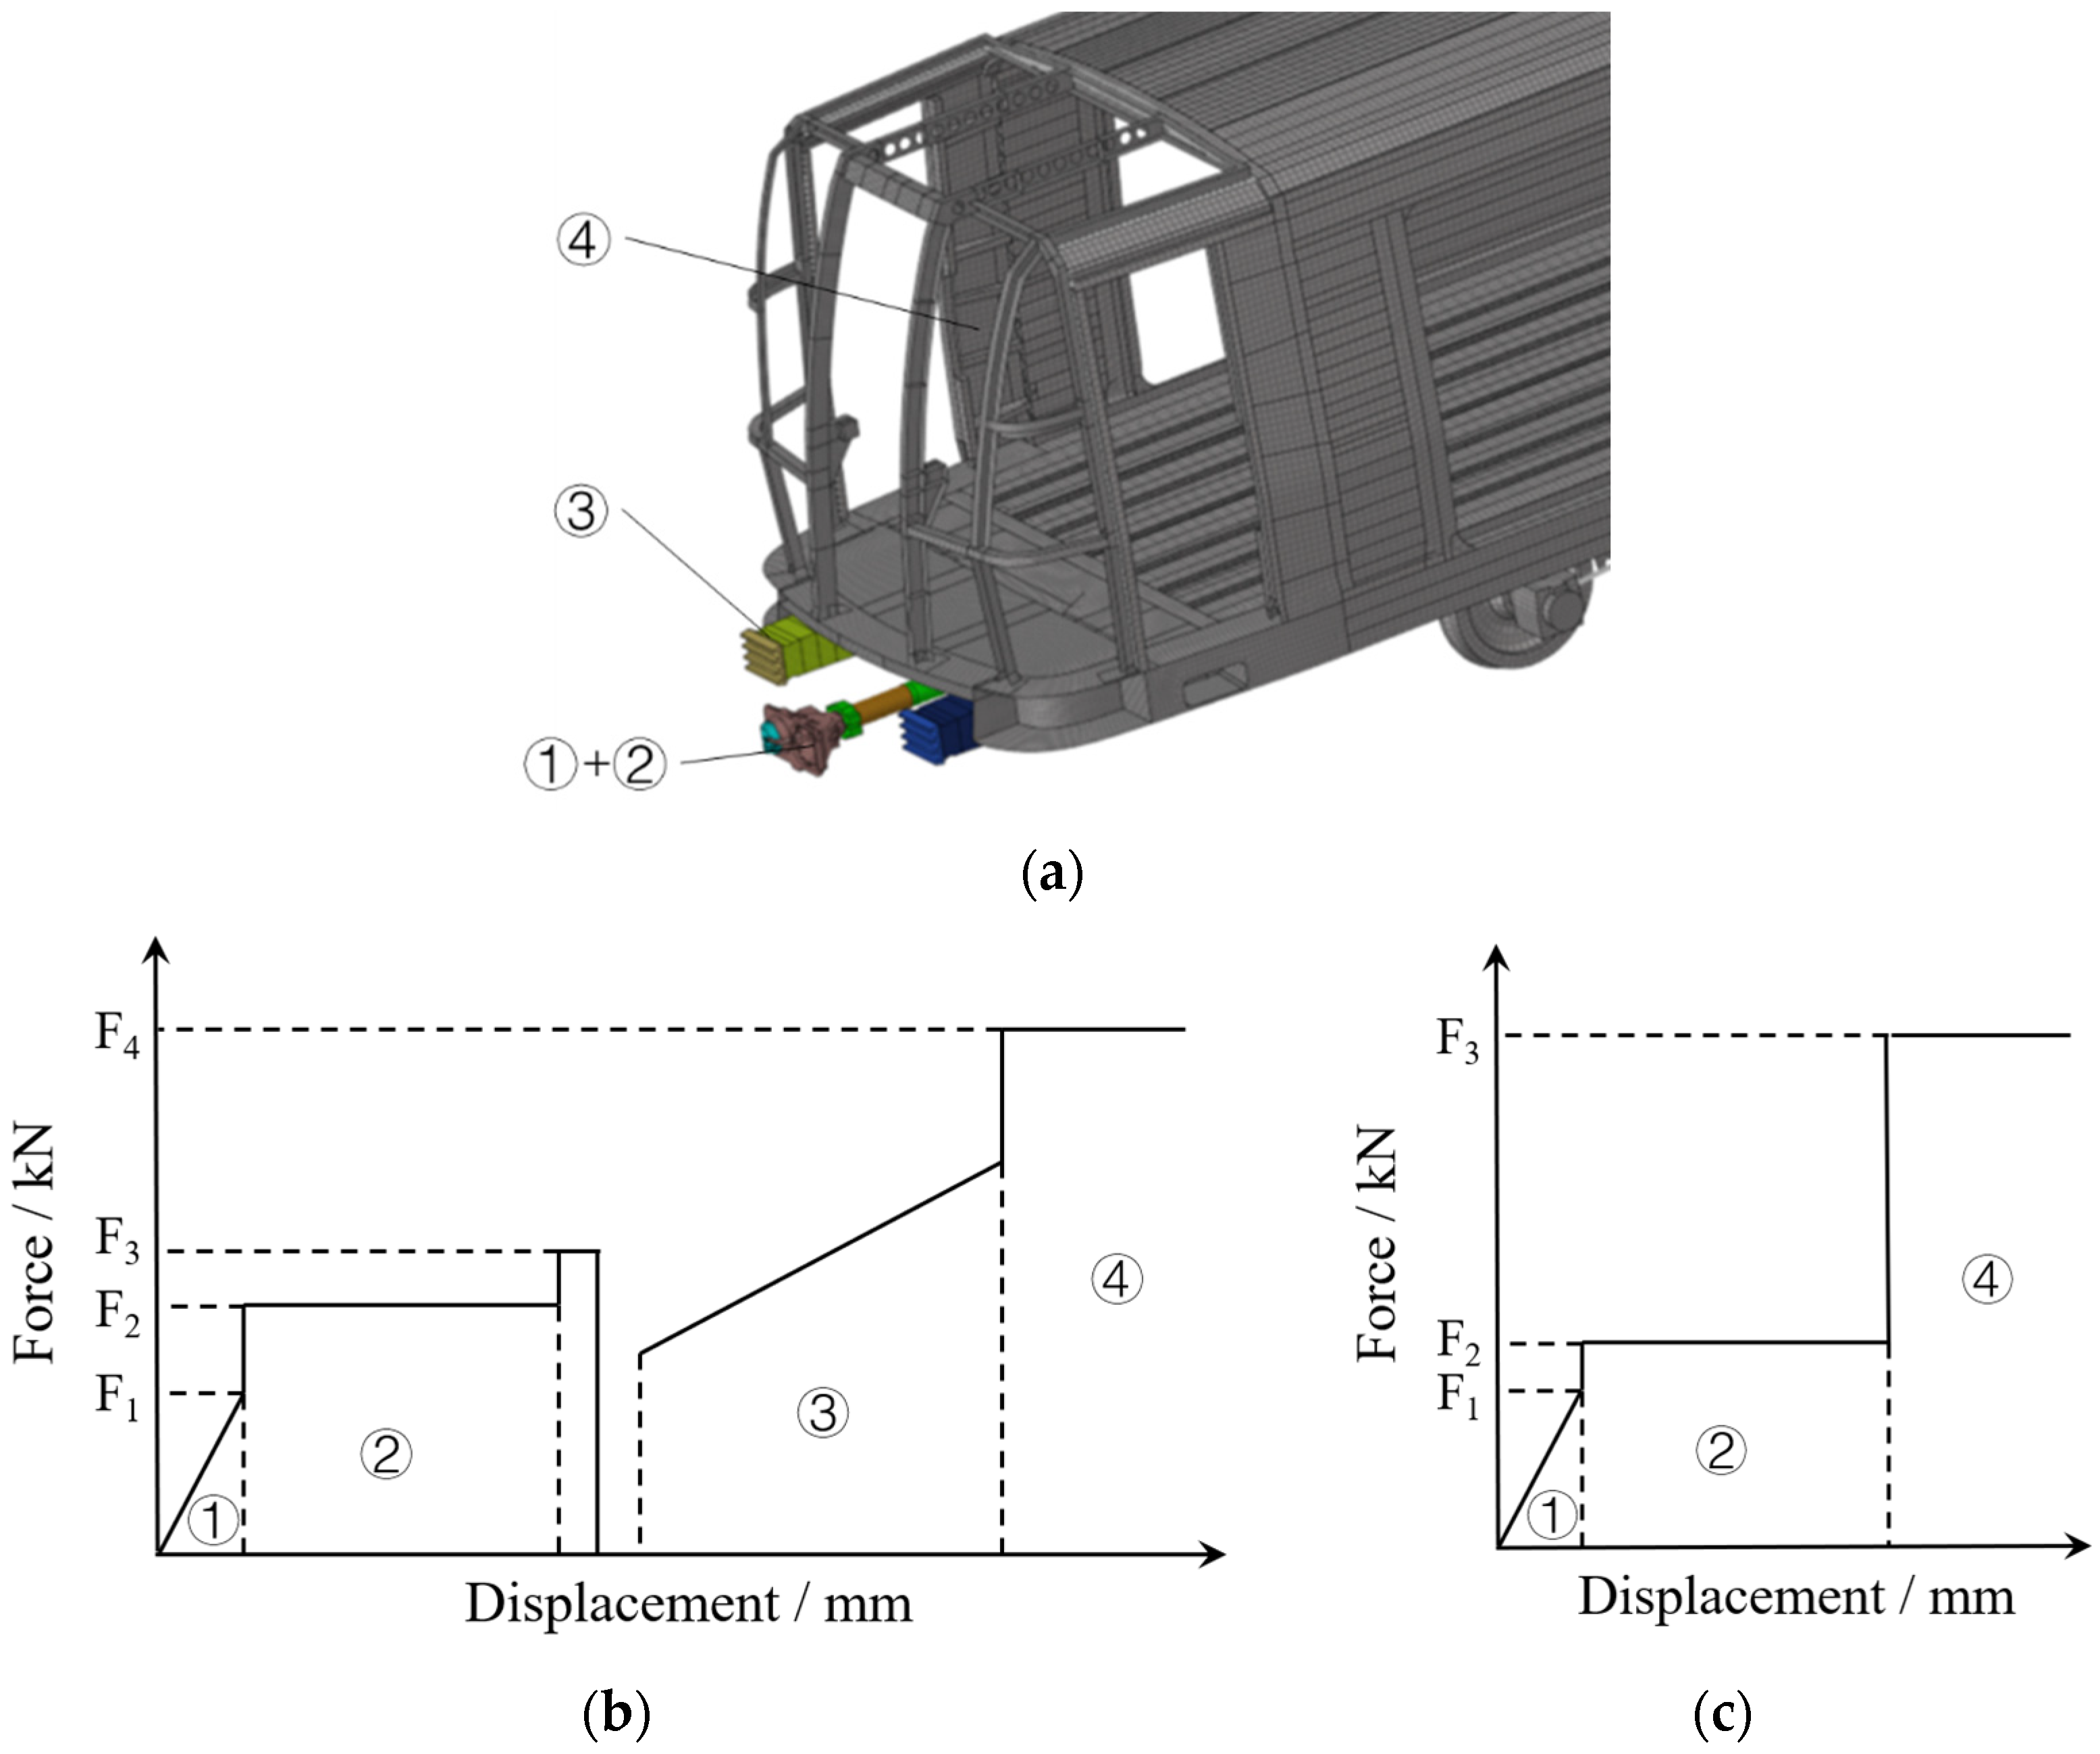
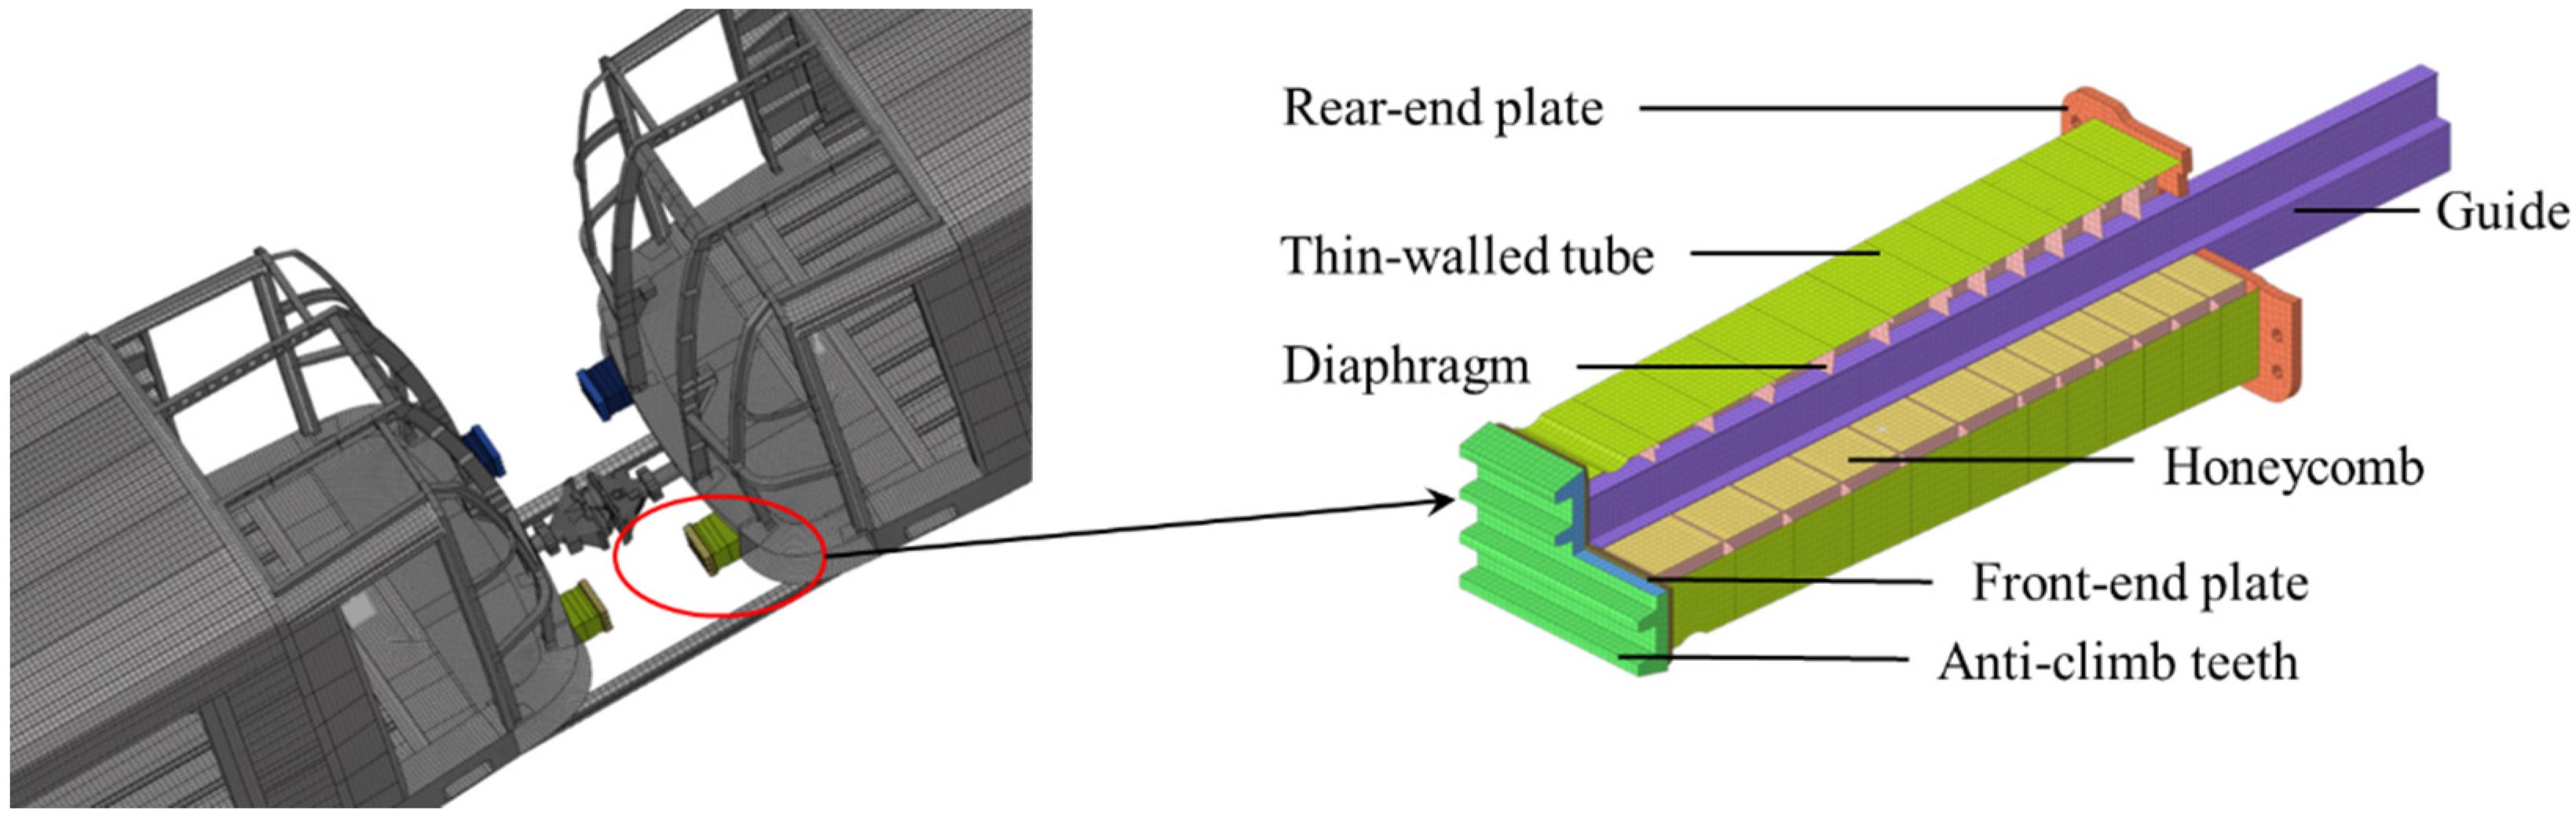
2.2. Square Cone Energy-Absorbing Structure for Urban Rail Trains
3. Collision Dynamics Model of Urban Rail Trains
3.1. Dynamic Model of Train Longitudinal Collision
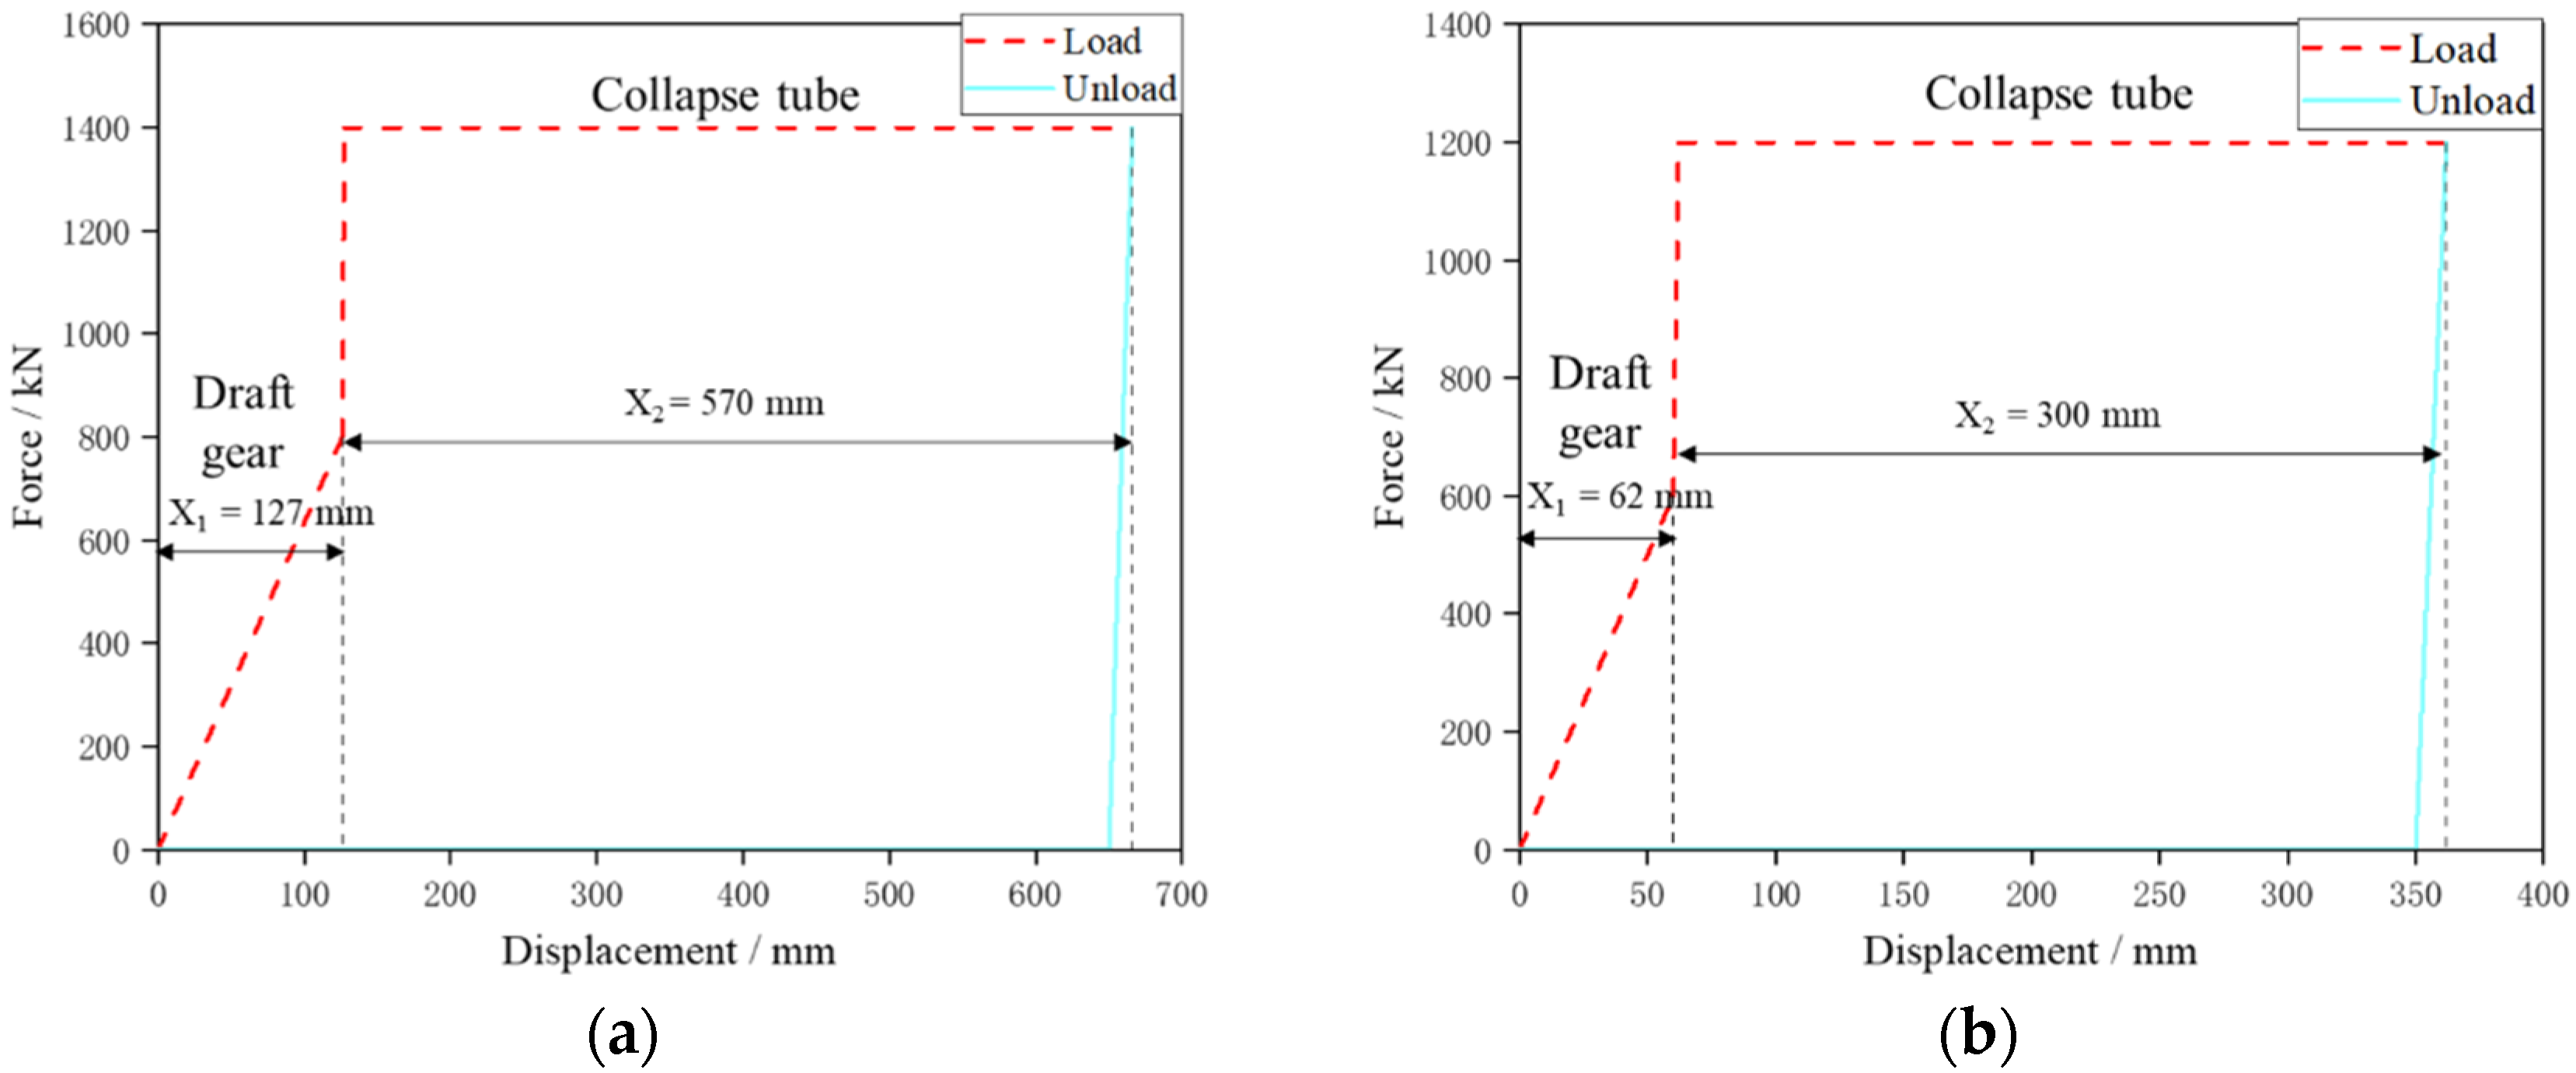
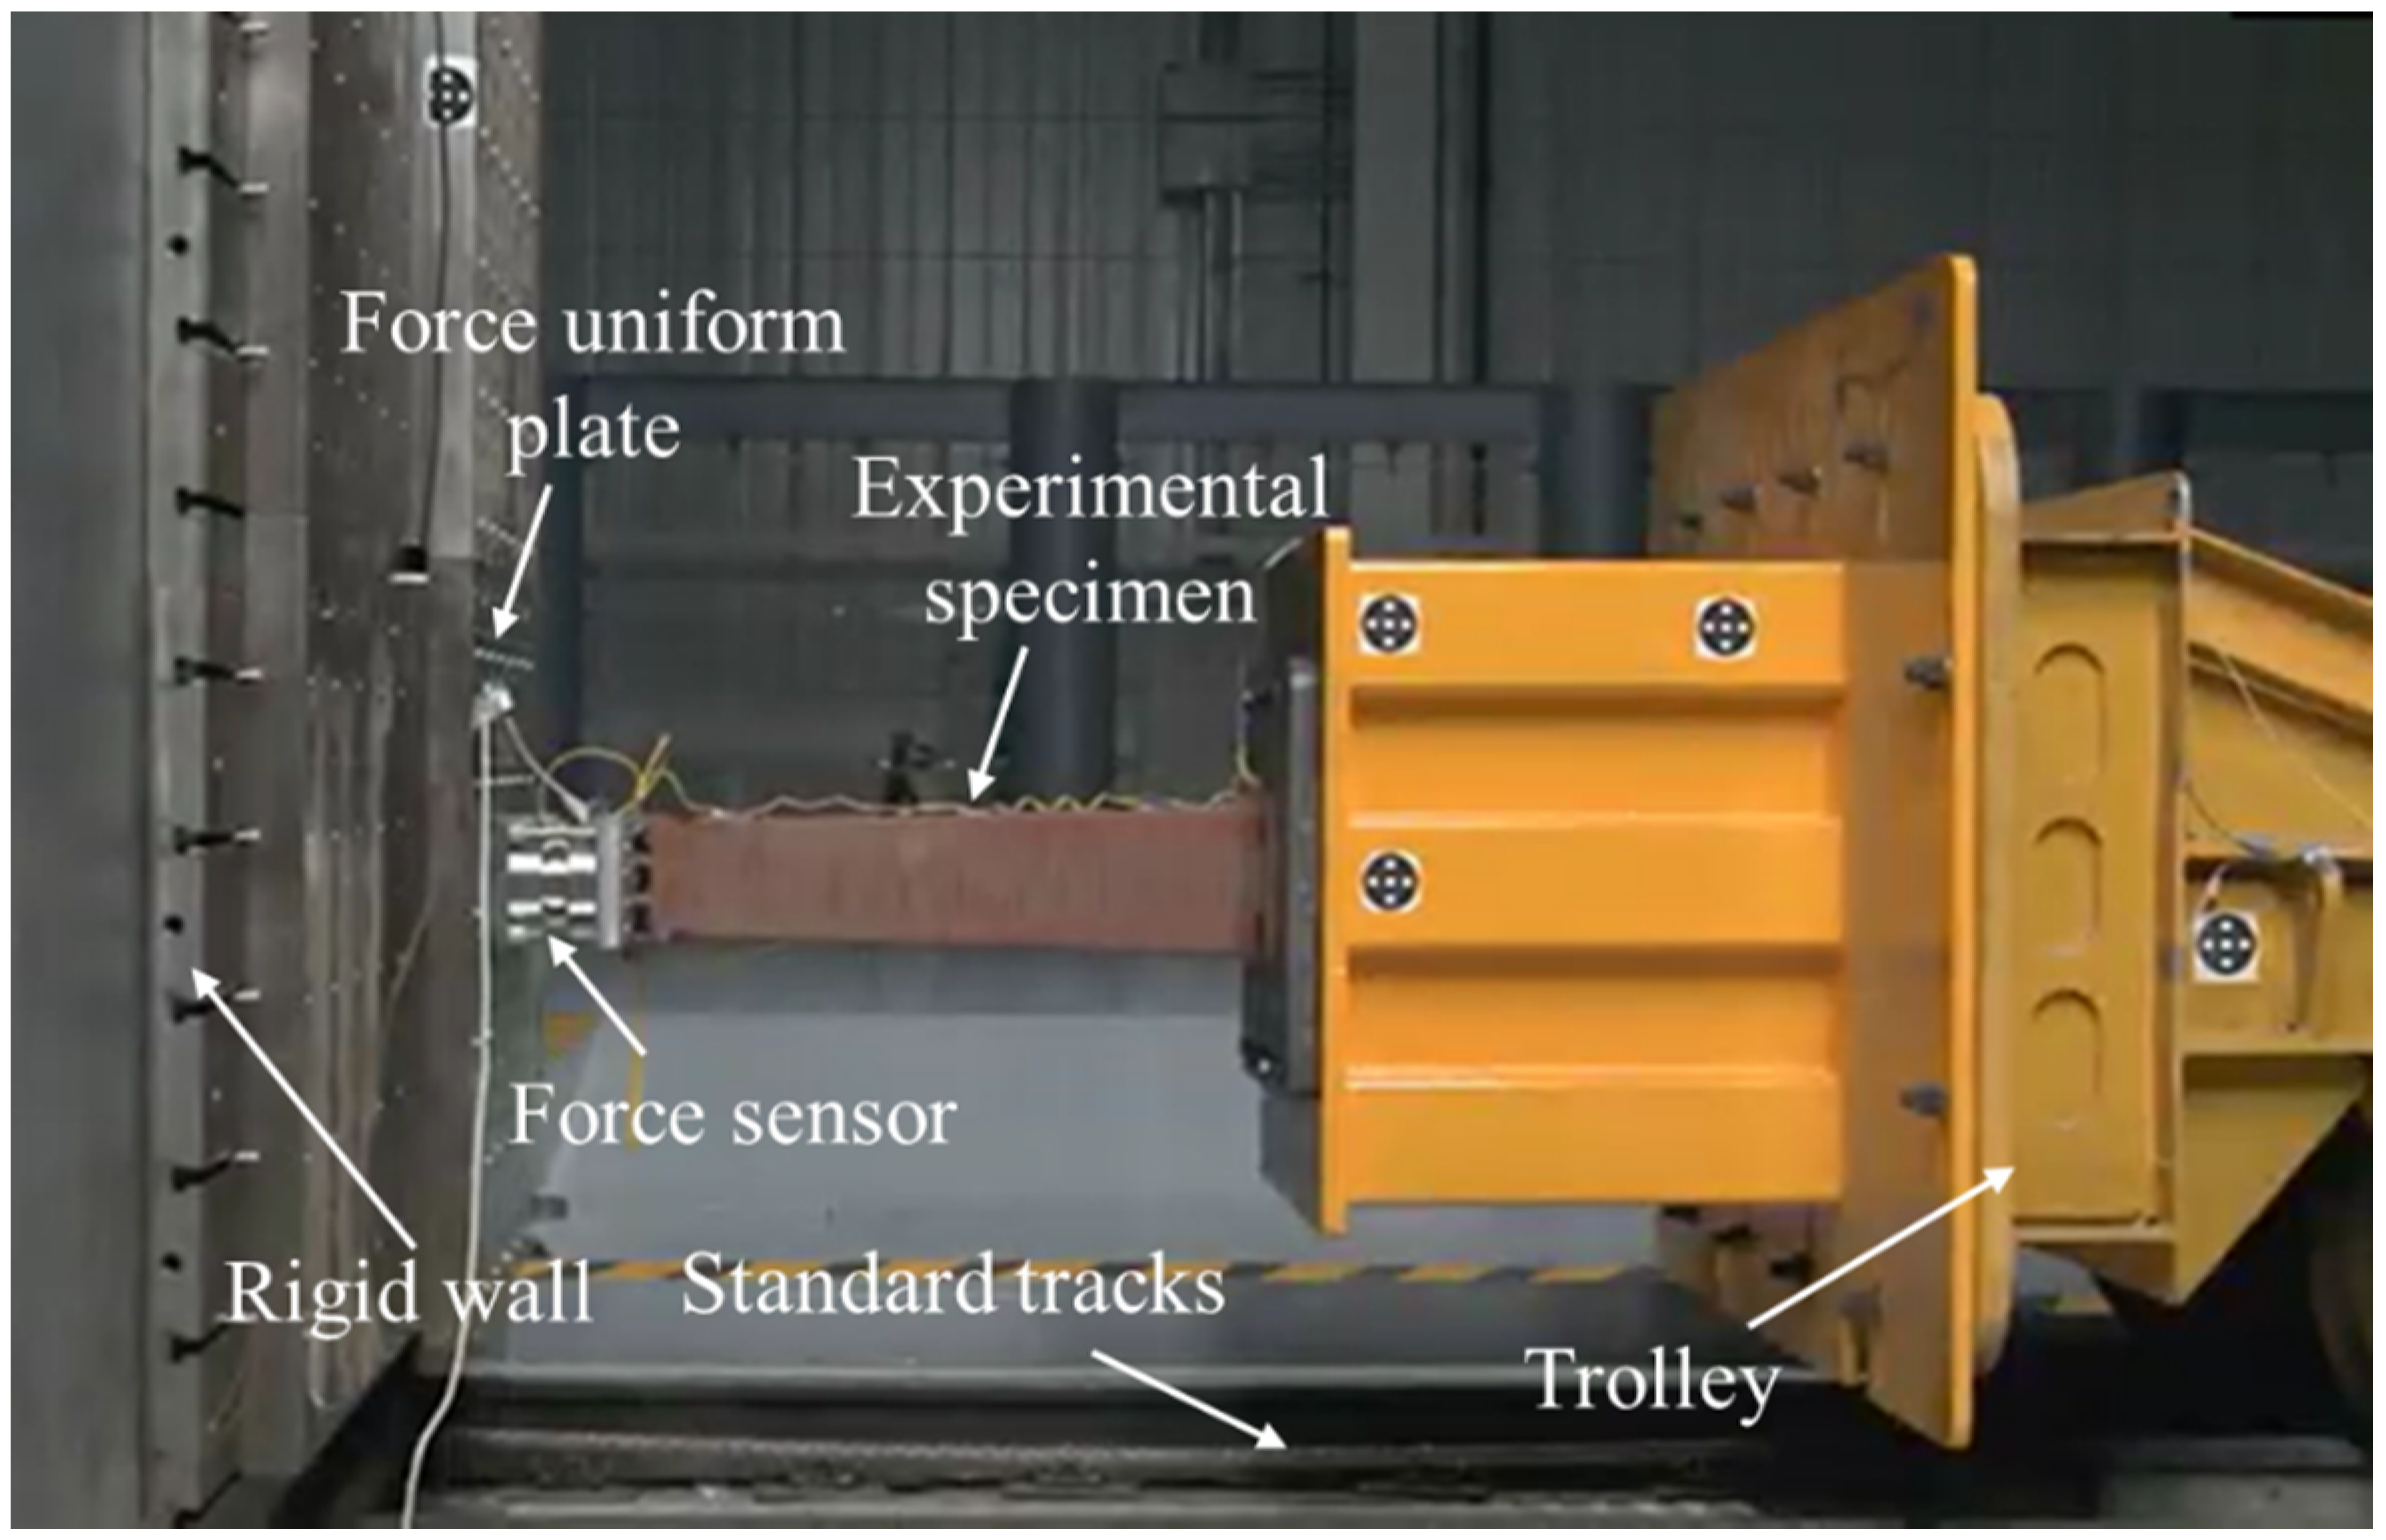
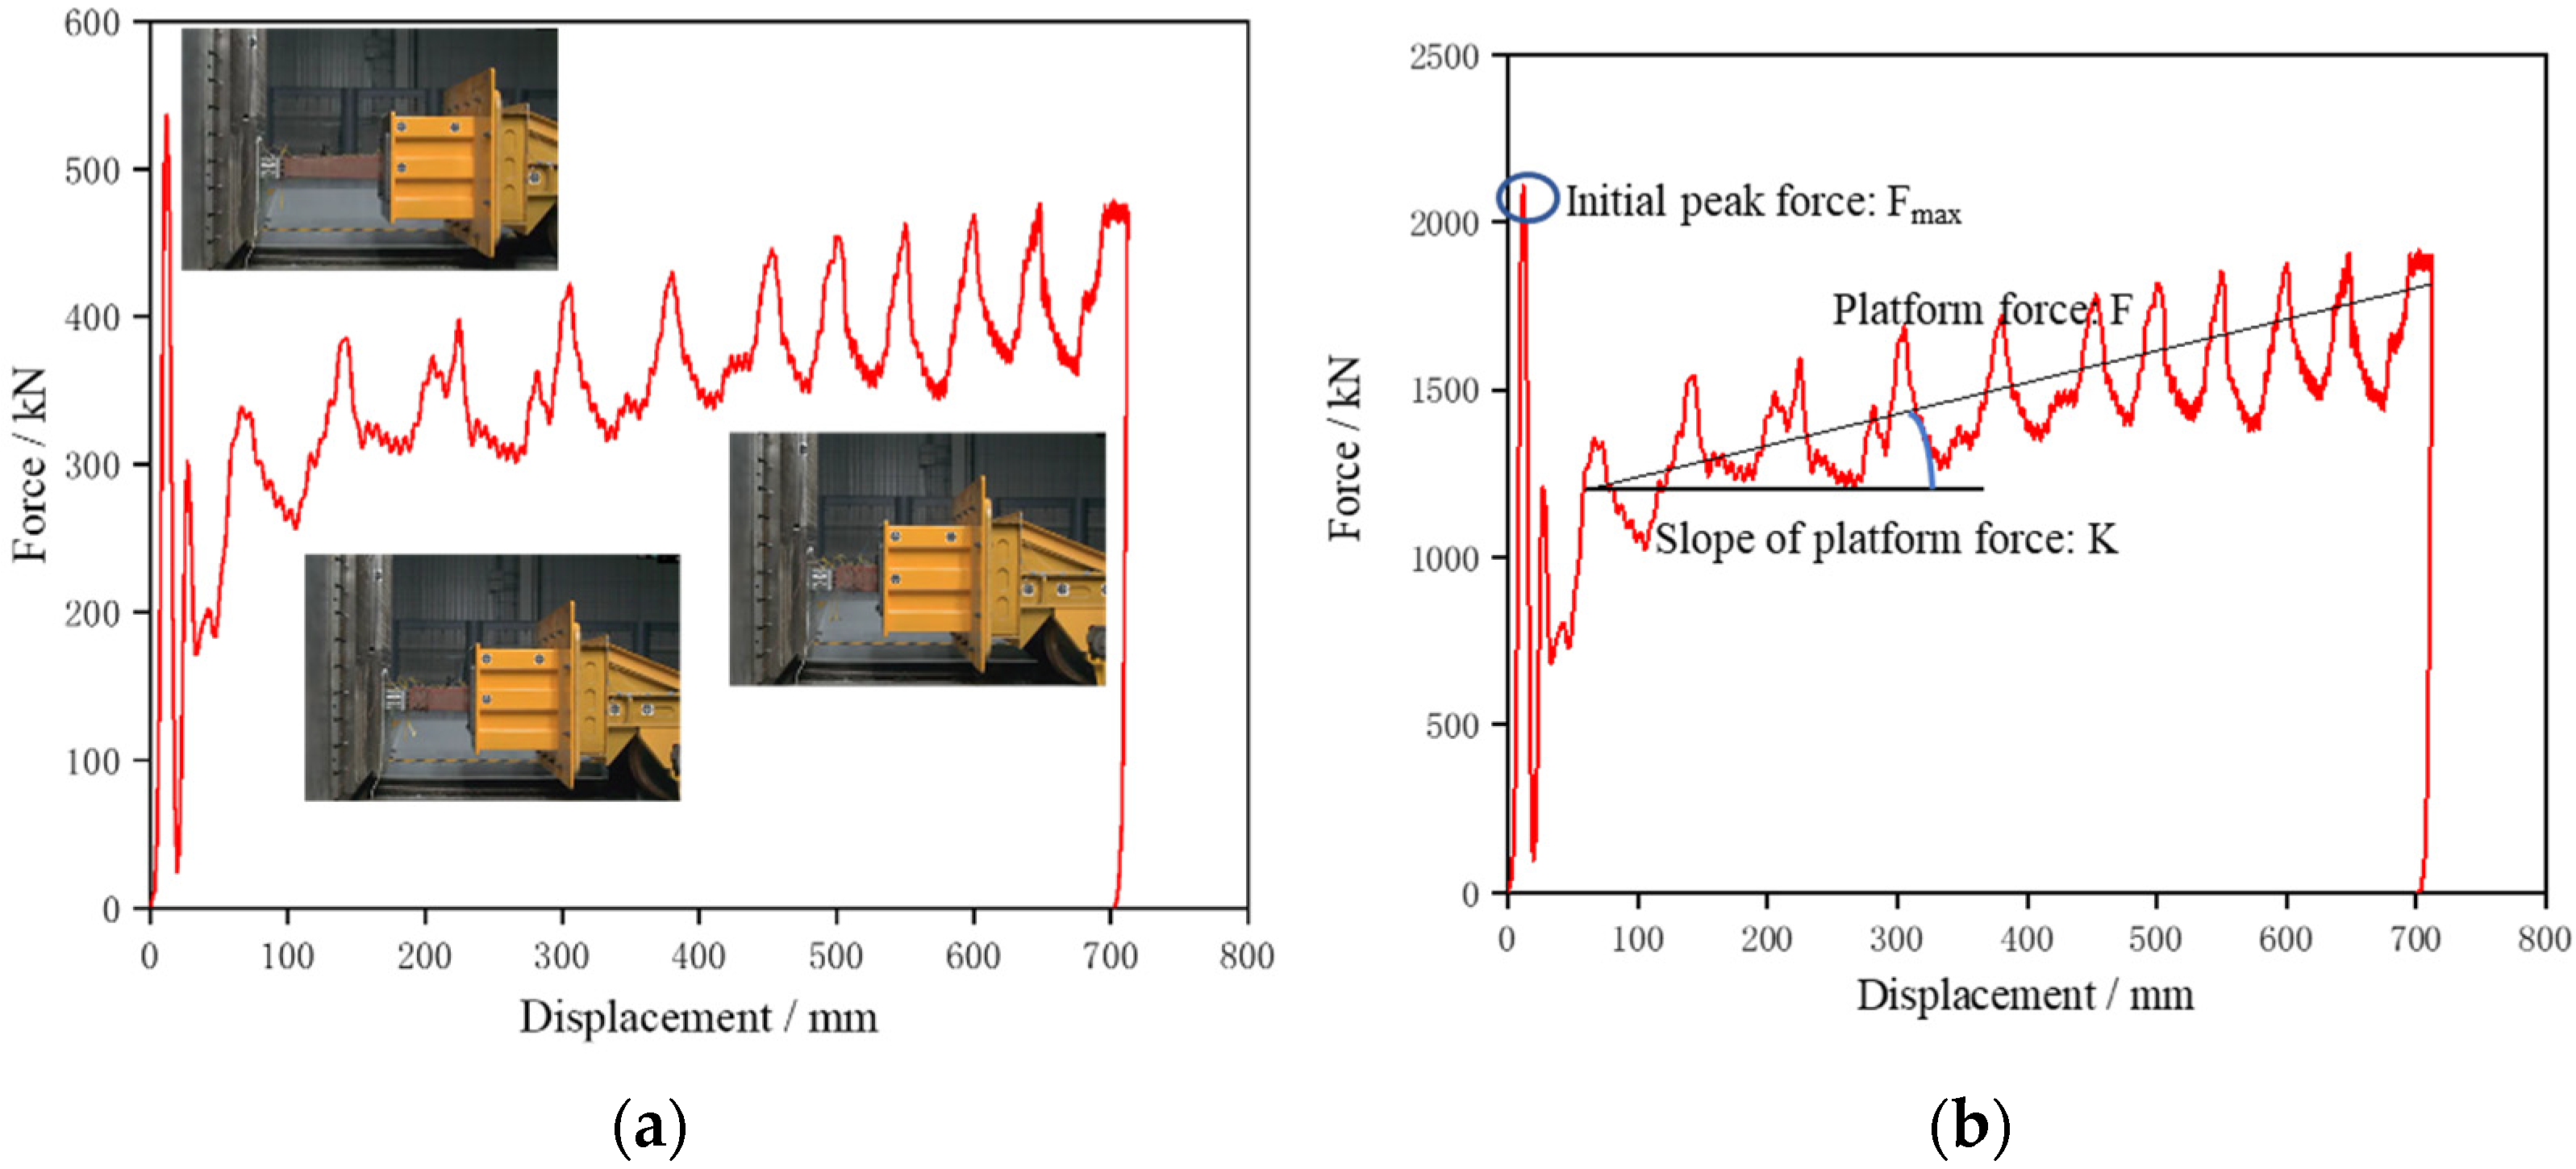
3.2. Force–Displacement Curve of Square Cone Anti-Climbing Energy-Absorbing Structure
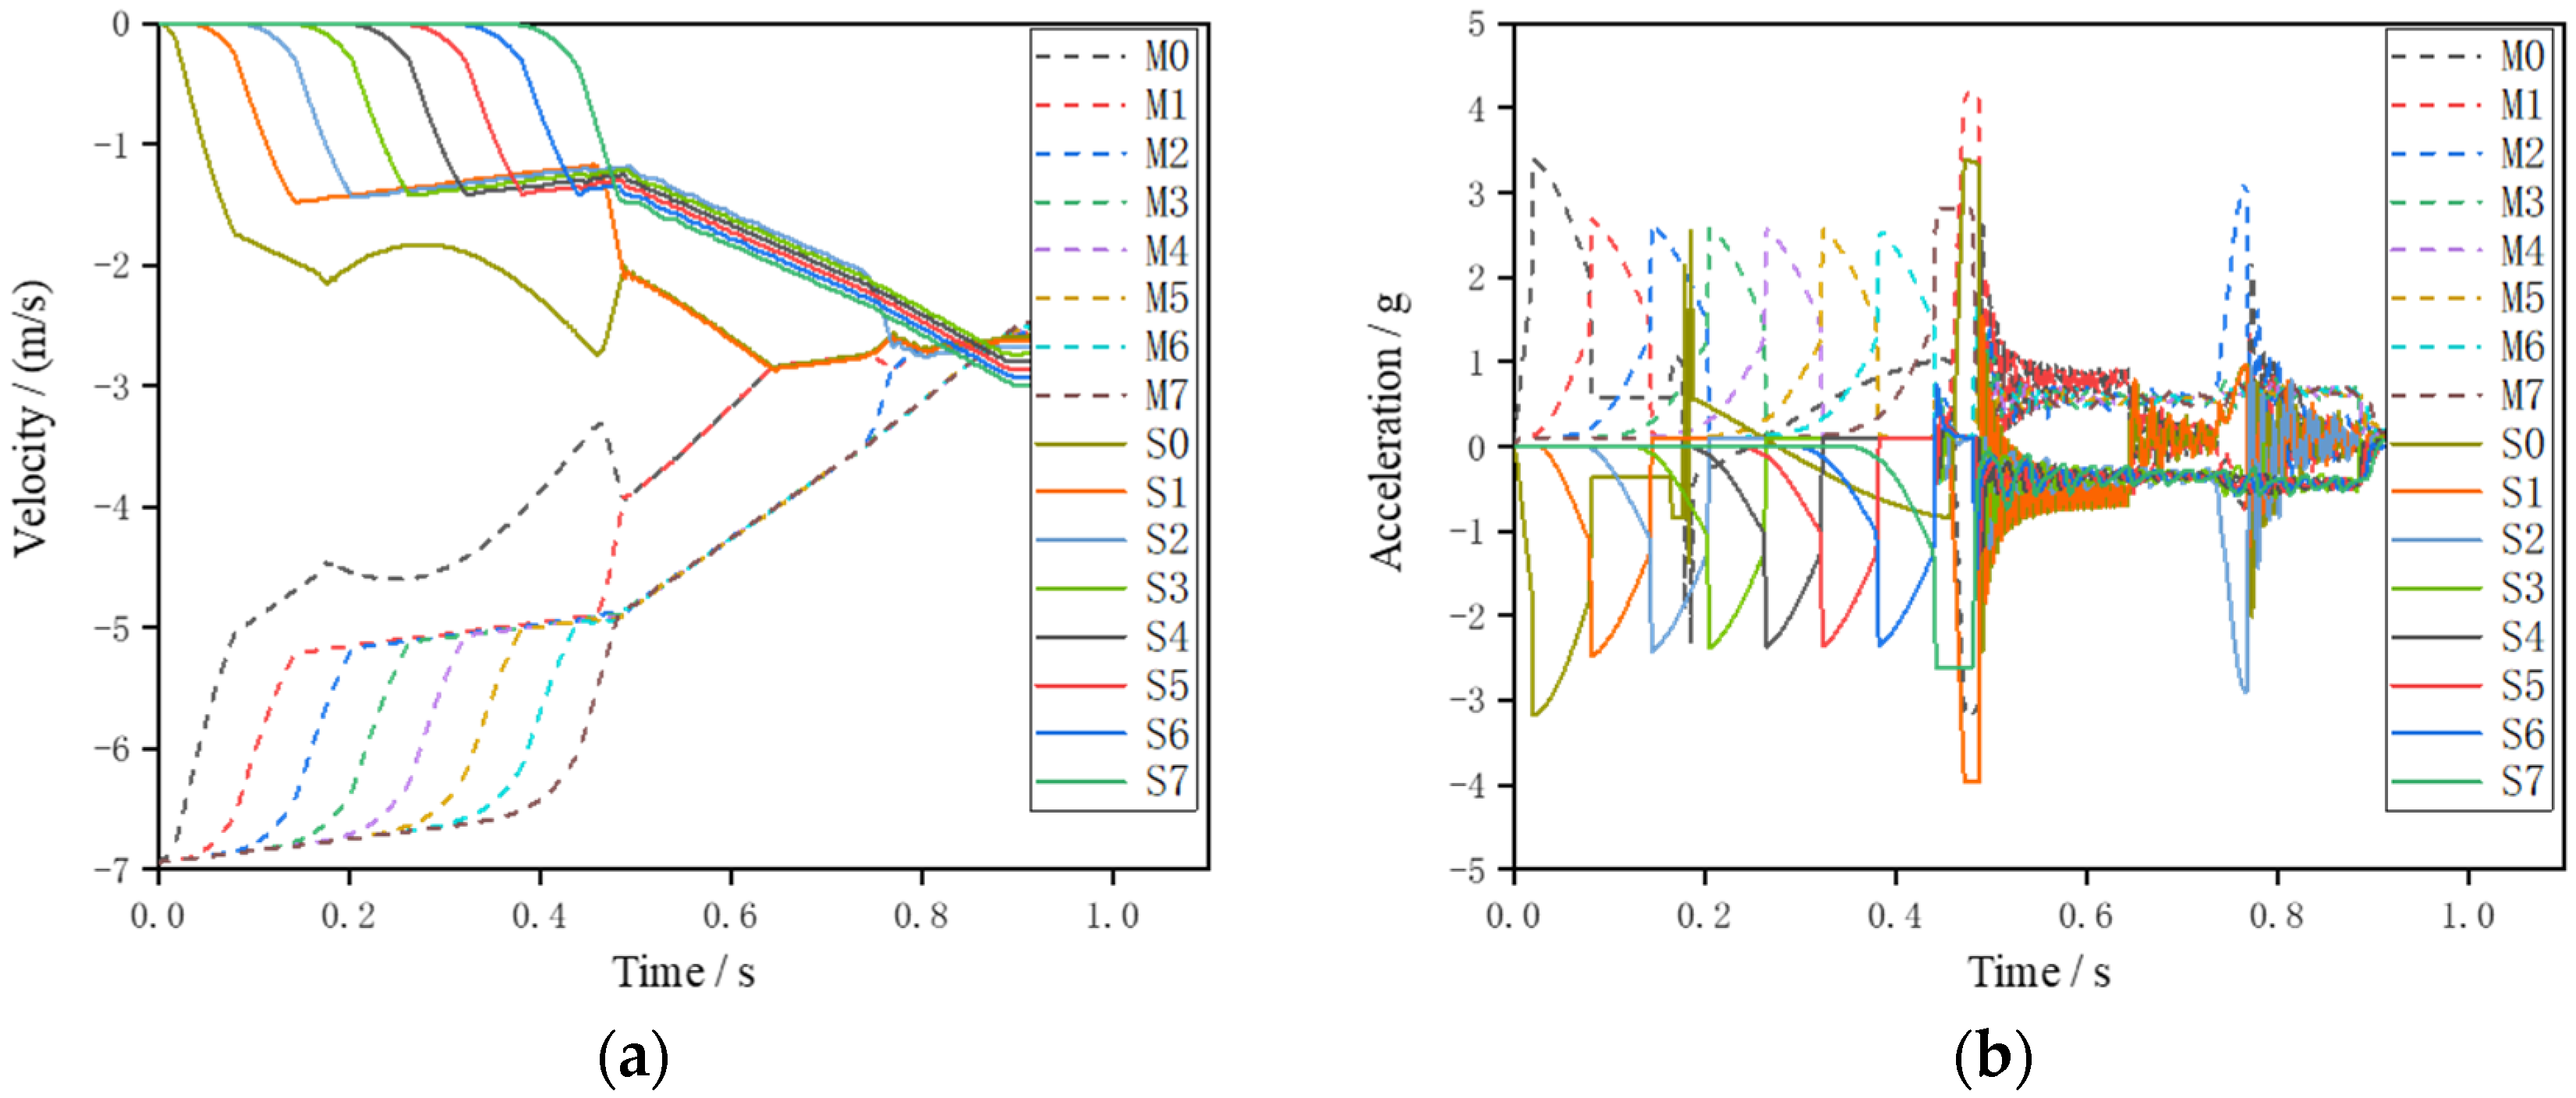
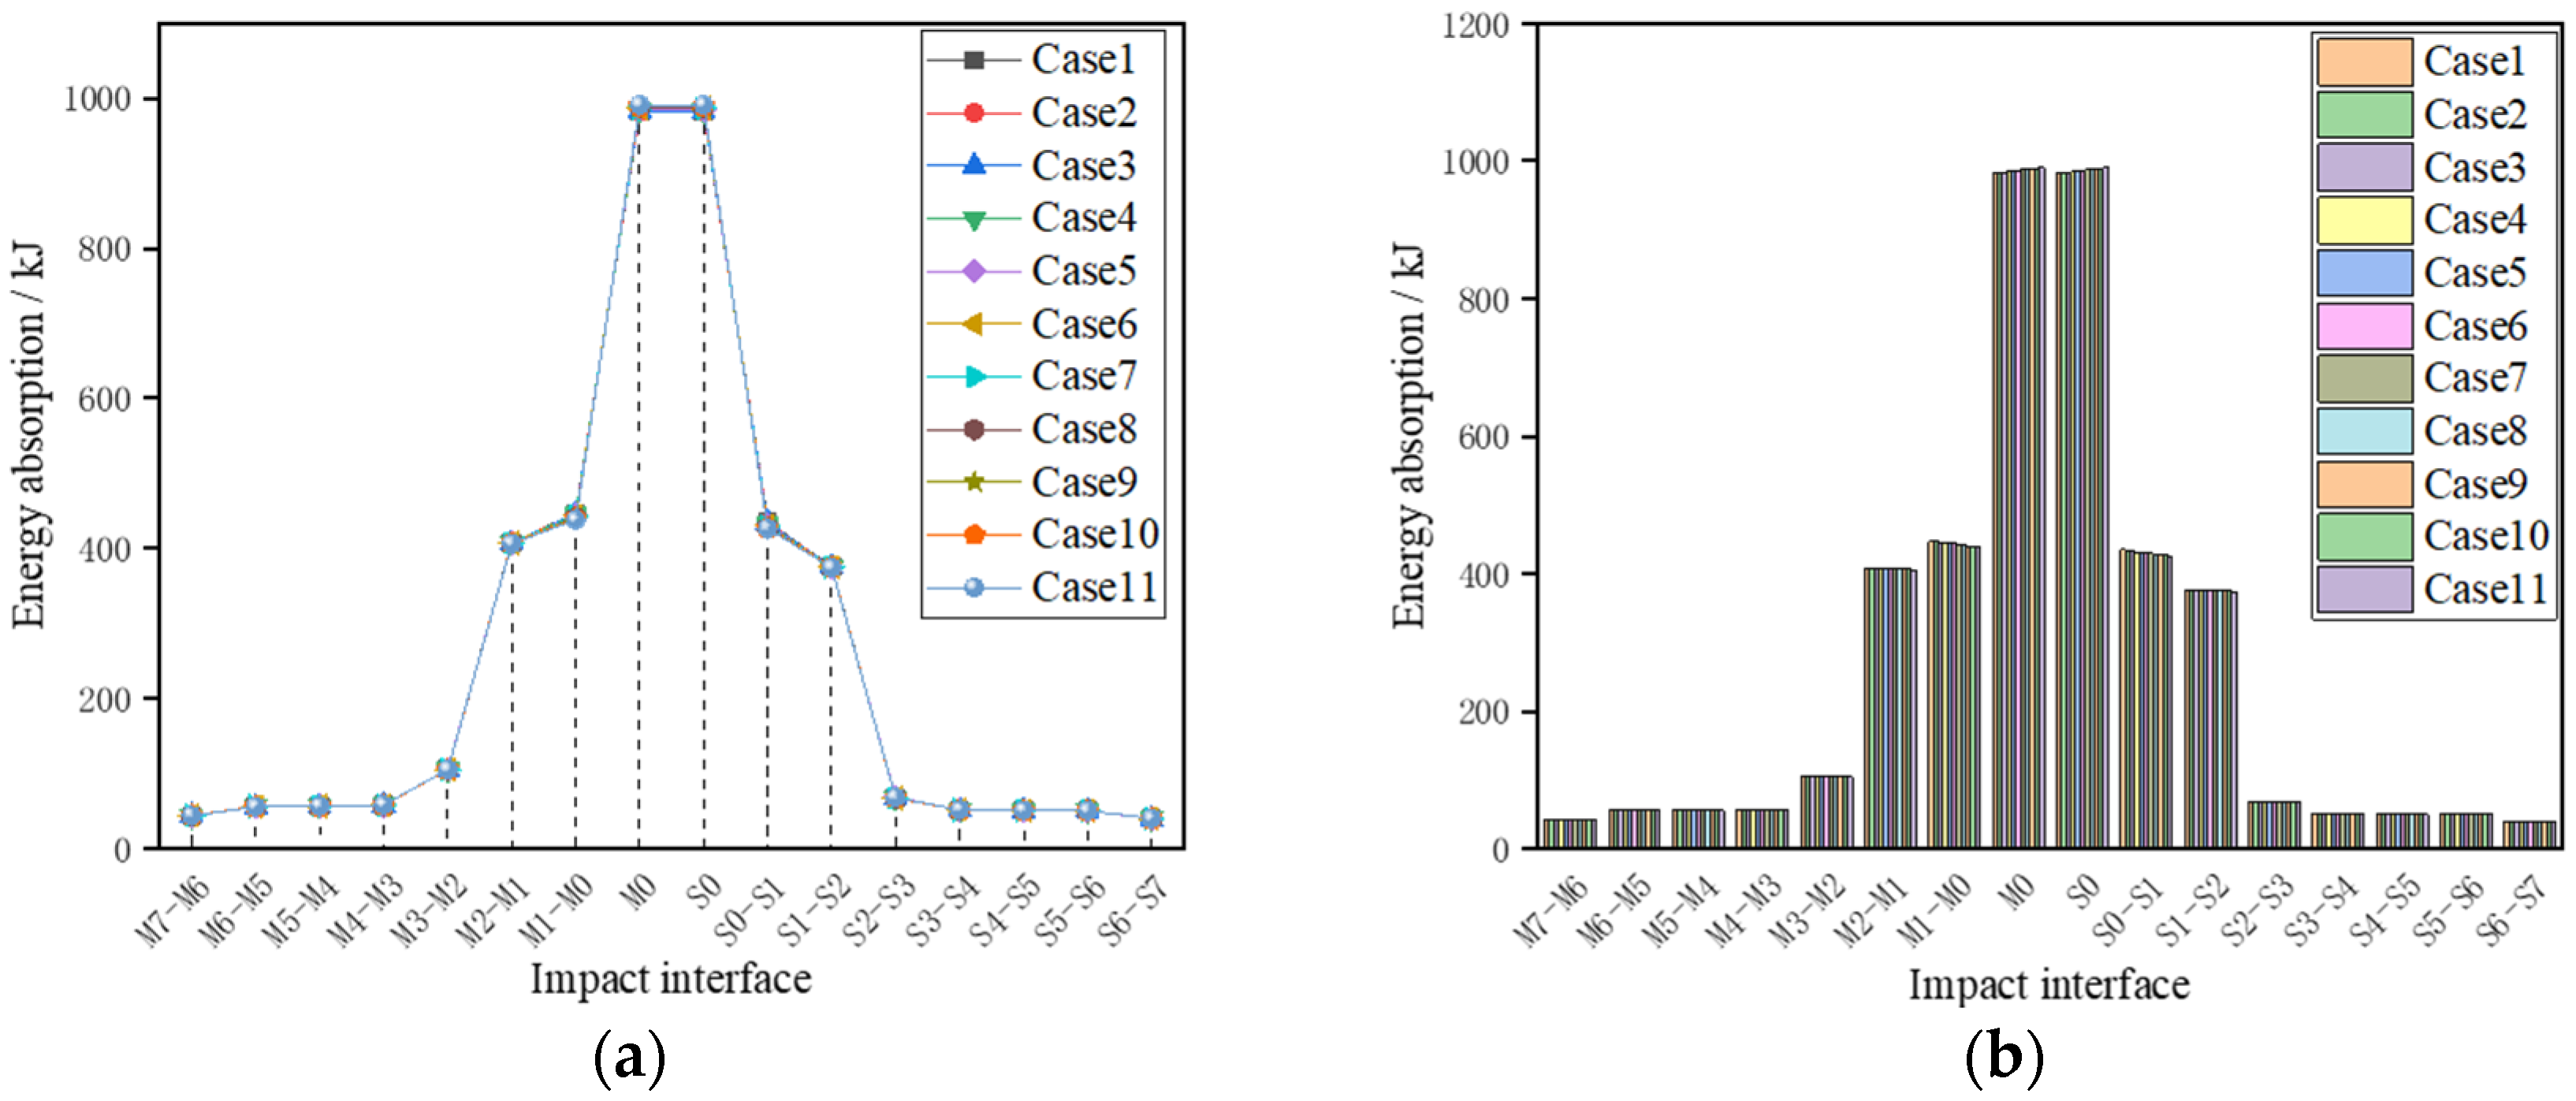
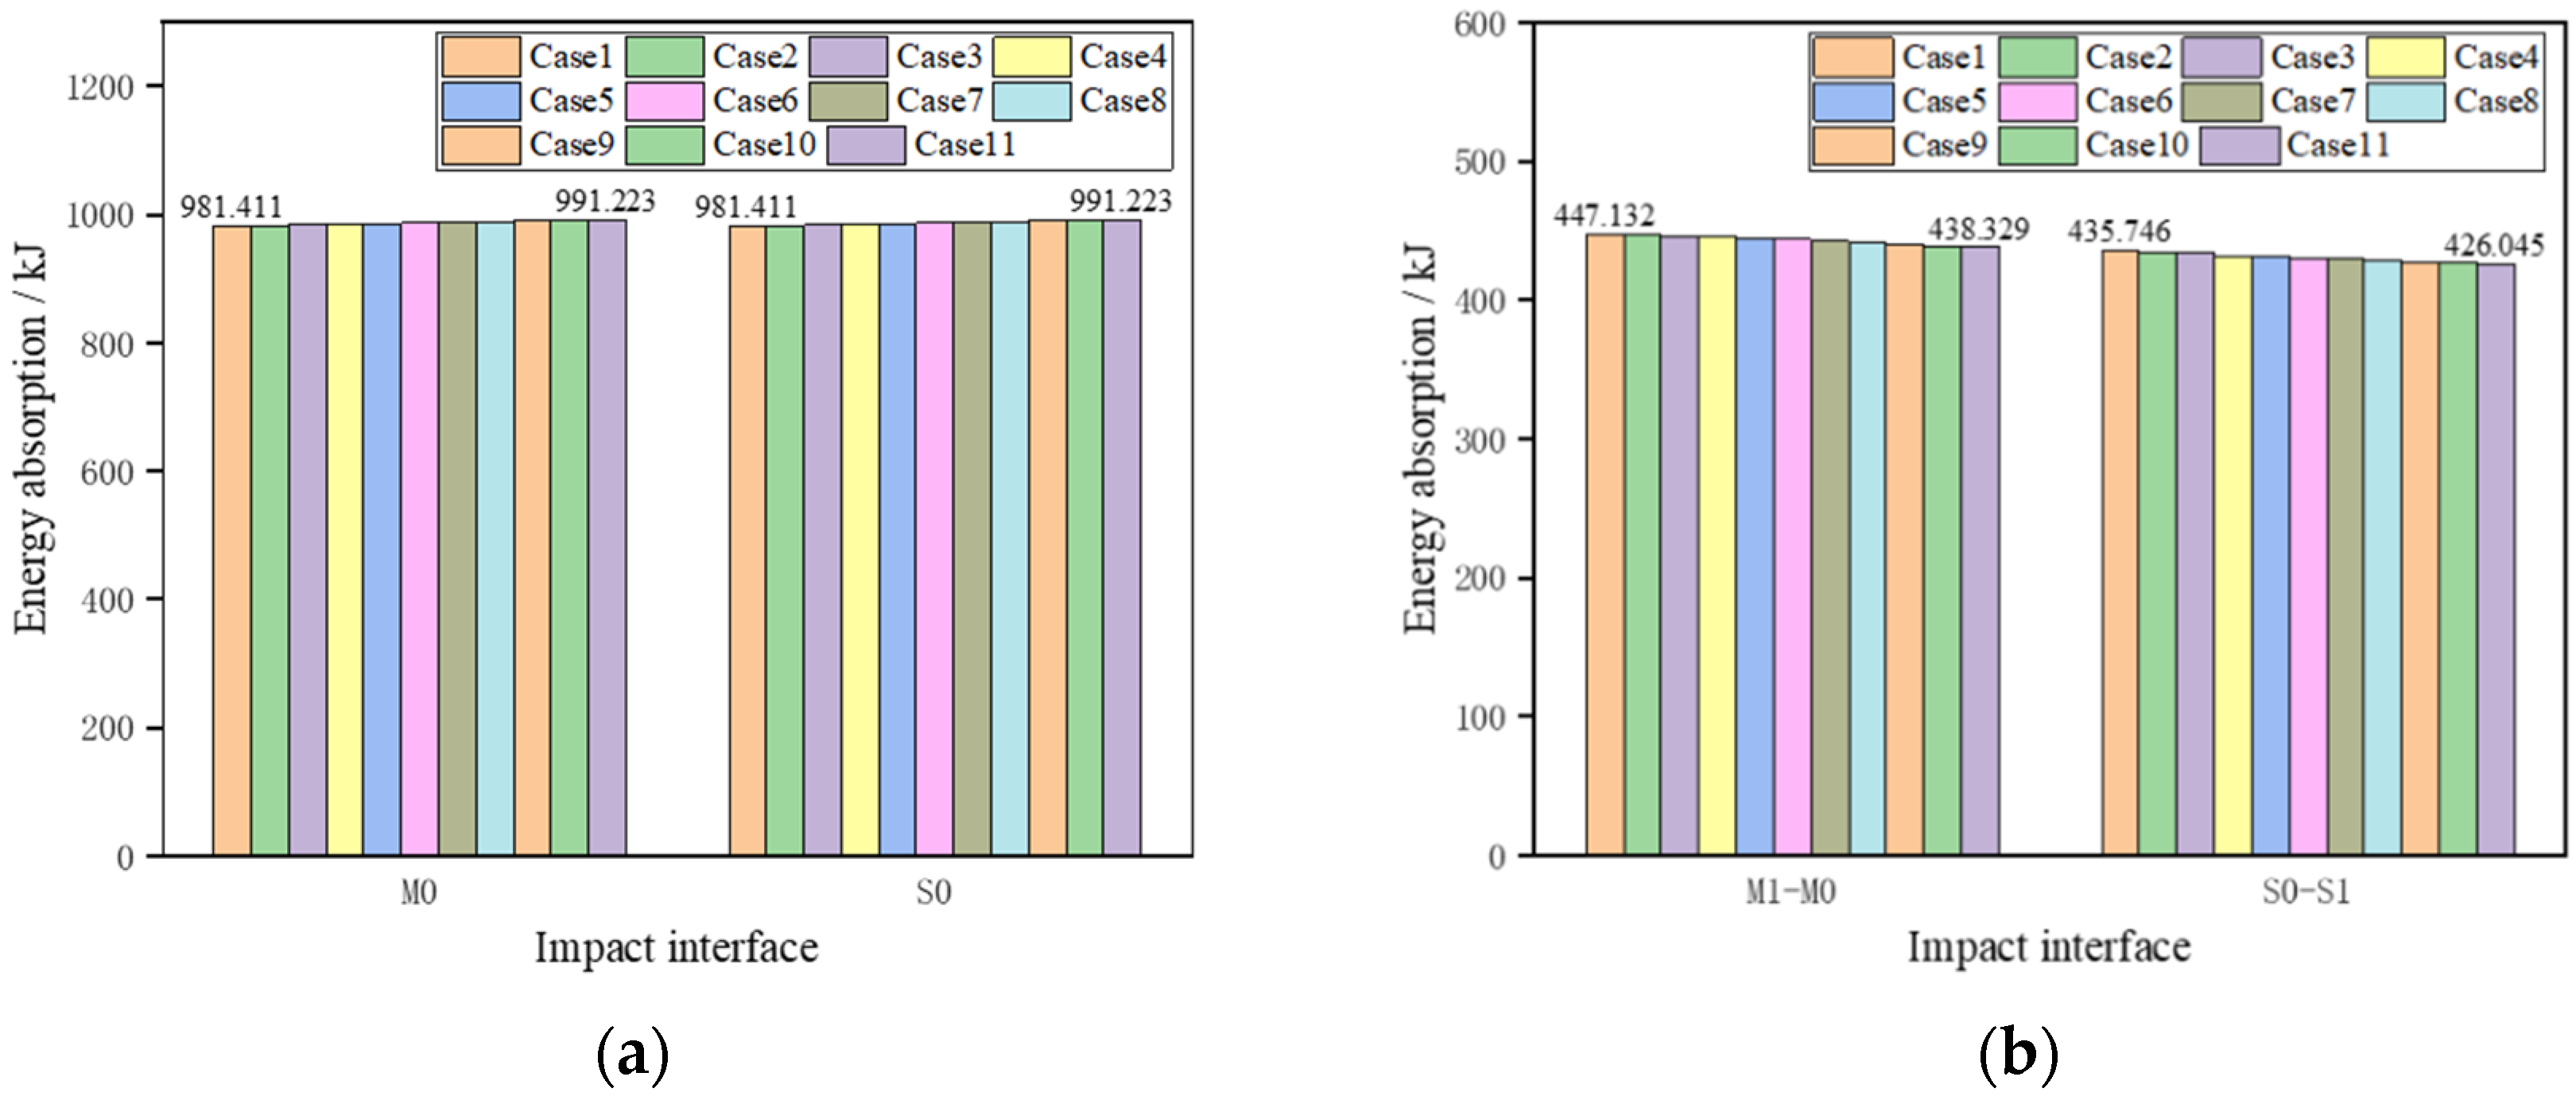
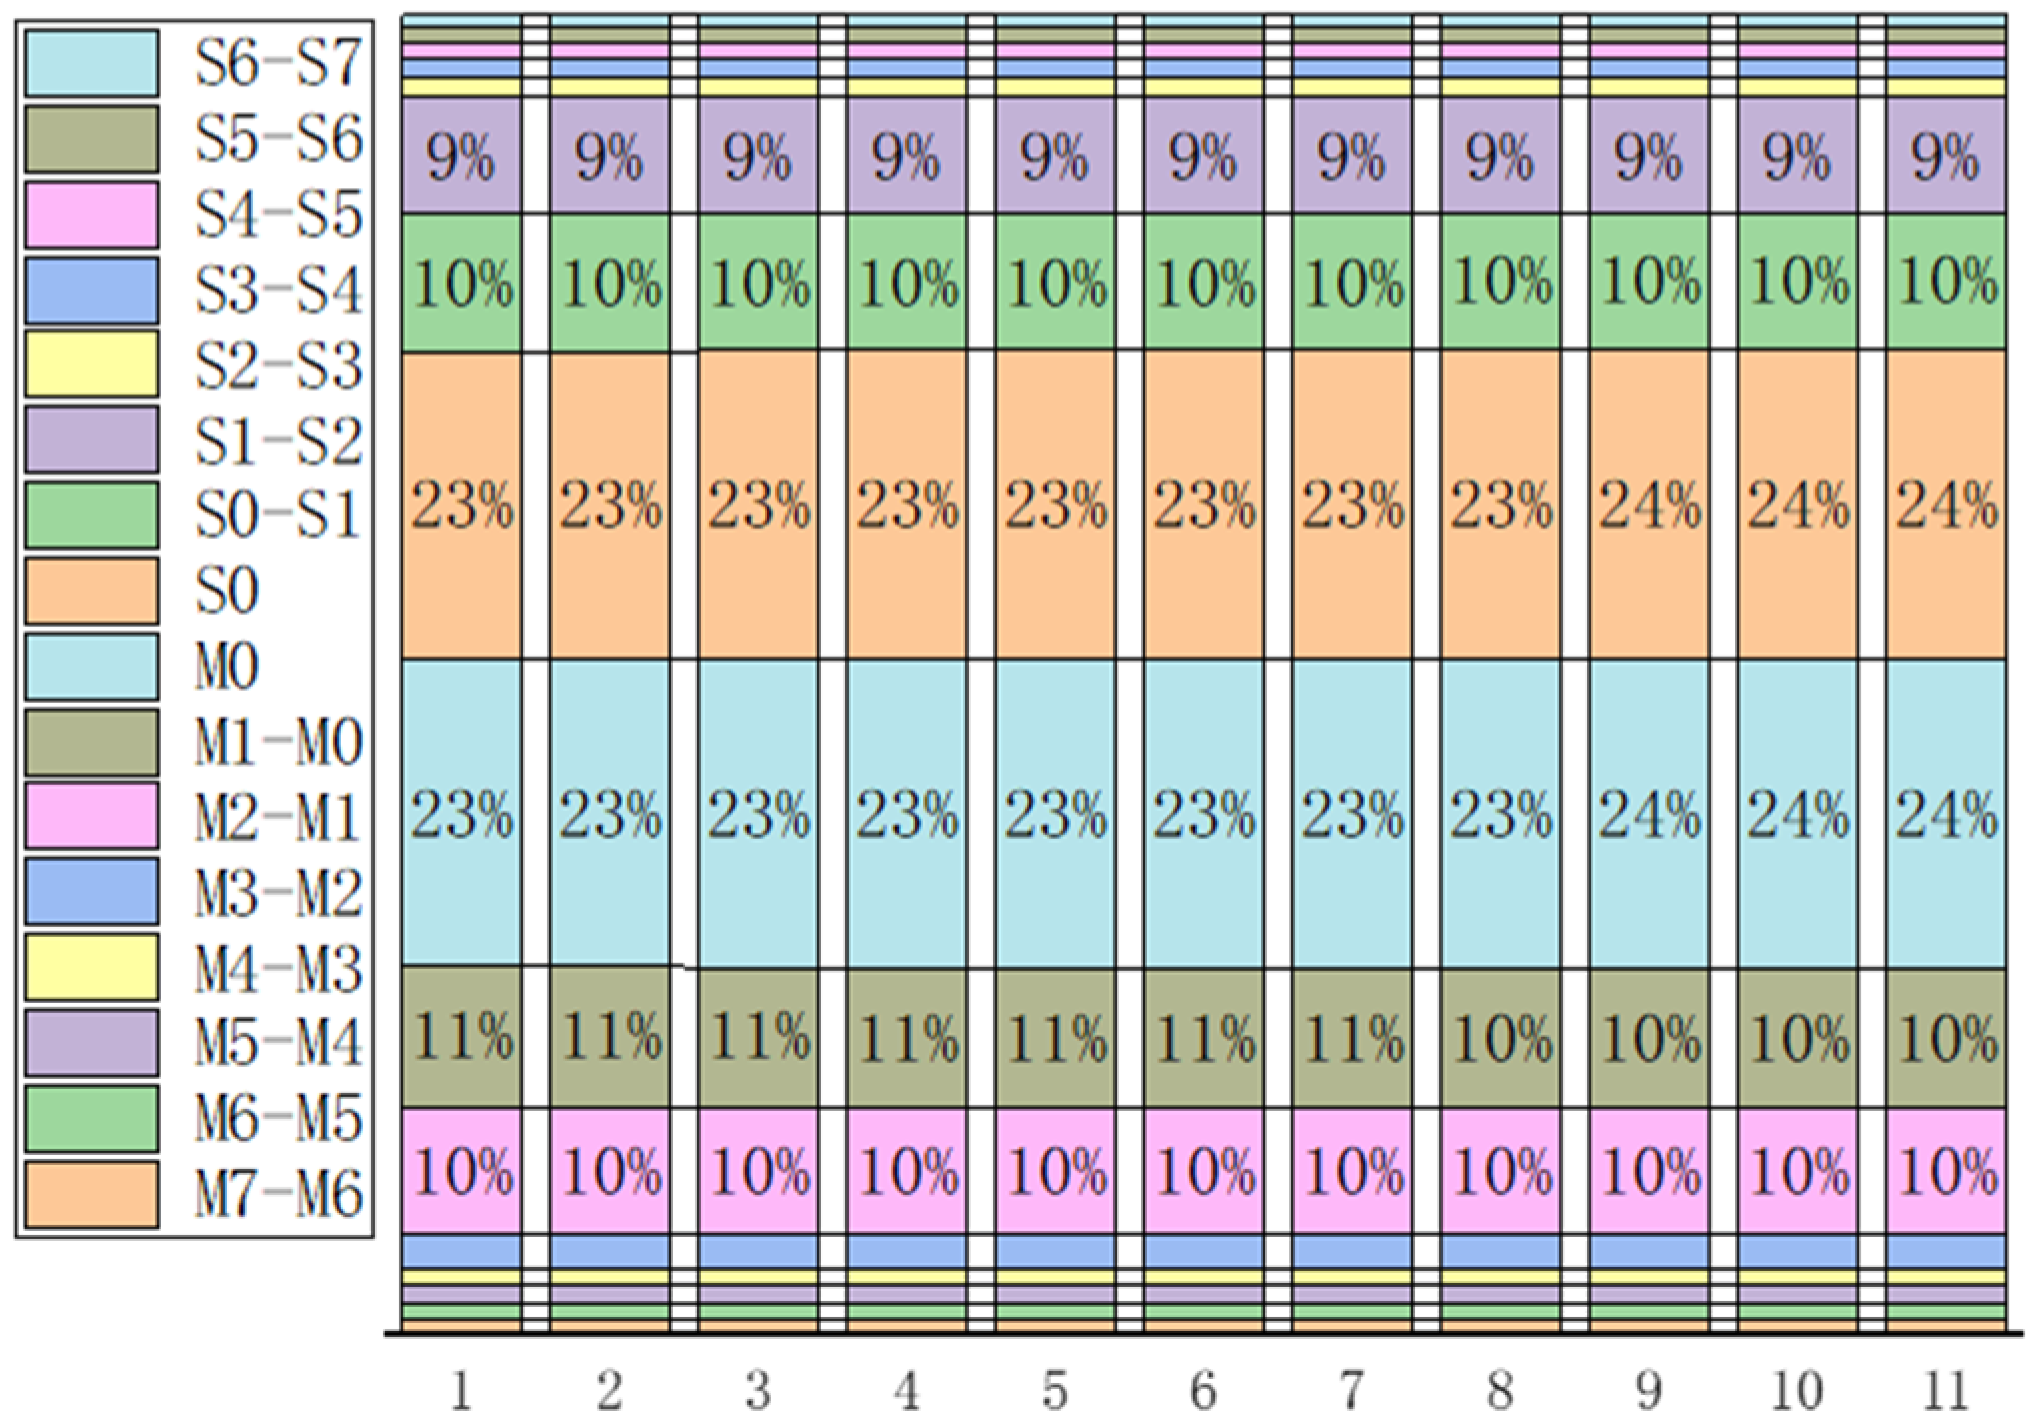
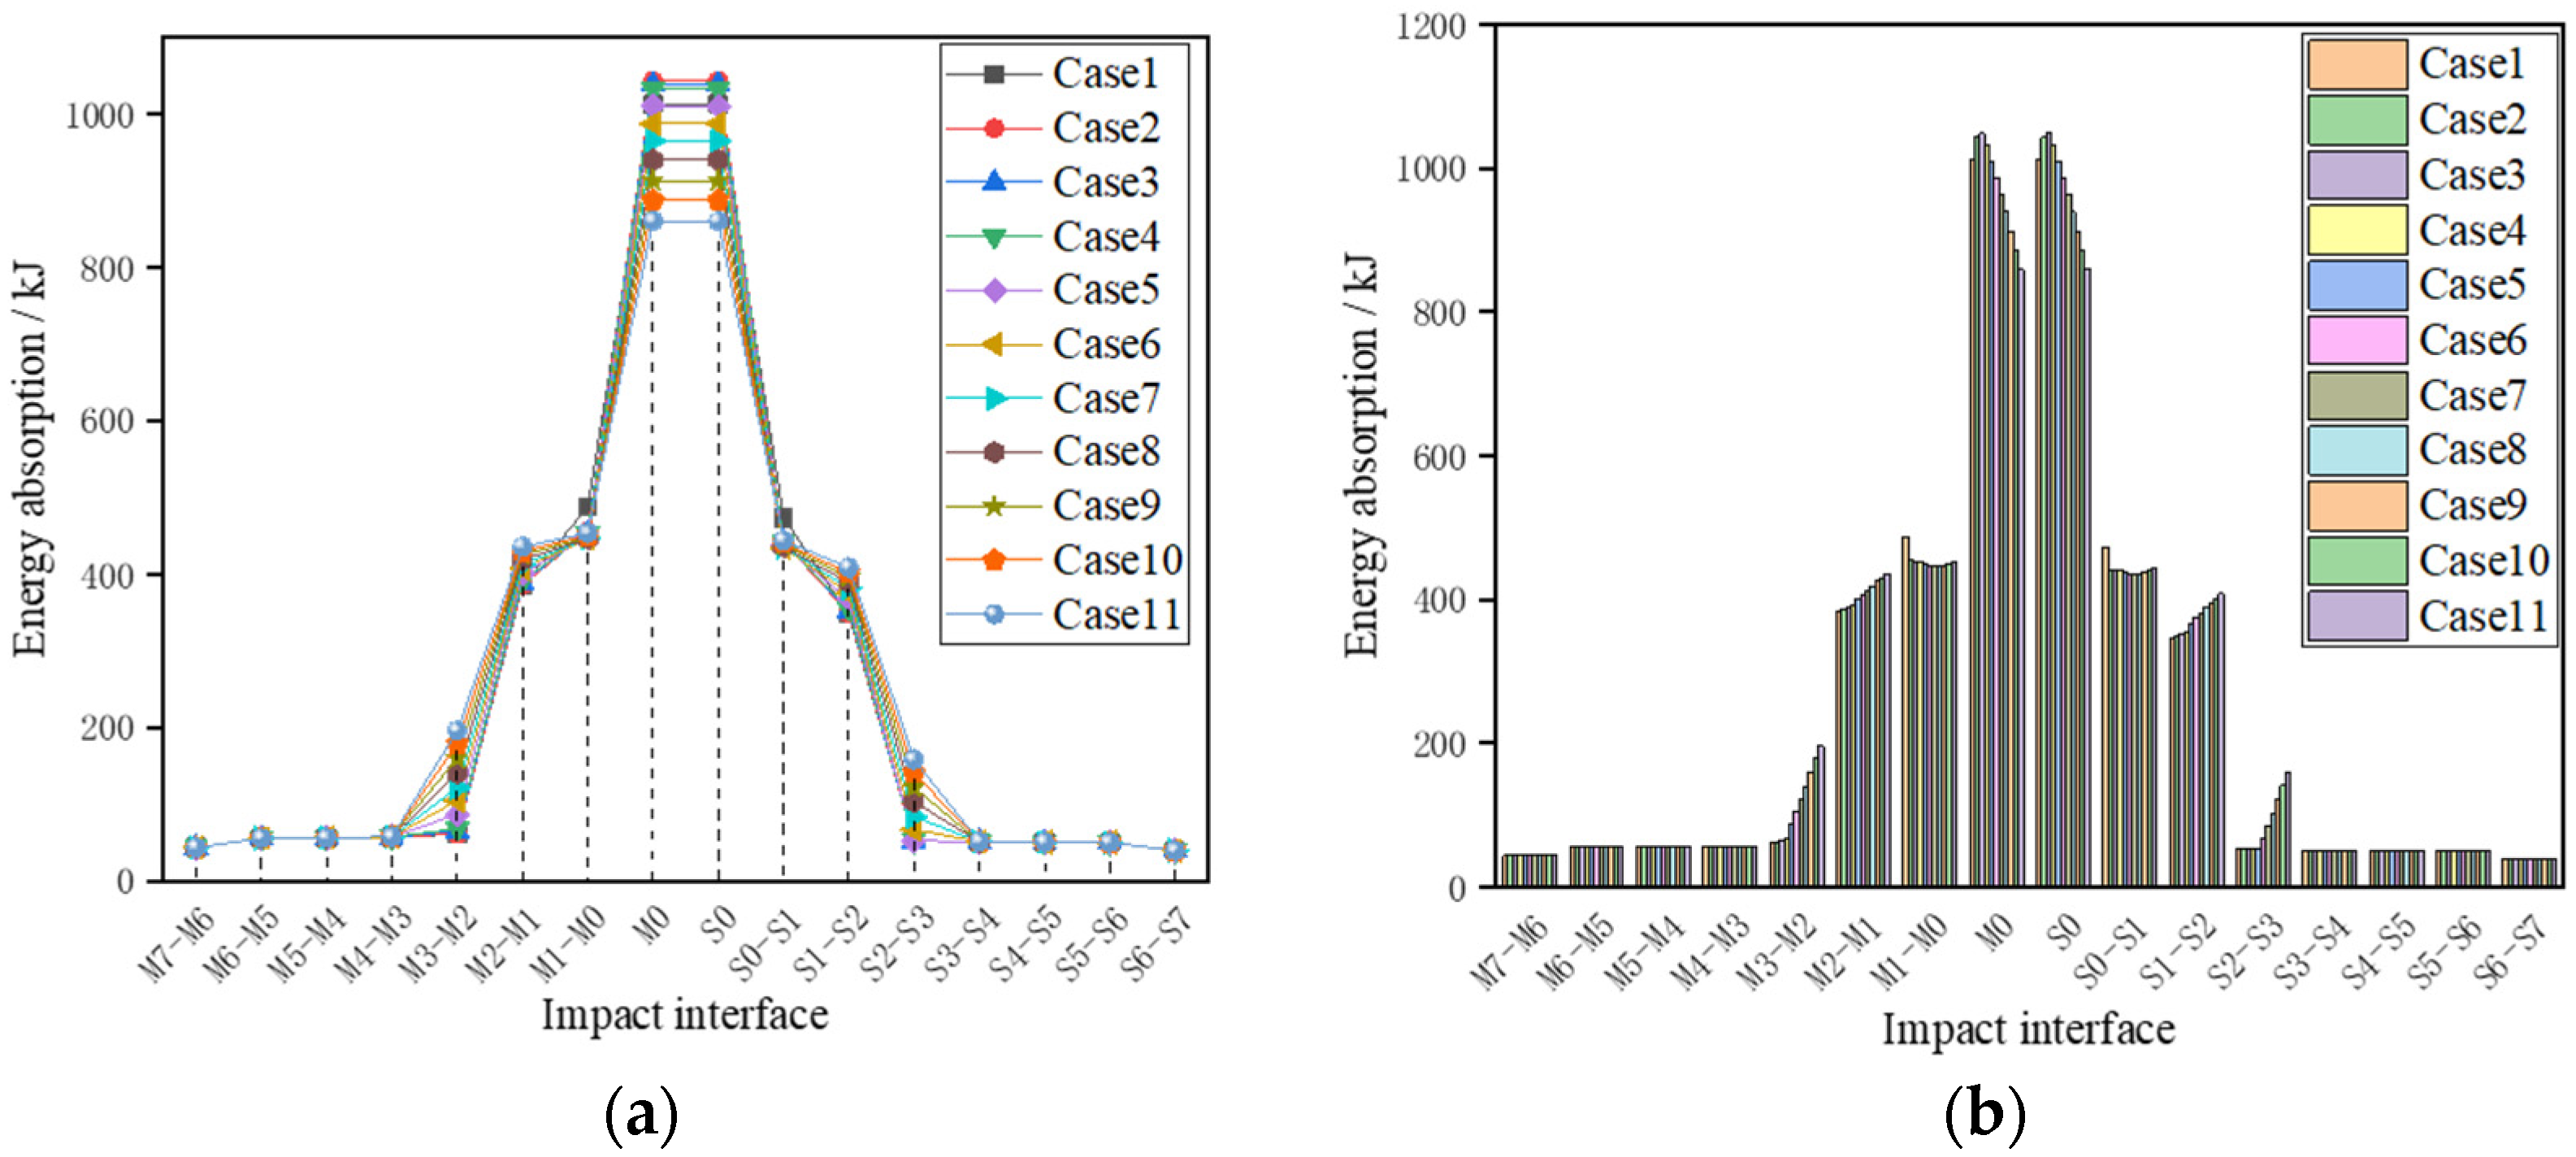
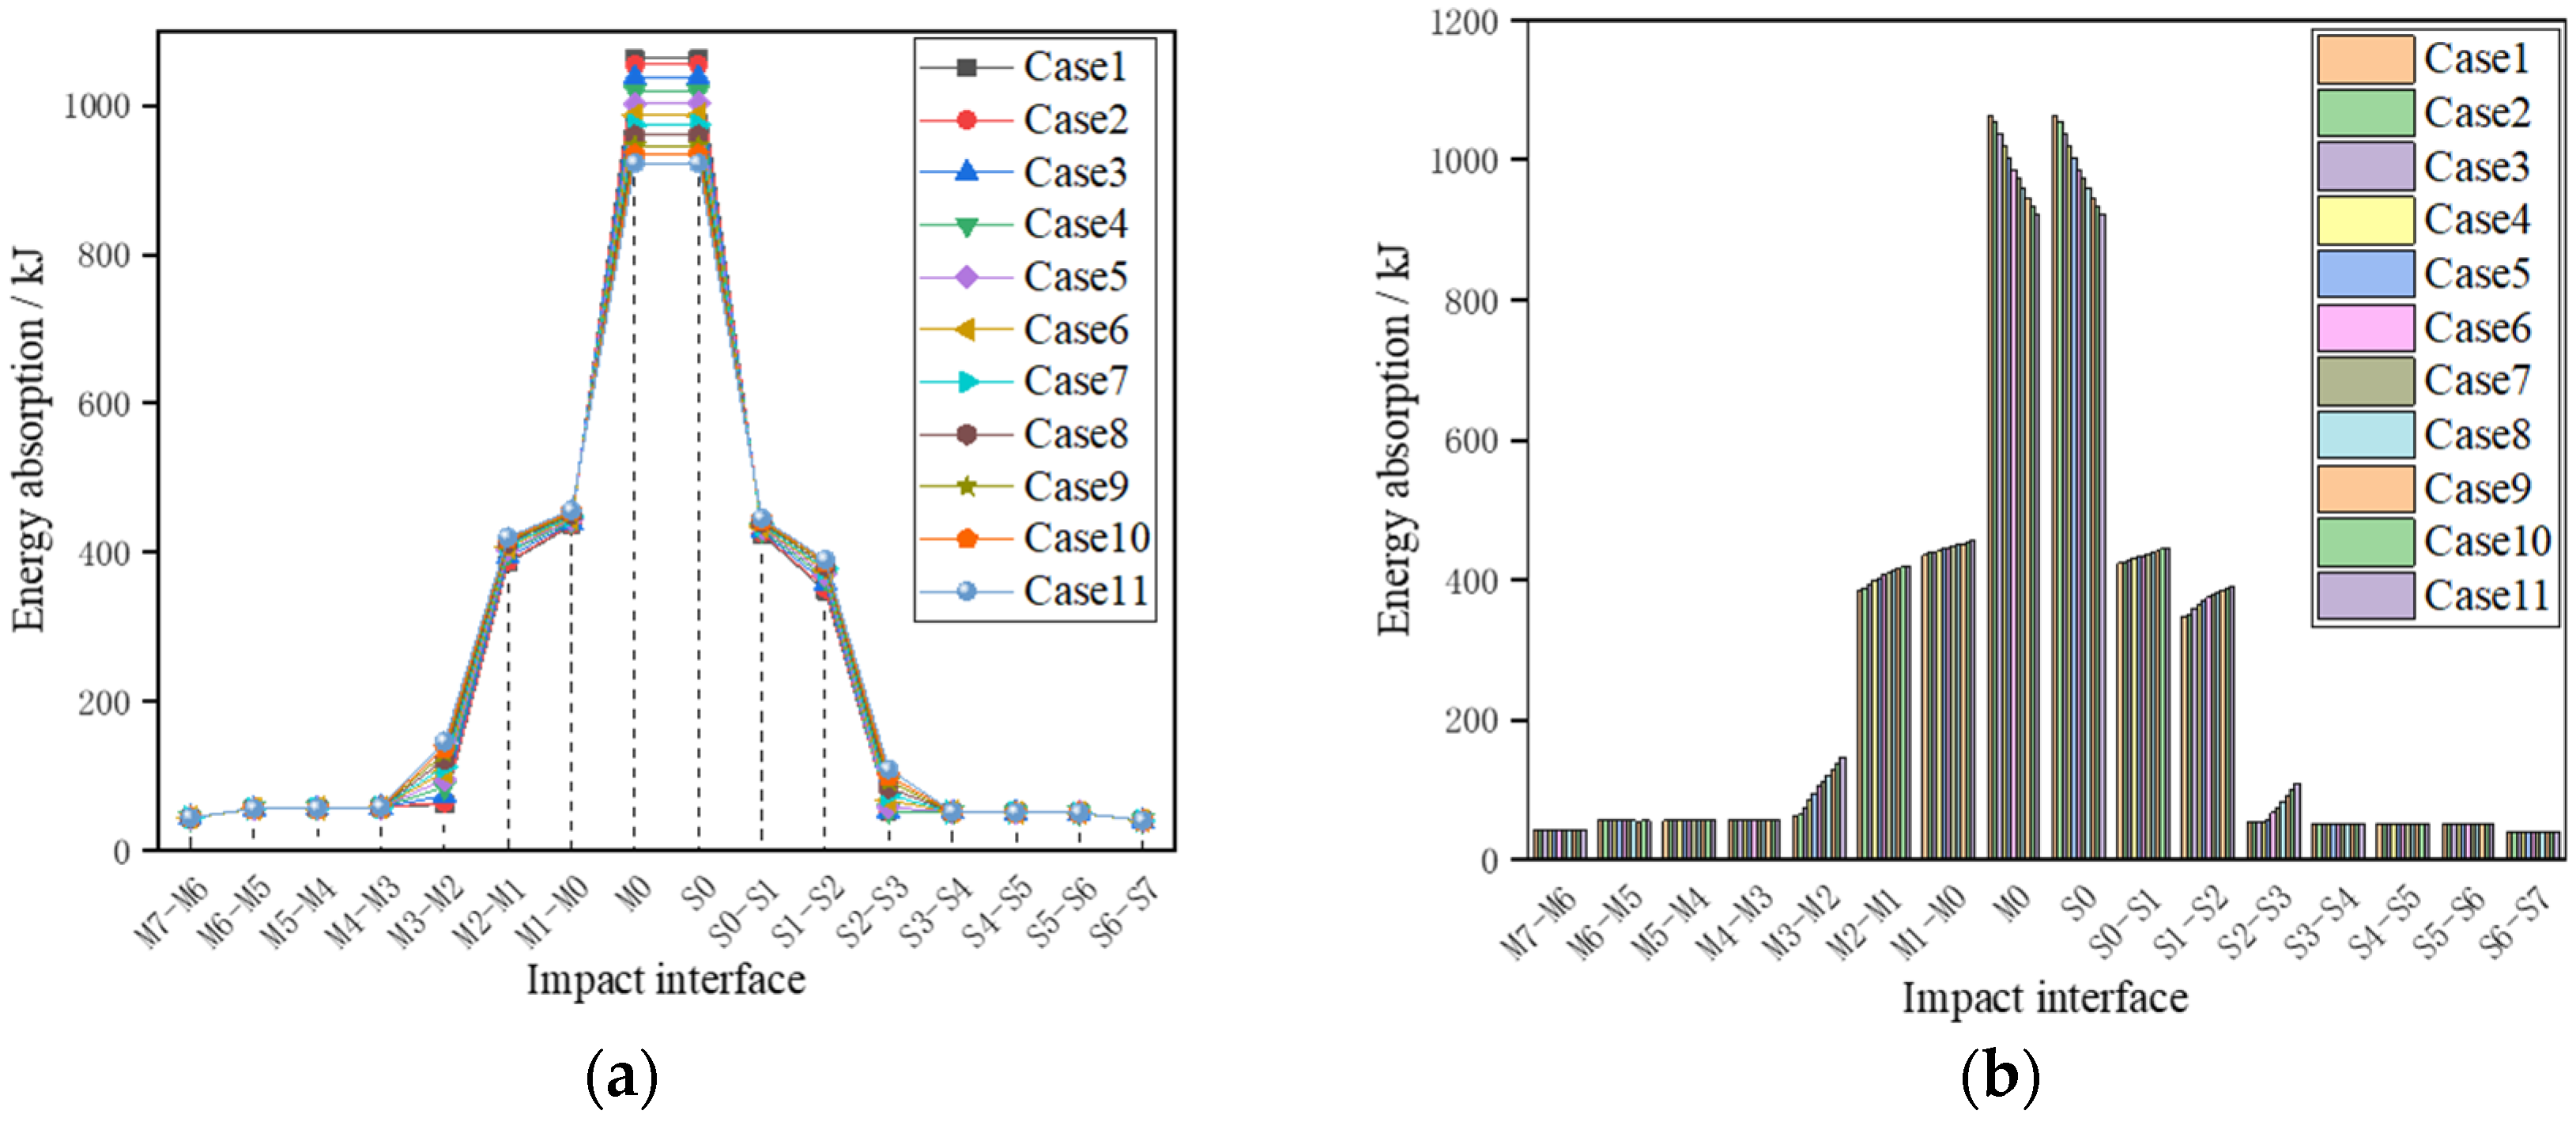
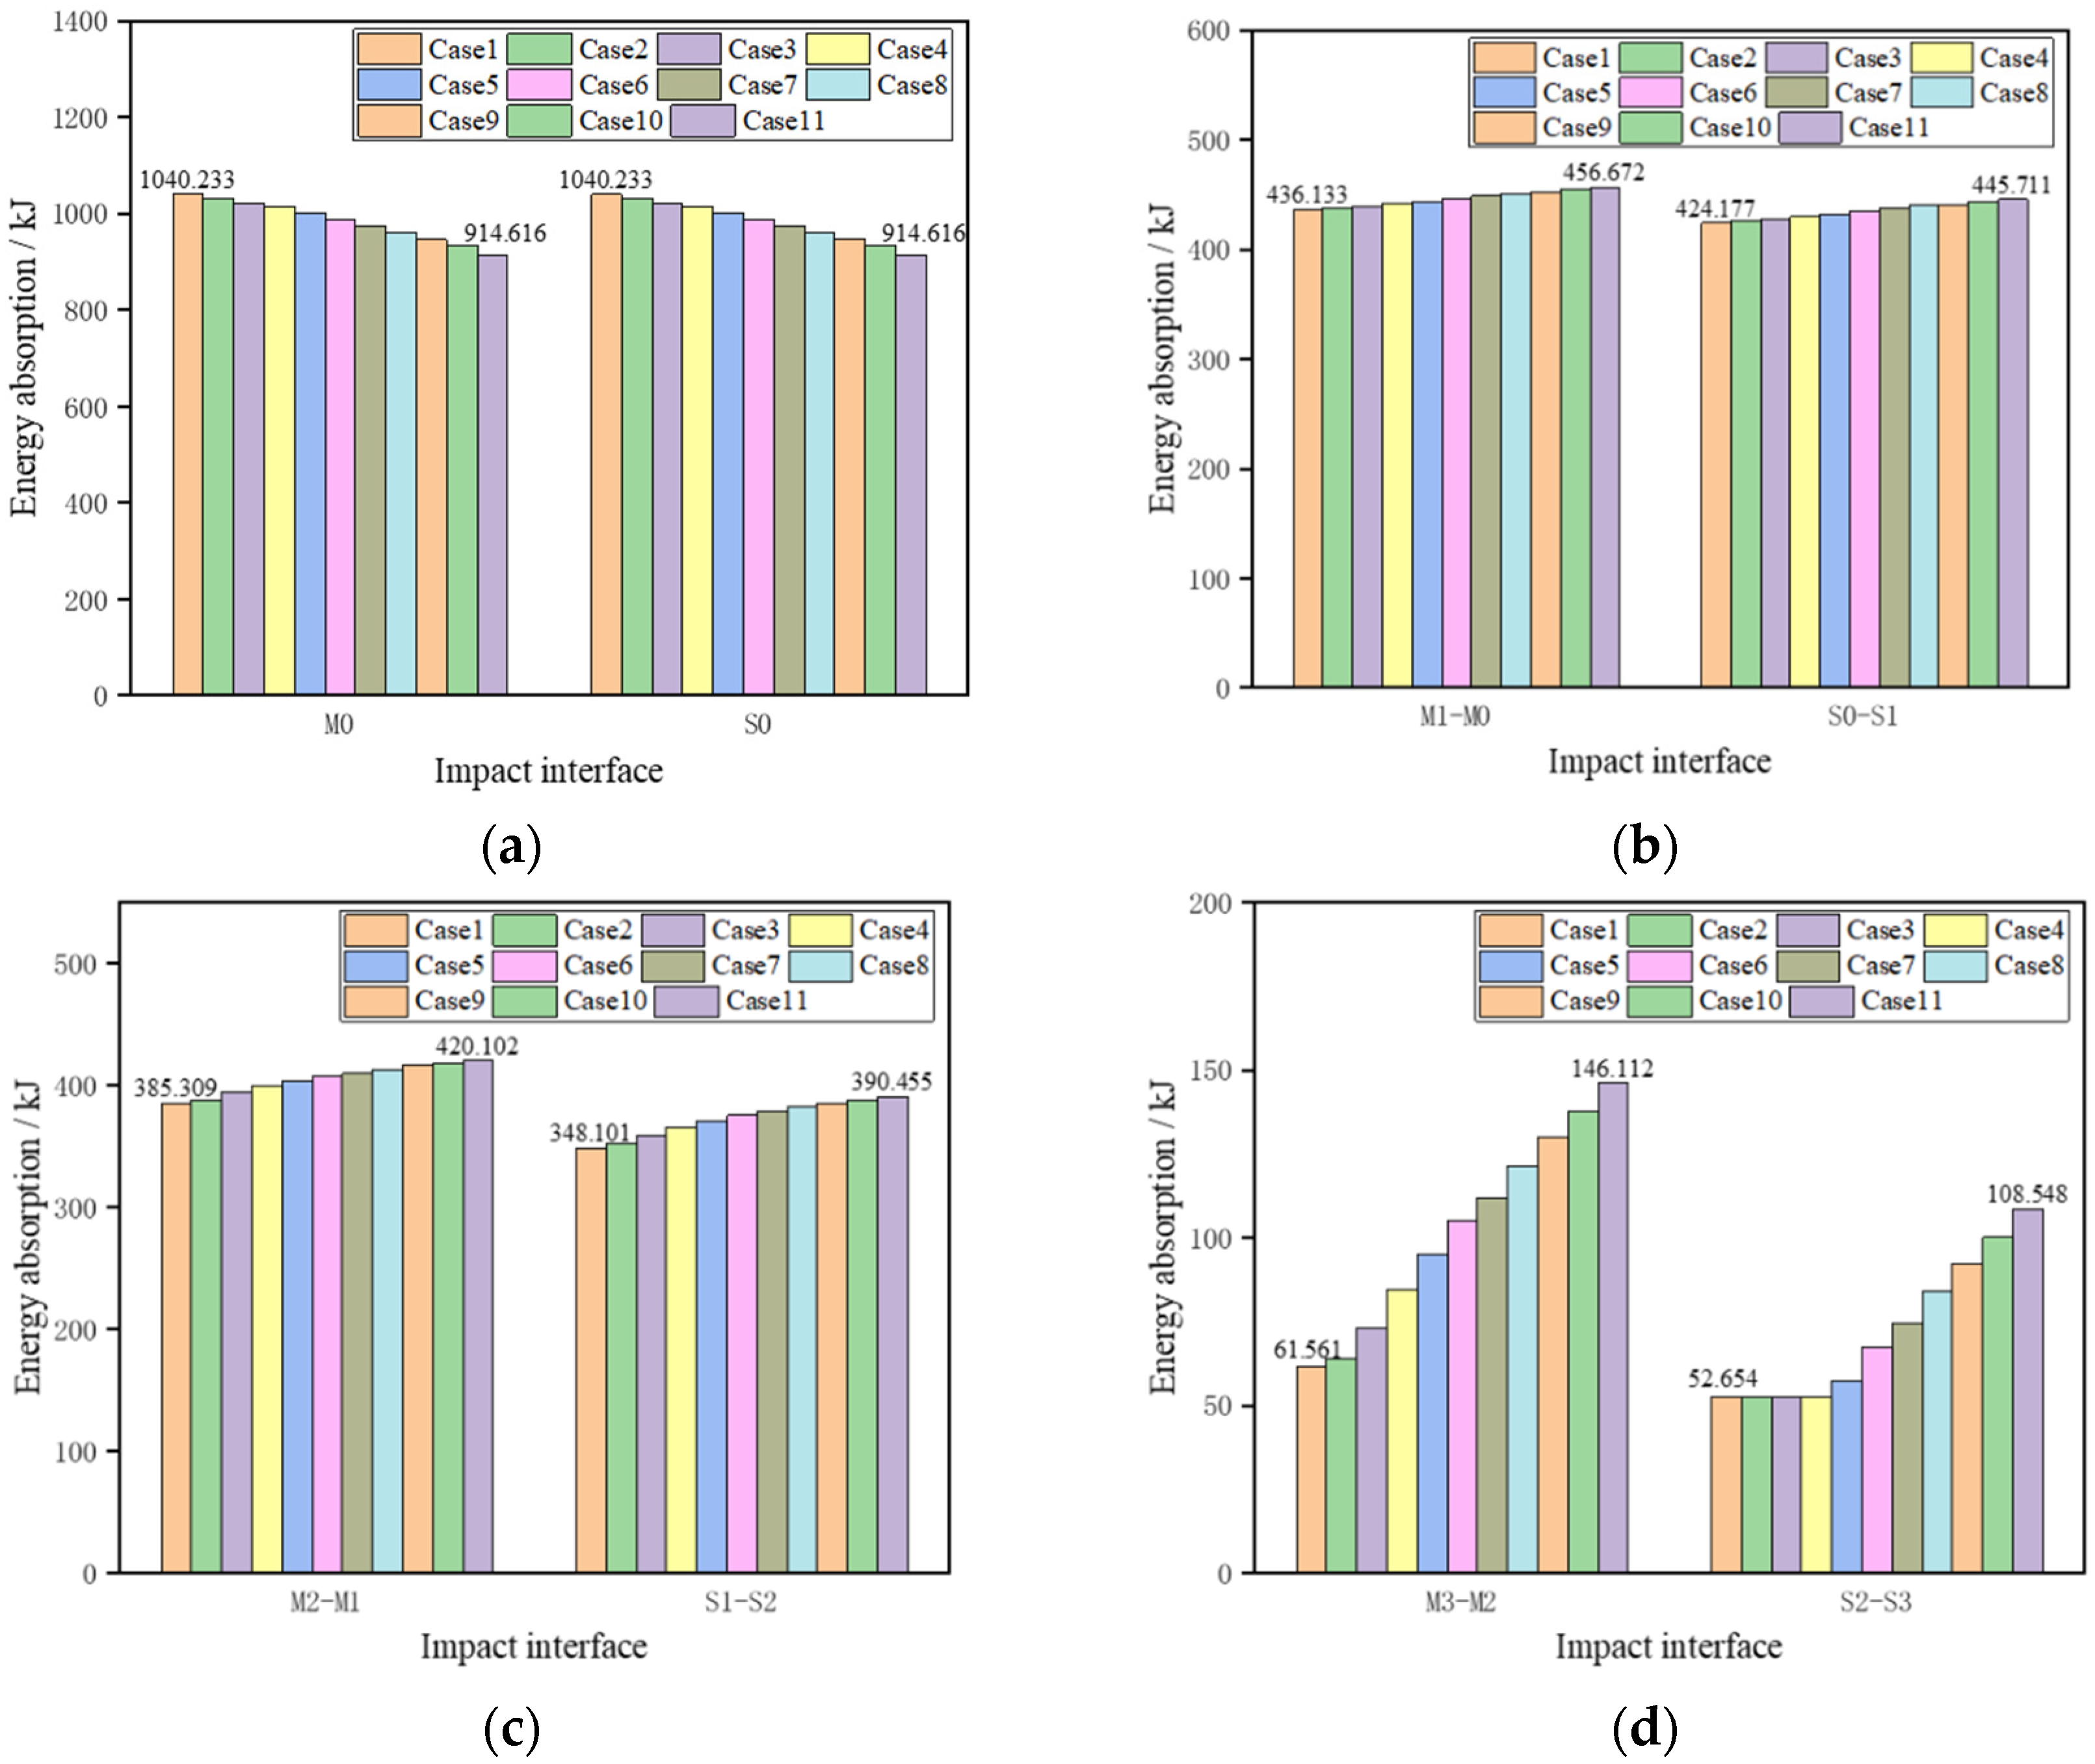
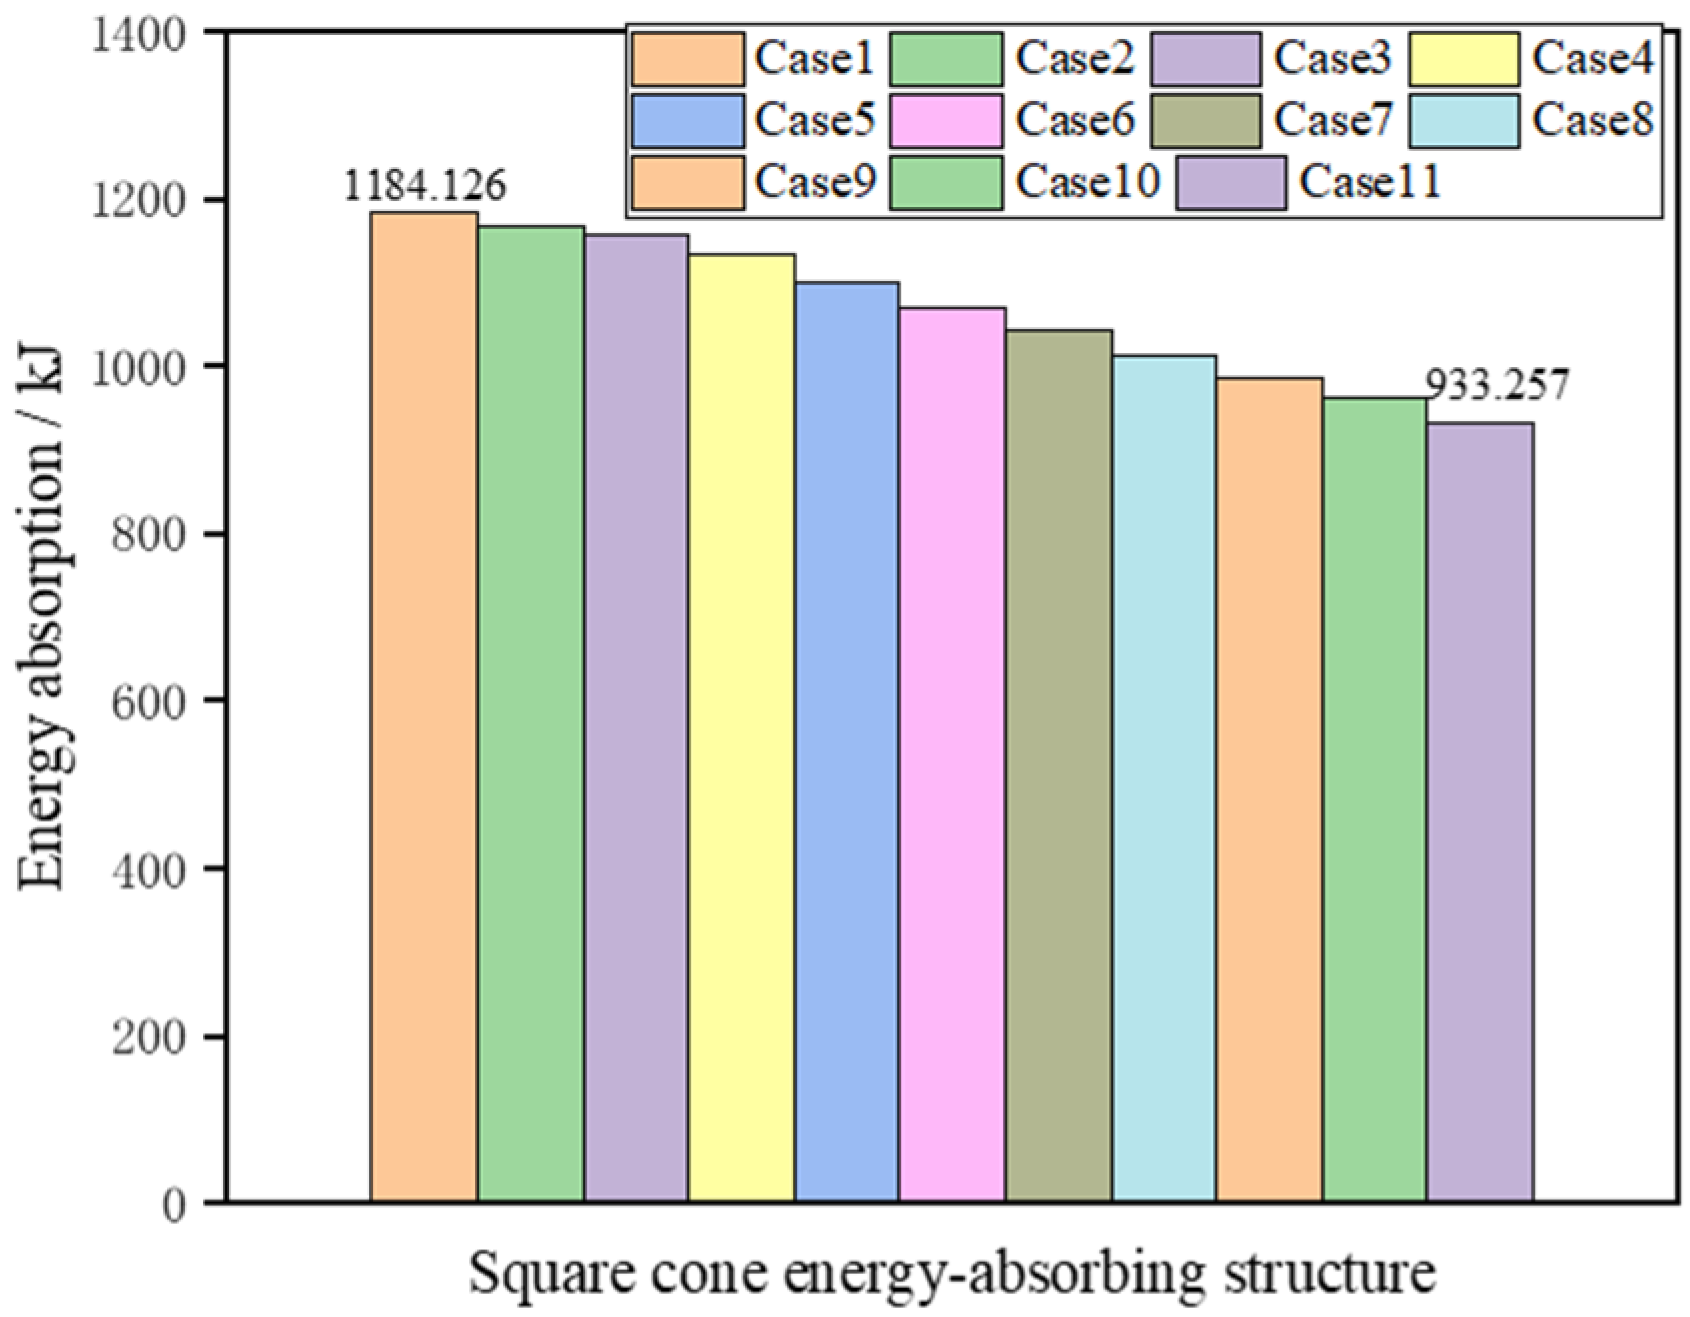
3.3. Simulation Calculation Result Analysis
4. Parameter Analysis
4.1. Influence of the Initial Peak Force
4.2. Influence of the Platform Force
4.3. Influence of the Slope of Platform Force
5. Multi-Objective Optimization Design
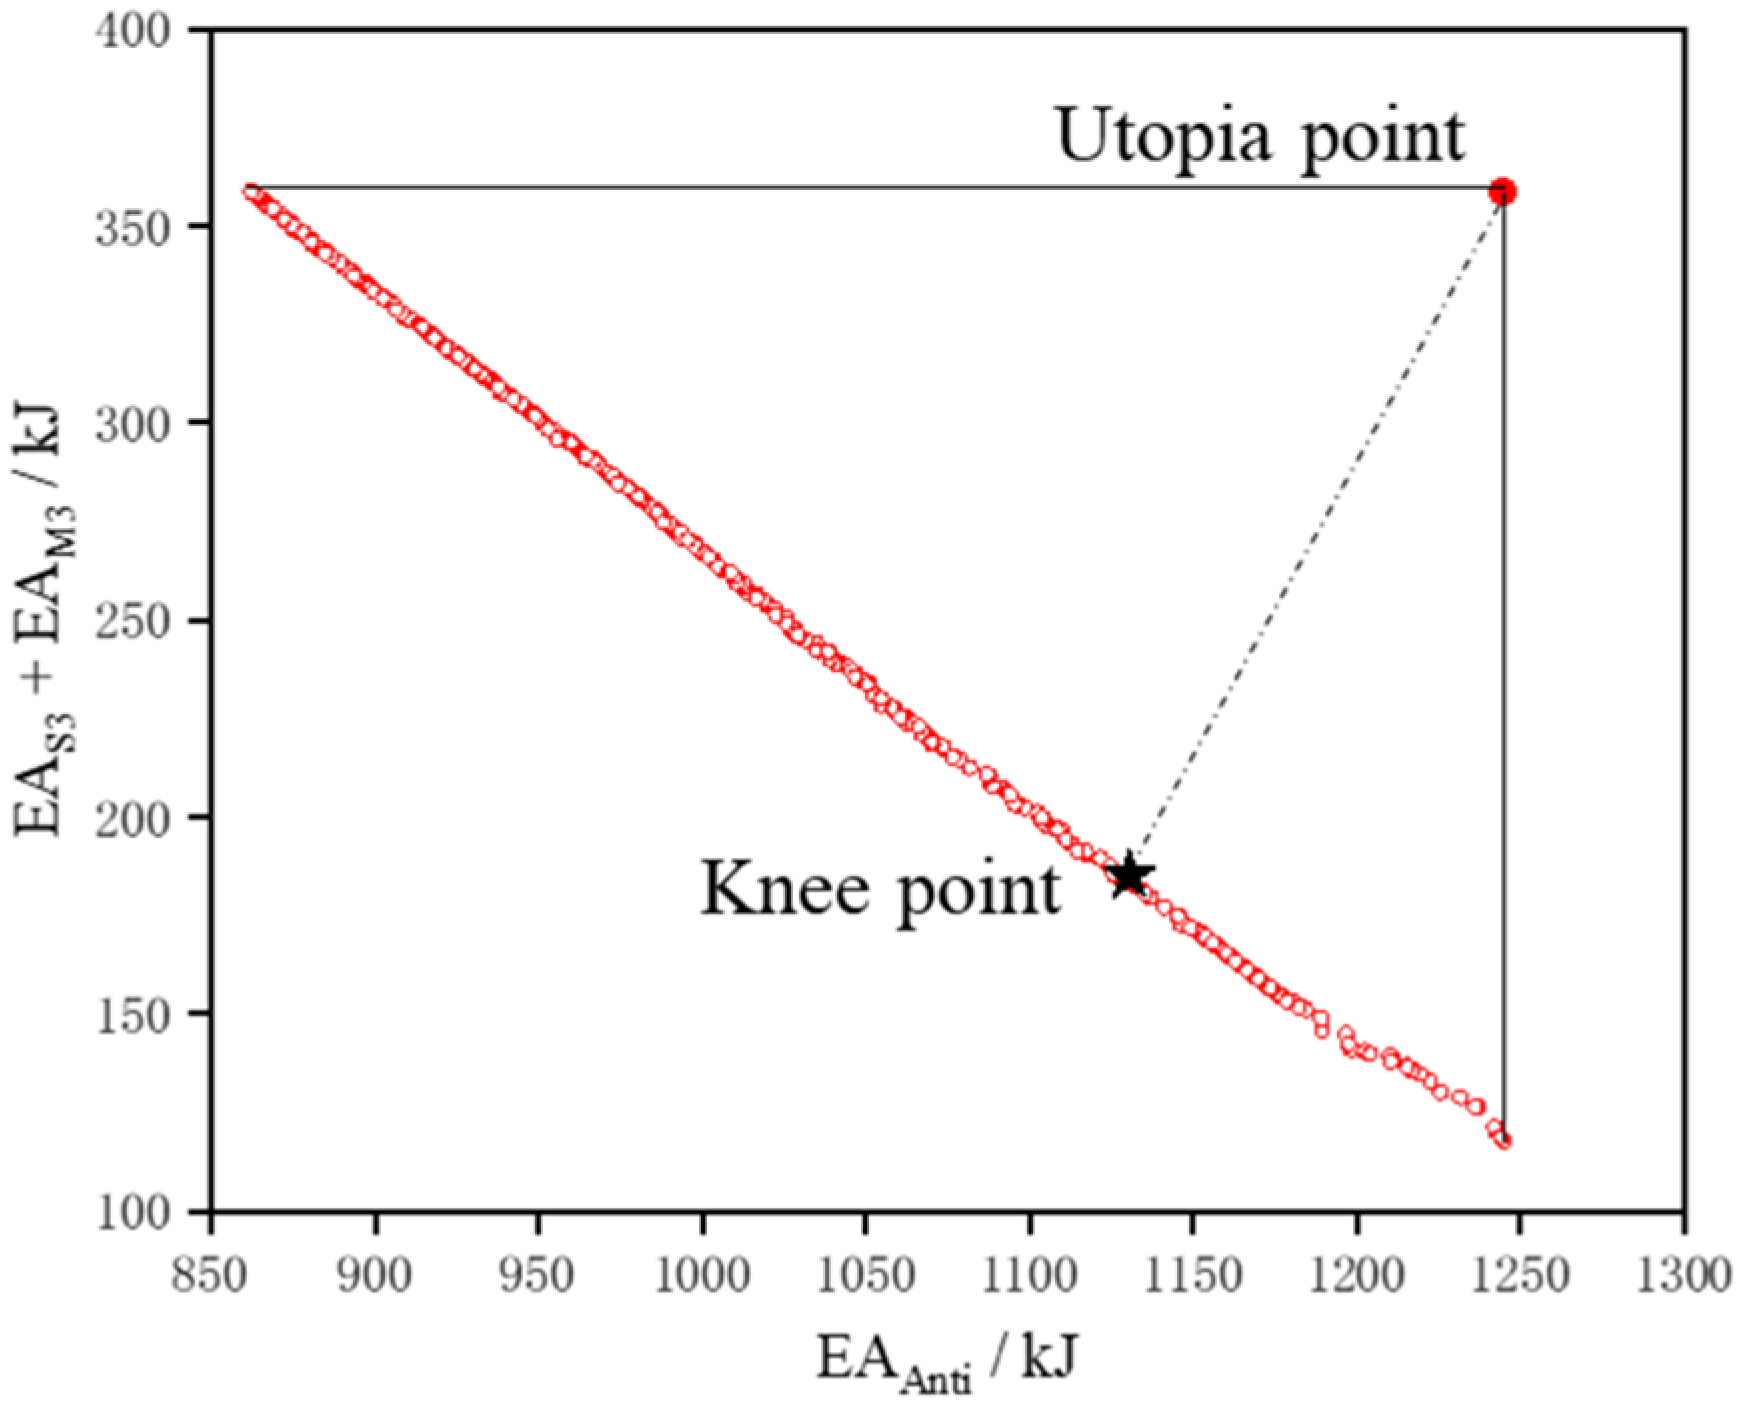
5.1. Definition of Optimization Problems
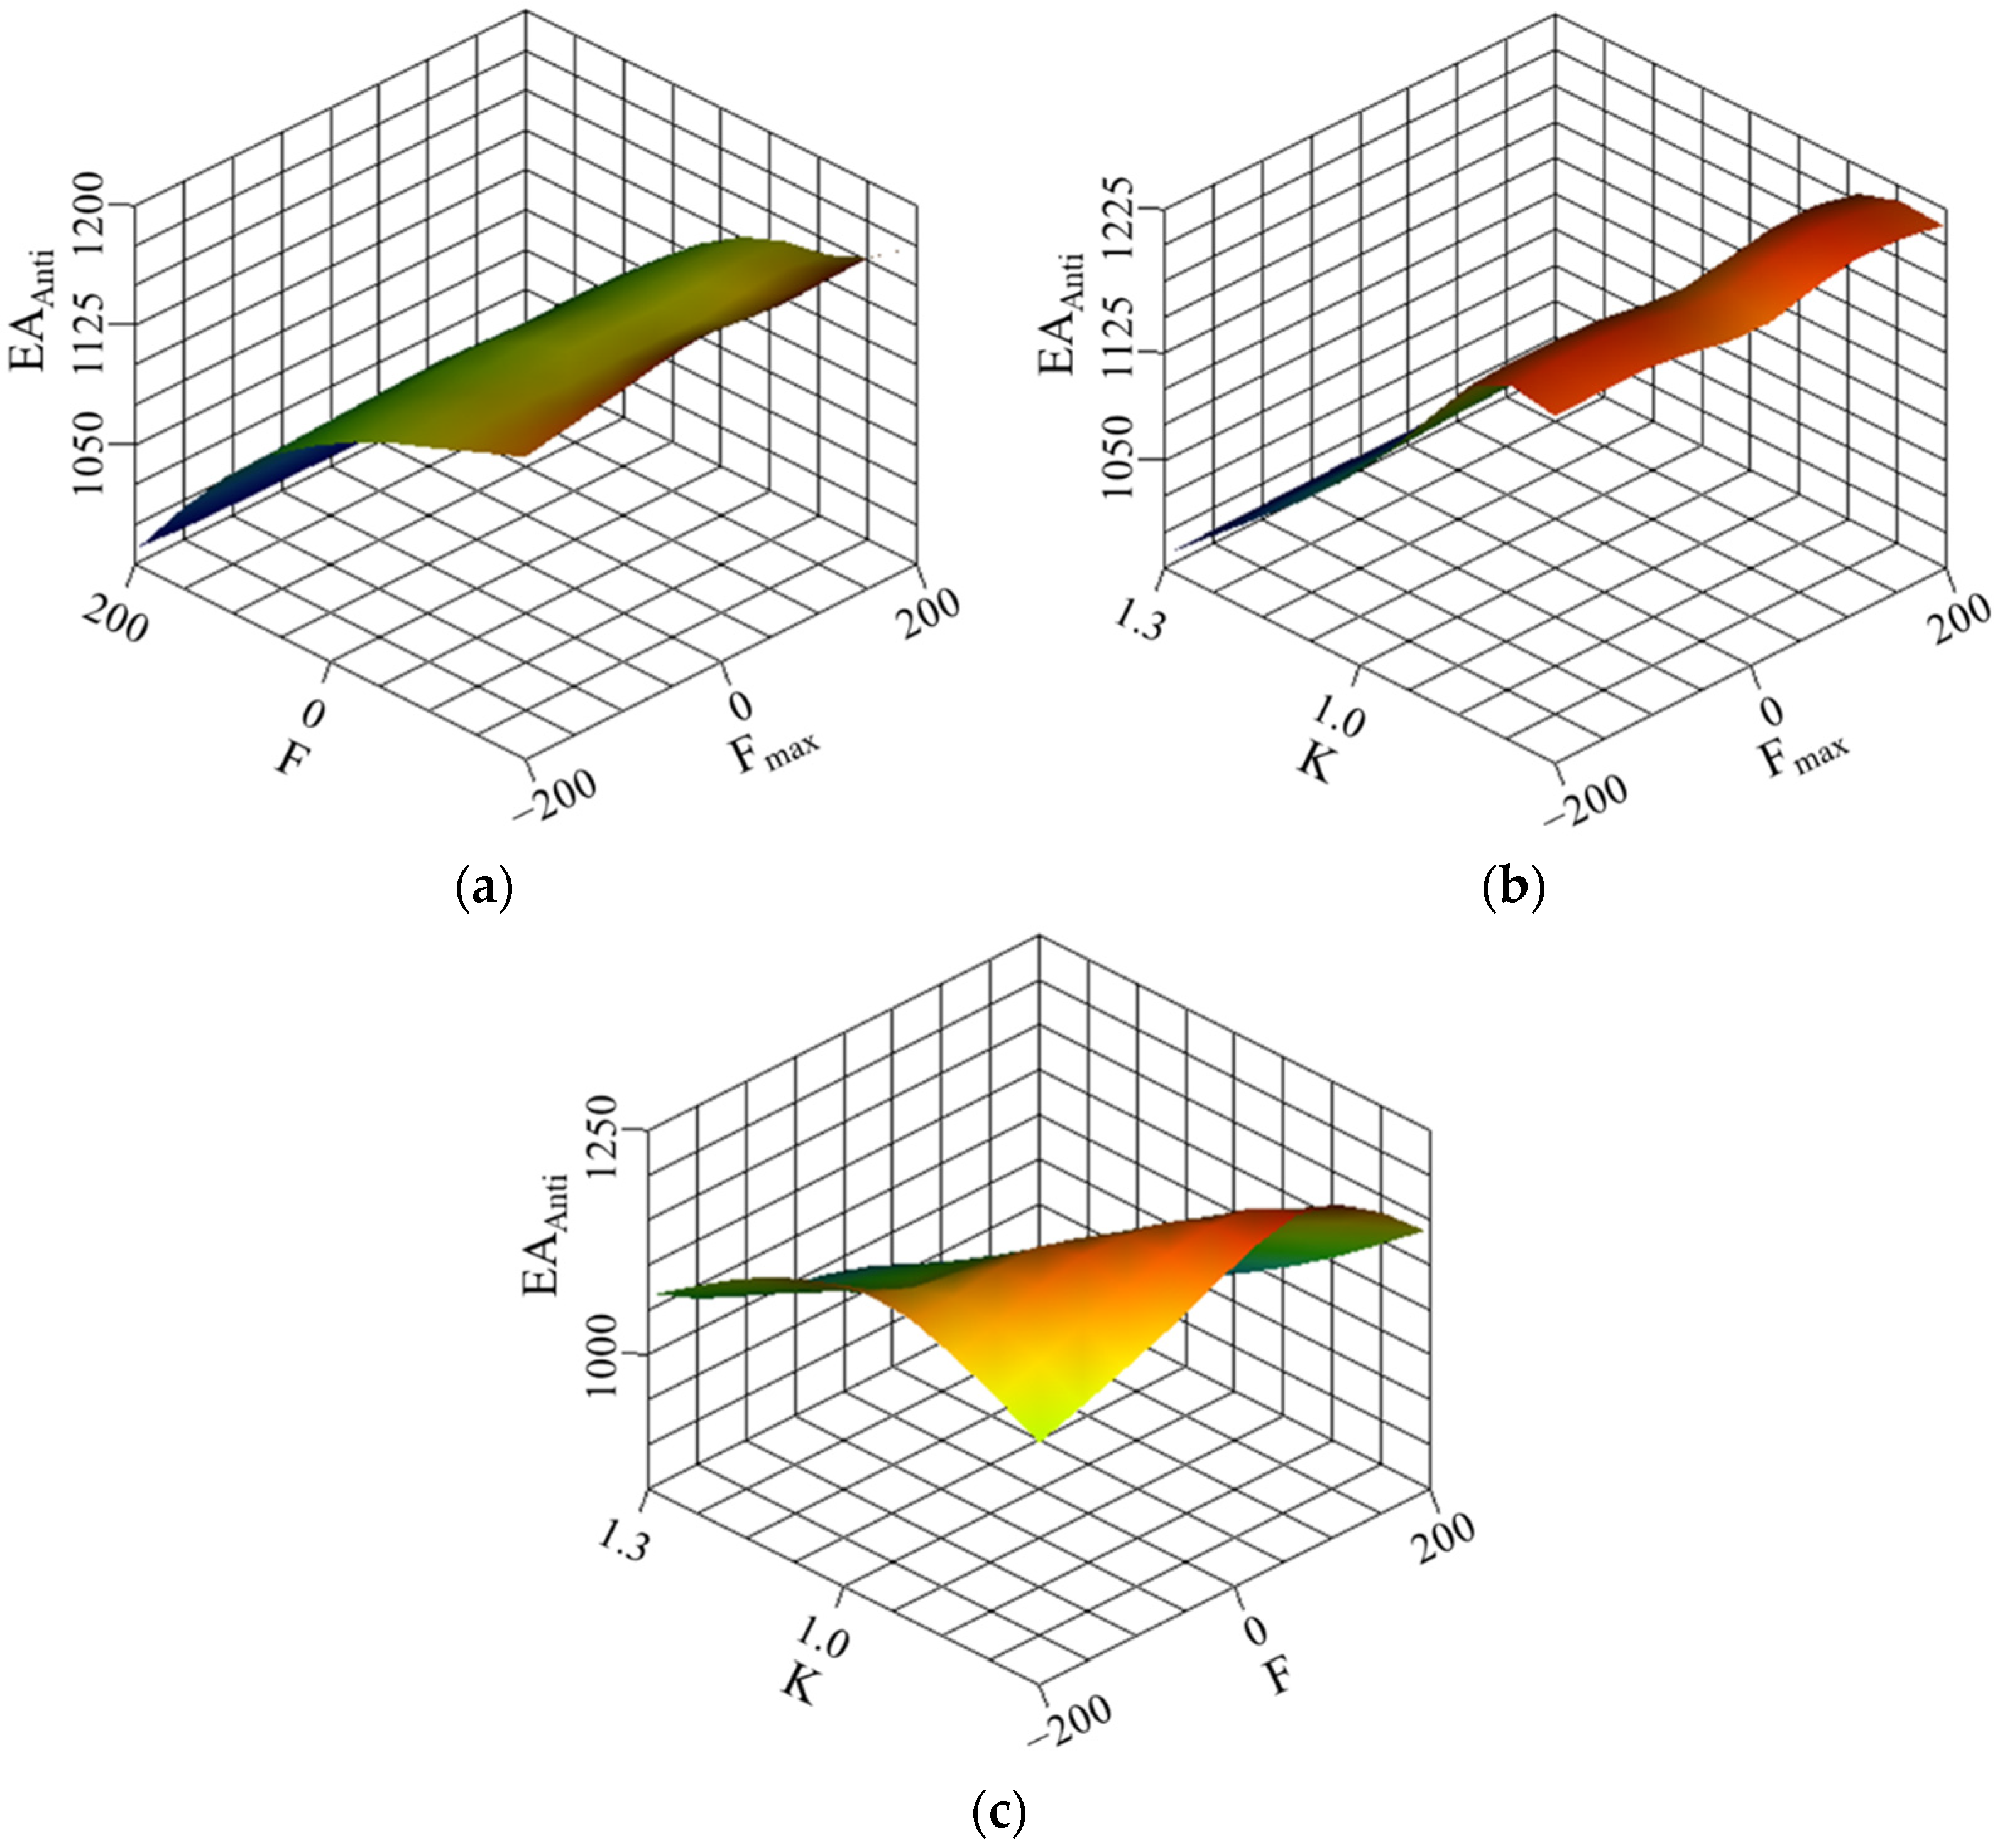
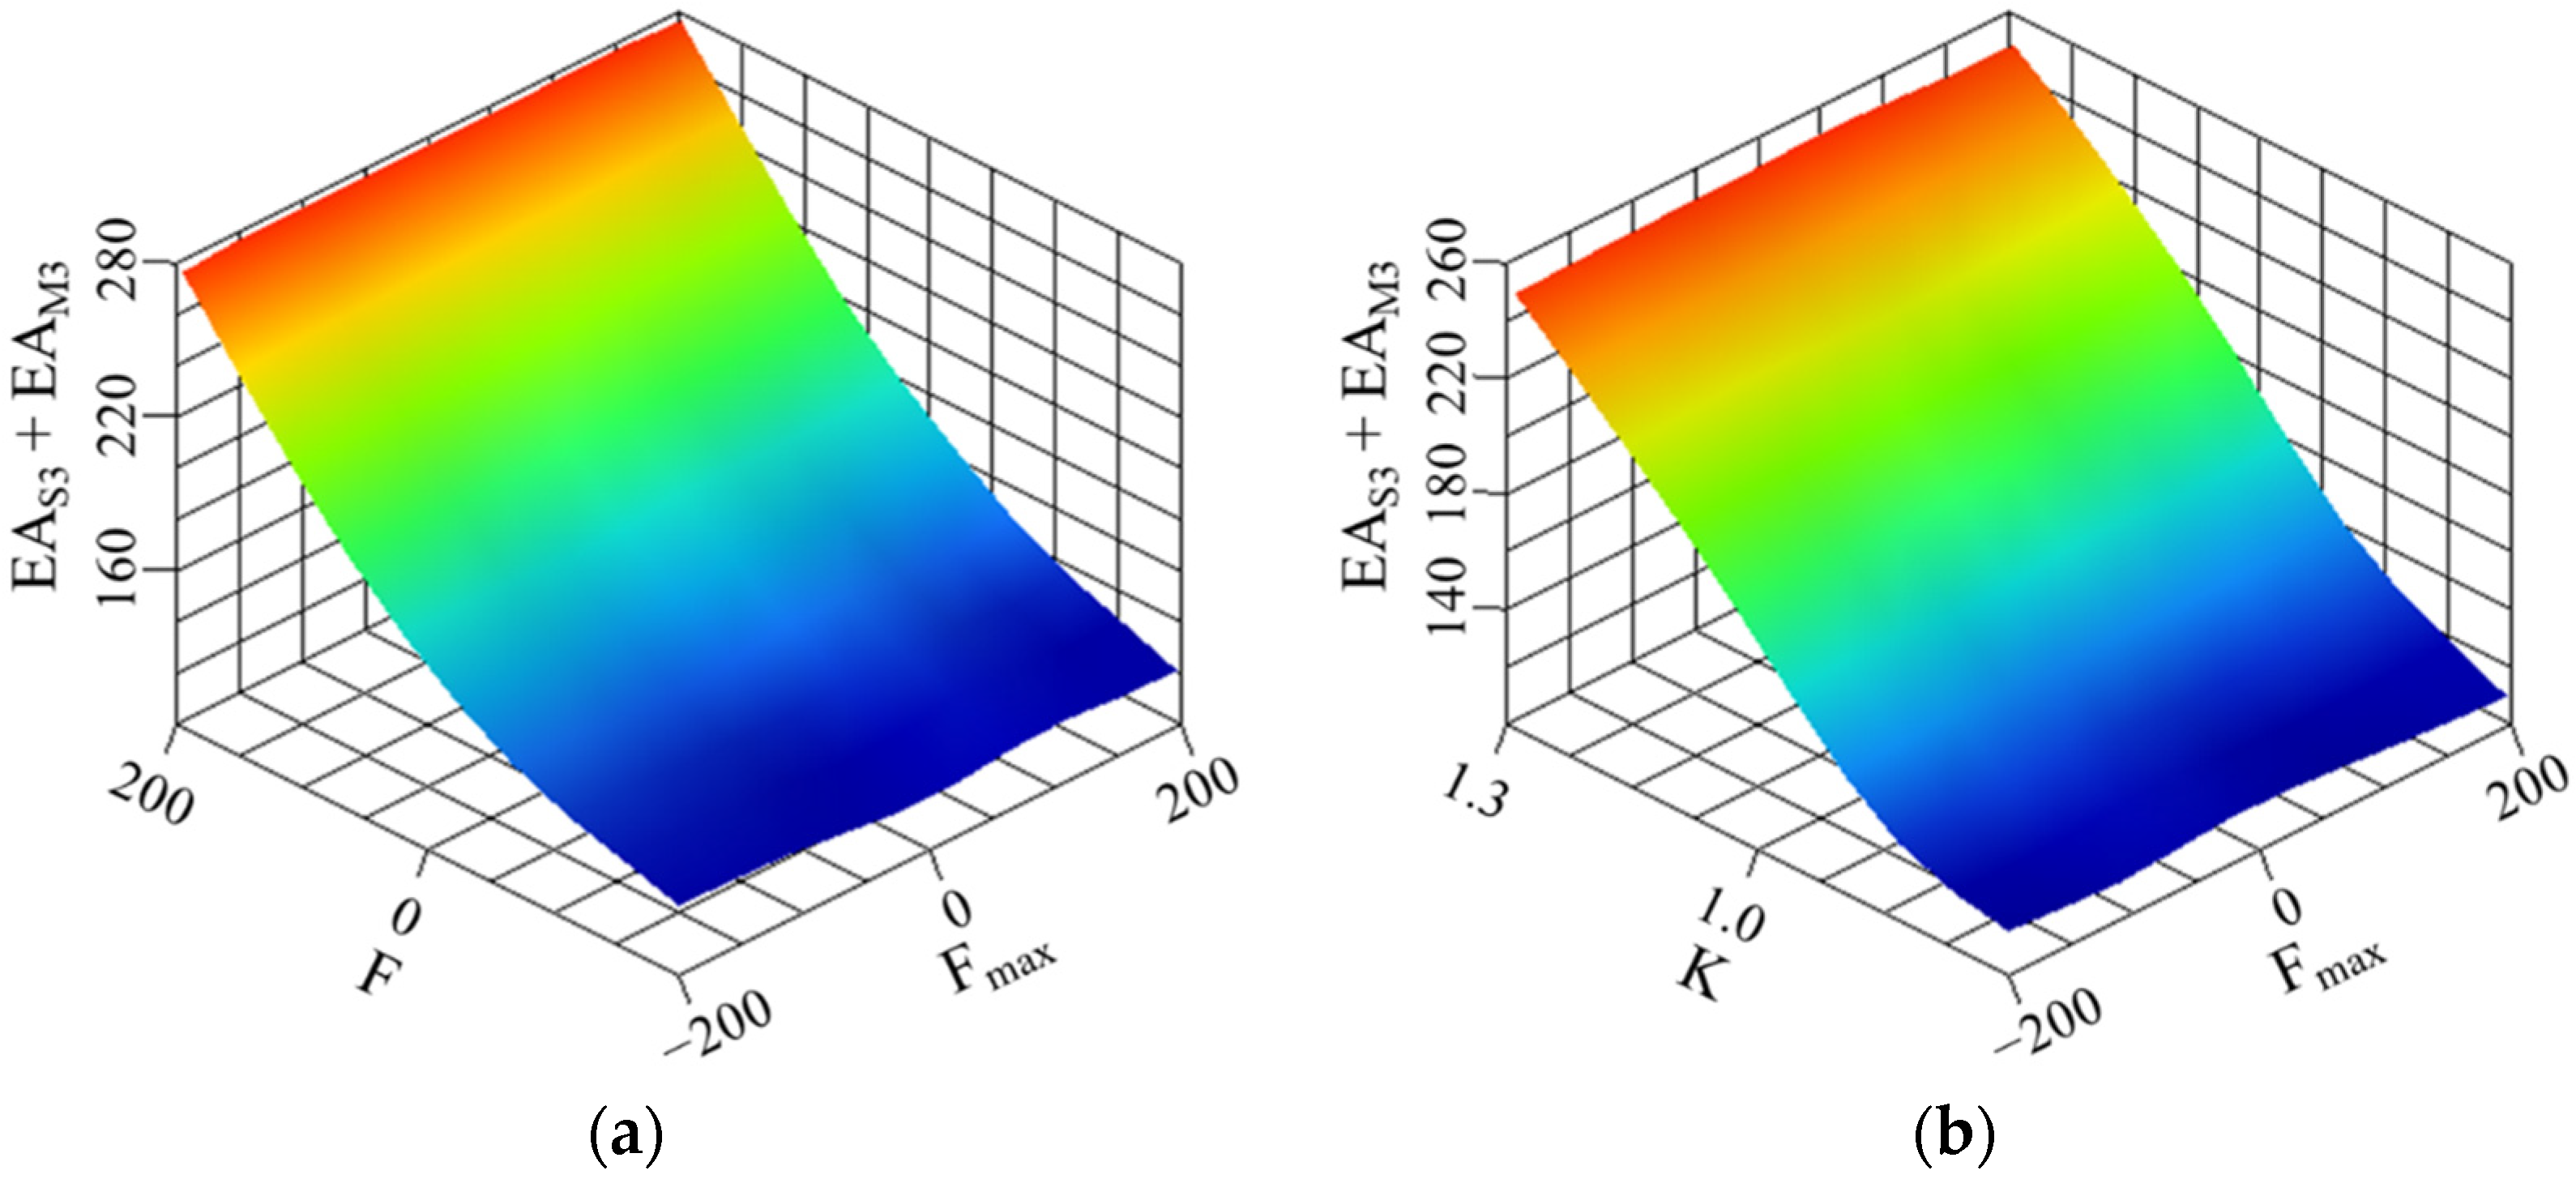
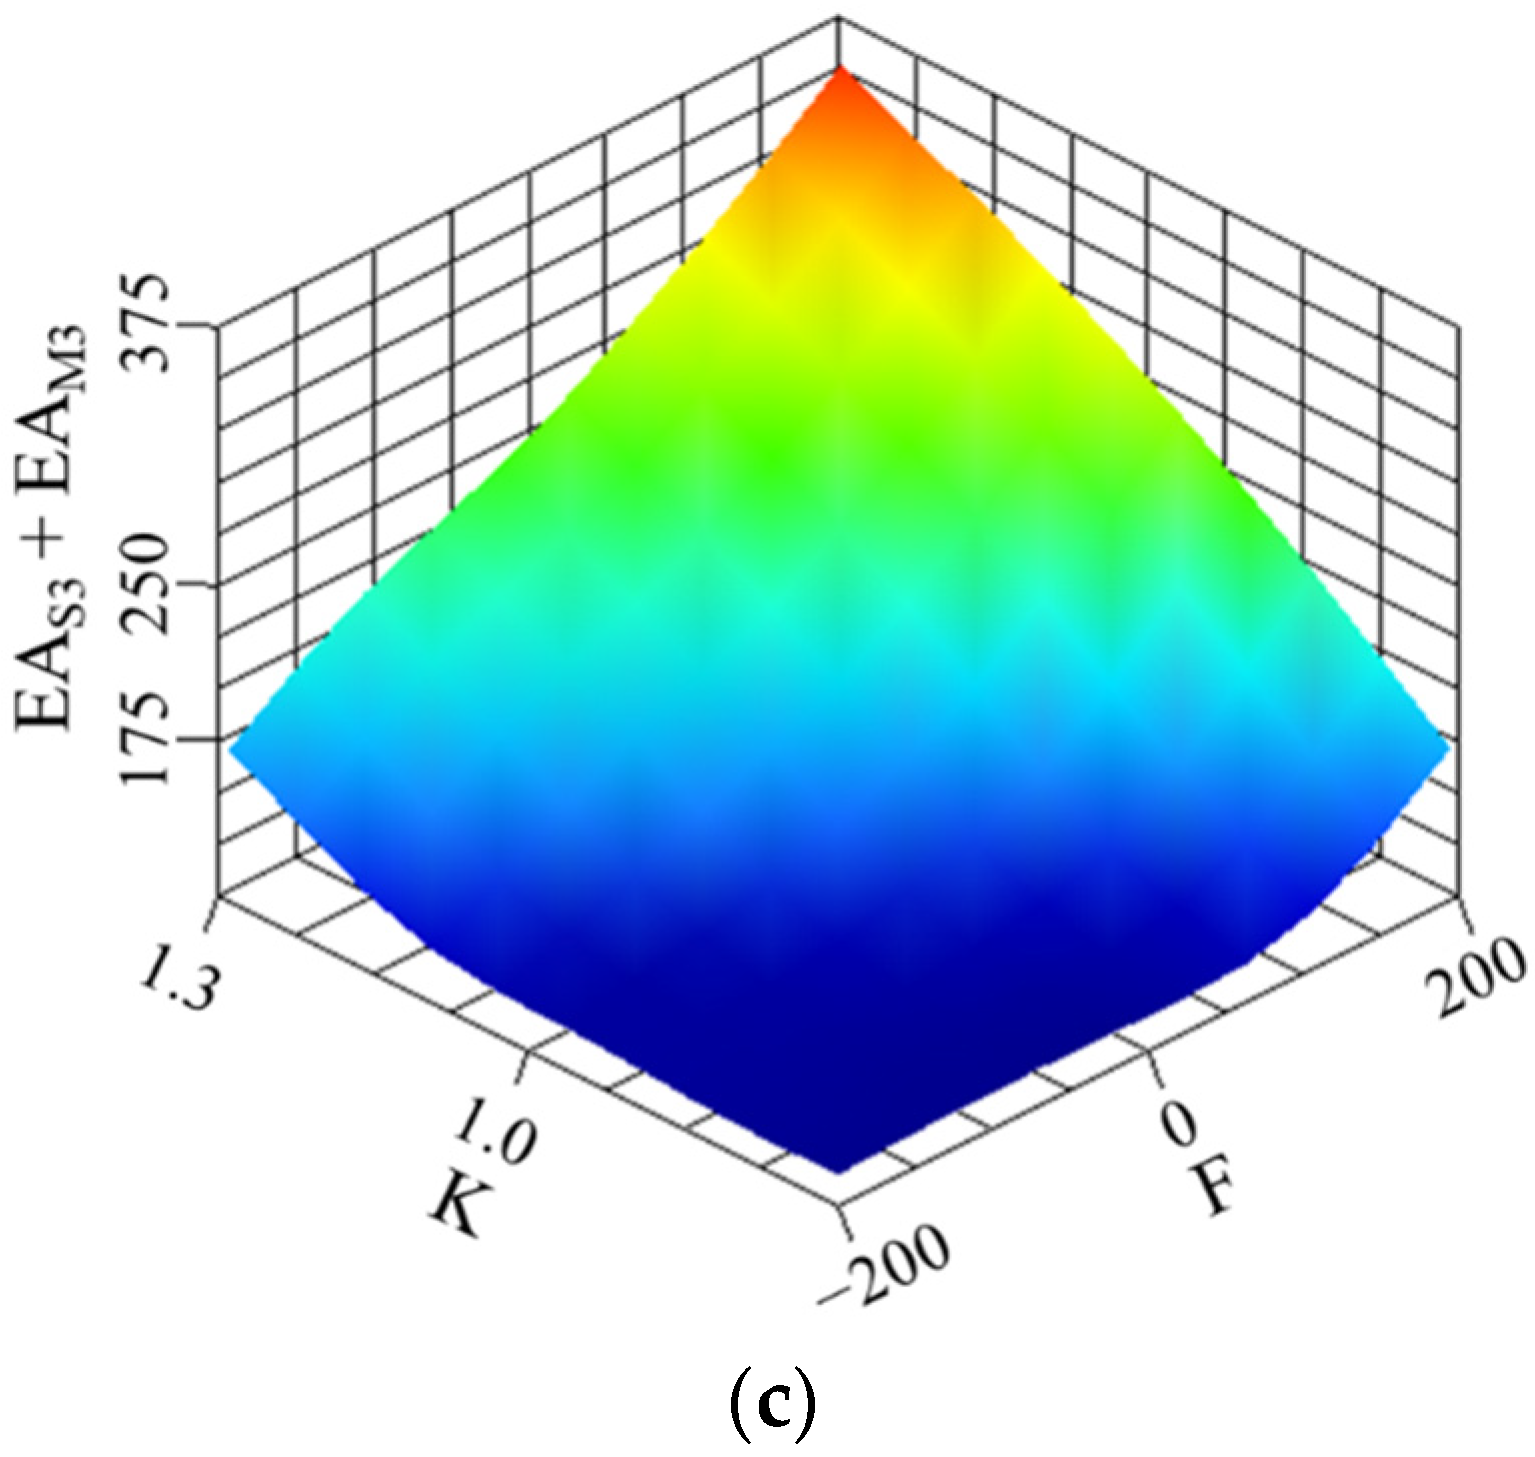
5.2. Building a Surrogate Model
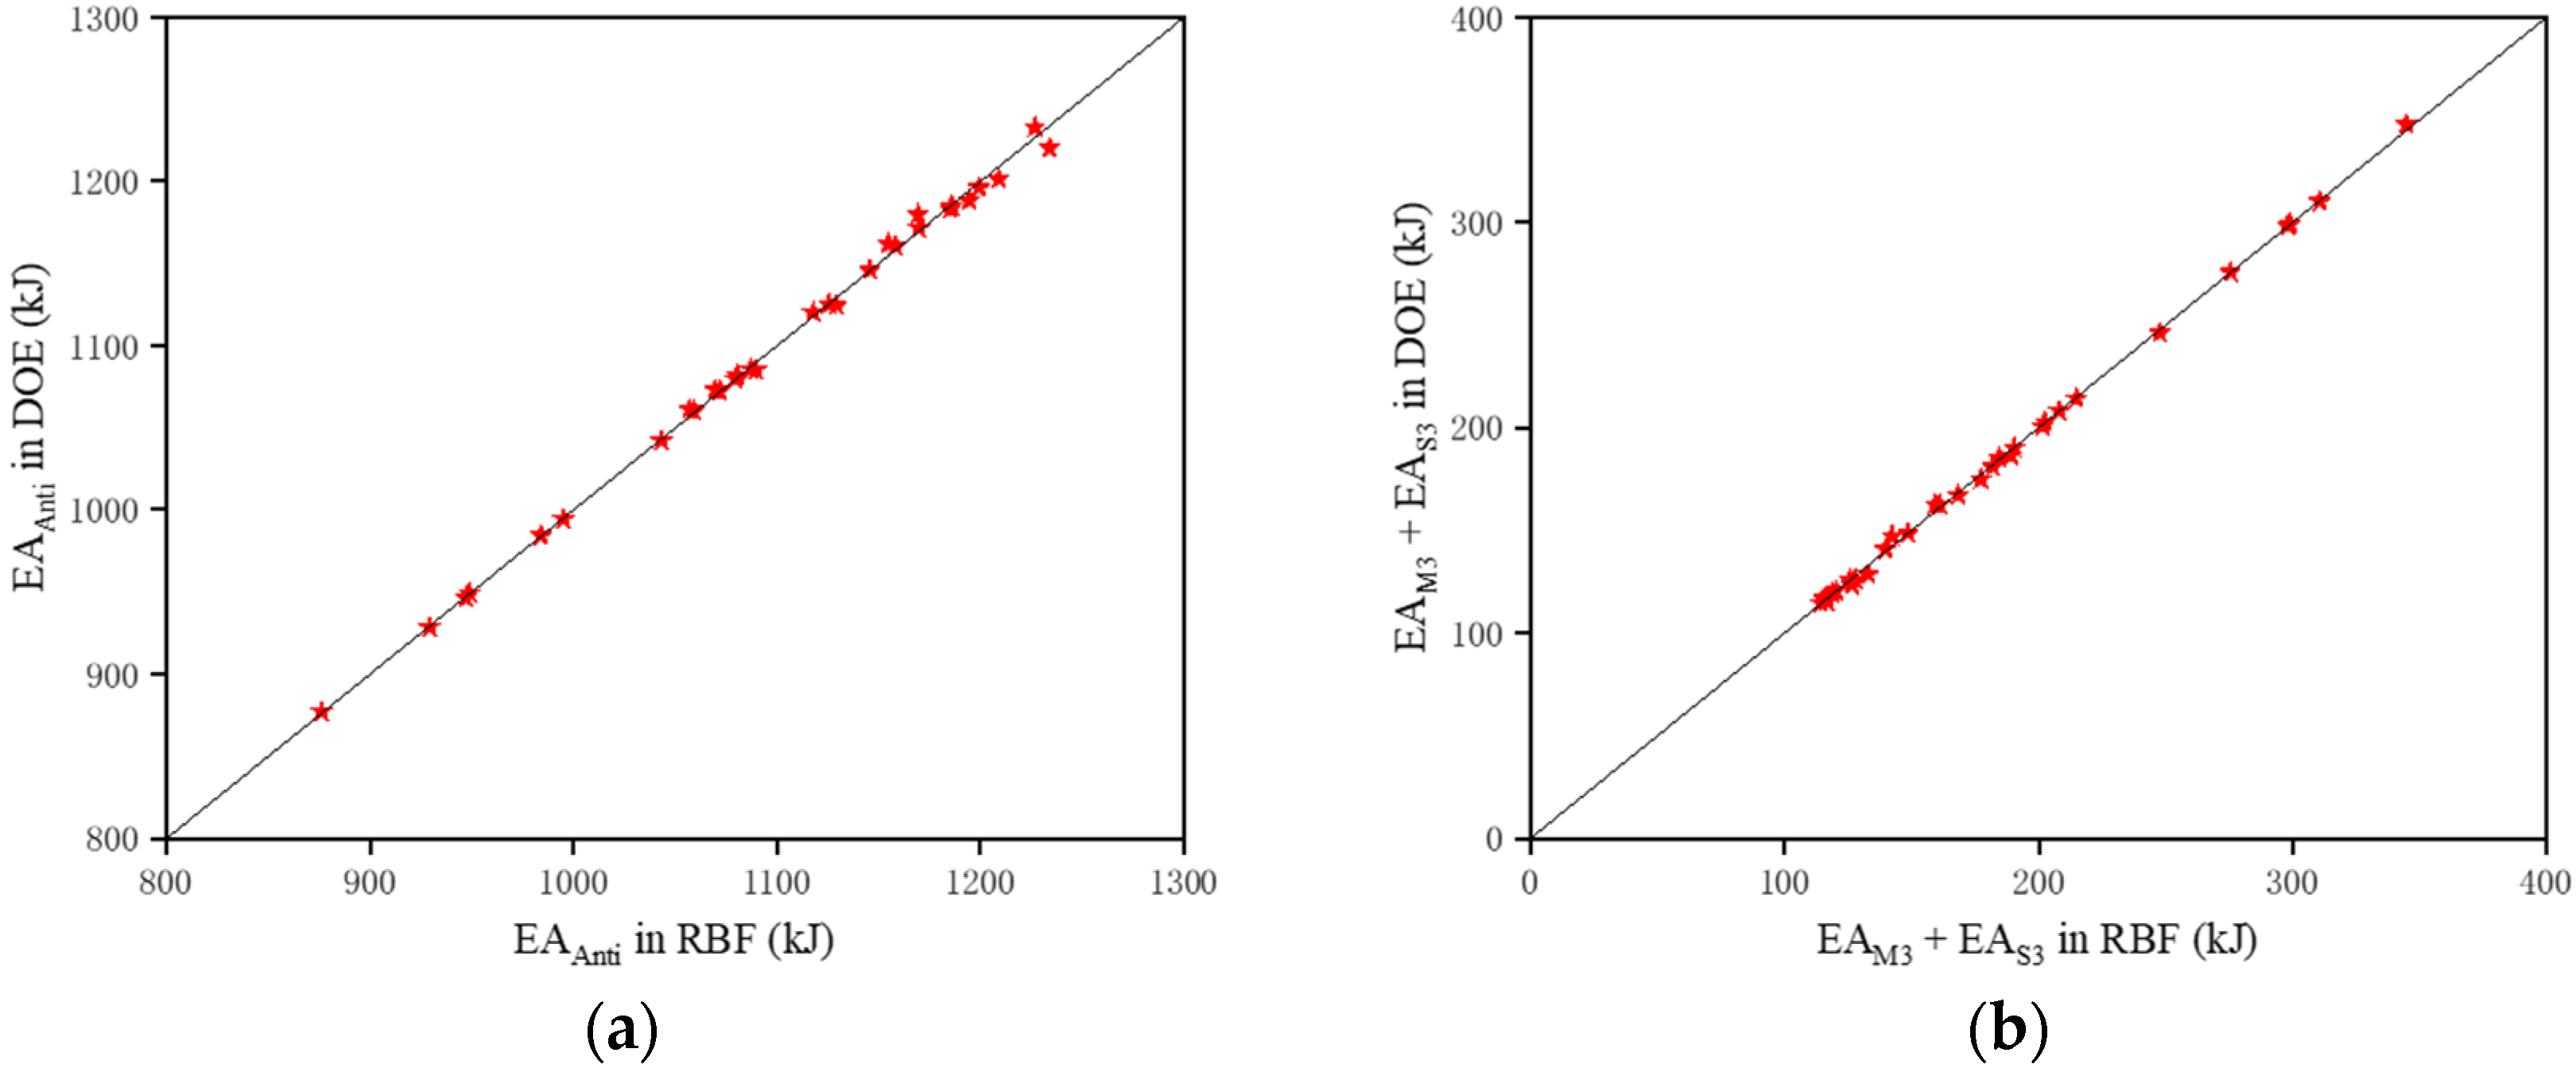
5.3. Optimization Algorithm
5.4. Optimization Result
6. Conclusions
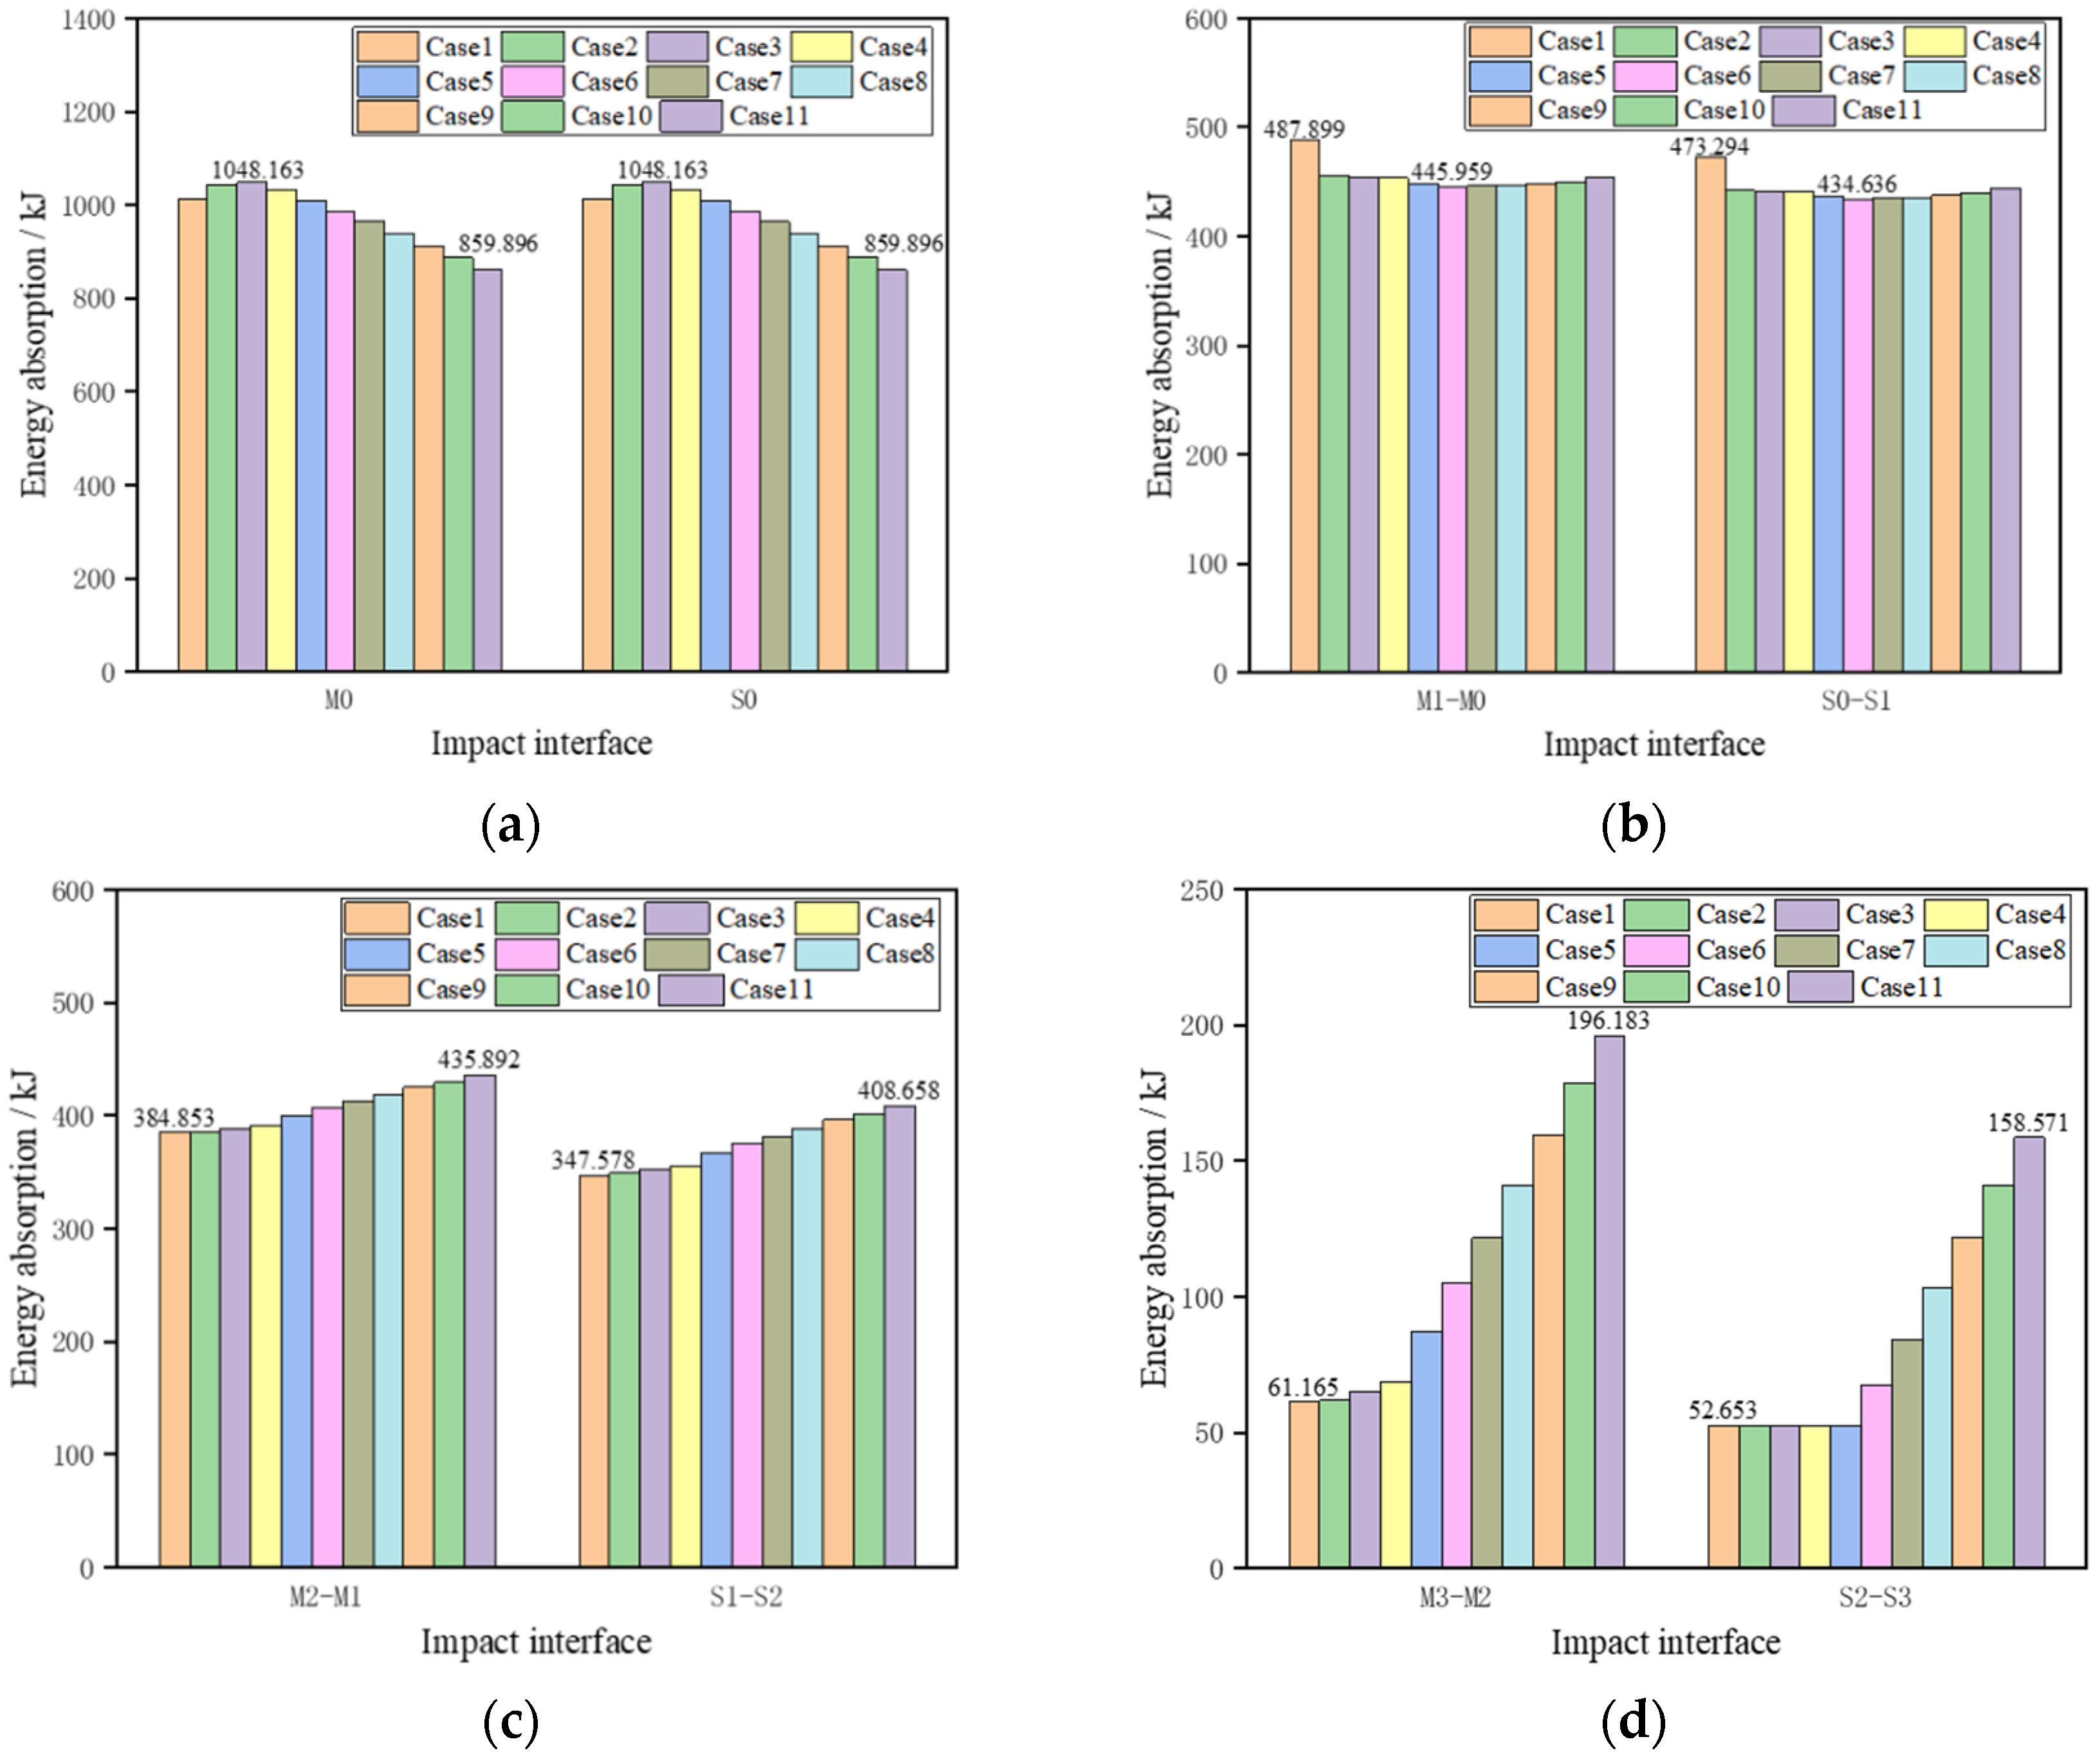
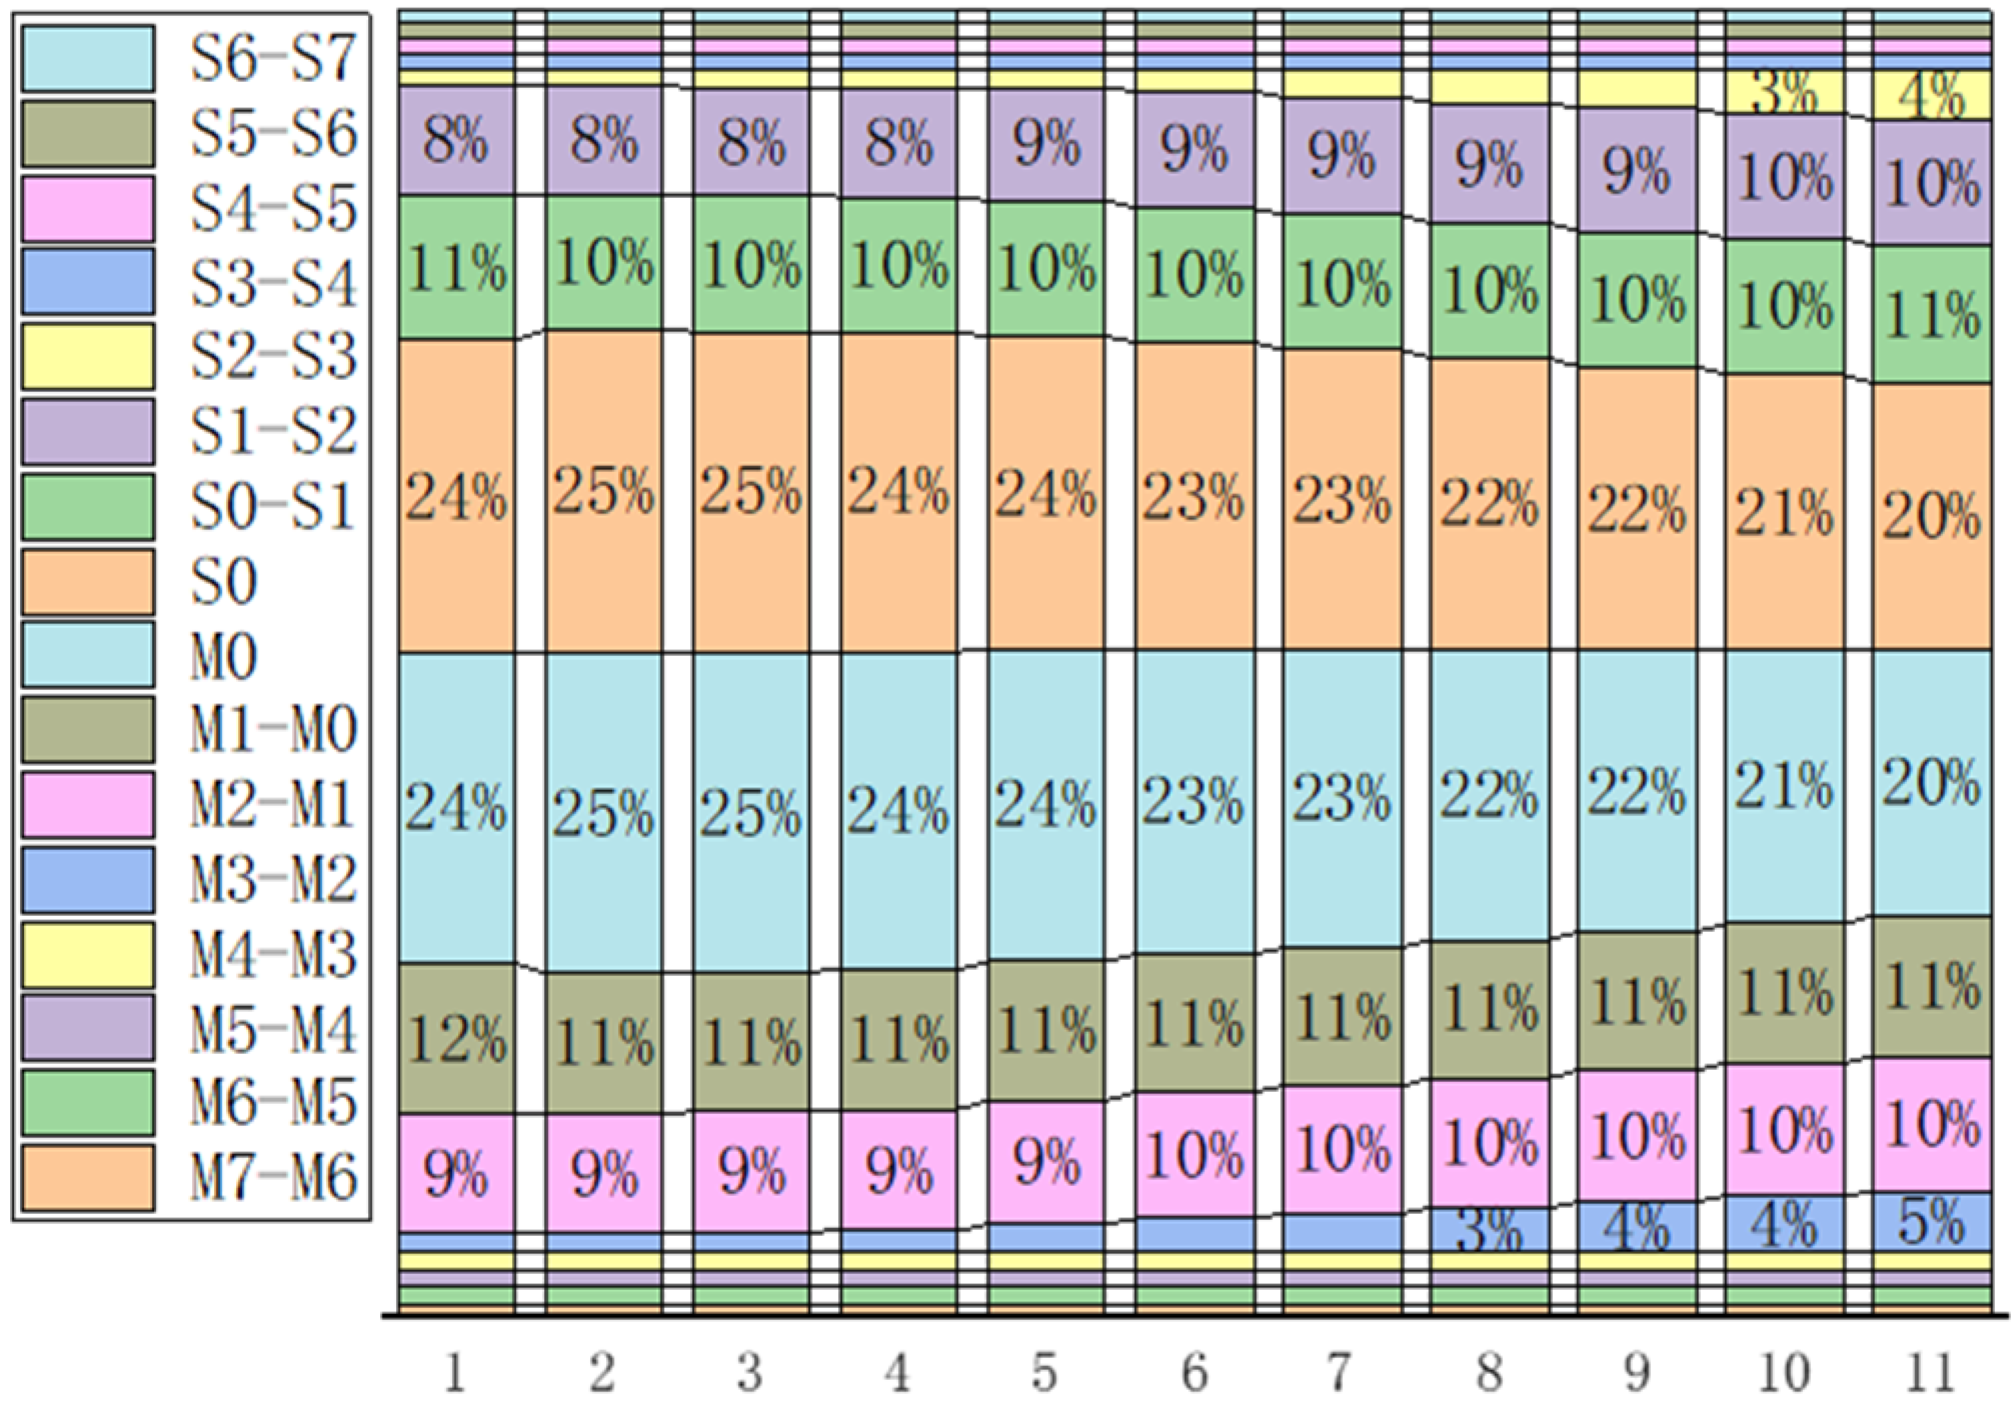
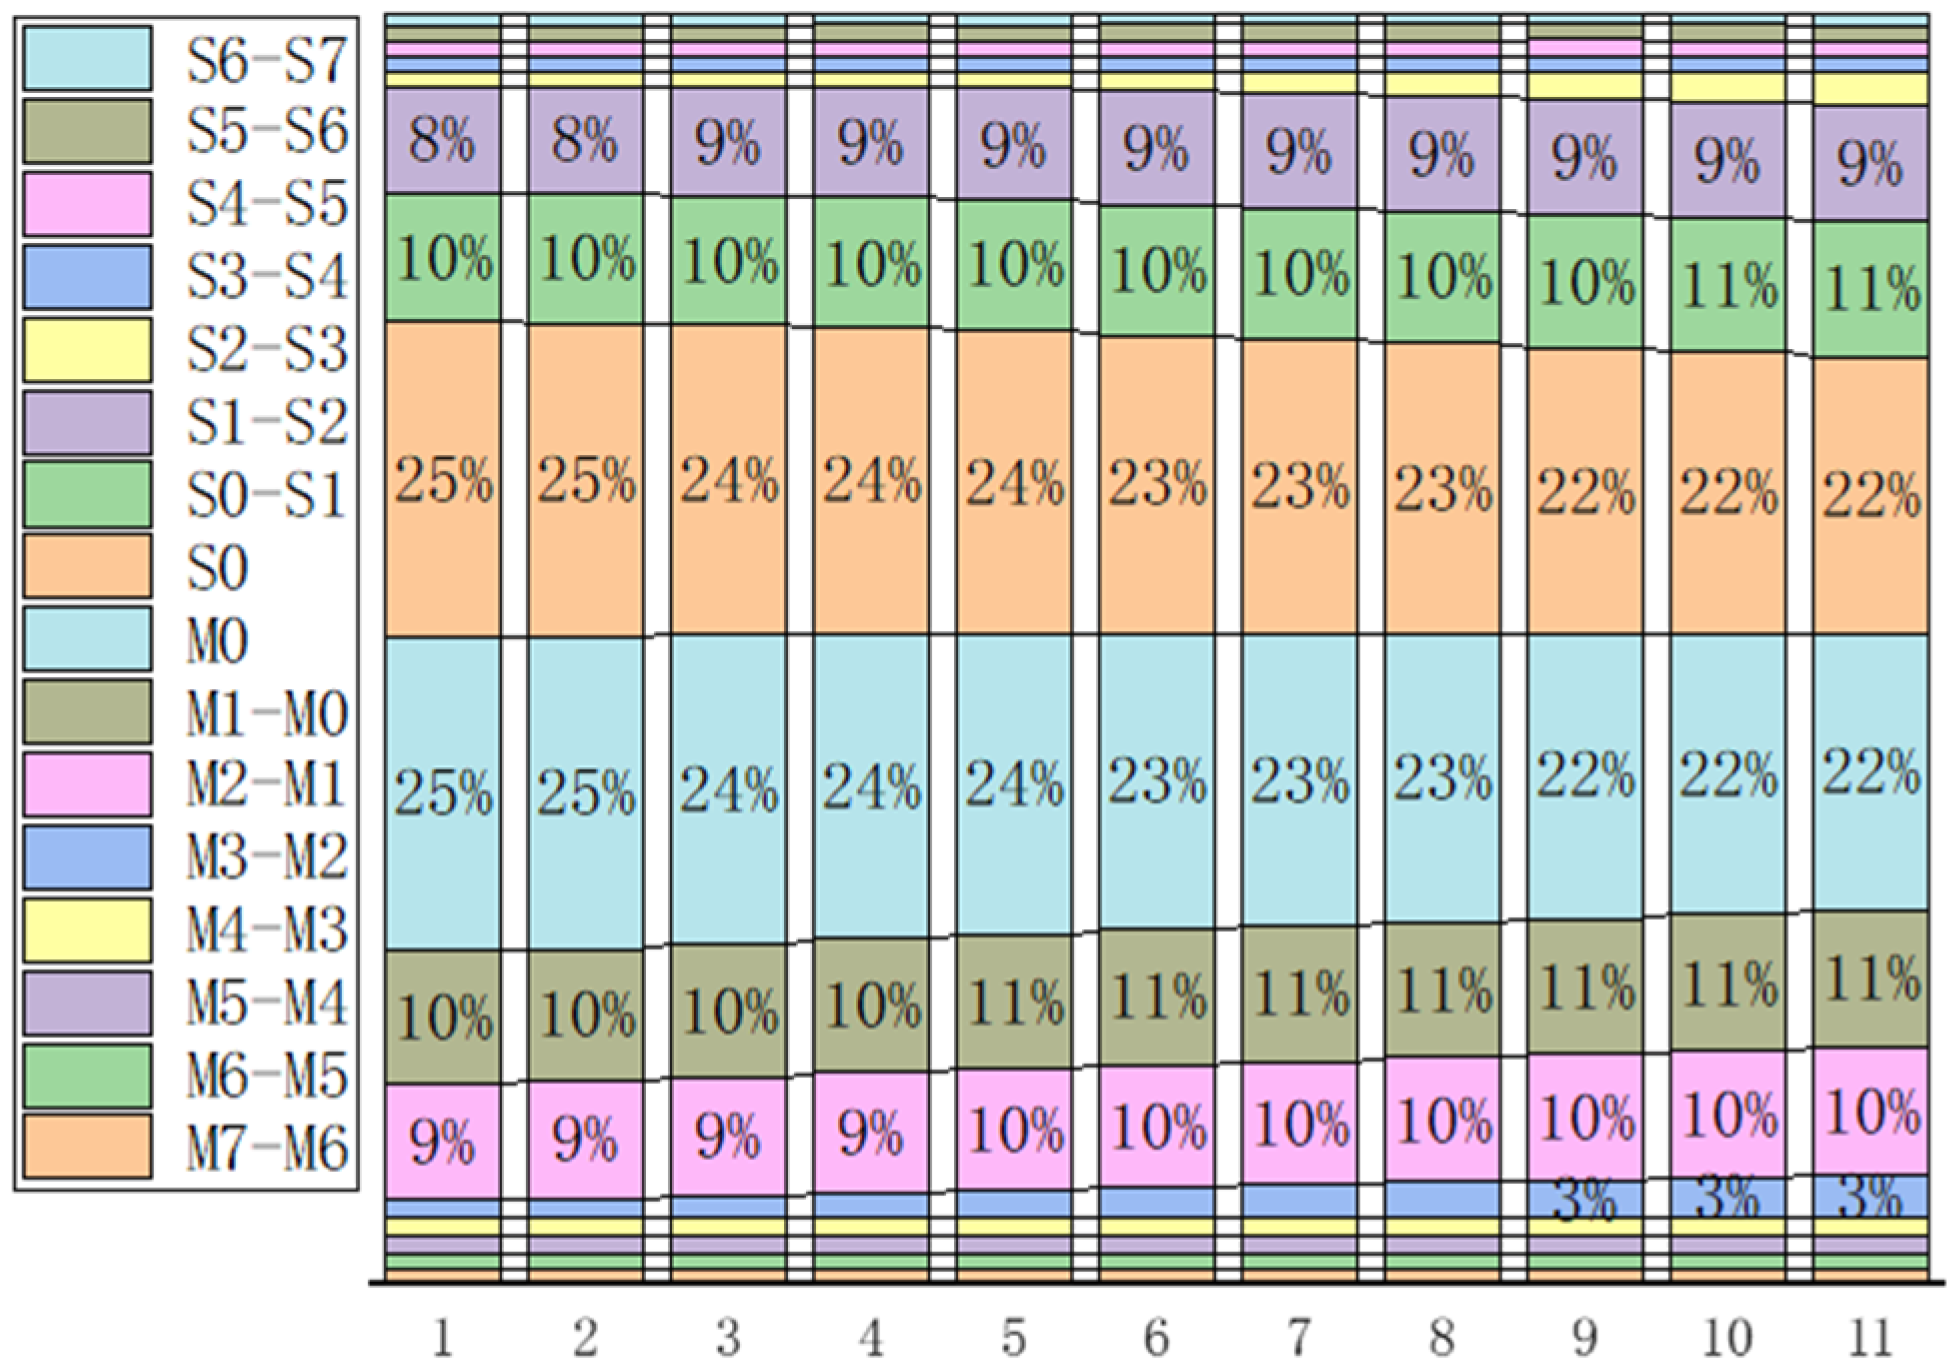
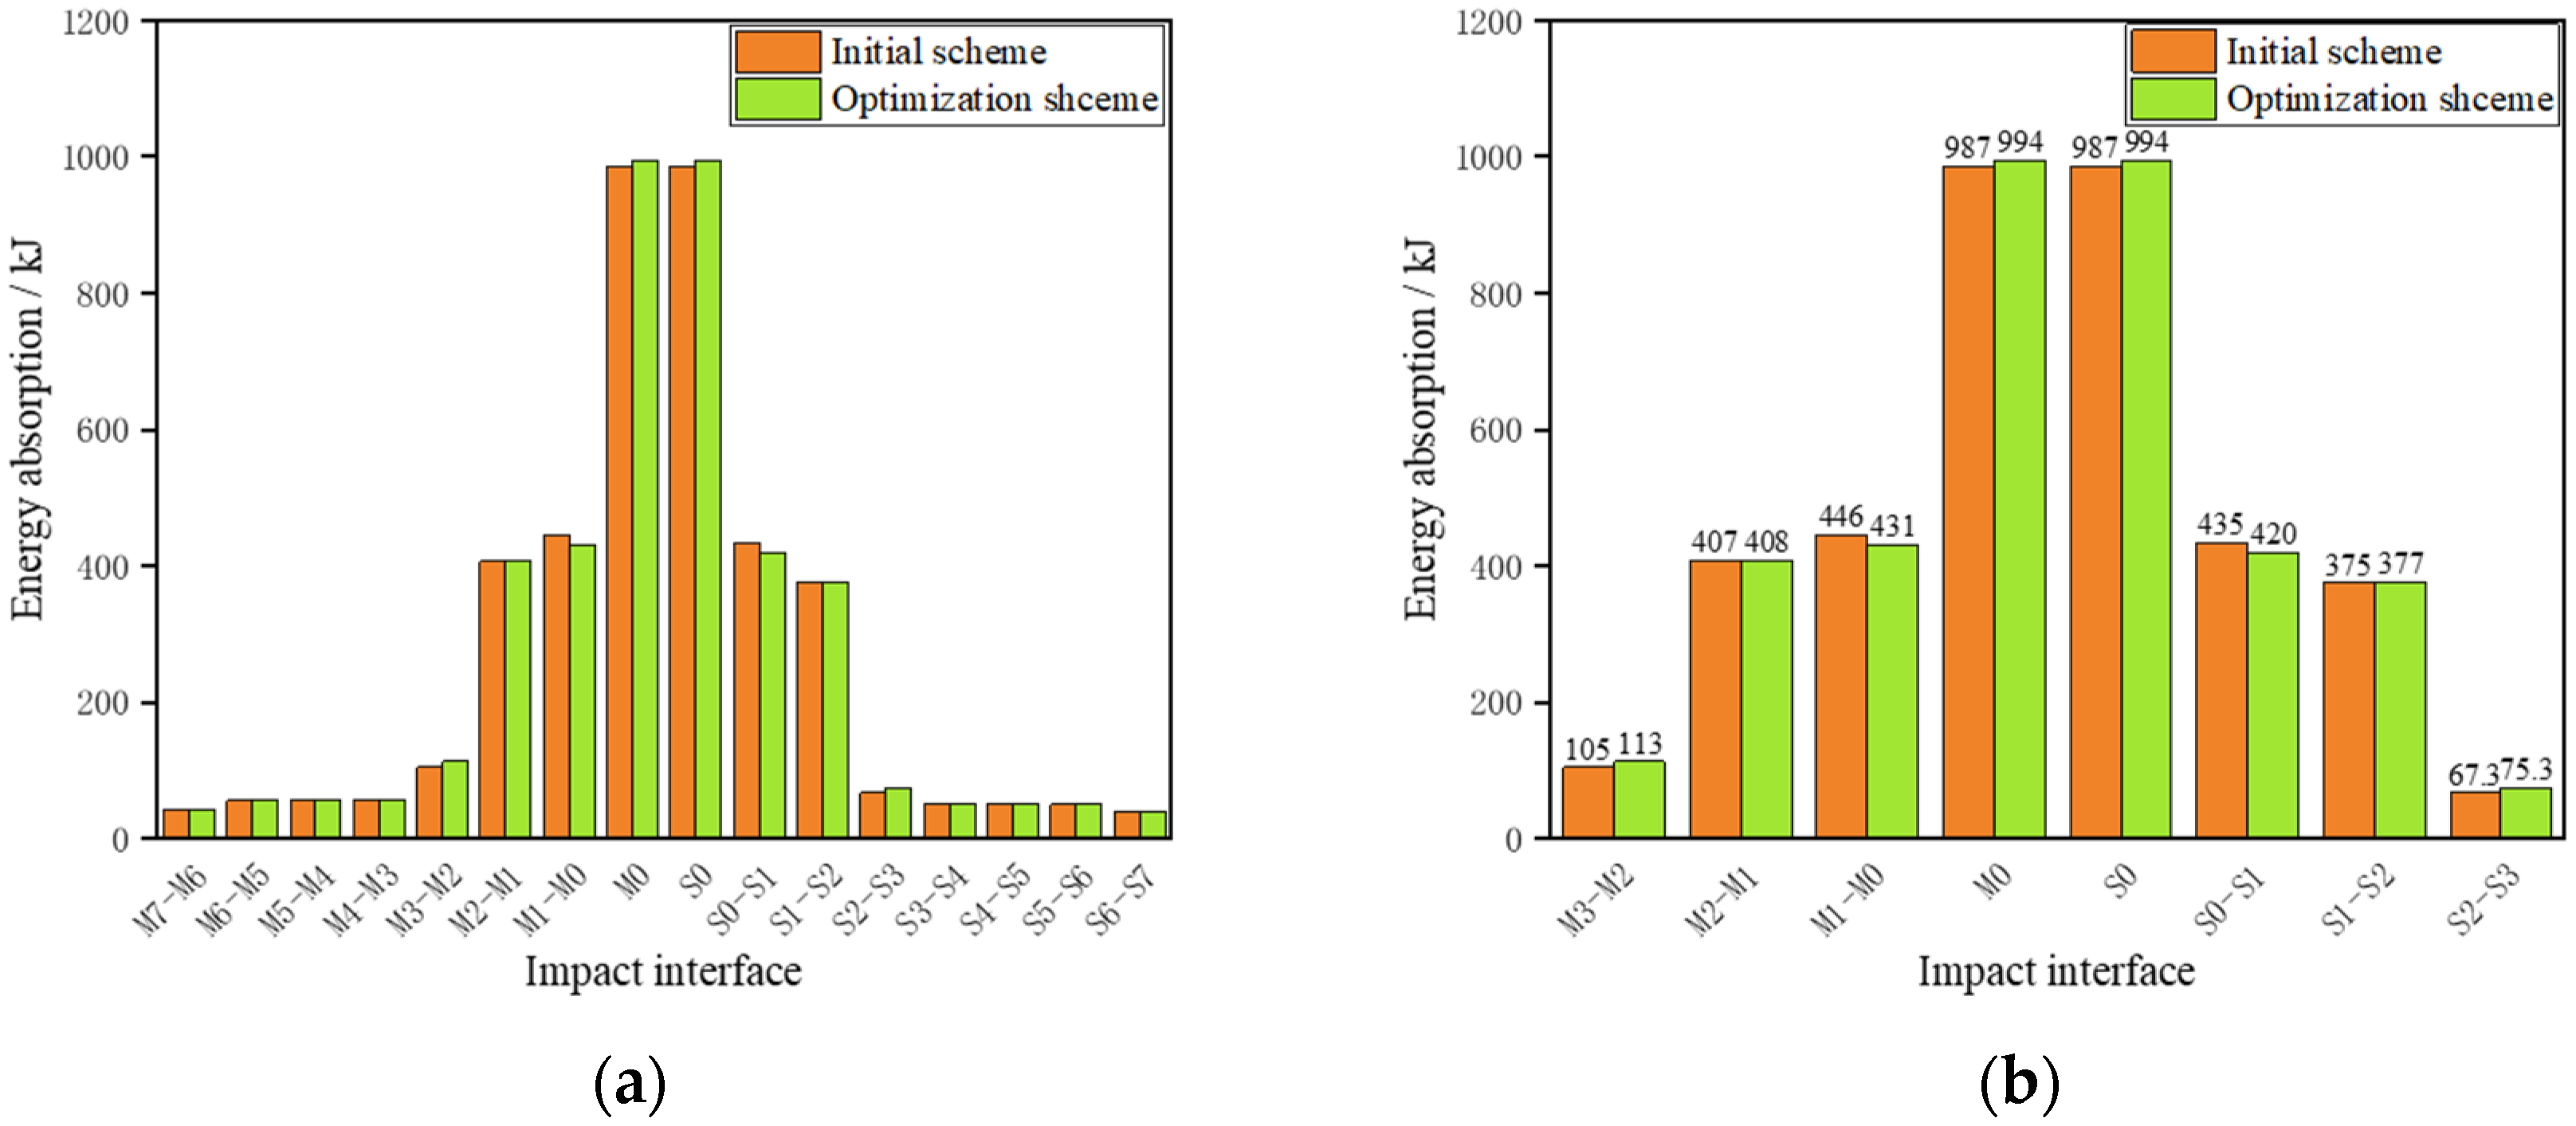
- The changes in the initial peak force Fmax, platform force F and platform force slope K of the square cone energy-absorbing structure have an influence on the distribution of train collision energy, which is mainly concentrated in M3–M2, M2–M1, M1–M0, M0–S0, S0–S1, S1–S2 and S2–S3 interfaces, but the degree was different. The changes in the platform force and platform force slope have a greater influence, while the initial peak force has a smaller impact.
- The increase in the initial peak force Fmax will reduce the energy absorption of the middle car impact interfaces M1–M0 and S0–S1, and increase the energy absorption of M0–S0. However, it has no influence on the energy absorption of other impact interfaces.
- When the platform force F is small, the head car body participates in energy absorption; its increase will lead to a rapid decrease in the energy absorption of M1–M0 and S0–S1, and an increase in M0–S0, M2–M1 and S1–S2 impact interfaces. When F is large, the deformation of the head car body will no longer occur, and the energy absorption of M0–S0 will reduce, and the other six impact interfaces will increase with its increase.
- For the platform force slope K, an increase will reduce the energy absorption of the head car collision interface M0–S0, and the subsequent energy absorption of M3–M2, M2–M1, M1–M0, S0–S1, S1–S2 and S2–S3 will increase continuously, which means that the collision energy will be dispersed from two head cars to the following six middle car collision interfaces.
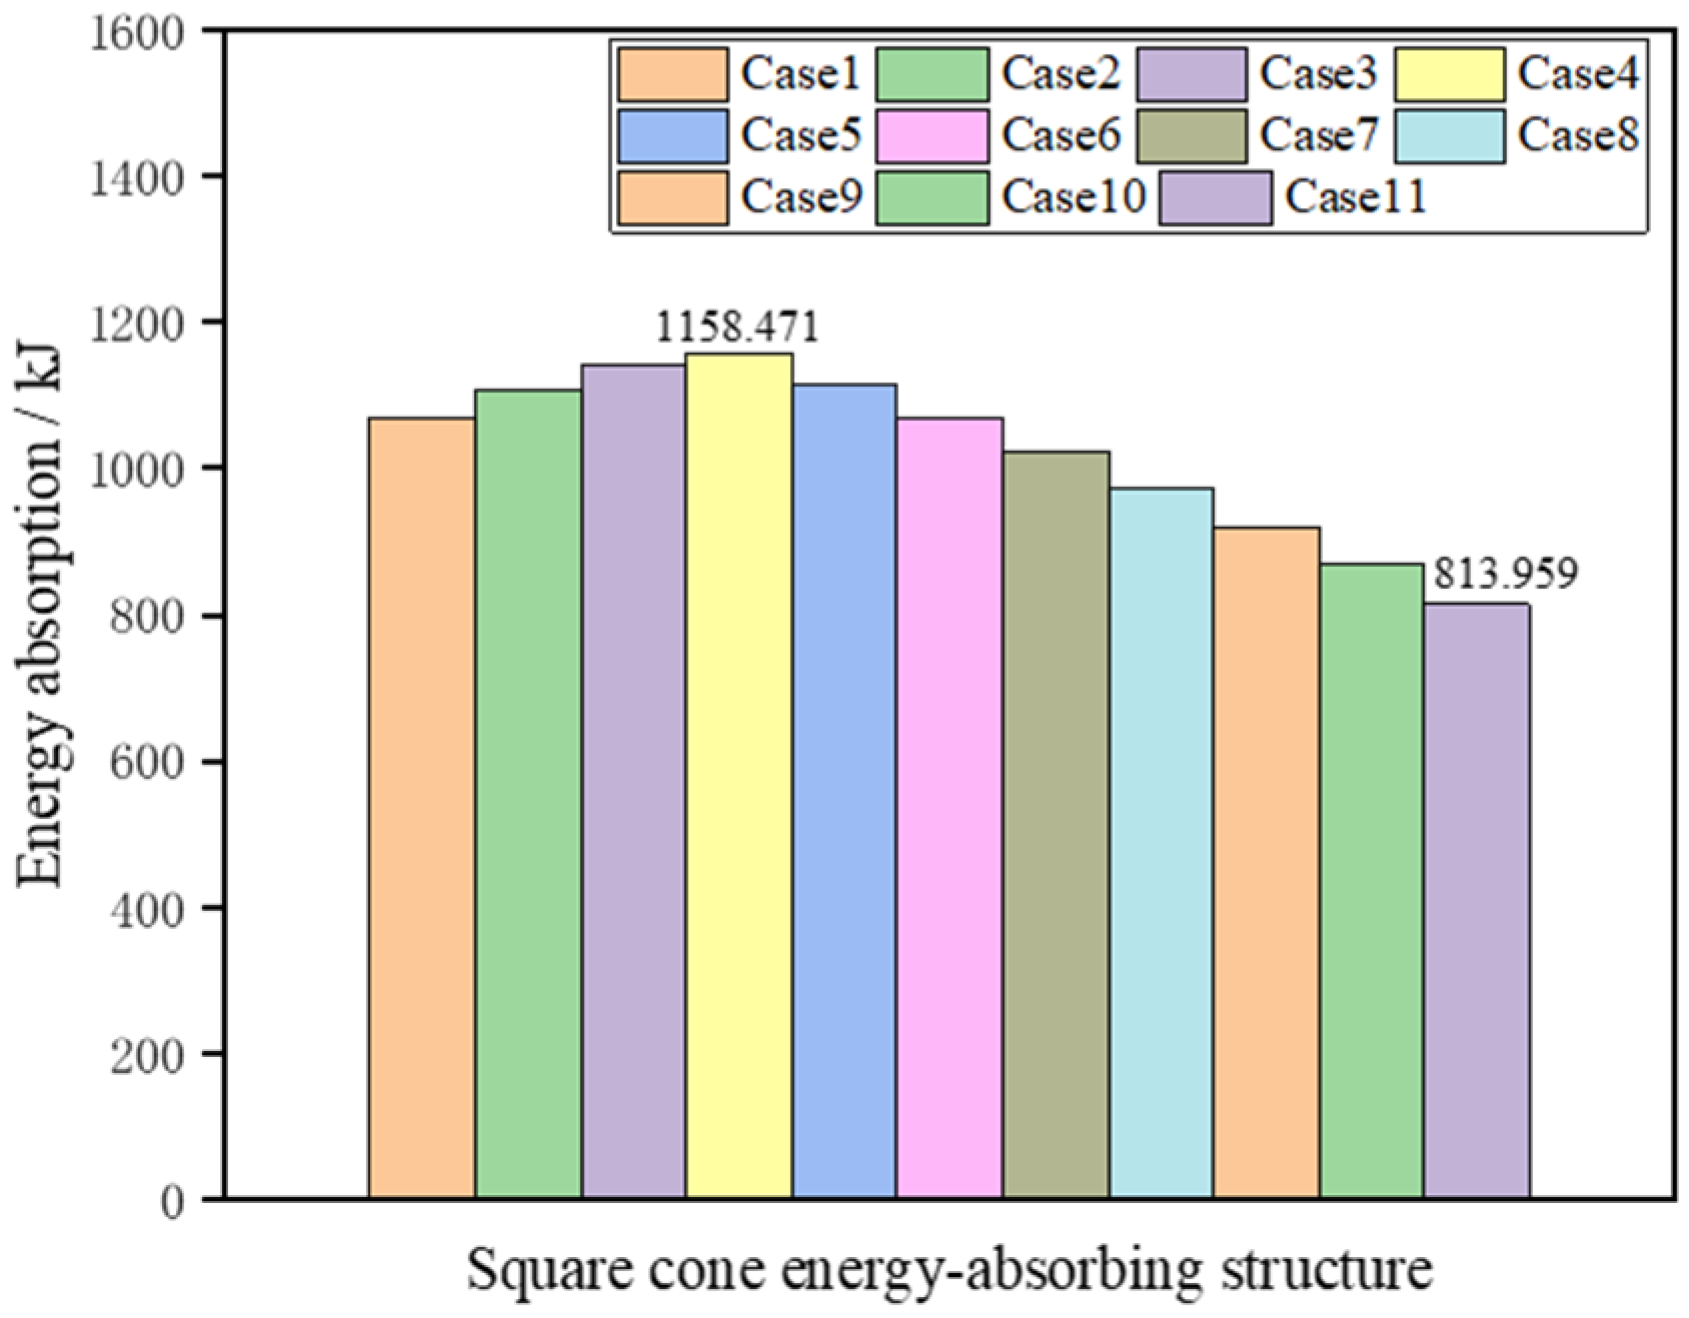
- Compared with the initial calculation, the optimization scheme has the more reasonable energy distribution. The energy absorption of the head car collision interface increases, the energy absorption of the first middle car impact interfaces decreases, and the third middle car impact interfaces obviously increase. The utilization efficiency of the energy-absorbing structure is improved.
Author Contributions
Funding
Institutional Review Board Statement
Informed Consent Statement
Data Availability Statement
Conflicts of Interest
Abbreviations
| Fmax | Initial peak force |
| F | Platform force |
| K | Slope of platform force |
| EA | Energy absorption |
| EAAnti | Energy absorption of the square cone anti-climbing structure |
| EAM3 + EAS3 | Energy absorption of the third middle car impact interfaces (i.e., M3–M2 and S2–S3) |
| DOE | Design of experiment |
| RS | Response surface |
| RBF | Radial basis function |
| MOGA | Multiple objective genetic algorithm |
| TMDSM | The minimum distance selection method |
References
- Gao, G.; Zhuo, T.; Guan, W. Recent research development of energy-absorption structure and application for railway vehicles. J. Cent. South Univ. 2020, 27, 1012–1038. [Google Scholar] [CrossRef]
- Marzbanrad, J.; Mehdikhanlo, M.; Saeedi Pour, A. An energy absorption comparison of square, circular and elliptic steel and aluminum tubes under impact loading. Turk. J. Eng. Environ. Sci. 2010, 33, 159–166. [Google Scholar] [CrossRef]
- Alavi Nia, N.; Parsapour, M. An investigation on the energy absorption characteristics of multi-cell square tubes. Thin-Walled Struct. 2013, 68, 26–34. [Google Scholar] [CrossRef]
- Song, J.; Chen, Y.; Lu, G. Axial crushing of thin-walled structures with origami patterns. Thin-Walled Struct. 2012, 54, 65–71. [Google Scholar] [CrossRef]
- Goyal, S.; Anand, C.S.; Sharma, S.K.; Sharma, R.C. Crashworthiness analysis of foam filled star shape polygon of thin-walled structure. Thin-Walled Struct. 2019, 144, 6312. [Google Scholar] [CrossRef]
- Yao, S.; Zhou, Y.; Li, Z.; Zhang, P.; Cao, Y.; Xu, P. Energy absorption characteristics of square frustum lattice structure. Compos. Struct. 2021, 275, 4492. [Google Scholar] [CrossRef]
- Zhang, X.; Zhang, H. Energy absorption of multi-cell stub columns under axial compression. Thin-Walled Struct. 2013, 68, 156–163. [Google Scholar] [CrossRef]
- Kannan, I.V.; Rajkumar, R. Deformation and energy absorption analysis of simple and multi-cell thin-walled tubes under quasi-static axial crushing. Int. J. Crashworthiness 2020, 25, 121–130. [Google Scholar] [CrossRef]
- Gao, G.; Dong, H.; Tian, H. Collision performance of square tubes with diaphragms. Thin-Walled Struct. 2014, 80, 167–177. [Google Scholar] [CrossRef]
- Yao, S.; Xiao, X.; Xu, P.; Qu, Q.; Che, Q. The impact performance of honeycomb-filled structures under eccentric loading for subway vehicles. Thin-Walled Struct. 2018, 123, 360–370. [Google Scholar] [CrossRef]
- Xie, S.; Du, X.; Zhou, H.; Wang, J.; Chen, P. Crashworthiness of Nomex honeycomb-filled anti-climbing energy absorbing devices. Int. J. Crashworthiness 2021, 26, 121–132. [Google Scholar] [CrossRef]
- Xu, P.; Yang, C.; Peng, Y.; Yao, S.; Xing, J.; Li, B. Cut-out grooves optimization to improve crashworthiness of a gradual energy-absorbing structure for subway vehicles. Mater. Des. 2016, 103, 132–143. [Google Scholar] [CrossRef]
- Wang, J.; Lu, Z.; Zhong, M.; Wang, T.; Sun, C.; Li, H. Coupled thermal–structural analysis and multi-objective optimization of a cutting-type energy-absorbing structure for subway vehicles. Thin-Walled Struct. 2019, 141, 360–373. [Google Scholar] [CrossRef]
- Chen, J.; Liang, X.; Xu, P.; Che, Q. Windowed design and structure optimization of energy absorbing structure of high-speed train. J. Railw. Sci. Eng. 2022, 19, 1502–1510. [Google Scholar] [CrossRef]
- Guo, W.; Xu, P.; Yi, Z.; Xing, J.; Zhao, H.; Yang, C. Variable Stiffness Design and Multiobjective Crashworthiness Optimization for Collision Post of Subway Cab Cars. Machines 2021, 9, 246. [Google Scholar] [CrossRef]
- Lu, G. Energy absorption requirement for crashworthy vehicles. Proc. Inst. Mech. Eng. Part F J. Rail Rapid Transit 2002, 216, 31–39. [Google Scholar] [CrossRef]
- Sun, Y.Q.; Cole, C.; Thambiratnam, D.P. Modeling and Analysis of the Crush Zone of a Typical Australian Passenger Train. Veh. Syst. Dyn. 2012, 50, 1137–1155. [Google Scholar] [CrossRef]
- Gao, G. The energy distribution of a train impact process based on the active–passive energy-absorption method. Transp. Saf. Environ. 2019, 1, 54–67. [Google Scholar] [CrossRef]
- Yao, S.; Yan, K.; Lu, S.; Xu, P. Energy-absorption optimisation of locomotives and scaled equivalent model validation. Int. J. Crashworthiness 2022, 4, 441–452. [Google Scholar] [CrossRef]
- Zhao, H.; Xu, P.; Jiang, S.; Li, B.; Yao, S.; Xing, J.; Huang, Q.; Xu, K. A novel design method of the impact zone of a high-speed train. Int. J. Crashworthiness 2020, 27, 476–485. [Google Scholar] [CrossRef]
- Ambrósio, J. Crash Analysis and Dynamical Behaviour of Light Road and Rail Vehicles. Veh. Syst. Dyn. 2005, 43, 385–411. [Google Scholar] [CrossRef]
- Xu, P.; Lu, S.; Yan, K.; Yao, S. Energy absorption design study of subway vehicles based on a scaled equivalent model test. Proc. IMechE Part F J. Rail Rapid Transit 2019, 23, 3–15. [Google Scholar] [CrossRef]
- European Committee for Standardization. EN 15227: 2020, Railway Applications Crashworthiness Requirements for Railway Vehicle Bodies; British Standard Published: London, UK, 2020. [Google Scholar]
- Federal Railroad Administration. Improving Railroad Safety and Rail Passenger Technology Through Targeted Research and Demonstrations, 1992–1997; US Department of Transportation: Washington, DC, USA, 1999. [Google Scholar]
- Carolinev, D. Passenger Rail Train-to-Train Impact Test Volume II: Summary of Occupant Protection Program; US Department of Transportation: Washington, DC, USA, 2003. [Google Scholar]
- Lyu, T.; Xiao, S.; Zhu, T.; Zhang, J.; Wang, X.; Li, Y.; Yang, G.; Yang, B. Optimization of Train Crash Energy Allocation Scheme with Multi-objective Evolutionary Algorithm. China Mech. Eng. 2021, 32, 2262–2267. [Google Scholar] [CrossRef]
- Zhang, J.; Zhu, T.; Wang, X.; Xiao, S.; Yang, G.; Yang, B. Comprehensive Evaluation Model for One-Dimensional Crash Energy Management of Trains. J. Southwest Jiaotong Univ. 2021, 56, 1329–1336. [Google Scholar] [CrossRef]
- Wang, D.; Xu, P.; Yang, C.; Xiao, X.; Che, Q. Crashing performance and multi-objective optimization of honeycomb-filled thin-walled energy absorber with axisymmetric thickness. Mech. Adv. Mater. Struct. 2022. [Google Scholar] [CrossRef]
- Xu, P.; Yang, L.; Yao, S.; Guo, W.; Che, Q.; Wang, A. Collision mechanics parameter design and multi-objective optimization of square cone anti-climbing energy-absorbing structure for urban rail trains. J. Cent. South Univ. (Sci. Technol.) 2022, 53, 1689–1699. [Google Scholar] [CrossRef]
- Ferreira, S.L.C.; Bruns, R.E.; Ferreira, H.S.; Matos, G.D.; David, J.M.; Brandão, G.C.; da Silva, E.G.P.; Portugal, L.A.; dos Reis, P.S.; Souza, A.S.; et al. Box-Behnken Design: An Alternative for the Optimization of Analytical Methods. Anal. Chim. Acta 2007, 597, 179–186. [Google Scholar] [CrossRef]
- Xu, P.; Qu, C.; Yao, S.; Yang, C.; Wang, A. Numerical Optimization for the Impact Performance of a Rubber Ring Buffer of a Train Coupler. Machines 2021, 9, 225. [Google Scholar] [CrossRef]
- Zhao, H.; Xu, P.; Li, B.; Yao, S.; Yang, C.; Guo, W.; Xiao, X. Full-Scale Train-to-Train Impact Test and Multi-Body Dynamic Simulation Analysis. Machines 2021, 9, 297. [Google Scholar] [CrossRef]
- Prasanna, J.; Karunamoorthy, L.; Venkat Raman, M.; Prashanth, S.; Raj Chordia, D. Optimization of process parameters of small hole dry drilling in Ti–6Al–4V using Taguchi and grey relational analysis. Measurement 2014, 48, 346–354. [Google Scholar] [CrossRef]
- Zhang, Y.; Xu, X.; Sun, G.; Lai, X.; Li, Q. Nondeterministic optimization of tapered sandwich column for crashworthiness. Thin-Walled Struct. 2018, 122, 193–207. [Google Scholar] [CrossRef]
- Xu, P.; Xing, J.; Yao, S.; Yang, C.; Chen, K.; Li, B. Energy distribution analysis and multi-objective optimization of a gradual energy-absorbing structure for subway vehicles. Thin-Walled Struct. 2017, 115, 255–263. [Google Scholar] [CrossRef]
- Tosun, N. Determination of Optimum Parameters for Multi-Performance Characteristics in Drilling by Using Grey Relational Analysis. Int. J. Adv. Manuf. Technol. 2006, 28, 450–455. [Google Scholar] [CrossRef]
- Xu, P.; Zhao, H.; Yao, S.; Che, Q.; Xing, J.; Huang, Q.; Xu, K. Multi-objective optimisation of a honeycomb-filled composite energy absorber for subway vehicles. Int. J. Crashworthiness 2019, 25, 603–611. [Google Scholar] [CrossRef]


| Car No. | 0 | 1 | 2 | 3 | 4 | 5 | 6 | 7 |
|---|---|---|---|---|---|---|---|---|
| Mass/t | 43.125 | 45 | 45 | 45 | 45 | 45 | 45 | 45 |
| Impact Interface | Total Stroke (mm) | Draft Gear Stroke (mm) | Collapse Tube Stroke (mm) | Energy Absorption (kJ) |
|---|---|---|---|---|
| M7–M6 | 81.94 | 62 | 19.94 | 43.64 |
| M6–M5 | 92.17 | 62 | 30.17 | 55.89 |
| M5–M4 | 92.58 | 62 | 30.58 | 56.38 |
| M4–M3 | 93.71 | 62 | 31.71 | 57.64 |
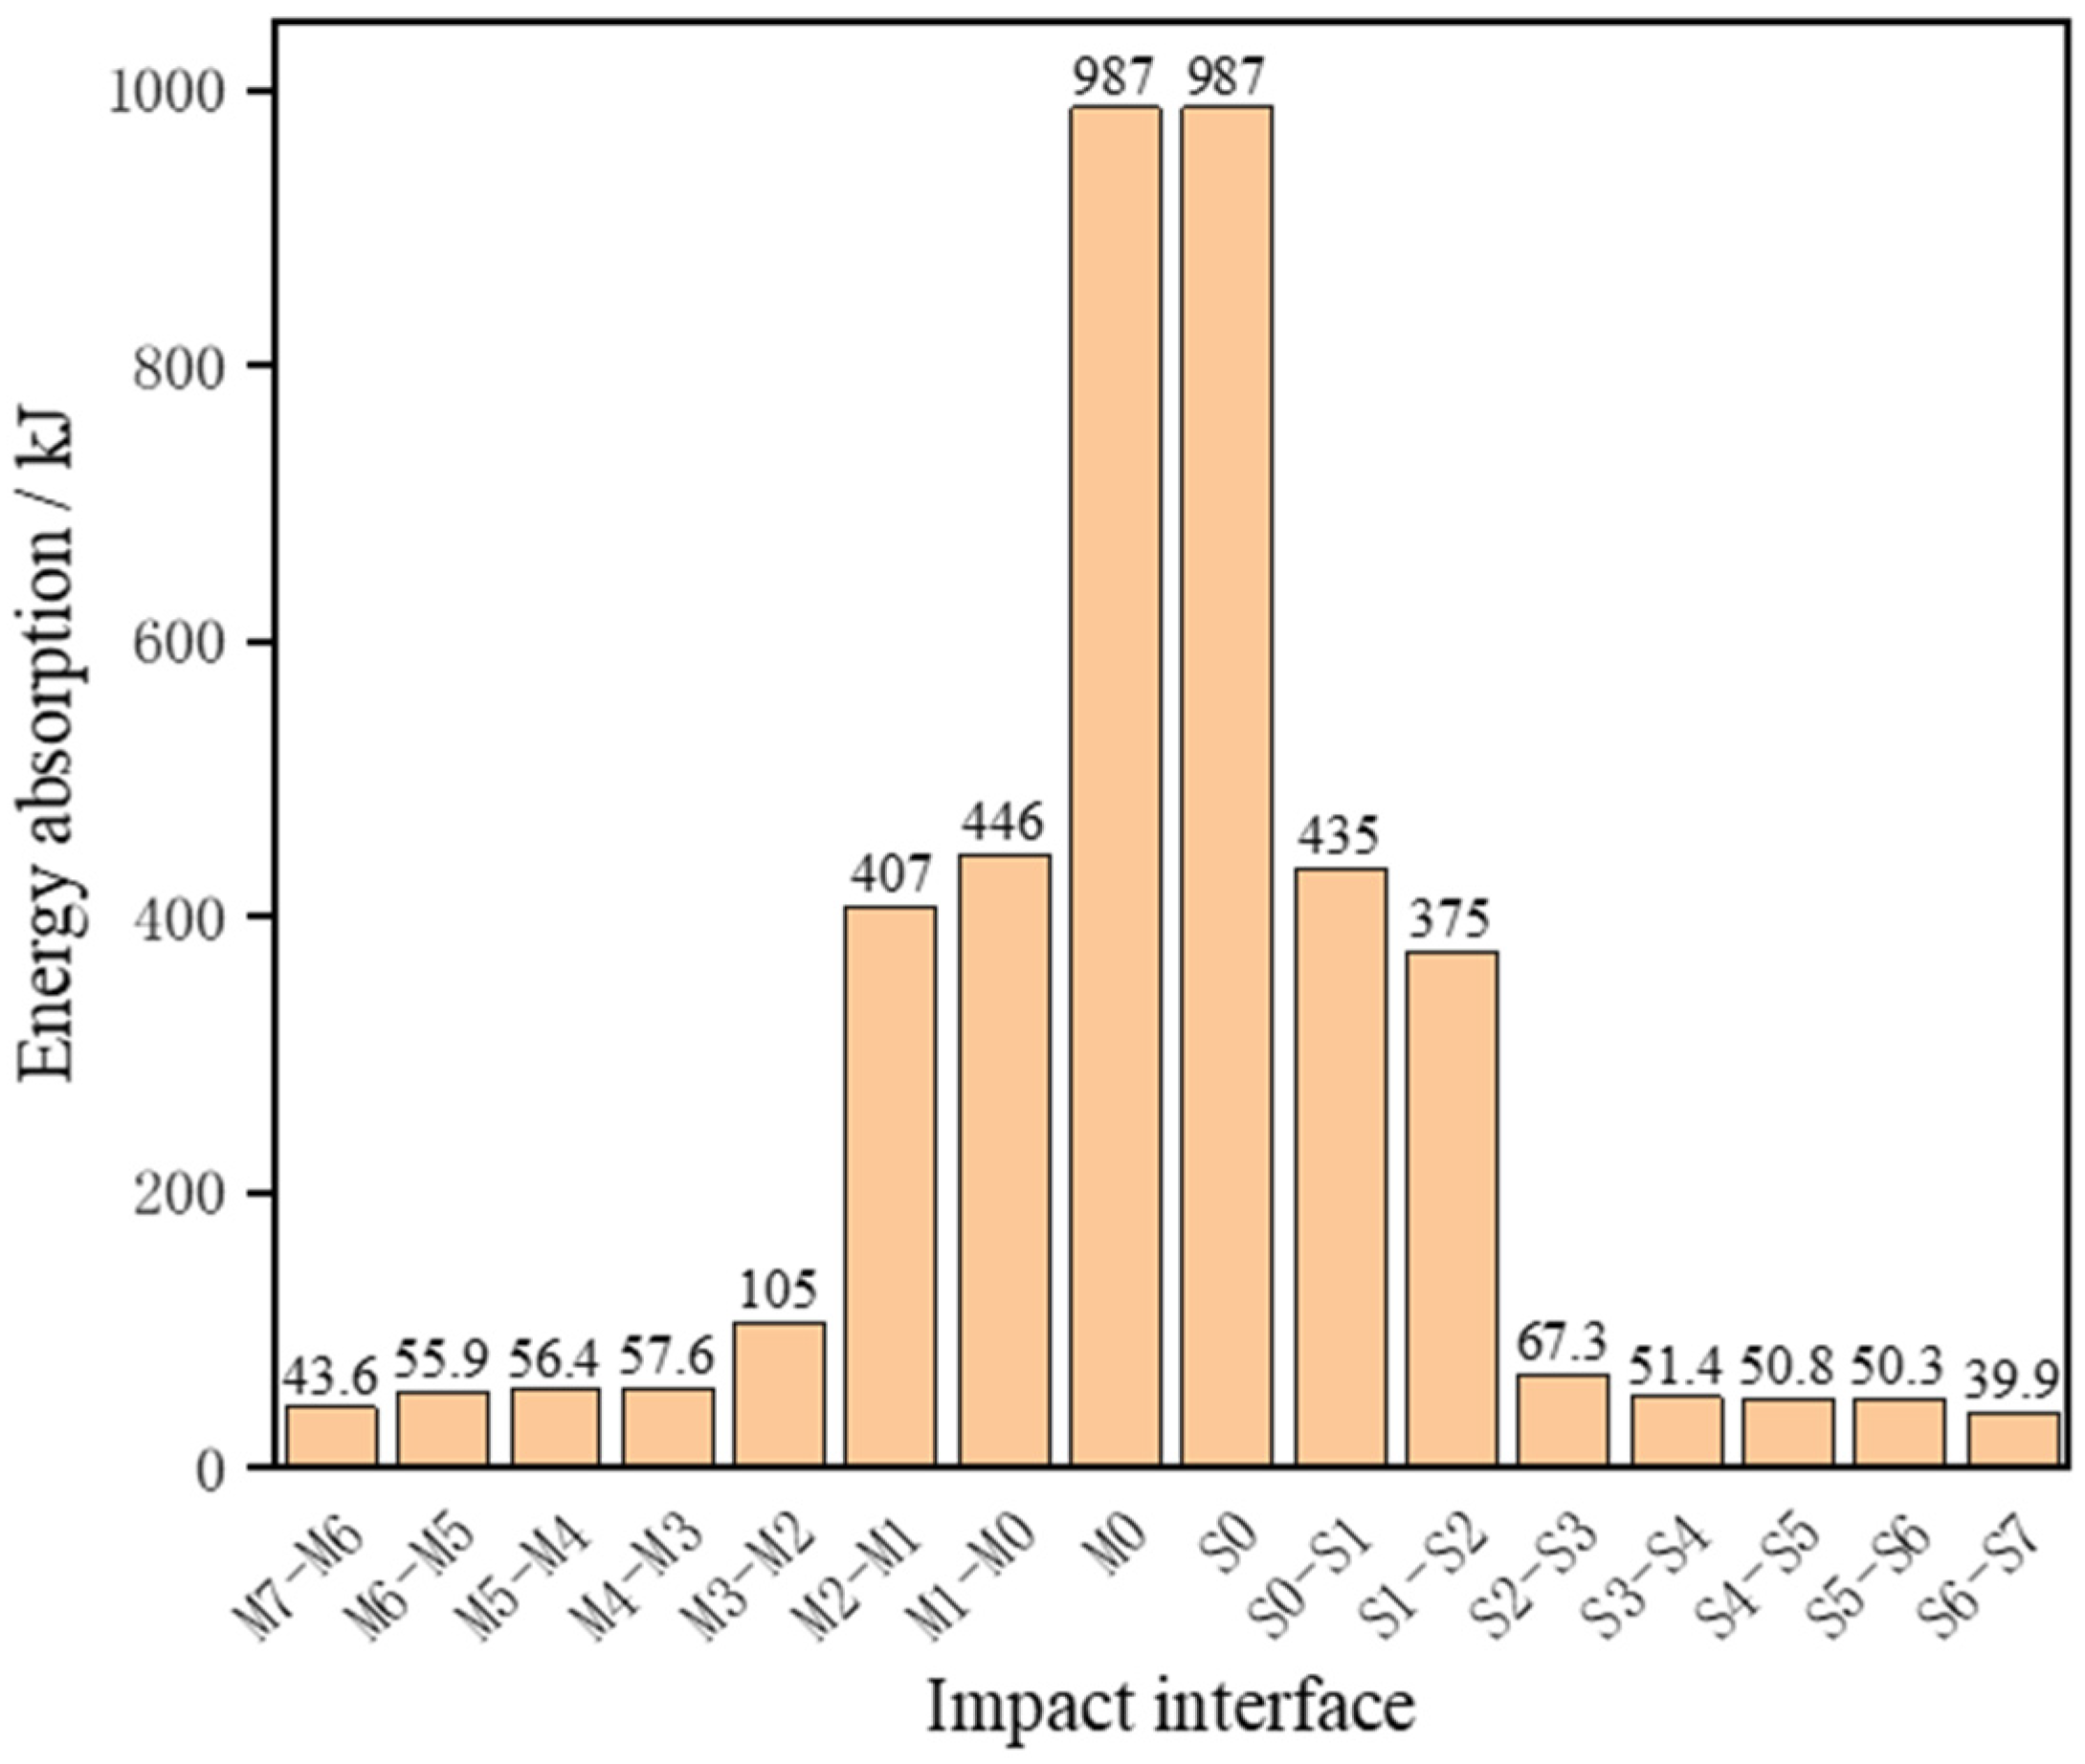
| M3–M2 | 133.19 | 62 | 71.19 | 104.98 |
| M2–M1 | 376.88 | 62 | 314.88 | 407.40 |
| M1–M0 | 390.11 | 62 | 328.11 | 445.96 |
| M0–S0 | 1403.40 | 127 | 570.00 | 1973.82 |
| S0–S1 | 380.23 | 62 | 318.23 | 434.63 |
| S1–S2 | 347.63 | 62 | 285.63 | 375.33 |
| S2–S3 | 94.98 | 62 | 32.98 | 67.35 |
| S3–S4 | 82.95 | 62 | 20.95 | 51.41 |
| S4–S5 | 81.97 | 62 | 19.97 | 50.77 |
| S5–S6 | 81.26 | 62 | 19.26 | 50.28 |
| S6–S7 | 72.44 | 62 | 10.44 | 39.93 |
| NO. | Design Variables | Objective Responses | |||
|---|---|---|---|---|---|
| Fmax (kN) | F (kN) | K | EAAnti (kJ) | EAM3 + EAS3 (kJ) | |
| 1 | 1907.333 | 1650.000 | 1.095 | 1168.056 | 140.724 |
| 2 | 1910.000 | 1550.000 | 0.762 | 1090.335 | 165.814 |
| 3 | 1912.667 | 1750.000 | 1.266 | 1197.483 | 136.907 |
| 4 | 1915.333 | 1600.000 | 0.817 | 1164.991 | 128.919 |
| 5 | 1918.000 | 1700.000 | 0.913 | 1016.583 | 241.729 |
| 6 | 1920.667 | 1675.000 | 1.087 | 1222.256 | 118.361 |
| 7 | 1923.333 | 1800.000 | 1.183 | 1009.102 | 258.380 |
| 8 | 1926.000 | 1475.000 | 0.728 | 1076.205 | 168.505 |
| 9 | 1928.667 | 1675.000 | 1.299 | 1223.757 | 116.445 |
| 10 | 1931.333 | 1625.000 | 0.967 | 1177.866 | 129.140 |
| … | … | … | … | … | … |
| 150 | 2304.667 | 1614.625 | 1.070 | 1200.716 | 128.544 |
| Evaluation Parameters | EAAnti | EAM3 + EAS3 |
|---|---|---|
| ARE (%) | 0.015 | 0.161 |
| R2 | 0.997 | 0.995 |
| RAAE (%) | 0.033 | 0.020 |
| Parameters | Value |
|---|---|
| Maximum Iterations | 50 |
| Minimum Iterations | 25 |
| Population Size | 70 |
| Mutation Rate | 0.01 |
| Elite Population (%) | 10 |
| Random Seed | 1 |
| Distribution Index | 5 |
| Fmax/kN | F/kN | K | EAAnti/kJ | EAM3 + EAS3/kJ | |
|---|---|---|---|---|---|
| Optimization scheme | 1910.739 | 1849.373 | 0.715 | 1131.937 | 187.106 |
| Optimization calculation | The same | The same | The same | 1130.530 | 188.133 |
| Initial calculation | 2106.000 | 1650.000 | 1.000 | 1115.985 | 172.326 |
| Variation | / | / | / | 1.31% | 9.17% |
Publisher’s Note: MDPI stays neutral with regard to jurisdictional claims in published maps and institutional affiliations. |
© 2022 by the authors. Licensee MDPI, Basel, Switzerland. This article is an open access article distributed under the terms and conditions of the Creative Commons Attribution (CC BY) license (https://creativecommons.org/licenses/by/4.0/).
Share and Cite
Xu, P.; Wang, A.; Yang, L.; Che, Q.; Yang, C. Correlation Study between the Mechanical Property of the Square Cone Energy-Absorbing Structure and Collision Energy Distribution for Urban Rail Trains. Machines 2022, 10, 747. https://doi.org/10.3390/machines10090747
Xu P, Wang A, Yang L, Che Q, Yang C. Correlation Study between the Mechanical Property of the Square Cone Energy-Absorbing Structure and Collision Energy Distribution for Urban Rail Trains. Machines. 2022; 10(9):747. https://doi.org/10.3390/machines10090747
Chicago/Turabian StyleXu, Ping, Ao Wang, Liting Yang, Quanwei Che, and Chengxing Yang. 2022. "Correlation Study between the Mechanical Property of the Square Cone Energy-Absorbing Structure and Collision Energy Distribution for Urban Rail Trains" Machines 10, no. 9: 747. https://doi.org/10.3390/machines10090747