1. Introduction
Means of transport must fulfil their main function safely and comfortably for travellers and drivers. In the most common means of land transport (train, car, coach, or bicycle), many redesigns have been implemented to minimise the effect of vibrations on the bodies of the people who use them, thus increasing user comfort.
The effects of vibrations on the human body depend on their frequency characteristics. The effects on ride comfort are in the frequency range of 0.5 to 80 Hz as indicated in the standard UNE-ISO-2631: 2008.
Although these vibrations can also be mitigated by improving the pavement or track for trains, we focus on the state of the art in the intrinsic improvements of each of the indicated means of transport. For railways, several investigations have focused on the type or design of the wheel [
1,
2], and the optimisation of suspension elements [
3,
4,
5]. Similarly, several studies have focused on improving the comfort of car passengers by redesigning tyres [
6,
7] and, most importantly, optimising the suspension elements [
8,
9]. Other authors have also considered other elements such as the vehicle–body interfaces, including the seats [
10]. Some research has also been conducted on comfort in other types of transport, such as motorcycles [
11], bicycles, or trucks [
12].
Thus, the influence of vibrations on the comfort and health of users of common methods of transport has been extensively investigated. A basic regulation of the influence of these vibrations is UNE-ISO-2631: 2008 [
13], which defines methods of evaluating the effect of vibrations received by the entire body standing, lying down, or sitting through the processing of received accelerations. This standard provides guidance on the degree of comfort as well as possible effects on health according to the level of vibration received and exposure time. For railways, the UNE-EN12299: 2010 [
14] regulation was developed; based on the previous regulation, it evaluates the comfort of railway passengers by evaluating the vibrations received by the entire body, standing or sitting.
Moreover, in recent years, increasing interest in mitigating the effects of climate change has resulted in the development of electric traction vehicles [
15]. In this regard, solutions are also being developed to solve the problem of the ‘last mile’ (the final route to reach an urban destination). Thus, several electric vehicle rental companies have been created, including for cars, motorcycles, bicycles, and electric scooters (e-scooters). E-scooters, within the so-called micro-mobility, have been a new transport option for a few years because they are cheap and attain speeds of more than 25 km/h. Additionally, their use has been increasing at the user level and has expanded with the advent of e-scooter rental companies in the main urban centres worldwide.
Existing research on this new type of transport is very recent and is oriented towards the following main aspects:
Regulation, standards, and policies [
16,
17,
18];
Battery charging and charger distribution [
19,
20,
21];
Usage patterns and organisation in different cities [
22,
23,
24];
Pollution or sustainability [
31,
32,
33].
The literature on the design of e-scooters and its influence on the comfort and health of the user or driver is scarce [
34,
35,
36,
37]. Cano-Moreno et al. [
34] proposed a methodology based on the dynamic simulation of multibody systems to study and analyse the vibrations received by a driver depending on two types of tyres: rigid and flexible. With this methodology [
35], the impact of vibrations on the comfort and health of the driver was statistically modelled, including scooters with or without front suspension. The results indicated that the vibrations have an influence within the speed range they reach (more than 25 km/h) because, depending on whether they have front suspension, e-scooters begin to be uncomfortable from 17 km/h for pavements with very low or low roughness.
Cafiso et al. [
36] measured and compared the accelerations on an e-scooter, bicycle, and car from a comfort perspective. However, their research focused mostly on detecting the state of the pavement through the root mean square (RMS) values of the accelerations. These values were obtained using a mobile device with a sampling frequency of 25 Hz. Antoniazzi and Davoli [
37] applied the methodology suggested by Cano-Moreno et al. [
34] and measured the vibrations received by e-scooters on different pavements and at different speeds to assess their influence on driver comfort. However, the sampling frequency was not well defined in their study, and the equipment used had a default sampling frequency of 10 Hz. These sampling frequencies are a limitation of these studies that assess comfort because, according to the Nyquist criterion, the sampling frequency must be at least twice the frequency of the signals that are of interest. In the filters of the UNE2631 standard, the study or limiting bands reach 100 Hz; therefore, a sampling frequency of at least 200 Hz is recommended.
In this study, an Arduino-based measurement instrument was designed and used to measure the effects of vibrations received on an e-scooter.
For these measurements, a sampling frequency of 200 Hz was used to fulfil the Nyquist criterion. Several actual measurements were performed on two types of pavements on a sensorised e-scooter, and the speed of advance and the accelerations received by the frame of the scooter were recorded. The type of e-scooter that does not use additional suspension for the wheels and pneumatic wheels is widely used by both private users and rental companies. In addition to the type of pavement, bumps were included in both pavements for two driving modes, namely, ECO, which limited the speed to approximately 20 km/h, and maximum speed (MAX), which enabled reaching a maximum speed of approximately 28 km/h. Moreover, the influence of the driver’s weight on comfort was studied. The tests were performed by two different drivers: one with a weight of 90 kg, and another with a weight of 115 kg. With these measurements, the influence of the different studied parameters on comfort was analysed through the processing of the actual vibrations received through the scooter from the perspective of the entire body.
2. Materials and Methods
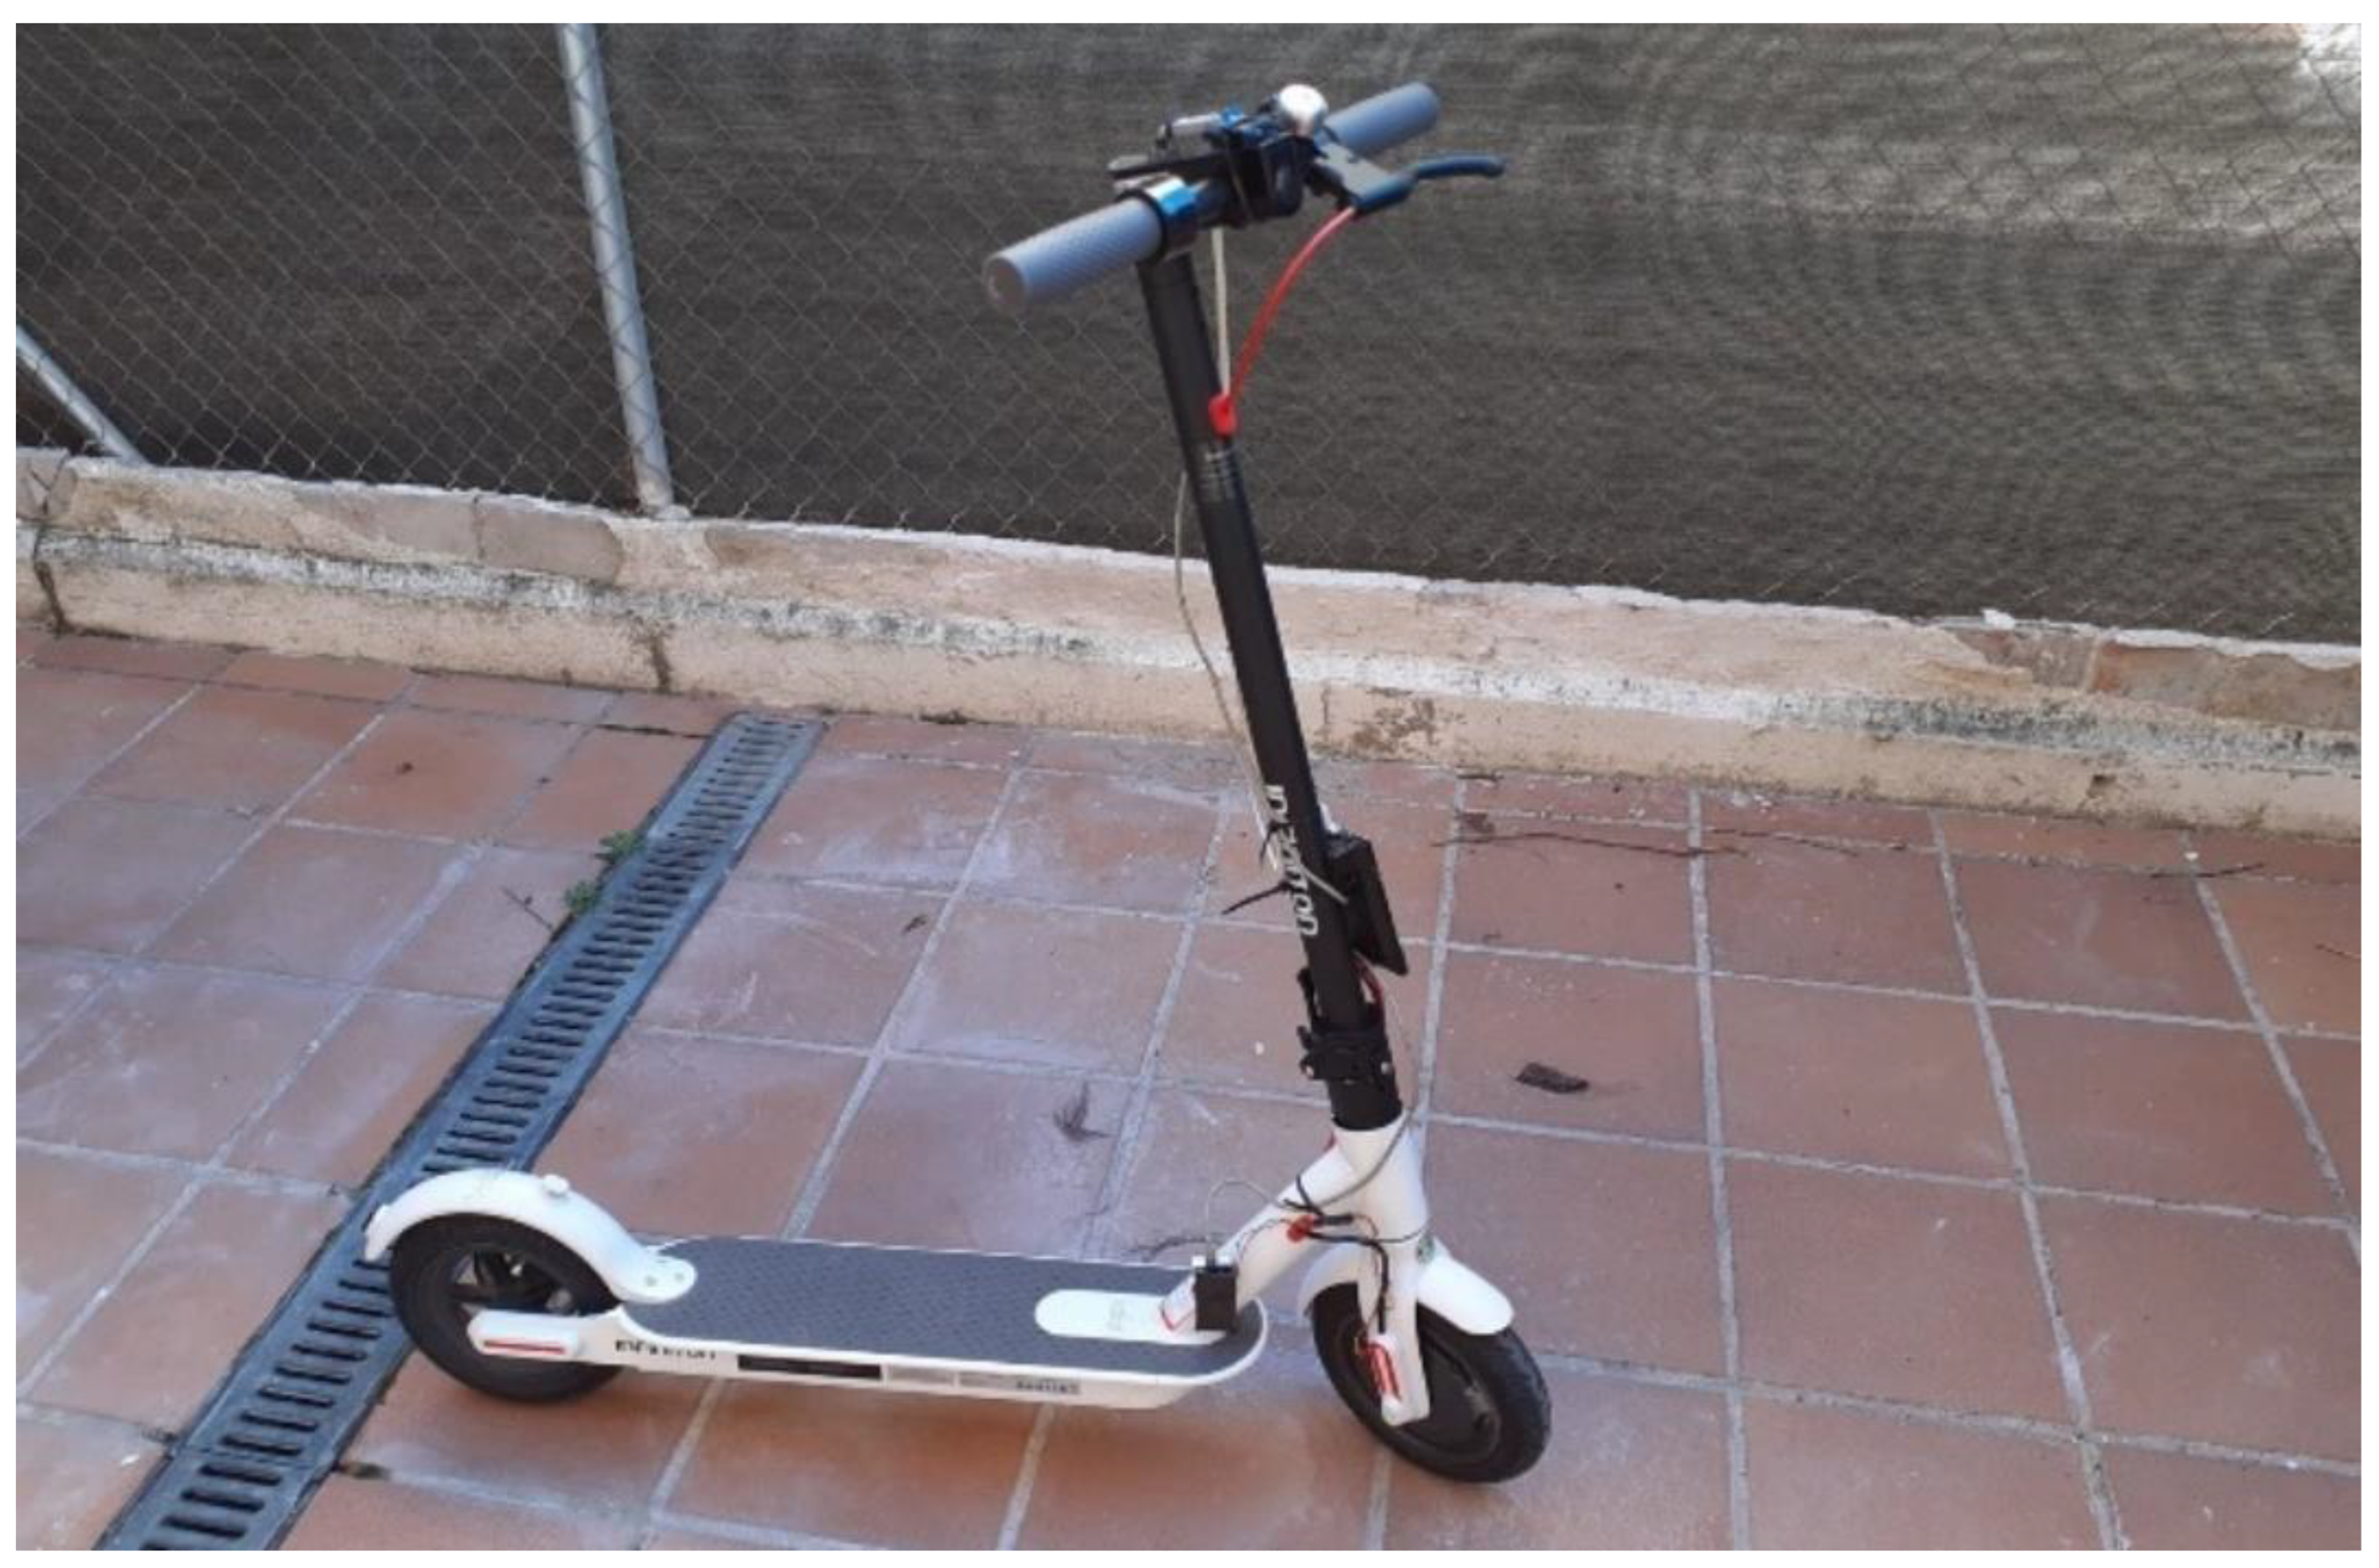
For this study, an Infiniton Electronics brand e-scooter [
38], the CityCross model, was used. The e-scooter has 8.5-inch inflatable wheels, has a range of 15–20 km, and supports a maximum weight of 120 kg. The e-scooter is primarily fabricated from aluminium, weighs 10 kg, and reaches a maximum speed of 28 km/h. It has two speed modes (speed limited to 20 km/h and the maximum speed).
Figure 1 shows the e-scooter used with the integrated components.
2.1. Design and Assembly of Arduino Data Acquisition System (ADAS) onto an Actual E-Scooter
The measurement objective of this first investigation was to obtain the accelerations that influence the driving comfort of the electric scooter as well as the speed at which it moves. Vertical acceleration is practically the only factor that influences comfort, but the accelerations in the direction of travel and the normal direction provide complete knowledge of the movement of the vehicle. Therefore, given that the available hardware was three-dimensional, the three accelerations and the magnetic signal of the neodymium magnet installed in the wheel for speed control were recorded.
The Nyquist criterion states that the sampling frequency must be twice the maximum frequency to be considered (80 Hz), which ensures its reproduction. This would provide a minimum sampling frequency of 160 Hz, which we increased to 200 Hz to include vibration frequencies up to 100 Hz, which is the limit established by the UNE-2631 standard in the limiting bands of the filters used. The system was tested up to 400 Hz without problems, but it was adjusted to 200 Hz to optimise the resulting computational cost of signal post-processing.
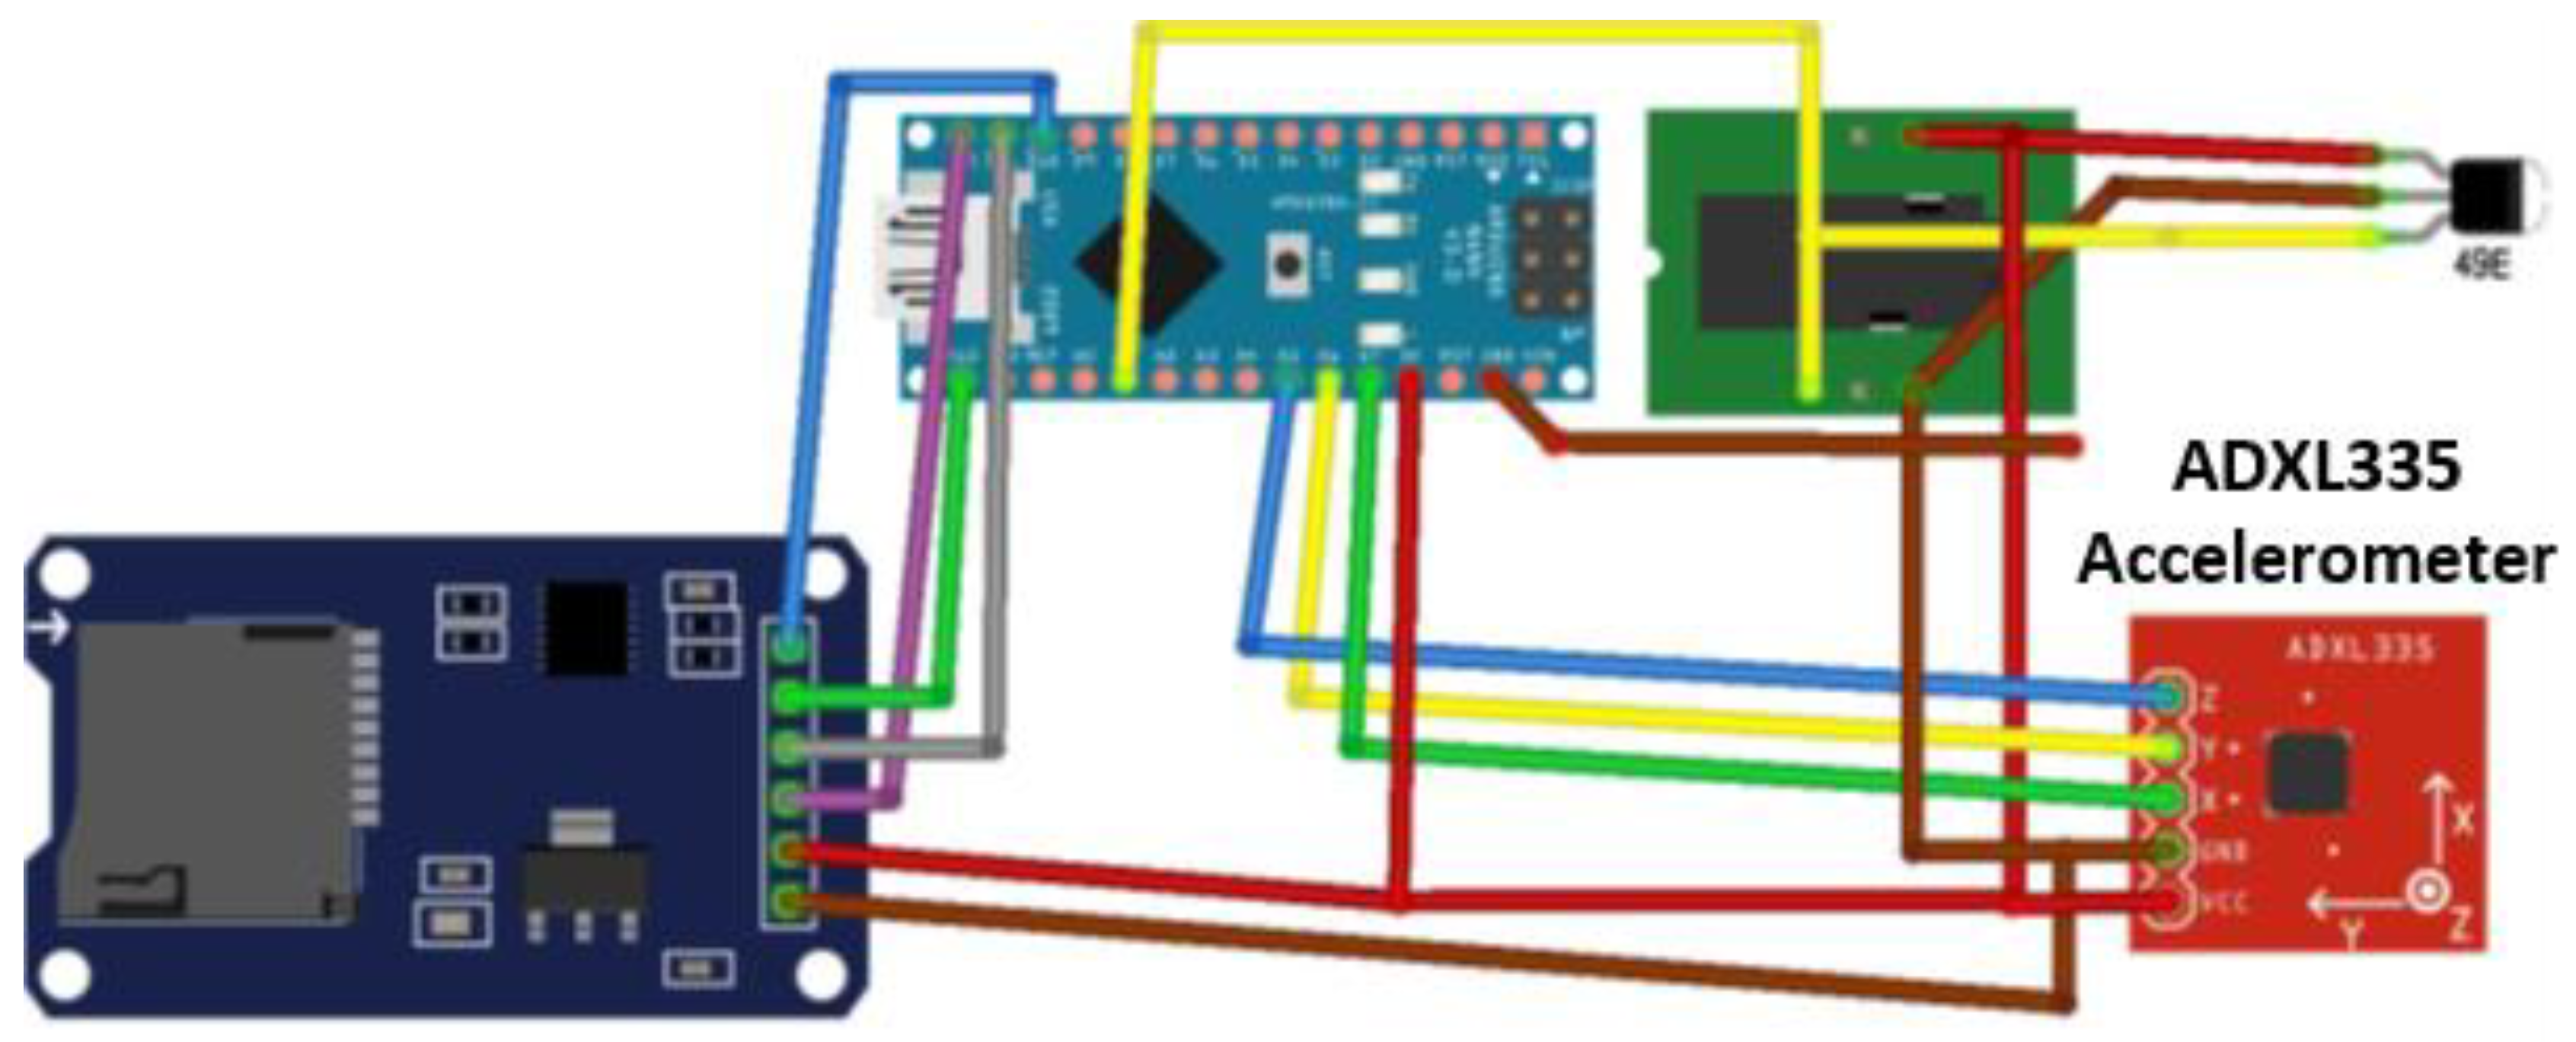
The system was based on a microcontroller from the Arduino family, the Nano, which converted the signal from the accelerometers and Hall linear magnetic detector through analogue–digital converters into integer values that were stored in text files on an SD card. These files are readable by any program and are easily converted to Excel files or processed by the MatLab software developed in this work.
2.1.1. Components
Figure 2 shows a diagram of the assembly of the measurement system.
The Arduino Nano 3.x microcontroller is based on an 8-bit Atmel ATmega328p processor with an AVR RISC architecture. It has 32 kB ISP flash memory, 2 kB SRAM, and 1 kB EEPROM. This provides 14 digital input and output pins, eight 10-bit analogic input pins, and a 5 V power and data USB connection. With a consumption of 19 mA and a plate size of 18 mm × 45 mm, it is ideal to be placed on a scooter without interfering with the passenger. The 10-bit analogue inputs have a total resolution of 1024 levels for a minimum value of 0 V and a maximum value between 1.1 and 5 V. Here, the sensors, accelerometers, and Hall have rest voltages of 1.5 and 2.5 V; therefore, the maximum reference is fixed at 5 V, coinciding with the battery power. This results in a resolution of 5 mV per level of analogic reading.
The AH49E Hall-effect linear magnetic sensor has a sensitivity of 1.6 mV per gauss of magnetic field and a voltage of 2500 mV at 0 G; therefore, it can measure up to 1600 G. At the adjustment distances, the neodymium magnet used produced a maximum field of approximately 1100 G, which was within the range of the sensor. With a linear detector, the speed per period between peaks and information on the direction of rotation were obtained. The maximum achievable speed was approximately 30 km/h, with a wheel diameter of 22.0 cm under a load, and a maximum wheel rotation frequency of 12.0 Hz was obtained. With a sample rate of 200 Hz, a minimum resolution of approximately 21° was obtained, which was less than the angle affected by the magnet.
The data were saved on a MicroSD card of the SD, SDC, and SDHC standards, using FAT16 or FAT32 formats. The capacity required to record the measurements of a path was derived from the length of the measurement record, on average 29 B, and the number of measurements per path. In the paths used in this study, the measurement time ranged between 50 and 70 s; therefore, the work registration time was set to 90 s to avoid losing relevant information in acceleration and deceleration. With a sampling rate of 200 Hz, we had a data requirement of 5800 B/s, which was theoretically well below the capacity of the serial peripheral interface (SPI) protocol. The total length of the file was 526 kB, including the additional information necessary for storage on the SD cards. With 1 GB cards, there is no limitation in the size of the register of a path, and the limitation in frequency results from the processing capacity of the Arduino itself.
2.1.2. Software
In Arduino applications, the size of the program and memory used is a decisive aspect. In this study, the program occupied less than 50% of the 30 kB capacity, and more than 50% of the 2 kB dynamic memory was used. This facilitated a certain margin of sophistication in the program, but processing capacity was always considered the most restrictive limit.
Arduino programs have a global part, where global objects used everywhere in the program are declared and created; an initialisation part, setup(), where initial values are indicated and the created objects are tested; and a loop that repeats indefinitely, loop(), where the task of reading and writing the data is performed. The loop ends when the maximum recording time is reached, at which point the file is closed, and the recording stops.
It has been observed that the communication process between the processor and SD card presents small delays in some scenarios. To avoid the accumulation of these delays and obtain the most regular sample possible, we ensured that measurements were performed as close as possible to the corresponding real time. This procedure produces the distancing or grouping of some data but guarantees the average sampling frequency is the desired one.
The data were stored directly in plaintext, but encryption was considered to reduce the length of the record and thus possibly increase the sampling rate. Therefore, the increase in processing operations for encrypting the information was rejected as it did not compensate for the gain owing to the decrease in data flow. Furthermore, the ease of processing and debugging that plaintext offers was lost.
2.1.3. Integration into an Actual E-Scooter
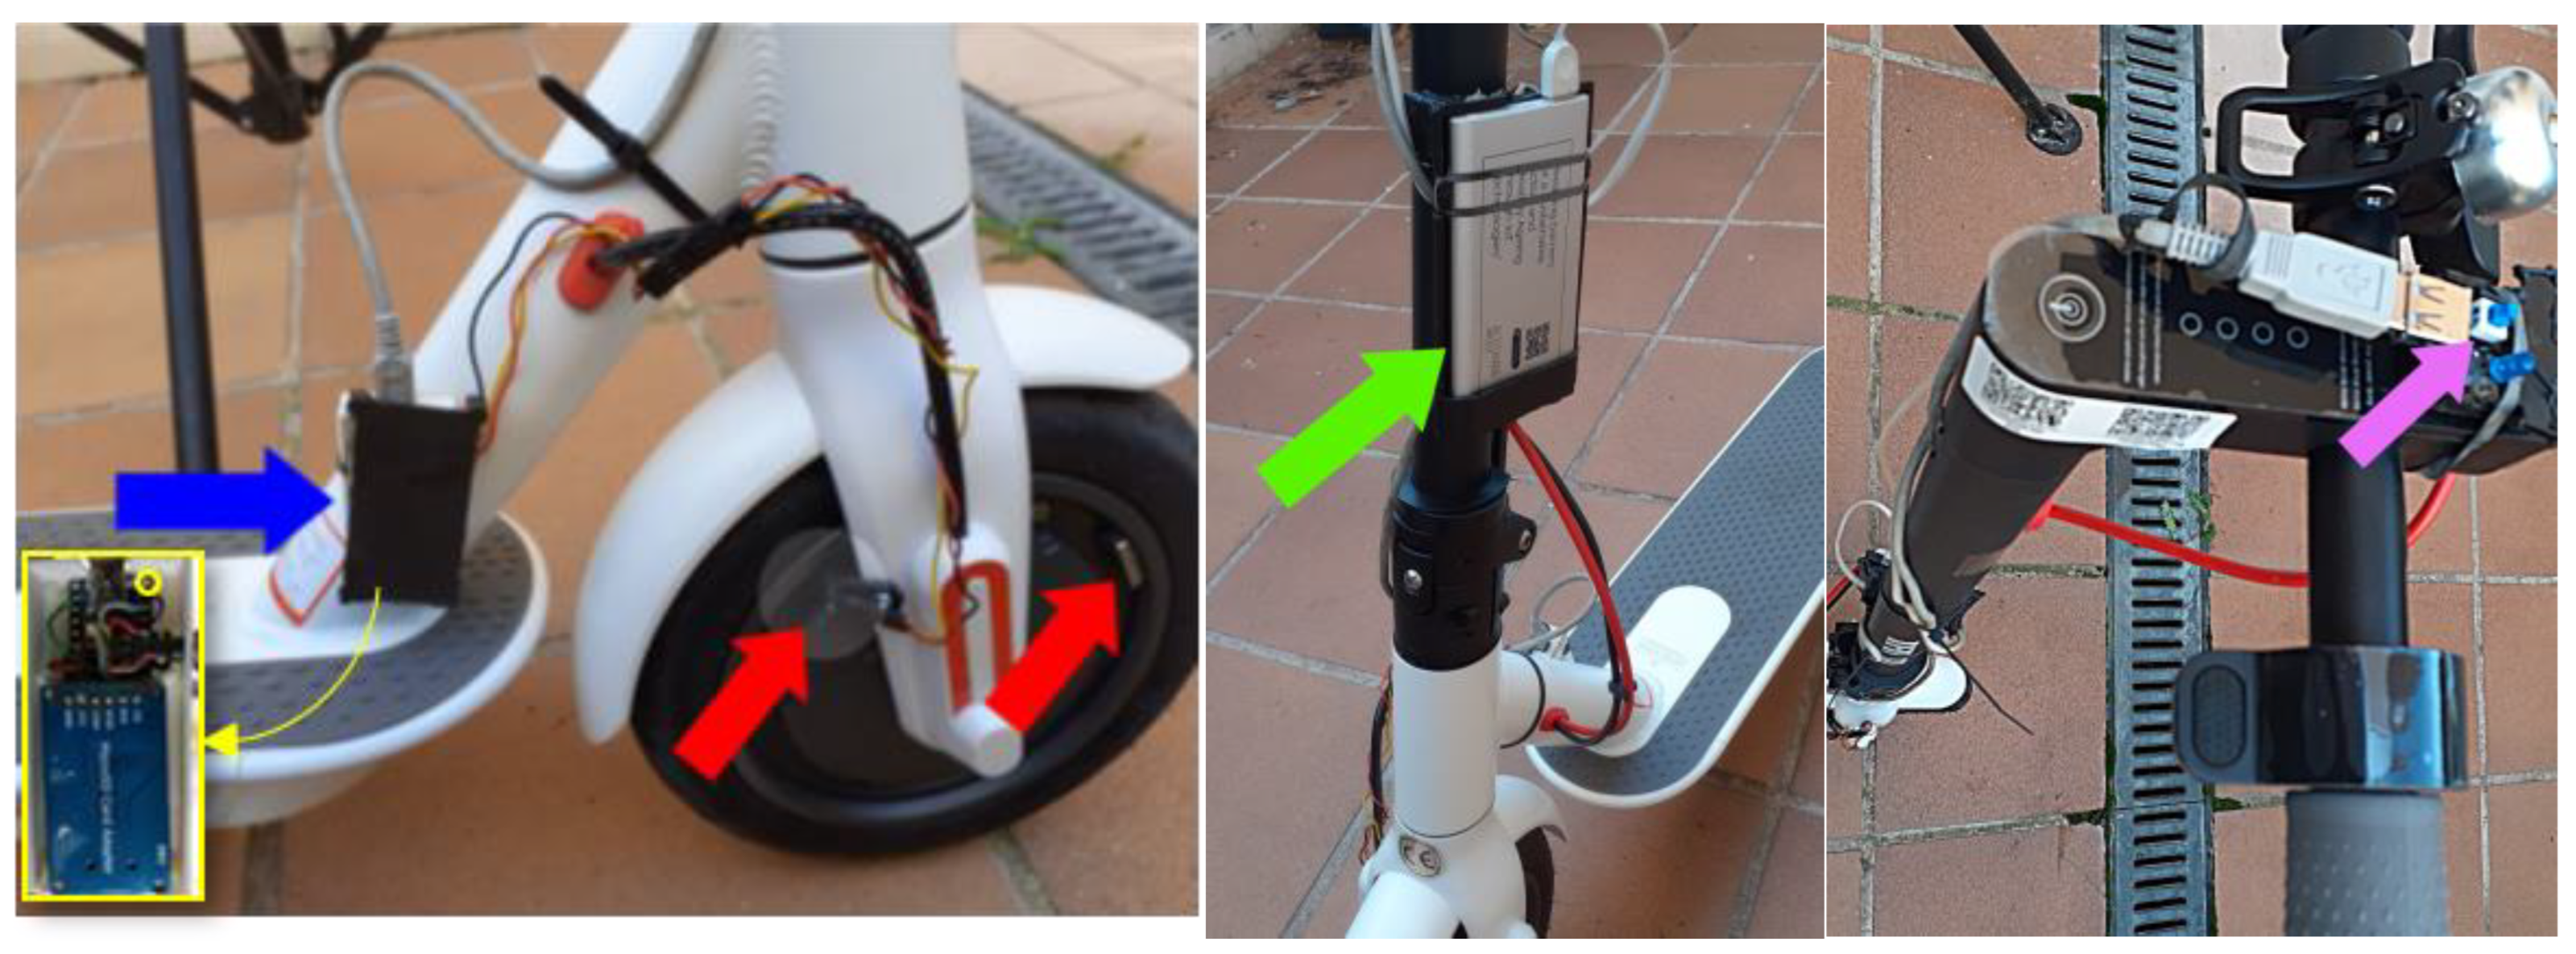
Figure 3 shows the physical installation of the recording system.
The blue arrow indicates the box (4 cm × 7 cm) that contained the Arduino, SD reader, and accelerometer (ADXL335), which was fixed by screwing it directly to the chassis of the scooter with an M3 screw placed at the yellow ring location indicated in
Figure 3. The red arrow on the left points to the 49E auto-switch, and the one on the right points to the magnet attached to the wheel. The green arrow indicates the position of the lithium battery that powered the system, and the purple arrow shows the switch and LEDs that indicated the data-recording process.
The placement of the accelerometer at the base of the chassis and its strong fixing using a metric screw guaranteed that the accelerations received were close to those received by the user, at least at the front. The system consumption is low (less than 50 mA); therefore, the battery used guaranteed power for the measurement sessions.
Scooters with small wheels, a small caster angle, and a short wheelbase are significantly more unstable than bicycles and motorcycles with much larger wheels, a greater caster angle, and a much longer wheelbase. This instability forces the user to keep both hands on the scooter’s handlebars and to maintain an upright and stable posture for as long as possible. This is the reason for placing the system switch at the top of the scooter handlebars. Previous tests in other positions have produced small accidents or incidents when the handlebars were left or unstable positions were adopted.
2.2. Effects of Vibrations on Ride Comfort
The analysis of the effects of vibrations transmitted by the e-scooter to the human body is based on the filters and criteria of the UNE-2631 standard [
13]. This standard defines methods of quantifying vibrations in the entire body according to the position in which they are received, whether sitting, standing, or lying down, following the reference systems indicated in
Table 1. In this study, the three axes were considered for the ‘standing’ position (longitudinal (
x axis), lateral (
y axis), and vertical (
z axis)) as directions of vibration input to the human body.
To measure the effects of vibrations on the driver of the e-scooter, we measured accelerations on the frame of the e-scooter according to the three axes indicated above. Although the actual vibration that reaches the driver may be slightly damped, depending on the footwear used, this assumption presents the worst case corresponding to the use of very rigid footwear.
This section describes the method used to evaluate vibration based on the UNE-2631 standard [
13]. This method is called the ‘basic evaluation method using the RMS value of weighted acceleration’. This method requires the calculation of the RMS value of the frequency-weighted linear acceleration of each axis
during the exposure time
.
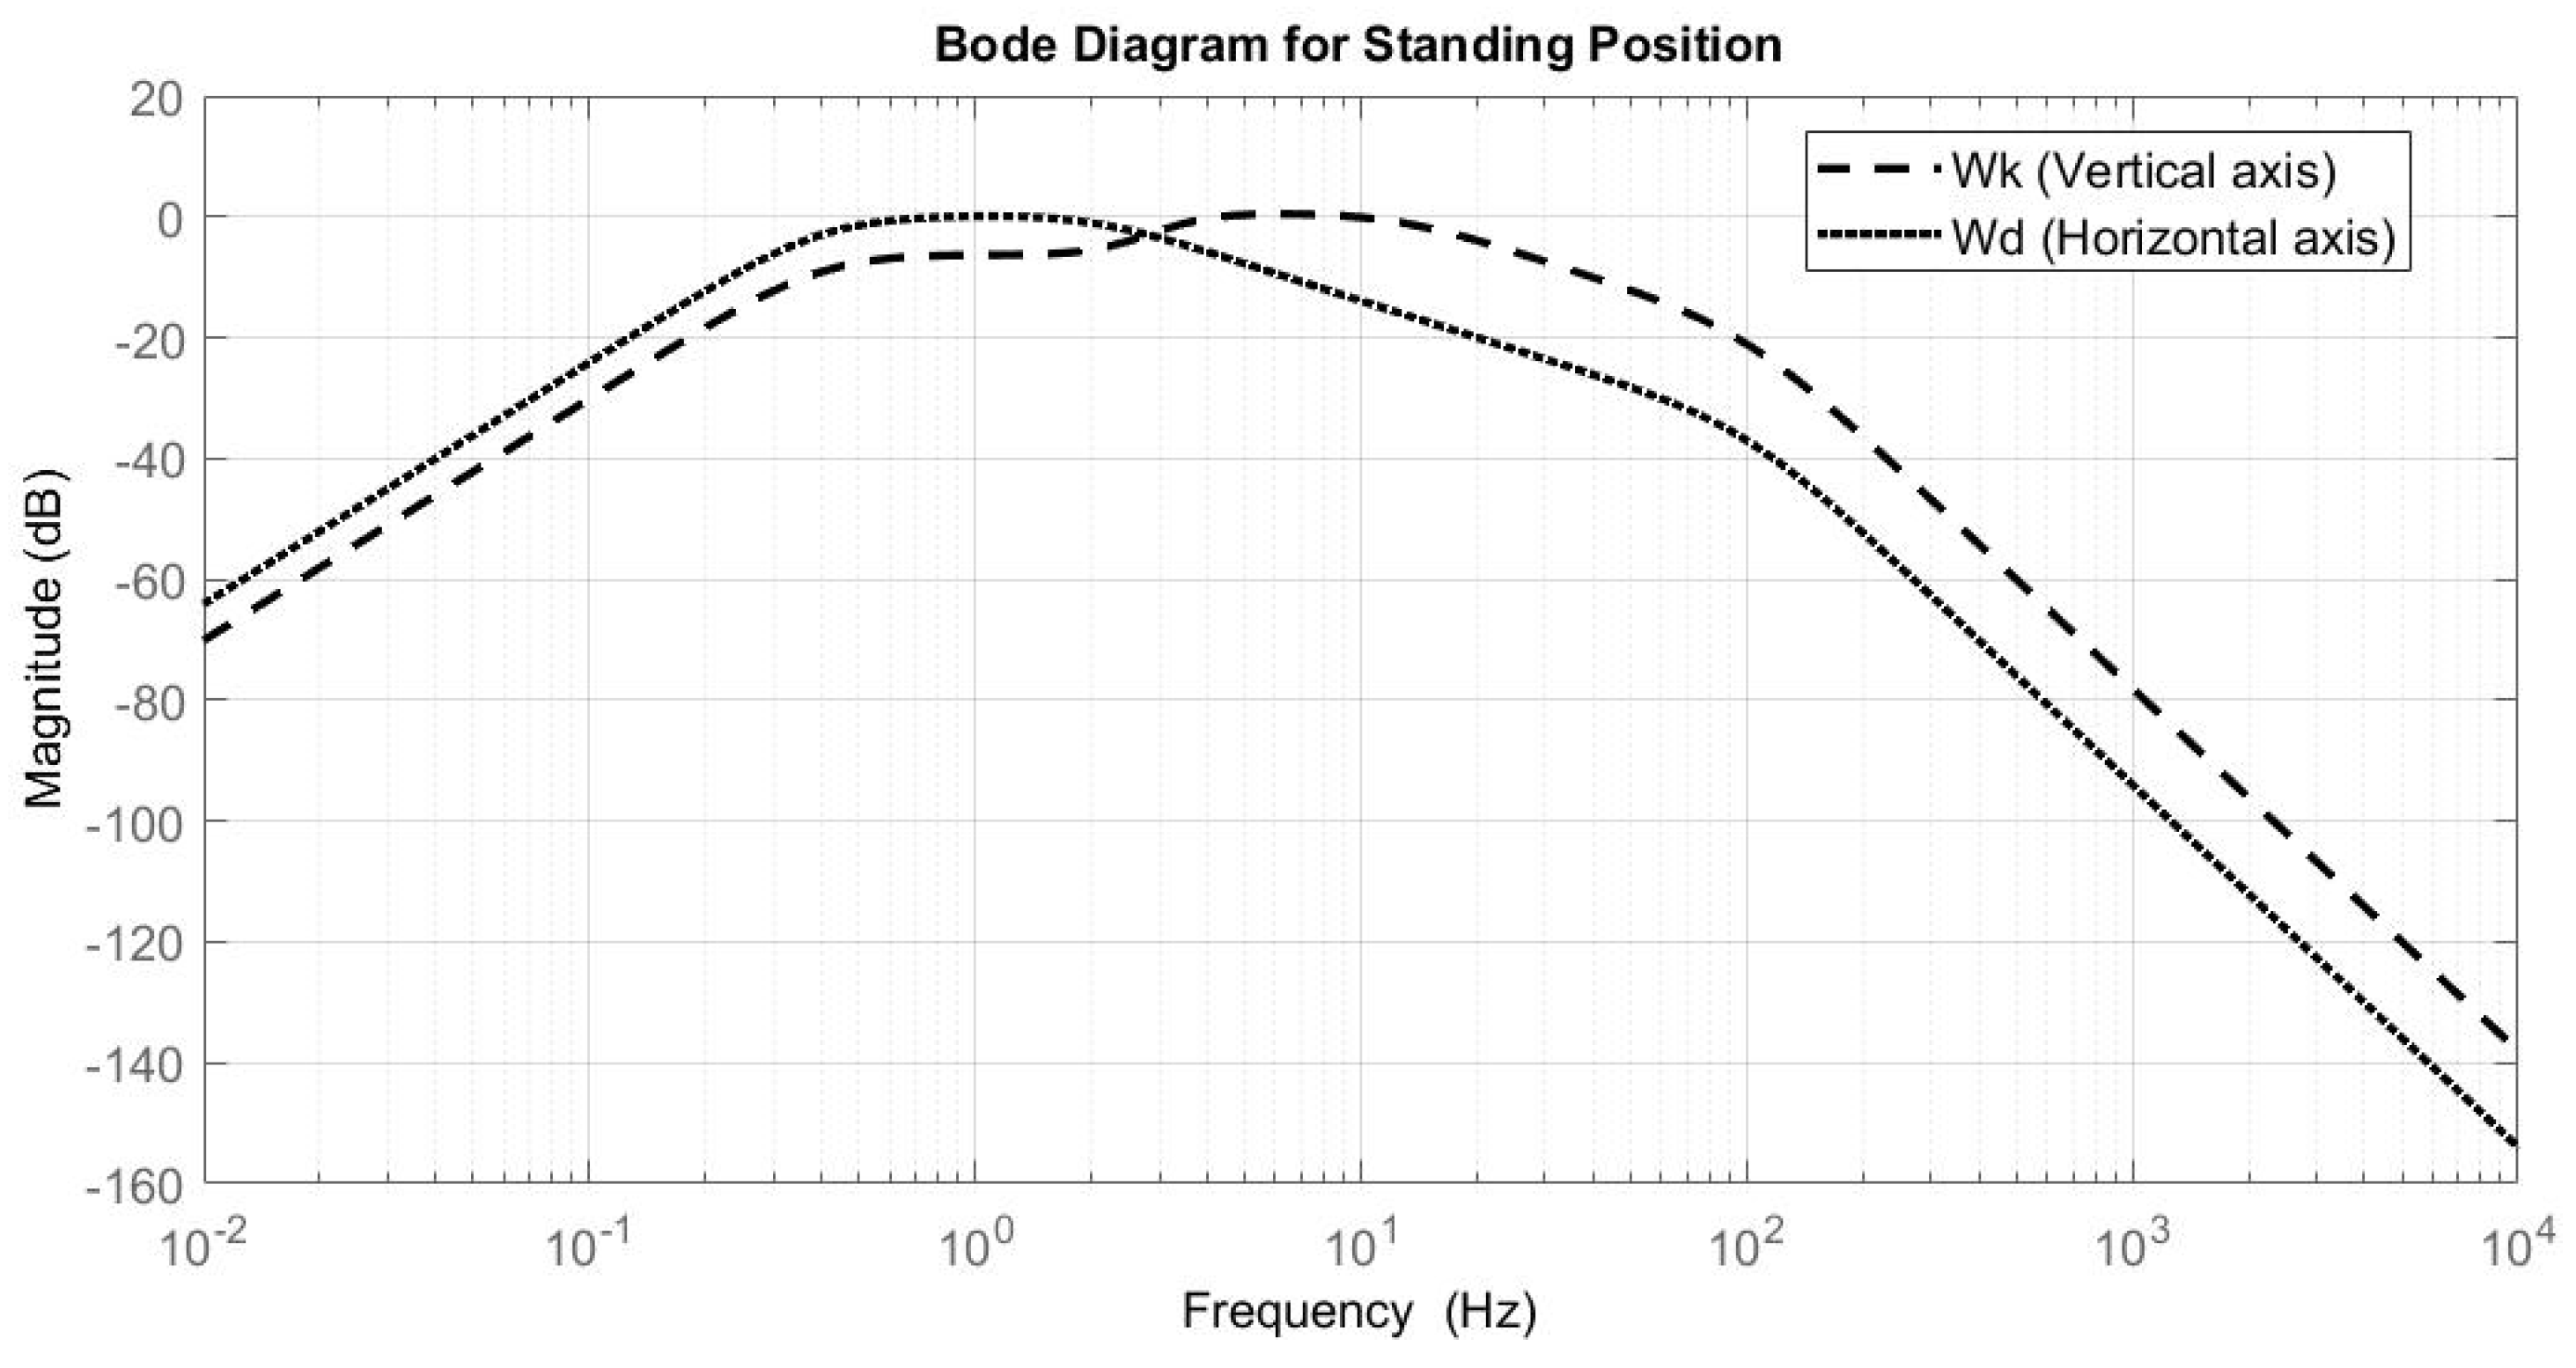
The effect of vibrations on the human body depends on their frequency characteristics. The effects on ride comfort are in the frequency range of 0.5 to 80 Hz. For this, a series of filters are applied that weigh the amplitude of the accelerations according to their frequency. The UNE-2631 standard defines a filter for each axis. Thus, for the longitudinal and lateral axes (horizontal axes), it recommends the application of a filter called , whereas for the vertical axis, it recommends a filter called . Both filters are composed of three types of filters:
Limiting band, which includes a low-pass filter () and a high-pass filter (). For and filters, the UNE-2631 standard establishes a band from 0.4 to 100 Hz.
Acceleration–velocity transition, .
Scale-up,
These functions are described in greater depth in the UNE-2631 standard and the methodology described by Cano-Moreno et al. [
34]. Therefore, the total weighting function applied to the measured accelerations is
where
, which is a complex number that corresponds to the imaginary angular frequency, which can also be interpreted as a variable of the Laplace transform.
Figure 4 shows the Bode diagram of the total transfer functions corresponding to the horizontal axes (
x and
y) and vertical axis (
z).
When the frequency-weighted RMS acceleration is calculated for each axis, the total vibration values for each measurement
are obtained and can be expressed as follows:
For the comfort of the e-scooter driver, the total vibration value of each measurement was compared with the values indicated in the UNE-2631 standard, which are summarised in
Table 2, and the subjective sensation of human beings regarding ride comfort was defined as a function of the frequency-weighted RMS acceleration values.
The integration of hardware and sensors in the e-scooter enabled the measurement of the instantaneous accelerations received by the driver in the three directions of space as well as the linear forward speed. The post-processing of the measured data facilitated the assessment of ride comfort perceived by an e-scooter driver.
2.3. Design of the Experiment
For the experimental phase, a specific model of an e-scooter was used: EasyWay CityCross [
38], whose theoretical maximum speed is 28 km/h and admits drivers up to 120 kg in weight.
Table 3 lists the main characteristics of the experiments. The tyre pressures [
39] were valid for both drivers, despite their weight difference.
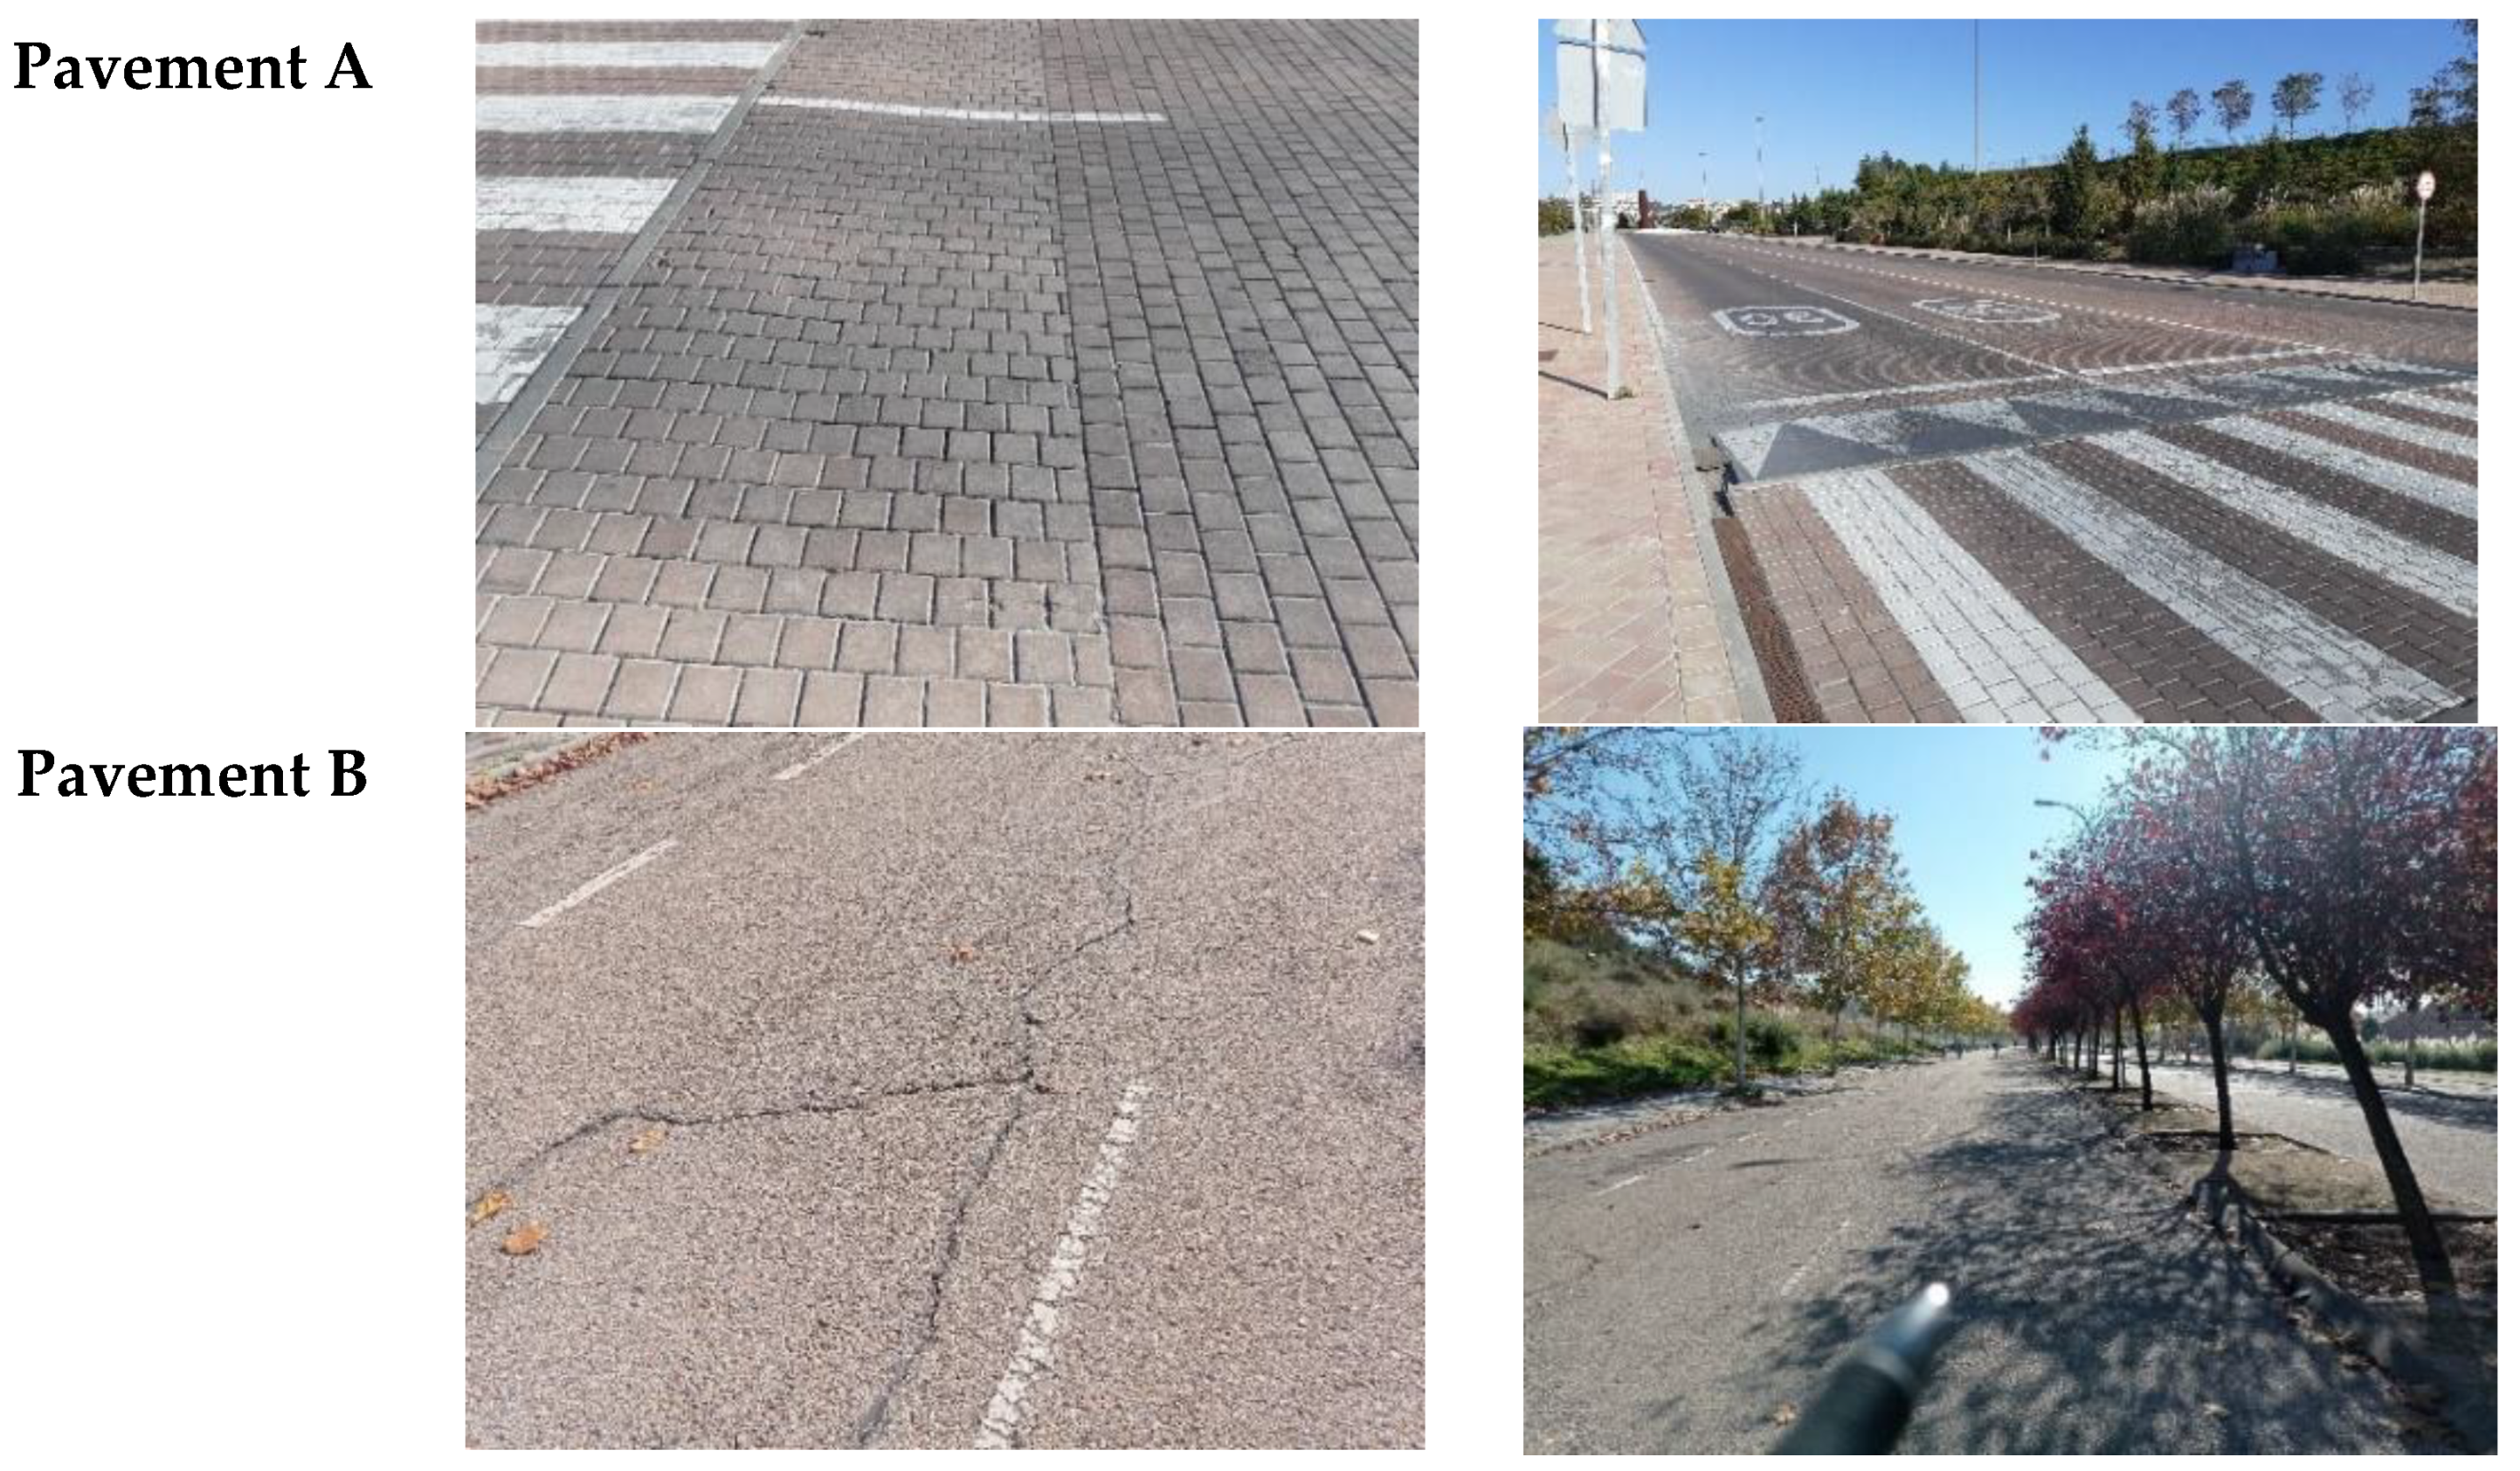
As indicated in
Table 3, two types of pavements were selected: the first was a regular cobbled pavement (pavement type A), with pavers (
, while the other was an asphalt pavement (pavement type B).
Figure 5 shows both types of pavements.
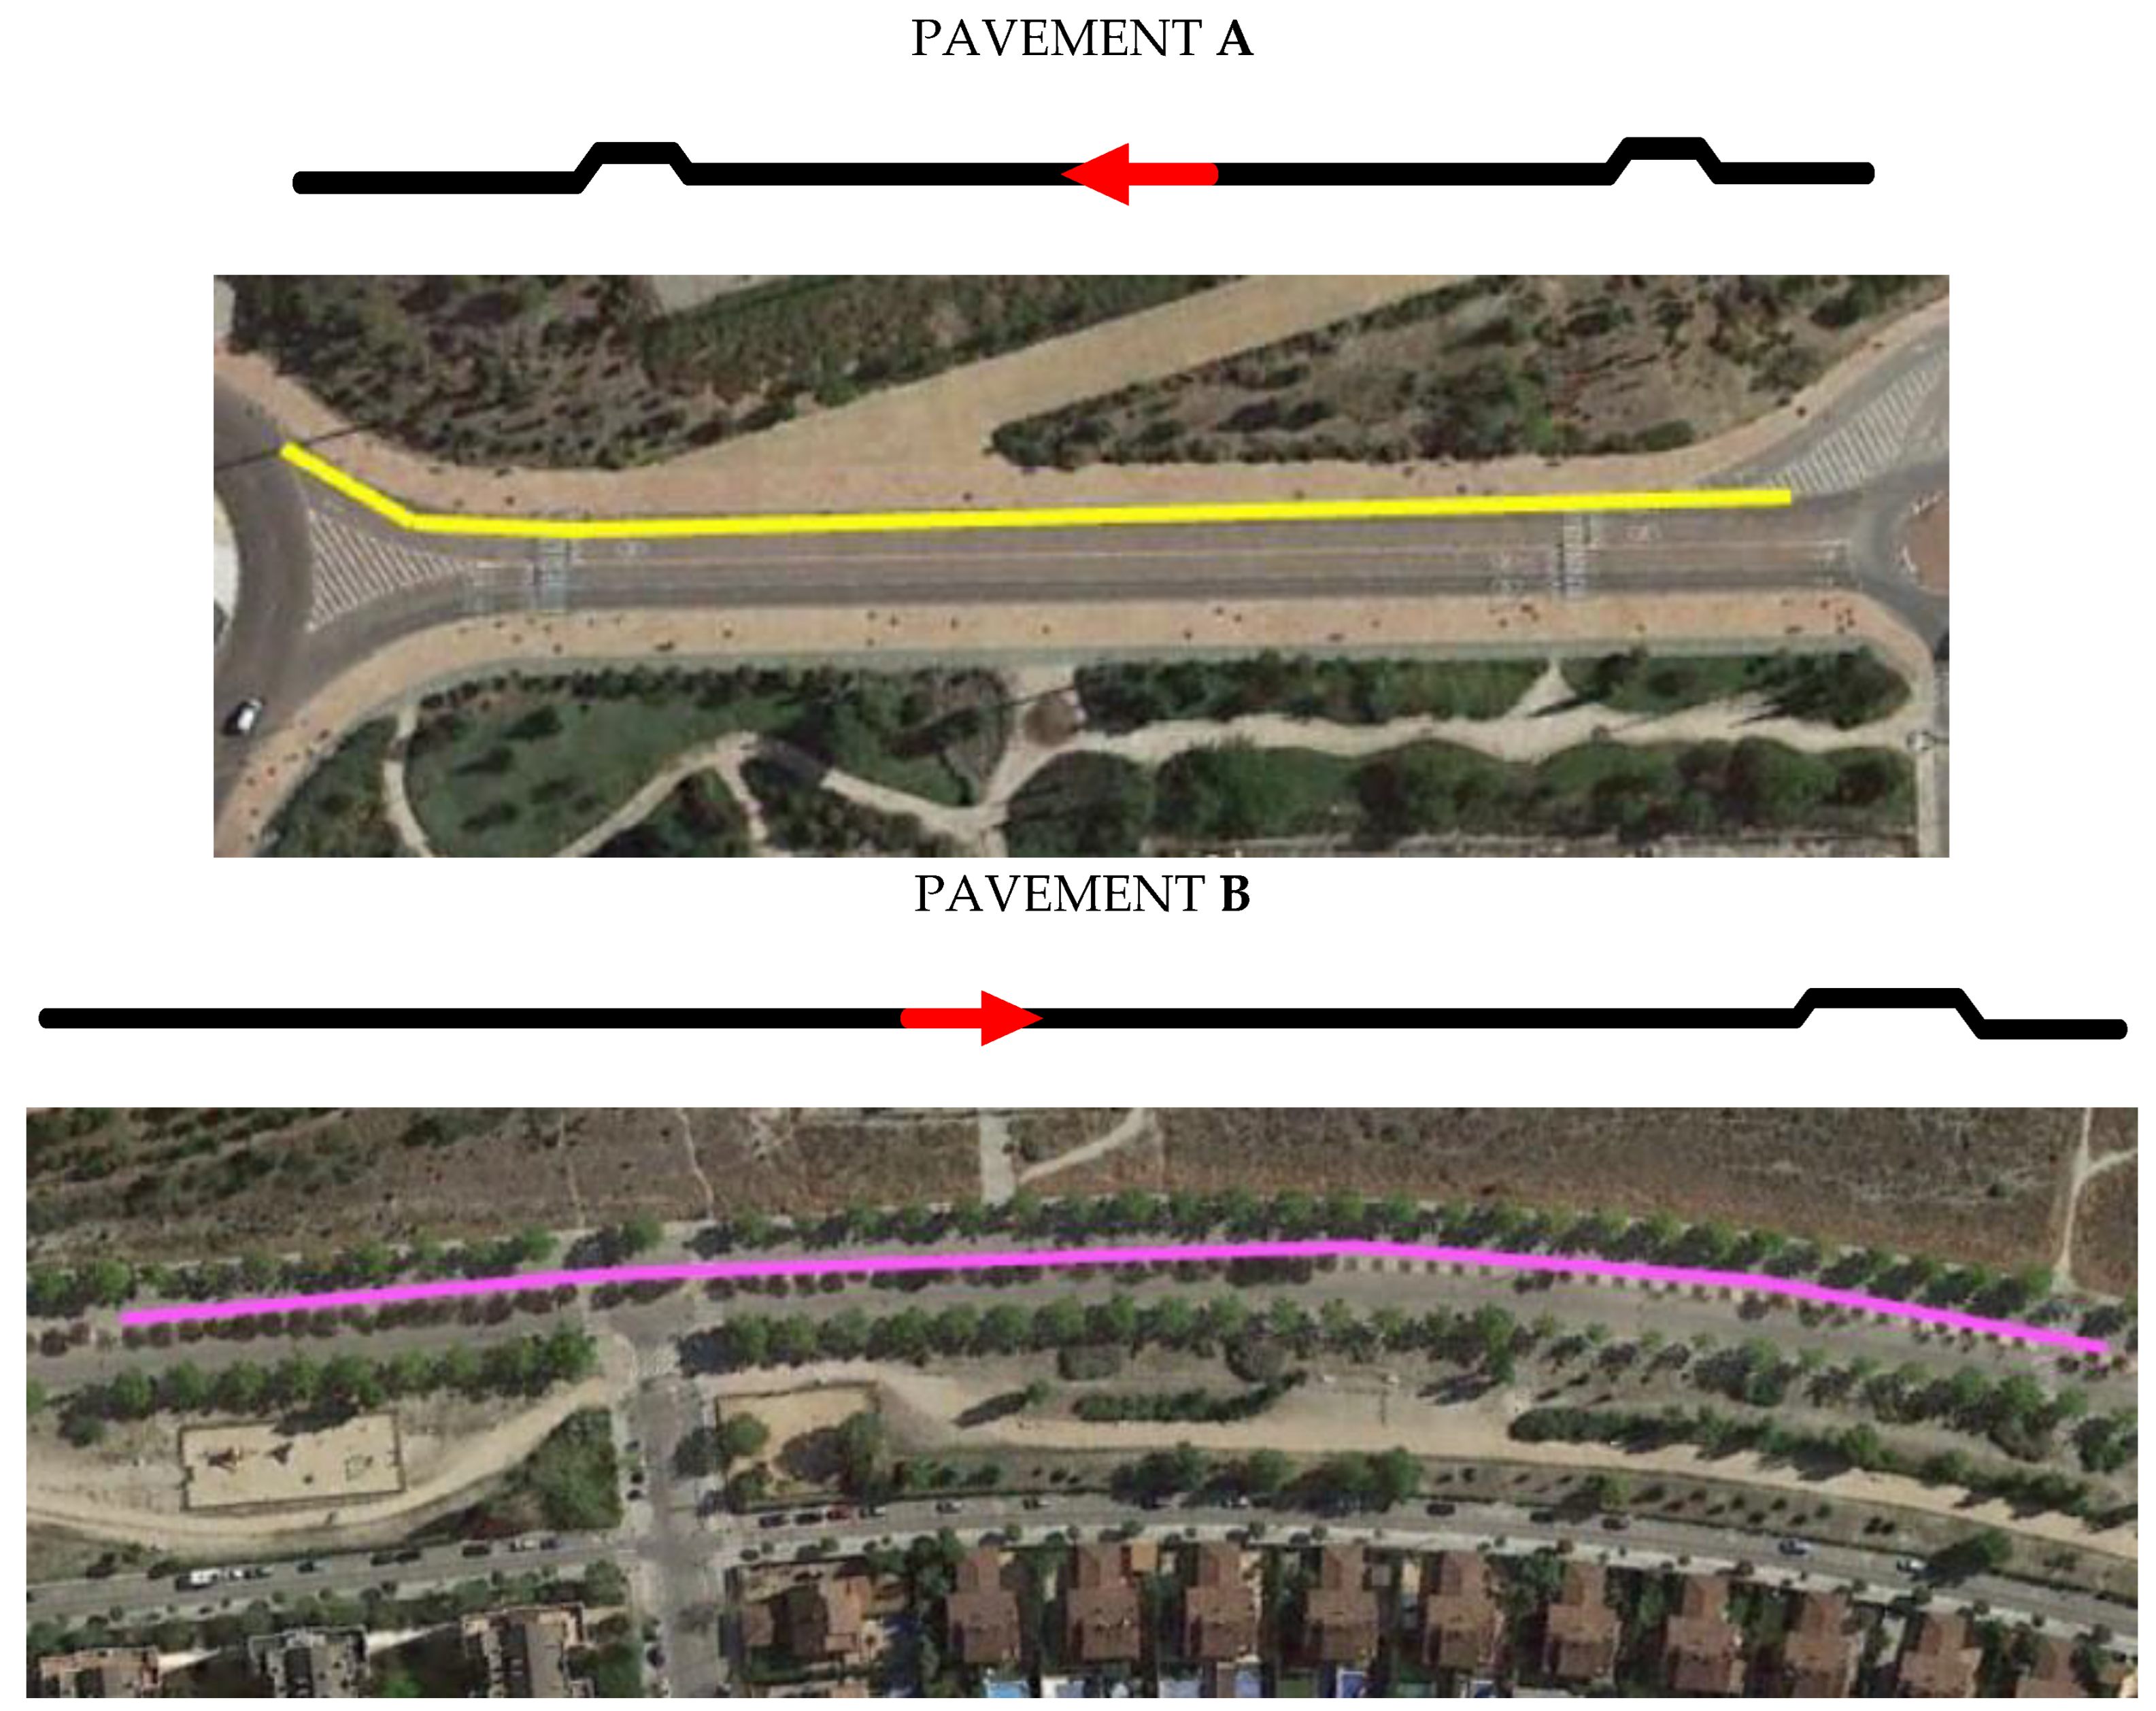
The routes followed were approximately 225 m with pavement A (0.5% slope, descending) and approximately 380 m with pavement B (2.5% slope, descending) (
Figure 6). The route of pavement A had a raised crosswalk at the beginning and another at the end, and both were passed with the e-scooter. However, pavement route B had only one raised crosswalk at its end. The raised crosswalks had a height of 0.1 m above the usual traffic pavement, a height that they attained after 1.5 m, which was the horizontal length of the entrance and exit ramps, which represents a slope of 6.7%. After the ascent and before the descent, the horizontal length of the raised crosswalk was 4 m.
Both pavements were travelled six times by two different drivers, for which a total of 24 acceleration and speed records were generated.
Table 4 shows the variables (pavement, driver, and speed mode) and replicas that defined the design of the experiment. Recorded data is available at
http://doi.org/10.5281/zenodo.6977206.
3. Results and Discussion
First, the results of the analysis of the accelerations in the three directions of space were summarised graphically following the mathematical treatment established by the UNE-2631 standard. The value of Equation (3) was calculated and graphed continuously for a better interpretation. For applying the standard calculus and obtaining a value of rms acceleration and also a comfort valuation, we needed to define a period of time in which we would study these vibrations. We used a constant and slider period of time, . We used a value of , which corresponded to slightly more than 10 m at 20 km/h and slightly more when this speed was exceeded.
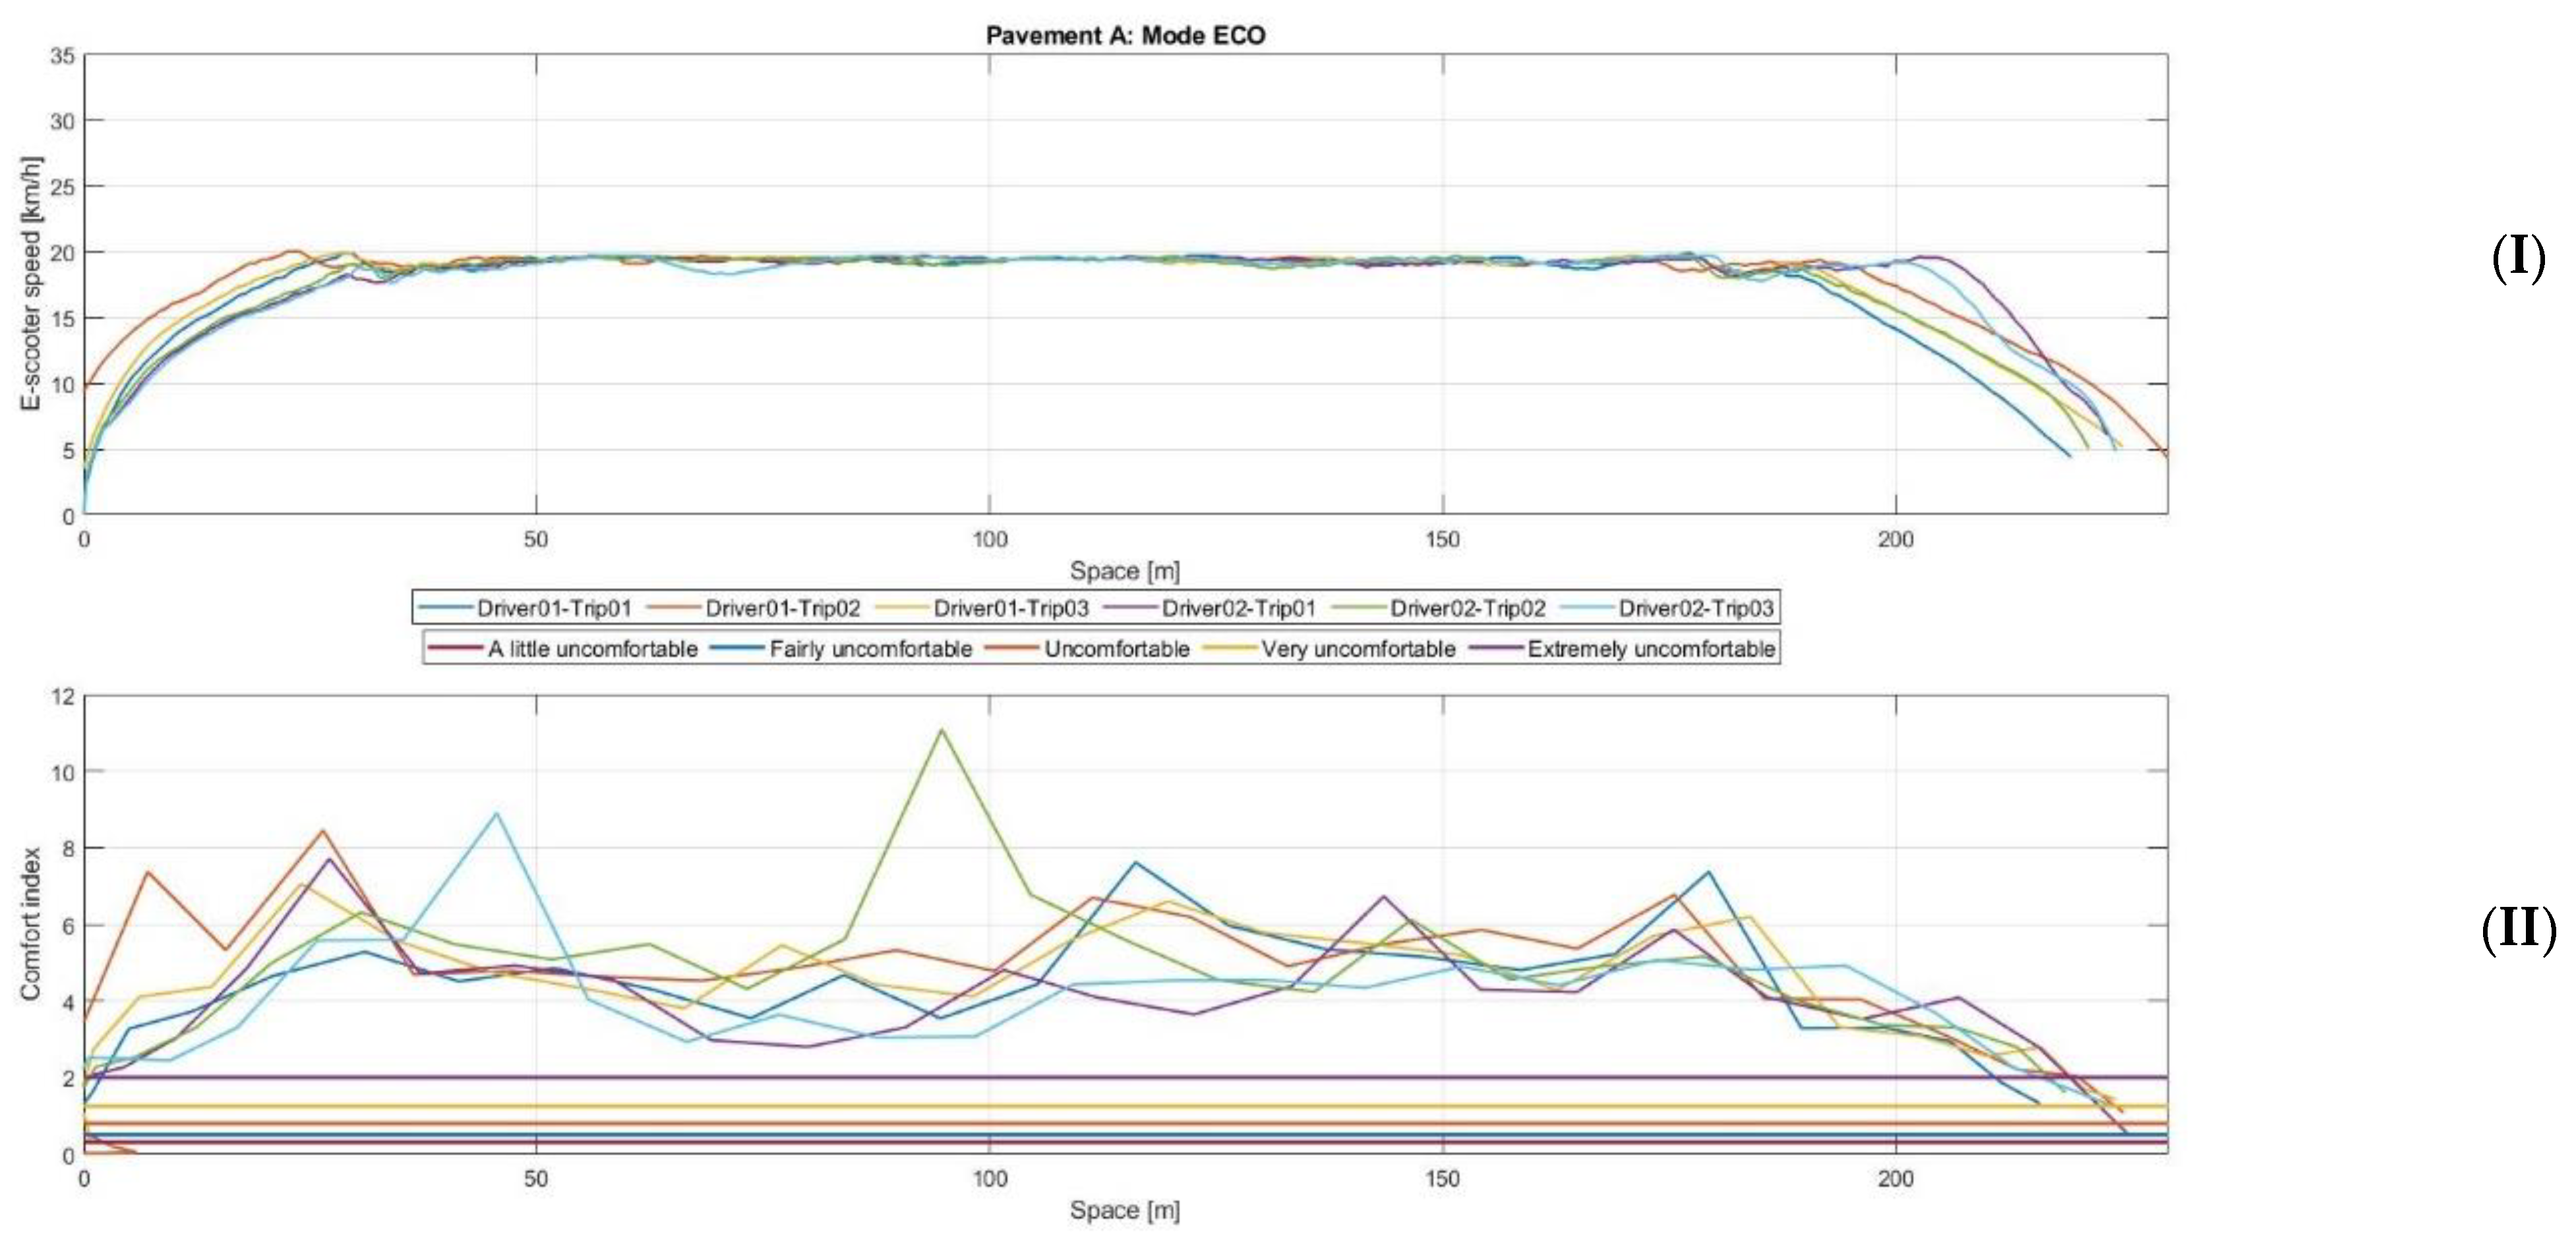
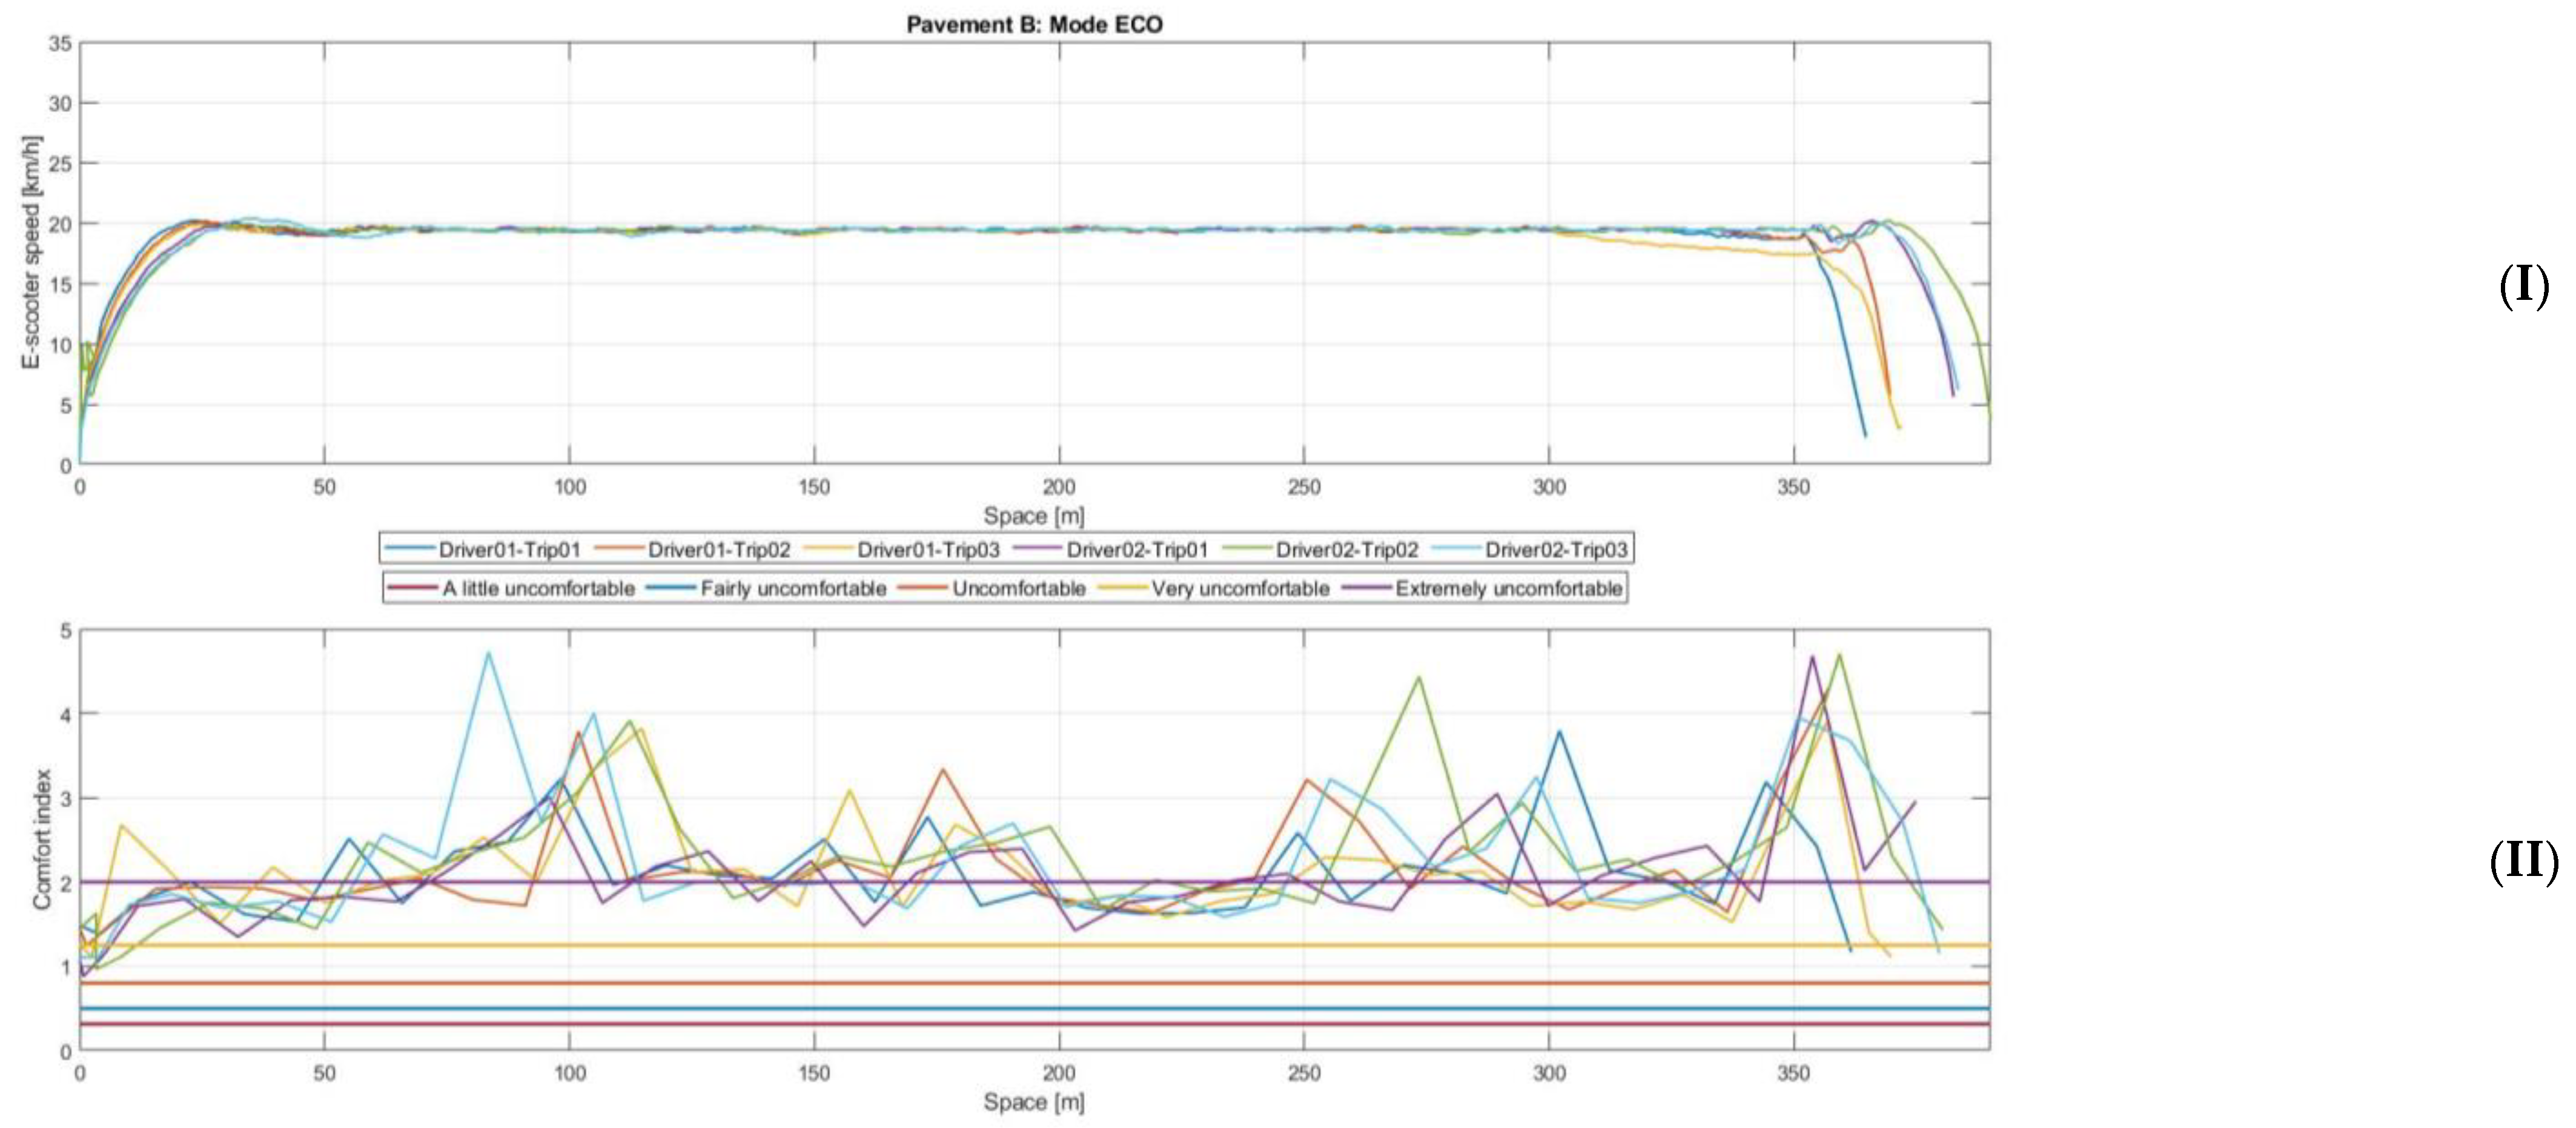
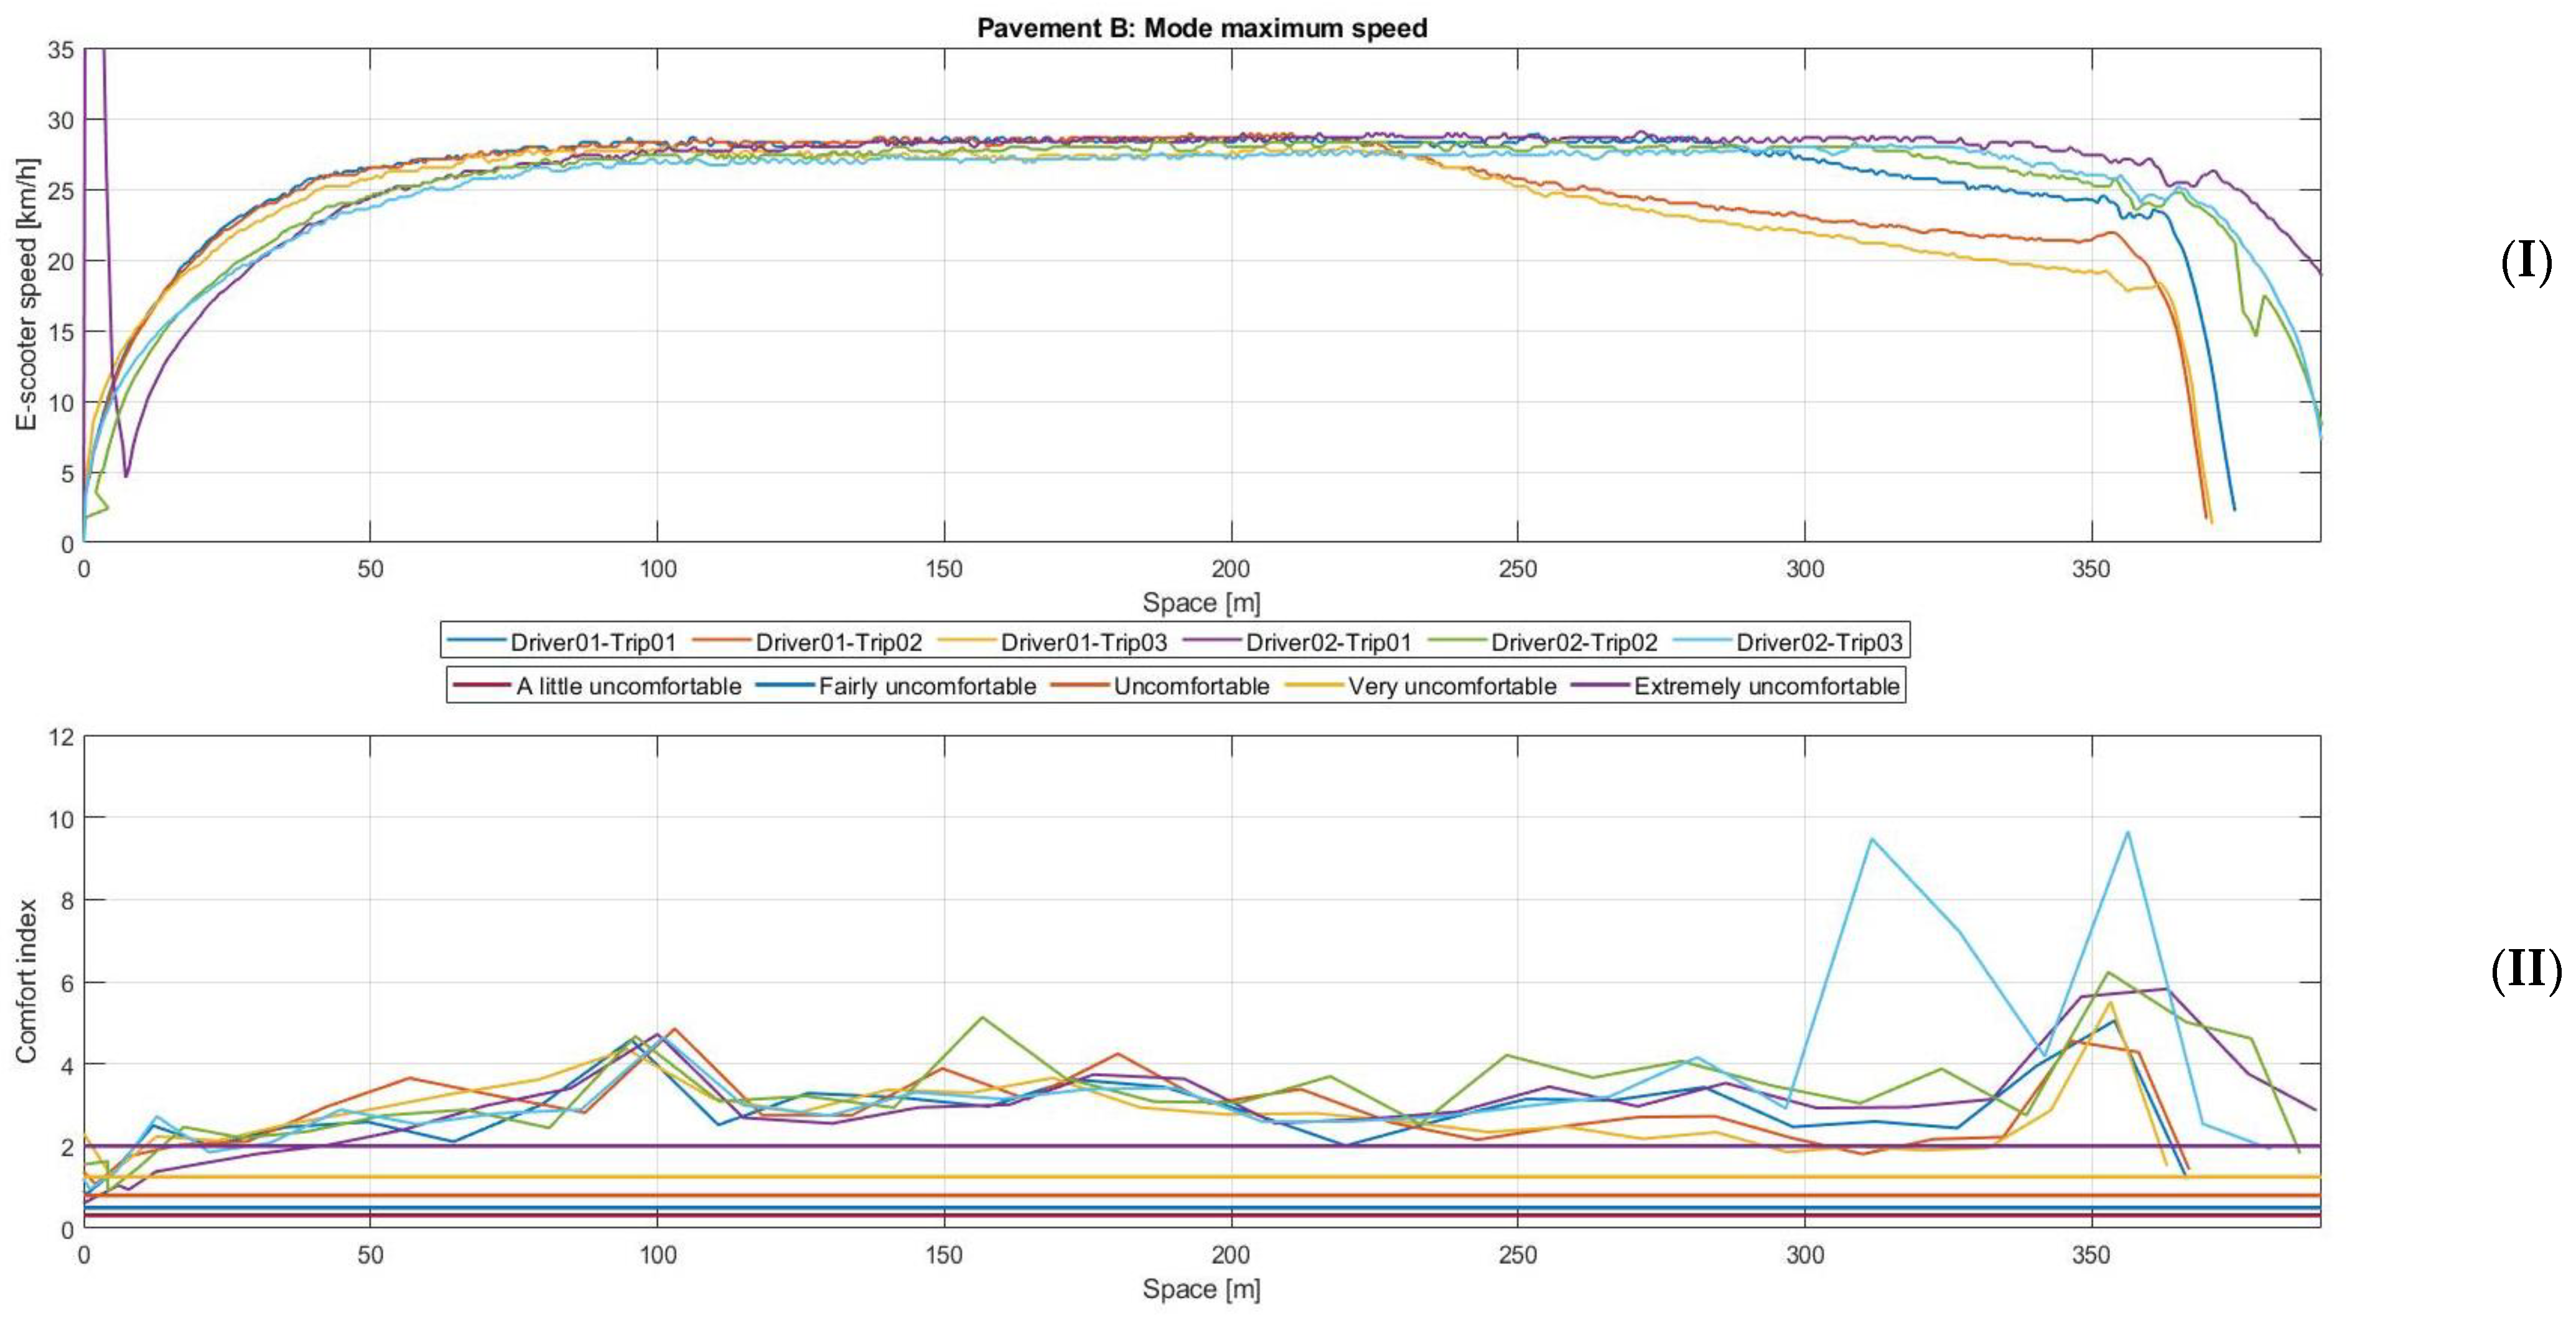
For each of the four graphs used to condense the results of this research, there were two differentiated graphs. The first (I) corresponded to the speed profile obtained from the post-processing of the magnetic sensor. The second graph (II) corresponded to the RMS acceleration value that we used to assess the comfort of the e-scooter user. In all plots, six replicates for the pavement type and speed mode were included, with three replicates for each of the two drivers.
3.1. Pavement A: Mode ECO
Figure 7 shows very similar speed profiles (I) between all replicas and both drivers. The comfort values (II) exhibited three clear peak areas, the two raised crosswalks at the beginning and at the end and a zone of possible intermediate irregularities (primarily slightly raised pavers) that did not always appear, owing to having been avoided in some of the aftershocks. Comfort was very low, being always above the ‘extremely uncomfortable’ line.
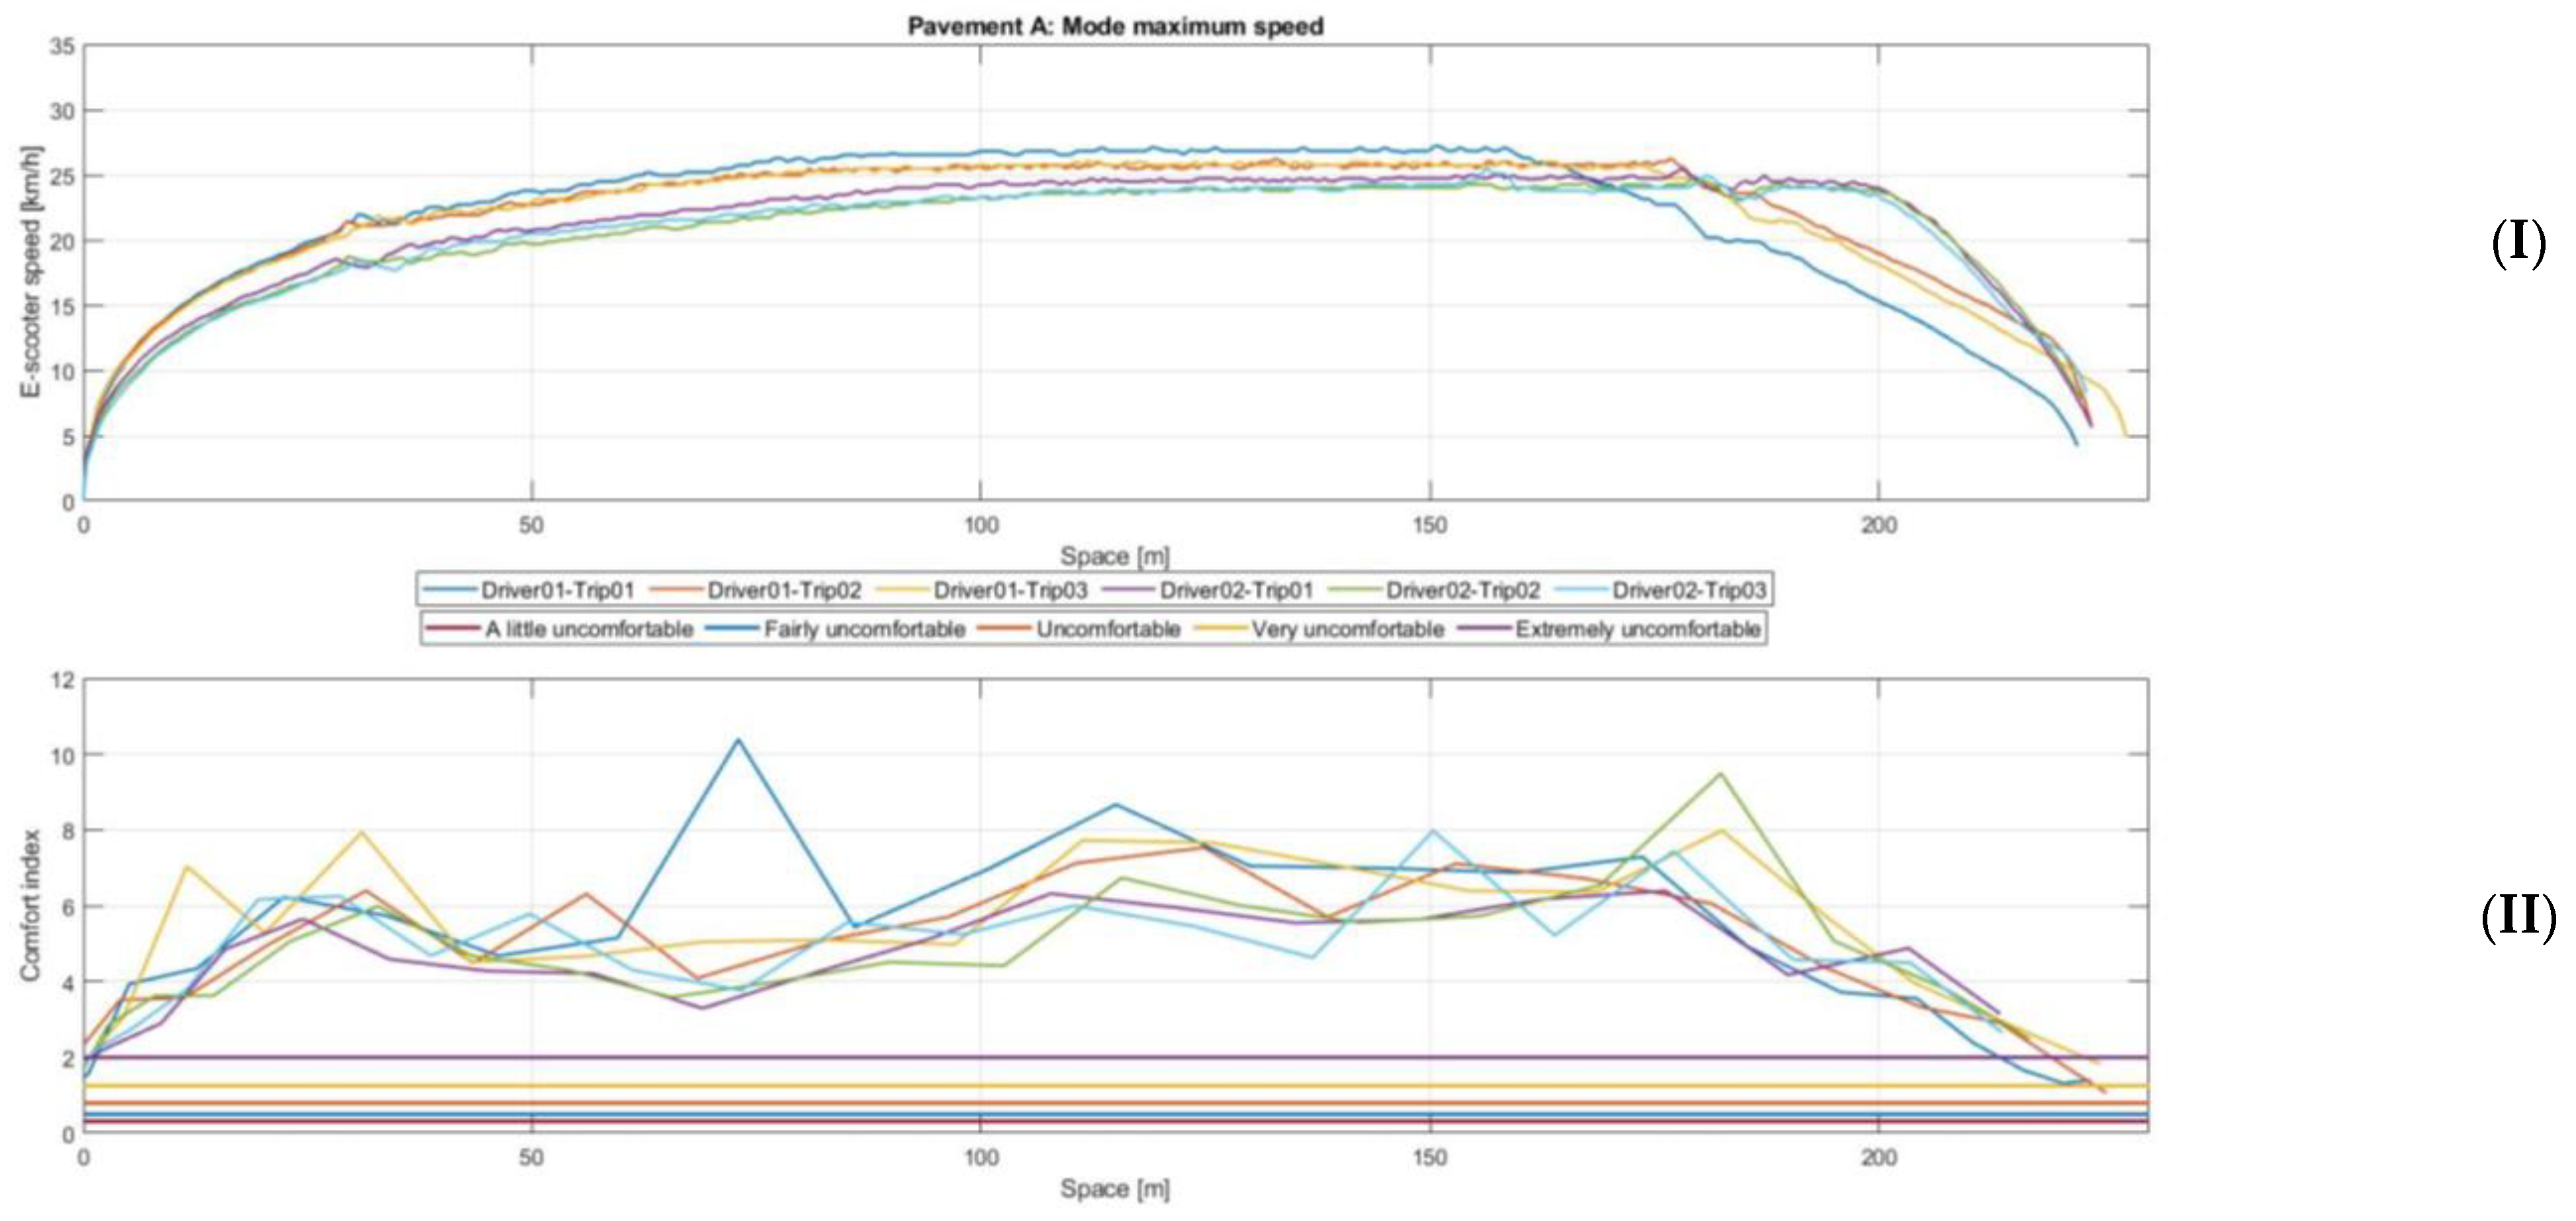
3.2. Pavement A: Mode MAX
In this scenario,
Figure 8 shows that, at maximum speed, similar speed profiles (I) were observed, but the speed curve of Driver 02 (the one with a greater weight) was slightly below that of Driver 01. There was also a greater difference in the braking curves than in the previous scenarios. The three areas of irregularities continued to appear, and the comfort notes (II) worsened with respect to the ECO mode, which was expected for increasing speed.
3.3. Pavement B: Mode ECO
Figure 9 shows very similar speed profiles (I) between all replicas and both drivers. The comfort values (II) exhibited three clear peak areas, the clearest being that of the raised crosswalk located at the end of the route. Of the other two zones, only the first appeared in all replicas, whereas the second, at approximately 300 m, only appeared clearly in one replica. Comfort was greater than for the pavement with pavers and driving in the ECO mode, but it was not significantly high. It was always above the ‘very uncomfortable’ line, passing in many areas of the final line, ‘extremely uncomfortable’.
3.4. Pavement B: Mode MAX
In this scenario, which was circulated at maximum speed, similar speed profiles (I) were observed, but the speed curve of Driver 02 (the one with a greater weight) was slightly below that of Driver 01 (
Figure 10). Additionally, a greater difference than in the previous scenarios was observed in the braking curves, even more than that observed in pavement A and driving mode MAX. This, as well as the difference in the weight of the drivers, explains the difference in amplitudes in the assessment of comfort (II) in the final raised crosswalk. The three areas of irregularities continued to appear; the first and last were still clearer, and the second was accentuated. For the type A pavement, the comfort notes worsened with respect to the ECO mode, which was expected as the speed increased. In this scenario, the worst comfort rating, ‘extremely uncomfortable’, was almost always exceeded.
For an additional discussion of the results, the average and maximum values of comfort were calculated for RMS evaluation intervals of 1–5 s, differentiating the selected speed mode and the driver, as well as the type of pavement. The values are presented in
Table 5.
Table 5 shows the worsening of the average degree of comfort of the trip in the following scenarios:
Driver weight. The driver with more weight had slightly better average values on pavement A than the driver with a lower weight; however, they worsened for pavement type B (asphalt). However, the maximum values were lower for Driver 02 only for the type A pavement and ECO mode speed. For the type A pavement, the increase in speed did not significantly penalise the comfort of the heavier driver, whereas in the type B pavement, the opposite was observed, as will be discussed later.
Speed. When changing from the ECO mode to the maximum speed mode for each of the pavements, the variation in comfort values in percentage was worse for the asphalt pavement (36.4%) than for the cobblestone pavement (17.8%). Switching from ECO mode to MAX mode meant the following:
- a.
Pavement A, ECO mode to MAX:
- i.
Driver 01, increase of 21.6%;
- ii.
Driver 02, increase of 13.6%.
- b.
Pavement B, ECO mode to MAX:
- i.
Driver 01, increase of 30.0%;
- ii.
Driver 02, increase of 42.9%.
Pavement. When moving from one asphalt pavement to another with pavers, the RMS value was multiplied by an average value of 1.8, except for Driver 02 and the maximum speed, where it was multiplied by only 1.4.
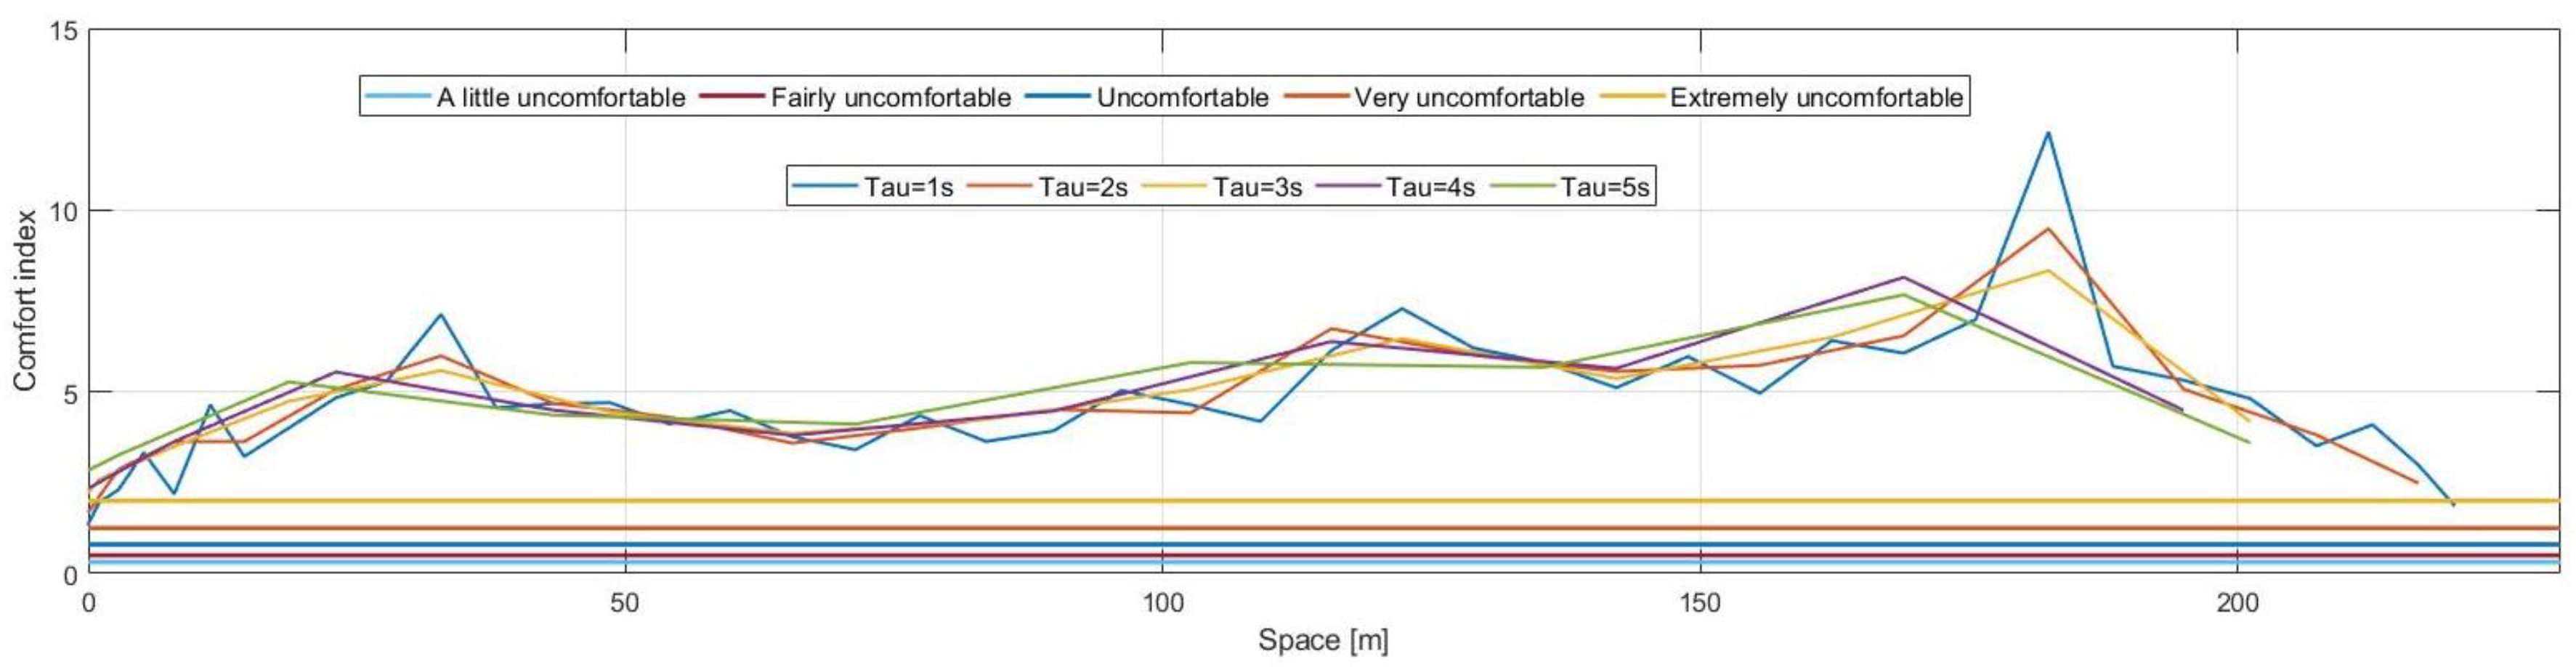
RMS value calculation time. By decreasing the calculation time of the RMS values when passing from 5 to 1 s, the value of the maximum increased by a factor greater than 1.5.
For example, to visualise how the choice of this time constant varied, the scenario of pavement A, Driver 02, second replica was collected.
Figure 11 shows the decrease in the maximum values as the calculation time of the comfort value increased, also lowering its sensitivity for detecting short-duration events.
As indicated, few studies have assessed the comfort of an e-scooter through experimental measurements. Cafiso et al. [
36] measured accelerations with a smartphone and assessed the comfort of a scooter similar to how it was studied in this research. Although they assumed a limitation of the sampling frequency (25 Hz), we can qualitatively compare their results for an asphalt-type pavement. Their results indicated a high sensitivity to the comfort of the e-scooter compared with other vehicles, such as a bicycle and car, showing in their measurements a percentage of comfort in the e-scooter of approximately 50% above the ‘very uncomfortable’ limit, which is consistent with the results obtained in this study. They also indicated that RMS accelerations of more than 8 m/s
2 are related to severe irregularities in the pavement, which is consistent with the cobbled pavement that assumed an irregularity of constant frequency. If we compare with the mathematical model proposed by Cano-Moreno et al. [
35] in the contour maps they present, we observe that for a speed of 20 km/h, for the asphalt road, if we place it between classes BC and CD, RMS values between 3 and 5 m/s
2 are obtained, which is slightly consistent with the type B pavement and the measured values.
Other published measurements include those of Antoniazzi and Davoli [
37] of the Politecnico de Milano (Italy), who measured the comfort of e-scooters for a scooter model different from ours because it had an additional damping system for the wheels. In these measurements, the maximum RMS vertical acceleration values were
Pavement-type uniform asphalt (25 km/h), comfort value: 1.95 m/s2;
Asphalt-type pavement with cracks (25 km/h), comfort value: 4.76 m/s2;
Pavement with pavers (15 km/h), comfort value: 5.32 m/s2.
For asphalt with not very severe cracks and for 28 km/h, values of approximately the same order as the type 2 pavement were obtained, worsening in the raised crosswalk area. For the type A pavement, some comfort values at 28 km/h did not fall below 5 m/s2 as a base value, significantly exceeding the value of experiment 3, which could be explained by the additional cushioning in the scooter in this study. With some differences primarily owing to the use of different sensors, data acquisition systems, sampling frequencies, scooter models, and pavements, we can affirm that these measurements are highly consistent.
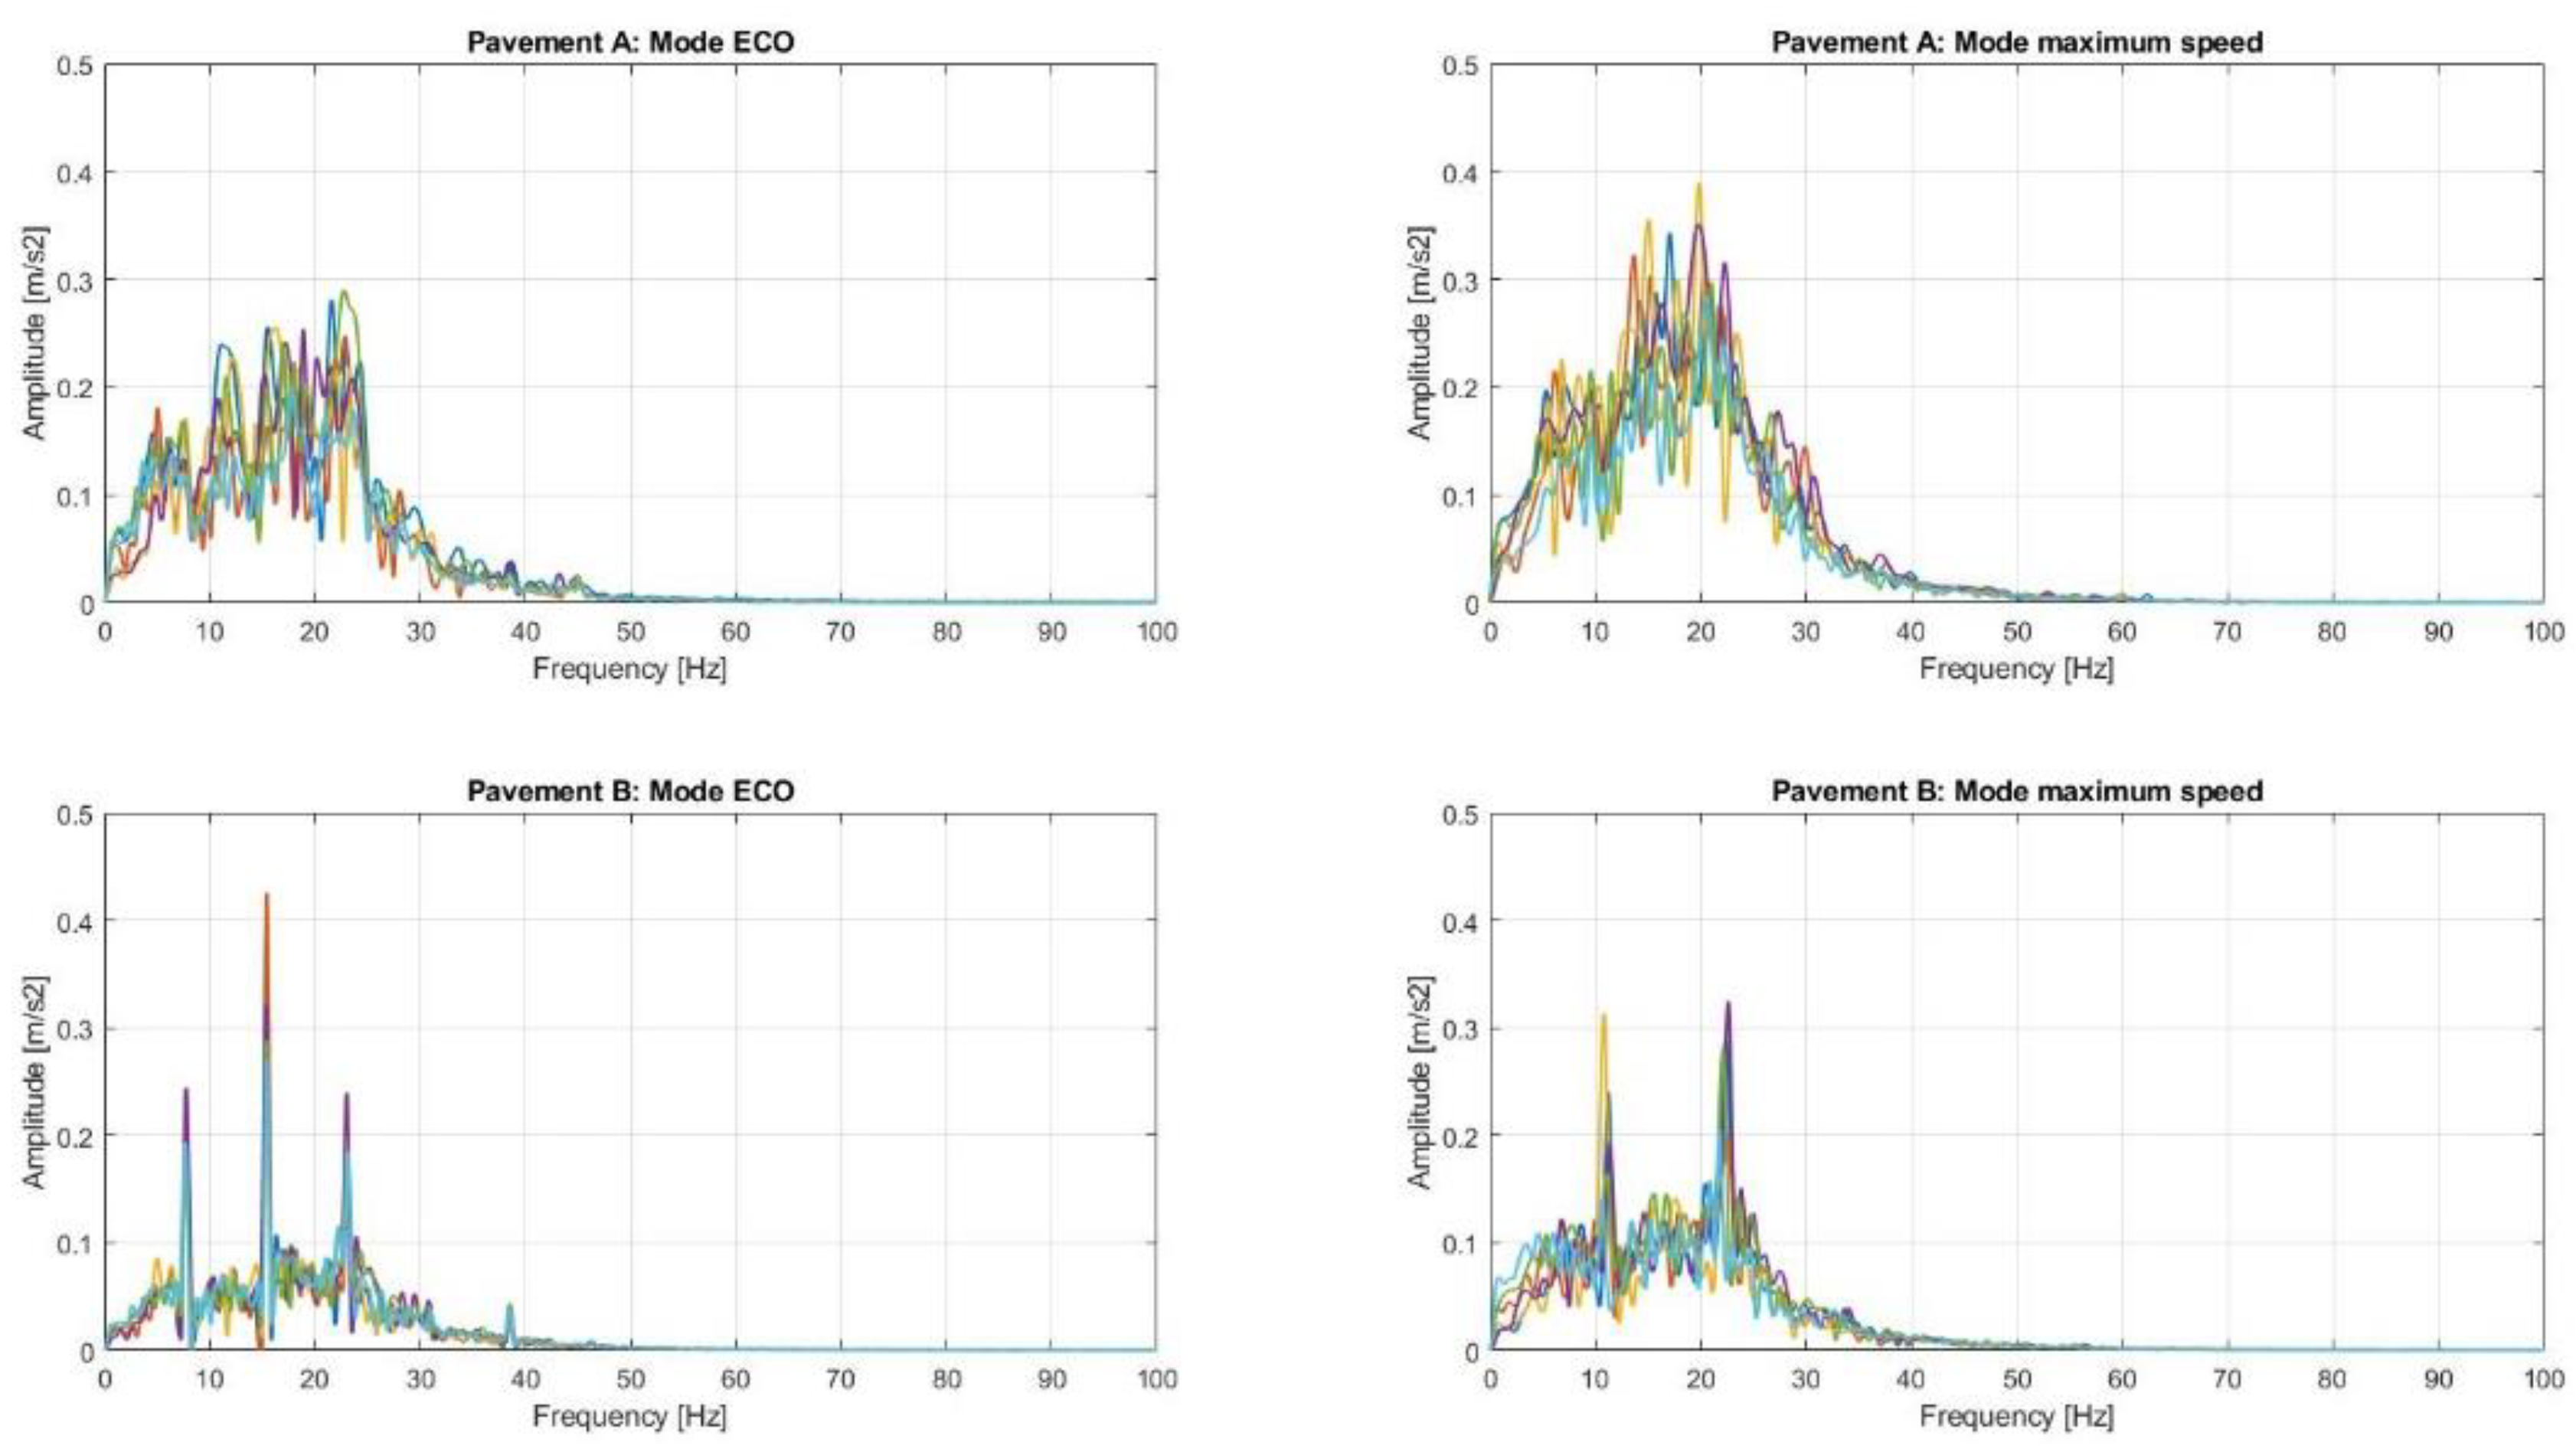
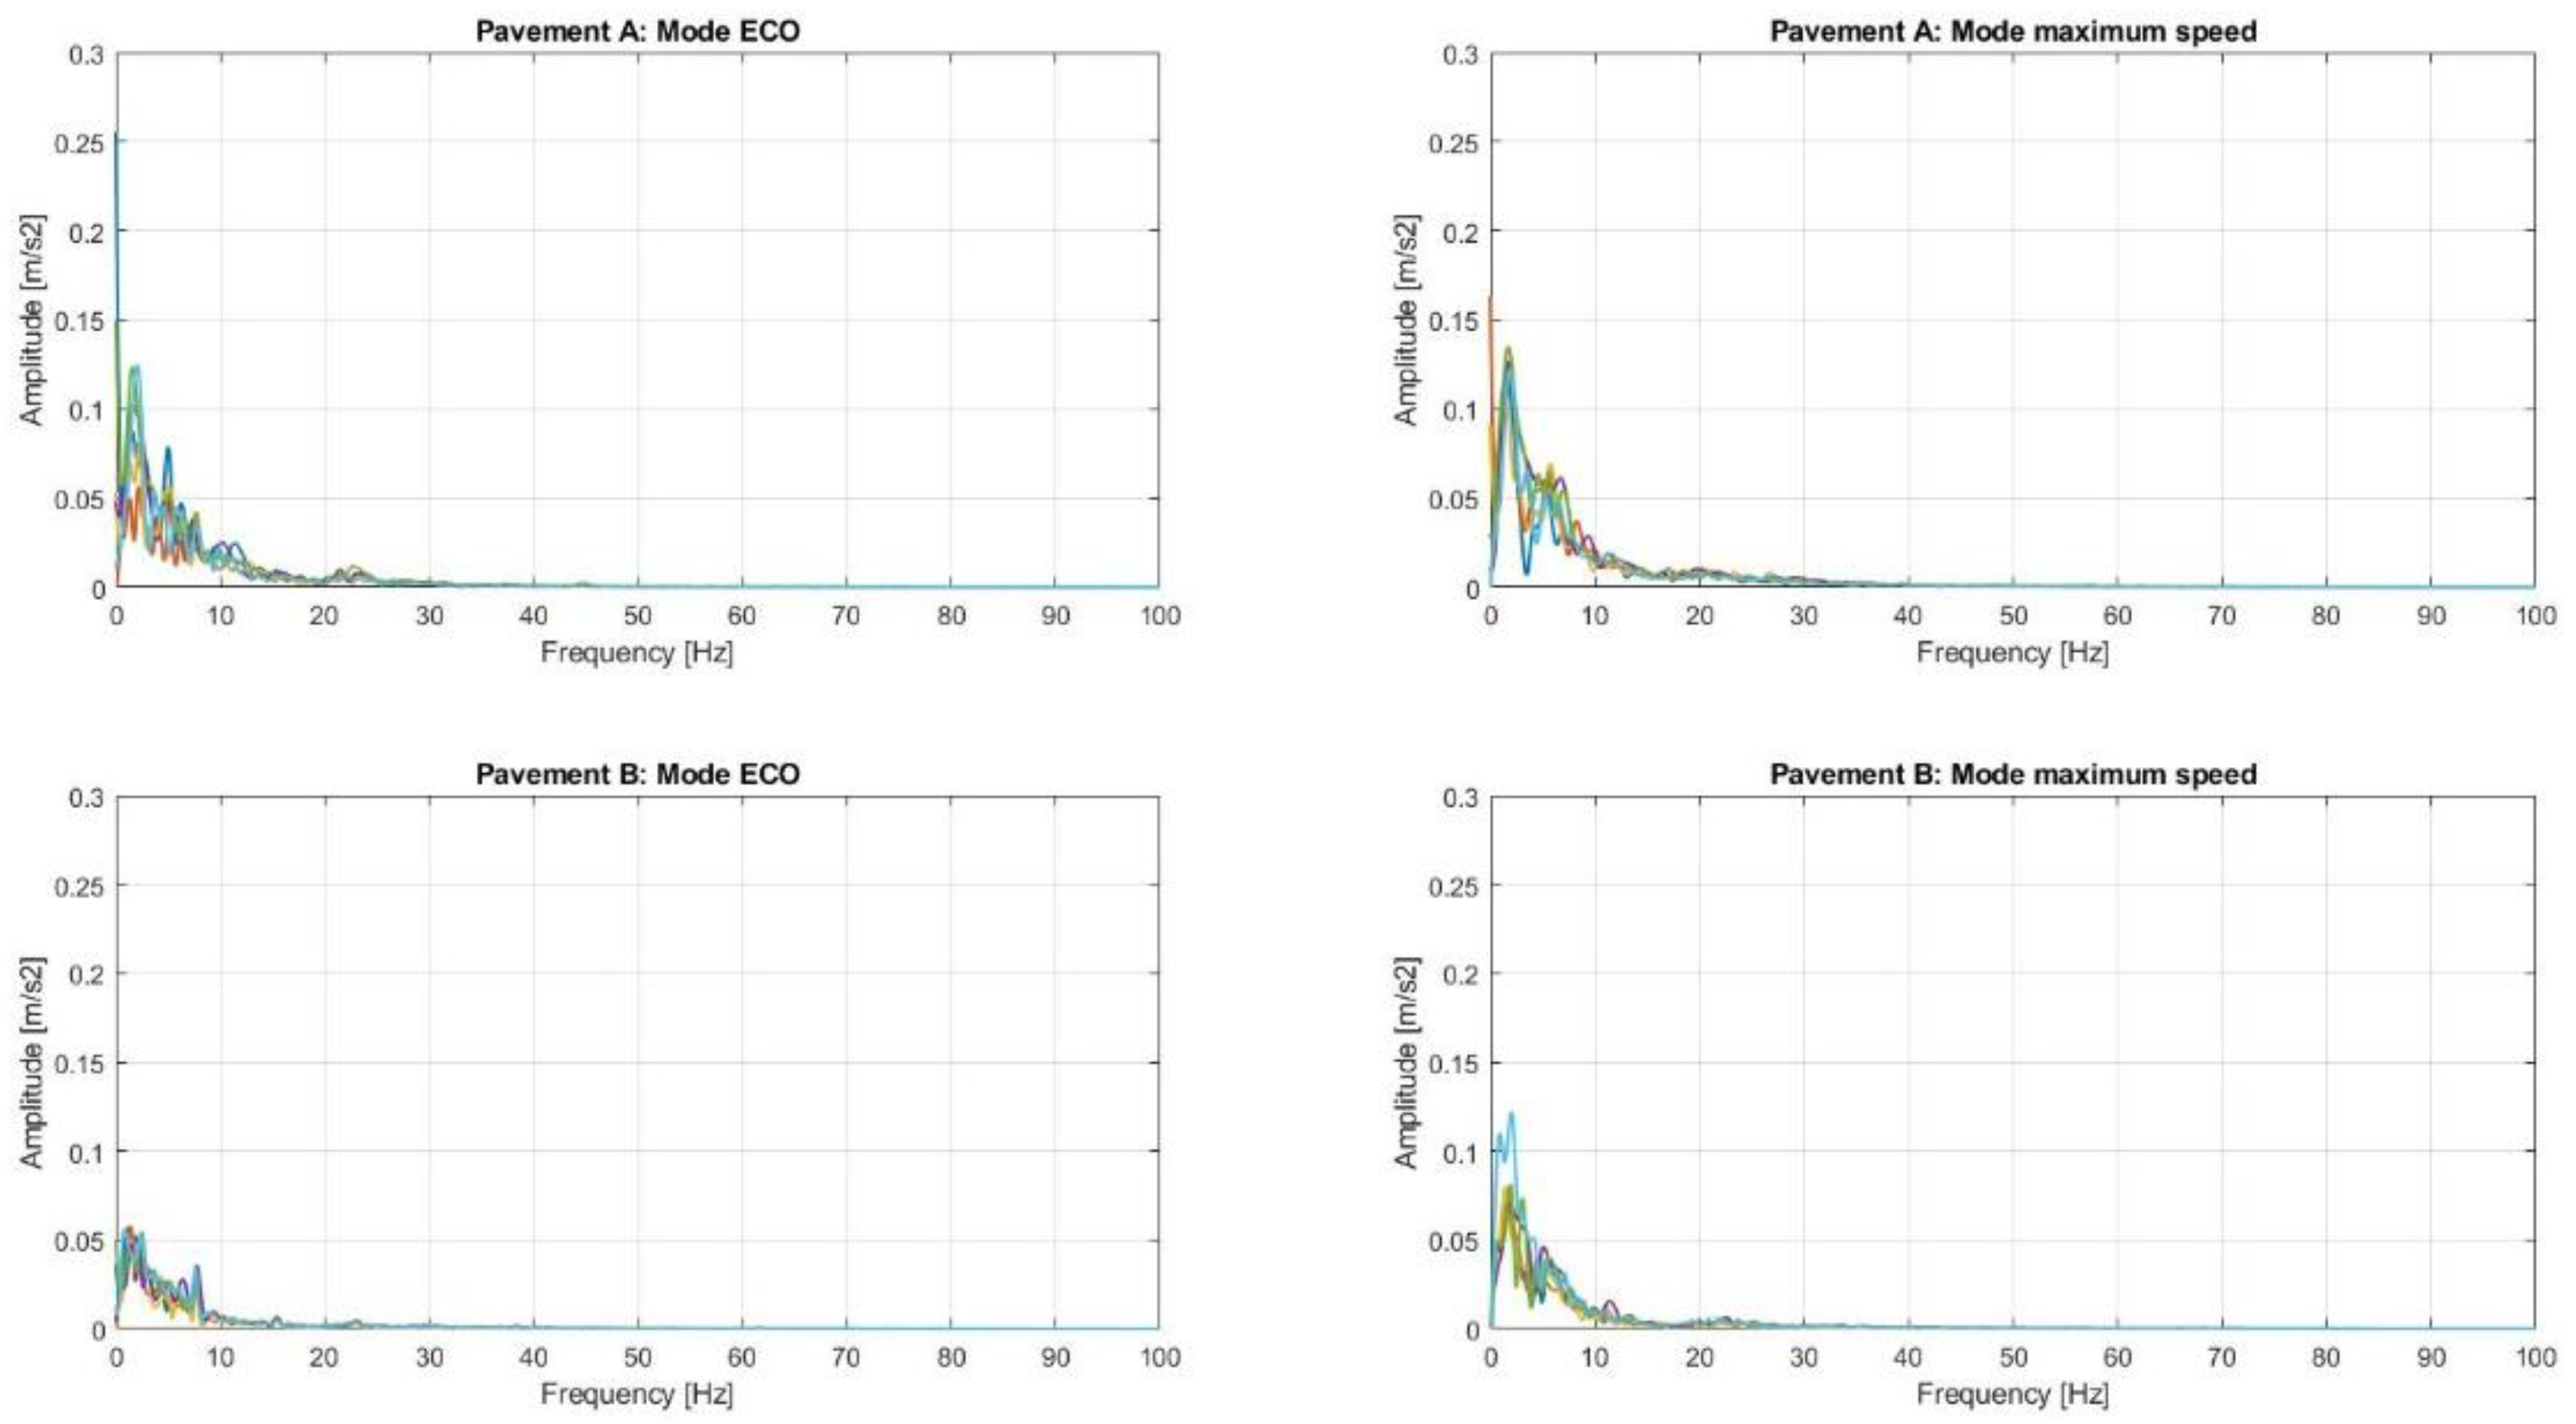
To analyse the relevance of using a 200 Hz data acquisition system instead of the 25 Hz that other authors have used, the vertical acceleration was measured and filtered according to the filter of UNE-2631.
Figure 12 shows that, for all the tests, significant values of vertical acceleration up to 30–40 Hz were observed, which means that these signals should be measured at least using data acquisition systems with a sampling frequency greater than 60–80 Hz. We also observed some clearer peaks in two or three predominant frequencies in pavement B (asphalt), while in pavement A, they were not clearly distinguished.
If we analyse the next component in importance, the longitudinal, with the corresponding filter (
) of the UNE-2631 standard, the significant frequencies decay before the vertical ones, in addition to having a lower amplitude (
Figure 13).
4. Conclusions
In this study, comfort was assessed with respect to whole-body vibrations that could be perceived by two e-scooter drivers with a weight difference of 27%. For this, a commercial model of an e-scooter (EasyWay CityCross) was used without any suspension for the tyres. The assessment of vibrations, based on the UNE-2631 standard, was performed through the measurement of accelerations in an actual environment. In the experiments, two types of pavements were analysed (pavers and asphalt), which were travelled in two driving modes of the scooter, which we called ECO and MAX, which establish two maximum speed limits (20 km/h and 28 km/h, respectively). For each experiment or a combination of experimental variables, three replications were performed.
The first conclusion, based on the assessment of comfort according to the UNE-2631 standard, is that the e-scooter transmits vibrations to the driver that are relevant from the perspective of comfort. In particular, the following aspects should be highlighted.
For an asphalt pavement (pavement B) with small irregularities and patches, we can conclude that
- a.
The minimum values, that is, those attained in the absence of potholes or bumps, are always close to the ‘extremely uncomfortable’ line, slightly below the maximum speed of 20 km/h, and almost always above when the maximum speed is 28–30 km/h. They are always above the ‘very uncomfortable’ line.
- b.
A certain sensitivity to the comfort values is detected based on the weight of the driver. In this scenario, two drivers with a large difference in weight (90 and 115 kg) drove the same e-scooter without changing the tyre pressures, which were within the recommended values. The results indicate that comfort improves with weight on type A pavements (pavers) and worsens on type B pavements (asphalt).
- c.
In addition to the raised crosswalk located at the end of the route, small irregularities on the road caused vibration peaks that made this area extremely uncomfortable.
For the paver pavement, which already assumes a constant level of irregularities every 10 cm, in addition to the irregularities and damage to the pavement in some areas, we can conclude that
- a.
The minimum values, that is, those reached when in the absence of potholes or bumps, are always above the ‘extremely uncomfortable’ line in both driving modes, ECO and MAX, worsening with increasing speed.
- b.
In this scenario, very low comfort values appeared very clearly in the areas corresponding to the two raised crosswalks along the route, in addition to the occasional peak owing to other types of irregularities.
A significant influence of the pavement type on which the e-scooter circulated was observed. Depending on the type of driving and the weight of the driver, a cobbled pavement can almost double the RMS value of user comfort, which makes it advisable to reduce the speed on this type of pavement or avoid it as much as possible. Although it is not a common pavement on different roads, many e-scooter drivers use pedestrian areas to avoid the danger of driving between other vehicles. The presence of cobblestones has increased significantly in these areas. Although the speed is lower, it is worth noting the high level of vibrations that can be transmitted for the e-scooter model analysed, as well as for others with similar suspension characteristics.
In contrast, raised crosswalks, potholes, or irregularities in the pavement where e-scooters circulate in large cities result in a significant increase in vibrations in both pavements; therefore, it is advisable to always pass them at low speed whenever they cannot be avoided. Thus, pavement maintenance should improve owing to this new means of transport, which is part of the solution to the last mile problem.
In addition, we can conclude that, at least for the e-scooter model used, a data acquisition system with a sampling frequency of at least 80 Hz must be used to measure the most significant components from the perspective of comfort, which corresponds to the vertical component of acceleration.
Finally, we observed that this type of scooter studied, with 8.5-inch pneumatic wheels without additional suspension systems for the wheels, for a speed equal to or greater than 20 km/h, is not comfortable from the perspective of the UNE-2631 standard.
Although a limitation of this study may be the lack of use of lower speeds to study comfort, the main objective of the e-scooter is to solve the problem of the last mile; thus, it must be able to admit competitive speeds. In other words, if it is not sufficiently comfortable for these competitive speeds, it would be advisable to implement improvements in its design, particularly at the suspension level. An improvement in the circulation pavement would improve user comfort.
In future research, we intend to extend this type of measurement to other types of scooters, with additional suspension systems for the wheels, to check their response to the vibrations of different types of pavement. Experiments can also be extended to additional drivers with different weights and associated tyre pressures. Moreover, an Arduino-based algorithm can be implemented to warn the driver when to slow down to ensure a predetermined level of comfort.


 ,
, 


