
Design of a Digital Twin for an Industrial Vacuum Process: A Predictive Maintenance Approach

 , , , , , and
Abstract
:1. Introduction

| Fault | Fault Type | Motors Phases | Motors Power (KW) | References |
|---|---|---|---|---|
| Stator faults | Electrical | Three-phases | 1.48; 2.2 | [7,8] |
| Unbalanced voltage | Electrical | Three-phases | 0.75; 4 | [9,10] |
| Broken rotor bar | Mechanical | Three-phases | 1.1; 7.5 | [11,12] |
| Eccentricity | Mechanical | Three-phases | 1.1; 2.2 | [13,14] |
| Bent shaft | Mechanical | Three-phases | 0.8; 0.373 | [15,16] |
| Bearing | Mechanical | Three-phases | 3; 0.425 | [17,18] |
2. Materials and Methods
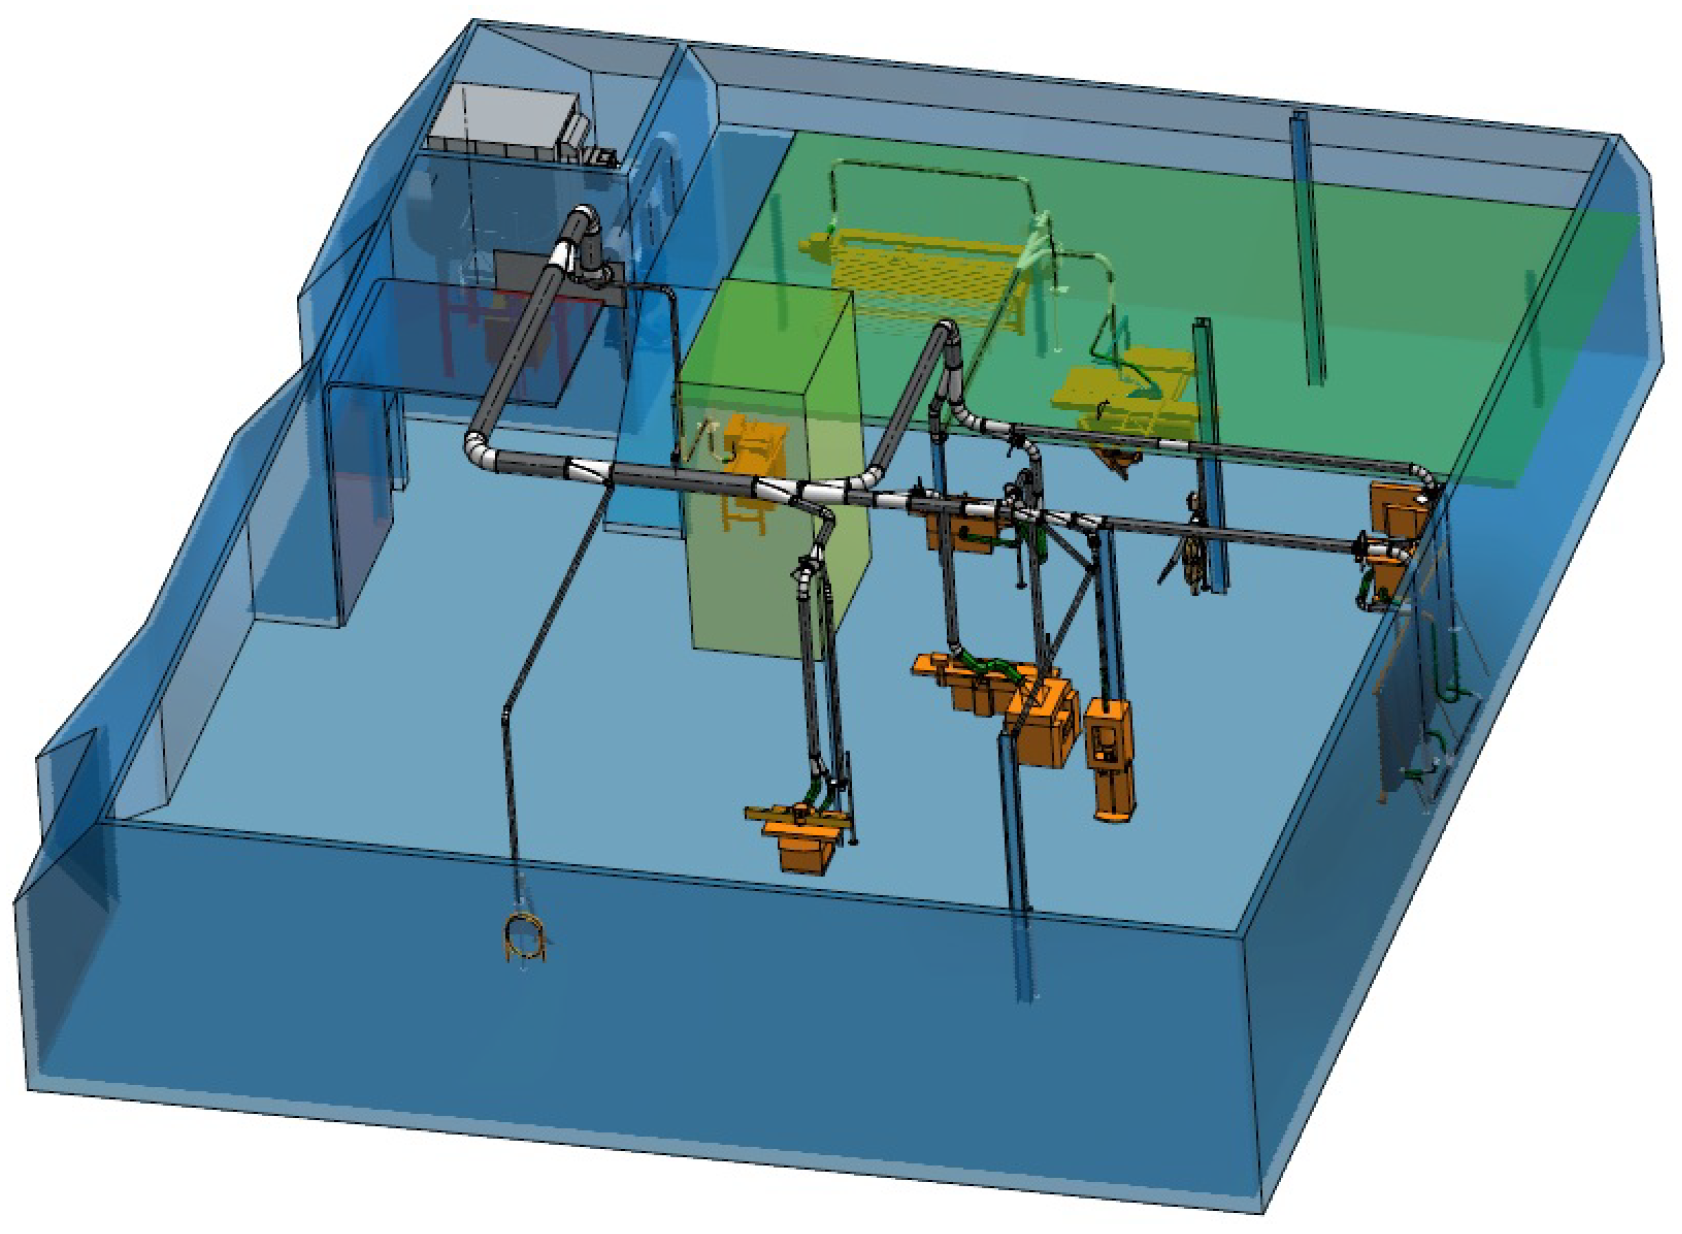
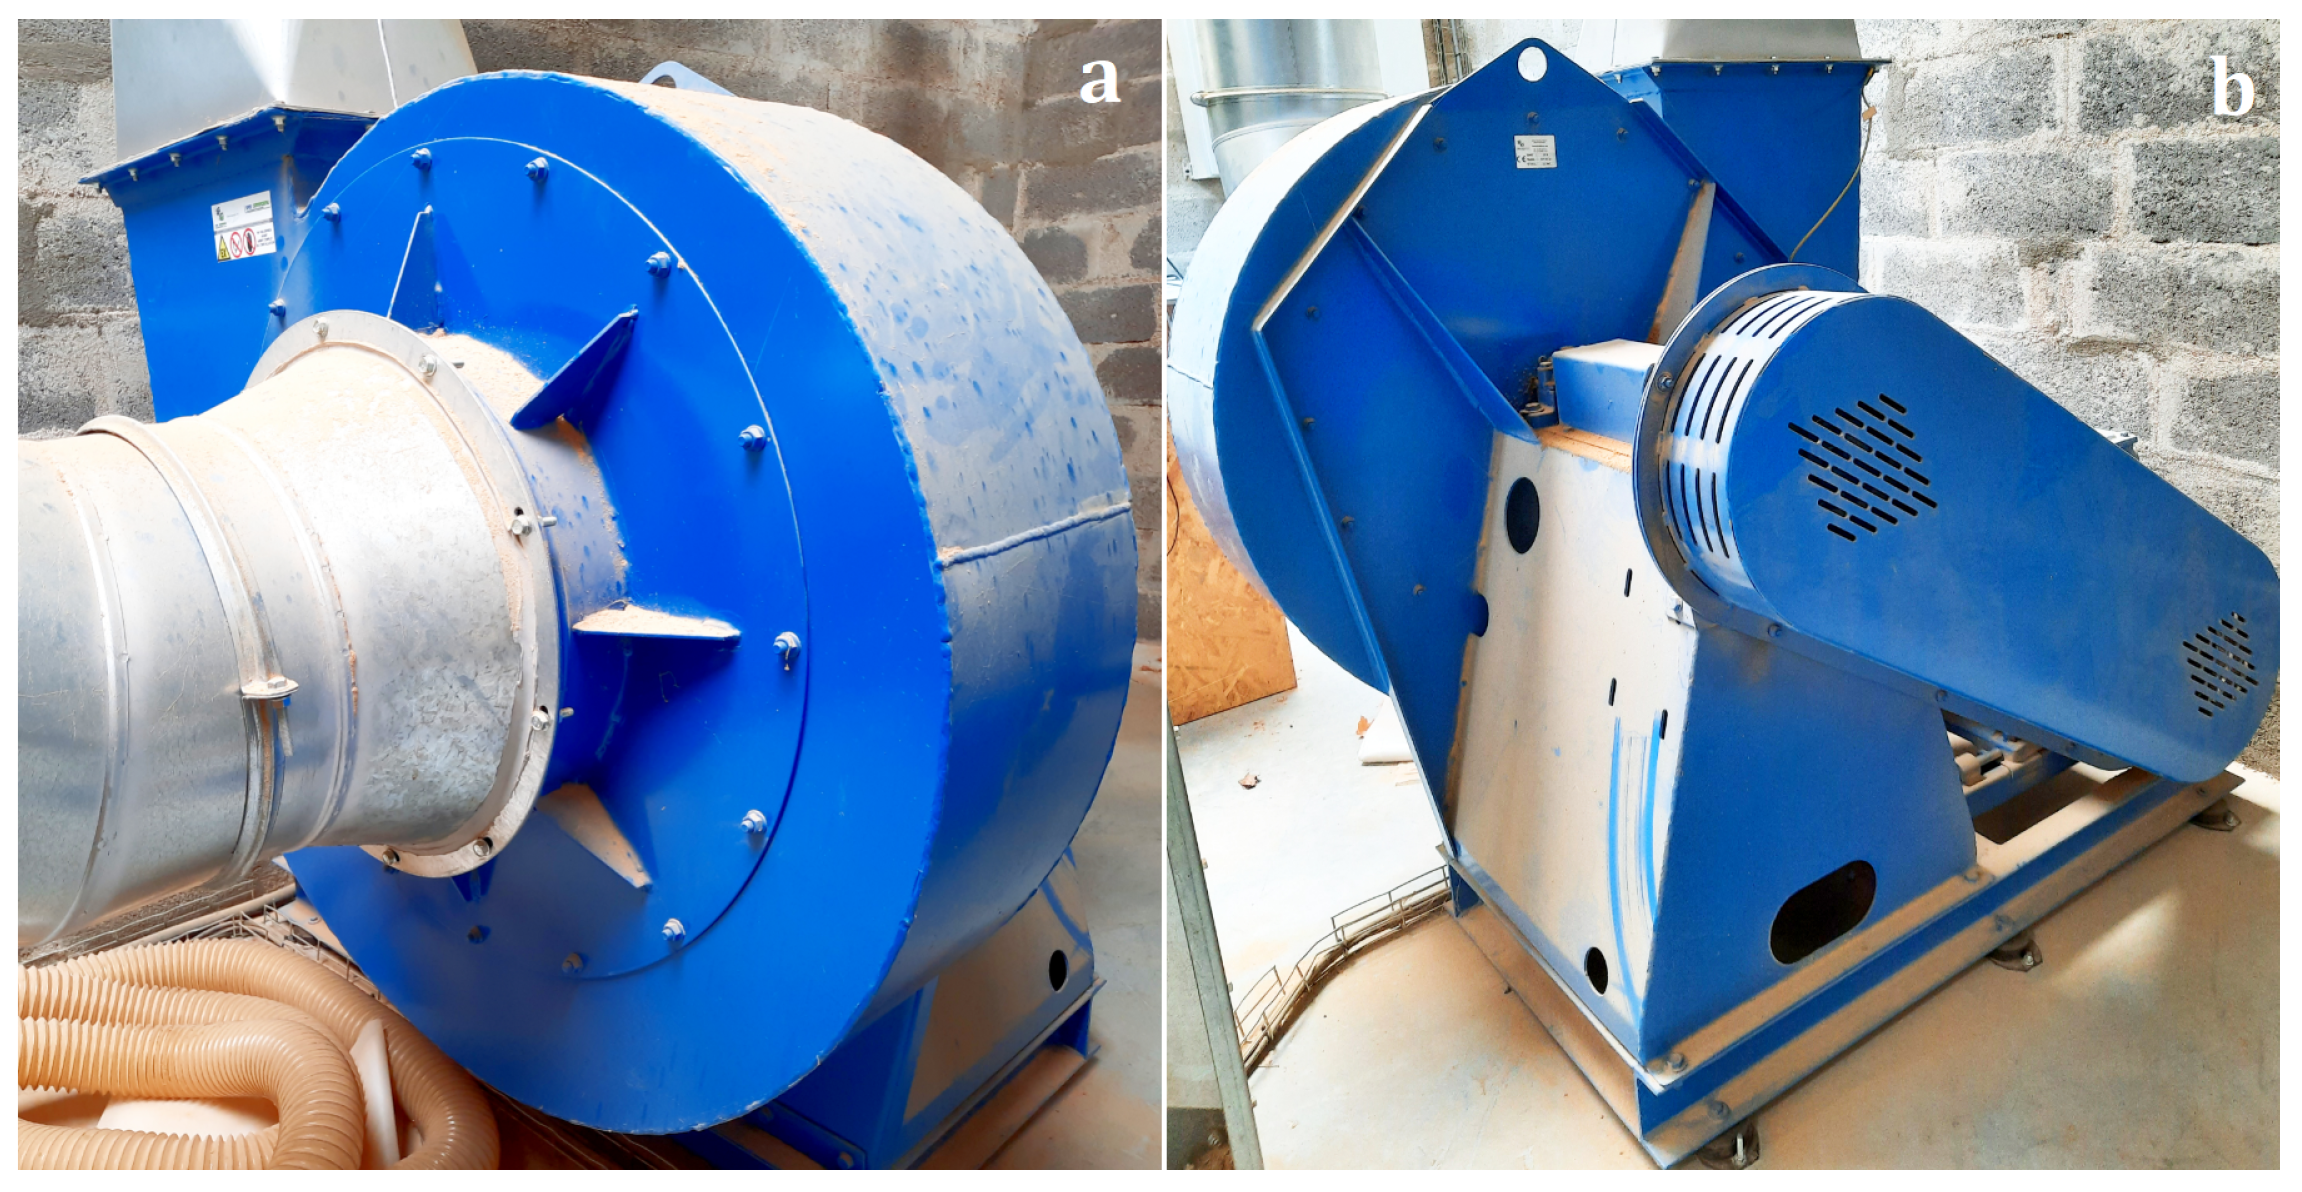
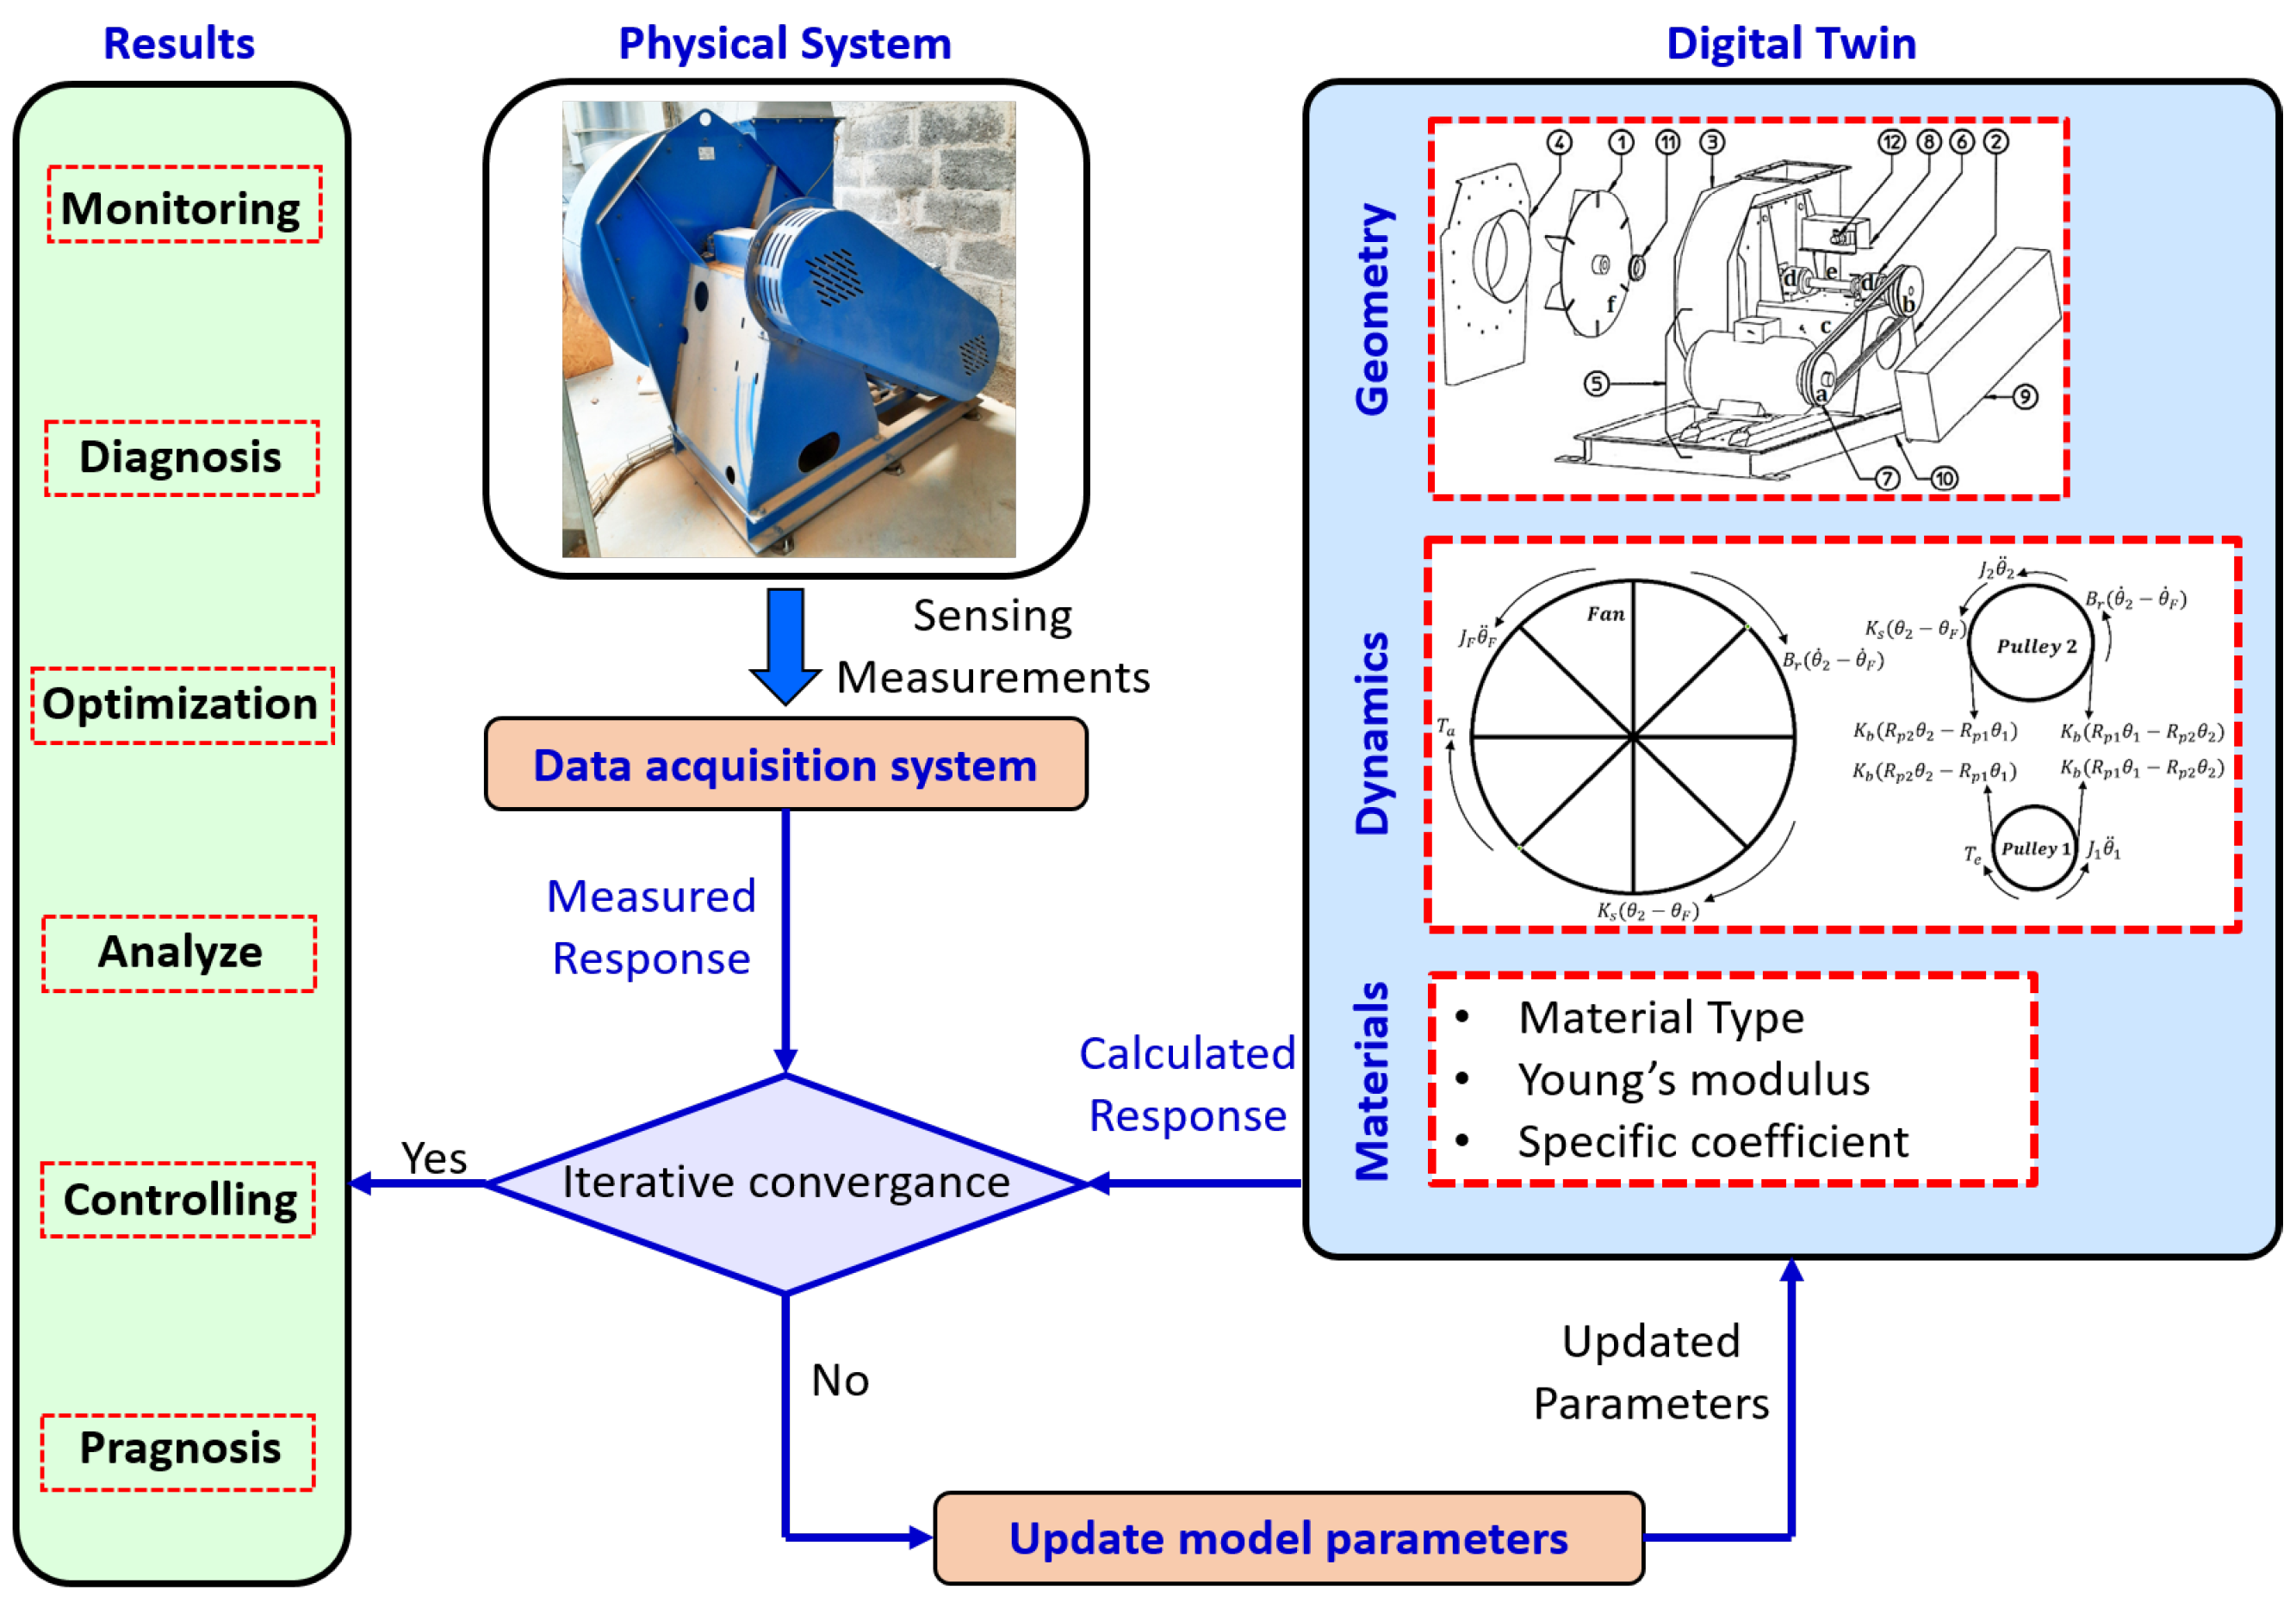
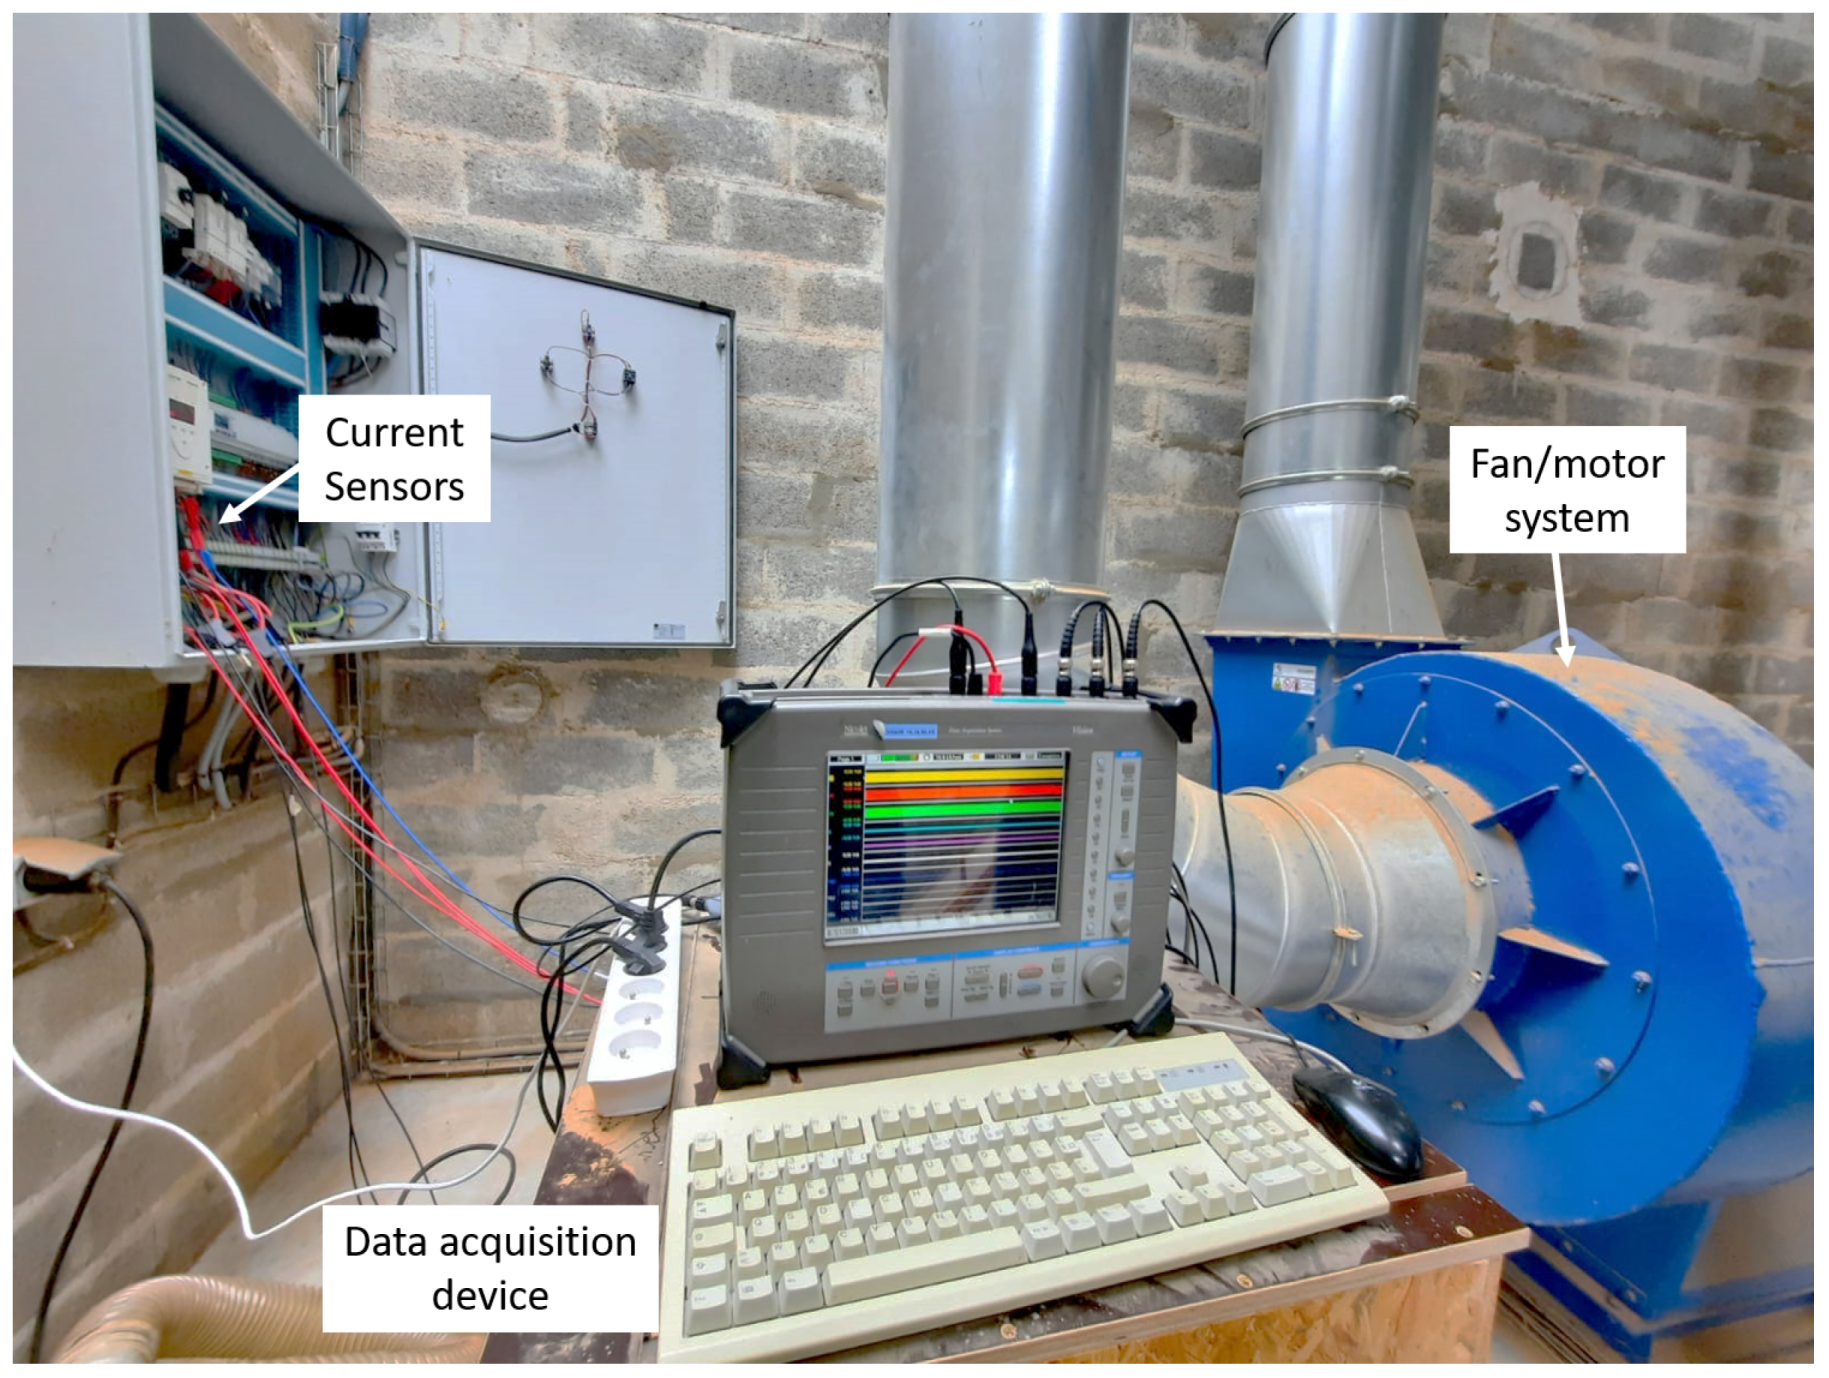
2.1. Description of the Physical System
2.2. Developing of the Digital Twin
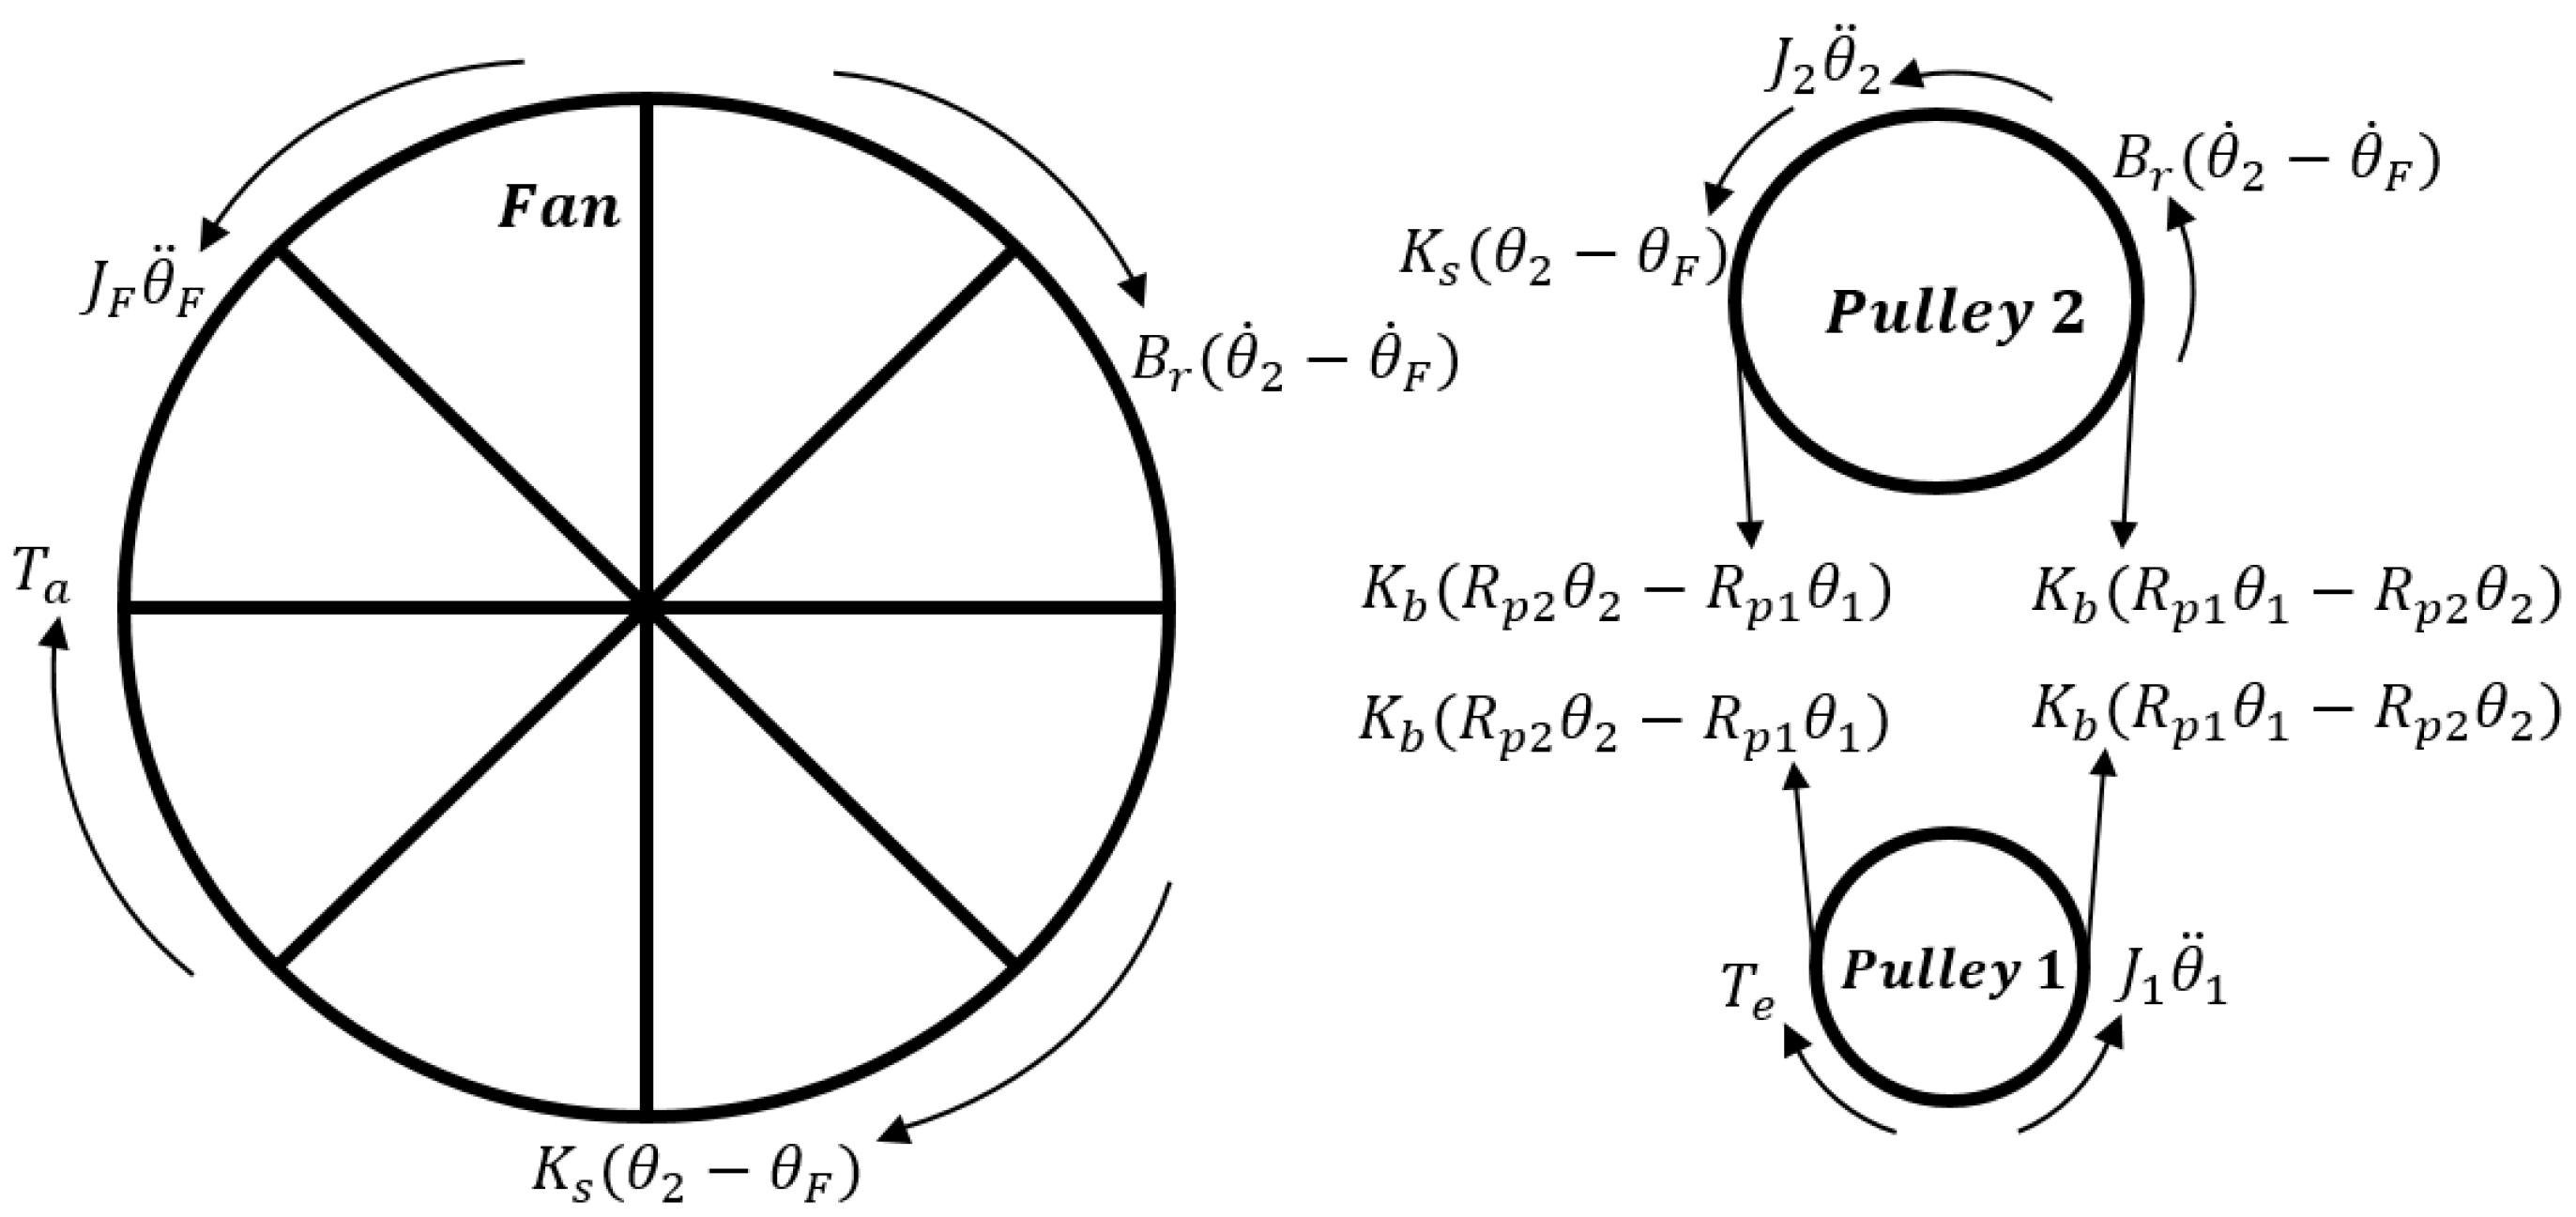
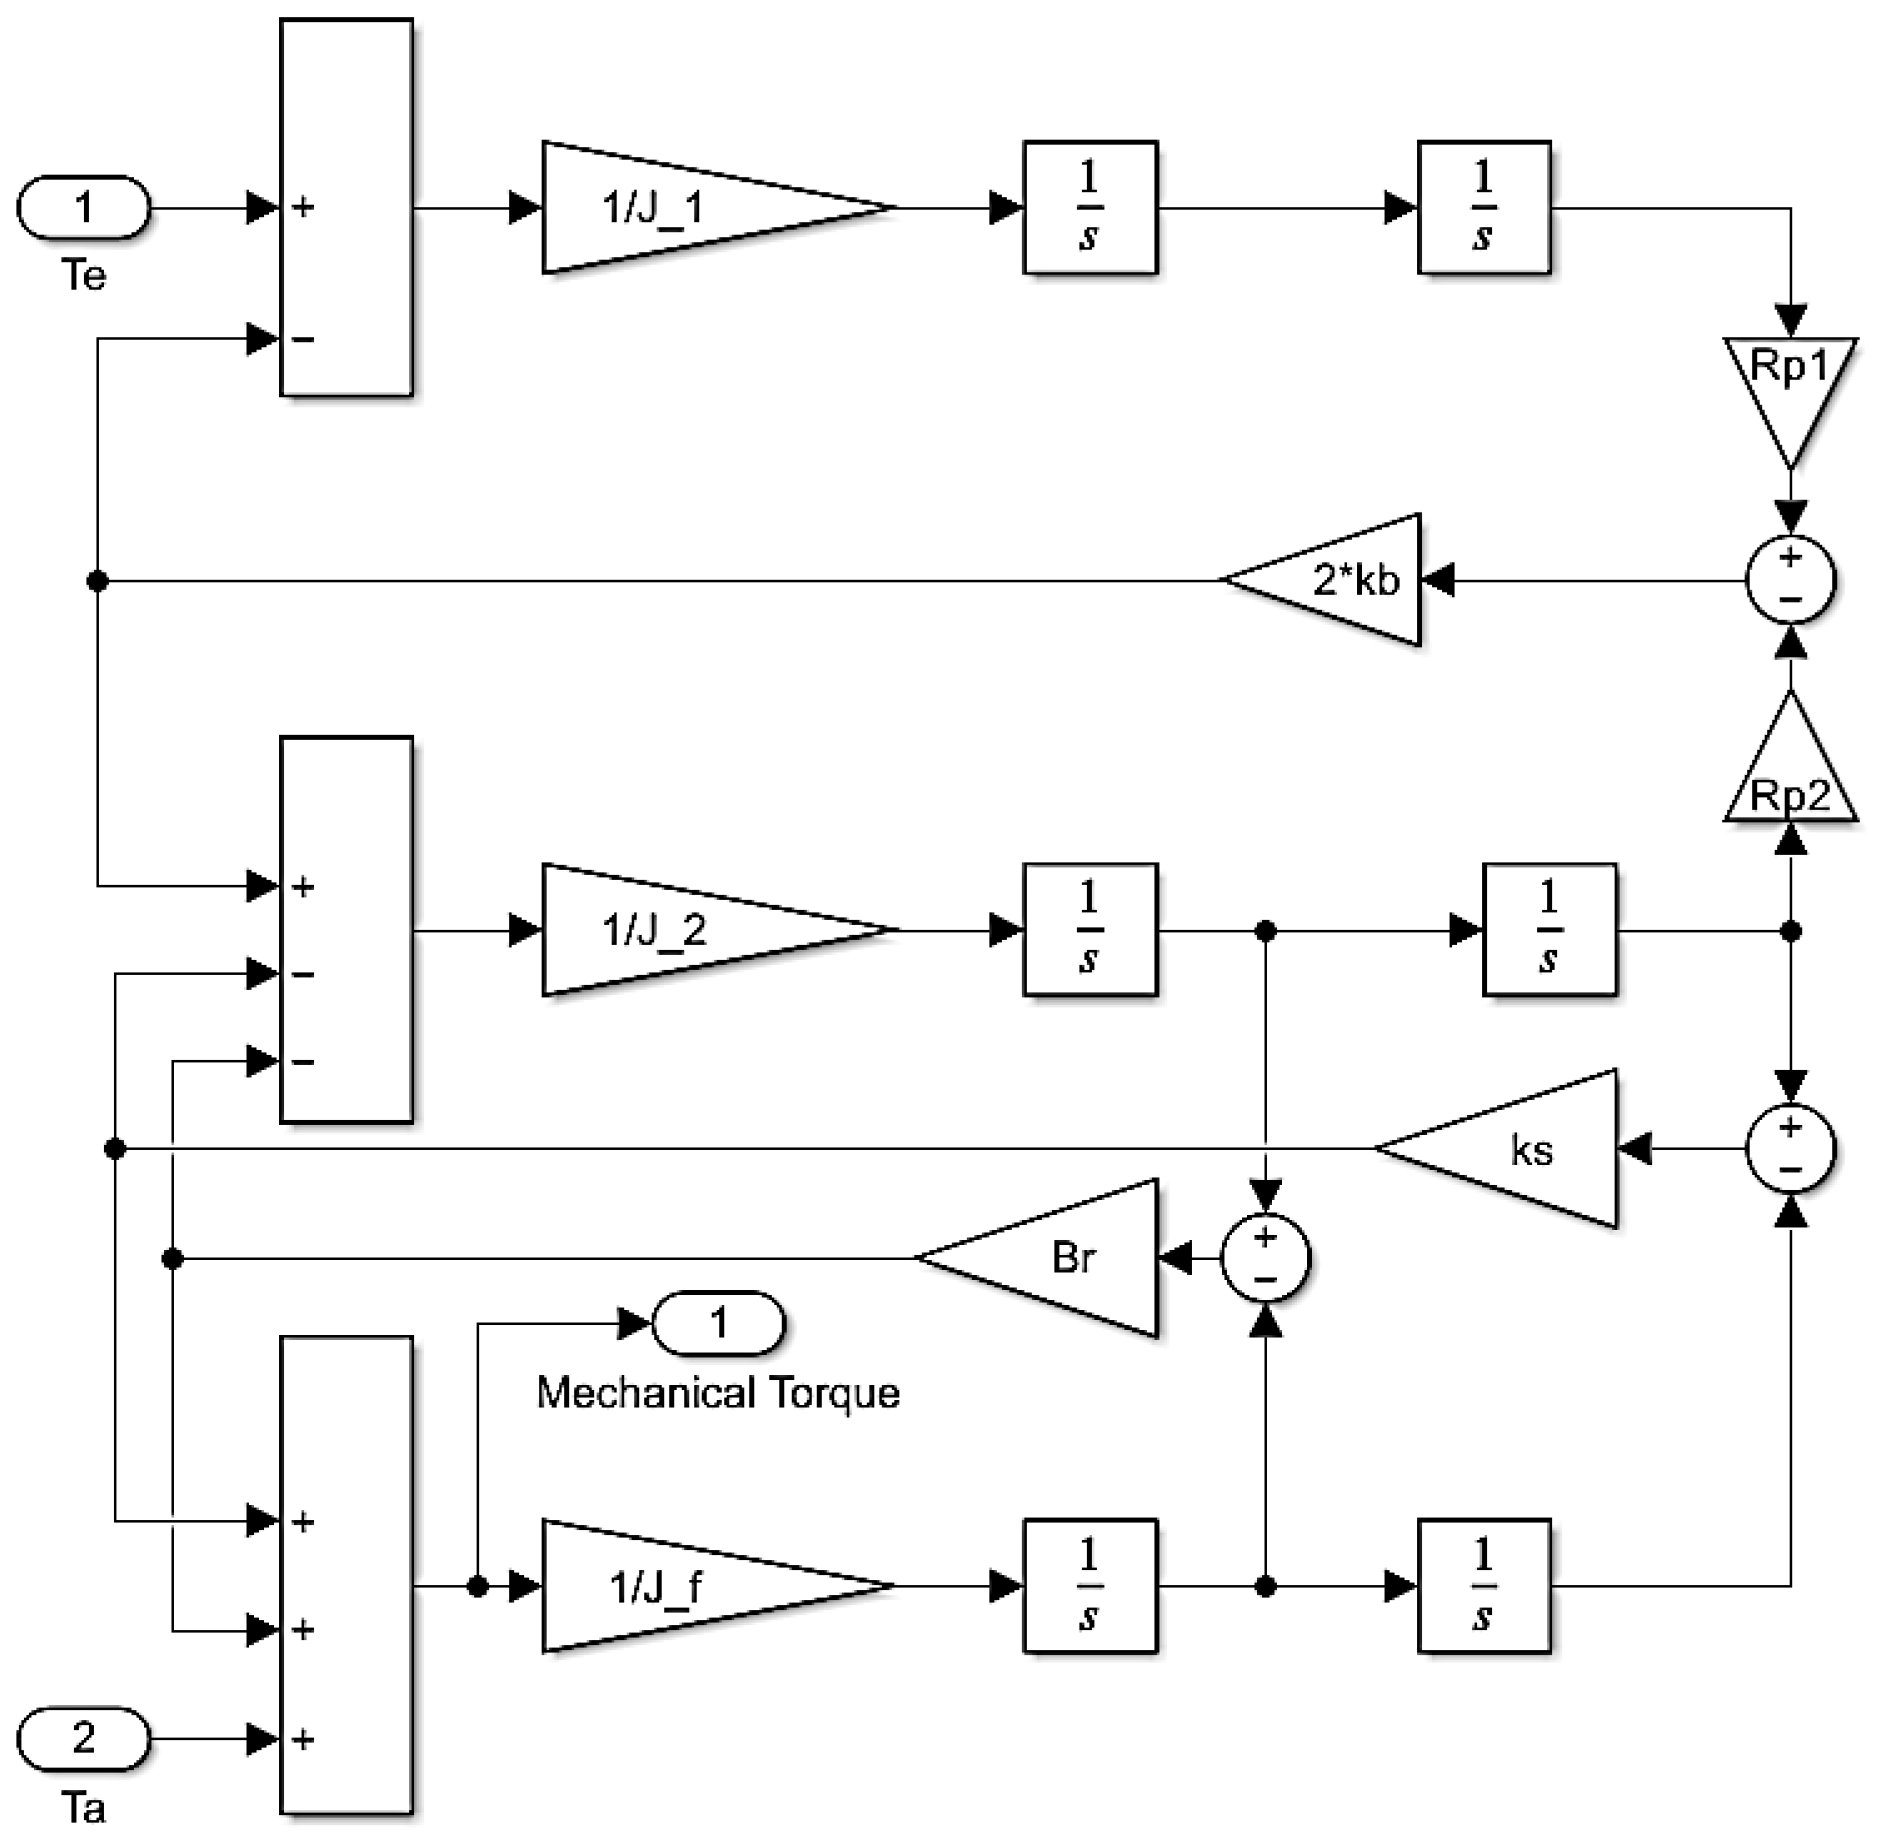
2.2.1. Mathematical Model
- Pulley 1:
- Pulley 2:
- The fan:
2.2.2. System Defects
| Defect | Frequency (Hz) | Reference |
|---|---|---|
| Bearing inner ring | 0.6 × | [43] |
| Ball bearings | 0.4 × | [43] |
| Belts | [44] | |
| Broken rotor | [45] | |
| Notch harmonics | ×/p | [46] |
| Eccentricity | [47] | |
| Fan imbalance | × | [47] |
| Misalignment | [39] |
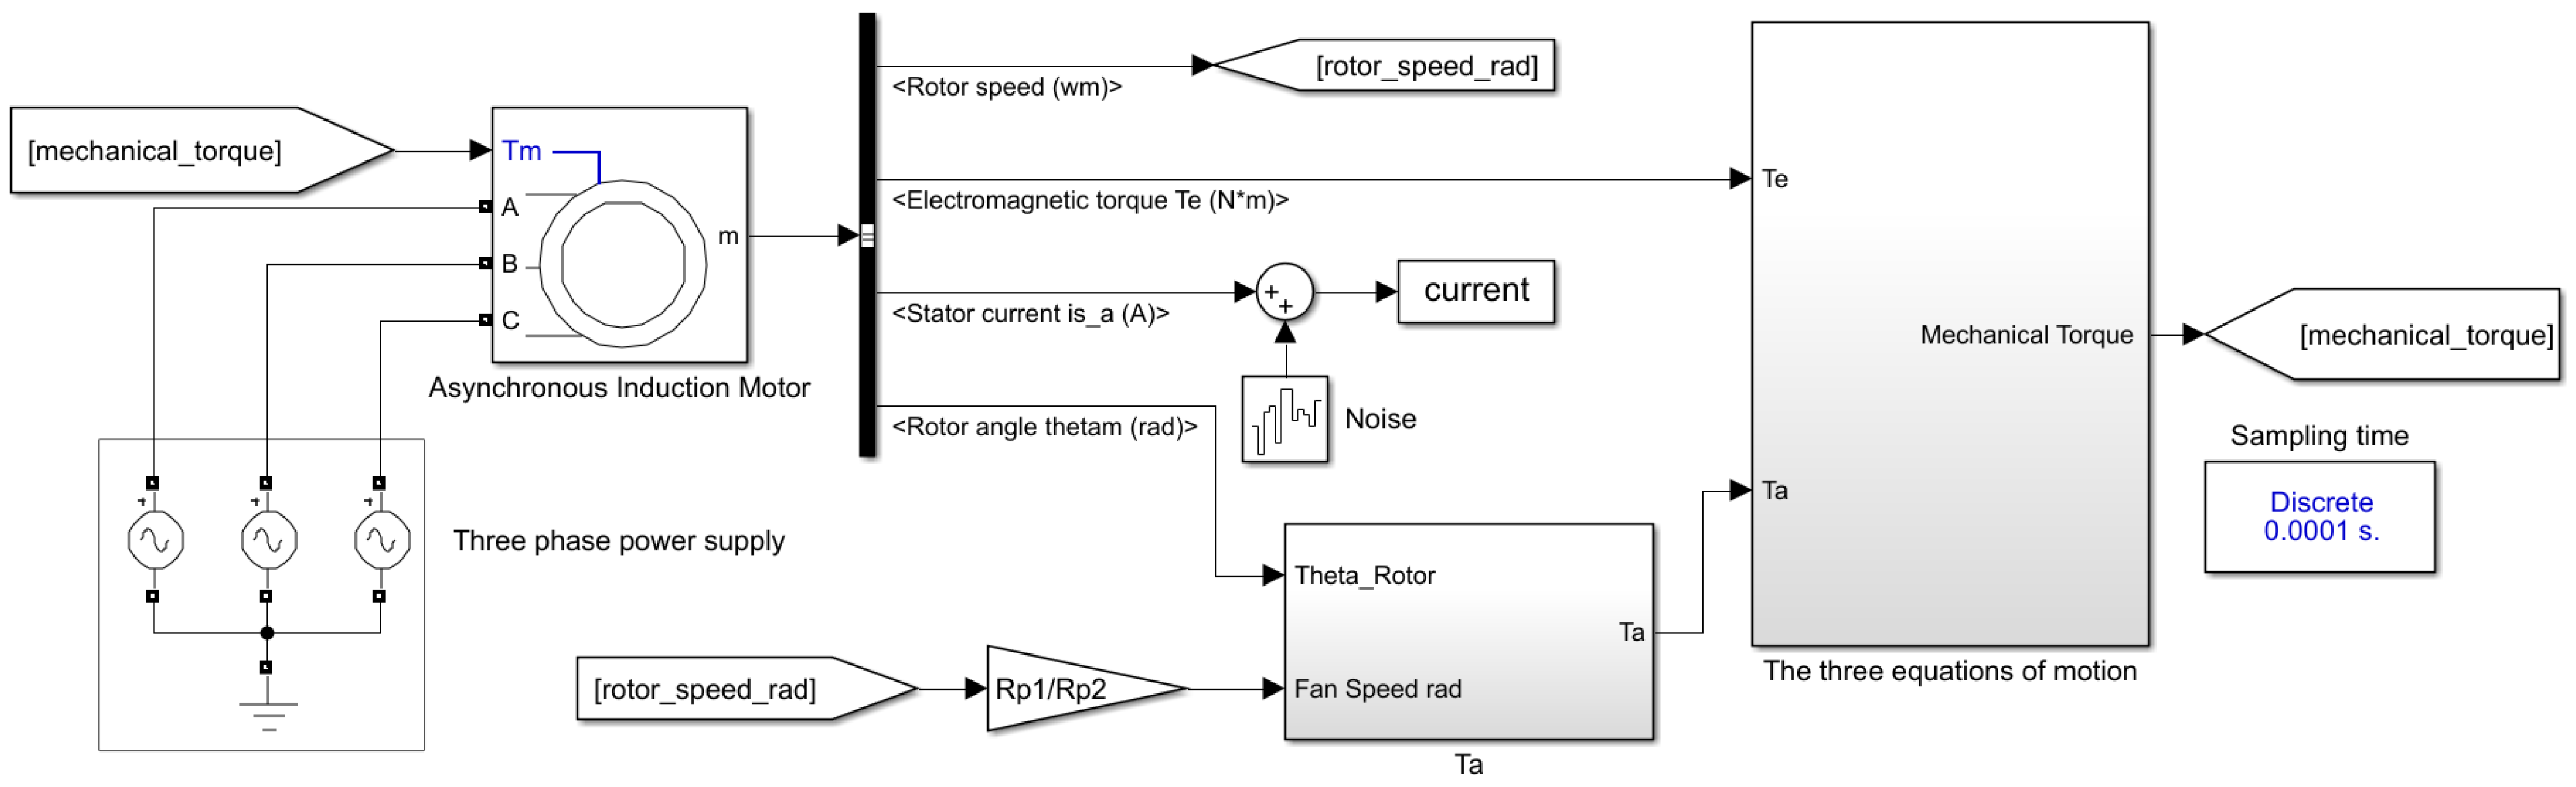
2.2.3. Modeling
2.3. Electrical Analysis
2.3.1. Motor Current Signature Analysis (MCSA)
| Method | Dimension | Type | Reference |
|---|---|---|---|
| Recursive identification | Mono-dimensional | Online | [52] |
| Teager–Kaiser Energy | Mono-dimensional | Online | [53] |
| Concordia Transform | Multi-dimensional | Online | [54] |
| Hilbert transform | Mono-dimensional | Offline | [55] |
| Principal Component Analysis | Multi-dimensional | Offline | [56] |
2.3.2. Concordia Transform
2.4. Diagnostic Protocol: Statistical Method
3. Results and Discussions
4. Conclusions
Author Contributions
Funding
Institutional Review Board Statement
Data Availability Statement
Acknowledgments
Conflicts of Interest
Abbreviations
| CM | Condition monitoring |
| IM | Induction motor |
| MCSA | Motor current signature analysis |
| MTC | Municipal technical centre |
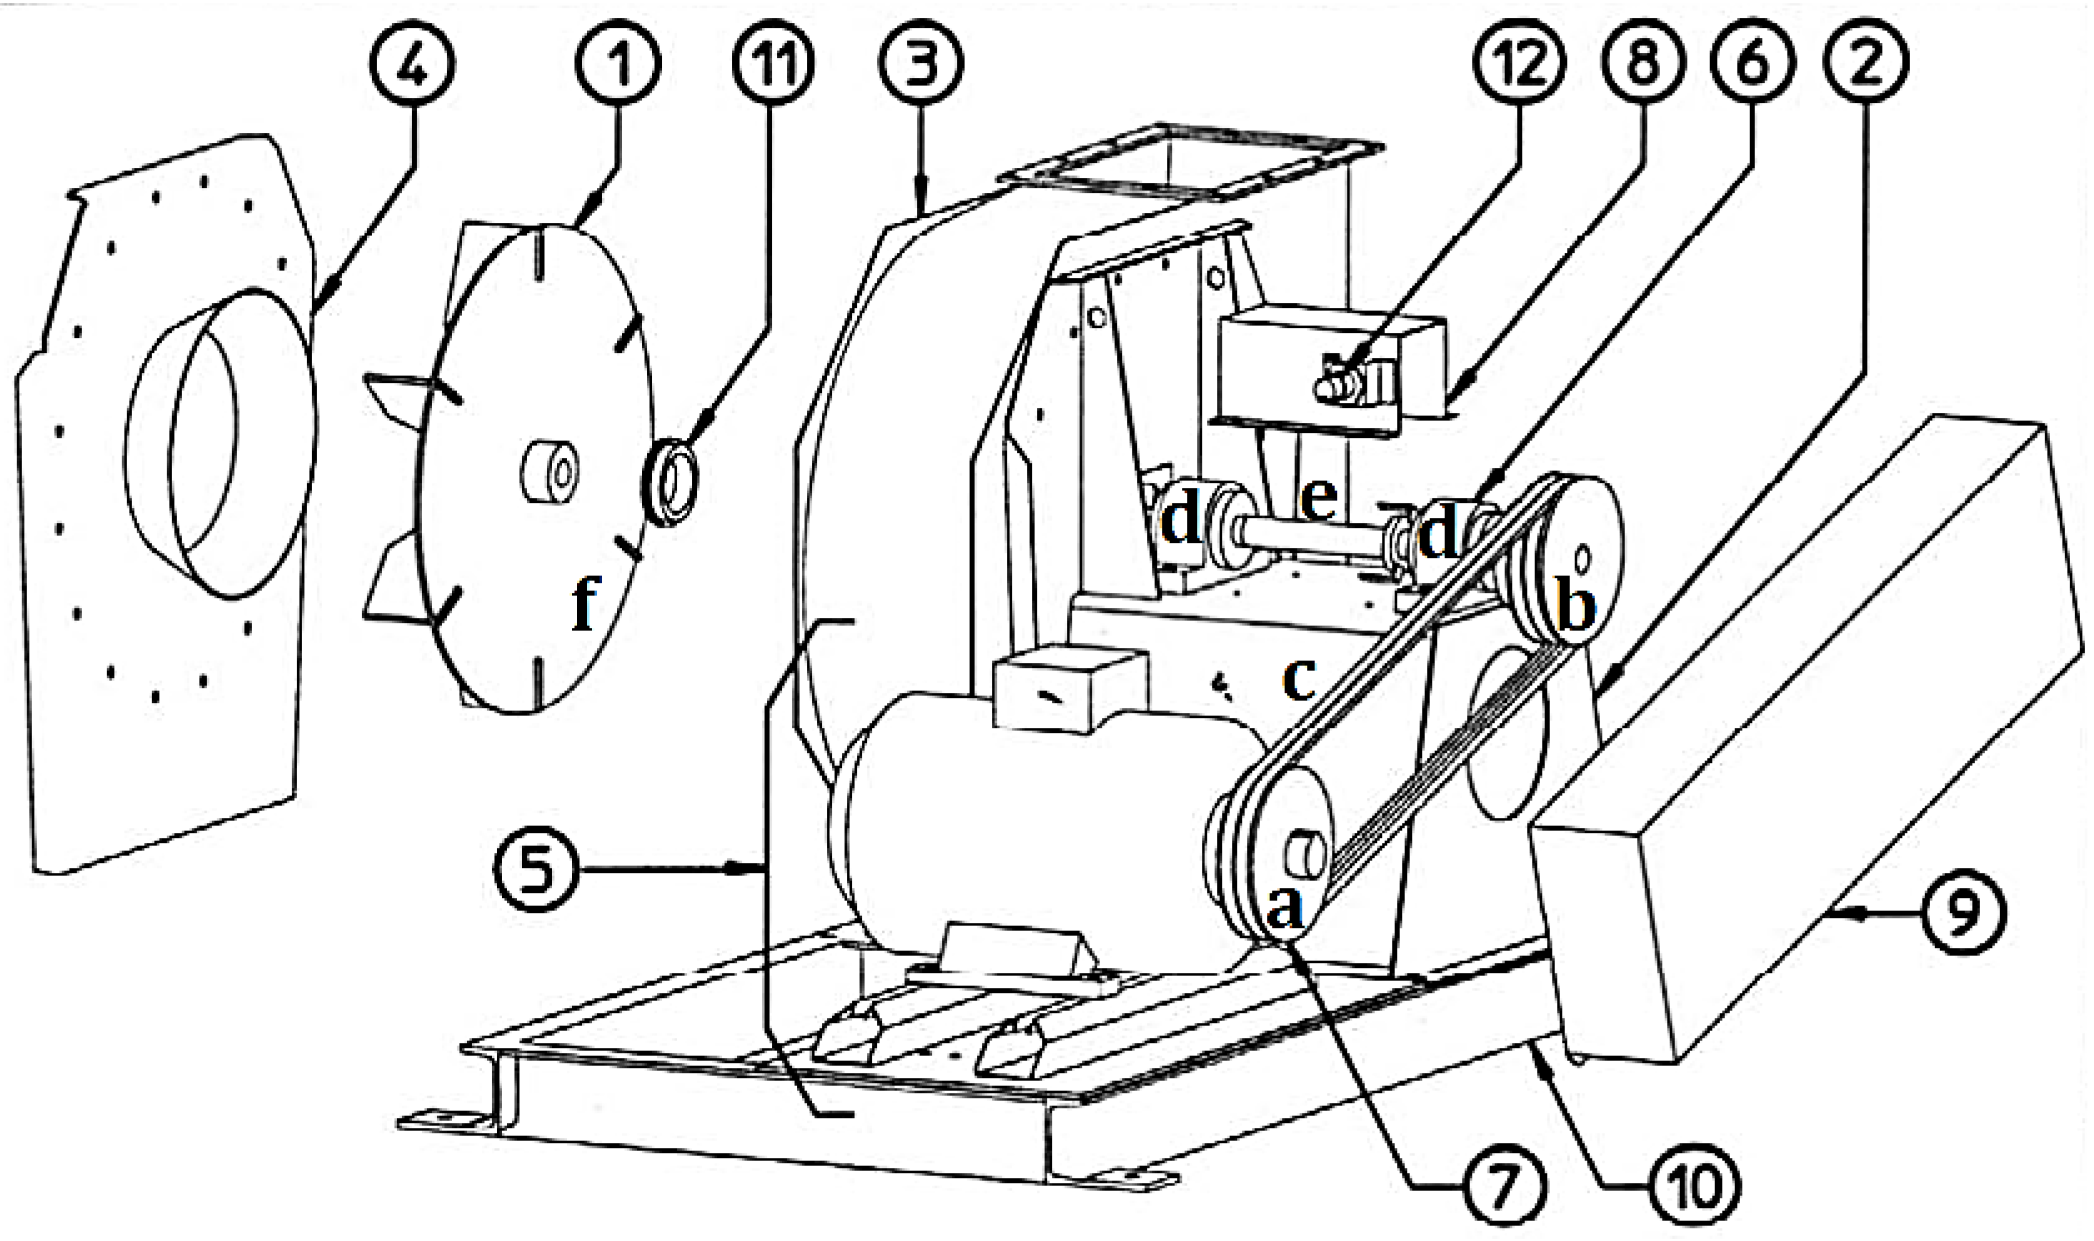
Appendix A
| 1 | Turbine |
| 2 | Seat |
| 3 | Scroll |
| 4 | Entrance pavilion |
| 5 | Motor with sliders |
| 6 | Shaft connection |
| 7 | Transmission |
| 8 | Shaft casing and baring |
| 9 | Transmission casing |
| 10 | Frame |
| 11 | Reinforced sealing system (option) |
| 12 | Rotation detector (option) |
| a | Pulley 1 |
| b | Pulley 2 |
| c | Belts |
| d | Bearings |
| e | Shaft |
| f | Fan |
References
- Mattera, C.G.; Quevedo, J.; Escobet, T.; Shaker, H.R.; Jradi, M. A Method for Fault Detection and Diagnostics in Ventilation Units Using Virtual Sensors. Sensors 2018, 18, 3931. [Google Scholar] [CrossRef]
- Kaya, D.; Çanka Kılıç, F.; Öztürk, H.H. Energy Management and Energy Efficiency in Industry: Practical Examples; Chapter Energy Efficiency in Fans; Springer International Publishing: Cham, Switzerland, 2021; pp. 419–425. [Google Scholar] [CrossRef]
- Diab, A.A.Z.; Al-Sayed, A.H.M.; Mohammed, H.H.A.; Mohammed, Y.S. Development of Adaptive Speed Observers for Induction Machine System Stabilization; Chapter Literature Review of Induction Motor Drives; Springer: Singapore, 2020; pp. 7–18. [Google Scholar] [CrossRef]
- Jin, X.; Chow, T.W. Anomaly detection of cooling fan and fault classification of induction motor using Mahalanobis–Taguchi system. Expert Syst. Appl. 2013, 40, 5787–5795. [Google Scholar] [CrossRef]
- Kang, T.J.; Yang, C.; Park, Y.; Hyun, D.; Lee, S.B.; Teska, M. Electrical Monitoring of Mechanical Defects in Induction Motor-Driven V-Belt–Pulley Speed Reduction Couplings. IEEE Trans. Ind. Appl. 2018, 54, 2255–2264. [Google Scholar] [CrossRef]
- Yan, X.; Jia, M.; Zhang, W.; Zhu, L. Fault diagnosis of rolling element bearing using a new optimal scale morphology analysis method. ISA Trans. 2018, 73, 165–180. [Google Scholar] [CrossRef]
- Glowacz, A.; Glowacz, W.; Glowacz, Z.; Kozi, J. Early fault diagnosis of bearing and stator faults of the single-phase induction motor using acoustic signals. Measurement 2018, 113, 1–9. [Google Scholar] [CrossRef]
- Bazan, G.H.; Scalassara, P.R.; Endo, W.; Goedtel, A.; Godoy, W.F.; Palácios, R.H.C. Stator fault analysis of three-phase induction motors using information measures and artificial neural networks. Electr. Power Syst. Res. 2017, 143, 347–356. [Google Scholar] [CrossRef]
- Gonzalez-Cordoba, J.L.; Osornio-Rios, R.A.; Granados-Lieberman, D.; Romero-Troncoso, R.d.J.; Valtierra-Rodriguez, M. Thermal-Impact-Based Protection of Induction Motors Under Voltage Unbalance Conditions. IEEE Trans. Energy Convers. 2018, 33, 1748–1756. [Google Scholar] [CrossRef]
- Sahu, S.; Dash, R.N.; Panigrahi, C.K.; Subudhi, B. Unbalanced voltage effects and its analysis on an induction motor. In Proceedings of the International Conference on Innovative Mechanisms for Industry Applications (ICIMIA), Bengaluru, India, 21–23 February 2017; pp. 263–268. [Google Scholar] [CrossRef]
- Panagiotou, P.A.; Arvanitakis, I.; Lophitis, N.; Antonino-Daviu, J.A.; Gyftakis, K.N. A New Approach for Broken Rotor Bar Detection in Induction Motors Using Frequency Extraction in Stray Flux Signals. IEEE Trans. Ind. Appl. 2019, 55, 3501–3511. [Google Scholar] [CrossRef]
- Asad, B.; Vaimann, T.; Belahcen, A.; Kallaste, A.; Rassolkin, A.; Heidari, H. The Low Voltage Start-up Test of Induction Motor for the Detection of Broken Bars. In Proceedings of the International Conference on Electrical Machines (ICEM), Online, 23–26 August 202; pp. 1481–1487. [CrossRef]
- Oumaamar, M.E.K.; Maouche, Y.; Boucherma, M.; Khezzar, A. Static air-gap eccentricity fault diagnosis using rotor slot harmonics in line neutral voltage of three-phase squirrel cage induction motor. Mech. Syst. Signal Process. 2017, 84, 584–597. [Google Scholar] [CrossRef]
- Yassa, N.; Rachek, M.; Houassine, H. Motor Current Signature Analysis for the Air Gap Eccentricity Detection In the Squirrel Cage Induction Machines. Energy Procedia 2019, 162, 251–262. [Google Scholar] [CrossRef]
- Jokic, S.; Cincar, N.; Novakovic, B. The analysis of vibration measurement and current signature in motor drive faults detection. In Proceedings of the 17th International Symposium INFOTEH-JAHORINA (INFOTEH), Sarajevo, Bosnia and Herzegovina, 21–23 March 2018; pp. 1–6. [Google Scholar] [CrossRef]
- Gangsar, P.; Tiwari, R. Signal based condition monitoring techniques for fault detection and diagnosis of induction motors: A state-of-the-art review. Mech. Syst. Signal Process. 2020, 144, 106908. [Google Scholar] [CrossRef]
- Han, Q.; Ding, Z.; Xu, X.; Wang, T.; Chu, F. Stator current model for detecting rolling bearing faults in induction motors using magnetic equivalent circuits. Mech. Syst. Signal Process. 2019, 131, 554–575. [Google Scholar] [CrossRef]
- Toma, R.N.; Prosvirin, A.E.; Kim, J.M. Bearing Fault Diagnosis of Induction Motors Using a Genetic Algorithm and Machine Learning Classifiers. Sensors 2020, 20, 1884. [Google Scholar] [CrossRef]
- Hossain, M.L.; Abu-Siada, A.; Muyeen, S.M. Methods for Advanced Wind Turbine Condition Monitoring and Early Diagnosis: A Literature Review. Energies 2018, 11, 1309–1322. [Google Scholar] [CrossRef]
- Arun, A.; Rameshkumar, K.; Unnikrishnan, D.; Sumesh, A. Tool Condition Monitoring Of Cylindrical Grinding Process Using Acoustic Emission Sensor. Mater. Today Proc. 2018, 5, 11888–11899. [Google Scholar] [CrossRef]
- Choudhary, A.; Goyal, D.; Shimi, S.L.; Akula, A. Condition Monitoring and Fault Diagnosis of Induction Motors: A Review. Arch. Comput. Methods Eng. 2019, 26, 1221–1238. [Google Scholar] [CrossRef]
- Schoen, R.; Habetler, T. Effects of time-varying loads on rotor fault detection in induction machines. In Proceedings of the 1993 IEEE Industry Applications Conference TwentyEighth IAS Annual Meeting, Toronto, ON, Canada, 2–8 October 1993; pp. 324–330. [Google Scholar] [CrossRef]
- Saad, N.; Irfan, M.; Ibrahim, R. Condition Monitoring and Faults Diagnosis of Induction Motors: Electrical Signature Analysis; CRC Press: Boca Raton, FL, USA, 2018. [Google Scholar]
- Thomson, W.T.; Culbert, I. Current signature analysis for condition monitoring of cage induction motors: Industrial application and case Histories, first edition. In Proceedings of the International Conference on Electrical, Electronics, and Optimization Techniques (ICEEOT 2016), Chennai, India, 3–5 March 2016. [Google Scholar]
- Boschert, S.; Rosen, R. Digital Twin—The Simulation Aspect; Springer: Berlin/Heidelberg, Germany, 2016. [Google Scholar]
- Grieves, M. Manufacturing Excellence through Virtual Factory Replication. White Pap. 2015, 1, 1–7. [Google Scholar]
- Negri, E.; Fumagalli, L.; Macchi, M. A review of the roles of digital twin in CPS-based production system. Procedia Manuf. 2017, 11, 939–948. [Google Scholar] [CrossRef]
- Tuegel, E.J.; Ingraffea, A.R.; Eason, T.G.; Spottswood, S.M. Reengineering aircraft structural life prediction using a digital twin. Int. J. Aerosp. Eng. 2011, 2011, 154798. [Google Scholar] [CrossRef]
- Abramovici, M.; Göbel, J.C.; BaoDang, H. Semantic data management for the development and continuous reconfiguration of smart products and systems. CIRP Annals 2016, 65, 185–188. [Google Scholar] [CrossRef]
- Rosen, R.; Wichert, G.; Lo, G.; Bettenhausen, K.D. About the importance of autonomy and digital twins for the future of manufacturing. CIRP Annals 2015, 48, 567–572. [Google Scholar] [CrossRef]
- Schluse, M.; Rossmann, J. From simulation to experimentable digital twins: Simulation-based development and operation of complex technical systems. In Proceedings of the IEEE International Symposium on Systems Engineering (ISSE), Edinburgh, UK, 3–5 October 2016; pp. 1–6. [Google Scholar] [CrossRef]
- Kraft, E.M. The Air Force Digital Thread/Digital Twin—Life Cycle Integration and Use of Computational and Experimental Knowledge. In Proceedings of the 54th AIAA Aerospace Sciences Meeting, AIAA SciTech Forum (AIAA 2016-0897), Grapevine, TX, USA, 9–13 January 2017; pp. 1–22. [Google Scholar] [CrossRef]
- Aivaliotis, P.; Georgoulias, K.; Alexopoulos, K. Using digital twin for maintenance applications in manufacturing: State of the Art and Gap analysis. In Proceedings of the IEEE International Conference on Engineering, Technology and Innovation (ICE/ITMC), Park, France, 17–19 June 2019; pp. 1–5. [Google Scholar] [CrossRef]
- Chowdhury, S.; Yedavalli, R.K. Dynamics of belt-pulley-shaft systems. Mech. Mach. Theory 2016, 98, 199–215. [Google Scholar] [CrossRef]
- Fu, C.; Xu, Y.; Yang, Y.; Lu, K.; Gu, F.; Ball, A. Response analysis of an accelerating unbalanced rotating system with both random and interval variables. J. Sound Vib. 2020, 466, 115047. [Google Scholar] [CrossRef]
- Yu, P.; Zhang, D.; Ma, Y.; Hong, J. Dynamic modeling and vibration characteristics analysis of the aero-engine dual-rotor system with Fan blade out. Mech. Syst. Signal Process. 2018, 106, 158–175. [Google Scholar] [CrossRef]
- Yakhni, M.F.; Ali, M.N.; El-Goary, M.A. Magnetorheological damper voltage control using artificial neural network for optimum vehicle ride comfort. J. Mech. Eng. Sci. 2021, 15, 7648–7661. [Google Scholar] [CrossRef]
- Luo, W.; Hu, T.; Zhang, C.; Wei, Y. Digital twin for CNC machine tool: Modeling and using strategy. J. Ambient. Intell. Humaniz. Comput. 2019, 10, 1129–1140. [Google Scholar] [CrossRef]
- Afrizal, N. Motor Current Signature Analysis towards Mechanical Seal Failure Detection for Electrical Submersible Pump. Ph.D. Thesis, University of Liverpool, Liverpool, UK, 2020. [Google Scholar]
- Xia, M.; Shao, H.; Williams, D.; Lu, S.; Shu, L.; de Silva, C.W. Intelligent fault diagnosis of machinery using digital twin-assisted deep transfer learning Reliab. Eng. Syst. Saf. 2021, 215, 107938. [Google Scholar] [CrossRef]
- Xiao, Y.; Shao, H.; Han, S.; Huo, Z.; Wan, J. Novel Joint Transfer Network for Unsupervised Bearing Fault Diagnosis From Simulation Domain to Experimental Domain. IEEE/ASME Trans. Mechatron. 2022, 215, 1–10. [Google Scholar] [CrossRef]
- Wang, J.; Ye, L.; Gao, R.X.; Li, C.; Zhang, L. Digital Twin for rotating machinery fault diagnosis in smart manufacturing. Int. J. Prod. Res. 2019, 57, 3920–3934. [Google Scholar] [CrossRef]
- Noureddine, B.; Eddine, Z.S.; Mohamed, S. Experimental exploitation for the diagnosis to the induction machine under a bearing fault—Using MCSA. In Proceedings of the 4th International Conference on Electrical Engineering (ICEE), Boumerdes, Algeria, 13–15 December; pp. 1–4. [CrossRef]
- Hyun, D.; Kang, T.J.; Kim, J. Fault diagnosis of belt driving power transfer facility using vibration analysis. J. Electr. Eng. Technol. 2021, 16, 2257–2264. [Google Scholar] [CrossRef]
- Singh, G.; Naikan, V. Detection of half broken rotor bar fault in VFD driven induction motor drive using motor square current MUSIC analysis. Mech. Syst. Signal Process. 2018, 110, 333–348. [Google Scholar] [CrossRef]
- Thomson, W.T.; Culbert, I. Current Signature Analysis for Condition Monitoring of Cage Induction Motors: Industrial Application and Case Histories; John Wiley & Sons: Hoboken, NJ, USA, 2017. [Google Scholar]
- Dehina, W.; Boumerhaz, M.; Kraftz, F.; Fantini, J. Diagnosis and Comparison between Stator Current Analysis and Vibration Analysis of Static Eccentricity Faults in The Induction Motor. In Proceedings of the 4th International Conference on Power Electronics and their Applications (ICPEA), Elazig, Turkey, 25–27 September 2019; pp. 1–4. [Google Scholar] [CrossRef]
- Fournier, E.; Picot, A.; Régnier, J.; Andrieux, C.; Saint-Michel, J.; Maussion, P. Effects of transmission belt looseness on electrical and mechanical measurements of an induction motor. In Proceedings of the 2015 IEEE 10th International Symposium on Diagnostics for Electrical Machines, Power Electronics and Drives (SDEMPED), Guarda, Portugal, 1–4 September 2015; pp. 259–265. [Google Scholar] [CrossRef]
- Marzebali, M.H.; Kia, S.H.; Henao, H.; Capolino, G.A.; Faiz, J. Planetary Gearbox Torsional Vibration Effects on Wound-Rotor Induction Generator Electrical Signatures. IEEE Trans. Ind. Appl. 2016, 52, 4770–4780. [Google Scholar] [CrossRef]
- Allouche, A.; Etien, E.; Rambault, L.; Doget, T.; Cauet, S.; Sakout, A. Mechanical Fault Diagnostic in PMSM from Only One Current Measurement: A Tacholess Order Tracking Approach. Sensors 2020, 20, 5011. [Google Scholar] [CrossRef]
- Elvira-Ortiz, D.A.; Morinigo-Sotelo, D.; Zorita-Lamadrid, A.L.; Osornio-Rios, R.A.; Romero-Troncoso, R.D.J. Fundamental frequency suppression for the detection of broken bar in induction motors at low slip and frequency. Appl. Sci. 2020, 10, 4160. [Google Scholar] [CrossRef]
- Etien, E.; Allouche, A.; Rambault, L.; Doget, T.; Cauet, S.; Sakout, A. A Tacholess Order Analysis Method for PMSG Mechanical Fault Detection with Varying Speeds. Electronics 2021, 10, 418. [Google Scholar] [CrossRef]
- Li, H.; Wang, Z.; Zhen, D.; Gu, F.; Ball, A. Modulation Sideband Separation Using the Teager–Kaiser Energy Operator for Rotor Fault Diagnostics of Induction Motors. Energies 2019, 12, 4437. [Google Scholar] [CrossRef]
- Trajin, B.; Chabert, M.; Regnier, J.; Faucher, J. Hilbert versus Concordia transform for three-phase machine stator current time-frequency monitoring. Mech. Syst. Signal Process. 2009, 23, 2648–2657. [Google Scholar] [CrossRef]
- Elbouchikhi, E.; Choqueuse, V.; Amirat, Y.; Benbouzid, M.E.H.; Turri, S. An Efficient Hilbert–Huang Transform-Based Bearing Faults Detection in Induction Machines. IEEE Trans. Energy Convers. 2017, 32, 401–413. [Google Scholar] [CrossRef]
- Choqueuse, V.; Benbouzid, M.E.H.; Amirat, Y.; Turri, S. Diagnosis of Three-Phase Electrical Machines Using Multidimensional Demodulation Techniques. IEEE Trans. Ind. Electron. 2012, 59, 2014–2023. [Google Scholar] [CrossRef]
- Bouchikhi, E.H.E.; Choqueuse, V.; Benbouzid, M.; Antonino-Daviu, J.A. Stator current demodulation for induction machine rotor faults diagnosis. In Proceedings of the First International Conference on Green Energy ICGE 2014, Sfax, Tunisia, 25–27 March 2014; pp. 176–181. [Google Scholar] [CrossRef]
- Pin, G.; Wang, Y.; Chen, B.; Parisini, T. Identification of multi-sinusoidal signals with direct frequency estimation: An adaptive observer approach. Automatica 2019, 99, 338–345. [Google Scholar] [CrossRef]
- Fournier, E.; Picot, A.; Regnier, J.; Maussion, P.; Yamdeu, M.T.; Andrejak, J.M.; Somer, L. A generic diagnosis protocol for the monitoring of induction motors based on multiple statistical references in the torque-speed plane. In Proceedings of the IECON 2014—40th Annual Conference of the IEEE Industrial Electronics Society, Dallas, TX, USA, 29 October–1 November 2014; pp. 3348–3354. [Google Scholar] [CrossRef]
- Fournier, E.; Picot, A.; Régnier, J.; Yamdeu, M.T.; Andréjak, J.M.; Maussion, P. Current-Based Detection of Mechanical Unbalance in an Induction Machine Using Spectral Kurtosis With Reference. IEEE Trans. Ind. Electron. 2015, 62, 1879–1887. [Google Scholar] [CrossRef]


| Supply | Voltage (V) | Frequency (Hz) | Current (A) | Power (KW) | Cos () | Speed (rpm) |
|---|---|---|---|---|---|---|
| Three-Phase | 400 Delta | 50 | 51.6 | 30 | 0.9 | 2950 |
Publisher’s Note: MDPI stays neutral with regard to jurisdictional claims in published maps and institutional affiliations. |
© 2022 by the authors. Licensee MDPI, Basel, Switzerland. This article is an open access article distributed under the terms and conditions of the Creative Commons Attribution (CC BY) license (https://creativecommons.org/licenses/by/4.0/).
Share and Cite
Yakhni, M.F.; Hosni, H.; Cauet, S.; Sakout, A.; Etien, E.; Rambault, L.; Assoum, H.; El-Gohary, M. Design of a Digital Twin for an Industrial Vacuum Process: A Predictive Maintenance Approach. Machines 2022, 10, 686. https://doi.org/10.3390/machines10080686
Yakhni MF, Hosni H, Cauet S, Sakout A, Etien E, Rambault L, Assoum H, El-Gohary M. Design of a Digital Twin for an Industrial Vacuum Process: A Predictive Maintenance Approach. Machines. 2022; 10(8):686. https://doi.org/10.3390/machines10080686
Chicago/Turabian StyleYakhni, Mohammad F., Houssem Hosni, Sebastien Cauet, Anas Sakout, Erik Etien, Laurent Rambault, Hassan Assoum, and Mohamed El-Gohary. 2022. "Design of a Digital Twin for an Industrial Vacuum Process: A Predictive Maintenance Approach" Machines 10, no. 8: 686. https://doi.org/10.3390/machines10080686