Article

Online Multiple Object Tracking Using Spatial Pyramid Pooling Hashing and Image Retrieval for Autonomous Driving

by
Hongjian Wei
1,2,† and
Yingping Huang
1,*,†
1
School of Optical-Electrical and Computer Engineering, University of Shanghai for Science and Technology, Shanghai 200093, China
2
School of Physics and Electronic Engineering, Fuyang Normal University, Fuyang 236037, China
*
Author to whom correspondence should be addressed.
These authors contributed equally to this work.
Machines 2022, 10(8), 668; https://doi.org/10.3390/machines10080668
Submission received: 18 June 2022 / Revised: 4 August 2022 / Accepted: 6 August 2022 / Published: 9 August 2022

Abstract

:
Multiple object tracking (MOT) is a fundamental issue and has attracted considerable attention in the autonomous driving community. This paper presents a novel MOT framework for autonomous driving. The framework consists of two stages of object representation and data association. In the stage of object representation, we employ appearance, motion, and position features to characterize objects. We design a spatial pyramidal pooling hash network (SPPHNet) to generate the appearance features. Multiple-level representative features in the SPPHNet are mapped into a similarity-preserving binary space, called hash features. The hash features retain the visual discriminability of high-dimensional features and are beneficial for computational efficiency. For data association, a two-tier data association scheme is designed to address the occlusion issue, consisting of an affinity cost model and a hash-based image retrieval model. The affinity cost model accommodates the hash features, disparity, and optical flow as the first tier of data association. The hash-based image retrieval model exploits the hash features and adopts image retrieval technology to handle reappearing objects as the second tier of data association. Experiments on the KITTI public benchmark dataset and our campus scenario sequences show that our method has superior tracking performance to the state-of-the-art vision-based MOT methods.

1. Introduction

Multiple object tracking (MOT) is the process of recognizing and locating multiple objects of interest in each frame of a continuous image sequence, assigning and holding a unique identity (ID) for each object, and yielding individual trajectories. MOT is a fundamental issue and has attracted considerable attention in the computer vision community [1,2,3,4]. It has important applications in the fields of autonomous vehicles, robotics, and surveillance. Particularly in autonomous driving, MOT is essential for analyzing moving trajectories (behaviors) of other traffic participants and predicting their position at a certain time, as well as planning the route of the ego-vehicle accordingly.
Owing to the significant progress of object detection technologies, a widely used contemporary pipeline of tracking methods is the tracking-by-detection method [5,6,7,8,9,10,11,12,13]. The approaches following this pipeline firstly detect the bounding boxes of objects by a reliable detector and extract the features of the detected objects. Afterwards, the detected objects or trajectories are linked by a data association approach based on their affinities, computed by their features, to form long tracks. For high-quality tracking, accurate object feature extraction is important. Existing works on MOT such as [6,7,8,9,10] generally apply object bounding boxes directly to feature extraction. A drawback of these approaches is the presence of several background regions in the object bounding boxes. These regions contaminate object attributes and will result in redundant feature extraction and, therefore, unreliable object tracking. Therefore, we apply the segmentation method proposed in our previous work [14] to precisely determine the object regions and correspondingly eliminate the background regions within the bounding boxes. Furthermore, most existing tracking-by-detection methods adopt either hand-crafted features [5,6,7] (shallow level) or employ a Convolutional Neural Network (CNN) [8,9,10] to extract high-dimensional representative features (deep level). These works do not consider multiple levels of abstraction of objects. In this work, we propose a spatial pyramid pooling hash network (SPPHNet) to generate hash features for characterizing objects. The hash features are compact binary codes generated by mapping multiple levels of representative features in the SPPHNet into a similarity-preserving binary space. The hash features retain the visual discriminability of high-dimensional features and, at the same time, are of benefit to computational efficiency. In the proposed SPPHNet, we make use of multiple levels of abstraction of objects rather than only considering the last layer of abstraction. On the other hand, we introduce a spatial pyramid pooling module in the proposed SPPHNet to accommodate the various sizes of bounding boxes so that the hash code can be generated without resizing the bounding boxes, thus avoiding information loss caused by resizing. Apart from the hash features (appearance cue), we also take disparity (position cue) and optical flow (motion cue) for characterizing objects. In this paper, the image sequences used are binocular image sequences captured by a stereo vision system on board an autonomous driving vehicle. Binocular images generally consist of two images, left and right, which are captured by the stereo vision system using the method of observing the same object from two viewpoints in simulation of human binocular observation of the object, i.e., the same object is captured by two cameras at different locations. The position cue is the distance between the object and the cameras’ optical center, calculated according to the triangulation principle using the disparity between the pixels of the two left and right images [15,16].
Data association is to associate corresponding objects in an image sequence according to feature affinities, i.e., link objects into trajectories. The challenge of multiple object tracking lies in the case of occlusion. Existing MOT methods normally work well for tracking continuously appearing objects, but may fail in tracking severely or long-term occluded objects due to unreliable data association. A common solution [12,17] is to reconstruct the entire trajectories of reappearing objects by using trajectory estimation to fill undetected gaps. This method may fail in cases of severe or complete occlusion. In this study, we address this issue from a different perspective by using a two-tier data association scheme. The proposed two-tier data association scheme consists of two tiers of association using two models: an affinity cost model and a hash-based image retrieval model. The affinity cost model accommodates hash features extracted by the SPPHNet, disparity, and optical flow as the first tier of data association. The continuously detected objects can be associated with the affinity cost model. For the unmatched trajectories and unmatched objects (mainly for reappearing objects or newly appearing objects), we construct the hash-based image retrieval model to conduct second-tier data association. By leveraging the image retrieval of “querying image with image” [18,19], we employ the hash features to retrieve coarse matching pairs of the unmatched objects in the historical trajectories, fuse the appearance features with the motion cue to refine the coarse matching pairs, and finally, obtain the correct IDs of objects.
To summarize, this paper presents a novel MOT framework for autonomous driving. The main contributions are as follows:
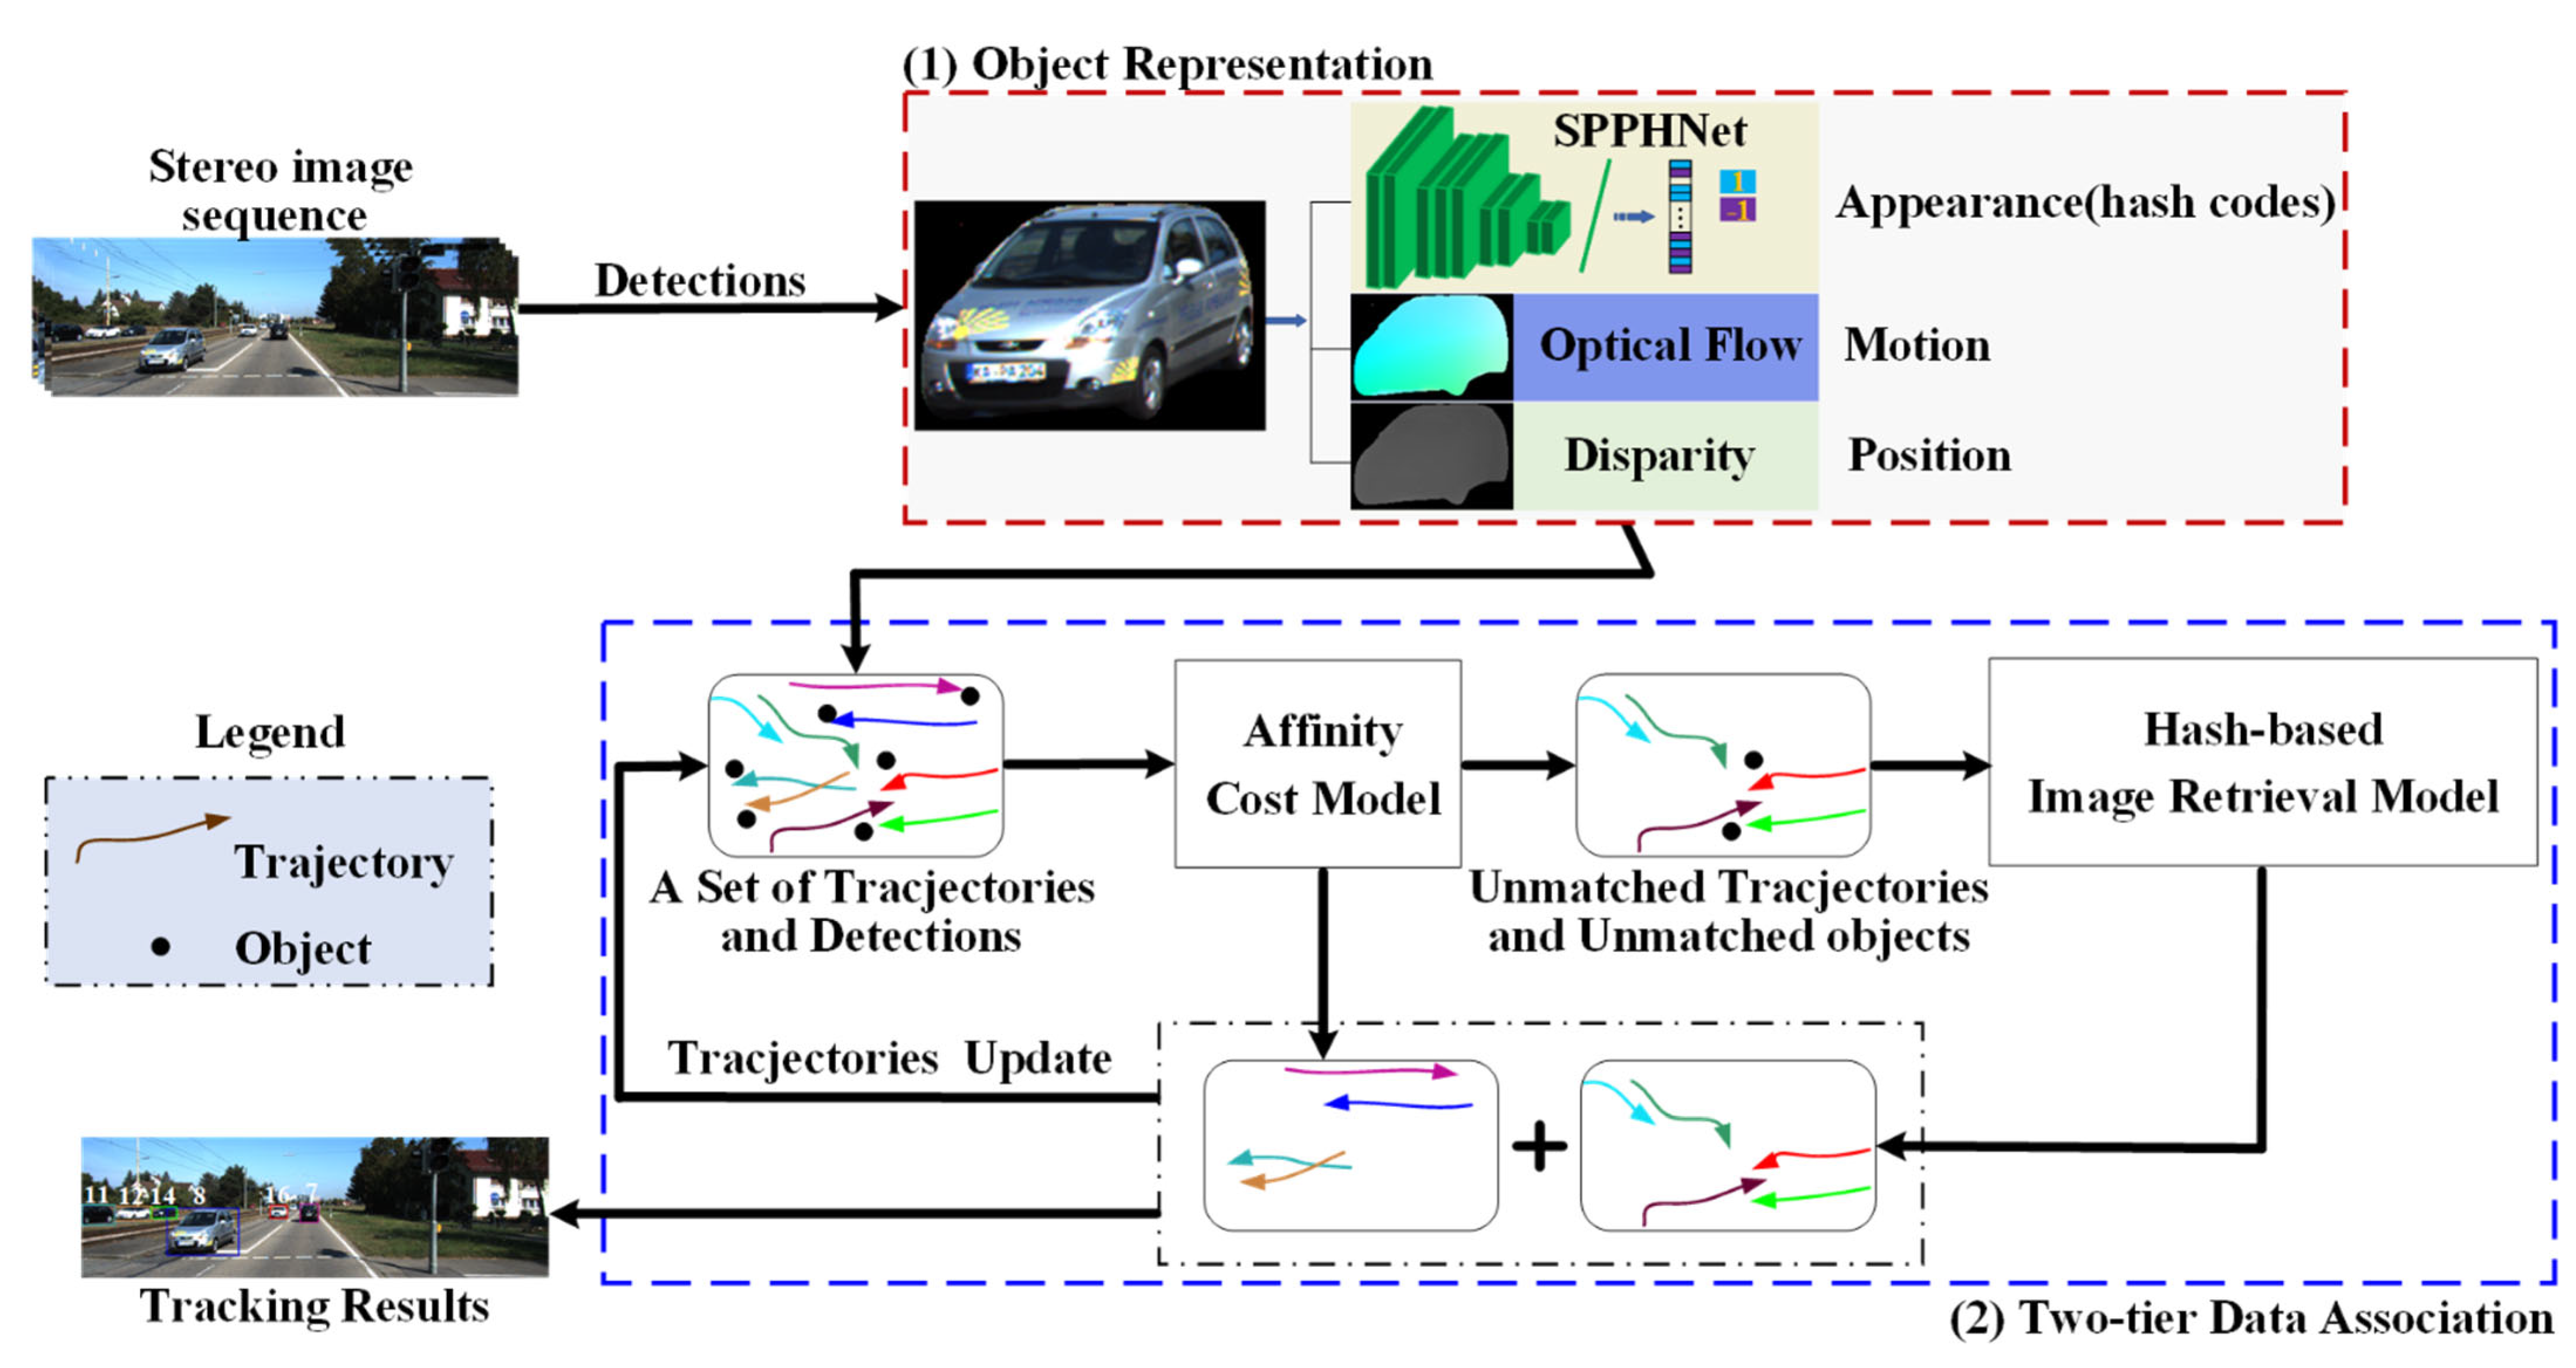
  • A spatial pyramidal pooling hash network is designed to generate appearance features. Multiple-level representative features in the SPPHNet are mapped into a similarity-preserving binary space, called hash features. The hash features retain the visual discriminability of high-dimensional features and, at the same time, are of benefit to computational efficiency. The SPPHNet is capable of accommodating various sizes of bounding boxes, thus avoiding information loss caused by resizing;
  • We design a two-tier data association scheme consisting of an affinity cost model and a hash-based image retrieval model to address the occlusion issue. The affinity cost model accommodates hash features, disparity, and optical flow as the first tier of data association. The hash-based image retrieval model exploits the hash features and adopts the image retrieval technology of “querying image with image” to handle reappearing objects and reduce ID switches as the second tier of data association;
  • The ablation study has proven the effectiveness of various components. The experiments conducted on the public benchmark dataset and our own collected campus scenario sequences demonstrate that the proposed method surpasses state-of-the-art vision-based MOT methods.

2. Related Work

To be able to give a clear overview of MOT-related work, we divide the existing approaches into two categories: tracking by detection and joint detection and tracking, according to whether object detection and association are performed at the same time.

2.1. Tracking by Detection

The booming development of autonomous driving technology has made object detection in traffic scenes a highly researched topic. With their powerful feature extraction abilities, deep learning-based object detection techniques for traffic scenes have made breakthrough progress during the past several years [20,21,22]. Simon et al. [20] proposed a Complexer-YOLO model, a real-time 3D object detection and tracking model on semantic point clouds, in the context of autonomous driving. The model fuses state-of-the-art 3D detectors of neural networks with visual semantic segmentation. Cai et al. [21] solved the problem that monocular image target detection is quite difficult to recover position from in 3D space by decomposing the detection problem into a structured polygon prediction task and a depth recovery task. Cai et al. [22] proposed an efficient YOLOv4-based single-stage object detection framework, YOLOv4-5D. The backbone network in the proposed framework is CSPDarknet53_dcn(P), whose last layer output is replaced with deformable convolution to improve detection accuracy. In addition, YOLOv4-5D uses the feature fusion module PAN++ and a five-scale detection layer to improve the detection accuracy of small objects.
Owing to the significant progress of object detection technologies, tracking by detection becomes the mainstream MOT paradigm. The pipeline of the tracking-by-detection method consists of three stages including object detection, feature extraction, and data association. Object detection is used to locate objects of interest in continuous frames; feature extraction is used to extract features of the detected objects, while data association is used for associating corresponding objects according to feature affinities, i.e., linking objects to trajectories. Li et al. [5] used YOLO2 to detect the object bounding boxes and employed the object-level segmentation method to obtain object ontology, extracted the color, distance features, and overlapping score to construct the affinity, and adopted the Hungarian algorithm [23] to obtain the object trajectory. Karunasekera et al. [6] applied a Recurrent Rolling Convolution (RRC) network to detect the object bounding boxes and extracted a Linear Binary Pattern Histogram (LBPH) as object appearance features by gridding within the bounding box. A dissimilarity measure was defined based on object motion, appearance, structure, and size. The Hungarian algorithm was employed in solving the tracking identity assignment. Tian et al. [7] strictly used publicly available detections recommended by benchmarks. The HSV space color histogram was extracted to form the appearance descriptor, and data association was accomplished by putting together information from both enlarged structural and temporal domains. Sun et al. [8] first fixed the detection results provided by the dataset. The appearance features were extracted by a CNN network and the similarity between detection and trajectory was calculated using the proposed global and partial feature-matching methods. Afterwards, the cosine distance between the two bounding boxes was utilized as the cost to obtain the cost matrix and the Hungarian algorithm was applied to associate the trajectories and detections. Based on the YOLO-v4 detection, Lin et al. [9] used DeepSort’s extraction network to extract object appearance features. A hybrid track association method was proposed, which effectively utilizes an incremental Gaussian mixture model to model the historical appearance distances of the track and integrates the derived statistical information into the calculation of track association cost. Gonzalez et al. [10] developed a smart multiple affinity metric tracking (SMAT) for MOT. A Faster R-CNN was utilized for object detection; a Multiple Granularity Network was applied to extract the object appearance features. The cost matrix combined three affinity metrics that evaluate the position, appearance, and motion of the objects, and was solved by the Hungarian algorithm. EagerMOT [11] employed Point-GNN and RRC to acquire 3D and 2D detections of the objects, respectively. The 3D location and dimensions of the bounding box and the 2D interaction of union (IoU) were integrated into a simple tracking formulation. During the greedy association method, all possible match pairs were sorted by their tracking formulation values in descending order. In MOTSFusion [12], RRC and Track R-CNN were applied for object detection. A closed-loop method that first used tracking to reconstruct, and then used the reconstruction to track, was presented. The method first built up short tracklets using 2D optical flow and then fused these into dynamic 3D object reconstructions, which enabled a reduction in the number of ID switches and the recovery of missing detections. LGM [13] adopted CenterNet to detect objects. Two sub-networks, box and tracklet embedding, were designed to model both local and global motion cues, without object appearance features. The embedded boxes were associated with the trajectories by exploiting a bottom-up greedy method.

2.2. Joint Detection and Tracking

The joint detection and tracking method mixes detection and tracking together and conducts them simultaneously, also referred to as the end-to-end method. CenterTrack [24] was an end-to-end simultaneous object detection and tracking framework. It produced detection and tracking offsets for the current frame by performing detection on an image pair and combining the object detections from previous frames to estimate the object motion for the current frame. The tracker used the greedy method on objects through time. PermaTrack [25] is an end-to-end trainable joint detection and tracking method built on top of the CenterTrack architecture. Compared with CenterTrack, PermaTrack added a spatio-temporal, recurrent memory module that exploited all previous history to reason about object locations and identities in the current frame. Chaabane et al. [26] proposed an efficient joint detection and tracking model named DEFT. DEFT relied on an appearance-based object matching network jointly learned with an underlying object detection network, with the addition of a long short-term memory to capture motion constraints. Sun et al. [27] performed online tracking by associating the objects detected in the current frame with those in multiple previous frames. The proposed Deep Affinity Network modeled features of pre-detected objects in the consecutive frames at multiple levels of abstraction, and inferred object affinities across different frames by analyzing exhaustive permutations of the extracted features. TraDeS [28] focused on exploiting tracking cues to help detection and, in return, benefit tracking, and mainly employed two modules, Cost Volume-based Association (CVA) and Motion-guided Feature Warper (MFW), to accomplish online joint detection and tracking. The CVA was adopted to learn re-ID embeddings and derive object motions, while the MFW was applied to track cues from the CVA to propagate previous object features to enhance current detection or segmentation.

3. Method

Figure 1 gives an overview regarding the framework of our proposed MOT method. The method includes two stages: (1) object representation, (2) two-tier data association.
In the first stage, our previous work [14] is adopted to remove the background from each detection result of the object detector to obtain an accurate object ontology. Using the object ontology as input, we apply the hash features generated by the spatial pyramid pooling hash network as the object appearance features, and in turn, we employ appearance features, position cues (disparity), and motion cues (optical flow) to characterize the object.
In the second stage, we design a two-tier data association scheme. In the first tier of data association, we compose an affinity cost model containing appearance, motion, and location cues to generate matching pairs by solving the model. For the unmatched objects and unmatched trajectories, we use a hash-based image retrieval model to exploit the image retrieval of “querying image with image” as the second tier of association. The model employs the hash features to retrieve coarse matching pairs of objects in historical trajectories, combines appearance features and motion cues to refine the coarse matching pairs, and accordingly generates the object IDs.

3.1. Object Representation

We use appearance features, position cue, and motion cue to represent an object. For position cue and motion cue, they can be obtained from the disparity and optical flow of the object. We design a spatial pyramid pooling hash network (SPPHNet) to extract the appearance features of the object.

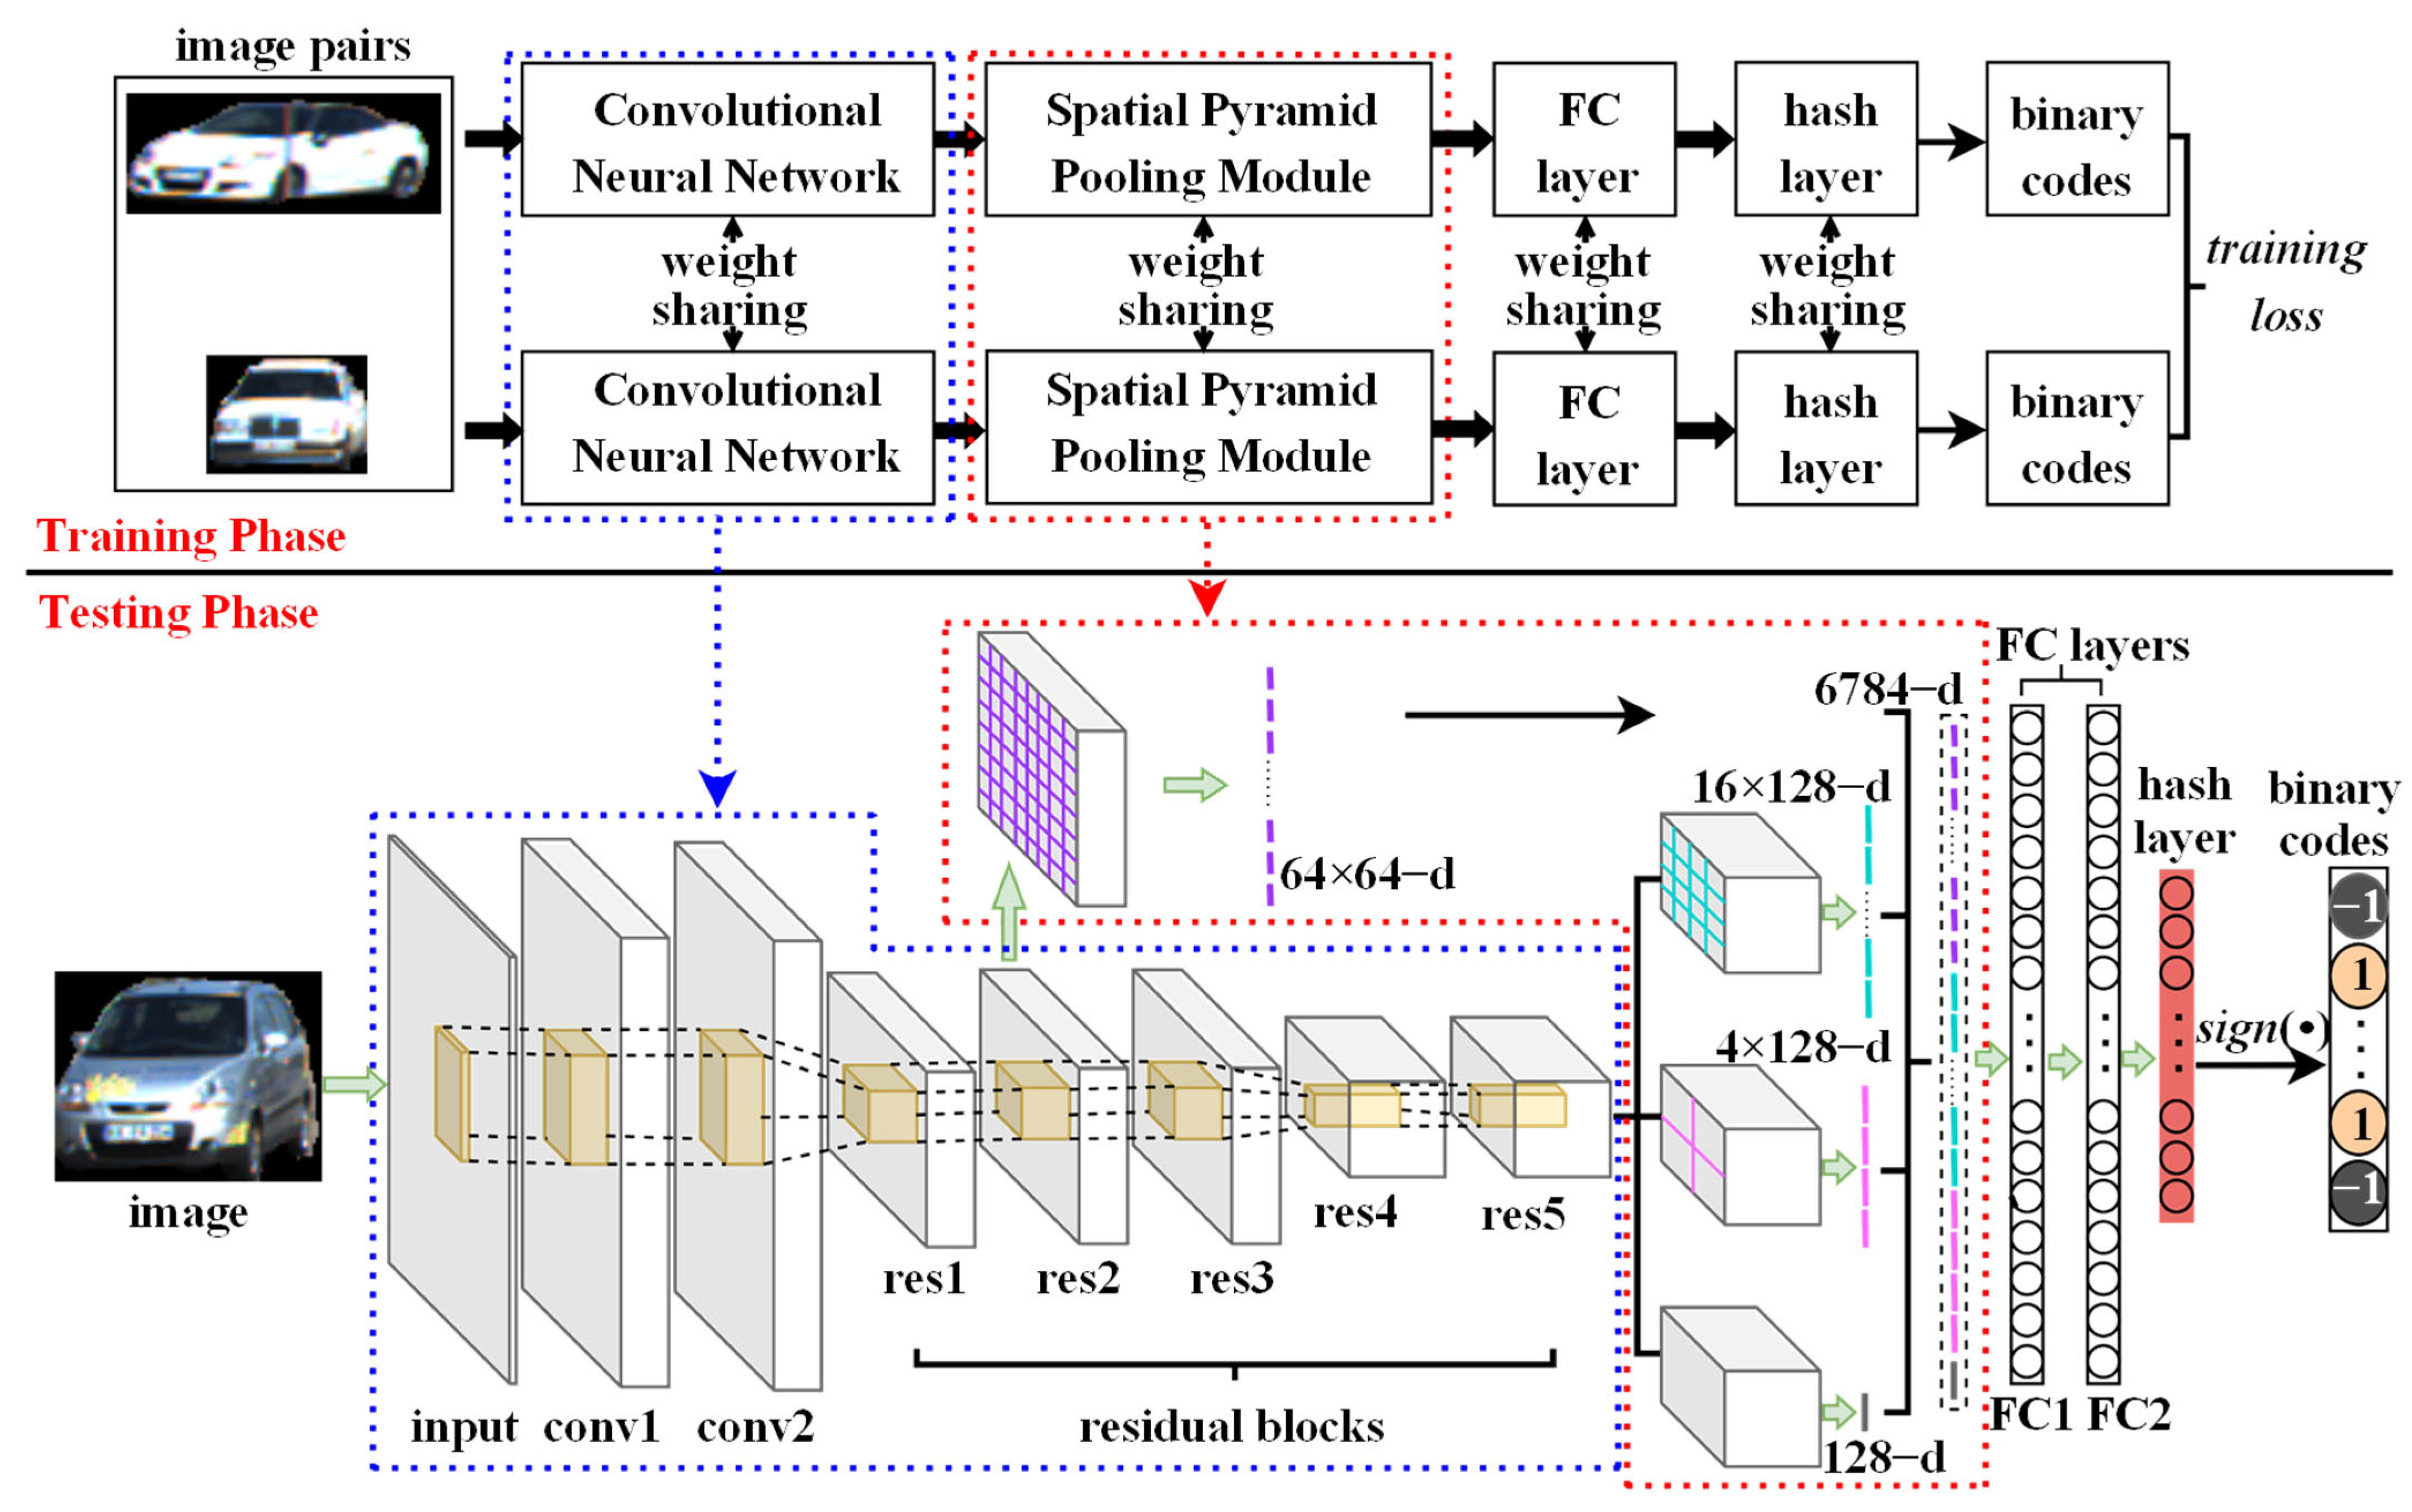
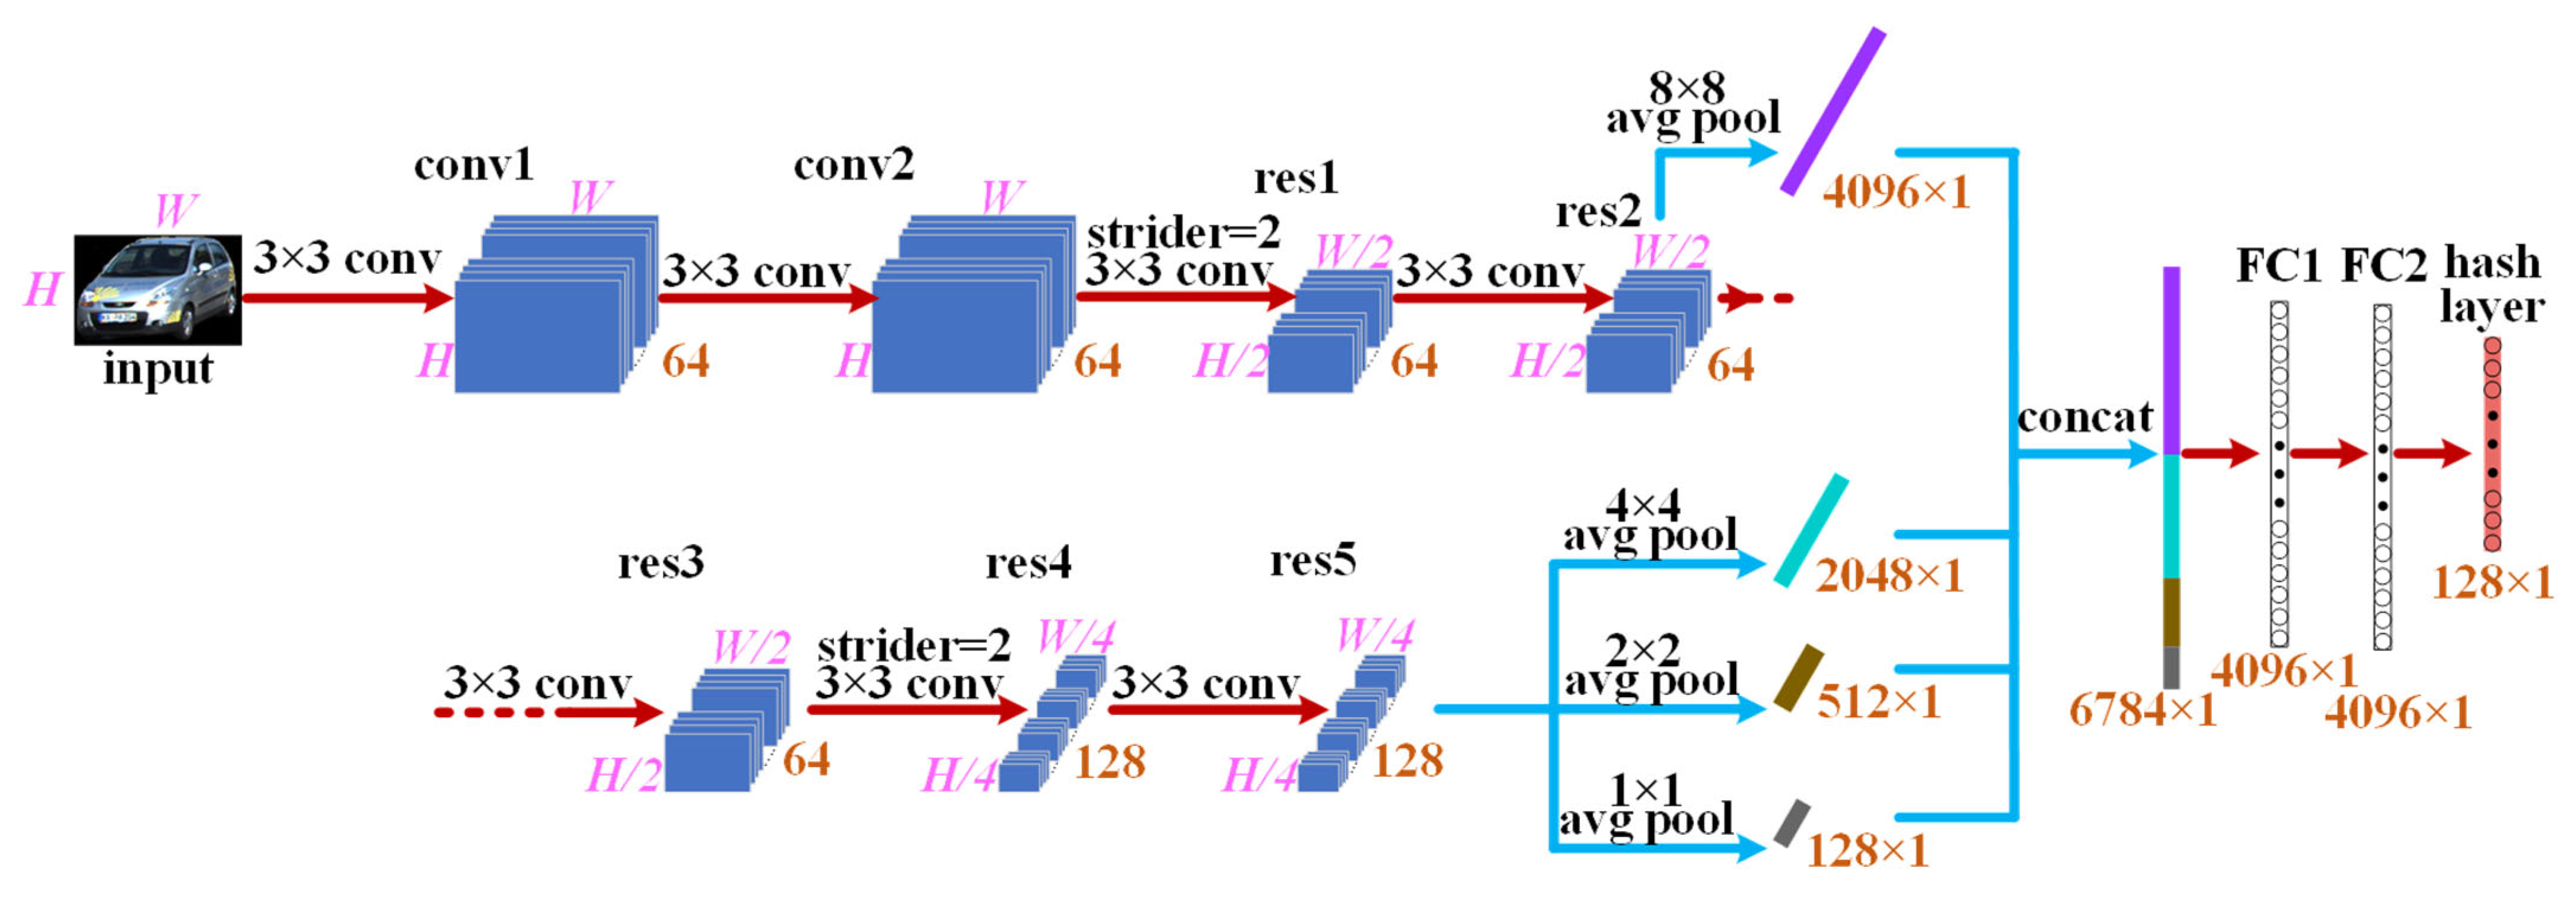
3.1.1. Architecture of Spatial Pyramid Pooling Hash Network for Appearance Feature Extraction

The appearance affinity metric is the core feature of objects. The extracted features must have discriminability, with a larger affinity between the same objects and a lower affinity between different objects. We design a spatial pyramid pooling hash network (as shown in Figure 2) for this purpose. The network maps the multiple levels of abstraction into a similarity-preserving low-dimensional binary (Hamming) space, and then generates the compact binary codes (hash features) that incorporate both shallow and deep representative features. The hash features possess a significant discriminability.
Given an image dataset χ consisting of segmentation results of variable size, and a set of training images, D T   =   { d i } i = 1 N χ , along with object identities, let s i j be the pairwise similarity label of image pairs d i and d j ( d i ,   d j D T ,   i ,   j = 1 ,   2 ,     ,   N ). s i j = 1 means that d i and d j are similar (the same object identities), while s i j = 0 means that d i and d j are dissimilar (not the same object identities). Our proposed SPPHNet aims to use deep neural networks to learn a nonlinear hash function F :   d b { 1 ,   1 } M that encodes each d into a compact set of M-bit (in this work, M = 128) hash codes such that the similarity relations in S = { s i j } are maintained in the binary hash codes.
As shown in the blue dashed box in Figure 2, the CNN consists of two convolutional layers and five residual blocks. The size of the convolutional kernels utilized in the convolutional layers and residual blocks is 3 × 3, and changing the feature map size is performed by setting the stride to 2. To remove the fixed input image size constraint of previous deep hash networks, we add a spatial pyramid pooling (SPP) module [29] between the fully connected FC1 layer and the res5 layer, as shown in the red dotted box in Figure 2. The SPP module unfolds the feature maps at the res2 and res5 layers into fixed-length features and feeds them into the FC1 layer. We adopt a fully-connected hash layer of M hidden units together with a hyperbolic tangent (tanh) function to transform the feature representation of the FC2 layer of each image d i into M-dimensional continuous code κ i within [−1, 1]. Finally, we obtain binary hash codes by b i = sgn( κ i ) where sgn( κ i ) is the sign function on vectors that, for l = 1, 2, …, M, sgn( κ i l ) = 1 if κ i l   > 0, otherwise, sgn( κ i l ) = −1.
To further guarantee the quality of hash codes, we exploit a training loss function consisting of cross-entropy loss and quantization loss. The cross-entropy loss preserves s i j of the training image pairs { ( d i ,   d j ,   s i j ) :   s i j S } , and the quantization loss controls the quantization error. The detailed parameter settings of the network are shown in Figure 3. In Figure 3, the input is a color image of dimension H × W × 3; 3 × 3 conv indicates the convolution kernel size; in the convolution layers and residual blocks, orange numbers such as 64,128 indicate the number of feature map channels; 8 × 8, 4 × 4, 2 × 2, and 1 × 1 denote the pyramid pooling sizes.

3.1.2. Spatial Pyramid Pooling Hash Network Learning

During learning of the parameters of the SPPHNet, the network accepts pairwise input images { ( d i ,   d j ,   s i j ) :   s i j S } . Training SPPHNet is achieved by jointly learning pairwise image similarity labels (0 or 1) and binary encoding.
(1)
Cross-Entropy Loss
One of the SPPHNet’s goals is to keep the similarity of the pairwise images consistent in high-dimensional space with Hamming space. In Hamming space, a larger Hamming distance d i s t ( b i ,   b j ) indicates that the image pair d i and d j should be categorized as different objects (dissimilar, labeled different identities); a smaller Hamming distance d i s t ( b i ,   b j ) indicates that the image pair d i and d j should be categorized as the same object (similar, labeled same identities). Since the similarity label s i j can only be 1 or 0, we can treat this goal similarly as a binary classification problem and the cross-entropy loss function, L c r o s s , is formulated as
L c r o s s = s i j S ω i j ( s i j l o g p i j   +   ( 1 s i j ) l o g ( 1 p i j ) ) = s i j S ω i j ( s i j l o g 1 p i j   +   ( 1 s i j ) l o g 1 1 p i j )
where p i j denotes the similarity between hash codes b i and b j . ω i j is the weight for each training pair ( d i ,   d j ,   s i j ) to alleviate the imbalance of the data. Inspired by [30], we amplify the weights of similar pairs in each batch by:
ω i j = { | S | / | S 0 | ,   s i j = 0 | S | / | S 1 | ,   s i j = 1
where S 0   =   { s i j S :   s i j = 0 } is the set of dissimilar pairs, and S 1 = { s i j S :   s i j = 1 } is the set of similar pairs. | · | denotes the total number of image pairs within the corresponding sets S , S 0 , and S 1 .
For p i j , we utilize the probability function presented in [31], which is expressed as
p i j = { 1 1 + m a x ( 0 ,   d i s t ( b i ,   b j ) - T H ) ,   s i j = 1 1 1 + m a x ( d i s t ( b i ,   b j ) ,   T H ) ,   s i j = 0
where T H is the threshold pre-specified in Hamming space. For a pair of binary hash codes b i and b j , we employ the relationship between the Hamming distance and their cosine distance to compute the d i s t ( b i ,   b j ) :
d i s t ( b i ,   b j ) = M 2 ( 1 c o s ( b i ,   b j ) )
Specifically, we substitute Equation (3) into Equation (1), then the cross-entropy loss function, L c r o s s , can be derived as
L c r o s s = s i j S ω i j s i j l o g ( 1 + m a x ( 0 ,   d i s t ( b i ,   b j ) T H ) ) + s i j S ω i j ( 1 s i j ) l o g ( 1   +   1 m a x ( d i s t ( b i ,   b j ) ,   T H ) )
(2)
Quantization Loss
Obtaining the binary codes for each image is the ultimate goal of the SPPHNet. The network creates quantization error while we use the sign function to convert the continuous representation into binary codes. Therefore, we apply the quantization loss function to control the quantization error. The quantization loss function, L q u a , is formulated as
L q u a = i = 1 N κ i sgn ( κ i ) 2 2
(3)
Overall Loss
Combining the cross-entropy loss Equation (5) and the quantization loss Equation (6), the overall loss function, L l o s s , for the SPPHNet can be formulated as
m i n Θ   L l o s s   =   L c r o s s   +   α L q u a
where Θ is the set of network parameters, and   α is the weighting parameter to trade off L c r o s s and L q u a .

3.2. Two-Tier Data Association

The two-tier data association consists of two models including an affinity cost model and a hash-based image retrieval model.

3.2.1. The First-Tier Data Association: Affinity Cost Model

The affinity cost model accommodates hash features extracted by the SPPHNet, disparity, and optical flow as the first tier of data association. Assume that, at frames t Δ t to t 1 , there is a set of existing object trajectories T t Δ t   :   t 1 c . We describe the k 1 th object at frame t by a state vector o t k 1 = ( b t k 1 ,   m o t k 1 ,   p o s t k 1 ) , where b t k 1 represents the appearance feature, m o t k 1 denotes the motion information, and p o s t k 1 is the position information, respectively. Assume the set of the object states at frame t as O t   ( o t k 1 O t ) with k 1 = 1, 2, 3,…, K 1 , and the set of the object states at frame t 1 as O t 1   ( o t 1 k 2 O t 1 ) with k 2 = 1, 2, 3,…, K 2 . K 1 and K 2 are the number of objects at frames t and t 1 , respectively. The affinity metrics used in our affinity cost model are described as follows:
(1)
Appearance Affinity Metric
The object appearance features are represented by a set of hash codes that are extracted using the proposed SPPHNet. For o t k 1 and o t 1 k 2 , we define the appearance affinity Λ k 1 , k 2 a p p as
Λ k 1 , k 2 a p p = 1 D _ H ( b t k 1 ,   b t 1 k 2 ) M
where b t k 1   and   b t 1 k 2 denote the hash codes of objects o t k 1 and o t 1 k 2 , respectively; D _ H ( b t k 1 ,   b t 1 k 2 ) represents the Hamming distance between o t k 1 and o t 1 k 2 . The smaller the Hamming distance between two objects, the more likely it is that the two objects are the same, and the greater the Λ k 1 , k 2 a p p . Conversely, the more likely it is that the objects are different, the smaller the Λ k 1 , k 2 a p p .
(2)
Motion affinity metric
In traffic scenes, the object is always in motion (stationary can be seen as a special case of motion) and its motion information is one of the important characteristics of the object. We evaluate the motion of an object based on its optical flow information, so the motion affinity metric Λ k 1 , k 2 m o of o t k 1 and o t 1 k 2 can be obtained by calculating the cosine distance between the two motions with the following:
Λ k 1 , k 2 mo = mo t k 1 mo t 1 k 2 mo t k 1 2 mo t 1 k 2 2
where mo t k 1 and mo t 1 k 2 are the mean optical flow information of objects o t k 1 and o t 1 k 2 , respectively.
(3)
Position affinity metric
It is calculated as
Λ k 1 , k 2 pos = { e - D _ E ( pos t k 1 ,   pos t 1 k 2 ) , D _ E ( pos t k 1 ,   pos t 1 k 2 ) < U 0.0001 , D _ E ( pos t k 1 ,   pos t 1 k 2 ) U
where pos t k 1 and pos t 1 k 2 represent the mean position information of objects o t k 1 and o t 1 k 2 on the X-Z plane, respectively; D _ E ( pos t k 1 ,   pos t 1 k 2 ) is the linear distance (i.e., the Euclidean distance) on the X-Z plane between o t k 1 and o t 1 k 2 ; U is the position threshold, and objects with position greater than this threshold can usually be considered as objects unrelated to each other, so the affinity is assigned a value close to zero; when the position is less than the threshold, the similarity can be calculated according to Equation (10).
Based on the above, the affinity metrics are calculated and collected in a cost matrix that represents the likelihood of all possible matches. This cost matrix is our affinity cost model Λ , which can be described as
Λ = [ Λ k 1 , k 2 ] K 1 × K 2
where Λ k 1 , k 2 indicates the affinity between objects o t k 1 and o t 1 k 2 , which can be
Λ k 1 , k 2 = Λ k 1 , k 2 a p p   ×   Λ k 1 , k 2 m o   ×   Λ k 1 , k 2 p o s
Once the affinity cost model Λ is established, we determine the optimal association matching pairs representing the same object responses using the Hungarian algorithm [18] by maximum cost assignment. When the association cost of an optimal association matching pair is greater than a pre-defined threshold θ 1 , this pair is considered to be a correct match and a valid trace. The effective tracking trajectory obtained after the affinity cost model is denoted as T * , and the corresponding set of objects at frame t is O t * . In general, the trajectory within T * should be the one that can correctly track the continuously detected objects within T t Δ t   :   t 1 c , including objects without occlusion and partially occluded but detectable objects. This is because, for the continuously detected objects, their trajectories are continuously updated with association matching, so the affinity metrics are all high; thus, correct association results can generally be obtained. However, for severely occluded undetectable objects (including completely occluded objects), there are no detection responses when they are occluded, and when these objects reappear, the affinities between the objects and their trajectories are low, resulting in object tracking failure. To solve the tracking problem of severely occluded undetectable objects, we propose a hash-based image retrieval data association model.

3.2.2. The Second-Tier Data Association: Hash-Based Image Retrieval Model

By leveraging the image retrieval of “querying image with image”, the hash-based image retrieval model employs the hash features to retrieve coarse matching pairs of reappearing objects in the historical trajectories, and fuses the appearance features with the motion cue to refine the coarse matching pairs. After the affinity cost data association model, the hash-based image retrieval model is performed for the unmatched objects O t ( O t *     O t = ,   O t *     O t = O t ,   o t k 1 O t ,   k 1 = 1 ,   2 ,   3 ,   , K 1 ,   K 1 is the total number of objects within O t ) and unmatched trajectories T c ( T *     T c = ,   T *     T c = T t Δ t   :   t 1 c ,   c _ c o u n t is the total number of trajectories within T c ). Usually, these unmatched objects contain objects that reappeared due to occlusion and newly generated objects. Therefore, the main role of the hash-based image retrieval model is to associate the reappearing objects with their broken trajectories.
For the reappearing objects, the change in their appearance features generated within t Δ t to t is small. As can be seen from Section 3.1, each detected object is extracted with a set of hash codes as its appearance features using the proposed SPPHNet. Thus, we use all objects contained in the unmatched trajectories T c as a feature pool and perform image retrieval and data association within the feature pool using the hash codes of object o t k 1 , as described below.
Firstly, we calculate the Hamming distance between each object in the feature pool and the object o t k 1 to be matched using the hash codes and sort from smallest to largest, and take the top N objects after sorting as the possible candidate objects for o t k 1 . The set of trajectories corresponding to these candidate objects is T c , and c _ n u m is the total number of trajectories in T c .
Secondly, for each trajectory in T c , find the m nearest objects to the current frame and calculate their affinity with o t k 1 as follows:
Λ r , k 1 = Λ r , k 1 a p p × Λ r , k 1 m o ,   r = 1 ,   2 ,   3 , ,   m
In calculating the affinity, we do not use the affinity metrics of appearance, motion, and position simultaneously as in Equation (12), but apply only appearance and motion. This is due to the fact that, for the reappearing objects, the position may change considerably from t - Δ t to t , but the changes produced in the appearance and motion direction are relatively small.
Thirdly, we compute the affinity Λ n u m , k 1 of each trajectory in T c to the object o t k 1 as follows:
Λ n u m , k 1 = r = 1 m λ r Λ r , k 1 ,   r = 1 m λ r = 1
where n u m = 1 ,   2 ,   3 ,   ,   c _ n u m , and λ r is the weight. Thus, the affinity Λ between T c and object o t k 1 can be obtained as Λ = [ Λ n u m , k 1 ] c   n u m × 1 .
Finally, the maximum value in Λ is found, and if this value is greater than the pre-defined threshold θ 2 , we consider that the trajectory corresponding to object o t k 1 and this maximum value is successfully matched and correctly tracked.
In summary, the implementation flow for our proposed two-tier data association approach is illustrated in Algorithm 1.
Algorithm 1: Implementation flow for our proposed two-tier data association approach
Input: The set of objects of frame t   O t ( o t k 1 O t ) k 1 = 1 ,   2 ,   3 ,   ,   K 1 ;
The set of objects of frame t 1   O t 1 ( o t 1 k 2 O t 1 )   k 2 = 1 ,   2 ,   3 ,   ,   K 2 ;
The set of existing object trajectories   T t Δ t   :   t 1 c from frame t Δ t to t 1 ;
Output: The set of object trajectories of frame t
1: if K 1 > 0 and K 2 > 0  then
2: Calculate Λ k 1 , k 2 between o t k 1 and o t 1 k 2 according to Equation (12);
3: Construct the affinity cost model Λ according to Equation (11);
4: Use the Hungarian algorithm to solve for Λ to obtain the optimal association matching pairs;
5: The affinity of each optimal association matching pair is greater than θ 1 , and update the corresponding trajectory;
6: For the unmatched objects O t ( o t k 1 O t , k 1 = 1 ,   2 ,   3 ,   ,   K 1 ) and unmatched trajectories   T c
7:  if K 1 > 0 and c _ count > 0 then
8:   for the object o t k 1  do
9:    Use the hash code to retrieve the N objects in T c with the smallest Hamming distance and their corresponding trajectories T c ;
10:   For each trajectory in T c , find the m closest objects to the current frame and calculate the affinity with o t k 1 according to Equation (13);
11:   Calculate the affinity Λ n u m , k 1 of each trajectory in T c with o t k 1 according to Equation (14);
12:   Construct an affinity Λ between T c and o t k 1 ;
13:   if  m a x ( Λ ) > θ 2  then
14:     o t k 1 is matched with the trajectory corresponding to m a x ( Λ ) , and update the corresponding trajectory;
15:    end if
16:   end for
17:  else
18:   Generate new trajectories;
19:  end if
20:  Update the trajectories;
21: end if

4. Experiments

To evaluate the performance of our MOT method, we conducted experiments on the KITTI MOT dataset [32], a MOT benchmark platform for autonomous driving, and on the campus scenario sequences captured using the on-board Point Grey binocular camera of our experimental vehicle, respectively. We only evaluate the tracking performance on the car category. We used the KITTI MOT dataset for quantitative analysis of our MOT method, including comparison with state-of-the-art methods, while the KITTI MOT dataset and the actual campus scenario sequences were used for visually intuitive evaluation (i.e., qualitative analysis). The campus scenario sequences have a resolution of 640 × 480 pixels per image. The KITTI MOT dataset consists of 21 training sequences and 29 test sequences with a resolution of 1242 × 375 pixels per image. These image sequences contain environmental factors that can impact the tracking performance, such as varying degrees of illumination, different degrees of object occlusion, crowded multi-object interaction scenes, changes in object scale, and so on.

4.1. SPPHNet Training and Performance

4.1.1. SPPHNet Training

We implement SPPHNet based on the TensorFlow framework and train the network on a workstation consisting of a Nvidia GeForce GTX1080TI graphics processor with 11 GB video memory, an Intel Xeon Silver 4-core processor, and 16 GB Random Access Memory (RAM).
All network weights in the convolutional layers (including the convolutional layers in the residual blocks) are initialized as a normal distribution with a mean of 0 and a standard deviation of 1. In the fully connected layers and the hash layer, the weights are initialized in the same way as in the convolutional layers. The weights are updated using the mini-batch stochastic gradient descent (SGD) with 0.9 momentum. The gradients can be computed by back-propagation through the loss in Equation (7) and the two instances of pairwise input images { ( d i ,   d j ,   s i j ) :   s i j S } . The total gradient is the sum of the contributions from the two instances d i and d j . The learning rate is cross-validated from 10 5 to 10 2 with a multiplicative step size. The mini-batch size of images is set as 32 and the weight decay parameter is 5 × 10 5 . The weighting parameter α in Equation (7) is selected by cross-validation and the hyperparameter T H in Equation (3) is set as 2.

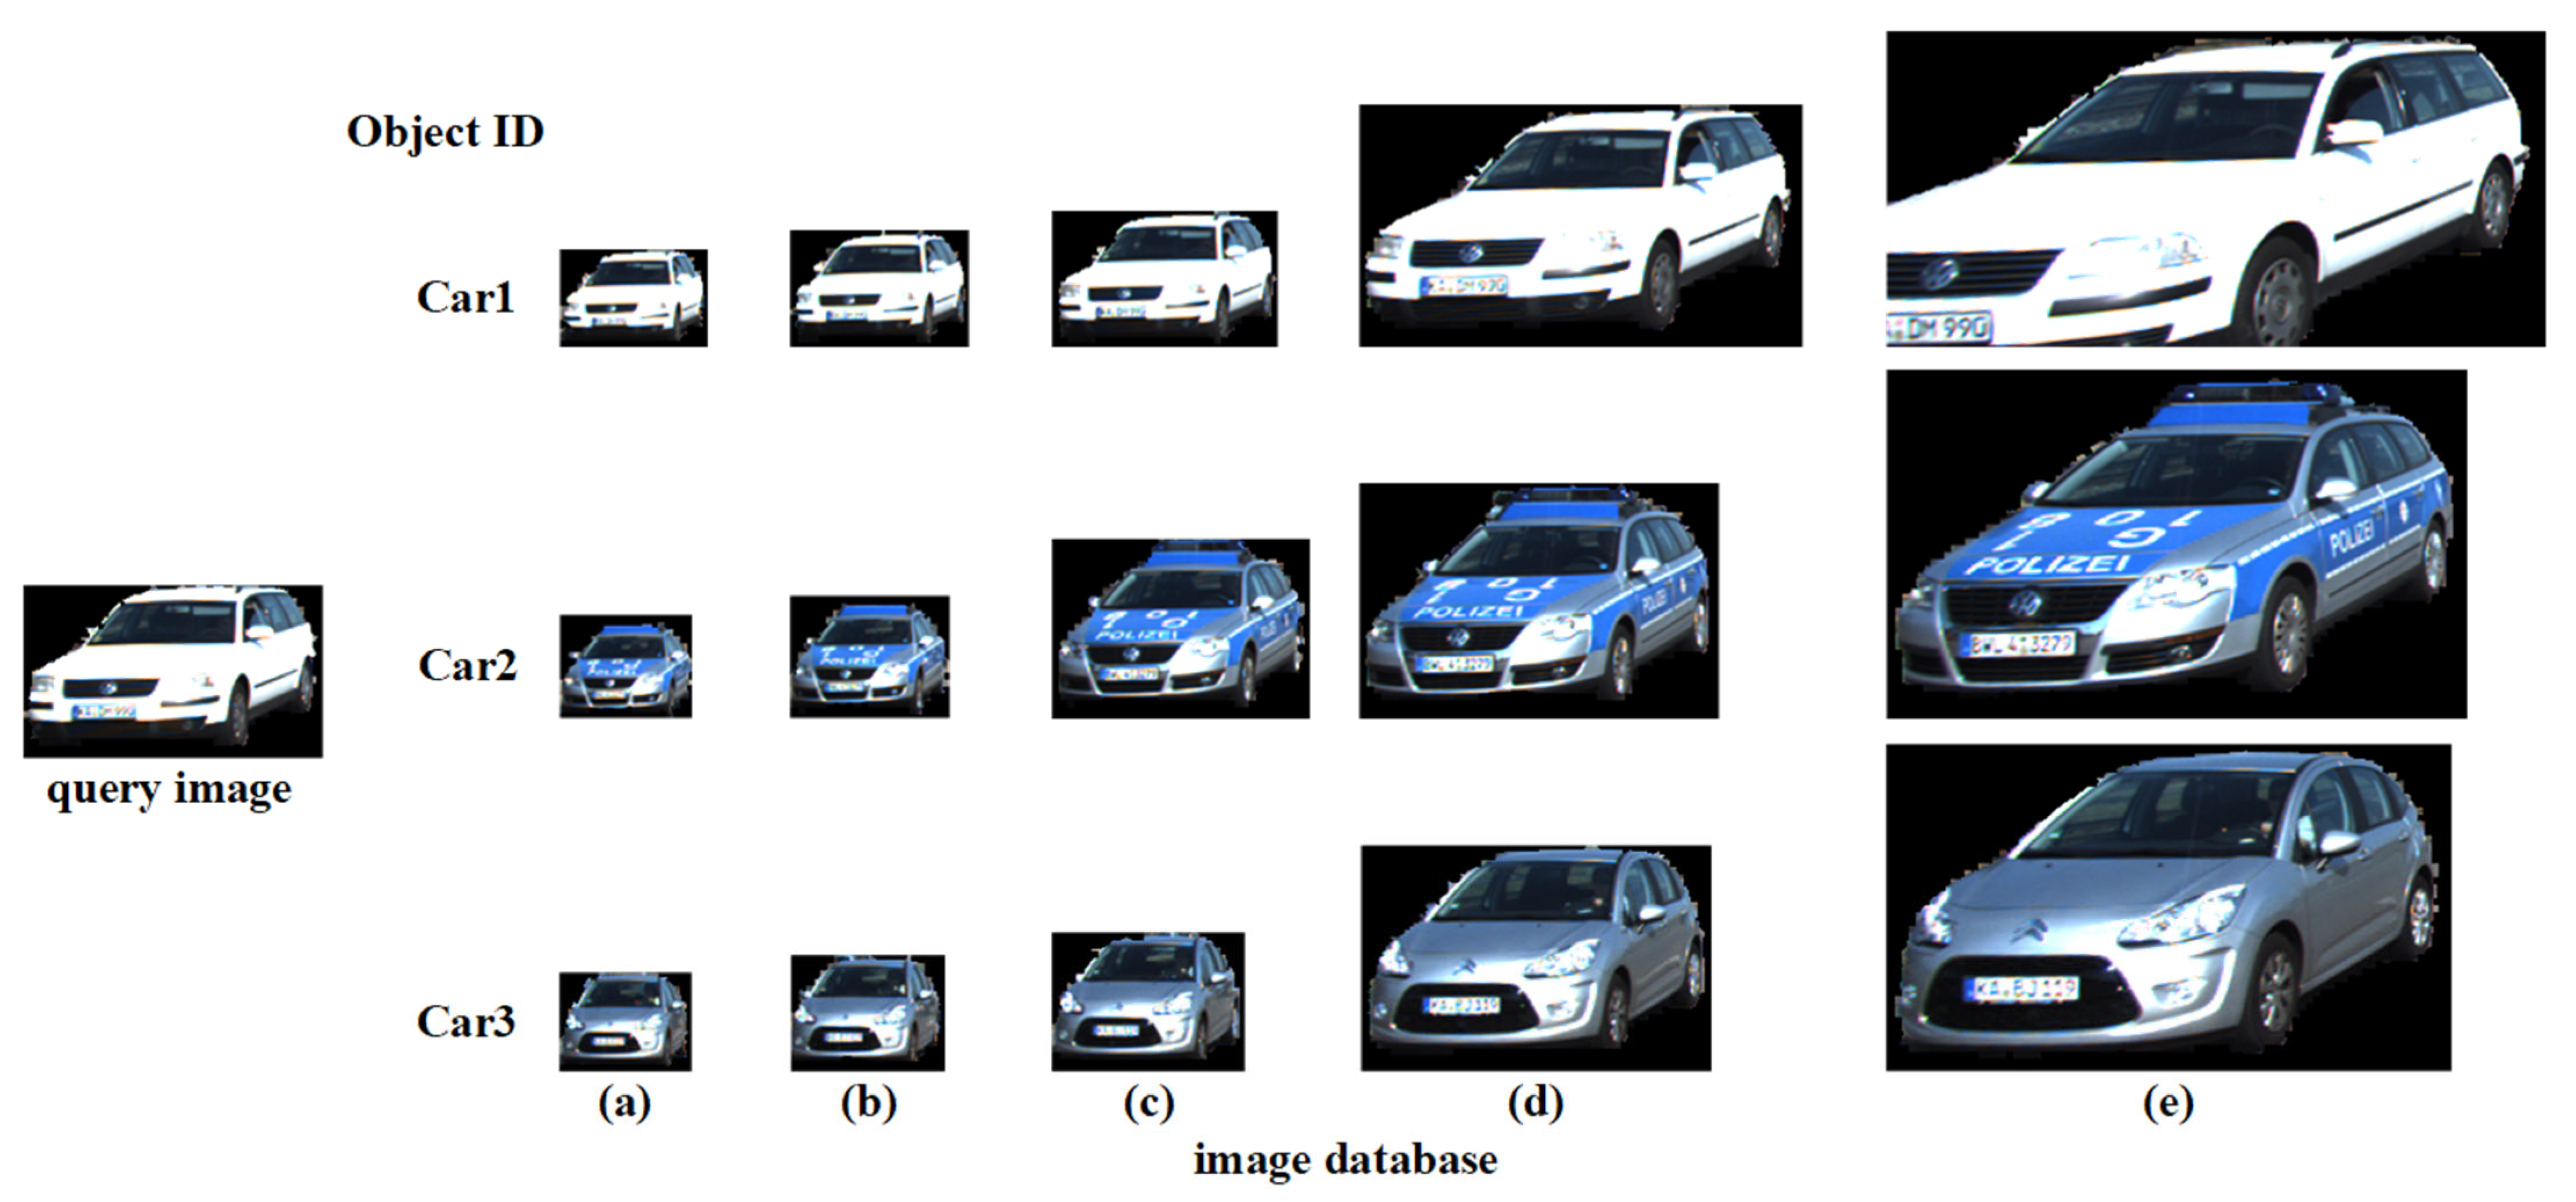
4.1.2. SPPHNet Performance

Deep neural networks such as ResNet50 [33] and VGG16 [34] are usually used in MOT algorithms to extract deep features of objects to improve the accuracy of data association. To demonstrate the performance of our proposed SPPHNet, we select a number of object images from the KITTI dataset that contain cars with the same ID (query image, Car1) and different IDs (Car2, Car3) as shown in Figure 4. We use ResNet50, VGG16, and SPPHNet to extract the features of the query image and the images in the image database, respectively, and then calculate the feature distances between the query images and the images in the image database. The comparison results of the feature distances of the three networks are shown in Table 1. When using ResNet50 and VGG16 to extract object features, the object image size should be cropped to 224 × 224 and then used as the input of the networks. Since there is a relationship between the Hamming distance of the hash codes and the cosine distance as in Equation (4), we use the cosine distance to measure the feature distance.
From Table 1, we can see that the feature distance gap of our proposed SPPHNet for different objects is larger than that of ResNet50 and VGG16. This also means that the SPPHNet can still maintain high discriminability of object appearance with mapping high-dimensional features to low-dimensional hash space, minimizing the feature distance of the same object and maximizing the feature distance of different objects. The proposed SPPHNet can make a better distinction of objects with different identities.

4.2. MOT Evaluation Metrics

We evaluate our method using the metrics defined in the literature [35,36,37] as follows:
Higher Order Tracking Accuracy (HOTA ): Fairly combines all the different aspects of the tracking assessment into a single metric. HOTA decomposes the detection and tracking aspects of MOT by separately measuring detection accuracy (DetA), which evaluates detection performance, and association accuracy (AssA), which evaluates data association. HOTA, DetA, and AssA are newly defined in [35] and are adopted as the main evaluation metrics for MOT in the KITTI MOT dataset.
Identity Switches (IDSw ): Number of times its corresponding object identity has changed for a given trajectory.
Multiple Object Tracking Accuracy (MOTA ) [36]: This metric integrates three error types: identity switches, false negatives, and false positives. The MOTA can be formulated as
M O T A = 1 t ( F P t + F N t + I D s t ) t G T t
where F P t , F N t , I D s t , and G T t are the number of false positives, of false negatives, of identity switches, and of ground truths, respectively, for frame t . The range of MOTA scores is ( ,   1 ] .
Mostly Tracked (MT ): For a certain object, when the track hypothesis is greater than 80% of the ground-truth trajectory, the object is considered to be mostly tracked. For a given image sequence, assuming that the number of ground-truth trajectories is M t r a c , the number of ground-truth objects on the m m th trajectory is n u m _ G T m m , and the number of detections generated by the MOT method to match the ground-truth objects is n u m _ T P m m ; the MT of the image sequence is calculated as
M T = m m = 1 M t r a c M T m m M t r a c
where
M T m m = { 1 , i f   n u m _ T P m m n u m _ G T m m > 80 % 0 , e l s e
Mostly Lost (ML ): For a certain object, when the track hypothesis is less than 20% of the ground-truth trajectory, the object is considered mostly lost. For a given image sequence, the ML is calculated as
M L = m m = 1 M t r a c M L m m M t r a c
where
M L m m = { 1 , i f   n u m _ T P m m n u m _ G T m m < 20 % 0 , e l s e
In the above metrics, indicates the larger, the better, while indicates the smaller, the better.

4.3. Ablation Study

In our proposed MOT method, appearance features extracted adopting the proposed SPPHNet, motion cues, and position cues are employed to represent the objects, and a two-tier data association approach is applied to match the detections and trajectories. In order to verify the role of each component (three types of features, two data association models), we have conducted an ablation study on different versions of the proposed method by splitting the 21 KITTI MOT training sequences into training/validation sets. The results are summarized in Table 2. In Table 2, app represents the appearance features, mo denotes the motion feature, pos represents the position feature. AC denotes the affinity cost model, and HIR denotes the hash-based image retrieval model.
The first row is the standard version of our method with all components employed. Comparing other rows with the first row can exhibit how each component contributes to the tracking performance.
The second–fourth rows are versions using different features. The second row is the version using motion and position features without using appearance features; the third row is the one using appearance and position features without using motion features, while the fourth row is the one using appearance and motion features without using position features. It has the largest drop (8.09% HOTA) in tracking performance when the appearance features are removed (the second row). The HOTA drops 6.22% when the motion feature is removed (the third row). The HOTA drops 5.13% when the position feature is removed (the fourth row). These results indicate that all three types of features contribute to the tracking results, while the appearance features play the most significant role. This result is in line with the actual situation, as a human mainly pays attention to appearance features (such as color, texture, shape, etc.) for tracking objects. On the other hand, the comparison also proved that the proposed SPPHNet is capable of integrating the hierarchical features of the objects at multiple levels of abstraction, and the binary hash codes generated by the SPPHNet are a good representative of objects’ appearance.
Comparing the fifth row with the first row shows the impact of the two proposed data association models on the performance. When only using the affinity cost model without using the hash-based image retrieval model (the fifth row), the HOTA decreases by 5.1%, and the IDSw increases by 12. This is because the affinity cost model only considers the affinity between the current frame and the previous frame and does not pay attention to the past trajectories of the reappearing objects. The hash-based image retrieval model uses the image retrieval of “querying image with image” to retrieve the information of the reappearing objects in the historical trajectories. It is effective to find the best match for the reappearing objects, thereby reducing ID switches. The comparison indicates that the hash-based image retrieval model is a good complement to the affinity cost model, and the two models work in cascade to ensure robust tracking.

4.4. Comparison with the State-of-the-Art Methods

4.4.1. Benchmark Evaluation

With the use of 29 testing sequences, we compare our method with eight state-of-the-art methods [6,7,10,12,13,24,25,26], among which [6,7,10,12,13] are tracking-by-detection-based methods and [24,25,26] utilize joint detection and tracking methods. Table 3 lists the comparison result. The data for eight state-of-the-art methods were from the KITTI MOT leaderboard. The numbers were accessed on 6 December 2021. It is worthy to note that all methods in Table 3 are only vision-based methods.
The first three rows in Table 3 are the joint detection and tracking-based methods, while the fourth–ninth rows are the tracking-by-detection-based methods. It can be seen that our method dominates all scores and performs best in the category of the tracking-by-detection-based methods.
Compared with the joint detection and tracking-based methods (The first three rows), our method has achieved the best performance in terms of AssA (80.38%) and IDSw (104). This is because our two-tier data association approach exhibits superior association performance with fewer changes in the object identity of the tracked trajectory and high reliability of the tracking results. This is mainly benefited from the excellent ability of our proposed SPPHNet to extract visually structured information, while the hash-based image retrieval model is able to match with historical trajectories for reappearing objects. Our method obtains a HOTA of 74.69%, which is only lower than the PermaTrack [25]. This is because PermaTrack applies a spatio-temporal, recurrent memory module to reason about the location of severely and completely occluded objects using the entire previous history, and not just the current observation. However, our method exploits an object detector that acts only on the current frame, and once an object becomes severely or completely occluded, the detector fails and the trajectory is corrupted. In terms of DetA, MOTA, MT, and ML, our method is not the best, mainly because these metrics are strongly influenced by the object detector detection results. DetA measures the detection performance of detectors. These methods use different object detectors, which result in performance differences. Although MOTA is also an evaluation metric that combines detection performance and association performance, it is greatly influenced by the performance of the input detector, and measures the detection performance of MOT methods significantly outweighing the association performance [35]. Similarly, the MT and ML values can be affected by the detection results. When an object is intermittently detected due to severe occlusion or complete occlusion, the two adjacent detections may differ by many frames. In spite of utilizing the image retrieval of “querying image with image” to process these reappearing objects and associate them with past trajectories, our algorithm cannot reconstruct their trajectories on the undetected frames, even though those trajectories are real. Therefore, as a result, the MT and ML values may be inferior to other methods. We show the qualitative comparison results between our method and PermaTrack [25] on the KITTI MOT testing sequence 0010 in Figure 5. As can be seen in Figure 5, for our method, a car (Obj. 5) with a red circle drawn on the figure is completely occluded by a grey car in frame 123 and then associated to the correct label in frame 274 after it reappears, while the PermaTrack [25] fails in the association (ID changes from 5 to 47). This demonstrates the effectiveness of our proposed SPPHNet and data association method.
As a standard for the KITTI MOT dataset, the detector runtime is not included in any MOT method when submitting test results to the server. Our MOT method runtime of 37 ms per frame took less than JCSTD [7], LGM [13], SMAT [10], and MOTSFusion [12], and more than MASS [6] in the tracking-by-detection-based methods. Since the KITTI MOT dataset is captured at 10 frames per second, our MOT method is capable of meeting the real-time requirements with the appropriate choice of detector.

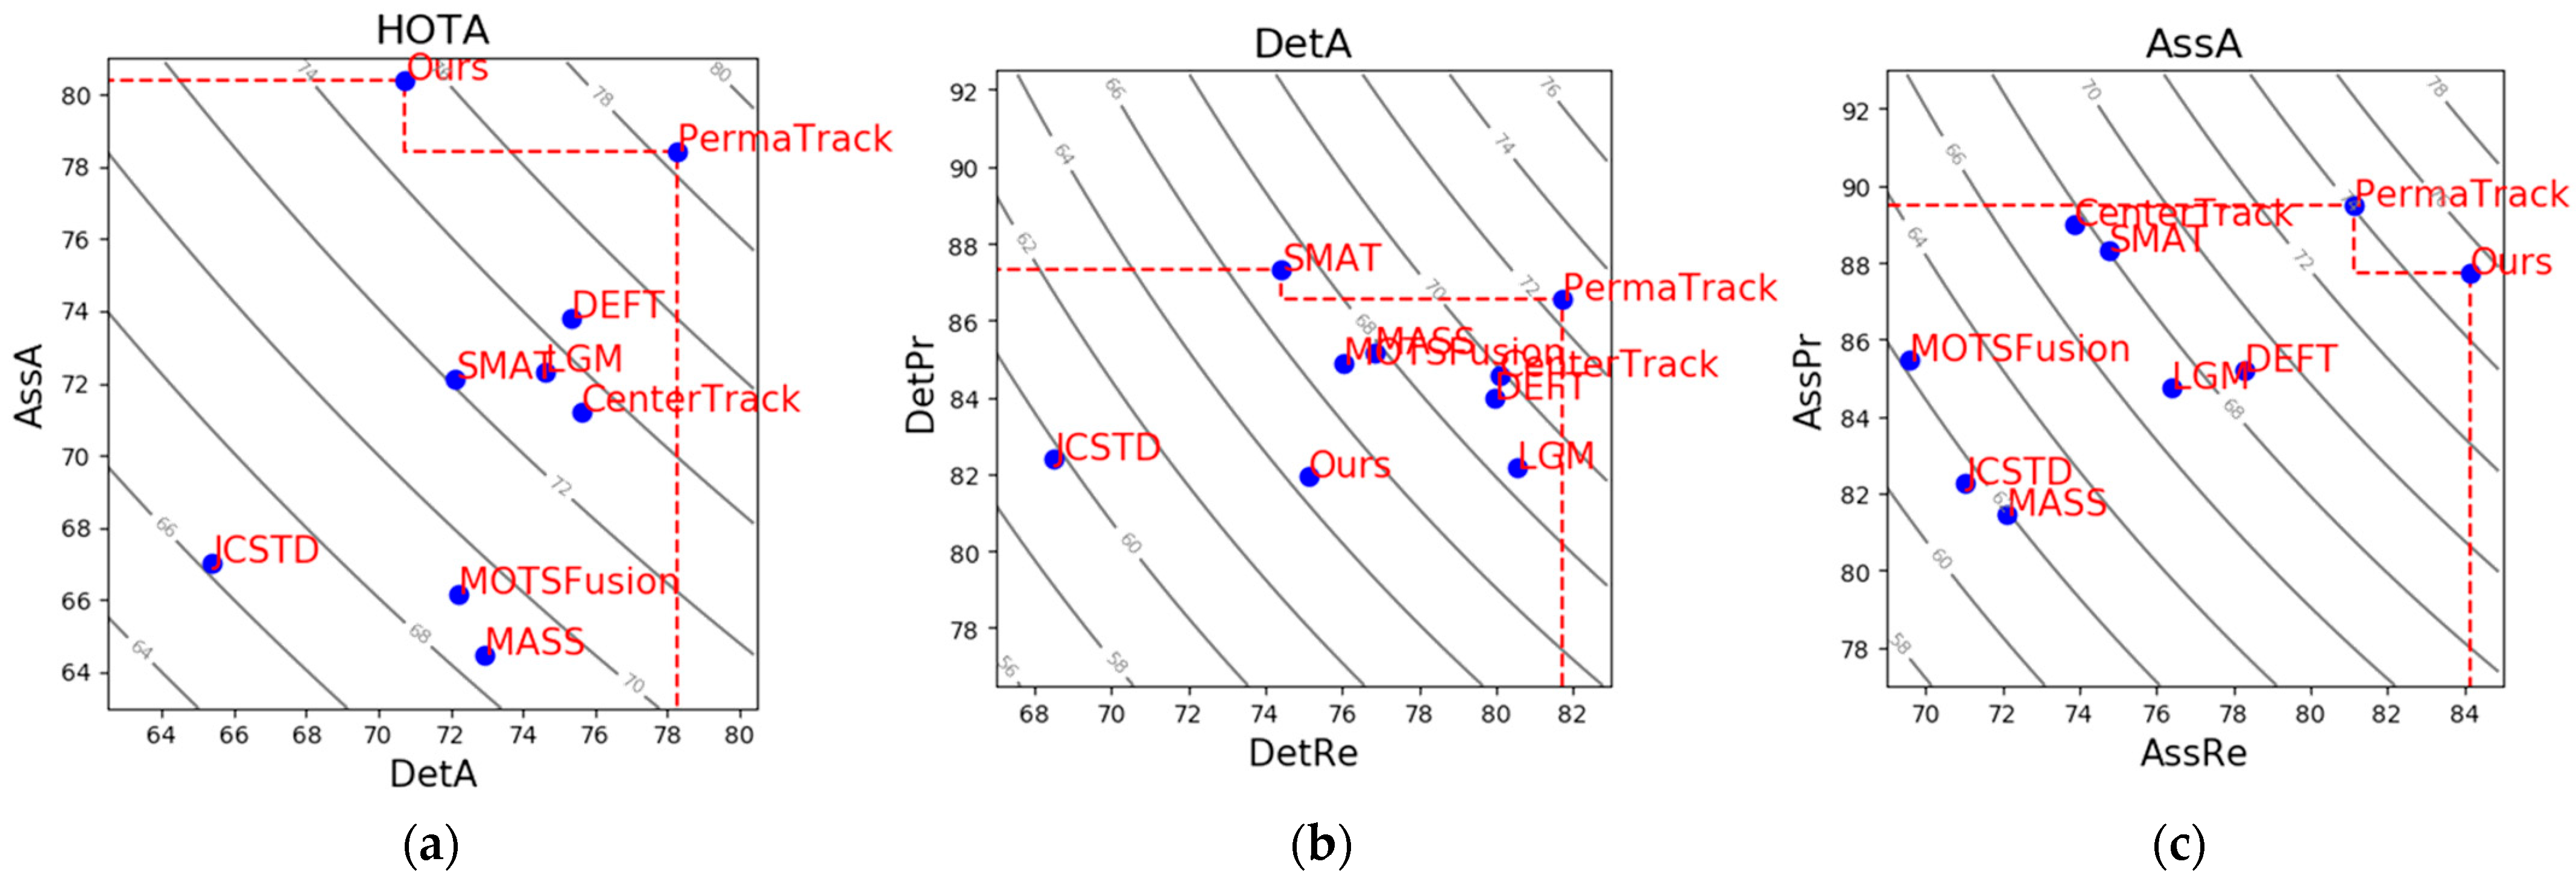
4.4.2. Benchmark Evaluation in Multiple Dimensions

As an integrated measure, HOTA can be decomposed into different types of tracking errors including false negatives, false positives, fragmentations, mergers, etc., and these errors reflect different aspects of tracking performance including the detection and association. Therefore, to further evaluate these methods, we performed a multidimensional analysis on our method and eight state-of-the-art methods in virtue of the HOTA sub-metric in [35] (as shown in Figure 6). The HOTA sub-metrics are DetA (consisting of detection recall and detection precision) and AssA (consisting of association recall and association precision). Detection recall (DetRe), detection precision (DetPr), association recall (AssRe), and association precision (AssPr) are equivalent to false negatives, false positives, fragmentations, and mergers, respectively. The DetRe evaluates the percentage of ground-truth detections that have been correctly predicted by the MOT method, while the DetPr evaluates the percentage of detection predictions made that are correct. The AssRe measures how the MOT method avoids splitting an object up into multiple shorter trajectories. In contrast, the AssPr measures how to avoid merging multiple objects into one trajectory.
The multidimensional analysis allows one to clearly see the benefits and pitfalls of certain methods and allows for the selection of top-performing methods for different applications that may have different requirements. In Figure 6, any tracking method along the multidimensional Pareto front (red dashed line) can be regarded as state-of-the-art in at least one aspect of tracking performance.
Figure 6a shows how the HOTA score (grey curve) of the MOT method increases as the detection and data association scores increase. As can be seen in Figure 6a, our method is the best in data association, while PermaTrack is better in detection. In fact, these two methods lie on the Pareto front. Thus, for some trade-offs between detection performance and data association, each of them is the best choice.
In Figure 6b, CenterTrack, DEFT, and LGM have similar DetRe scores and are all able to find more true objects, but also predict more false detections (lower DetPr) compared to SMAT. Our method is relatively low in both DetRe and DetPr, which points the way to further improve the detector performance.
As seen in Figure 6c, PermaTrack is more likely to split trajectories into multiple smaller trajectories than our method but is better at not merging trajectories. Our method has not only the highest AssRe, but also a good AssPr, with the smallest difference between the two values, reaching a certain degree of balance. This also shows the effectiveness and superiority of the two-tier data association approach we have designed.

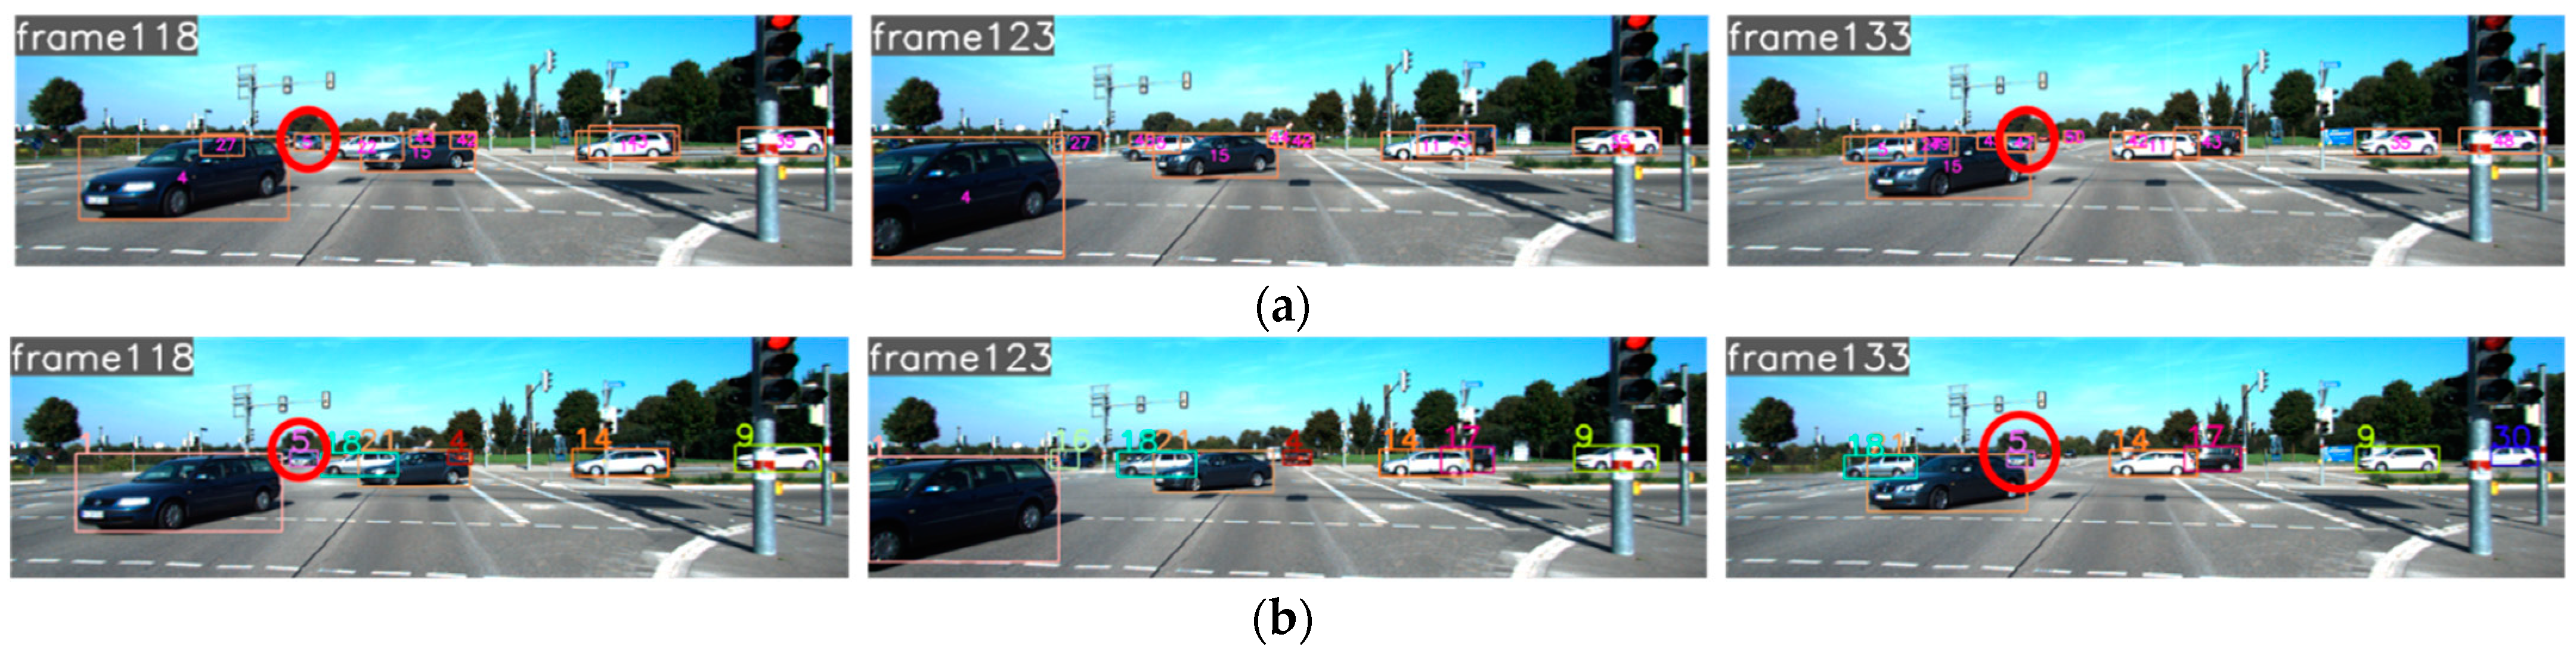
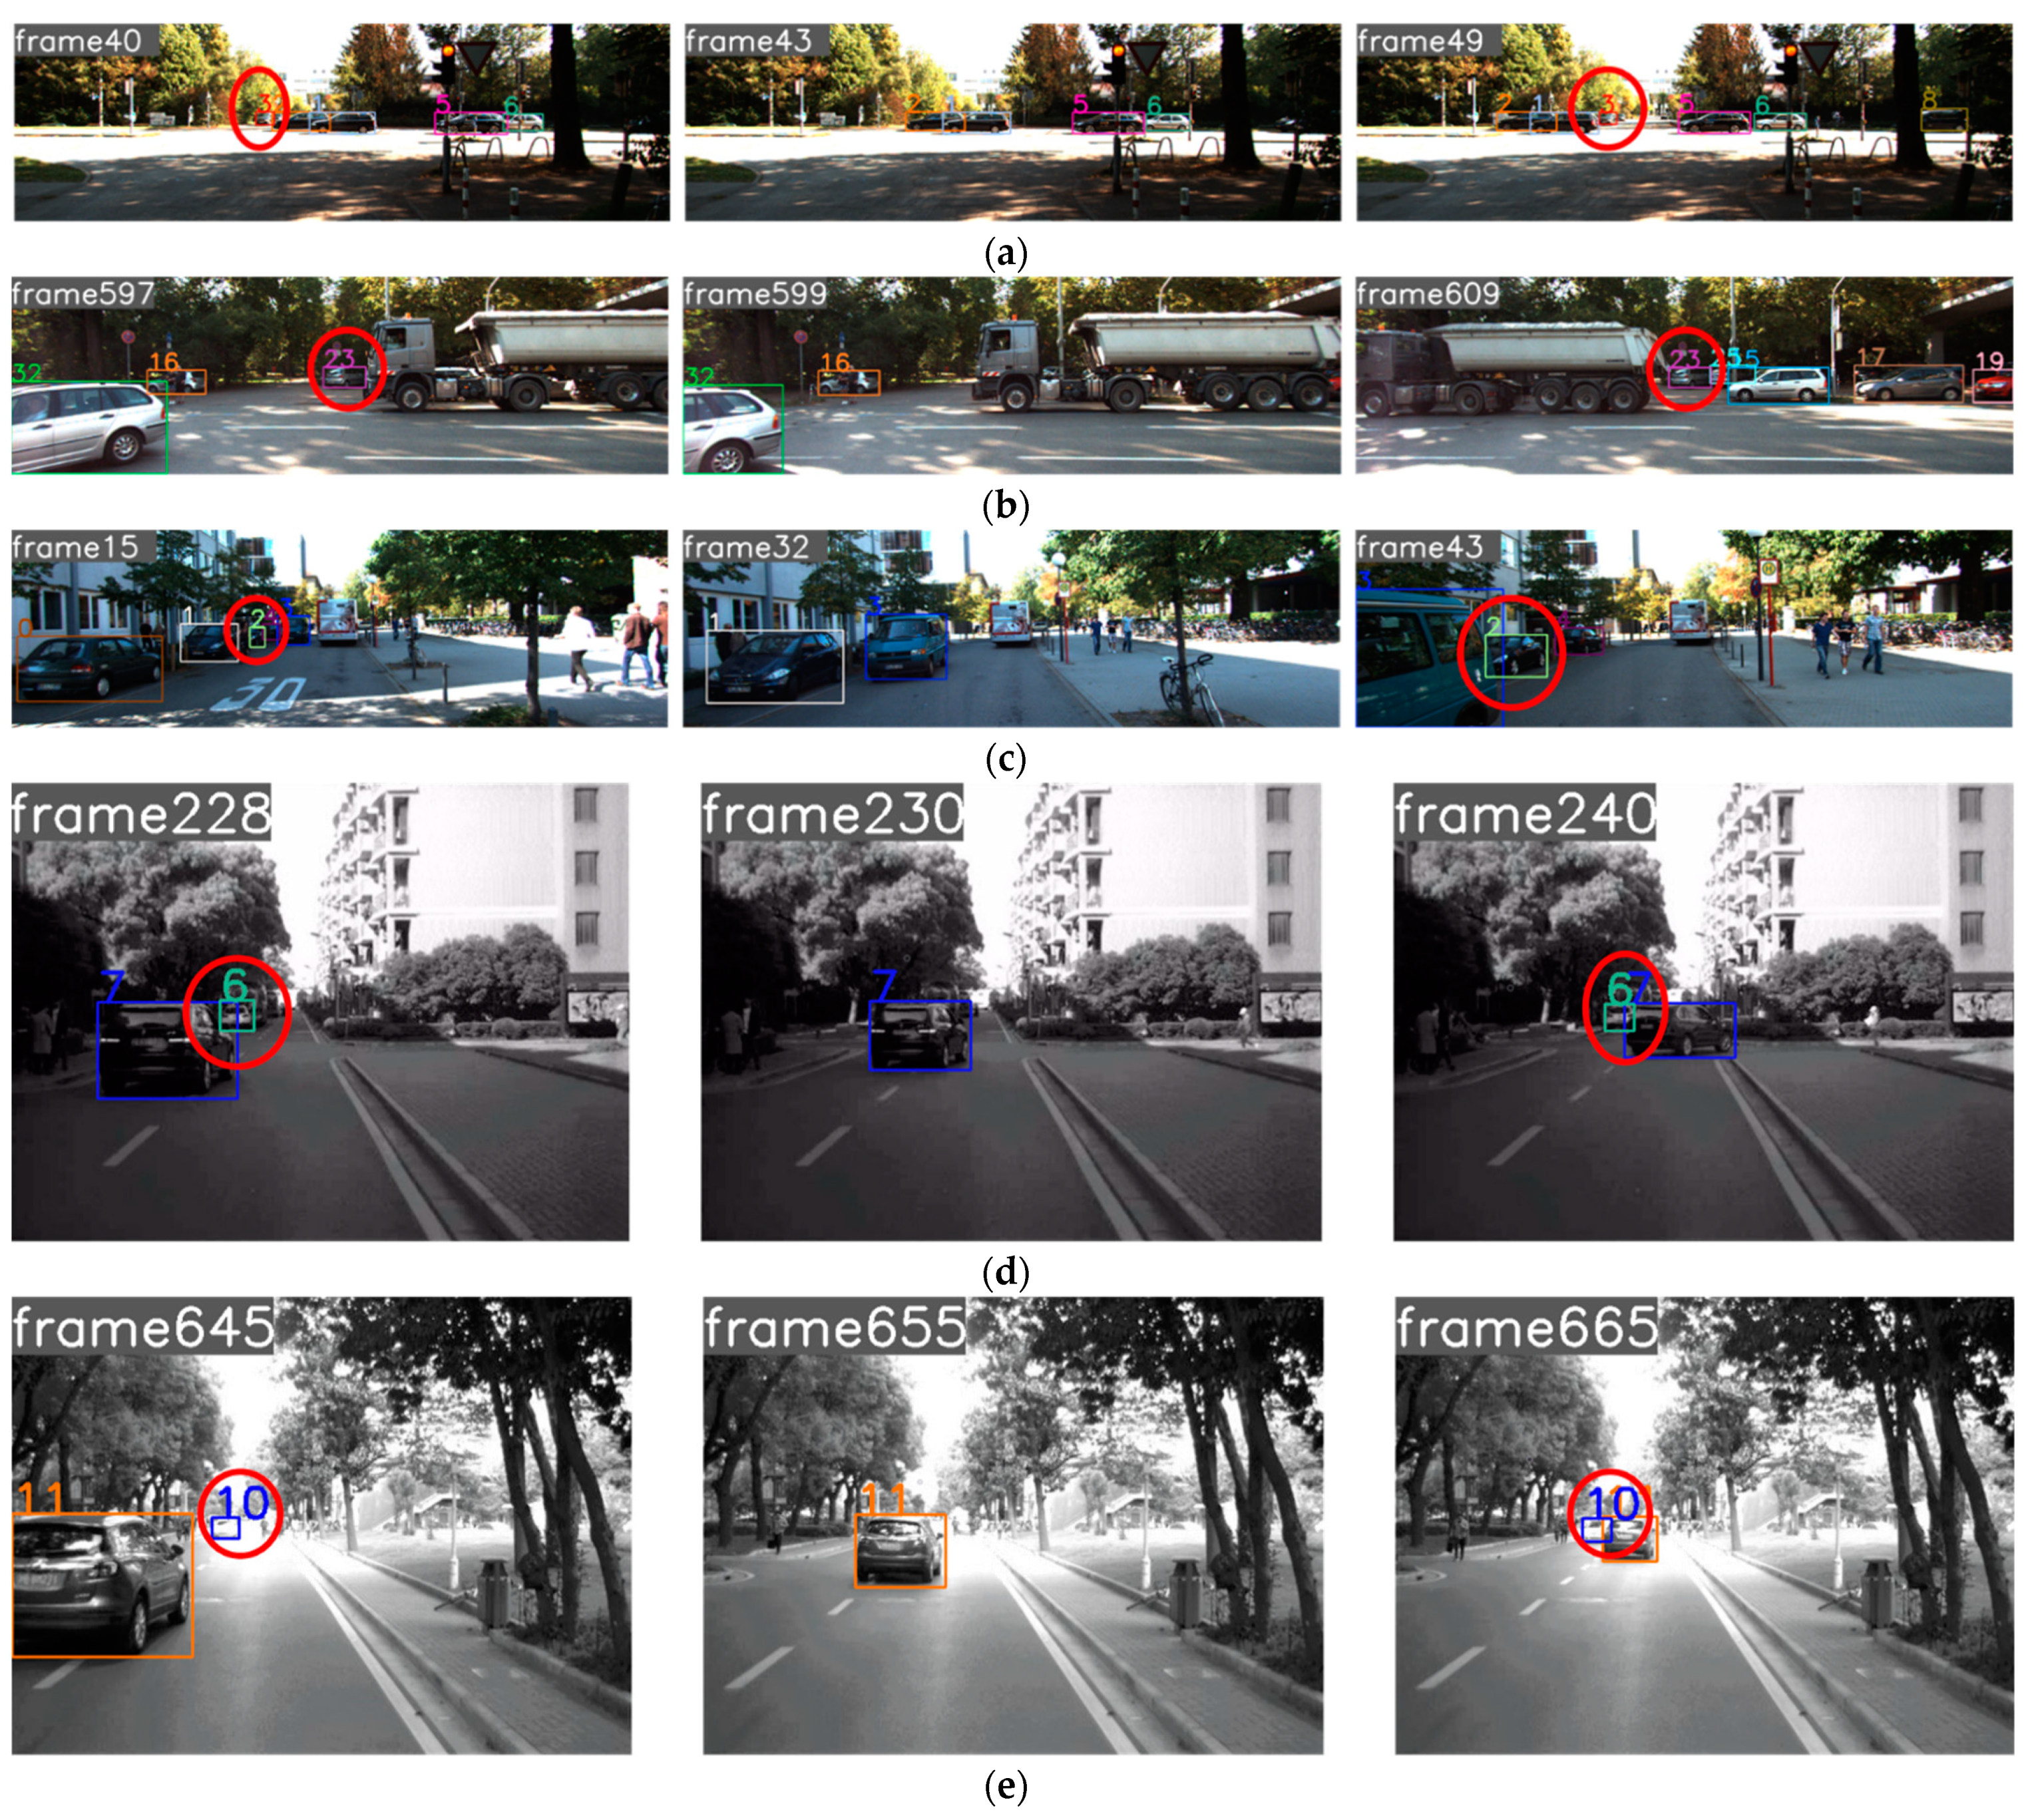
4.5. Visually Intuitive Evaluation

Figure 7 shows visually intuitive results of our method on some typical scenarios. The Figure 7a–c are the visual results on the KITTI MOT testing sequences, and the Figure 7d,e are the visual results on the campus scenario sequences captured by our experimental vehicle.
In Figure 7a, Obj. 1, 2, 5, and 6 appear consecutively at frames 40 to 49 and are tracked with their IDs unchanged. Obj. 3 (marked by a red circle) is completely occluded by Obj. 2 and 1 at frame 4. When it reappears at frame 49, our method correctly recovers its trajectory with ID 3. In Figure 7b, Obj. 23 was completely obscured by the tanker truck for a long period. It can be seen how our method successfully re-tracks it. In Figure 7c, Obj. 2 is severely or long-term occluded by Obj. 3 at frames 15 to 43. Our method correctly associates the trajectory with the object at frame 43. In Figure 7d, the objects are in a dimly lit position. Obj. 6 is occluded by Obj. 7 at frame 230. When it reappears, our method is able to maintain its unique identity. In Figure 7e, despite Obj. 10 undergoing complete occlusion, it can still be assigned the correct identity at frame 665. These five examples demonstrate the robustness of our method in dealing with reappearing objects caused by occlusion.

5. Conclusions

In this paper, we present a robust multiple object tracking following the tracking-by-detection paradigm for autonomous driving. A spatial pyramid pooling hash network is proposed to map multiple levels of abstractions into discriminative, compact hash codes. The obtained hash codes are used as object appearance features and are more robust to object appearance during tracking. We extract the appearance, motion, and position features of the detected objects and use them to design three affinity metrics. According to the characteristics of the different appearing states of objects (continuously appearing, reappearing), these metrics are applied to a two-tier data association scheme consisting of an affinity cost model and a hash-based image retrieval model to improve the tracking performance of our method. The hash-based image retrieval model introduces image retrieval technology to reduce ID switches caused by severe occlusions. Quantitative and qualitative experiments on the KITTI MOT dataset and the campus scenario sequence demonstrate that our MOT method works well in various scenarios and achieves state-of-the-art performance.

Author Contributions

Conceptualization, H.W. and Y.H.; methodology, H.W. and Y.H.; software, H.W.; validation, H.W. and Y.H.; formal analysis, H.W.; investigation, H.W.; writing—original draft preparation, H.W. and Y.H.; writing—review and editing, H.W. and Y.H.; project administration, Y.H.; funding acquisition, Y.H. All authors have read and agreed to the published version of the manuscript.

Funding

This research was funded by the Shanghai Nature Science Foundation of Shanghai Science and Technology Commission, China, grant number 20ZR1437900, and the National Nature Science Foundation of China, grant number 61374197.

Institutional Review Board Statement

Not applicable.

Informed Consent Statement

Not applicable.

Data Availability Statement

Data available in a publicly accessible repository.

Conflicts of Interest

The authors declare no conflict of interest.

References

  1. Ravindran, R.; Santora, M.J.; Jamali, M.M. Multi-Object detection and tracking, based on dNN, for autonomous vehicles: A review. IEEE Sens. J. 2021, 21, 5668–5677. [Google Scholar] [CrossRef]
  2. Zhang, C.; Yang, Z.; Liao, L.; You, Y.; Sui, Y.; Zhu, T. RPEOD: A real-time pose estimation and object detection system for aerial robot target tracking. Machines 2022, 10, 181. [Google Scholar] [CrossRef]
  3. Chong, Y.L.; Lee, C.D.W.; Chen, L.; Shen, C.; Chan, K.K.H.; Ang, M.H., Jr. Online obstacle trajectory prediction for autonomous buses. Machines 2022, 10, 202. [Google Scholar] [CrossRef]
  4. Lee, M.-F.R.; Lin, C.-Y. Object tracking for an autonomous unmanned surface vehicle. Machines 2022, 10, 378. [Google Scholar] [CrossRef]
  5. Li, J.; Wei, L.; Zhang, F.; Yang, T.; Lu, Z. Joint deep and depth for object-level segmentation and stereo tracking in crowds. IEEE Trans. Multimed. 2019, 21, 2531–2544. [Google Scholar] [CrossRef]
  6. Karunasekera, H.; Wang, H.; Zhang, H. Multiple object tracking with attention to appearance, structure, motion and size. IEEE Access 2019, 7, 104423–104434. [Google Scholar] [CrossRef]
  7. Tian, W.; Lauer, M.; Chen, L. Online multi-object tracking using joint domain information in traffic scenarios. IEEE Trans. Intell. Transp. Syst. 2020, 21, 374–384. [Google Scholar] [CrossRef]
  8. Sun, Z.; Chen, J.; Mukherjee, M.; Liang, C.; Ruan, W.; Pan, Z. Online multiple object tracking based on fusing global and partial features. Neurocomputing 2022, 470, 190–203. [Google Scholar] [CrossRef]
  9. Lin, X.; Li, C.-T.; Sanchez, V.; Maple, C. On the detection-to-track association for online multi-object tracking. Pattern Recognit. Lett. 2021, 146, 200–207. [Google Scholar] [CrossRef]
  10. Gonzalez, N.F.; Ospina, A.; Calvez, P. SMAT: Smart multiple affinity metrics for multiple object tracking. In Proceedings of the International Conference on Image Analysis and Recognition, Póvoa de Varzim, Portugal, 24–26 June 2020. [Google Scholar]
  11. Kim, A.; Ošep, A.; Leal-Taixé, L. EagerMOT: 3D multi-object tracking via sensor fusion. In Proceedings of the 2021 IEEE International Conference on Robotics and Automation (ICRA), Xi’an, China, 30 May–5 June 2021. [Google Scholar]
  12. Luiten, J.; Fischer, T.; Leibe, B. Track to reconstruct and reconstruct to track. IEEE Robot. Autom. Lett. 2020, 5, 1803–1810. [Google Scholar] [CrossRef] [Green Version]
  13. Wang, G.; Gu, R.; Liu, Z.; Hu, W.; Song, M.; Hwang, J. Track without appearance: Learn box and tracklet embedding with local and global motion patterns for vehicle tracking. In Proceedings of the 2021 IEEE/CVF International Conference on Computer Vision (ICCV), Montreal, QC, Canada, 10–17 October 2021. [Google Scholar]
  14. Wei, H.; Huang, Y.; Hu, F.; Zhao, B.; Guo, Z.; Zhang, R. Motion Estimation Using Region-Level Segmentation and Extended Kalman Filter for Autonomous Driving. Remote Sens. 2021, 13, 1828. [Google Scholar] [CrossRef]
  15. Liu, K.; Hu, R.; Ma, Z. Object Location and Tracking in Binocular Vision System. In Proceedings of the 1st International Conference on Communications and Information Processing, Aveiro, Portugal, 7–11 March 2012. [Google Scholar]
  16. Haq, Q.M.U.; Lin, C.H.; Ruan, S.J.; Gregor, D. An edge-aware based adaptive multi-feature set extraction for stereo matching of binocular images. J. Ambient. Intell. Human. Comput. 2022, 13, 1953–1967. [Google Scholar] [CrossRef]
  17. Xiang, J.; Zhang, G.; Hou, J. Online multi-object tracking based on feature representation and bayesian filtering within a deep learning architecture. IEEE Access 2019, 7, 27923–27935. [Google Scholar] [CrossRef]
  18. Xiong, Z.; Tang, Z.; Chen, X.; Zhang, X.; Zhang, K.; Ye, C. Research on image retrieval algorithm based on combination of color and shape features. J. Sign. Process. Syst. 2021, 93, 139–146. [Google Scholar]
  19. Yan, C.; Gong, B.; Wei, Y.; Gao, Y. Deep multi-view enhancement hashing for image retrieval. IEEE Trans. Pattern Anal. Mach. Intell. 2021, 43, 1445–1451. [Google Scholar] [CrossRef] [Green Version]
  20. Simon, M.; Amende, K.; Kraus, A.; Honer, J.; Sämann, T.; Kaulbersch, H.; Milz, S.; Gross, H.M. Complexer-yolo: Real-time 3d object detection and tracking on semantic point clouds. In Proceedings of the 2019 IEEE/CVF Conference on Computer Vision and Pattern Recognition Workshops (CVPRW), Long Beach, CA, USA, 16–17 June 2019. [Google Scholar]
  21. Cai, Y.; Li, B.; Jiao, Z.; Li, H.; Zeng, X.; Wang, X. Monocular 3d object detection with decoupled structured polygon estimation and height-guided depth estimation. In Proceedings of the AAAI Conference on Artificial Intelligence (AAAI), New York, NY, USA, 7–12 February 2020. [Google Scholar]
  22. Cai, Y.; Luan, T.; Gao, H.; Wang, H.; Chen, L.; Sotelo, M.A.; Li, Z. YOLOv4-5D: An Effective and Efficient Object Detector for Autonomous Driving. IEEE Trans. Instrum. Meas. 2021, 70, 1–13. [Google Scholar] [CrossRef]
  23. Kuhn, H.W. The Hungarian method for the assignment problem. Nav. Res. Logist. Q. 1955, 2, 83–97. [Google Scholar] [CrossRef] [Green Version]
  24. Zhou, X.; Koltun, V.; Krähenbühl, P. Tracking objects as points. In Proceedings of the European Conference on Computer Vision, Online, 23–28 August 2020. [Google Scholar]
  25. Tokmakov, P.; Li, J.; Burgard, W.; Gaidon, A. Learning to track with object permanence. In Proceedings of the 2021 IEEE/CVF International Conference on Computer Vision (ICCV), Montreal, QC, Canada, 10–17 October 2021. [Google Scholar]
  26. Chaabane, M.; Zhang, P.; Beveridge, R.; O’Hara, S. DEFT: Detection embeddings for tracking. arXiv 2021, arXiv:2102.02267. [Google Scholar]
  27. Sun, S.; Akhtar, N.; Song, H.; Mian, A.; Shah, M. Deep affinity network for multiple object tracking. IEEE Trans. Pattern Anal. Mach. Intell. 2021, 43, 104–119. [Google Scholar] [CrossRef] [Green Version]
  28. Wu, J.; Cao, J.; Song, L.; Wang, Y.; Yang, M.; Yuan, J. Track to detect and segment: An online multi-object tracker. In Proceedings of the 2021 IEEE/CVF Conference on Computer Vision and Pattern Recognition (CVPR), Nashville, TN, USA, 20–25 June 2021. [Google Scholar]
  29. He, K.; Zhang, X.; Ren, S.; Sun, J. Spatial pyramid pooling in deep convolutional networks for visual recognition. IEEE Trans. Pattern Anal. Mach. Intell. 2015, 37, 1904–1916. [Google Scholar] [CrossRef] [Green Version]
  30. Cao, Y.; Long, M.; Liu, B.; Wang, J. Deep cauchy hashing for hamming space retrieval. In Proceedings of the 2018 IEEE/CVF Conference on Computer Vision and Pattern Recognition, Salt Lake City, UT, USA, 18–23 June 2018. [Google Scholar]
  31. Kang, R.; Cao, Y.; Long, M.; Wang, J.; Yu, P.S. Maximum-Margin hamming hashing. In Proceedings of the 2019 IEEE/CVF International Conference on Computer Vision (ICCV), Seoul, Korea, 27 October–2 November 2019. [Google Scholar]
  32. Geiger, A.; Lenz, P.; Stiller, C. Vision meets robotics: The KITTI dataset. Int. J. Rob. Res. 2013, 32, 1231–1237. [Google Scholar] [CrossRef] [Green Version]
  33. He, K.; Zhang, X.; Ren, S.; Sun, J. Deep Residual Learning for Image Recognition. In Proceedings of the 2016 IEEE Conference on Computer Vision and Pattern Recognition (CVPR), Las Vegas, NV, USA, 27–30 June 2016. [Google Scholar]
  34. Simonyan, K.; Zisserman, A. V ery deep convolutional networks for large-scale image recognition. In Proceedings of the 2015 International Conference on Learning Representations, San Diego, CA, USA, 7–9 May 2015. [Google Scholar]
  35. Luiten, J.; Ošep, A.; Dendorfer, P.; Torr, P.; Geiger, A.; Leal-Taixé, L.; Leibe, B. HOTA: A higher order metric for evaluating multi-object tracking. Int. J. Comput. Vis. 2021, 129, 548–578. [Google Scholar] [CrossRef] [PubMed]
  36. Bernardin, K.; Stiefelhagen, R. Evaluating multiple object tracking performance: The CLEAR MOT metrics. EURASIP J. Image Video Process. 2008, 2008, 246309. [Google Scholar] [CrossRef] [Green Version]
  37. Li, Y.; Huang, C.; Nevatia, R. Learning to associate: HybridBoosted multi-target tracker for crowded scene. In Proceedings of the 2009 IEEE Conference on Computer Vision and Pattern Recognition, Miami, FL, USA, 20–25 June 2009. [Google Scholar]
Figure 1. The framework of our proposed MOT method. (1) Object representation (in the red dashed box). (2) data association (in the blue dashed box).
Machines 10 00668 g001
Figure 2. The architecture of the proposed spatial pyramid pooling hash network (SPPHNet).
Machines 10 00668 g002
Figure 3. Parameters of the proposed SPPHNet architecture.
Machines 10 00668 g003
Figure 4. The query image and the image database. The query image is the same car as Car1, while Car2 and Car3 are cars that are different from the query image. In the image database, (ae) represent the images of Car1, Car2, and Car3 in five different sizes, respectively.
Machines 10 00668 g004
Figure 5. Qualitative comparison results between our method and PermaTrack [25] on the KITTI MOT testing sequence 0010. Each tracked vehicle is represented in a unique ID. The red circles mark the objects severely or long-term occluded in subsequent frames. (a) Qualitative results on the KITTI MOT testing sequence 0010 of PermaTrack [25]. (b) Qualitative results on the KITTI MOT testing sequence 0010 of our method.
Machines 10 00668 g005
Figure 6. Comparison results between our method and eight state-of-the-art methods on HOTA sub-metrics. (a) HOTA is decomposed into DetA and AssA to evaluate the detection and data association performance of MOT methods. (b) DetA is decomposed into DetRe and DetPr to evaluate the detection performance. (c) AssA is decomposed into AssRe and AssPr to evaluate the data association performance. The grey curves are level sets contours of a constant score.
Machines 10 00668 g006
Figure 7. Visual results of some typical scenarios. In each sequence, the tracked vehicle is masked with a unique color and assigned with an ID. The red circles mark the objects severely or long-term occluded in subsequent frames. (a) Visual results on the KITTI MOT testing sequence 0017. (b) Visual results on the KITTI MOT testing sequence 0015. (c) Visual results on the KITTI MOT testing sequence 0018. (d) Visual results on the campus scenarios sequence 0002. (e) Visual results on the campus scenario sequence 0005.
Machines 10 00668 g007
Table 1. Feature distance comparison results of ResNet50, VGG16, and SPPHNet.
Object IDNetwork(a)(b)(c)(d)(e)
Car1ResNet500.72950.74250.74750.7120.6659
VGG160.68090.79590.72480.69760.6189
SPPHNet0.83590.8750.92190.92970.7653
Car2ResNet500.49560.52010.51740.53340.468
VGG160.46290.51380.53890.52130.5009
SPPHNet0.13280.19530.17190.16410.1406
Car3ResNet500.51770.5040.53710.51590.4143
VGG160.46020.47380.49040.45060.4272
SPPHNet0.24220.13280.13280.09380.1328
Table 2. Quantitative comparison of different versions of our method.
Different Versions of Our MethodHOTA
( % )
DetA
( % )
AssA
( % )
MOTA
( % )
MT
( % )
ML
( % )
IDSw
app + mo + pos + AC + HIR82.3780.1685.2390.7096.8407
mo + pos + AC + HIR74.2869.379.8679.0274.744.2131
app + pos + AC + HIR76.1571.4481.3779.0273.685.2624
app + mo + AC + HIR77.2472.6882.3280.8984.216.8421
app + mo + pos + AC77.2772.8982.1684.1887.895.2619
Table 3. The comparison of our method with the state-of-the-art methods on the KITTI MOT testing set.
HOTA
( % )
DetA
( % )
AssA
( % )
MOTA
( % )
MT
( % )
ML
( % )
IDSw Runtime
( ms )
CenterTrack [24] $73.0275.6271.2088.8382.152.4625445
DEFT [26] $74.2375.3373.7988.3884.312.1534440
PermaTrack [25] $78.0378.2978.4191.3385.692.62258100
JCSTD [7]65.9465.3767.0380.2457.087.8517370 + D
MASS [6]68.2572.9264.4684.6474.002.9235310 + D
LGM [13]73.1474.6172.3187.6085.082.4644880 + D
SMAT [10]71.8872.1372.1383.6462.776.00198100 + D
MOTSFusion [12]68.7472.1966.1684.2472.772.92415440 + D
Ours74.6970.7480.3885.7274.613.5410437 + D
$ represents the joint detection and tracking-based method. The others are the tracking-by-detection-based method. Runtimes are from the leaderboard. +D means detection time. The best performance is shown in bold type.
Publisher’s Note: MDPI stays neutral with regard to jurisdictional claims in published maps and institutional affiliations.

