Article

Research on Safety Detection of Transmission Line Disaster Prevention Based on Improved Lightweight Convolutional Neural Network

Department of Civil Engineering, College of Engineering, Ocean University of China, Qingdao 266100, China
*
Author to whom correspondence should be addressed.
Machines 2022, 10(7), 588; https://doi.org/10.3390/machines10070588
Submission received: 7 June 2022 / Revised: 10 July 2022 / Accepted: 15 July 2022 / Published: 19 July 2022
(This article belongs to the Section Robotics, Mechatronics and Intelligent Machines)

Abstract

:
The use of drones to inspect transmission lines is an important task for the energy maintenance department to ensure the stability and safety of power transmission. However, the current electric power inspection is inseparable from the participation of artificial vision. It is necessary to establish an automatic visual recognition technology with high reliability, high flexibility, and low embedded cost. This paper develops an improved YOLOv5S deep-learning-based transmission line disaster prevention safety detection model, called Model E. Compared to the original network, we use the Ghost convolution operation in the Model E network to improve the redundant computation caused by the conventional convolution operation. The BiFPN network structure is adopted to enhance the feature extraction ability of the original PANet network for unsafe objects in the transmission line image. This occurs in the process of Model E transmission line disaster prevention safety detection model learning. Equalized Focal Loss (EFL) is used to improve the Model E sample imbalance problem processing mechanism. The Model E proposed in this paper is 6.9%, 1.7%, 1.7%, and 2.9% higher than the current lightweight mainstream algorithms YOLOv3-Tiny and YOLOv5S, Model C (based on the original YOLOv5S network, the BiFPN structure in the Model E network part is improved), and Model D network (in the Backbone layer, four conventional convolutions are improved as Ghost convolution operations, and the rest of the structure is the same as the Model E network) in mAP@.5 evaluation index. Meanwhile, the size of the model is only 79.5%, 97.7%, 84.9%, and 93.8% of the above algorithm model. The experimental results show that the Model E transmission line disaster prevention and safety detection model proposed in this paper shows stronger competitiveness and advancement, with high reliability, flexibility, and fast detection ability, and can be applied to cost, reliability, and efficiency in order to have a higher standard of practical engineering needs.

1. Introduction

Electricity is an indispensable energy source in modern society. With the rapid development of modern industry, electricity demand is constantly expanding. As the only channel for long-distance transmission of electric energy, transmission lines play a very important role in human life [1]. Uninterrupted power transmission for different regions is a big challenge for the power maintenance department. There are often complex safety hazards on the transmission line, such as bird nests and insulator damage. In addition, the leakage of power transmission lines and fires also occur from time to time, leaving a huge safety hazard for the transmission of power. Power failures often bring huge losses to the economy and life [2]. For example, the power outage in Jordan in May 2021 caused traffic chaos, and hospitals could only rely on generators to supply patients urgently [3]. In June 2021, a fire at a substation in Monacillos, Puerto Rico, left hundreds of thousands of people without electricity across the island [4]. According to an annual report by NERC and the Iran Grid Management Company, about 70 percent of blackouts are due to equipment and grid failures [5]. It can be seen that the safety maintenance of transmission lines is very important, and inspection work plays an important role in preventing circuit disasters from occurring [6]. However, the erection of power lines, especially UHV transmission lines, is generally arranged on high mountains and hills and even in harsh environments with high altitudes and high latitudes, which poses huge challenges for human inspection or auxiliary equipment inspection that relies on human inspection [7]. At the same time, inspections that rely on manpower often find it difficult to ensure the life safety of staff in harsh climate environments [8]. In addition, there are many disadvantages such as low efficiency, high cost of manpower and inspection equipment, and the influence of human subjective factors that can easily lead to different detection standards.
In recent years, drone technology has developed rapidly, and it has shown irreplaceable convenience, safety, and efficiency in disaster prevention and safety inspection of transmission lines, especially in harsh environmental conditions [9,10,11,12,13]. The autonomous intelligent line-following technology of the UAV can perform the line-flying flight of the transmission line through a one-time setting and can optimize the battery to achieve a relatively ideal working cruise state [14]. The fault detection performance of the hardware and software carried by the UAV is the focus of realizing the disaster prevention and inspection of transmission lines, the installation of hardware equipment and equipment such as radar infrared, and sensors, which increase the cost of inspection equipment [15,16,17]. With the rapid development of image processing technology, the inspection of transmission lines based on computer vision technology has received extensive attention from an increasing number of scientific researchers [18,19,20].
Transmission line disaster prevention and detection research based on image processing technology can be divided into two categories: traditional image processing technology and image processing technology based on deep learning. Based on the traditional image processing technology, the feature selection of the faulty object to be inspected is completed manually [21] by relying on differences in color [22], shape [23], etc. For example, X Wang et al. [24] completed the identification of transmission line insulators based on Gabor and used support vector machines as classifiers. However, the detection method based on traditional image processing technology cannot meet the generalization requirements of fault detection in the complex background of the transmission line in the actual project through the selection of simple features. With the rapid iterative development of GPU hardware equipment, image processing technology based on deep learning theory has begun to be widely researched and applied in the direction of disaster prevention and inspection of transmission lines [17,25]. Algorithms in this field are generally divided into two categories; one is a two-stage detection algorithm, such as Mask R-CNN [26], Fast RCNN [27], and Faster RCNN [28], and other network algorithms; the algorithm first generates candidate frames and then performs convolutional neural network extraction and classification. For example, Zhenbing Zhao et al. [29] improved the R-CNN model to realize the detection of insulators under occlusion with high accuracy (81.8%). Gaoqiang Kang et al. [30] employed a Faster R-CNN network to locate key catenary components in transmission lines. Two-stage networks such as R-CNN have large structures and poor flexibility. Although they have high accuracy, they find it difficult to meet the low-cost and high-efficiency detection requirements of actual transmission line disaster prevention and detection projects. Another type of algorithm is the single-stage target detection algorithm, such as the SSD algorithm [31] and YOLO series algorithm [32]. Its accuracy is slightly lower than that of the two-stage target detection algorithm, but with the proposal of the sample imbalance function [33], the performance of the single-stage target detection algorithm is also rising and even surpasses the two-stage detection algorithm. This makes the single-stage target detection algorithm greatly improved in speed and accuracy. Chuanyang Liu et al. [34] performed a study based on YOLOv3 to realize the research on the detection of transmission line insulators under different interference conditions of aerial images, with an accuracy of about 90%, but only realized the detection of insulators in transmission lines without multi-target detection. Chen, BH et al. [35] performed the application of the YOLOv3 algorithm to realize the detection and counting of distribution network poles in UAV line patrol video. Although the YOLOv3 algorithm used has a smaller network structure and faster speed than the two-stage target detection algorithm, it cannot meet the need to be fast, efficient, and low cost when embedded in the mobile terminal carried by the UAV. With the rapid update and iteration of YOLO series algorithms, YOLOv5 has shown good robustness and practicability in the related fields of electric line disaster prevention detection [36,37,38]. Zhiqiang Feng et al. [39] used YOLOv5 models with different network depths to conduct a comparative study, and the results show that YOLOv5X with deeper network depth has better detection performance. However, the more flexible YOLOv5S has significant speed and cost advantages in the detection of actual UAV-mounted mobile terminals. Qiang Li et al. [40] proposed to use YOLOv5S for damage detection and localization of insulators. The analysis and comparison of experimental results show that YOLOv5S is superior to YOLOv3 and YOLOv4 in terms of speed and accuracy, showing good flexibility and robustness; however, this research only analyzes and compares the defects of insulators, and does not conduct multi-target detection research on other faults of transmission lines. Although the above-mentioned models have achieved relatively good performance in some aspects, there is still a big gap in the actual direct application, and it is difficult to meet the task requirements of real-time disaster prevention and safety detection of transmission lines.
At present, there are still some difficulties and challenges in the disaster prevention and safety detection of transmission lines. The accuracy and generalization of target detection models in the disaster prevention and safety detection of transmission lines need to be improved. It is difficult to find a dataset that can meet the establishment of a transmission line disaster prevention safety detection model in the public dataset. At the same time, the hardware equipment space and the load of the UAV are limited, and it is difficult to carry heavy and high-configuration equipment. To solve the above problems, this paper proposes the Model E transmission line disaster prevention and safety detection model, according to the characteristics of the disaster prevention and safety detection of transmission lines. YOLOv3-Tiny (Model A) and YOLOv5S (Model B) are established. The modified Model C of the BiFPN structure in the Model E network is only performed on the original Model B network; in the Backbone layer, four conventional convolutions are improved as Ghost convolution operations, and the rest of the structure is the same as the Model E network and Model D network. The four types of transmission line detection models are evaluated and analyzed. The research work of this paper is mainly carried out in the following aspects.
(1)
Establish an experimental dataset for the disaster prevention and safety detection of transmission lines, aiming to fill in the current data gaps in the field of disaster prevention and safety detection of transmission lines.
(2)
Improve the lightweight convolutional neural network structure, aiming to improve the overall performance of the Model E model in the safety detection of transmission line disaster prevention.
(3)
Establish a reliable, flexible, low-cost embedded transmission line disaster prevention safety detection model.

2. Methods

In the field of target detection of transmission lines, the two-stage target detection algorithm is difficult to embed into low-cost mobile terminals due to its huge network structure, and the detection speed is too slow to meet the real-time detection needs. Although the single-stage target detection algorithm has fast detection ability, the accuracy needs to be further strengthened. The Model B algorithm is essentially a lightweight deep convolutional neural network, which is a product of the YOLO series of single-stage target detection algorithms. This model has the characteristics of high precision and high speed [41]. We propose a Model E network model based on the Model B algorithm according to the actual engineering situation of transmission line disaster prevention and safety detection, aiming to establish a reliable and advanced transmission line disaster prevention and safety detection model. The methods of Model E [42] model establishment are introduced in detail in the following subsections, respectively.

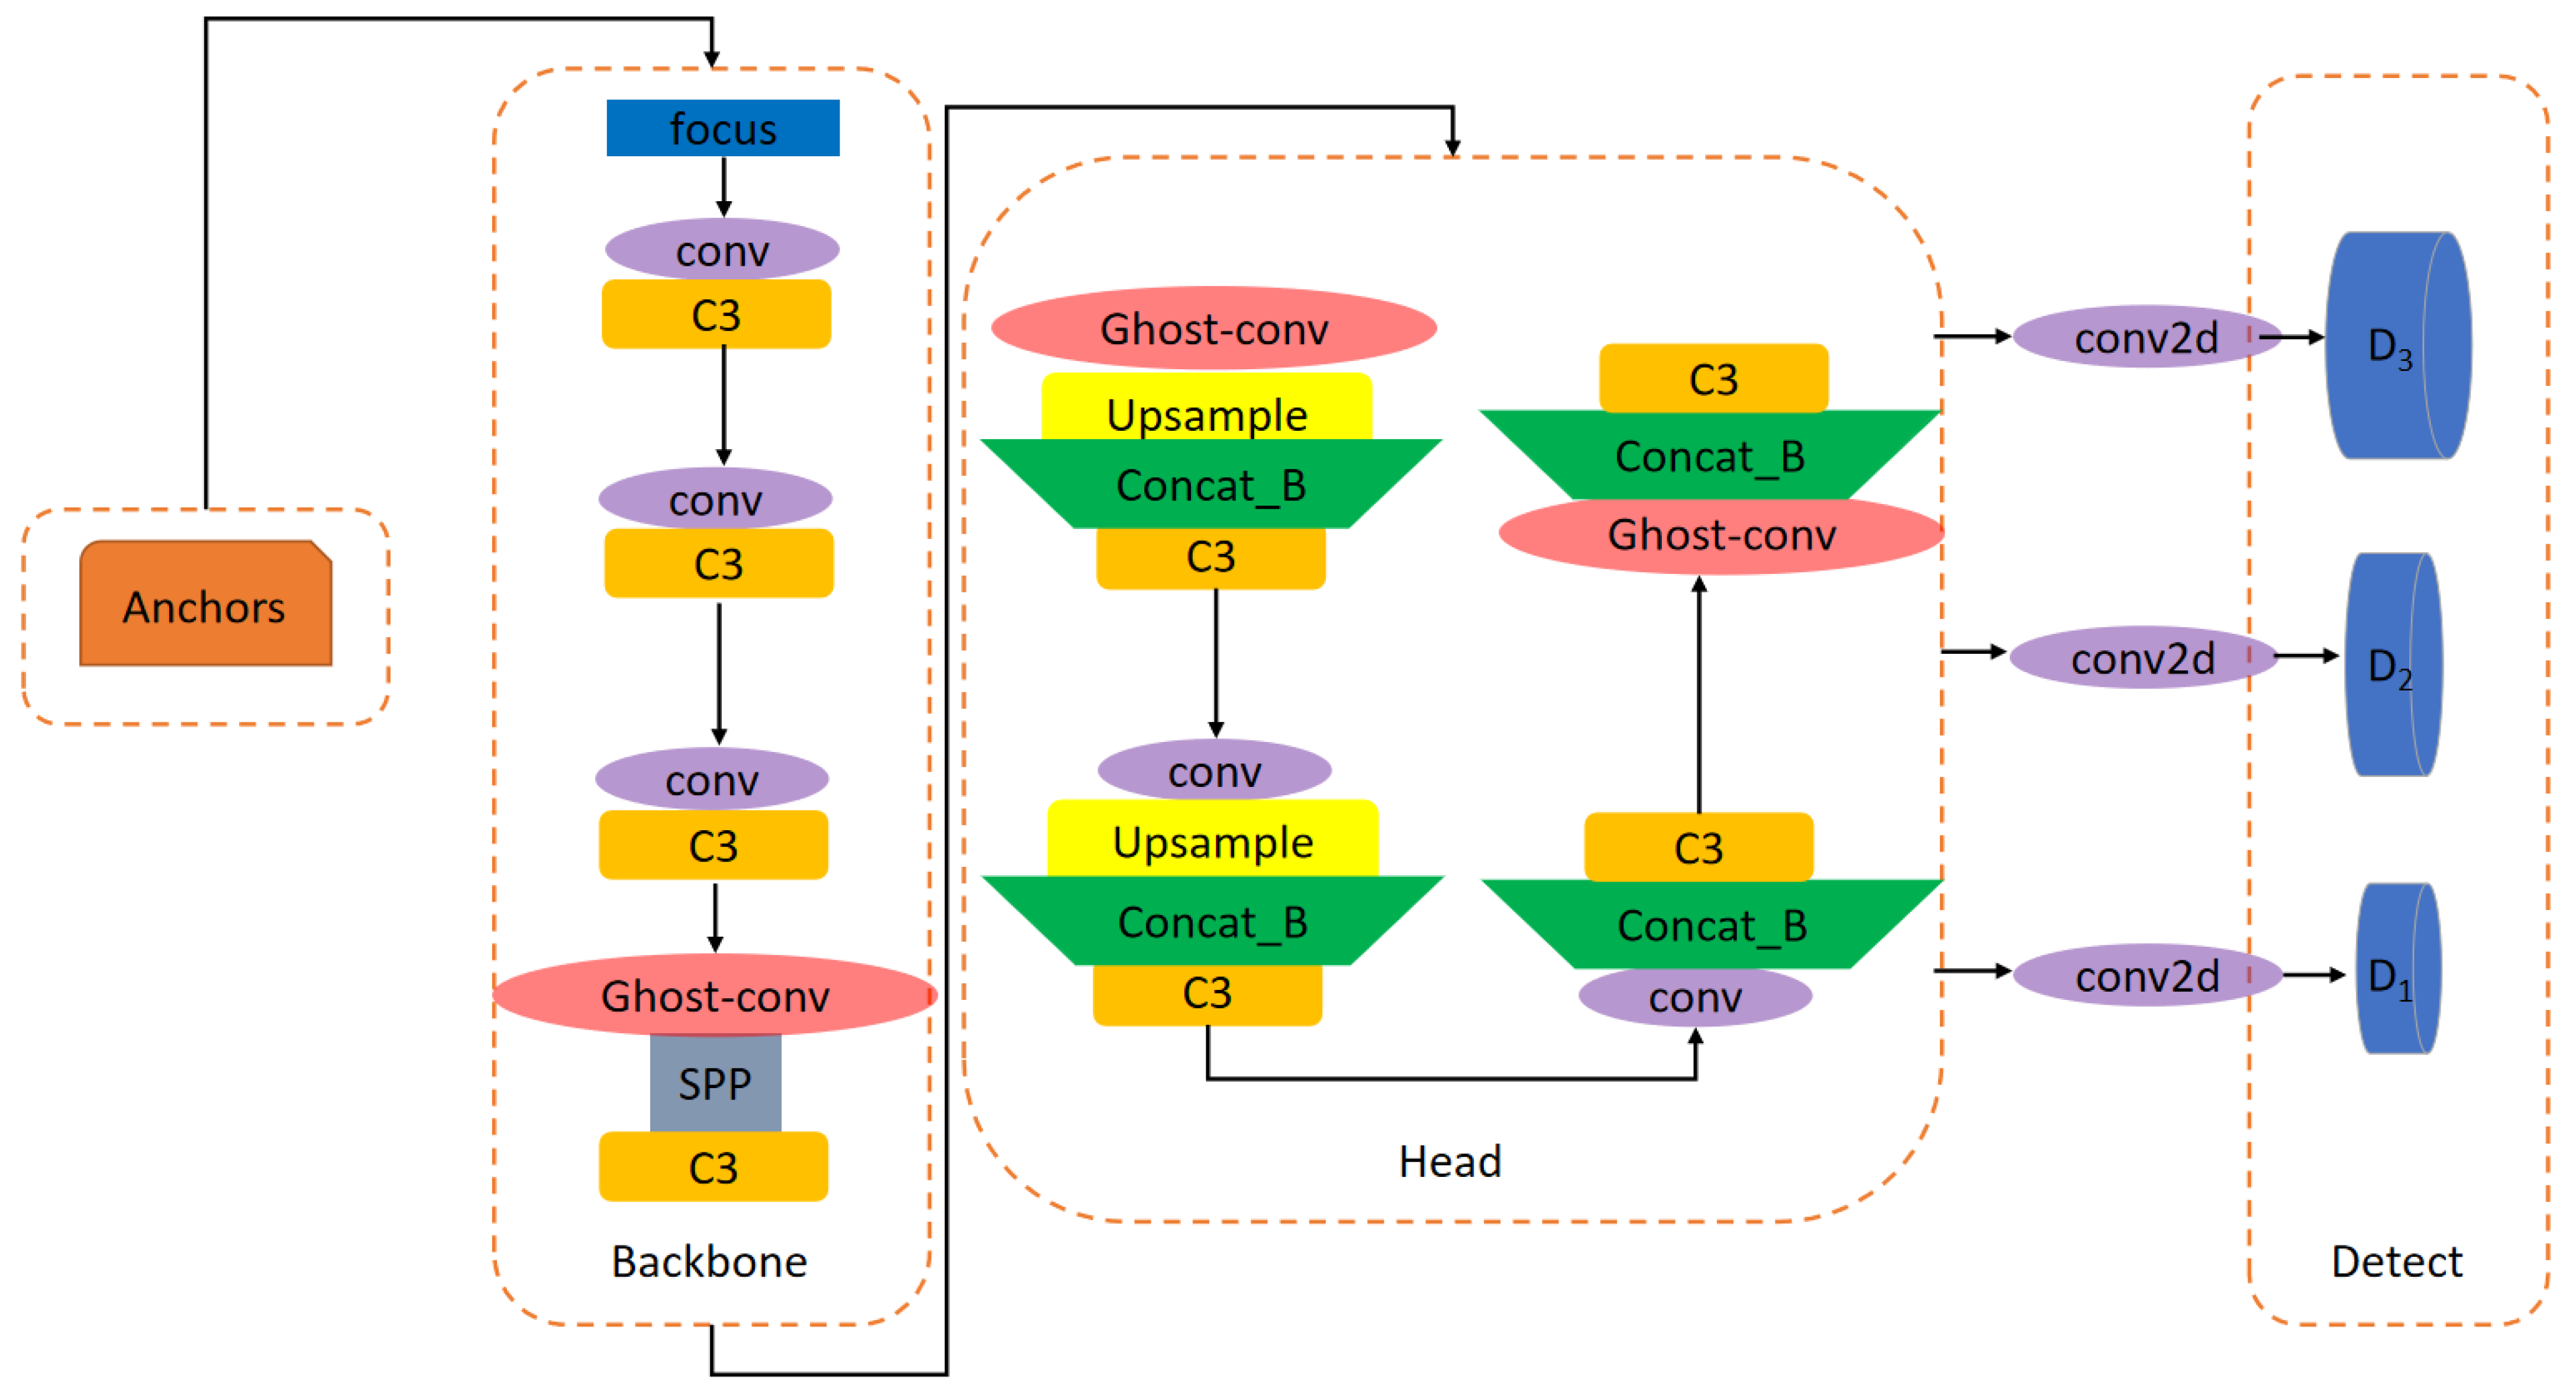
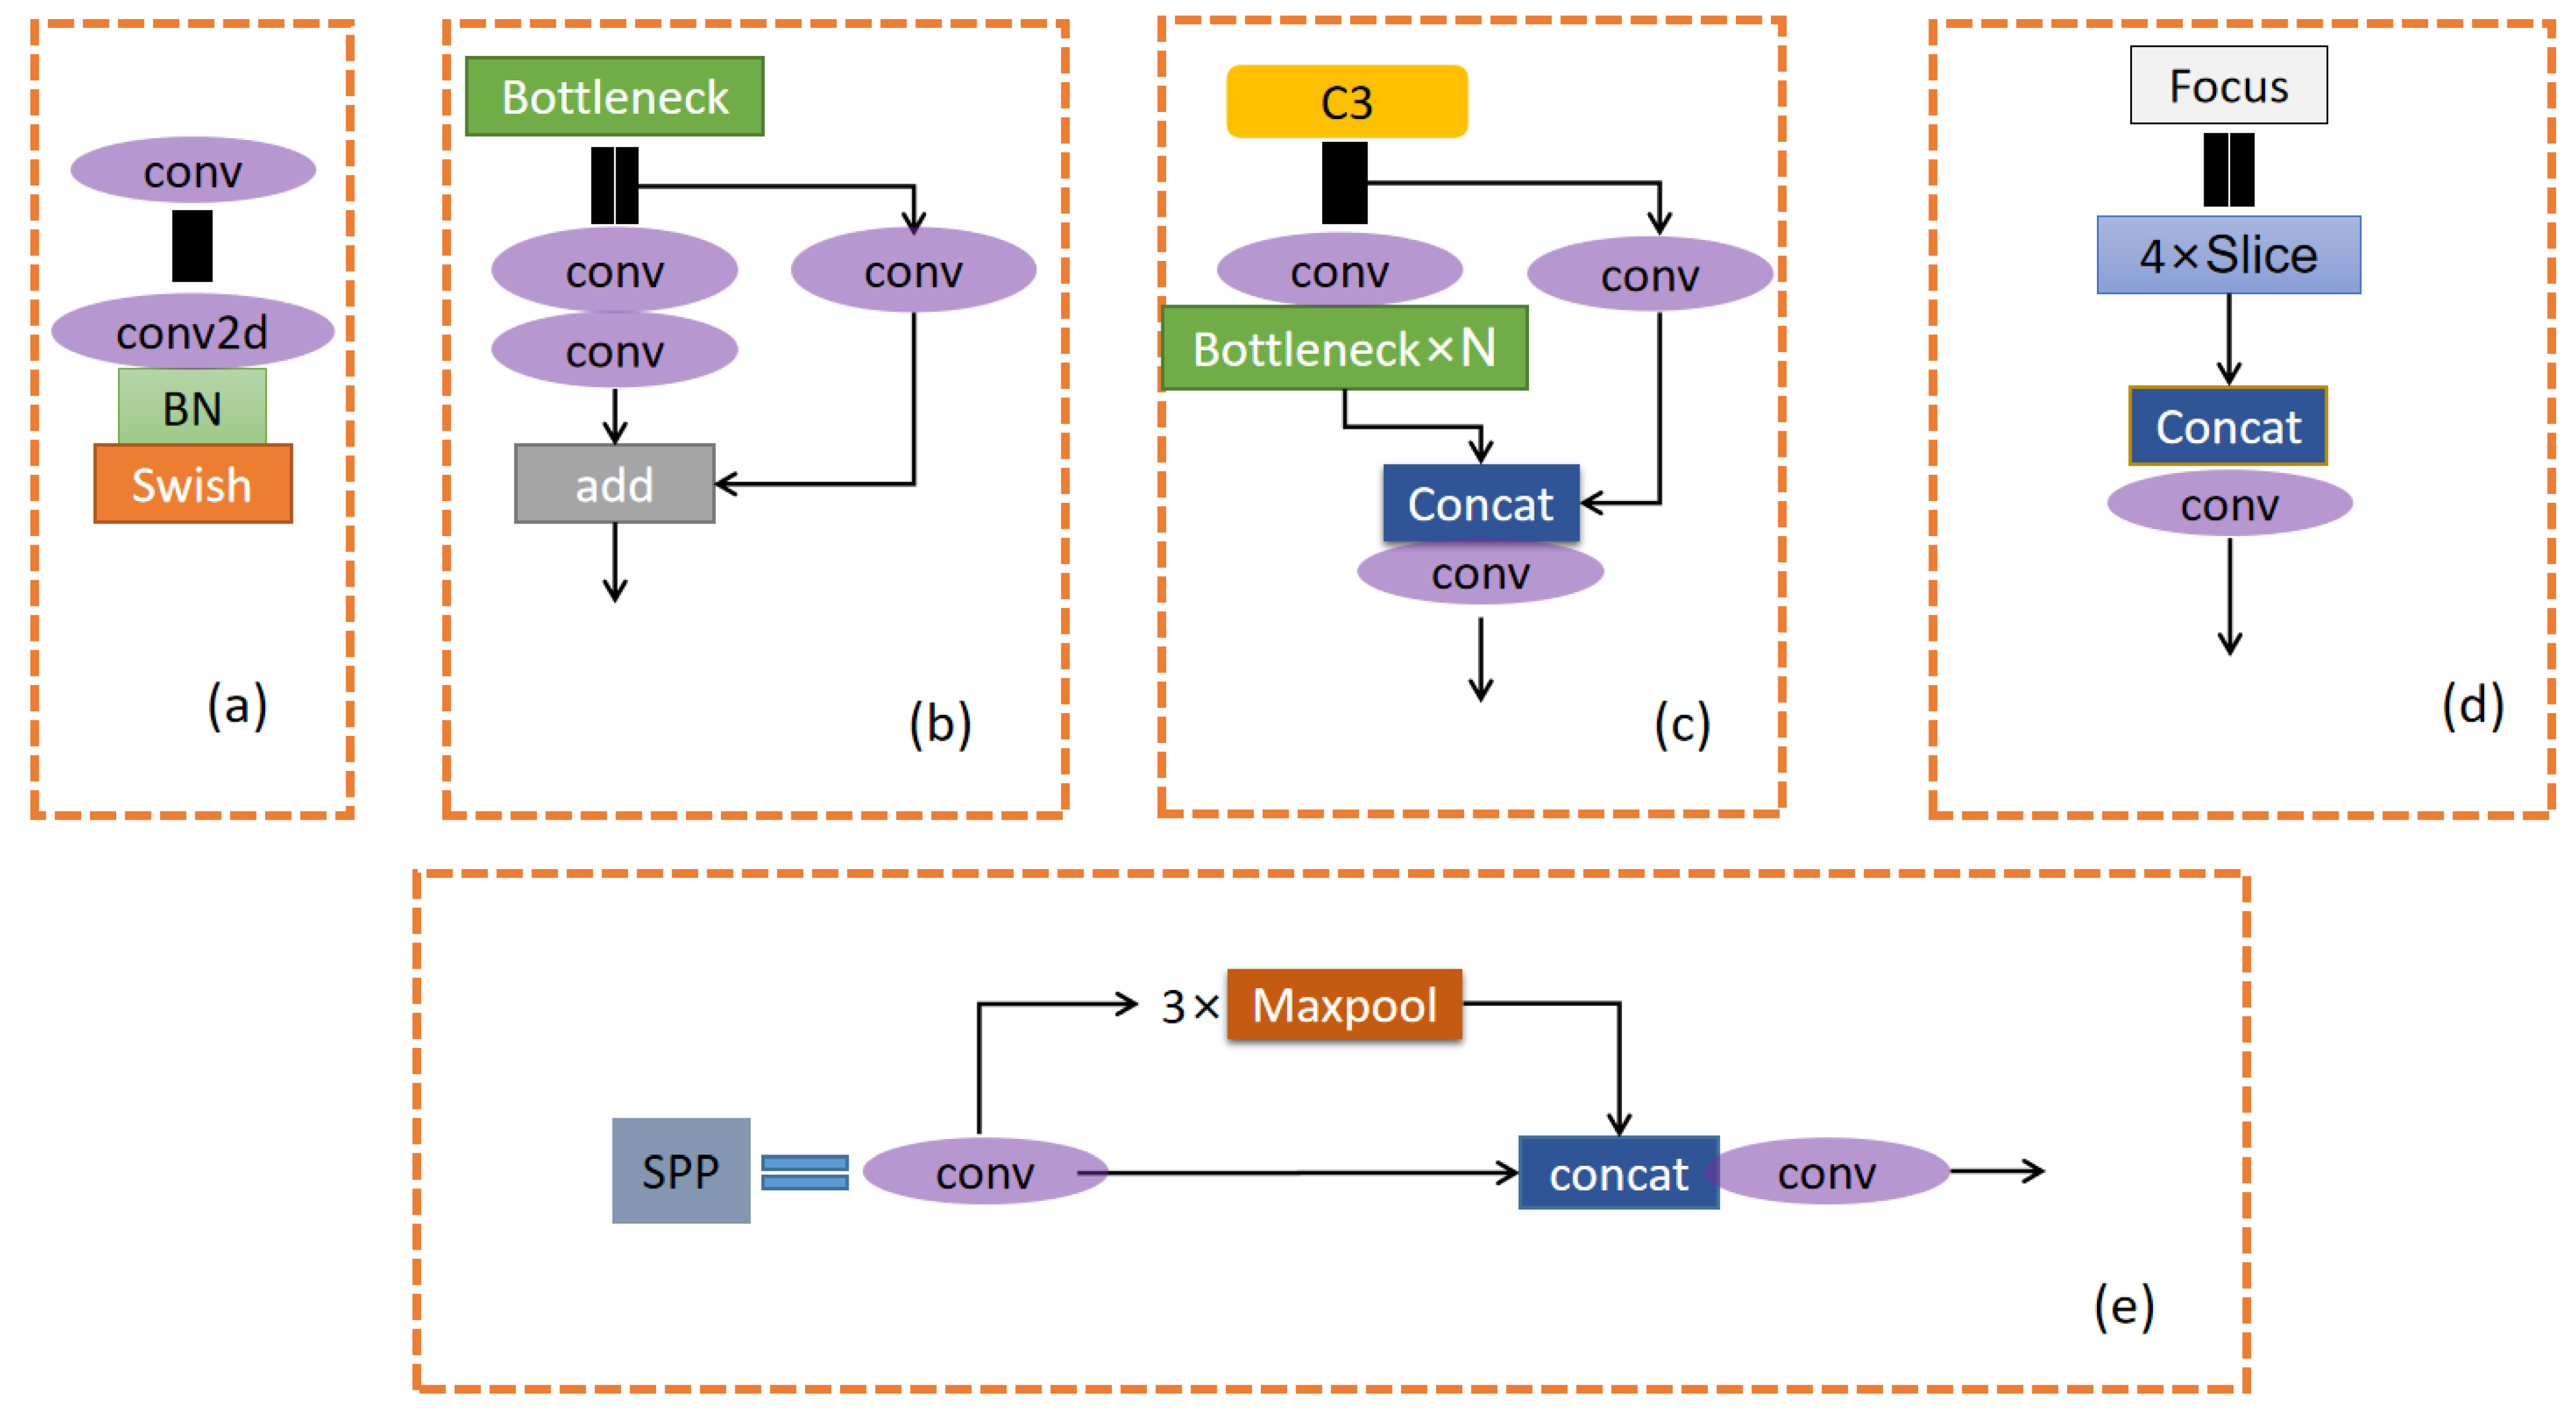
2.1. Model E Network Frame

The YOLOv5 network is a new type of YOLO series of target detection networks released in June 2020. The author divides the YOLOv5 network into four versions according to the depth of the network. The most flexible one is the Model B network. Compared with other target detection models, Model B has significant advantages such as fast speed, strong robustness, high flexibility, and easy deployment. It has fewer parameters and lower running costs [43]. At present, some teams have realized the deployment and detection of Model B in ordinary Android mobile phones [44], which greatly stimulates our interest in realizing low-cost real-time detection of end-to-end transmission line disaster prevention and safety. However, Model B still has the shortcomings of low accuracy and low generalization in the performance of transmission line disaster prevention and safety detection. Based on the Model B network model, this paper proposes the Model E network for the actual engineering requirements of transmission lines relying on UAV inspection. Its network structure is shown in Figure 1, and each module is shown in Figure 2.
The Anchors part in Figure 1 is the initial anchor frame, which is used to predict the output of the frame and compare it with the real frame. By calculating the gap, it iteratively calculates the update of the network parameters. The backbone is the backbone network part of the YOLO algorithm, and the input image mainly extracts feature information through the backbone network part. The Head part of this paper mainly uses the BiFPN network structure to further integrate the feature information of the backbone network to achieve efficient information transmission. In the Detect part, the information features previously processed by the network are used to predict the object to be measured. Conv2d is a convolution operation performed on a two-dimensional image through methods such as convolution kernel convolution. Conv is a conventional convolution operation, which can increase the nonlinear characteristics under the condition of constant scale. The Bottleneck module is a dimension reduction calculation. After the convolution operation of conv, the dimension is reduced to reduce the amount of calculation. Focus is a slice operation designed for the YOLOv5 network, expanding the input channel. C3 learns residual features through four slices and connection layers. The SPP module, the network structure of Rongguoguo as shown in Figure 2, reduces the problem of image distortion, solves the problem of extracting repeated features in the image, and improves computational efficiency.
The overall network improvements proposed in this work are as follows: We integrated the GhostConv network structure in the Backbone part and the BiFPN network structure in the Head part. At the same time, in the process of training, we improved the Focal Loss to make efficient use of the training samples and adopted the FEL function to improve the sample imbalance processing mechanism of the Model E transmission line disaster prevention and safety detection network model. Table 1 shows the specific structure and process settings of the improved Model E network algorithm.

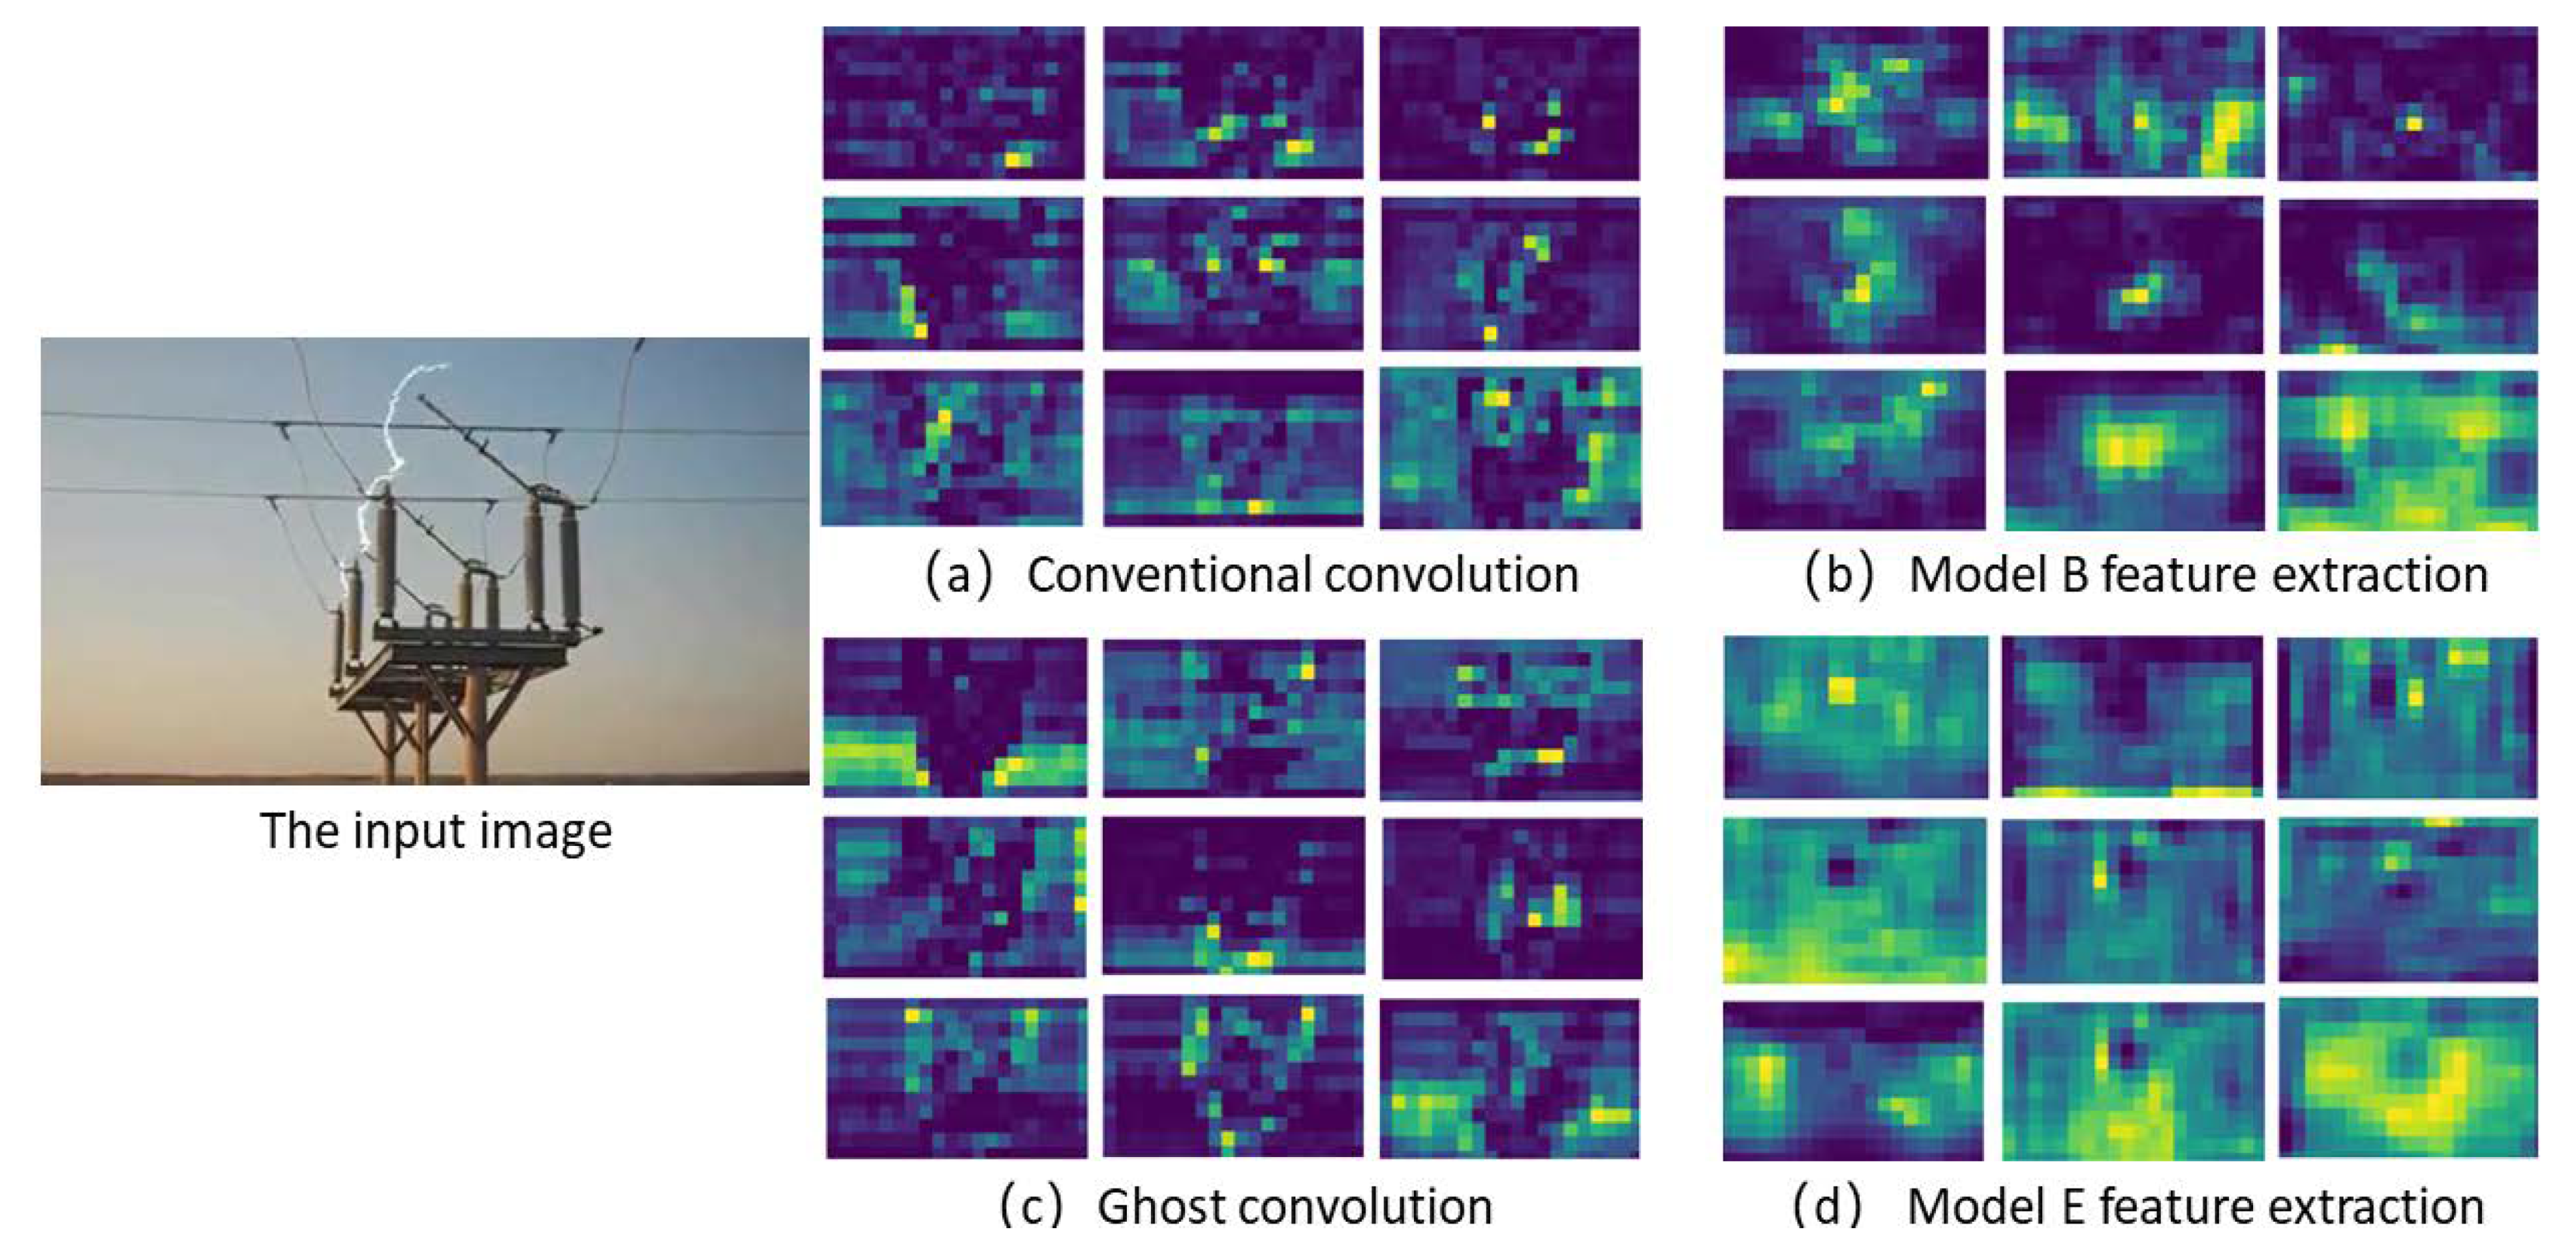
2.2. Improve Model E Backbone Network Feature Extraction Efficiency

The demand for the deployment of deep convolutional neural networks in embedded devices is gradually rising. In the disaster prevention and safety inspection of UAV transmission lines, the deployment of embedded devices is indispensable. Researchers have actively conducted research and proposed a series of lightweight convolutional neural network models. Examples include MobileNets [45], based on deep separable convolutional neural networks, MobileNetV2 [28], based on inverted residual blocks, and ShuffleNetV2 [46], network models that run at actual hardware speed. Although the above models reduce FLOPs, they are not well exploited in the correlation and redundancy between feature maps [47]. The Backbone part of Model B is composed of many convolution operations. A large number of convolution operations consume a lot of computing space and slow down the speed of computing. There is extensive redundancy of feature information in the convolution operation of a convolutional neural network (CNN) [47]. To reduce the redundant information calculation time of the transmission line disaster prevention safety detection model, Model E, and improve the feature extraction efficiency of the backbone network for transmission line disaster prevention safety detection, as shown in Figure 1, we have integrated the Ghost module into the Backbone part, and the schematic diagram of its network structure and the CNN convolutional network structure is shown in Figure 3.
The aerial image of the transmission line that we input in the conventional convolution operation can be expressed as Xc × h × w, where c, h, and w represent the channel number, height, and width of the input aerial image, respectively, then the n feature maps generated by the convolution operation are defined as shown in Formula (1):
Y = X f + b
The above formula ⊙ represents the convolution operation, b is the bias term, Ycⅹhⅹwfc × k × k × n is the convolution filter of this layer, h’, w’ are the output height and width dimensions after the convolution operation, respectively, k × k is the size of the convolution filter f convolution kernel, and the FLOP required in this process is defined as Formula (2).
N F L O P = n × h × w × c × k × k
In conventional convolution operations, the values of n and care are usually large, and thus more FLOP resources are consumed. However, in fact, the output result of the aerial image of the transmission line after the conventional convolution operation contains many redundant feature maps, and there is a large similarity in the content of the information, which wastes the calculation cost. Given this, we introduce the Ghost module, and the convolution operation of the transmission line disaster prevention and safety detection model through Ghost can generate a large amount of image feature information by consuming a small amount of calculation. Φ as shown in Figure 3, Φ represents the kernel convolution. Compared with the conventional convolution, the Ghost convolution only needs to perform the convolution calculation on one channel, and the calculation cost is greatly reduced. According to the ghost feature maps generated by the calculation of the intrinsic feature maps, its definition is shown in Formula (3).
y i j = ϕ i , j ( y i ) i = 1 , 2 , m , j = 1 , 2 , , m
In Equation (3) above, yi represents the i-th feature map in the aerial image intrinsic feature maps of the transmission line, i represents the serial number of m intrinsic feature maps of the aerial image of the transmission line, and j represents the aerial image feature of the intrinsic feature maps. A linear transformation of the graph was performed j times. Through the calculation of Formula (3), we perform an s-1 linear transformation on each feature map containing the image information of the transmission line in the intrinsic feature maps, thereby greatly reducing the amount of calculation of redundant information generated by the convolution operation [47] to improve the efficiency of the Backbone part of Model E for image feature extraction of transmission line disaster prevention and safety detection. Among them, please refer to https://github.com/huawei-noah/ghostnet (accessed on 23 May 2022)for the implementation of the Ghost source code [48].

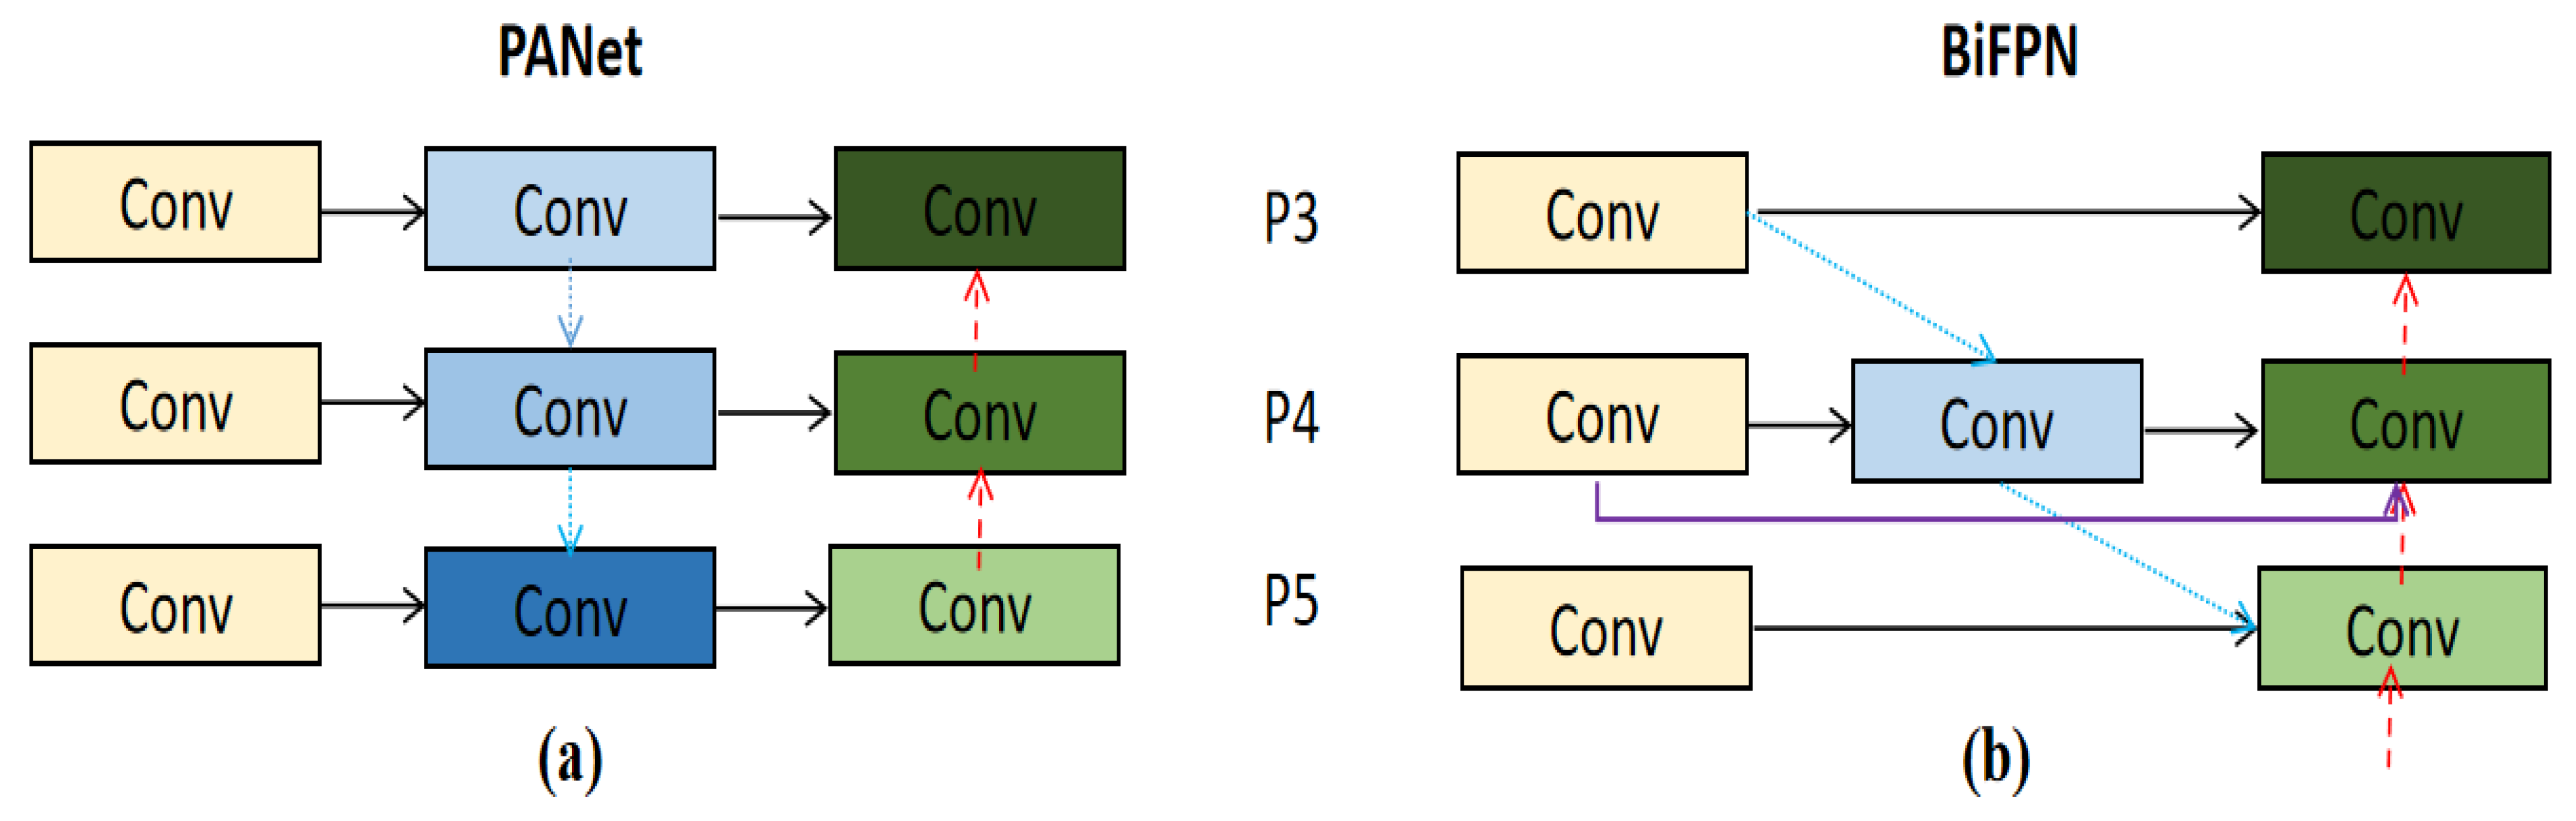
2.3. Improve the Feature Extraction Capability of the Head Network of Model E

Transmission lines often exist in remote areas such as high mountains and hills, and such backgrounds have certain complexities, such as the serious similarity between weeds and bird nests in transmission lines. In the work of this paper, we are aware of this interesting problem; therefore, we introduce the BiFPN network for the feature enhancement extraction of the Head layer network. The purpose is to improve the Model E model to mine deep information in aerial images of transmission lines, reduce the probability of missed detection and false detection of the detection model, and further improve the reliability and practicability of the Model E network model in the safety detection of transmission line disaster prevention. As shown in Figure 1, we use the BiFPN convolution module in the head layer P5 part of Model E instead of the conventional convolution operation in the original PANet network structure. The BiFPN network structure was first proposed in 2019 by Mingxing Tan et al. [49]. The comparison between its network structure and PANet network structure is shown in Figure 4.
The introduction of the BiFPN network structure aims to improve Model E’s ability to mine the deep-level information of the transmission line disaster prevention and safety detection images. The BiFPN module and the PANet module are both feature information processing modules, but different network processing methods have different results on the feature processing of the transmission line. The feature extraction of PANet adopts the same processing method for feature information of different importance, which weakens the importance of deep-level semantic feature information to a certain extent and instead pays more attention to information such as shallow-level information [50]. This is bad for the distinction of complex backgrounds in transmission lines. As shown in Figure 4, the BiFPN network structure cancels the nodes that are not fused at the two endpoints in the middle, which reduces the amount of computation and speeds up the network. As mentioned above, the importance of the information contained in different features is different. The BiFPN network extracts more important information by using fast normalized fusion weighted fusion, thereby improving the feature extraction capability of the Head layer, which is defined as shown in Formula (4). This makes the model more focused on the effective information in the aerial image. In Formula (4), the learning weight wi adopts the ReLU activation function and takes the value ε = 0.0001 to enhance the numerical stability.
O = i w i + j w j I i
The deep convolutional network Model E, in the process of extracting feature information of aerial images through continuous conventional convolution operations, loses the feature information of the target of disaster prevention and safety detection of transmission lines in the aerial images to a certain extent [51]. To comprehensively improve the information mining ability of the Model E transmission line disaster prevention and safety detection model for aerial images, and at the same time to avoid a large amount of information loss of both ends of the nodes caused by repeated use of the cycle, it was decided that the BiFPN network was to be improved in the Head layer network. The specific details of the experiments will be introduced and analyzed in detail in the following sections. The definition of the BiFPN network module in the P5 layer of the Model E network is shown in Formula (5).
P 5 t d = C o n v ( w 1 P 5 i n + w 2 R w s i z e ( P 6 i n ) w 1 + w 2 + ) P 5 o u t = C o n v ( w 1 P 5 i n + w 2 P 5 t d + w 3 Re s i z e ( P 4 o u t ) w 1 + w 2 + w 3 + )
In the above formula, P 5 t d represents the middle feature of the fifth layer from the top to the bottom, P 5 o u t represents the output feature of the fifth layer from the bottom to the top, and wi is the same as Formula (4). The fifth layer improves the model E network’s processing ability to extract feature information by interacting and merging the target information of transmission line disaster prevention and safety detection with different layers. This aims to enhance the robustness of Model E for disaster prevention detection of transmission lines. For the implementation of BiFPN source code, see https://github.com/zylo117/Yet-Another-EfficientDet-Pytorch(accessed on 23 May 2022) [52].
As shown in Figure 5 below, it is a comparison chart of feature extraction between the original image and the improved image, in which Figure 5a,c show the conventional convolution extraction features and Ghost convolution extraction features, respectively. By comparison, we can find that the features extracted by the Ghost convolution module have more obvious feature information than the conventional convolution operation; in particular, the contour information is significantly more obvious than the conventional convolution operation; Figure 5b,d show the feature extraction effects of the Model B network and the Model E network proposed in this paper on the detection images of disaster prevention and safety targets in transmission lines. Through comparison, we can find that the features processed by Ghost convolution and BiFPN network structure proposed in this paper are very significant compared with Model B, and the information contained is more abundant.

2.4. Optimize the Sample Imbalance Handling Mechanism of Model E

The problem of sample imbalance restricts the development of single-stage networks. Especially for the application of disaster prevention and safety detection of transmission lines, there are a large number of negative background samples. In practical engineering, the occurrence of sample imbalance is inevitable, and at present, not a lot of researchers in this field have noticed the existence of this problem. The Model B network uses Focal Loss to improve it during model learning. The main mechanism of Focal Loss is relatively simple. By controlling the weight of positive and negative samples and controlling the weight of easy and difficult samples, the sample imbalance is corrected. It is defined in the following Formula (6), where pt ∈ [0, 1] represents the prediction confidence score of a candidate frame target; αt is used as a parameter for balancing positive and negative samples, and γ is a parameter variable that increases as the imbalance of positive and negative samples increases.
F L ( p t ) = α ( 1 p t ) γ log ( p t )
Through the analysis of the above formula, we find that Focal Loss uses the same modulation factor to balance the problem of sample imbalance, which has a good effect under the condition of class balance, However, the foreground categories are not balanced in the detection of transmission lines, so the traditional Focal Loss algorithm cannot effectively solve the long tail problem encountered in the detection of disaster prevention and safety of transmission lines [53]. Therefore, in the learning and training process of the Model E network, we use Equalized Focal Loss (EFL) [53] to improve the mechanism of Model E to deal with sample imbalance, which is defined as Formula (7). Among them, the Weighting Factor of the j-th bridge loss target is defined as (γb + γvj)/γb. Balancing the loss work of different categories reduces the importance of the rare and difficult samples in the learning of the transmission line disaster prevention safety detection model, and prevents the occurrence of individual scarce samples from affecting the dominant direction of Model E model learning.
E F L ( p t ) = j = i C α t ( γ b + γ v j γ b ) ( 1 p t ) γ b + γ v j log ( p t )
Among them, the source code implementation of Equalized Focal Loss is detailed at https://github.com/ModelTC/EOD(accessed on 23 May 2022) [54].

3. Experiment

The hardware and software configurations of the experiments conducted in this paper are shown in Table 2. We trained and tested the experimental models in the experimental equipment with the following configurations. The experimental workflow of this paper is shown in Figure 6. We mainly divided it into three parts: preliminary preparation, intermediate experiment, post-analysis, and summary. In the following subsections of this chapter, we will introduce and explain the details of the experimental implementation, the establishment of the dataset, the establishment of the evaluation indicators, and the experimental results in the work of this paper in a complete and detailed manner.

3.1. The Establishment of Evaluation Indicators

To comprehensively evaluate the performance of the Model E lightweight convolutional neural network model proposed in this paper in the field of disaster prevention and safety detection of transmission lines, we mainly introduce ten evaluations from three perspectives of detection efficiency, reliability, and advancement. The indicators comprehensively evaluate the work of this paper. The following is the introduction and definition of the evaluation index of the transmission line disaster prevention and safety detection model.
(1)
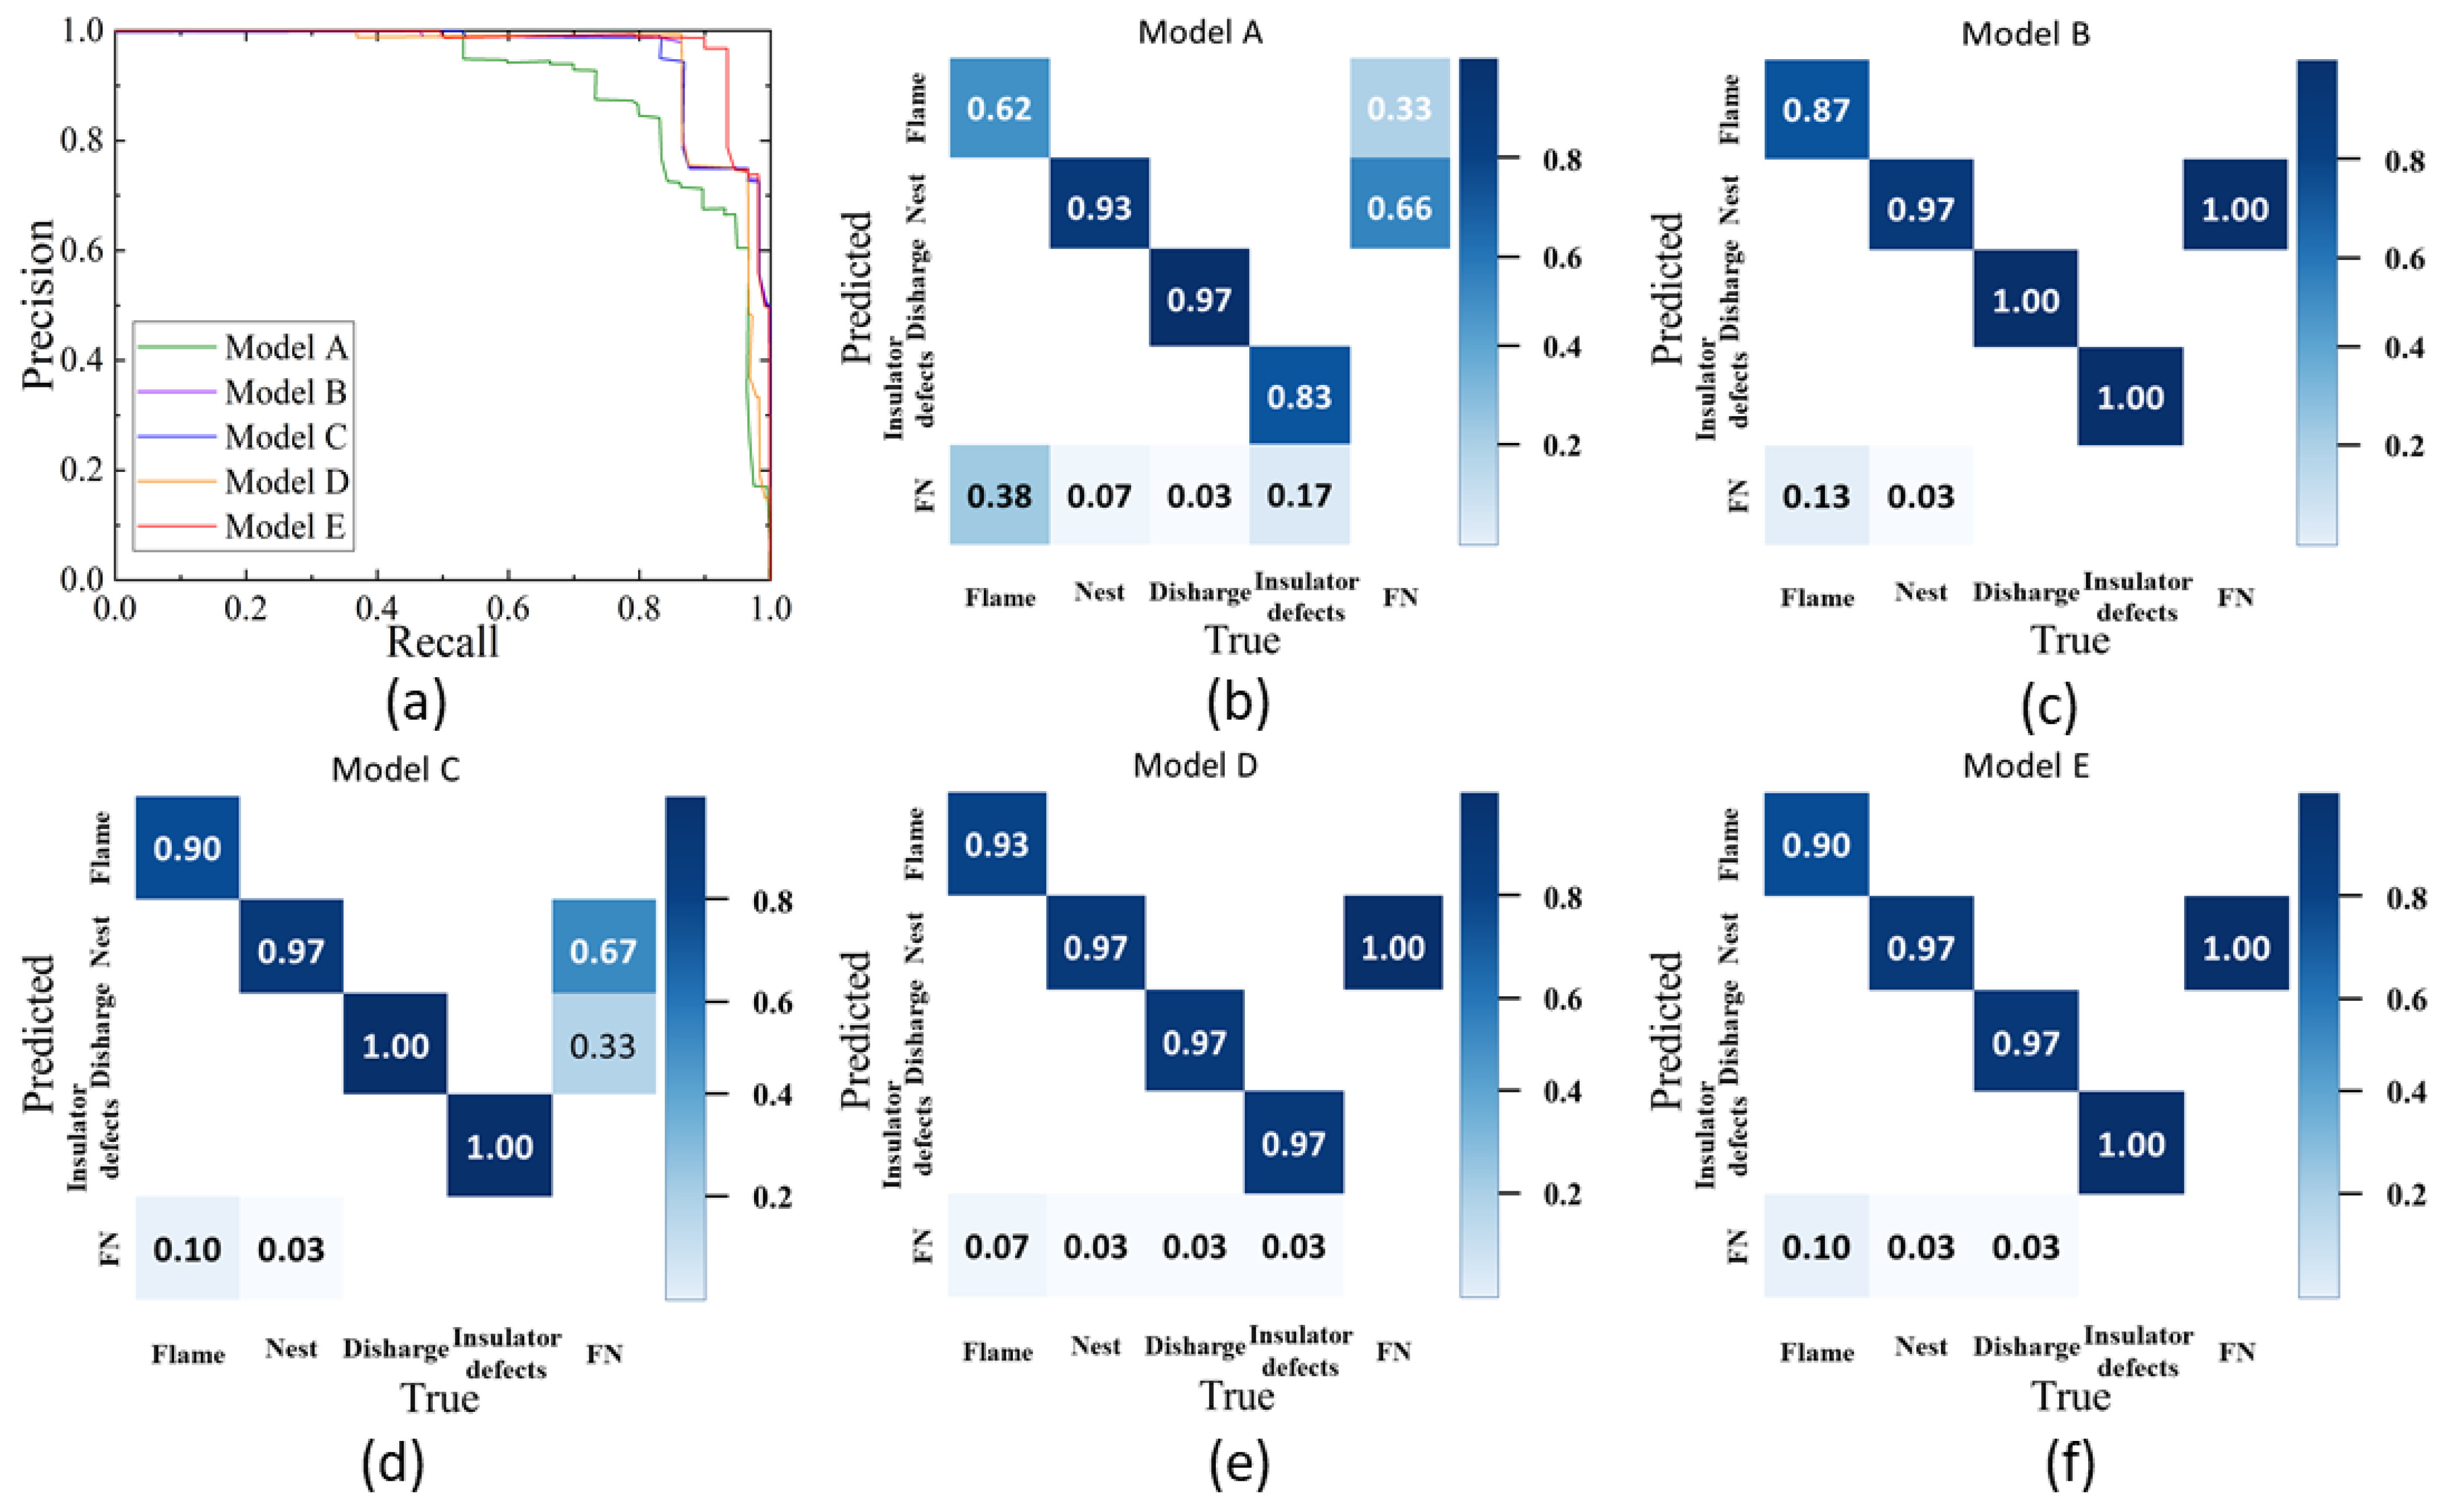
The confusion matrix
A confusion matrix is the basic definition of many evaluation indicators in the field of target detection, and it lays the foundation for the evaluation of transmission line disaster prevention and safety detection models. It mainly includes four types of indicators: TN (predict negative samples as negative samples), FN (predict positive samples as negative samples), TP (predict positive samples as positive samples), and FP (predict negative samples as positive samples).
(2)
Precision, Recall, F1-score, and PR curve
Accuracy is the evaluation index of how many real sample targets of potential safety hazards are predicted by the transmission line disaster prevention safety detection model as real samples, that is, the proportion of the real required transmission line safety hazards that target positive examples in the prediction results, which is defined as the following Formula (8). Recall indicates how many bridge damages are correctly predicted in the dataset, i.e., the proportion correctly predicted by the model in all positive examples. This is used to evaluate the detection coverage of our experimental model for bridge damage targets in the sample, which is defined as Formula (9). In fact, in the actual experiment, the two indicators Precision and Recall are a pair of contradictory measures. When Precision is high, Recall is low, and vice versa. To more accurately measure the precision and recall balance performance of different models in the experiment in the detection of transmission line disaster prevention and safety targets, the F1 score is introduced in this paper to rebalance the contributions of the two and intuitively express it in a quantitative form. It is defined as Formula (10). The PR curve is drawn with P as the ordinate and R as the abscissa, which can intuitively find the advantages and disadvantages of different models in transmission line detection through the image.
P r e c i s i o n ( P ) = T P T P + F P
Re c a l l ( R ) = T P T P + F N
F 1 s c o r e ( F 1 ) = 2 × P × R P + R
(3)
mAP@.5 (mean Average Precision IoU = 0.5), mAP@.5:.95
Accuracy is an important evaluation index to evaluate the different experimental models in this paper in the disaster prevention and safety detection of transmission lines. It is defined as the following Formula (12). It represents the proportion of positive samples and negative samples accurately predicted by the model in the transmission line safety hidden danger data. The work of this paper is not only to classify the targets of hidden dangers of transmission lines but also to mark the location information of the targets. Intersection over Union (IoU) also participates in the performance of the model. To comprehensively evaluate the overall performance of the model in the transmission line disaster prevention safety detection, the Accuracy is calculated under the condition of IoU = 0.5 (the correlation between the prediction frame and the rear frame is 50%), and the average mAP over different IoU thresholds (from 0.5 to 0.95, step size 0.05) is defined as Formula (13), IoU = x.
P int e r p ( r ) = max r ~ p ( r ) ~
A P = 1 11 γ { 0 , 0 . , 0.2 , , 1 } p i n t e r p ( r )
m A P = i = 1 3 A P i 3 ( I o U = x )
(4)
Giga Floating Point Operations Per Second (GFLOPs), Frames Per Second (FPS), and Parameters
In practical engineering, the cost of carrying energy by drones, the cost of embedded hardware devices, considering the available space, etc., have extremely high requirements for the small size and rapid detection of the transmission line disaster prevention safety model. Therefore, we introduce FLOPs and FPS to evaluate the structural complexity and detection speed of the model, aiming to evaluate the practicability of the model in the detection of disaster prevention and safety of transmission lines.
GFLOPs are used to calculate the floating-point arithmetic of the transmission line disaster prevention and safety detection model to measure the complexity of the model. The larger the value, the higher the complexity of the model. The higher the model complexity, the greater the loss in speed and flexibility. FPS represents the detection rate of the transmission line disaster prevention and safety detection model and expresses the number of frames per second transmitted by the screen. For example, the perceived speed of the human eye to video is generally 10-12 FPS [55]. Parameters are the parameters of a model, generally expressed as the size of the model. Generally speaking, the smaller the model, the more flexible it is. The hardware configuration required to run the algorithm can be lower, so the model with high flexibility can meet the needs of easy deployment, low cost, and high speed in practical engineering.

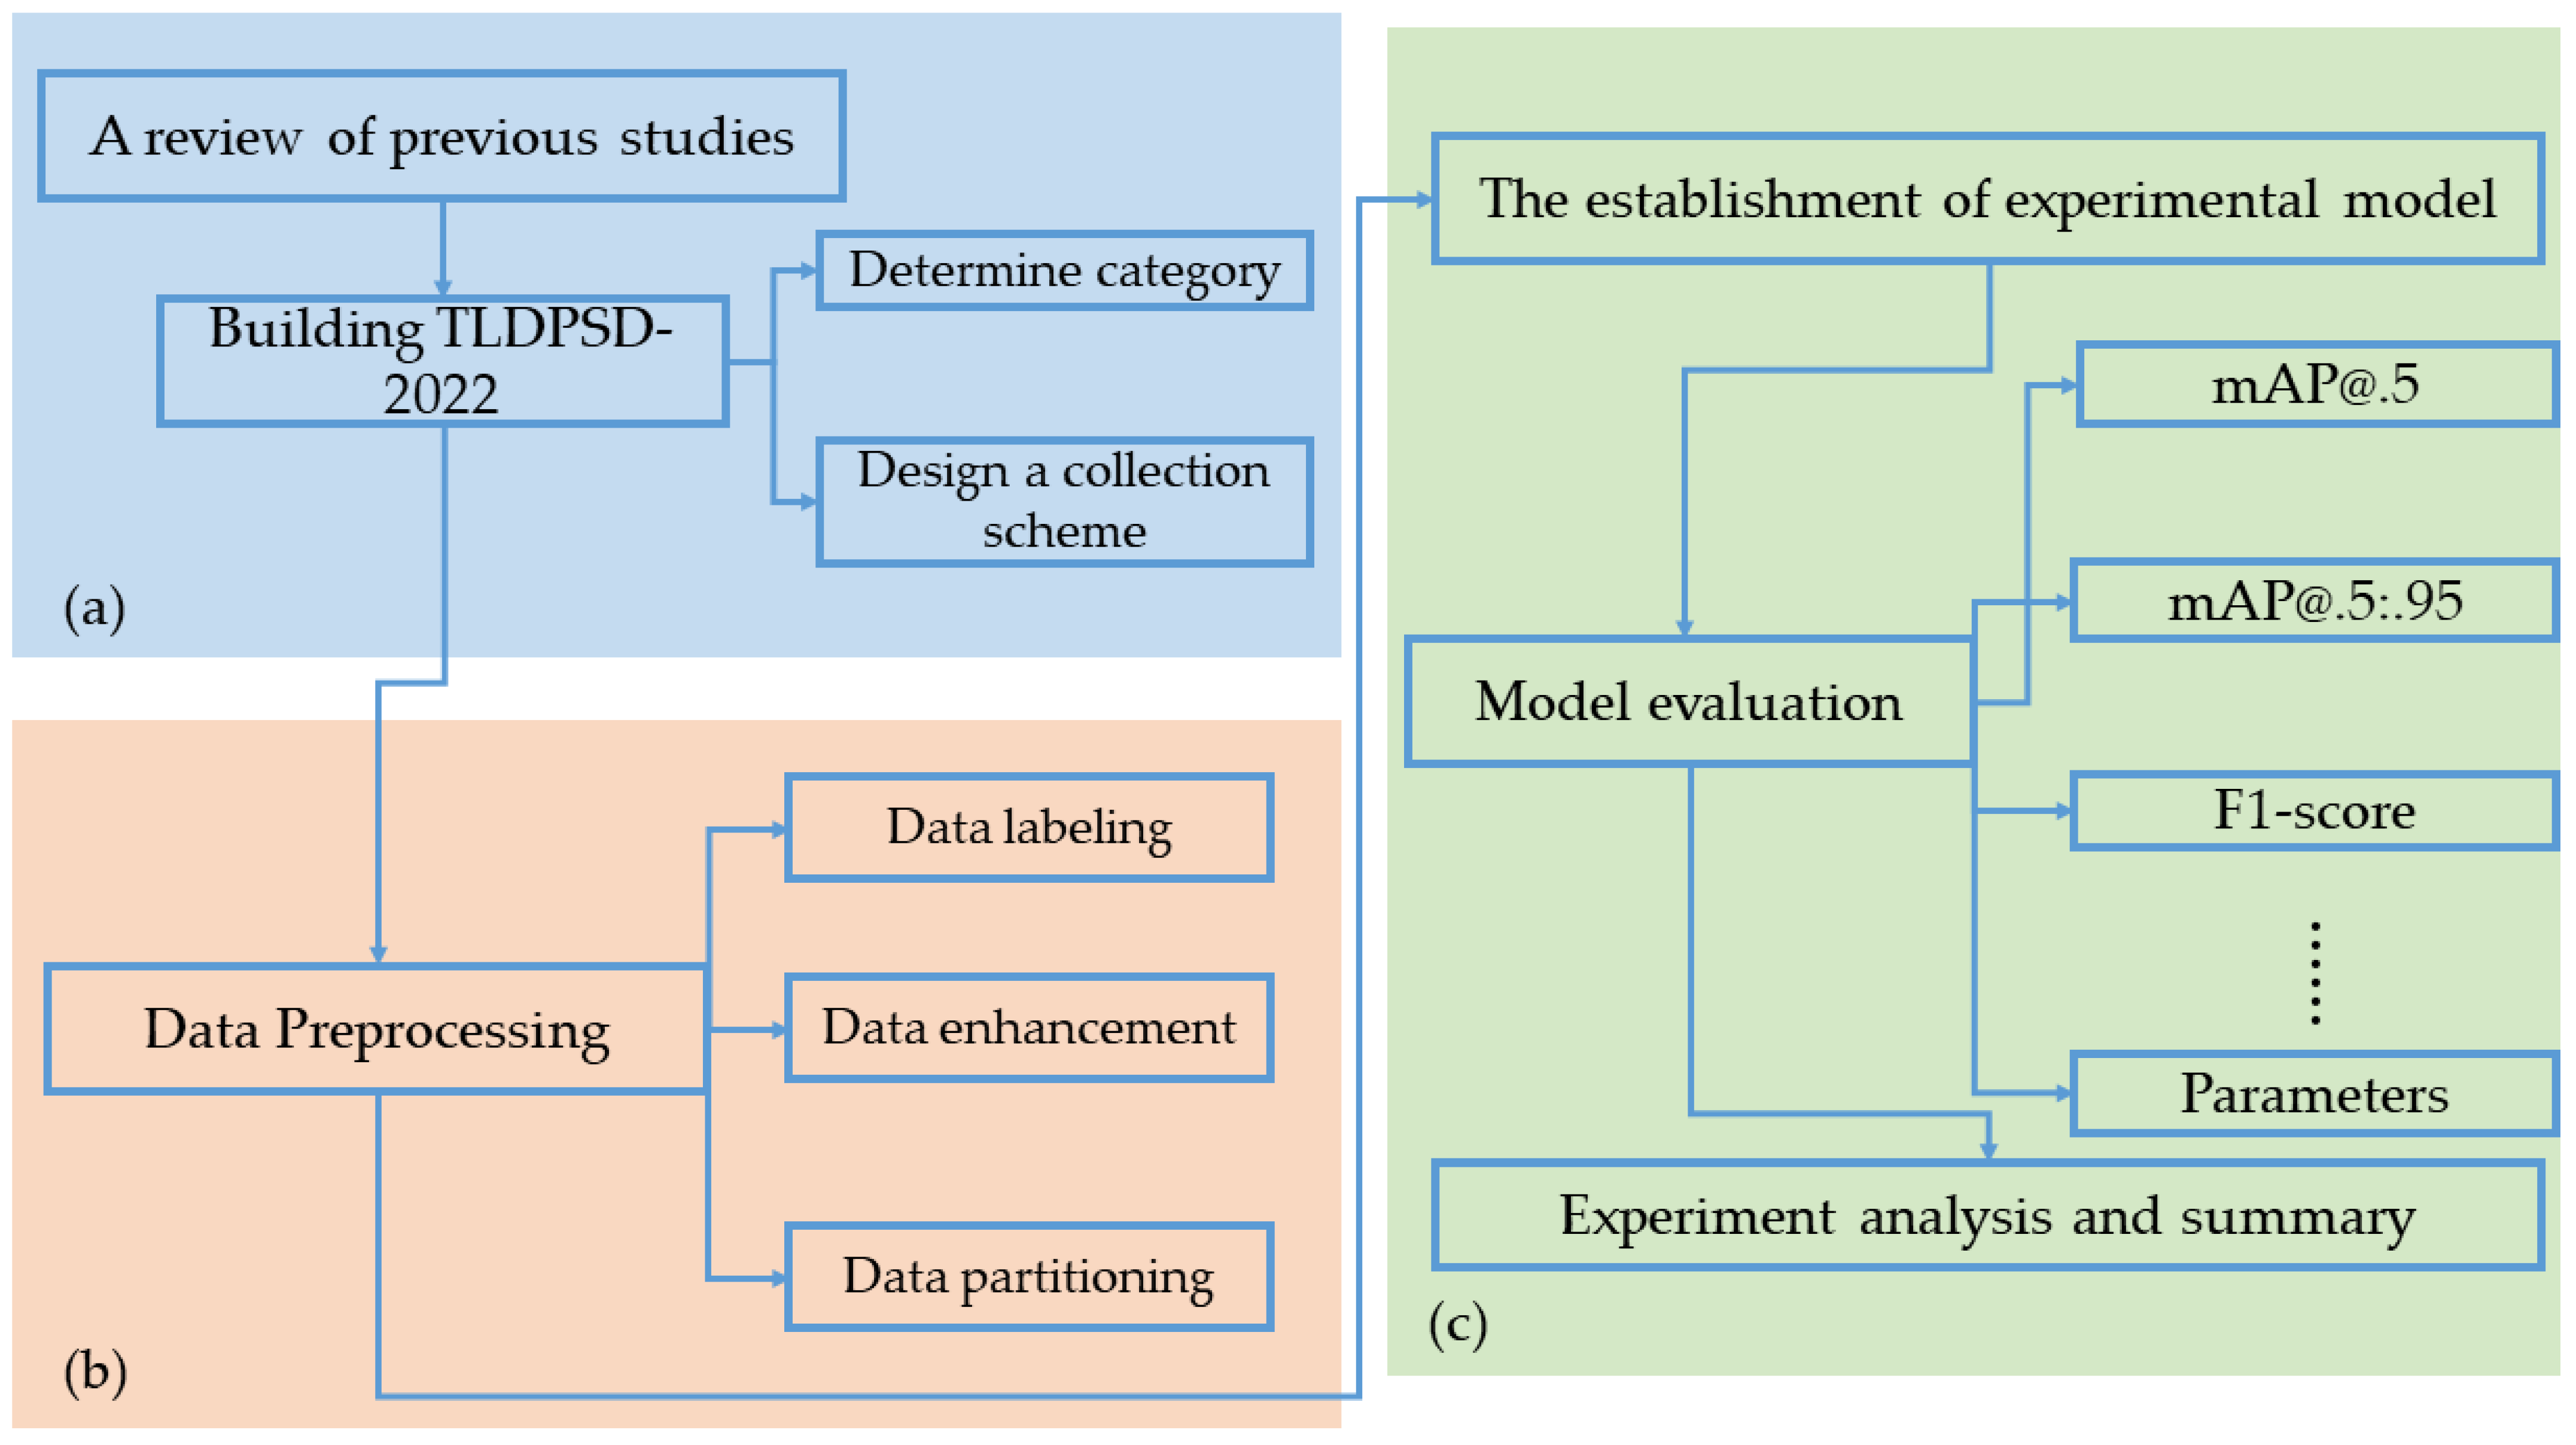
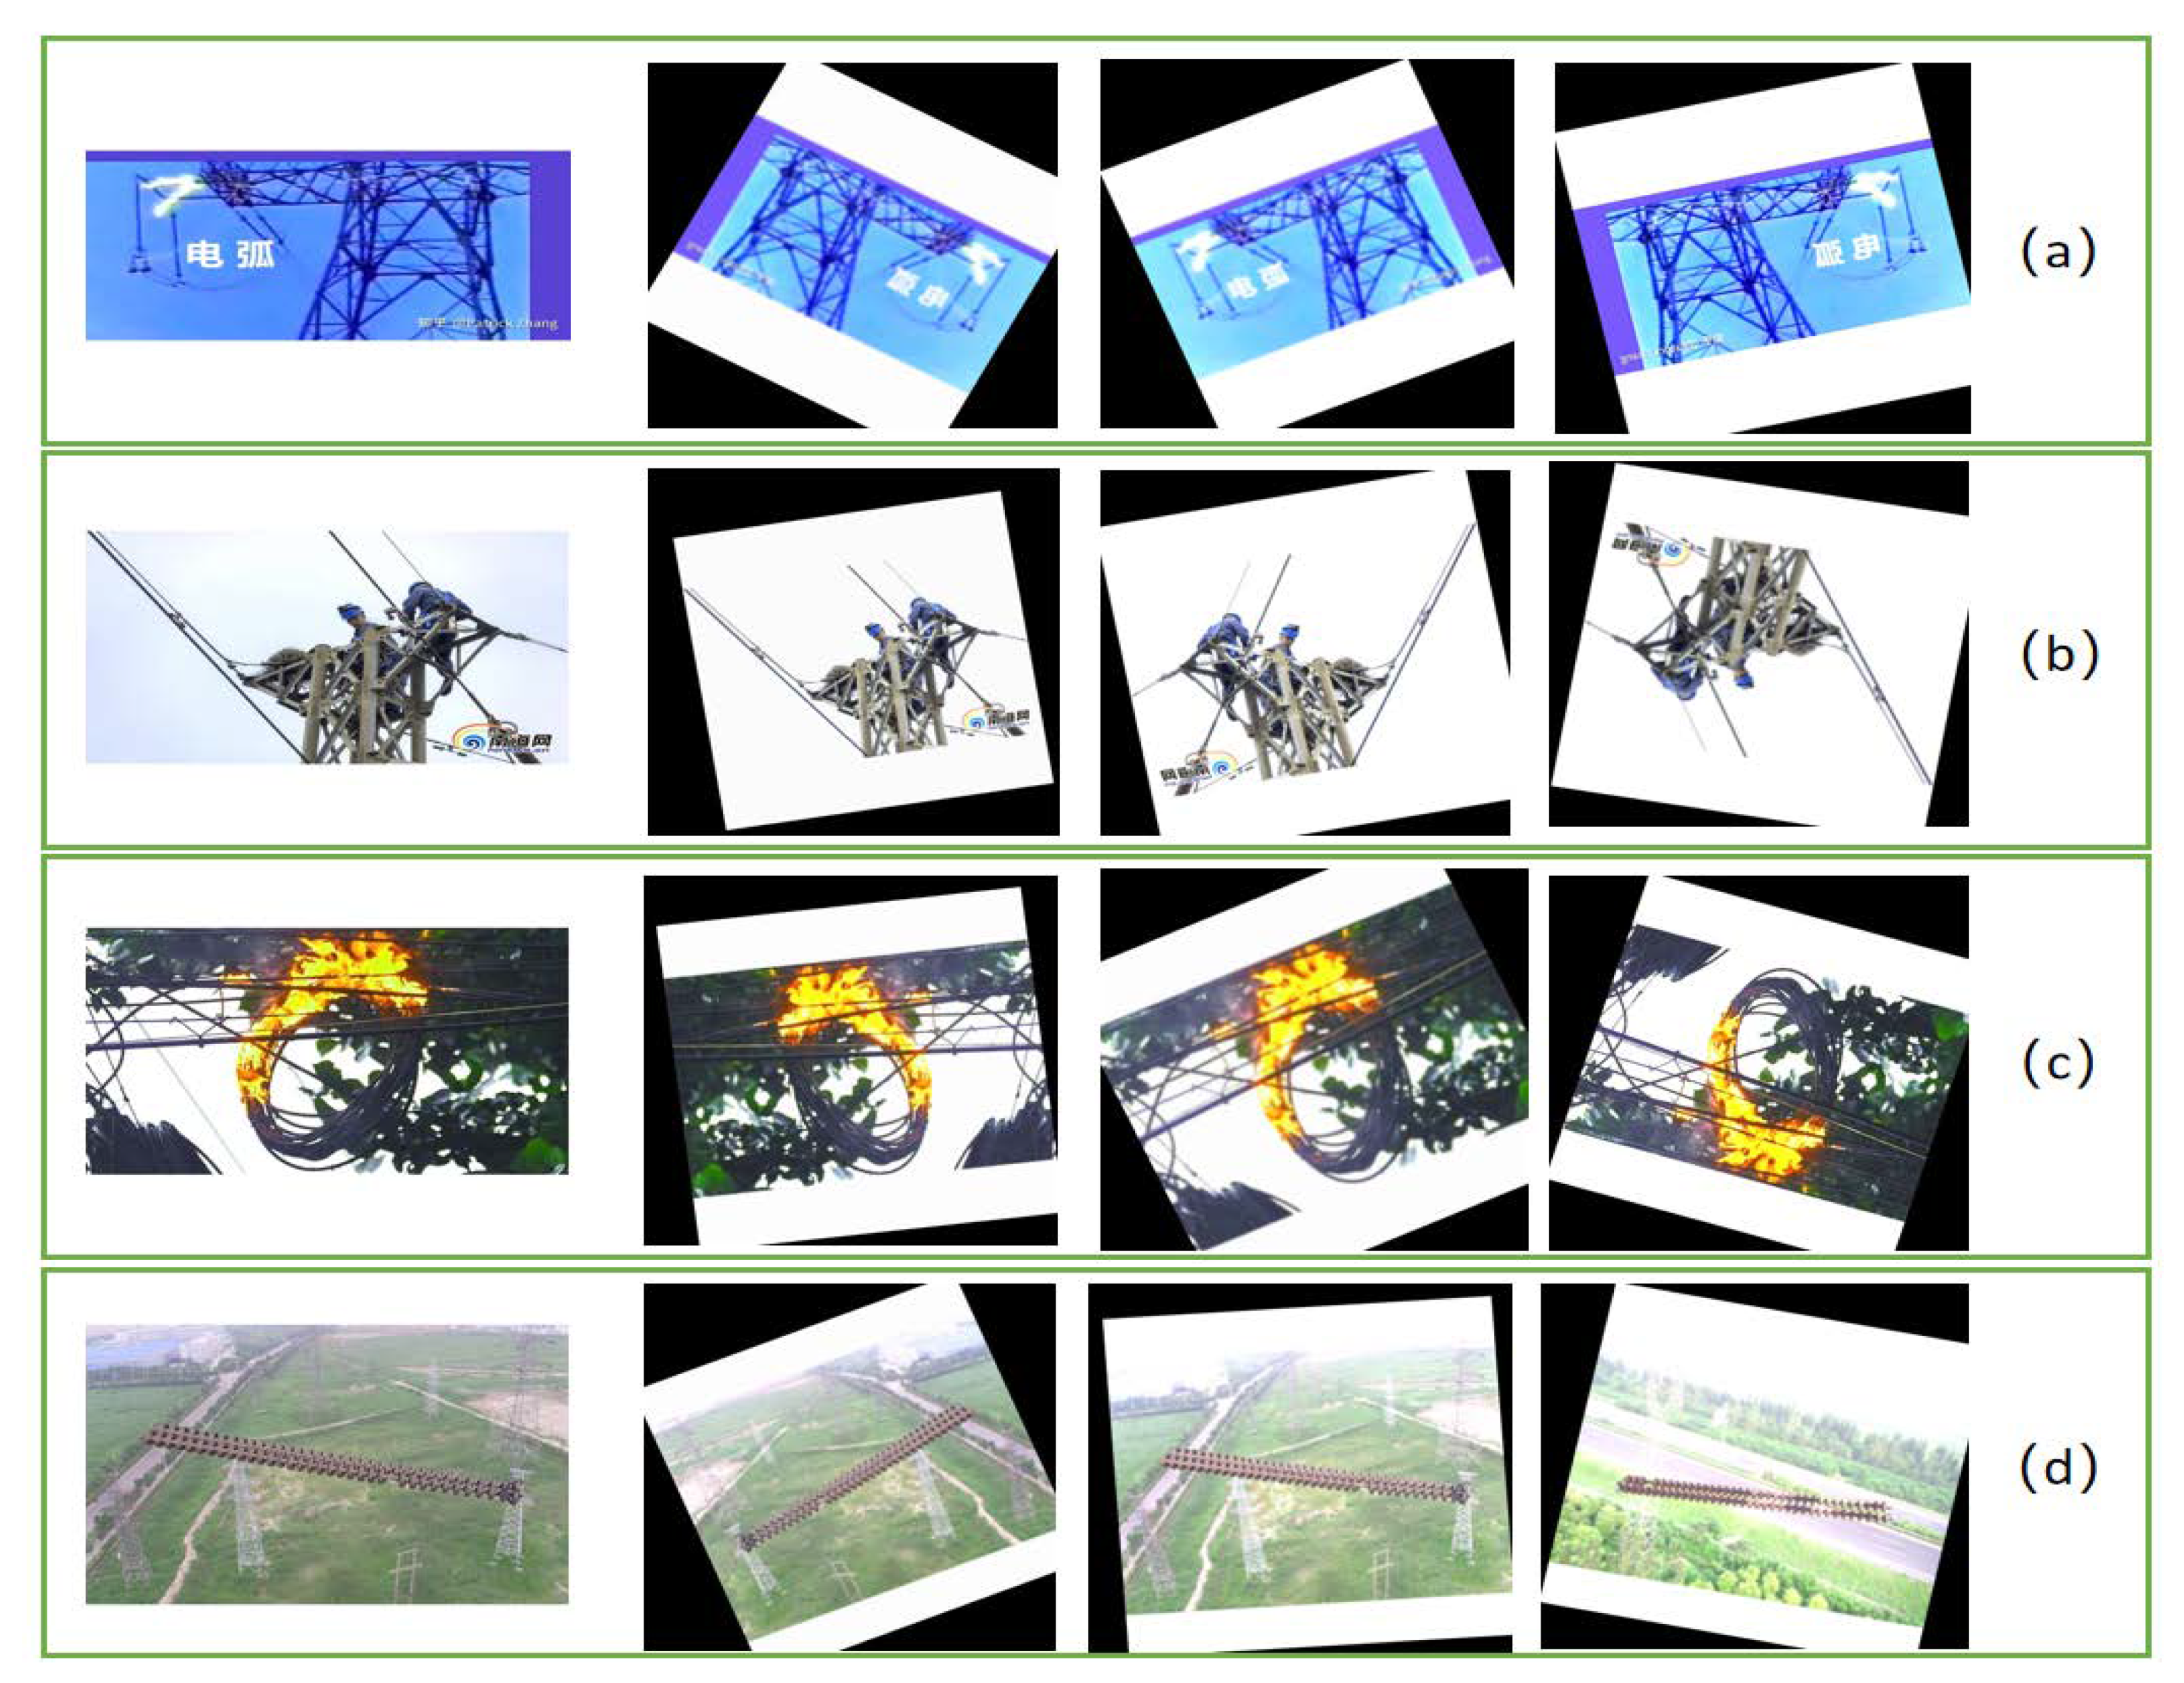
3.2. The Establishment of the Dataset

Deep learning models are data-driven, and the quality of data plays a crucial role in model building. However, most of the currently published datasets are single-type data about insulator faults in transmission lines, which have difficulty in meeting the generalization training requirements for multi-target detection in practical projects. To this end, we aim at the multi-objective and complex background requirements for model generalization in transmission line disaster prevention safety detection. The dataset required in this paper is established by taking bird’s nest, flame, arc (leakage phenomenon), and insulator defects, that is, there are similarities (such as flame and arc) and there are differences (such as insulator and bird’s nest) in feature categories as samples, and the transmission line disaster prevention safety dataset-2022 (TLDPSD-2022) is named. The purpose is to fully train and test the performance of different deep learning models in transmission line disaster prevention and safety detection, and further establish the applicability of the model establishment. This experimental dataset TLDPSD-2022 mainly uses web crawlers to crawl related images and open the insulator dataset, InsulatorDataSet-master [56,57]. After careful selection, labeling is used to mark it. The search for datasets is very time-consuming. To further improve the efficiency of data utilization, one must increase the amount of data to train the transmission line disaster prevention and safety model, and improve the generalization ability and robustness of the model. At the same time, to make the data more suitable for the input of the Model E model and make it more suitable for the size requirements of the algorithm training, we standardized the TLDPSD-2022 dataset, and scaled and filled all the dimensions to 640 × 640 pixels. A total of 1158 pieces of data are formed, and they are independently divided into the training set, validation set, and test set according to the ratio of 8:1:1. The details of the TLDPSD-2022 dataset are shown in Table 3, and its data enhancement processing data display and part of the dataset are shown in Figure 7.

3.3. Implementation Details

The learning ability of each deep network learning model in this experiment determines its performance in disaster prevention and safety detection of transmission lines. We use the same environmental conditions for the training, validation, and test sets of the TLDPSD-2022 dataset. Model E is trained and compared with the representative Model A, Model B, Model C, and Model D methods in the lightweight target detection network. The training parameters are configured as shown in Table 3.
The learning process of a single model takes about 4 h, and the loss function during the learning process expresses the learning ability of different transmission line disaster prevention and safety detection models, as shown in Figure 8. During the training process, with the continuous reduction of the loss value, the adequacy of the model learning is continuously improved, until the loss function convergence model reaches the upper limit of the transmission line disaster prevention and safety detection capability provided by the dataset. In Figure 8, Train Box Loss, Train Object Loss, and Train Class Loss represent the prediction box position, target, and confidence learning loss function of the experimental model in the training set learning; Val Box Loss, Val Object Loss, and Val Class Loss represent the prediction box position, target, and confidence of the validation loss function of the experimental model when it is validated on the validation set, respectively. Through the comparison and analysis of the loss functions of different models in Figure 8, we found that after 1000 Epochs of iterative learning, the five types of transmission line disaster prevention and safety detection models in this experiment have all been fully learned. By comparing the learning ability of the five types of models in Figure 8a, Train Box Loss, and Figure 8d, Val Box Loss, it can be found that the Model E proposed in this paper has more sufficient Box learning ability in the TLDPSD-2022 training set and validation set; by comparing the learning ability of the five types of models in Figure 8b, Train Object Loss, and Figure 8e, Val Object Loss, it can be found that the Model E proposed in this paper has a better ability to learn Objects in the TLDPSD-2022 training set and verification set; however, after 1000 Epoch iteration, the five types of models all have a certain overfitting phenomenon; in the performance of Class learning ability, the learning performance of the five types of models is consistent and sufficient, but in terms of training speed, Model B and Model E proposed in this paper achieve convergence faster. In general, from the analysis of Figure 8, the Model A model has poor learning ability and has a significant gap with other models. The Model E transmission line disaster prevention and safety detection model proposed in this paper shows excellent learning ability.

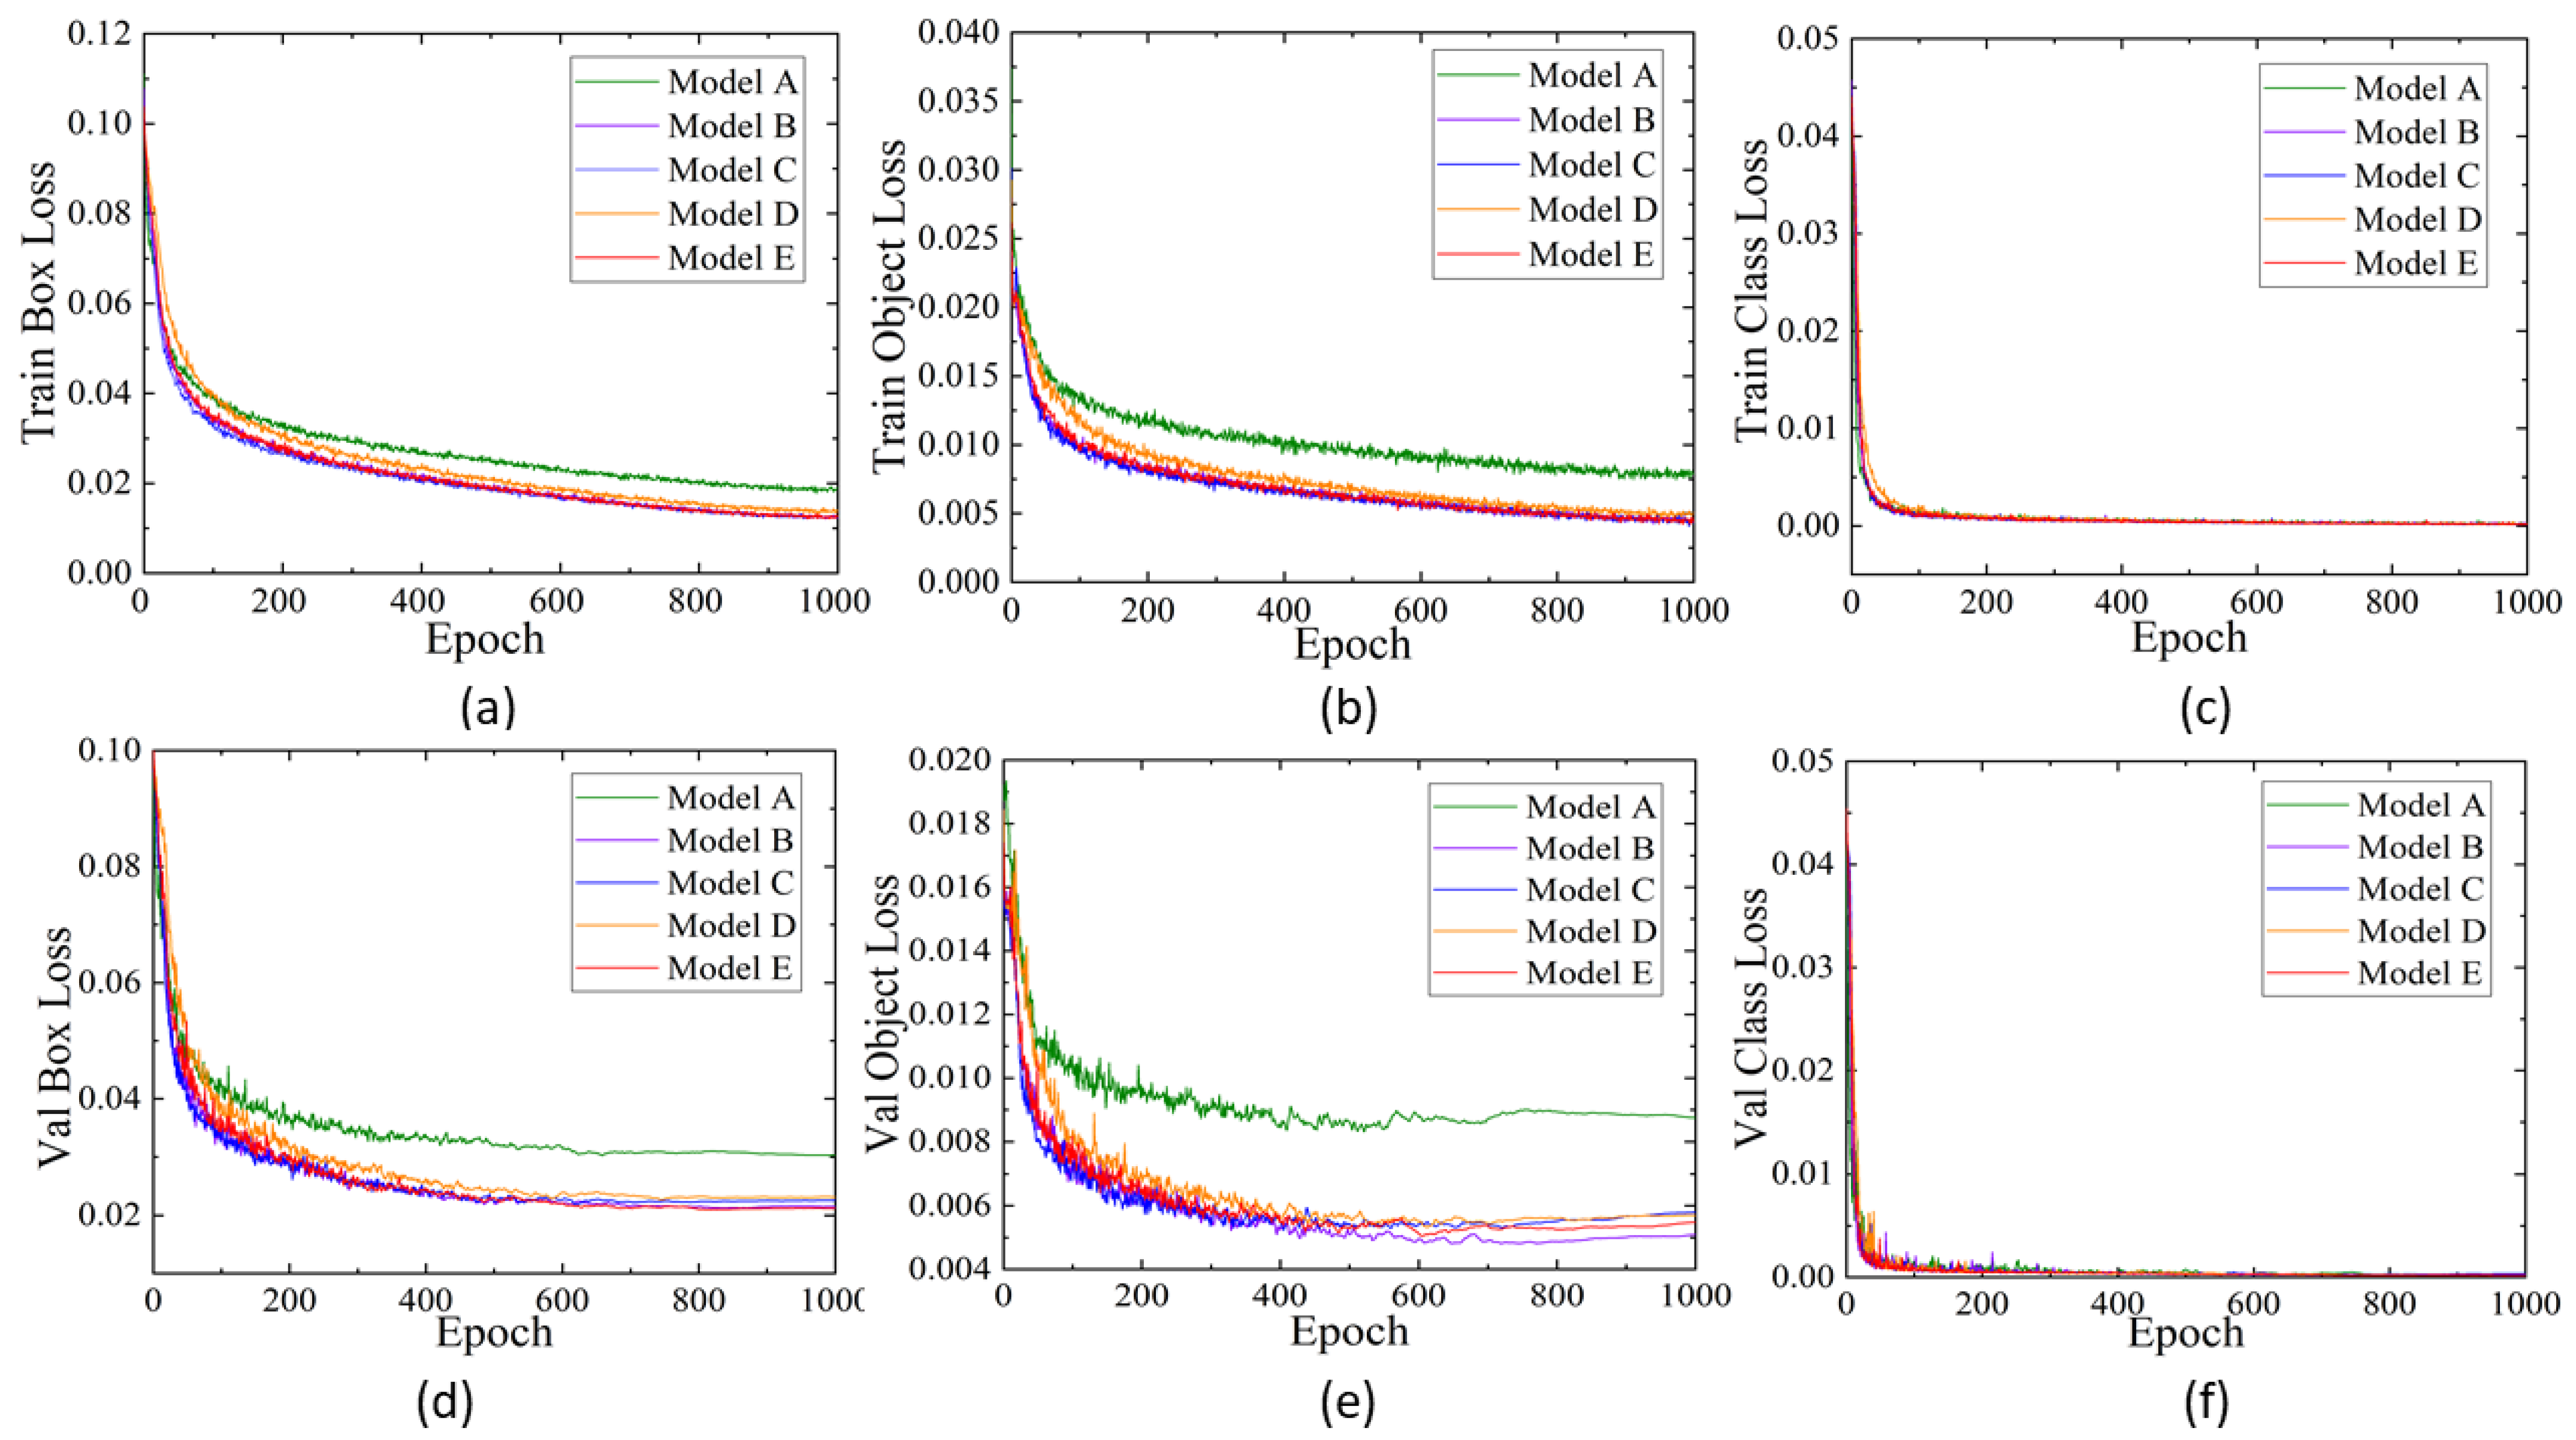
3.4. Results and Discussions

To prove the performance of the proposed method in transmission line disaster prevention and safety detection, we compare the following transmission line disaster prevention and safety detection side algorithms under the same laboratory environment and parameter settings. The models are the representative Model A, Model B network, Model C, and Model D network in the lightweight deep learning network. Model E is proposed in this paper; its network structure has been introduced in detail in the above chapters. The size of the input image to be detected in the test experiment is 640 × 640, and the batch size is 32. According to the performance results of the five types of transmission line disaster prevention safety detection models in the TLDPSD-2022 test set, we draw the PR curves and the confusion matrix of the five types of models, as shown in Figure 9. To comprehensively evaluate the advanced nature of the work proposed in this paper in disaster prevention and safety in transmission lines, we have conducted a detailed evaluation of various indicators. The detailed evaluation results are shown in Table 4.
Through the PR curve analysis of the five types of transmission line disaster prevention and safety detection models in the TLDPSD-2022 test set in Figure 9, we can intuitively find that the PR curve of the Model E transmission line disaster prevention and safety detection model proposed in this paper wraps other models, and at the same time, using the balance point F1 to judge the performance of Model E is still outstanding. Therefore, it can be concluded that the Model E deep network learning model proposed in this paper has advanced features in the disaster prevention and safety detection of transmission lines. Through the confusion matrix analysis of different algorithms in the TLDPSD-2022 test set of the five types of transmission line disaster prevention and safety detection models in Figure 8, it is found that the accuracy rate of the YOLOv3-Tiny algorithm for detection of Flam and insulator defects in the disaster prevention and safety detection of transmission lines is much lower than other models, the performance is poor, and the overall performance gap of other models is small. However, through the analysis of the confusion matrix, we can intuitively see that the above five types of transmission line disaster prevention and safety detection networks are strongly interfered with by background environmental factors in both Nest and Flame categories. For single-stage target detection algorithms, their generalization performance needs further enhancement.
To be able to comprehensively evaluate the reliability, applicability, and advancement of the Model E network proposed in this paper in practical engineering, we evaluate mAP@.5, mAP@.95, Precision, Recall, F1-score, FPS, GFLOPs, as well as the Parameters index; a comprehensive and detailed evaluation was carried out from the perspective of meeting the actual engineering needs. In mAP@.5 evaluation indicators, the Model E model proposed in this paper leads the Model A, Model B, Model C, and Model D models by 6.9%, 1.7%, 1.7%, and 2.9%, respectively. In the mAP@.5:.95 evaluation index, the Model E model proposed in this paper leads the Model A, Model B, Model C, and Model D models by 17.5%, 1.8%, 1.8%, and 5.3%, respectively. In the Presion evaluation index, the Model E model proposed in this paper is ahead of the Model A, Model B, Model C, and Model D models by 9.7%, −2.3%, −2.3%, and −2.1%. In the Recall evaluation index, the Model E model proposed in this paper is ahead of the Model A, Model B, Model C, and Model D models by 9.4%, 2.1%, 2.3%, and 3.3%, respectively. In the F1-score evaluation index, the Model E model proposed in this paper is ahead of the Model A, Model B, Model C, and Model D models by 9.5%, −0.1%, 0.3%, and 0.7%, respectively. Model B, which is relatively improved in terms of speed, is 39 frames per second faster, although slightly slower than other networks, but it can fully meet the needs of practical projects in terms of speed. In terms of the complexity of the model, we experimented on the same hardware equipment. The computing power of the Model E network proposed in this paper is only slightly inferior to that of Model C, and it is superior to or even significantly superior to other networks. In terms of Parameters, the Model E network proposed in this paper is significantly better than other networks, and its parameter sizes are 79.5%, 97.7%, 84.9%, and 93.8% of the Model A, Model B, Model C, and Model D networks. After a comprehensive assessment of the above evaluation indicators, The Model E model proposed in this paper has excellent reliability and advancement in the safety detection of power transmission line disaster prevention and has the flexibility of a UAV practical engineering application in terms of the parameter size and processing capacity of the model.
Through further analysis of the above results, the performance of the algorithm based on the Model B network in the transmission line disaster prevention and safety detection model is generally higher than that of the lightweight deep learning network algorithm Model A. By comparing the Model B network and the Model C network, we can find that the reliability of the BiFPN network in the TLDPSD-2022 dataset is more consistent, but the computing power and speed have been significantly enhanced. Due to the introduction of the BiFPN network structure in this paper, the network structure of Model E is effectively simplified by cutting out the feature transmission nodes of the redundant transmission line image, and the efficiency of the transmission line disaster prevention and safety detection model is improved; however, the number of model parameters increases to a certain extent through the addition of multiple fusion channels; when we improve all the conventional convolution operations in the Head part of the Model B network to Ghost convolution operations, we can find that the reliability performance of the Model D network in the transmission line disaster prevention and safety detection is significantly reduced, but the model size is significantly reduced. This is mainly because, in the Ghost module, redundant feature maps are generated by using a linear transformation method with a small amount of computation, and the convolution operations used are greatly reduced. However, the results show that although the Ghost convolution operation can effectively reduce the size of the model, many overly cheap calculations weaken the image feature information in the transmission line to a certain extent, resulting in the reduction of the robustness of the model [58]. Model E proposed in this paper uses an appropriate amount of Ghost modules to perform convolution operations to extract the feature information of disaster prevention and safety targets in transmission lines. In addition, one must adopt the BiFPN network structure, by cutting low-efficiency nodes and adding efficient information transmission channels, to integrate the characteristic information of disaster prevention and safety goals in transmission lines. The experimental results show that the Model E network model proposed in this paper can meet the practical engineering needs that have higher requirements on speed, cost, and reliability.
Because the erection environment of transmission lines is generally located in dense areas far away from human habitation, such as mountains and hills, it is difficult and complex to control the background environment. To a certain extent, this increases the difficulty of transmission line disaster prevention safety detection. To further comprehensively evaluate the applicability of the work proposed in this paper in transmission line disaster prevention safety detection, we have performed visual detection tests on illumination enhancement, small targets, unconventional inspection perspectives, and similar targets, and the results are shown in Figure 10. In Figure 10a, the actual target is a flame, but the five types of transmission line disaster prevention safety detection models are all identified as arcs. Although the visual images of the two are similar, the experimental results show, however, that the quality of the dataset in this experiment needs to be further improved to improve the generalization ability of the model, and it also reveals that the lightweight deep network learning model in the current experiment needs to be further strengthened in the extraction of feature information; in Figure 10b, we have selected the conditions where the target information is similar to the background information for evaluation and comparison. Model C has a false detection situation, and the detection ability of the other models is better; in Figure 10c, we select the target under the condition of enhanced illumination for detection. We can find that the Model A algorithm has poor robustness under this condition, is greatly interfered with by the illumination factor, and cannot effectively detect the target information. The Model E proposed in this paper has the highest confidence in detecting target information and is the least affected by light. Under this condition, it has strong robustness and has significant advantages in the daily inspection of transmission line disasters frequently occurring in summer in actual projects. In Figure 10d, we detect small objects, and by comparing the confidence, we find that Model A has poor robustness. However, the Model E transmission line disaster prevention safety detection model proposed in this paper has the highest confidence and shows excellent disaster prevention safety detection performance.
Through the comparison of the above evaluation results, we believe that the Model E network proposed in this paper can significantly improve the detection speed of the model and enhance the feature extraction to mine deeper feature information through the improvement of the BiFPN network structure to reduce the occurrence of false detections. By using the Ghost convolution operation, the parameter quantity of the model is further reduced, and the flexibility of the model is improved. Through EFL, the Model E network model is improved to deal with the problem of sample imbalance during training, so that the training of the model is more adequate, and the purpose is to improve the robustness of the Model E model in the safety detection of transmission line disaster prevention. To sum up, the Model E transmission line disaster prevention safety detection model proposed in this paper can meet the needs of the actual project of transmission line safety inspection that has high requirements for the complex operating environment, inspection cost, and reliability.

4. Conclusions

In this paper, an advanced lightweight deep network learning model, Model E, is proposed, which is used in the safety and inspection of transmission lines with embedded equipment on UAVs. In the work of this paper, firstly, we collect images of unsafe objects in transmission lines through public dataset extraction and web crawling. The initial dataset is formed by manual and meticulous annotation, and then the data are enhanced using illumination enhancement, position transformation, etc., to establish the TLDPSD-2022 transmission line disaster prevention and safety detection dataset required for the experiment in this paper. Given the complex background of the transmission line and the needs of the embedded model for UAV inspection, we use Ghost convolution operation to improve the feature extraction method of the conventional lightweight target detection deep network learning model and reduce the size of the model. The BiFPN network structure is used to strengthen the ability of the Model E transmission line disaster prevention safety detection model to extract the feature information of unsafe targets. In the training phase of the model, this paper adopts the EFL strategy to deal with the sample imbalance function. This was used to comprehensively evaluate the performance of the Model E model proposed in this paper in the disaster prevention and safety detection of transmission lines. We conducted a comprehensive and detailed evaluation and comparative analysis of the representative Model A network model in the field of lightweight detection, as well as Model B and Model-B-based improved models. The experimental results show that the Model E transmission line disaster prevention and safety detection model proposed in this paper shows excellent results in mAP@.5, and mAP@.5:95, Precision, Recall, F1-score, FPS, GFLOPs, and Parameters index. Meanwhile, the work presented in this paper reduces the size of the model, The parameter sizes are 79.5%, 97.7%, 84.9%, and 93.8% of those of Model A, Model B, Model C, and Model D networks, which meet the practical engineering requirements of the strongest reliability and the highest flexibility. Therefore, the Model E transmission line disaster prevention and safety detection model proposed in this paper is advanced and practical in the inspection work of transmission lines and can meet the needs of projects with higher cost and reliability requirements.
The Model E transmission line disaster prevention safety detection model proposed in this paper is more suitable for the detection of unsafe factors under the complex conditions of the actual transmission line inspection work and has good practicability and reliability. Compared with other target detection models, Model E can be more flexibly deployed in lower-cost embedded devices, and Model E has shown excellent performance in the test of transmission line disaster prevention safety detection.

Author Contributions

Conceptualization, F.D. and S.J.; methodology, software, validation, formal analysis, investigation, F.D.; resources, F.D.; data curation, writing—original draft preparation, F.D. and K.C.; writing—review and editing F.D. and K.C.; visualization, F.D.; supervision, S.J.; project administration, F.D. All authors have read and agreed to the published version of the manuscript.

Funding

This research received no external funding.

Institutional Review Board Statement

Not applicable.

Informed Consent Statement

Informed consent was obtained from all subjects involved in the study.

Data Availability Statement

The data are not publicly available, as they involve the subsequent applications for patents, software copyright, and the publication of project deliverables.

Conflicts of Interest

The authors declare no conflict of interest.

References

  1. Liu, Y.; Pei, S.; Fu, W.; Zhang, K.; Ji, X.; Yin, Z. The discrimination method as applied to a deteriorated porcelain insulator used in transmission lines on the basis of a convolution neural network. IEEE Trans. Dielectr. Electr. Insul. 2017, 24, 3559–3566. [Google Scholar] [CrossRef]
  2. Castillo, A. Risk analysis and management in power outage and restoration: A literature survey. Electr. Power Syst. Res. 2014, 107, 9–15. [Google Scholar] [CrossRef]
  3. National, T. Jordan Hit by Widespread Power Cut. The National. 21 May 2021. Available online: https://www.thenationalnews.com/mena/jordan/jordan-hit-by-widespread-power-cut-1.1227062 (accessed on 20 May 2022).
  4. Puerto Rico Outage: An Electrical Substation Fire Has Knocked Out Power to 400,000 throughout the Island—CNN. Available online: https://edition.cnn.com/2021/06/10/us/puerto-rico-substation-fire-power-outage/index.html (accessed on 20 May 2022).
  5. Tavakoli, M.; Nafar, M. Human reliability analysis in maintenance team of power transmission system protection. Prot. Control Mod. Power Syst 2020, 5, 26. [Google Scholar] [CrossRef]
  6. Bao, Y.; Wang, Y.; Huang, G.; Xia, J.; Chen, J.; Guo, C. Impact of human error on electrical equipment preventive maintenance policy. In Proceedings of the 2015 IEEE Power & Energy Society General Meeting, Denver, CO, USA, 26–30 July 2015; Institute of Electrical and Electronics Engineers: Piscataway, NJ, USA, 2015; pp. 1–5, ISBN 9781467380409. [Google Scholar]
  7. Muniappan, M. A comprehensive review of DC fault protection methods in HVDC transmission systems. Prot. Control Mod. Power Syst. 2021, 6, 1. [Google Scholar] [CrossRef]
  8. Kumar, A.; Anwar, M.N.; Kumar, S. Sliding mode controller design for frequency regulation in an interconnected power system. Prot. Control Mod. Power Syst. 2021, 6, 6. [Google Scholar] [CrossRef]
  9. Injeti, S.K.; Thunuguntla, V.K. Optimal integration of DGs into radial distribution network in the presence of plug-in electric vehicles to minimize daily active power losses and to improve the voltage profile of the system using bio-inspired optimization algorithms. Prot. Control Mod. Power Syst. 2020, 5, 3. [Google Scholar] [CrossRef] [Green Version]
  10. He, J.; Chen, K.; Li, M.; Luo, Y.; Liang, C.; Xu, Y. Review of protection and fault handling for a flexible DC grid. Prot. Control Mod. Power Syst. 2020, 5, 15. [Google Scholar] [CrossRef]
  11. Shao, G.W.; Liu, Z.; Fu, J.; Tan, J.Y.; Chen, Y.; Zhou, L.W. Research progress in unmanned aerial vehicle inspection technology on overhead transmission lines. High Volt. Eng. 2020, 46, 14–22. [Google Scholar]
  12. Wu, Y.; Zhao, G.; Hu, J.; Ouyang, Y.; Wang, S.X.; He, J.; Gao, F.; Wang, S. Overhead Transmission Line Parameter Reconstruction for UAV Inspection Based on Tunneling Magnetoresistive Sensors and Inverse Models. IEEE Trans. Power Deliv. 2019, 34, 819–827. [Google Scholar] [CrossRef]
  13. Chen, D.-Q.; Guo, X.-H.; Huang, P.; Li, F.-H. Safety Distance Analysis of 500 kV Transmission Line Tower UAV Patrol Inspection. IEEE Lett. Electromagn. Compat. Pract. Appl. 2020, 2, 124–128. [Google Scholar] [CrossRef]
  14. Zhai, Y.; Zhao, H.; Zhao, M.; Jiao, S. Design of Electric Patrol UAVs Based on a Dual Antenna System. Energies 2018, 11, 866. [Google Scholar] [CrossRef] [Green Version]
  15. Su, Z.; Qi, L.; Han, W.; Zhu, X.; Xi, X.; Wang, C.; Wang, P.; Nie, S. Danger tree detection and tree number estimation based on UAV LiDAR data. J. Univ. Chin. Acad. Sci. 2020, 37, 760. [Google Scholar]
  16. Han, S.; Yang, F.; Yang, G.; Gao, B.; Zhang, N.; Wang, D. Electrical equipment identification in infrared images based on ROI-selected CNN method. Electr. Power Syst. Res. 2020, 188, 106534. [Google Scholar] [CrossRef]
  17. Serikbay, A.; Bagheri, M.; Zollanvari, A.; Phung, B.T. Accurate Surface Condition Classification of High Voltage Insulators based on Deep Convolutional Neural Networks. IEEE Trans. Dielect. Electr. Insul. 2021, 28, 2126–2133. [Google Scholar] [CrossRef]
  18. Liu, Y.; Ji, X.; Pei, S.; Ma, Z.; Zhang, G.; Lin, Y.; Chen, Y. Research on automatic location and recognition of insulators in substation based on YOLOv3. High Volt. 2020, 5, 62–68. [Google Scholar] [CrossRef]
  19. Prates, R.M.; Cruz, R.; Marotta, A.P.; Ramos, R.P.; Simas Filho, E.F.; Cardoso, J. Insulator visual non-conformity detection in overhead power distribution lines using deep learning. Comput. Electr. Eng. 2019, 78, 343–355. [Google Scholar] [CrossRef]
  20. He, K.; Zhang, X.; Ren, S.; Sun, J. Deep Residual Learning for Image Recognition. In Proceedings of the 2016 IEEE Conference on Computer Vision and Pattern Recognition (CVPR), Las Vegas, NV, USA, 27–30 June 2016; IEEE: Piscataway, NJ, USA, 2016. [Google Scholar]
  21. Moghadas Nejad, F.; Zakeri, H. A comparison of multi-resolution methods for detection and isolation of pavement distress. Expert Syst. Appl. 2011, 38, 2857–2872. [Google Scholar] [CrossRef]
  22. Iruansi, U.; Tapamo, J.R.; Davidson, I.E. An active contour approach to insulator segmentation. In Proceedings of the AFRICON 2015, Addis Ababa, Ethiopia, 14–17 September 2015; IEEE: Piscataway, NJ, USA, 2015. [Google Scholar]
  23. Salari, E.; Bao, G. Pavement distress detection and severity analysis. In Image Processing: Machine Vision Applications IV; SPIE: Bellingham, WA, USA, 2011; pp. 107–116. [Google Scholar]
  24. Wang, X.; Zhang, Y. Insulator identification from aerial images using Support Vector Machine with background suppression. In Proceedings of the 2016 International Conference on Unmanned Aircraft Systems (ICUAS’16), Key Bridge Marriott, Arlington, VA, USA, 6 July–6 October 2016; IEEE: Piscataway, NJ, USA, 2016; pp. 892–897, ISBN 9781467393348. [Google Scholar]
  25. Zhao, W.; Cheng, X.; Zhao, Z.; Zhai, Y. Insulator recognition based on attention mechanism and Faster RCNN. CAAI Trans. Intell. Syst. 2020, 15, 92–98. [Google Scholar]
  26. He, K.; Gkioxari, G.; Dollár, P.; Girshick, R. Mask R-CNN. 2017. Available online: http://arxiv.org/pdf/1703.06870v3 (accessed on 23 May 2022).
  27. Girshick, R. Fast R-CNN. Advanced Engineering Informatics. In Proceedings of the IEEE International Conference on Computer Vision, Santiago, Chile, 7–13 December 2015. [Google Scholar]
  28. Ren, S.; He, K.; Girshick, R.; Sun, J. Faster R-CNN: Towards Real-Time Object Detection with Region. Proposal Networks. 2015. Available online: http://arxiv.org/pdf/1506.01497v3 (accessed on 23 May 2022).
  29. Zhao, Z.; Zhen, Z.; Zhang, L.; Qi, Y.; Kong, Y.; Zhang, K. Insulator Detection Method in Inspection Image Based on Improved Faster R-CNN. Energies 2019, 12, 1204. [Google Scholar] [CrossRef] [Green Version]
  30. Kang, G.; Gao, S.; Yu, L.; Zhang, D. Deep Architecture for High-Speed Railway Insulator Surface Defect Detection: Denoising Autoencoder With Multitask Learning. IEEE Trans. Instrum. Meas. 2019, 68, 2679–2690. [Google Scholar] [CrossRef]
  31. Cheng, Y.; Chen, C.; Gan, Z. Enhanced Single Shot MultiBox Detector for Pedestrian Detection. In Proceedings of the 3rd International Conference on Computer Science and Application Engineering—CSAE 2019, Sanya, China, 22–24 October 2019; Emrouznejad, A., Xu, Z., Eds.; ACM Press: New York, NY, USA, 2019; pp. 1–7, ISBN 9781450362948. [Google Scholar]
  32. Redmon, J.; Divvala, S.; Girshick, R.; Farhadi, A. You Only Look Once: Unified, Real-Time Object Detection. 2015. Available online: http://arxiv.org/pdf/1506.02640v5 (accessed on 23 May 2022).
  33. Lin, T.-Y.; Goyal, P.; Girshick, R.; He, K.; Dollár, P. Focal Loss for Dense Object Detection. 2017. Available online: http://arxiv.org/pdf/1708.02002v2 (accessed on 14 July 2022).
  34. Liu, C.; Wu, Y.; Liu, J.; Sun, Z. Improved YOLOv3 Network for Insulator Detection in Aerial Images with Diverse Background Interference. Electronics 2021, 10, 771. [Google Scholar] [CrossRef]
  35. Chen, B.; Miao, X. Distribution Line Pole Detection and Counting Based on YOLO Using UAV Inspection Line Video. J. Electr. Eng. Technol. 2020, 15, 441–448. [Google Scholar] [CrossRef]
  36. Liu, M.; Zheng, T.; Wu, J. A target detection algorithm with local space embedded attention. In Proceedings of the 2021 International Conference on Neural Networks, Information and Communication Engineering, Qingdao, China, 27–28 August 2021; Zhang, Z., Ed.; SPIE/International Society for Optical Engineering: Bellingham, WA, USA, 2021; p. 102, ISBN 9781510647374. [Google Scholar]
  37. Hong, F.; Song, J.; Meng, H.; Wang, R.; Fang, F.; Zhang, G. A novel framework on intelligent detection for module defects of PV plant combining the visible and infrared images. Sol. Energy 2022, 236, 406–416. [Google Scholar] [CrossRef]
  38. Liu, M.; Li, Z.; Li, Y.; Liu, Y. A Fast and Accurate Method of Power Line Intelligent Inspection Based on Edge Computing. IEEE Trans. Instrum. Meas. 2022, 71, 1–12. [Google Scholar] [CrossRef]
  39. Feng, Z.; Guo, L.; Huang, D.; Li, R. Electrical Insulator Defects Detection Method Based on YOLOv5. In Proceedings of the 2021 IEEE 10th Data Driven Control and Learning Systems Conference (DDCLS’21), Suzhou, China, 14–16 May 2021; Sun, M., Zhang, H., Eds.; IEEE: Piscataway, NJ, USA, 2021; pp. 979–984, ISBN 9781665424233. [Google Scholar]
  40. Li, Q.; Zhao, F.; Xu, Z.; Wang, J.; Liu, K.; Qin, L. Insulator and Damage Detection and Location Based on YOLOv5. In Proceedings of the 2022 International Conference on Power Energy Systems and Applications (ICoPESA), Singapore, 25–27 February 2022; IEEE: Piscataway, NJ, USA, 2022; pp. 17–24, ISBN 9781665410977. [Google Scholar]
  41. Xu, R.; Lin, H.; Lu, K.; Cao, L.; Liu, Y. A Forest Fire Detection System Based on Ensemble Learning. Forests 2021, 12, 217. [Google Scholar] [CrossRef]
  42. Ultralytics. Yolov5. Available online: https://github.com/ultralytics/yolov5 (accessed on 1 January 2021).
  43. Jiang, Z.; Zhao, L.; Li, S. Real-time object detection method based on improved YOLOv4-tiny. arXiv 2020, arXiv:2011.04244. [Google Scholar]
  44. GitHub. lp6m/yolov5s_android: Run yolov5s on Android Device! Available online: https://github.com/lp6m/yolov5s_android (accessed on 22 May 2022).
  45. Howard, A.G.; Zhu, M.; Chen, B.; Kalenichenko, D.; Wang, W.; Weyand, T.; Andreetto, M.; Adam, H. MobileNets: Efficient Convolutional Neural Networks for Mobile Vision Applications. arXiv 2017, arXiv:1704.04861. [Google Scholar]
  46. Ma, N.; Zhang, X.; Zheng, H.-T.; Sun, J. ShuffleNet V2: Practical Guidelines for Efficient CNN Architecture Design. In Proceedings of the Computer Vision—ECCV 2018: 15th European Conference, Munich, Germany, 8–14 September 2018; Ferrari, V., Ed.; Springer: Cham, Switzerland, 2018; pp. 122–138, ISBN 9783030012632. [Google Scholar]
  47. Han, K.; Wang, Y.; Tian, Q.; Guo, J.; Xu, C.; Xu, C. GhostNet: More Features From Cheap Operations. In Proceedings of the 2020 IEEE/CVF Conference on Computer Vision and Pattern Recognition (CVPR), Seattle, WA, USA, 13–19 June 2020; Mortensen, E., Masson-Forsythe, M., Eds.; IEEE: Piscataway, NJ, USA, 2020; pp. 1577–1586, ISBN 9781728171685. [Google Scholar]
  48. GitHub. huawei-noah/CV-Backbones: CV Backbones Including GhostNet, TinyNet and TNT, Developed by Huawei Noah’s Ark Lab. Available online: https://github.com/huawei-noah/CV-Backbones (accessed on 23 May 2022).
  49. Tan, M.; Pang, R.; Le, Q.V. EfficientDet: Scalable and Efficient Object Detection. In Proceedings of the IEEE Conference on Computer Vision and Pattern Recognition, Seattle, WA, USA, 13–19 June 2020. [Google Scholar]
  50. Du, F.-J.; Jiao, S.-J. Improvement of Lightweight Convolutional Neural Network Model Based on YOLO Algorithm and Its Research in Pavement Defect Detection. Sensors 2022, 22, 3537. [Google Scholar] [CrossRef]
  51. Liu, C.; Wu, Y.; Liu, J.; Sun, Z.; Xu, H. Insulator Faults Detection in Aerial Images from High-Voltage Transmission Lines Based on Deep Learning Model. Appl. Sci. 2021, 11, 4647. [Google Scholar] [CrossRef]
  52. GitHub. zylo117/Yet-Another-EfficientDet-Pytorch: The Pytorch Re-Implement of the Official Efficientdet with SOTA Performance in Real Time and Pretrained Weights. Available online: https://github.com/zylo117/Yet-Another-EfficientDet-Pytorch (accessed on 23 May 2022).
  53. Li, B.; Yao, Y.; Tan, J.; Zhang, G.; Yu, F.; Lu, J.; Luo, Y. Equalized Focal Loss for Dense Long-Tailed Object Detection. 2022. Available online: https://arxiv.org/pdf/2201.02593 (accessed on 23 May 2022).
  54. GitHub. ModelTC/EOD: Easy and Efficient Object Detector. Available online: https://github.com/ModelTC/EOD (accessed on 23 May 2022).
  55. Read, P.; Meyer, M.-P. Restoration of Motion Picture Film; Butterworth-Heinemann: Oxford, UK, 2000; ISBN 075062793X. [Google Scholar]
  56. Tao, X.; Zhang, D.; Wang, Z.; Liu, X.; Zhang, H.; Xu, D. Detection of Power Line Insulator Defects Using Aerial Images Analyzed With Convolutional Neural Networks. IEEE Trans. Syst. Man Cybern. Syst. 2020, 50, 1486–1498. [Google Scholar] [CrossRef]
  57. GitHub. InsulatorData/InsulatorDataSet: Provide Normal Insulator Images Captured by UAVs and Synthetic Defective Insulator Images. Available online: https://github.com/InsulatorData/InsulatorDataSet (accessed on 24 May 2022).
  58. Cheng, L.; Li, J.; Duan, P.; Wang, M. A small attentional YOLO model for landslide detection from satellite remote sensing images. Landslides 2021, 18, 2751–2765. [Google Scholar] [CrossRef]
Figure 1. Model E network structure. (The structure is divided into four parts, namely anchors, backbone, head, and detect parts, and the depth of the network is depth_multiple: 0.33, width_multiple: 0.50).
Machines 10 00588 g001
Figure 2. Schematic diagram of each module structure in the Model E network structure. (a) Conv module structure diagram; (b) Bottleneck module structure diagram; (c) C3 module structure diagram; (d) Focus module structure diagram; (e) SPP module structure diagram (Concat_B is an improved BiFPN module structure, Ghost-Conv is an improved Ghost convolution operation, and conv is a conventional convolution operation. The specific improvement methods are described in detail in the following two sections.).
Machines 10 00588 g002
Figure 3. Schematic diagram of the structure comparison between the conventional convolution operation and the Ghost convolution operation. (a) Conventional convolution operation; (b) Ghost convolution operation.
Machines 10 00588 g003
Figure 4. Schematic diagram of the comparison of PANet and BiFPN network structures. (a) PANet network structure; (b) BiFPN network structure (the convolution method in the Model E network structure is subject to the configuration in Table 2).
Machines 10 00588 g004
Figure 5. Comparison of feature extraction between the work in this paper and the original network structure. (a) Layer 7 feature extraction map after conventional convolution operation; (b) Model B network feature extraction structure display map; (c) Layer 7 feature extraction map after Ghost convolution operation; (d) feature extraction structure display diagram of Model E network.
Machines 10 00588 g005
Figure 6. Experimental flow chart of this paper. (a) Preparatory work, (b) mid-term experiment, (c) post-assessment analysis and summary.
Machines 10 00588 g006
Figure 7. Partial image display of TLDPSD-2022 dataset; (a) arc phenomenon, (b) bird’s nest, (c) fire, (d) insulator breakage defect.
Machines 10 00588 g007
Figure 8. The learned loss functions of different models in the TLDPSD-2022 training set. (a) Train Box loss; (b) Train Object loss; (c) Train Class loss; (d) Val Box Loss; (e) Val Object Loss; (f) Val Class Loss.
Machines 10 00588 g008
Figure 9. The PR curve and confusion matrix performance results of five types of transmission line disaster prevention safety detection models in the TLDPSD-2022 test set. (a) Comparison of PR curves; (b) confusion matrix of Model A; (c) confusion matrix of YOLOv5; (d) confusion matrix of Model C; (e) confusion matrix of Model D; (f) confusion matrix of Model E.
Machines 10 00588 g009
Figure 10. The test performance results of the experimental model in this paper are under different complex conditions. (a) under the condition that the target features are very similar; (b) under the condition of similar background features; (c) under the condition of enhanced illumination and price adjustment; (d) under the condition of a small target.
Machines 10 00588 g010
Table 1. Configuration table of Model E transmission line disaster prevention and safety detection model (from = −1 represents the current module connected to the previous module, the number represents the number of the current module, the module represents the type of the current module, and Argus represents the parameters of the current module).
BackboneHead
FromNumberModuleArgsFromNumberModuleArgs
−11Focus64, 3−11GhostConv512, 1, 1
−11Conv128, 3, 2−11UpsampleNone, 2, nearest
−13C3128−16Concat_B256, 256
−11Conv256, 3, 2−13C3512, False
−19C3256−11Conv256, 1, 1
−11Conv512, 3, 2−11UpsampleNone, 2, nearest
−19C3512−14Concat_B128, 128
−11GhostConv1024, 3, 2−13C3256, False
−11SPP5, 9, 13−11Conv512, 3, 2
−13C31024, False−16, 13Concat_B256, 256
−13C3512, False
−11GhostConv1024, 3, 2
−19Concat_B512, 512
−13C31024, False
Table 2. Laboratory environmental conditions established by the Model E model.
NameCPUGPUSystemFrameworkAccelerator
DispositionIntel(R) Xeon(R) Gold 5218GeForce RTX 2080 Ti/11GBubuntu18.04pytorch1.7.0CUDA10.2
cuDNN7
Table 3. Configuration table of learning parameters of the experimental model in this paper.
NameEpochLearning Stylelr0lrf
Disposition1000Cosine annealing0.0010.2
Table 4. Evaluation results of different transmission line disaster prevention and safety detection models in the test set in the experiments of this paper.
Evaluate MetricsModel AModel BModel CModel DModel E
mAP@.50.9040.9560.9560.9440.973
mAP@.5:.950.5440.7010.7010.6660.719
Presion0.8640.9840.9840.9820.961
Recall0.8770.950.9430.9380.971
F1-score0.8710.9670.9630.9590.966
FPS179133185185172
GFLOPs12.916.417.715.916.7
Parameters8,673,6227,062,0018,128,2567,357,1576,899,333
Publisher’s Note: MDPI stays neutral with regard to jurisdictional claims in published maps and institutional affiliations.

