
Experimental Study and Numerical Analysis of the Tensile Behavior of 3D Woven Ceramic Composites

Abstract
:1. Introduction
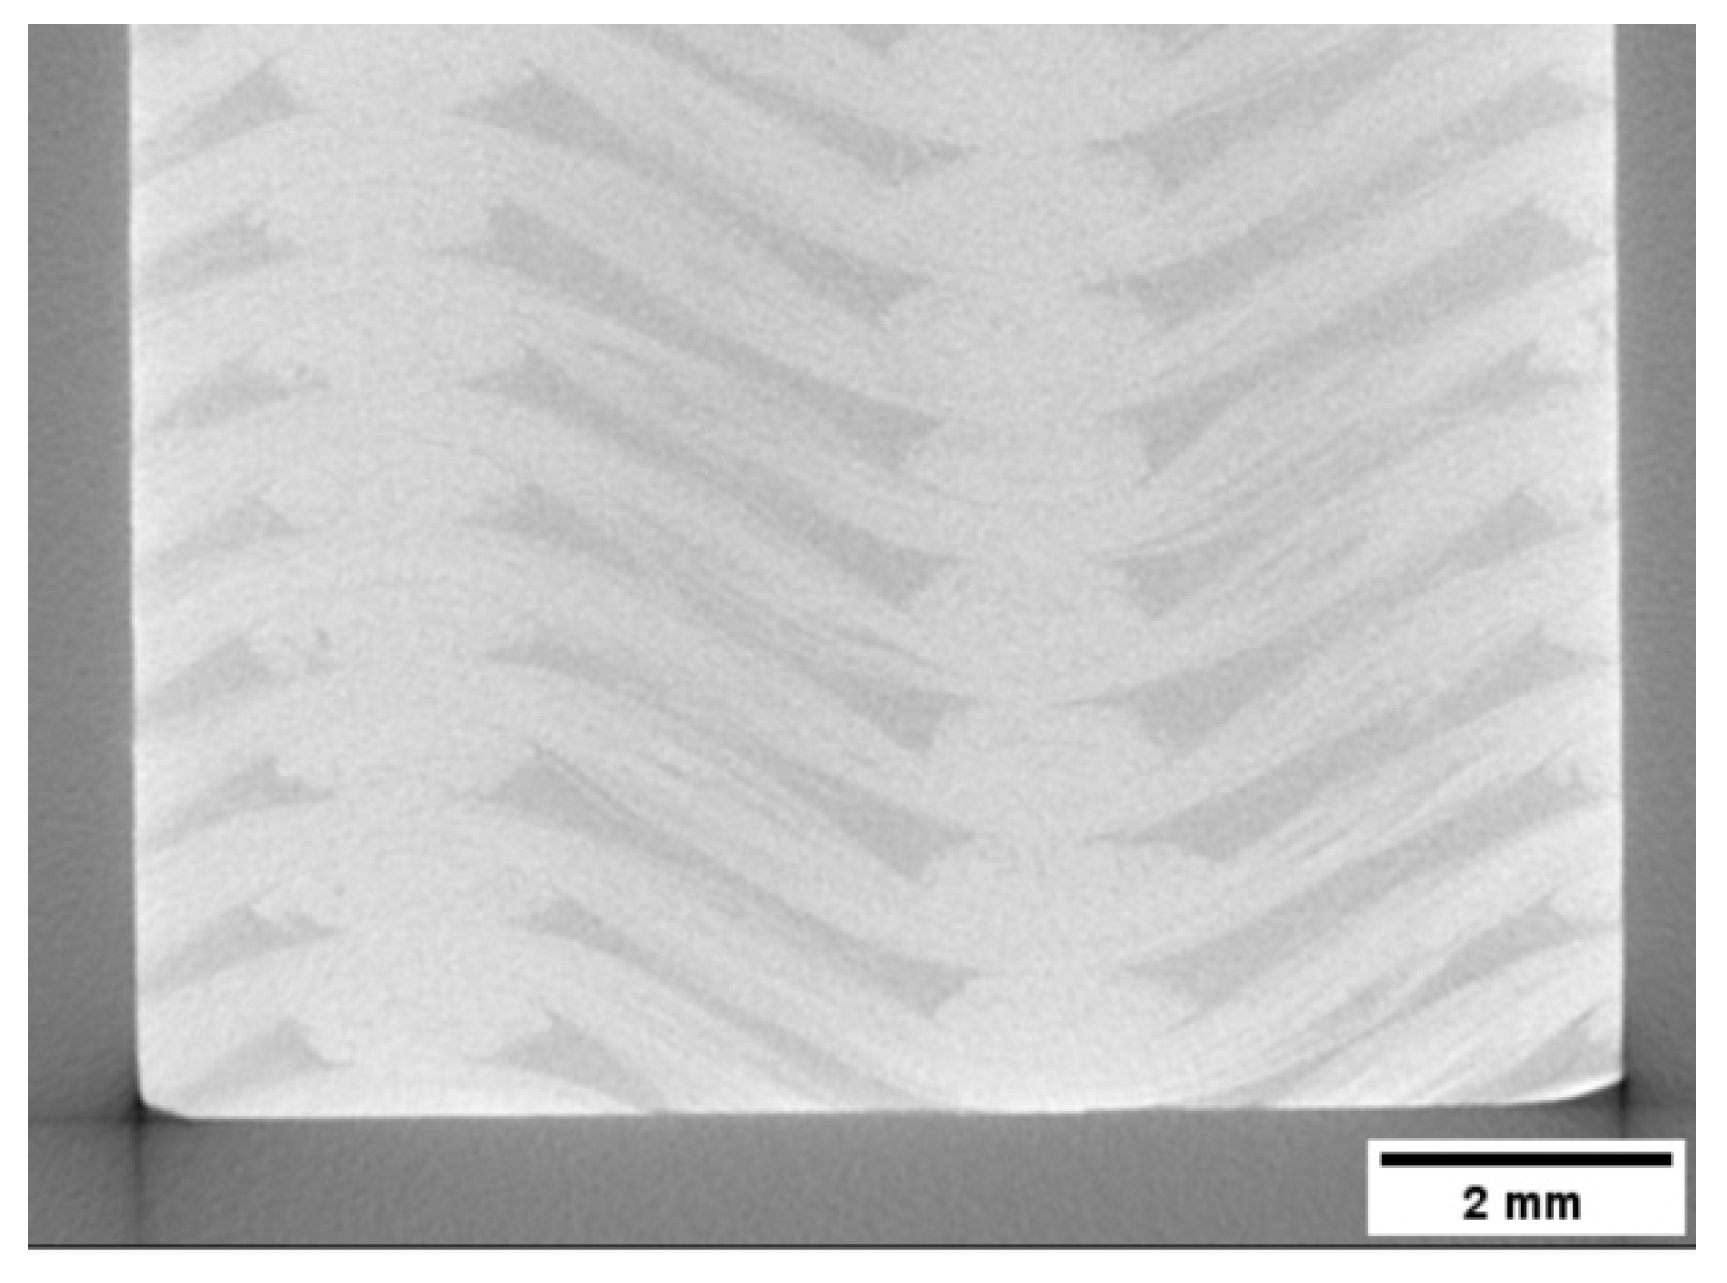
2. Materials, Manufacture and Testing
3. Finite Element Modelling
3.1. Geometric Modelling
3.2. Boundary Conditions
3.3. Material Properties
3.4. Damage Model
4. Results and Discussion
5. Conclusions
Author Contributions
Funding
Data Availability Statement
Conflicts of Interest
Appendix A


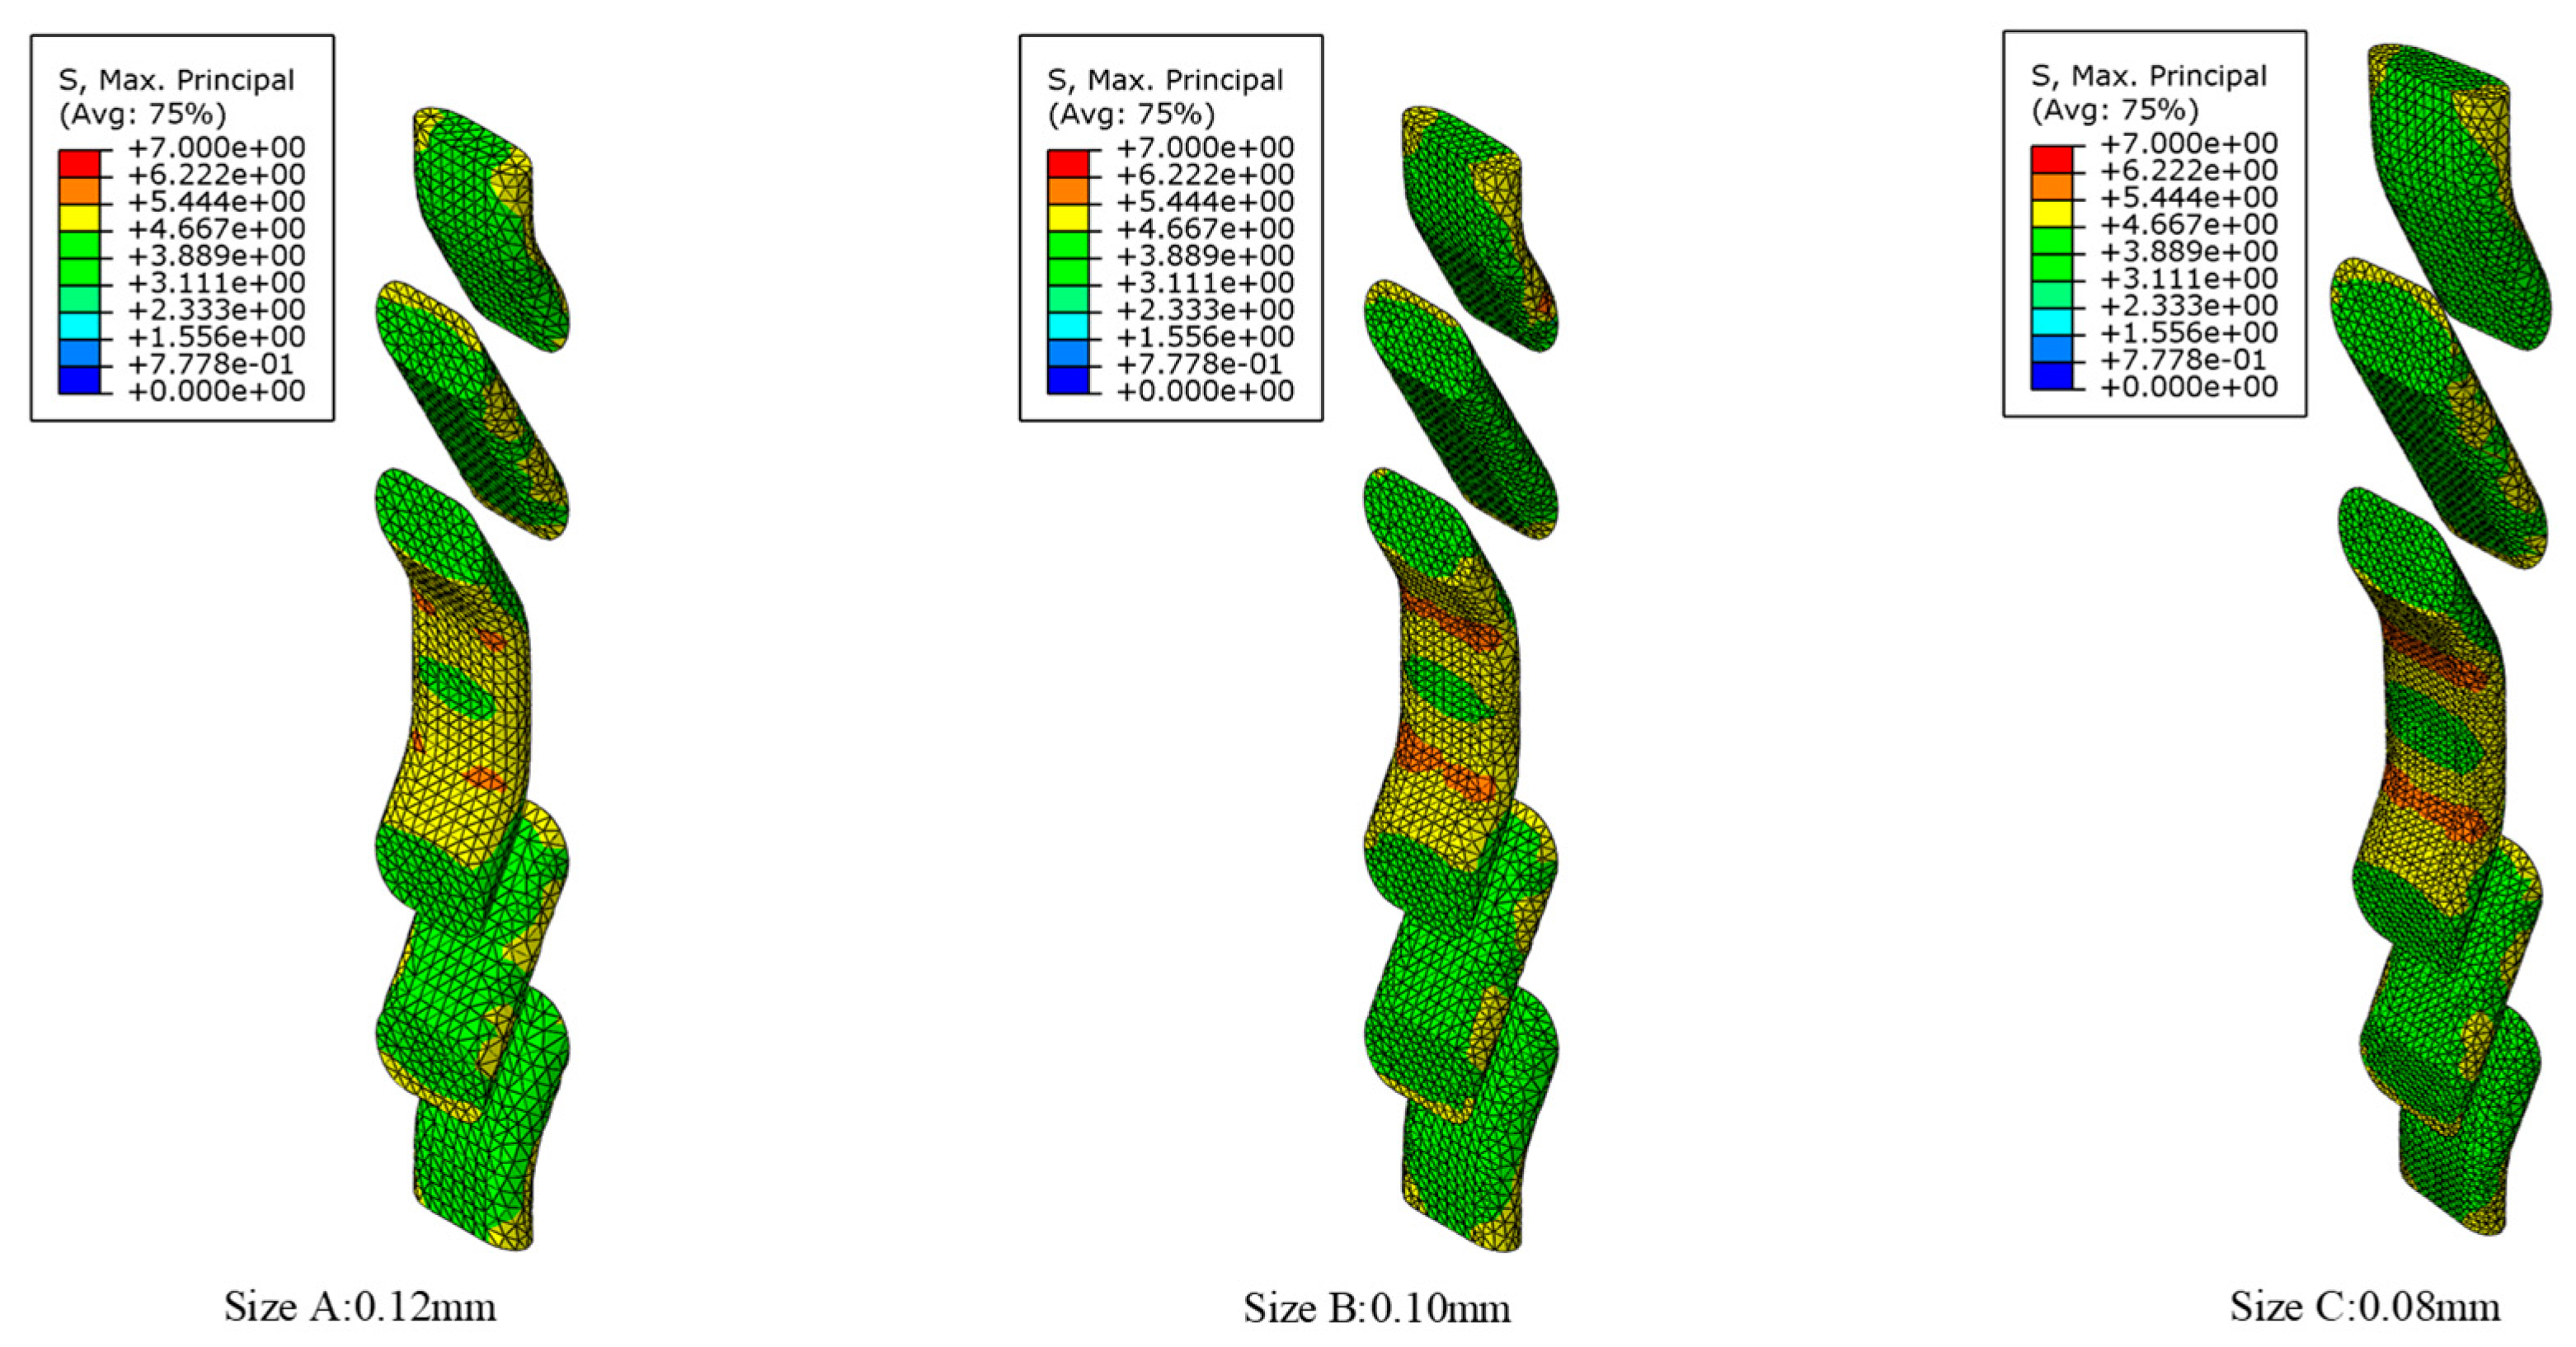
| Mesh Size | Total Number of Nodes | Stiffness |
|---|---|---|
| 0.12 mm | 12,882 | 14.38 GPa |
| 0.10 mm | 20,571 | 14.54 GPa |
| 0.08 mm | 34,250 | 14.40 GPa |

References
- Kandi, K.K.; Thallapalli, N.; Chilakalapalli, S.P.R. Development of silicon nitride-based ceramic radomes—A review. Int. J. Appl. Ceram. Technol. 2015, 12, 909–920. [Google Scholar] [CrossRef]
- Mahmoudi, M.; Wang, C.; Moreno, S.; Burlison, S.R.; Alatalo, D.; Hassanipour, F.; Smith, S.E.; Naraghi, M.; Minary-Jolandan, M. Three-dimensional printing of ceramics through “carving” a gel and “filling in” the precursor polymer. ACS Appl Mater. Interfaces 2020, 12, 31984–31991. [Google Scholar] [CrossRef] [PubMed]
- Miao, X.G.; Qu, Y.R.; Ghezzo, F.; Fang, X.W.; Yue, Y.T.; Zhao, Z.Y.; Liu, R.P. Fused silica ceramics and composites for radome applications. Adv. Mater. Res. 2014, 900, 123–129. [Google Scholar] [CrossRef]
- Xu, C.-M.; Wang, S.; Huang, X.; Guo, J. Processing and properties of unidirectional SiO2f/SiO2 composites. Ceram. Int. 2007, 33, 669–673. [Google Scholar] [CrossRef]
- Liu, Y.; Zhu, J.; Chen, Z.; Jiang, Y.; Li, C.; Li, B.; Lin, L.; Guan, T.; Chen, Z. Mechanical properties and microstructure of 2.5D (shallow straight-joint) quartz fibers-reinforced silica composites by silicasol-infiltration-sintering. Ceram. Int. 2012, 38, 795–800. [Google Scholar] [CrossRef]
- Shi, D.; Liu, C.; Cheng, Z.; Li, Z.; Yang, X.; Chen, H. On the tensile behaviors of 2D twill woven SiO2f/SiO2 composites at ambient and elevated temperatures: Mesoscale analysis and in situ experimental investigation. Ceram. Int. 2021, 47, 12680–12694. [Google Scholar] [CrossRef]
- Liu, Y.; Zhu, J.; Chen, Z.; Jiang, Y. Mechanical behavior of 2.5 D (shallow straight-joint) and 3D four-directional braided SiO2f/SiO2 composites. Ceram. Int. 2012, 38, 4245–4251. [Google Scholar] [CrossRef]
- Li, C.; Chen, Z.; Zhu, J.; Liu, Y.; Jiang, Y.; Guan, T.; Li, B.; Lin, L. Mechanical properties and microstructure of 3D orthogonal quartz fiber reinforced silica composites fabricated by silicasol-infiltration-sintering. Mater. Des. 2012, 36, 289–295. [Google Scholar] [CrossRef]
- Liu, Y.; Chen, Z.; Zhu, J.; Jiang, Y.; Li, B.; Boafo, F.E. Comparison of 3D four-directional and five-directional braided SiO2f/SiO2 composites with respect to mechanical properties and fracture behavior. Mater. Sci. Eng. A 2012, 558, 170–174. [Google Scholar] [CrossRef]
- Aiman, D.; Yahya, M.; Salleh, J. Impact properties of 2D and 3D woven composites: A review. AIP Conf. Proc. 2016, 1774, 020002. [Google Scholar]
- Zou, X.; Yan, S.; Matveev, M.; Rouse, J.P.; Jones, I.A. Experimental and numerical investigation of interface damage in composite L-angle sections under four-point bending. J. Compos. Mater. 2020, 55, 187–200. [Google Scholar] [CrossRef]
- Hung, W.-C.; Horng, R.S.; Shia, R.-E. Investigation of thermal insulation performance of glass/carbon fiber-reinforced silica aerogel composites. J. Sol-Gel Sci. Technol. 2021, 97, 414–421. [Google Scholar] [CrossRef]
- Yan, S.; Zeng, X.; Long, A. Effect of fibre architecture on tensile pull-off behaviour of 3D woven composite T-joints. Compos. Struct. 2020, 242, 112194. [Google Scholar] [CrossRef]
- Yan, S.; Zeng, X.; Long, A. Experimental assessment of the mechanical behaviour of 3D woven composite T-joints. Compos. Part B Eng. 2018, 154, 108–113. [Google Scholar] [CrossRef] [Green Version]
- Kaddour, A.S.; Hinton, M.J. Maturity of 3D failure criteria for fibre-reinforced composites: Comparison between theories and experiments: Part B of WWFE-II. J. Compos. Mater. 2013, 47, 925–966. [Google Scholar] [CrossRef]
- Christensen, R.M. Failure criteria for fiber composite materials, the astonishing sixty year search, definitive usable results. Compos. Sci. Technol. 2019, 182, 107718. [Google Scholar] [CrossRef]
- Ritman, E.L. Current status of developments and applications of micro-CT. Annu. Rev. Biomed. Eng. 2011, 13, 531–552. [Google Scholar] [CrossRef]
- Zhang, W.; Yan, S.; Yan, Y.; Li, Y. A parameterized unit cell model for 3D braided composites considering transverse braiding angle variation. J. Compos. Mater. 2022, 56, 491–505. [Google Scholar] [CrossRef]
- Lin, H.; Brown, L.P.; Long, A.C. Modelling and simulating textile structures using TexGen. Adv. Mater. Res. 2011, 331, 44–47. [Google Scholar] [CrossRef]
- Tay, T.; Liu, G.; Tan, V.; Sun, X.; Pham, D. Progressive failure analysis of composites. J. Compos. Mater. 2008, 42, 1921–1966. [Google Scholar] [CrossRef]
- Li, Y.; Yan, S.; Yan, Y.; Zhang, W. Modelling of the compressive behavior of 3D braided tubular composites by a novel unit cell. Compos. Struct. 2022, 287, 115303. [Google Scholar] [CrossRef]
- Yan, S.; Zeng, X.; Long, A. Meso-scale modelling of 3D woven composite T-joints with weave variations. Compos. Sci. Technol. 2019, 171, 171–179. [Google Scholar] [CrossRef]
- Llorca, J.; González, C.; Molina-Aldareguía, J.M.; Segurado, J.; Seltzer, R.; Sket, F.; Rodríguez, M.; Sádaba, S.; Muñoz, R.; Canal, L.P. Multiscale modeling of composite materials: A roadmap towards virtual testing. Adv. Mater. 2011, 23, 5130–5147. [Google Scholar] [CrossRef] [PubMed]
- Lapczyk, I.; Hurtado, J.A. Progressive damage modeling in fiber-reinforced materials. Compos. Part A Appl. Sci. Manuf. 2007, 38, 2333–2341. [Google Scholar] [CrossRef]
- Nobeen, N.S.; Zhong, Y.; Francis, B.A.P.; Ji, X.; Chia, E.S.M.; Joshi, S.C.; Chen, Z. Constituent materials micro-damage modeling in predicting progressive failure of braided fiber composites. Compos. Struct. 2016, 145, 194–202. [Google Scholar] [CrossRef]
- Hinton, M.; Kaddour, A.; Pinho, S.; Vyas, G.; Robinson, P.; Huang, Z.; Zhou, Y.; Rotem, A.; Carrere, N.; Laurin, F. Special Issue: The Second World-Wide Failure Exercise (WWFE-II): Part B: Evaluation of Theories for Predicting Failure in Polymer Composite Laminates Under 3-D States of Stress; Comparison with Experiments Preface; Sage Publications Ltd.: London, UK, 2013. [Google Scholar]
- Isart, N.; El Said, B.; Ivanov, D.; Hallett, S.; Mayugo, J.; Blanco, N. Internal geometric modelling of 3D woven composites: A comparison between different approaches. Compos. Struct. 2015, 132, 1219–1230. [Google Scholar] [CrossRef]
- Green, S.D.; Matveev, M.Y.; Long, A.C.; Ivanov, D.; Hallett, S.R. Mechanical modelling of 3D woven composites considering realistic unit cell geometry. Compos. Struct. 2014, 118, 284–293. [Google Scholar] [CrossRef] [Green Version]
- Yan, S.; Zeng, X.; Brown, L.; Long, A. Geometric modeling of 3D woven preforms in composite T-joints. Text. Res. J. 2018, 88, 1862–1875. [Google Scholar] [CrossRef] [Green Version]
- Li, S.; Sitnikova, E. An Excursion into Representative Volume Elements and Unit Cells; Elsevier: Amsterdam, The Netherlands, 2017. [Google Scholar]
- Chamis, C.C. Simplified Composite Micromechanics Equations for Hygral, Thermal and Mechanical Properties. In Proceedings of the 38th Annual Conference of the Society of the Plastics Industry Reinforced Plastics/Composites, Houston, TX, USA, 7–11 February 1983. [Google Scholar]
- Tsai, S.W.; Wu, E.M. A general theory of strength for anisotropic materials. J. Compos. Mater. 1971, 5, 58–80. [Google Scholar] [CrossRef]
- Li, S.; Sitnikova, E.; Liang, Y.; Kaddour, A.-S. The Tsai-Wu failure criterion rationalised in the context of UD composites. Compos. Part A Appl. Sci. Manuf. 2017, 102, 207–217. [Google Scholar] [CrossRef]
- Matzenmiller, A.; Lubliner, J.; Taylor, R.L. A constitutive model for anisotropic damage in fiber-composites. Mech. Mater. 1995, 20, 125–152. [Google Scholar] [CrossRef]


| Warp Yarn | Weft Yarn | Number of Measurements | |
|---|---|---|---|
| Height (SD) in mm | 0.36 (±0.04) | 0.53 (±0.04) | 20 |
| Width (SD) in mm | 1.11 (±0.07) | 1.76 (±0.08) | 20 |
| Spacing (mm) | 0.16 (±0.03) | 2.53 (±0.10) | 20 |
| Directions | Distance Vectors | Boundary Condition Equations |
|---|---|---|
| ξ-axis | ||
| η-axis | ||
| y-axis | ||
| z-axis |
| Elastic Constants | Values | |
|---|---|---|
| Quartz fiber | Elastic modulus | 72–78 GPa |
| Poisson’s ratio | 0.25 | |
| Tensile strength | 1046 MPa | |
| Silica matrix | Elastic modulus | 35–45 GPa |
| Poisson’s ratio | 0.26 | |
| Tensile strength | 180–220 MPa |
| Warp Yarn | |||||
| 52.43 | 12.61 | 6.07 | 4.66 | 0.28 | 0.35 |
| Weft yarn | |||||
| 45 | 11 | 5 | 4.07 | 0.29 | 0.35 |
| Warp and weft yarn strengths | |||||
| 200 | 80 | 80 | 80 | 40 | 40 |
| Porous Matrix | |||||
| 4.5 | 0.35 | ||||
Publisher’s Note: MDPI stays neutral with regard to jurisdictional claims in published maps and institutional affiliations. |
© 2022 by the authors. Licensee MDPI, Basel, Switzerland. This article is an open access article distributed under the terms and conditions of the Creative Commons Attribution (CC BY) license (https://creativecommons.org/licenses/by/4.0/).
Share and Cite
Lu, H.; Liu, Y.; Yan, S. Experimental Study and Numerical Analysis of the Tensile Behavior of 3D Woven Ceramic Composites. Machines 2022, 10, 434. https://doi.org/10.3390/machines10060434
Lu H, Liu Y, Yan S. Experimental Study and Numerical Analysis of the Tensile Behavior of 3D Woven Ceramic Composites. Machines. 2022; 10(6):434. https://doi.org/10.3390/machines10060434
Chicago/Turabian StyleLu, Hongbo, Yancheng Liu, and Shibo Yan. 2022. "Experimental Study and Numerical Analysis of the Tensile Behavior of 3D Woven Ceramic Composites" Machines 10, no. 6: 434. https://doi.org/10.3390/machines10060434