1. Introduction
Condition monitoring and failure prediction of the equipment are crucial due to their wide usage in different applications. Considering options for servicing critical technical systems, creating the possibility of periodic measurements for all machines seems inevitable. However, proper assembly and careful maintenance of the equipment makes it possible to reduce the number of scheduled checks of the devices, including measurement of the vibration level up to two or three times a year. It is also related to security issues and resource savings. Therefore, the creation of an effective condition monitoring system would ensure the reliability of technical resources and the quality of service.
If the vibration frequency is not constant, fractional derivatives are used. These derivatives demonstrate effectively use of vibration acceleration changes and vibration intensity. The derivative order can be any actual number. The intensity of the vibration acceleration change is estimated by the frequency spectrum of the vibration power [
1]. During the processing of signals, which inform on the level and balance of vibration, accuracy becomes critical, and, therefore, the ISO 16063 series of standards are used [
2]. In case of the absence of a tachometer (conditions for performing repeated multiple measurements and with a rapidly changing speed of rotation of the drive shaft), the diagnostic method is described in [
3].
Many studies in literature are related to the described problems. Authors in [
4] present an analysis of feature extraction methods in vibration-based condition monitoring for low-speed slew bearing. In [
5], authors introduce a study of fault diagnosis of a low-speed bearing based on acoustic emission signal and multi-class relevance vector machine. In [
6], an optimization method was applied to diagnose rolling bearing malfunctions, such as an optimization-based improved kernel novel method based on machine learning. At the same time, reducing the dimension of output values makes sense when assessing signs of machine part malfunctions, although it is difficult to determine the main influencing factors. Impressive findings on the diagnostic analysis of acceleration signals from rolling element bearings are presented in [
7]. Analyzing the envelope makes it possible to strongly estimate masking signals from gear elements in non-stationary conditions. Authors in [
8] apply the basic calculations of the uncertainty of measurement results during vibration transmission, but do not estimate the standard uncertainty. Attention is paid to the assessment accuracy of the rolling bearings state in [
9]. One of the approaches of real-time monitoring mode is proposed, but it is not proven that all the requirements for the accuracy of the assessment are met. The application of numerical modeling for applied studies of the state of mechanical systems is presented in [
10]. Good results were obtained in the interference suppression mode. An assessment of the accuracy of monitoring the technical condition of objects is given in [
11]. The industry has experimentally confirmed that vibration sensors increase the accuracy of measurements. The article [
12] presents an interesting algorithm for predicting the state of machining tools during the processing of parts. The mathematical modeling problems are solved in [
13] by constructing multifactorial mathematical models for turbine units. The article presents modern methods for wear monitoring of turning tools and the possibility of using the phase chronometer diagnostic method to assess tool wear [
14]. Authors in [
15] discuss challenges and perspectives of data-driven fault diagnosis for traction systems in high-speed trains.
The reliability of equipment that operates in heavy conditions is based mainly on the analysis of spontaneous emissions of oscillatory processes and on the study of damage accumulation. The initial distribution of defects, operating conditions, and the mechanical system’s interaction with the environment leads to accidental failures. It is necessary to describe the behavior of a mechanical system with a high degree of accuracy. A dynamic model of a closed electric drive with a measuring system configured for a monitoring mode is considered as a mechanical system. The measuring system must meet the Certificate in Investment Performance Measurement of Mutual Recognition Arrangement (CIPM MRA) conditions. Thus, the measurement system must be intelligent and time-bound. The SI-based data exchange system standard introduced metrology into digital format. All data are collected and processed according to this unit system.
This article is organized as follows. In
Section 2, the most common faults of bearings in electrical machines are introduced and their diagnostic possibilities are discussed.
Section 3 presents experiments done in the framework of the given study describing the test bench and studied bearing failures. In
Section 4, the results of the conducted experiments are presented and their accuracy is discussed.
2. Bearing Faults
According to statistics, 50% of all failures in electrical machines are referred to as mechanical faults causing additional noise and vibrations and leading to the total breakdown of the device [
16]. Bearings are the critical elements of a rotating machine. At the same time, bearing faults carry the highest portion of mechanical damages. The manufacturing of bearings is to be carried out under stringently defined requirements. However, the actual lifespan of the bearing is much lower than it is supposed to be due to different forces affecting it during operation, such as unexpected overload, insufficient lubrication, and improper bearing installation [
17]. As electrical machines operate in other conditions, bearings can be prone to many faults and damages. The reasons for these failures are different environmental or manufacturing factors.
2.1. Mechanical Damages
Most bearing faults are related to mechanical damages, which can occur due to manufacturing failures or unexpected conditions during motor operation. Usually, these mechanical damages are referred to as inner and outer rings, cages, or rolling elements. An example of a faulty bearing cage is shown in
Figure 1.
These mechanical damages can also be caused by an incorrect manufacturing or mounting process, improper design, misalignment of bearing rings, or unequal proportions of rolling elements. Before placing the bearing, it is mandatory to check for manufacturing faults: general appearance, rotational ease, and clearances of technical documentation requirements. Usually, open-type approaches are to be checked for contamination, corrosion, and cage condition. For sealed-type bearings, cages should also be checked to prevent possible damages.
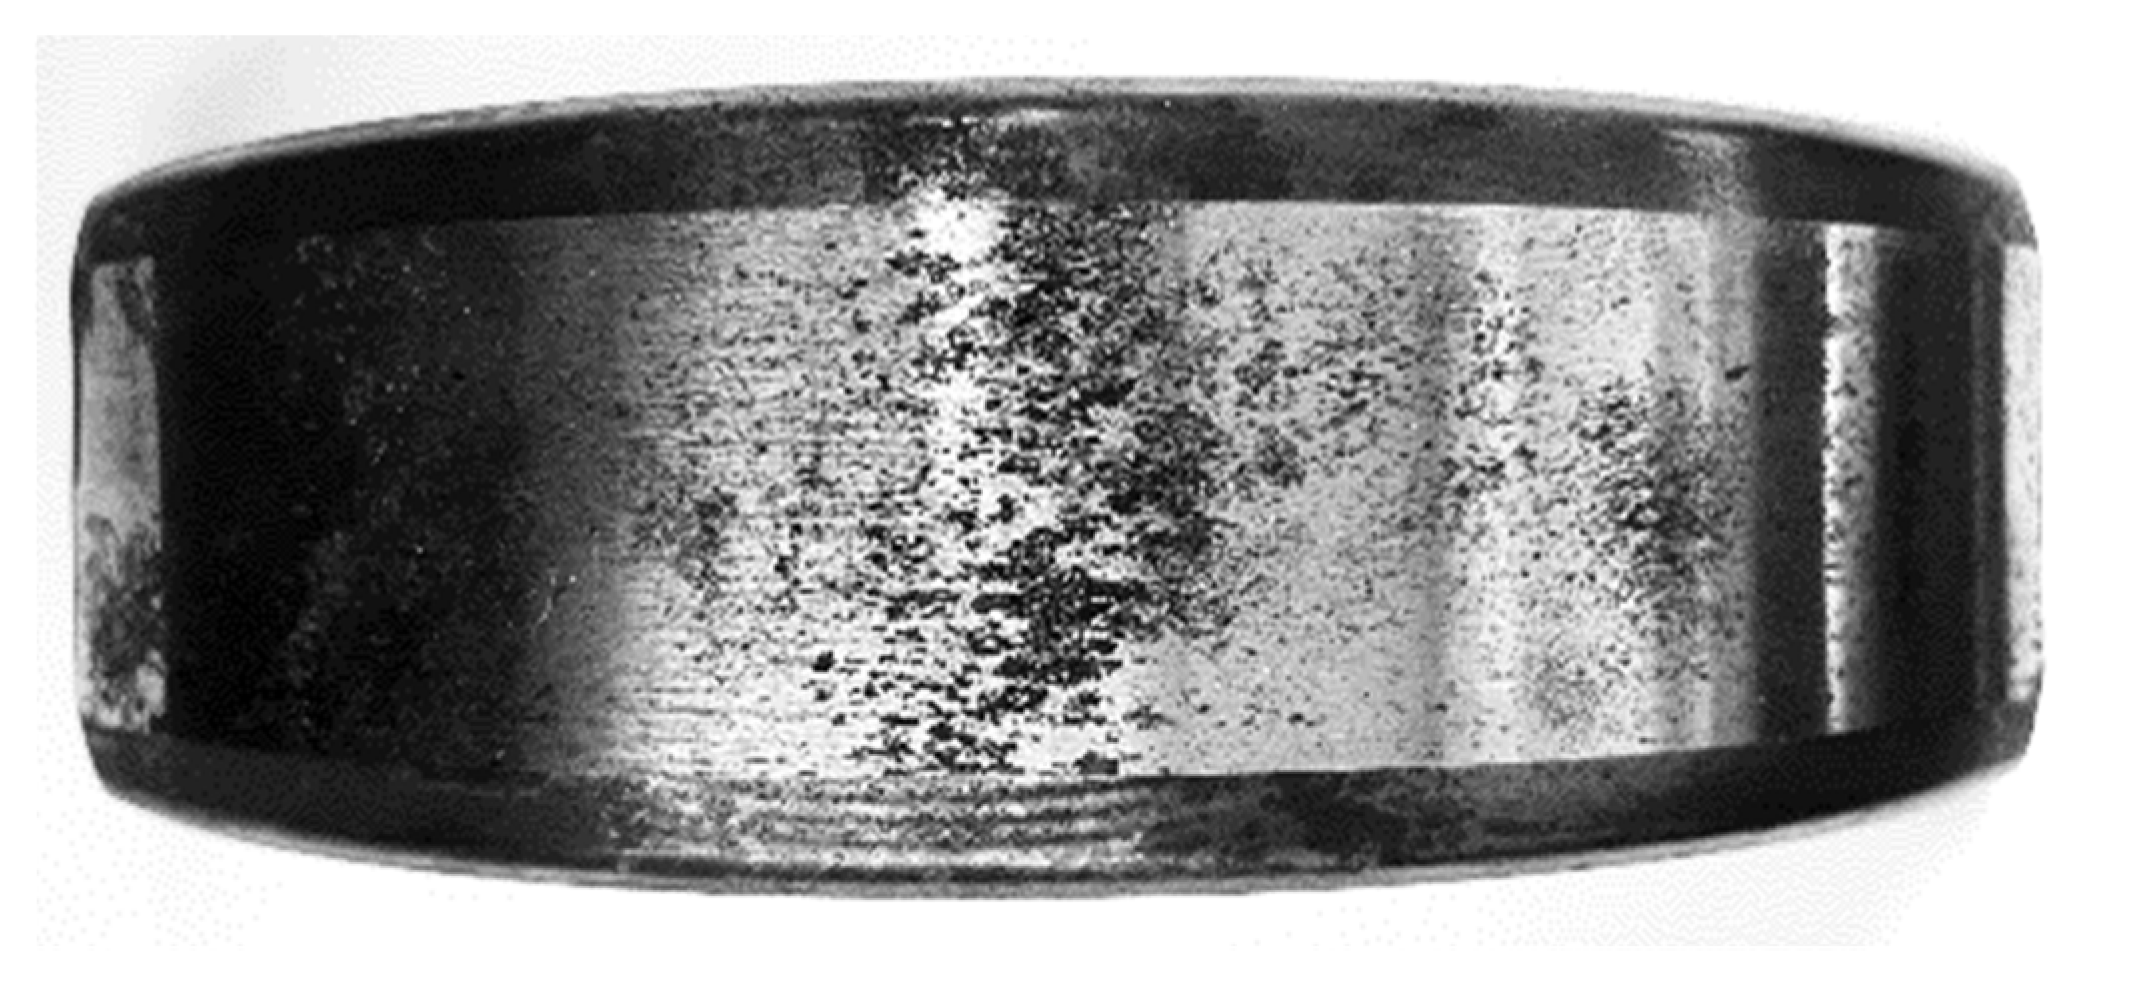
2.2. Material Fatigue
Material fatigue is usually caused by continuous loads that crack the bearing’s surface. If external forces are applied to the bearing rings, the strength of the material decreases, causing it to crack. Over time, cracking progresses, and, eventually, the bearing becomes unsuitable for further exploitation. The bearing’s durability is measured by the number of revolutions that the bearing makes before the first signs of material fatigue become noticeable on rings and rolling bodies [
18]. An example of bearing material fatigue is shown in
Figure 2.
Continuous overload, poorly maintained, and contaminated surfaces—all these factors inevitably lead to material fatigue. This phenomenon, its time occurrence, and developing process largely depend on the magnitude of the machine’s applicable load and rotational speed. Initially, microcracks appear in the subsurface. By process development, the surface of the bearing begins to crack on a larger surface and becomes rough. In this case, additional noise and vibration can be detected. In addition, the operating temperature of the bearing increases. The bearing should be regularly checked and well lubricated to prevent this failure.
2.3. Ambient Contamination
When humid air enters the bearing, it tears lubricant properties at certain points of an increased load on rings. In addition, lubricants can become polluted by water or other chemical substances. As lubricant properties are deteriorated, bearing corrosion appears. Corrosion is a process between material and environment that results in material dissolution. Proper lubrication is one of the bearing operating conditions that determines its durability. Rightly selected lubricant provides a thin oil layer, which helps to soften the impact of rolling elements against bearing rings and cages.
Moreover, the lubricant prevents the bearing from premature wear and corrosion. Improper lubrication can be referred to as an insufficiently as well as excessively greased bearing. Insufficient lubrication causes friction and crack progression, while an overly greased bearing results in the shaft slipping and leads to structural damage. An example of bearing corrosion is shown in
Figure 3.
Bearings can also be polluted by dust, sand, and other abrasive particles. This pollution leads to structural damages of the bearing (e.g., scratches, cracks) and produces significant dents when the rolling element rolls the shaving into the rings. The main reason for these damages is the wrongly selected bearing cage, preventing such particles from entering the bearing. As a preventative factor, corrosion-resistant lubricants can be used. Moreover, it is vital to keep the mounting process clean and not to use contaminated greases.
2.4. Bearing Currents
Bearings are often affected by shaft currents. If current passes through the bearing, damages will appear on the bearing surfaces. Usually, these failures occur in bearing areas, where the lubricant layer is the thinnest due to the increased load at these points. The most common damages caused by shaft currents are shown in
Figure 4. Fluting usually occurs with low voltage and constant rotational speed, where multiple lines occur across bearing rings. At the same time, frosting occurs if the motor operates at varying speeds. Pitting is usually caused by low speed and supplied high-voltage sources. Practically, dull-finish can also be observed, which resembles pitting, but the size of the craters are much smaller.
The first indicator of a possible problem related to shaft currents is lubricant darkening, which oxidizes during sparking caused by electrical discharges, as shown in
Figure 5.
At the initial stages, these damages are not visible and cannot be detected without disassembling the bearing and searching for microscopic deviations on the bearing rings and rolling elements [
19]. By fault development, the damage inflicted on the bearings due to currents differs visually from other bearing damages. For this reason, it is crucial to inspect changes in bearings in all cases during service if there is a reason to suspect the presence of bearing or shaft currents, especially in those cases where bearings are used in larger power class frequency converter-fed electrical machines.
3. Experiments
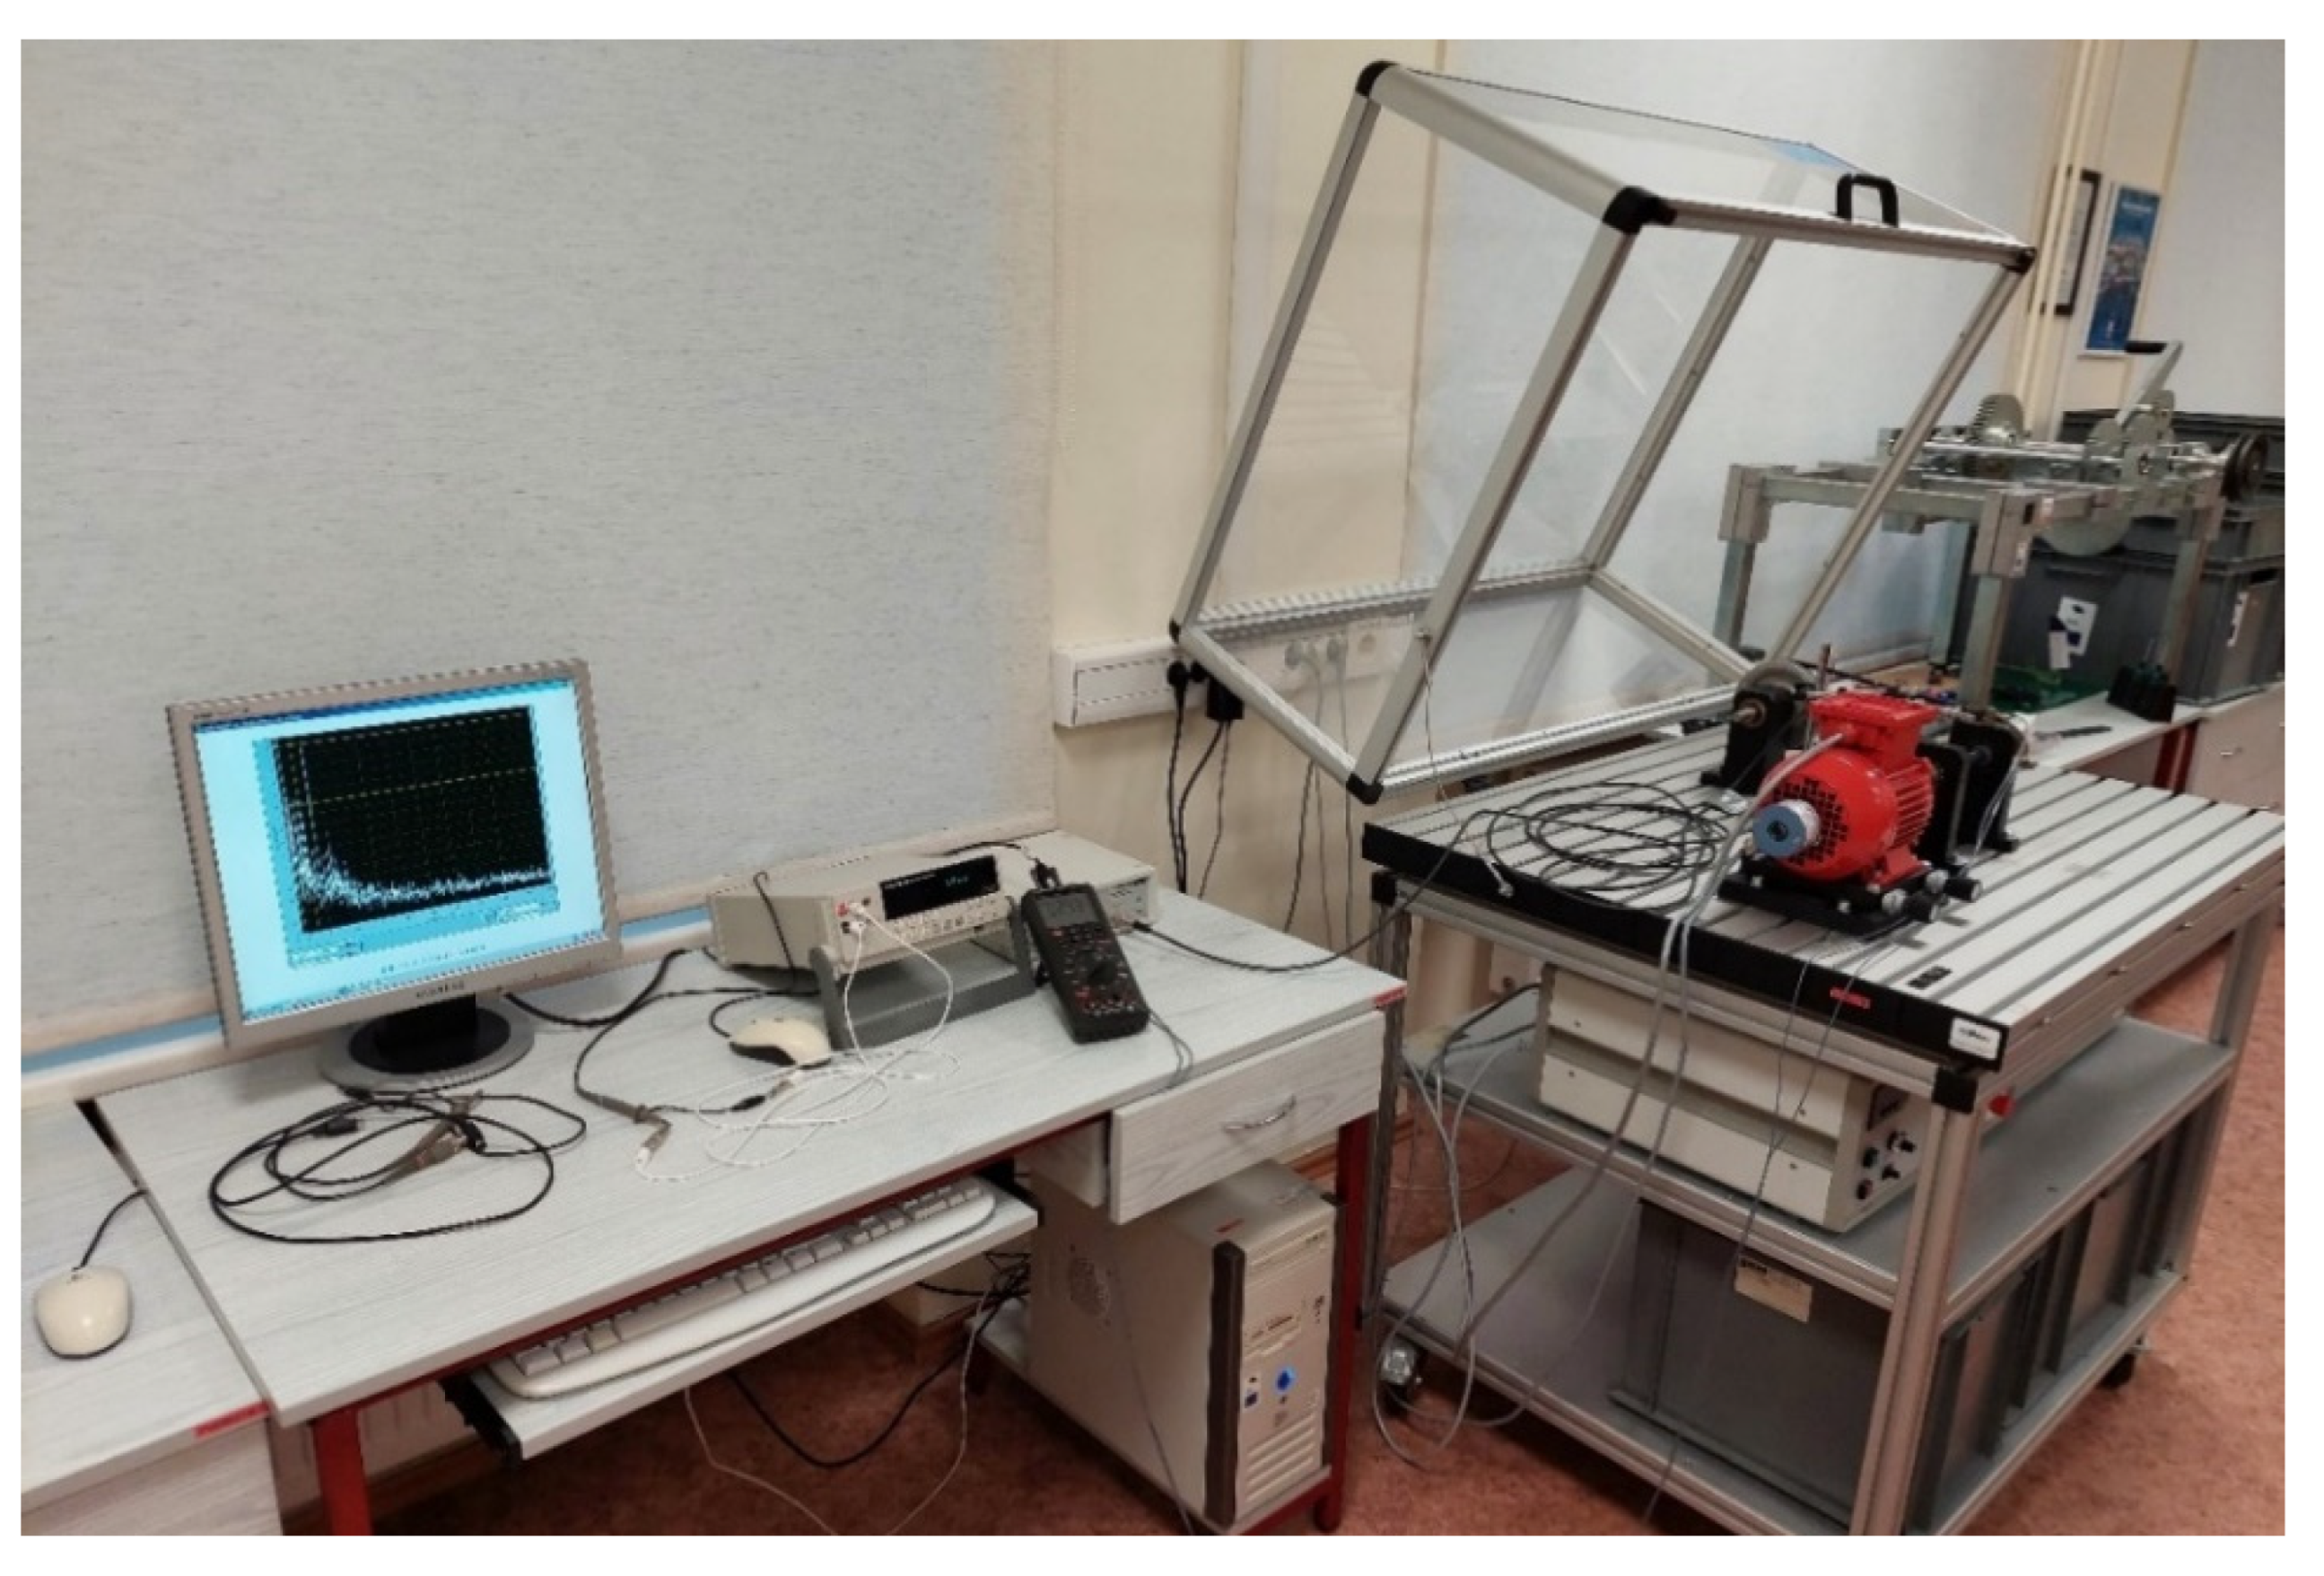
The dynamic model of the electric drive was studied in the torque control mode. Drive composition: a three-phase asynchronous motor C71B-2 with cage rotor, rotary optical encoder with IR-LED, precision ball bearings, grooved ball bearing 6004-2ZR, and belt drive with eccentric belt pulley with a pretension V-belt. The test bench is presented in
Figure 6.
The highest speed and the shorter interval between signals made it possible to obtain more accurate metrological support for monitoring the technical condition of a ball radial single-row rolling bearing. As shown in
Figure 7, the accelerometer output signal’s root mean square (RMS) value was measured. The frequency range and measurement uncertainty allow you to accurately evaluate the results of comparing different bearing fault signature extractions.
Before the experiment, the belt was pre-tensioned, thereby maintaining the speed of the rotation of the shaft. In the experiment, a vibration stand with the following characteristics was used: a non-linearity of ±1%, measuring range of ±490 m/s2 or ±50 g; broadband resolution of 3434 μm/s2. Small transverse and angular vibrations of the vibration stand table do not significantly affect the measurement results. The deviation of the acceleration amplitude during the measurement process is not more than 0.05% of the displayed value. The test unit’s electronic noise is below the maximum value of the output signal.
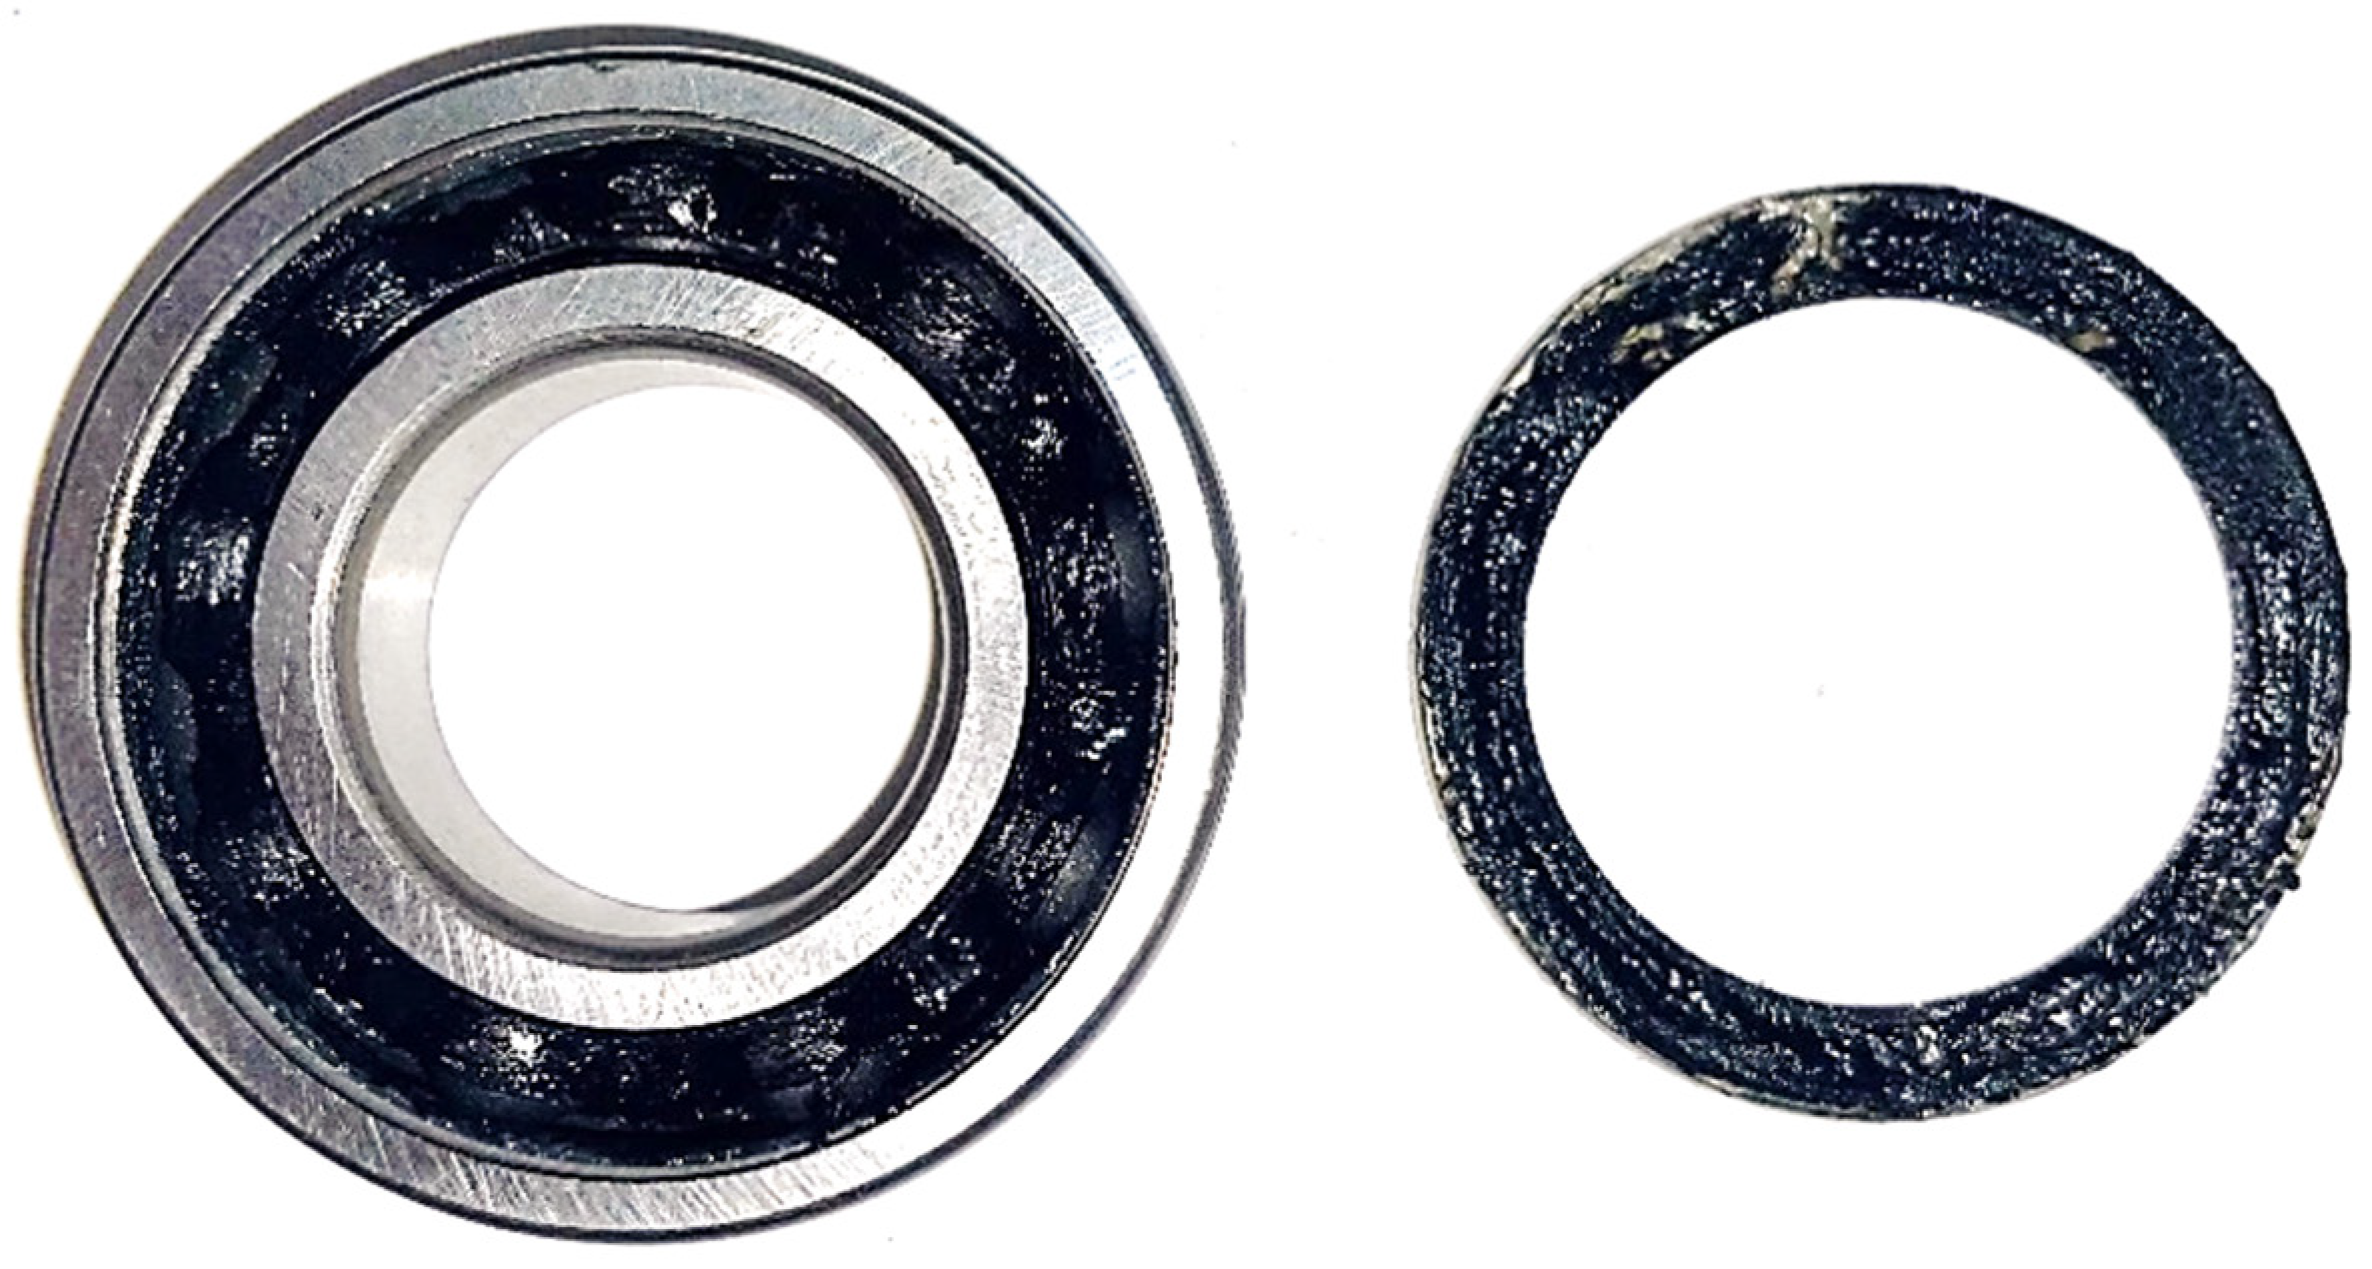
Deep groove ball bearings (type 6004 2RS) were used in these experiments. Healthy bearings were studied as well as bearings with additional damages. As shown in
Figure 8, the following cases were studied: the healthy bearing, bearing with damaged inner ring, bearing with damaged outer rings, bearing with broken cage, complex bearing damage (damaged outer ring, inner ring, and cage), and bearing with material fatigue.
4. Results
The data exchange should be carried out very quickly. Synchronization of the measurement system was carried out programmatically. The created software was effectively used to detect malfunctions in the drive parts at a low speed. A program was developed for more accurate recording of shock loads at low shaft rotation frequencies that allow recording shock loads in milliseconds. With such a sampling rate of vibration signals, it is challenging to diagnose malfunctions in bearings in belt drives. The shaft rotation frequency was 300 rpm in the experiment, thus the sampling frequency was 5 Hz. Low frequency and accessing a digital voltmeter at every millisecond made it possible to assess the condition of the bearing with great accuracy.
The algorithm is suitable for processing vibration spectra, which will allow continuous instant monitoring in the future. To implement the theoretical foundations of diagnostics, a custom program Lucia was created and written in C++ using the MFC (Microsoft Foundation Classes) library for synchronous monitoring of the state of the drive. MATLAB 2021b without Toolbox application was used only for process visualization. Lucia is aligned with MATLAB 2021b software. There are two options for synchronizing the measurement system’s operation: the program makes a measurement request and reads data from the port, setting the print-only mode.
In this way, you can change the data transfer rate and the intervals between data. All parameters can be monitored, and the results of diagnostics of the condition of the drive parts can be evaluated more accurately. The diagnosis of bearings with known malfunctions was carried out. Further, diagnostics of similar bearings with unknown malfunctions were carried out. The measurements are synchronized, as the timestamp of each measure is displayed in milliseconds and ticks. Based on these data, it is possible to estimate the interval between measurements and the data transfer rate. Theoretical values of data transfer rates do not correspond to actual values due to the asynchronous data exchange mode via COM port. The condition-monitoring scheme of using the custom Lucia program is shown in
Figure 9.
An alternative approach to the metrological control of the technical condition of rolling bearings is based on a single measurement information format. As an etalon, we use a bearing with a known character of the damage. At the first stage, we establish the ratio between the values of frequencies occurring due to damage in the etalon bearing depending on the speed, considering the measurement uncertainties. At the second stage; we use this information to establish the ratio necessary to assess the condition of a bearing with an unknown nature of damage based on the readings of the measurement system.
Conducting comparative measurements [
20], the value of F
s, which is the response of a malfunction of the etalon bearing, is compared with the value of F
c, which is the response of a malfunction of a bearing with unknown damage. As a rule, during the implementation of such measurements, the difference between these values
is determined. This difference is used to make corrections to the measurement result in the future. In this case, the estimation of measurement uncertainty consists of estimating this difference’s uncertainty ∆. The model equation in the case of comparing the results has the form:
where
the value associated with the response of a bearing malfunction with unknown damage;
the value associated with the failure response of the etalon bearing;
quantization error of the measuring instrument at the first stage of measurements;
non-excluded systematic error of the measuring instrument;
—error of quantization of the measuring instrument at the second stage of measurements. The following uncertainties correspond to the listed input values:
—Uncertainty associated with the scattering of readings related to the etalon bearing, and determined statistically when performing multiple measurements;
—Uncertainty of quantization of the measuring instrument at the first stage of measurements;
—The uncertainty of the measuring instrument obtained from the value of its non-excluded systematic error;
—Uncertainty associated with the scattering of readings related to a bearing with an unknown nature of the damage, and determined statistically when performing multiple measurements;
—Uncertainty of quantization of the measuring instrument at the second stage of measurements.
As the quantization error of the measuring instrument is the same at the two stages of measurement, it can be ignored. In this case, when processing the measurement results, it is advisable to use the method of reduction [ISO/IEC]. Then, the total standard uncertainty of comparative measurements will be determined by the expression:
where
—is the uncertainty associated with the scattering of the difference in readings at the first and second measurement stages statistically determined. The extended uncertainty of comparative measurements will be equal to:
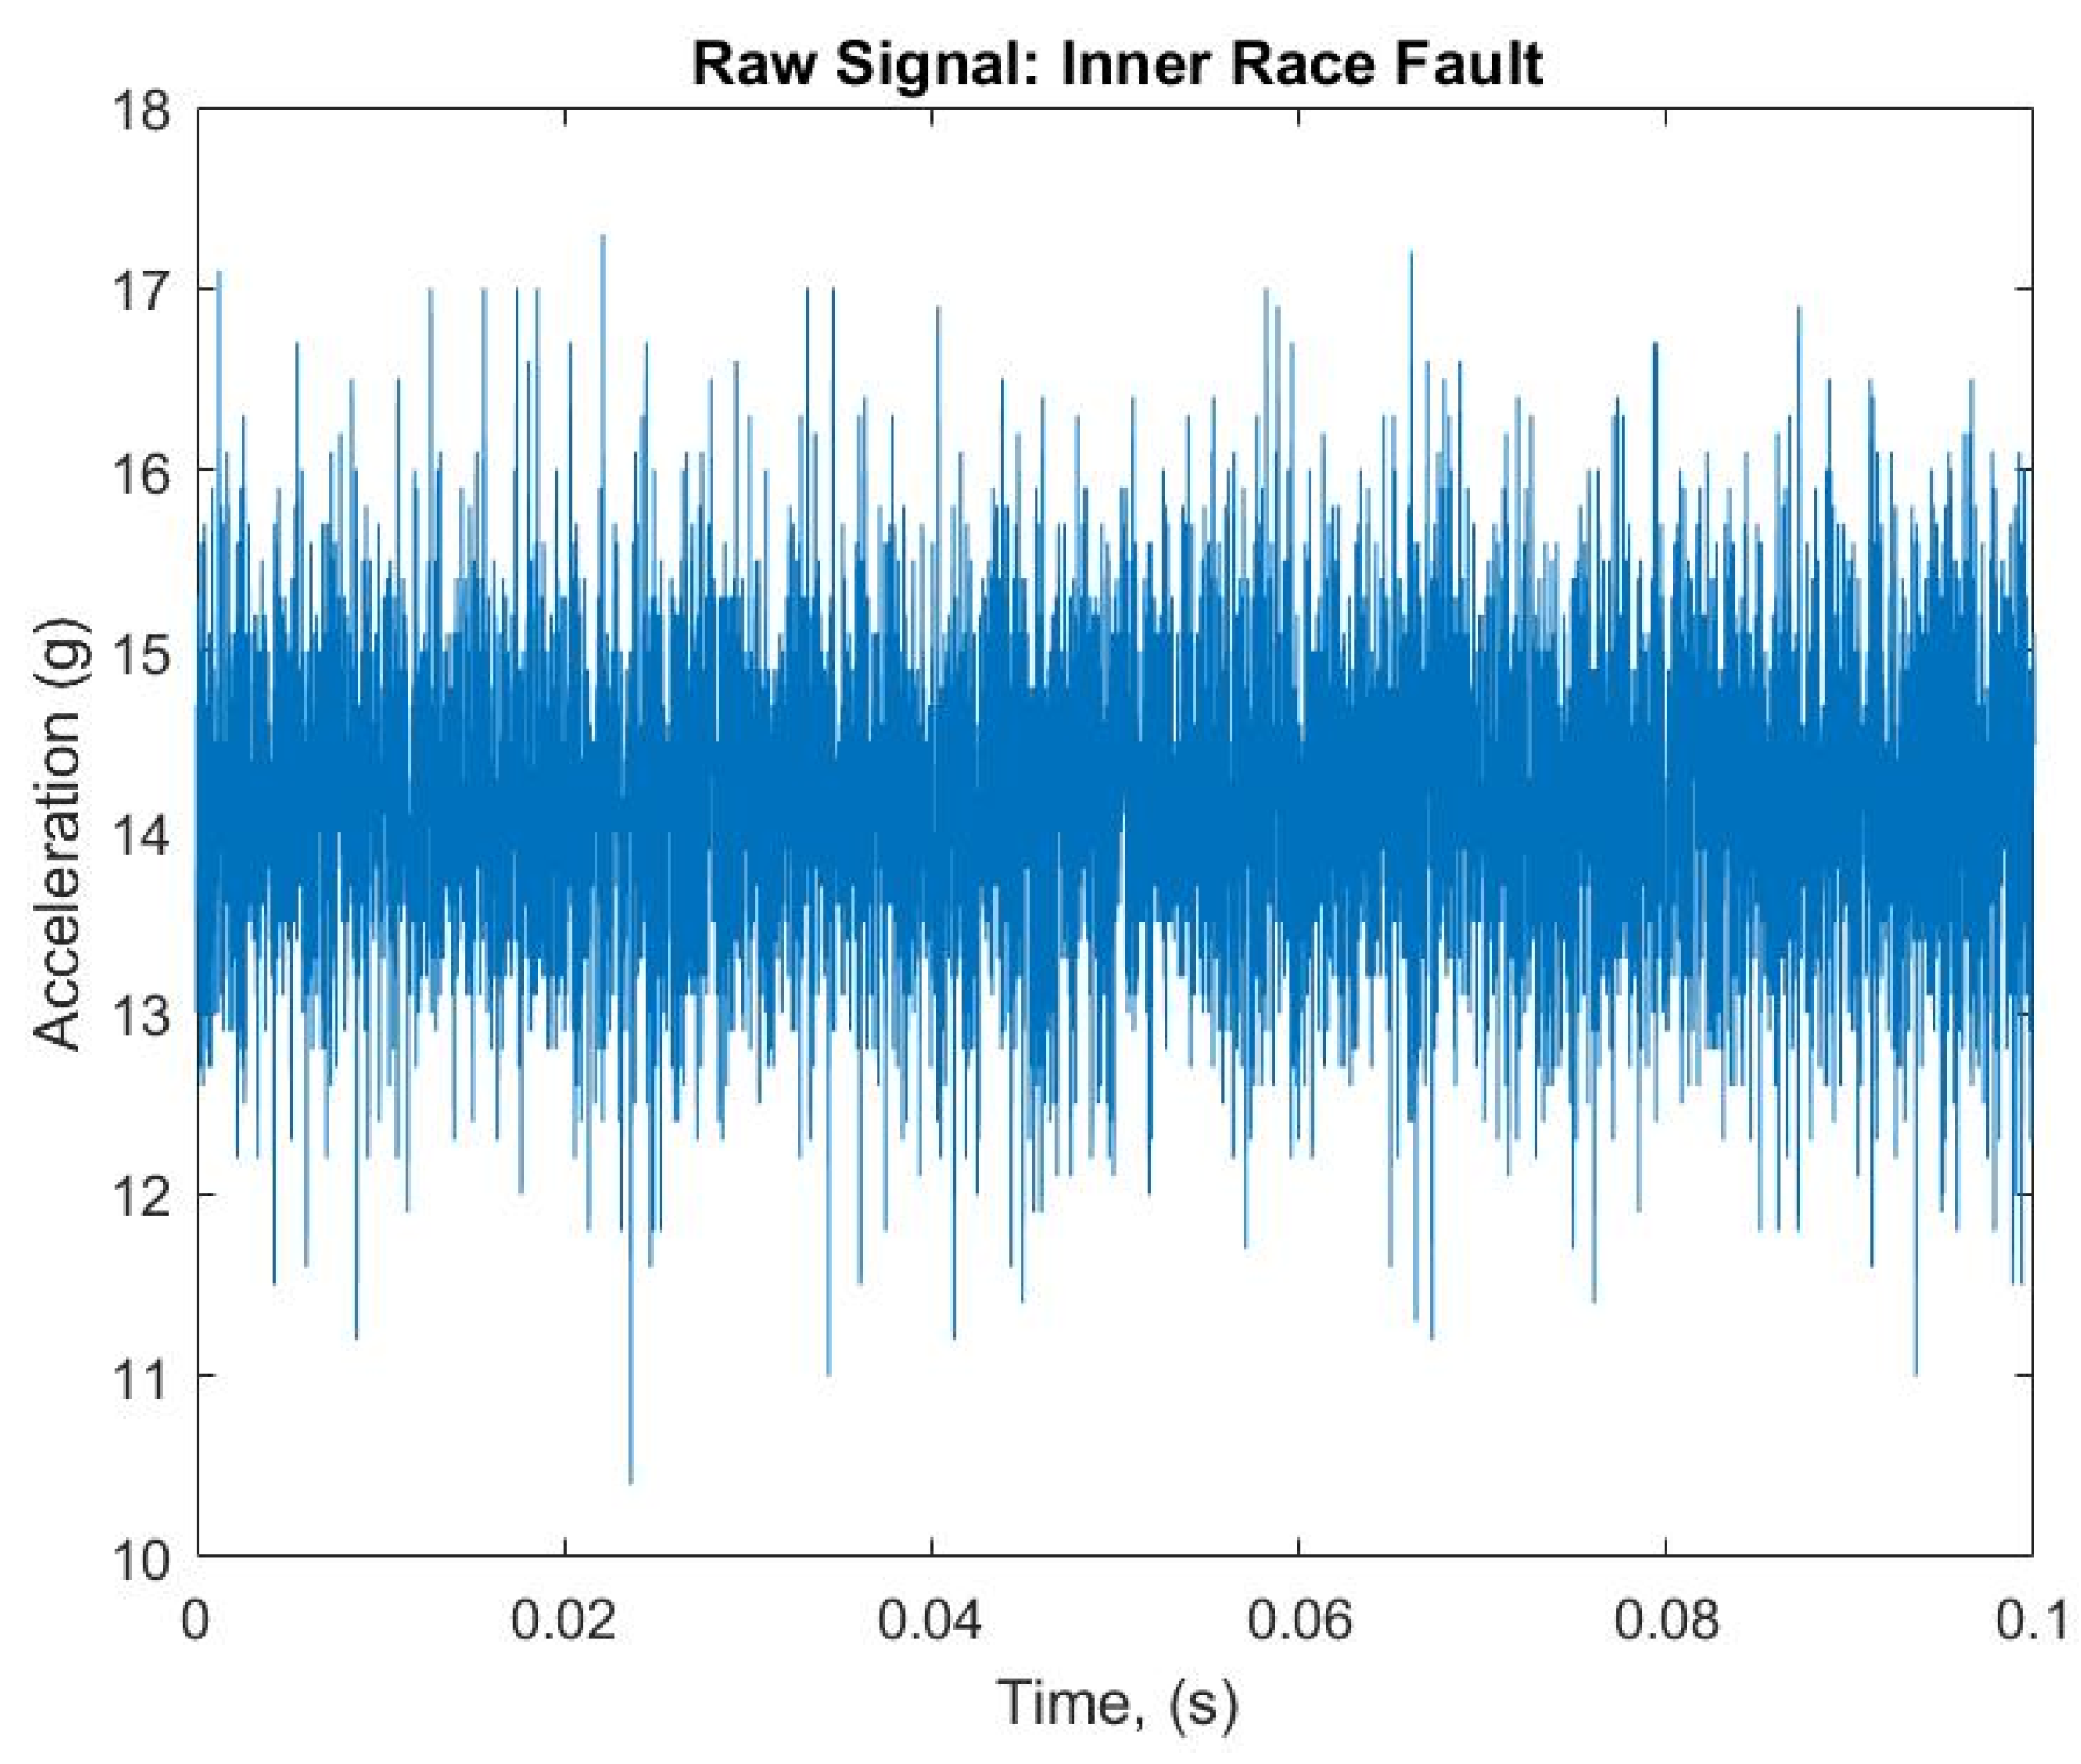
As mentioned, created software is coordinated with the MATLAB r2021b program. The most common envelope analysis method in non-stationary conditions was carried out for a bearing with an expected defect on the inner ring at a shaft rotation speed of 300 revolutions per minute. The envelope method was specifically used to demonstrate monitoring effectiveness with the created Lucia software. By synchronizing the monitoring process, it is possible, with an accuracy of less than 0.1%, to identify increasing failures in the parts of the electric drive. The experimental process can be shown in the example of the bearing with the damaged inner ring. The estimated frequencies arising from damage, depending on the rotational speed for a roller bearing type 6006 at a given shaft rotation speed, is 27.1 Hz. As the laboratory has an etalon (specifically designed according to standards) bearing with damaged inner rings, this particular prototype with damage on the inner ring was chosen to calculate the accuracy of diagnostics of the rolling bearing condition. The inner ring failure response frequency at a shaft speed of 300 rpm is 27.1 Hz. The original raw data containing the failure responses in the inner ring of the studied bearing can be visualized in the spectrum. This bearing has not been operated, and, therefore, it has been selected as the initial working standard with a known failure pattern. The raw data are presented in the time domain, as shown in
Figure 10.
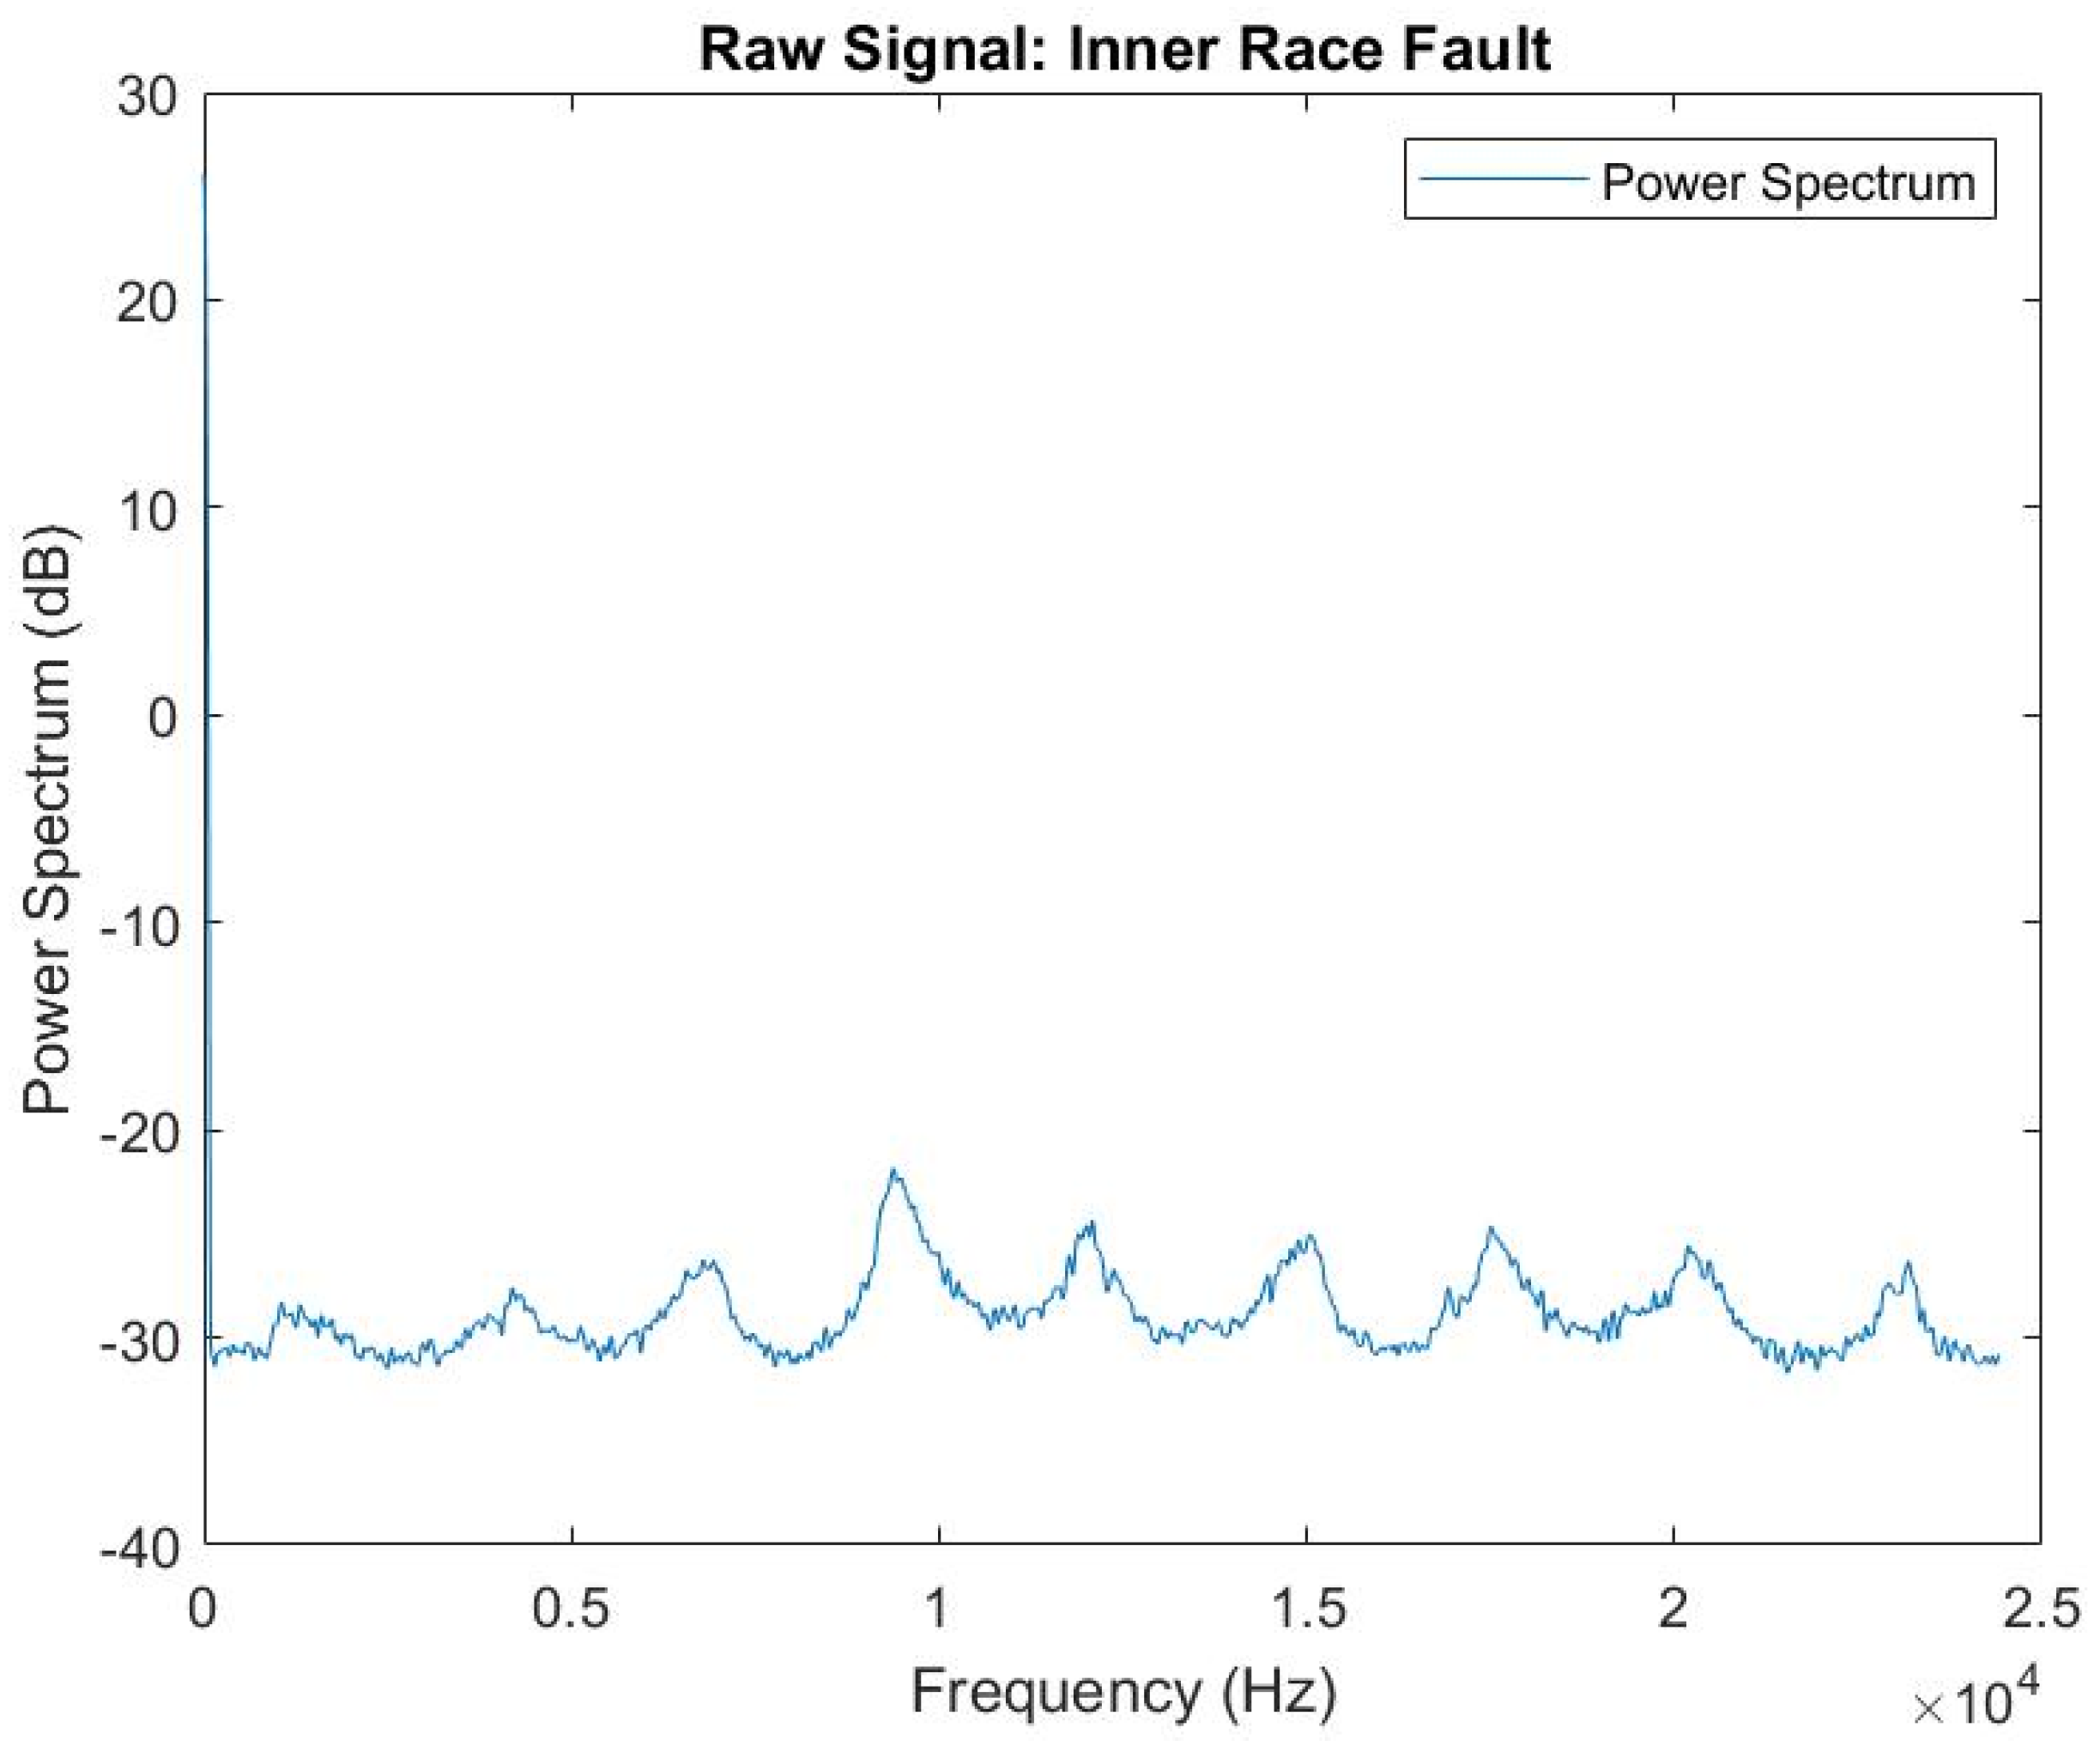
The motor shaft speed is 300 rpm. At this frequency, it is difficult to detect failures of the rolling bearing. In
Figure 11, a visualization of the same original raw data in the frequency domain is presented.
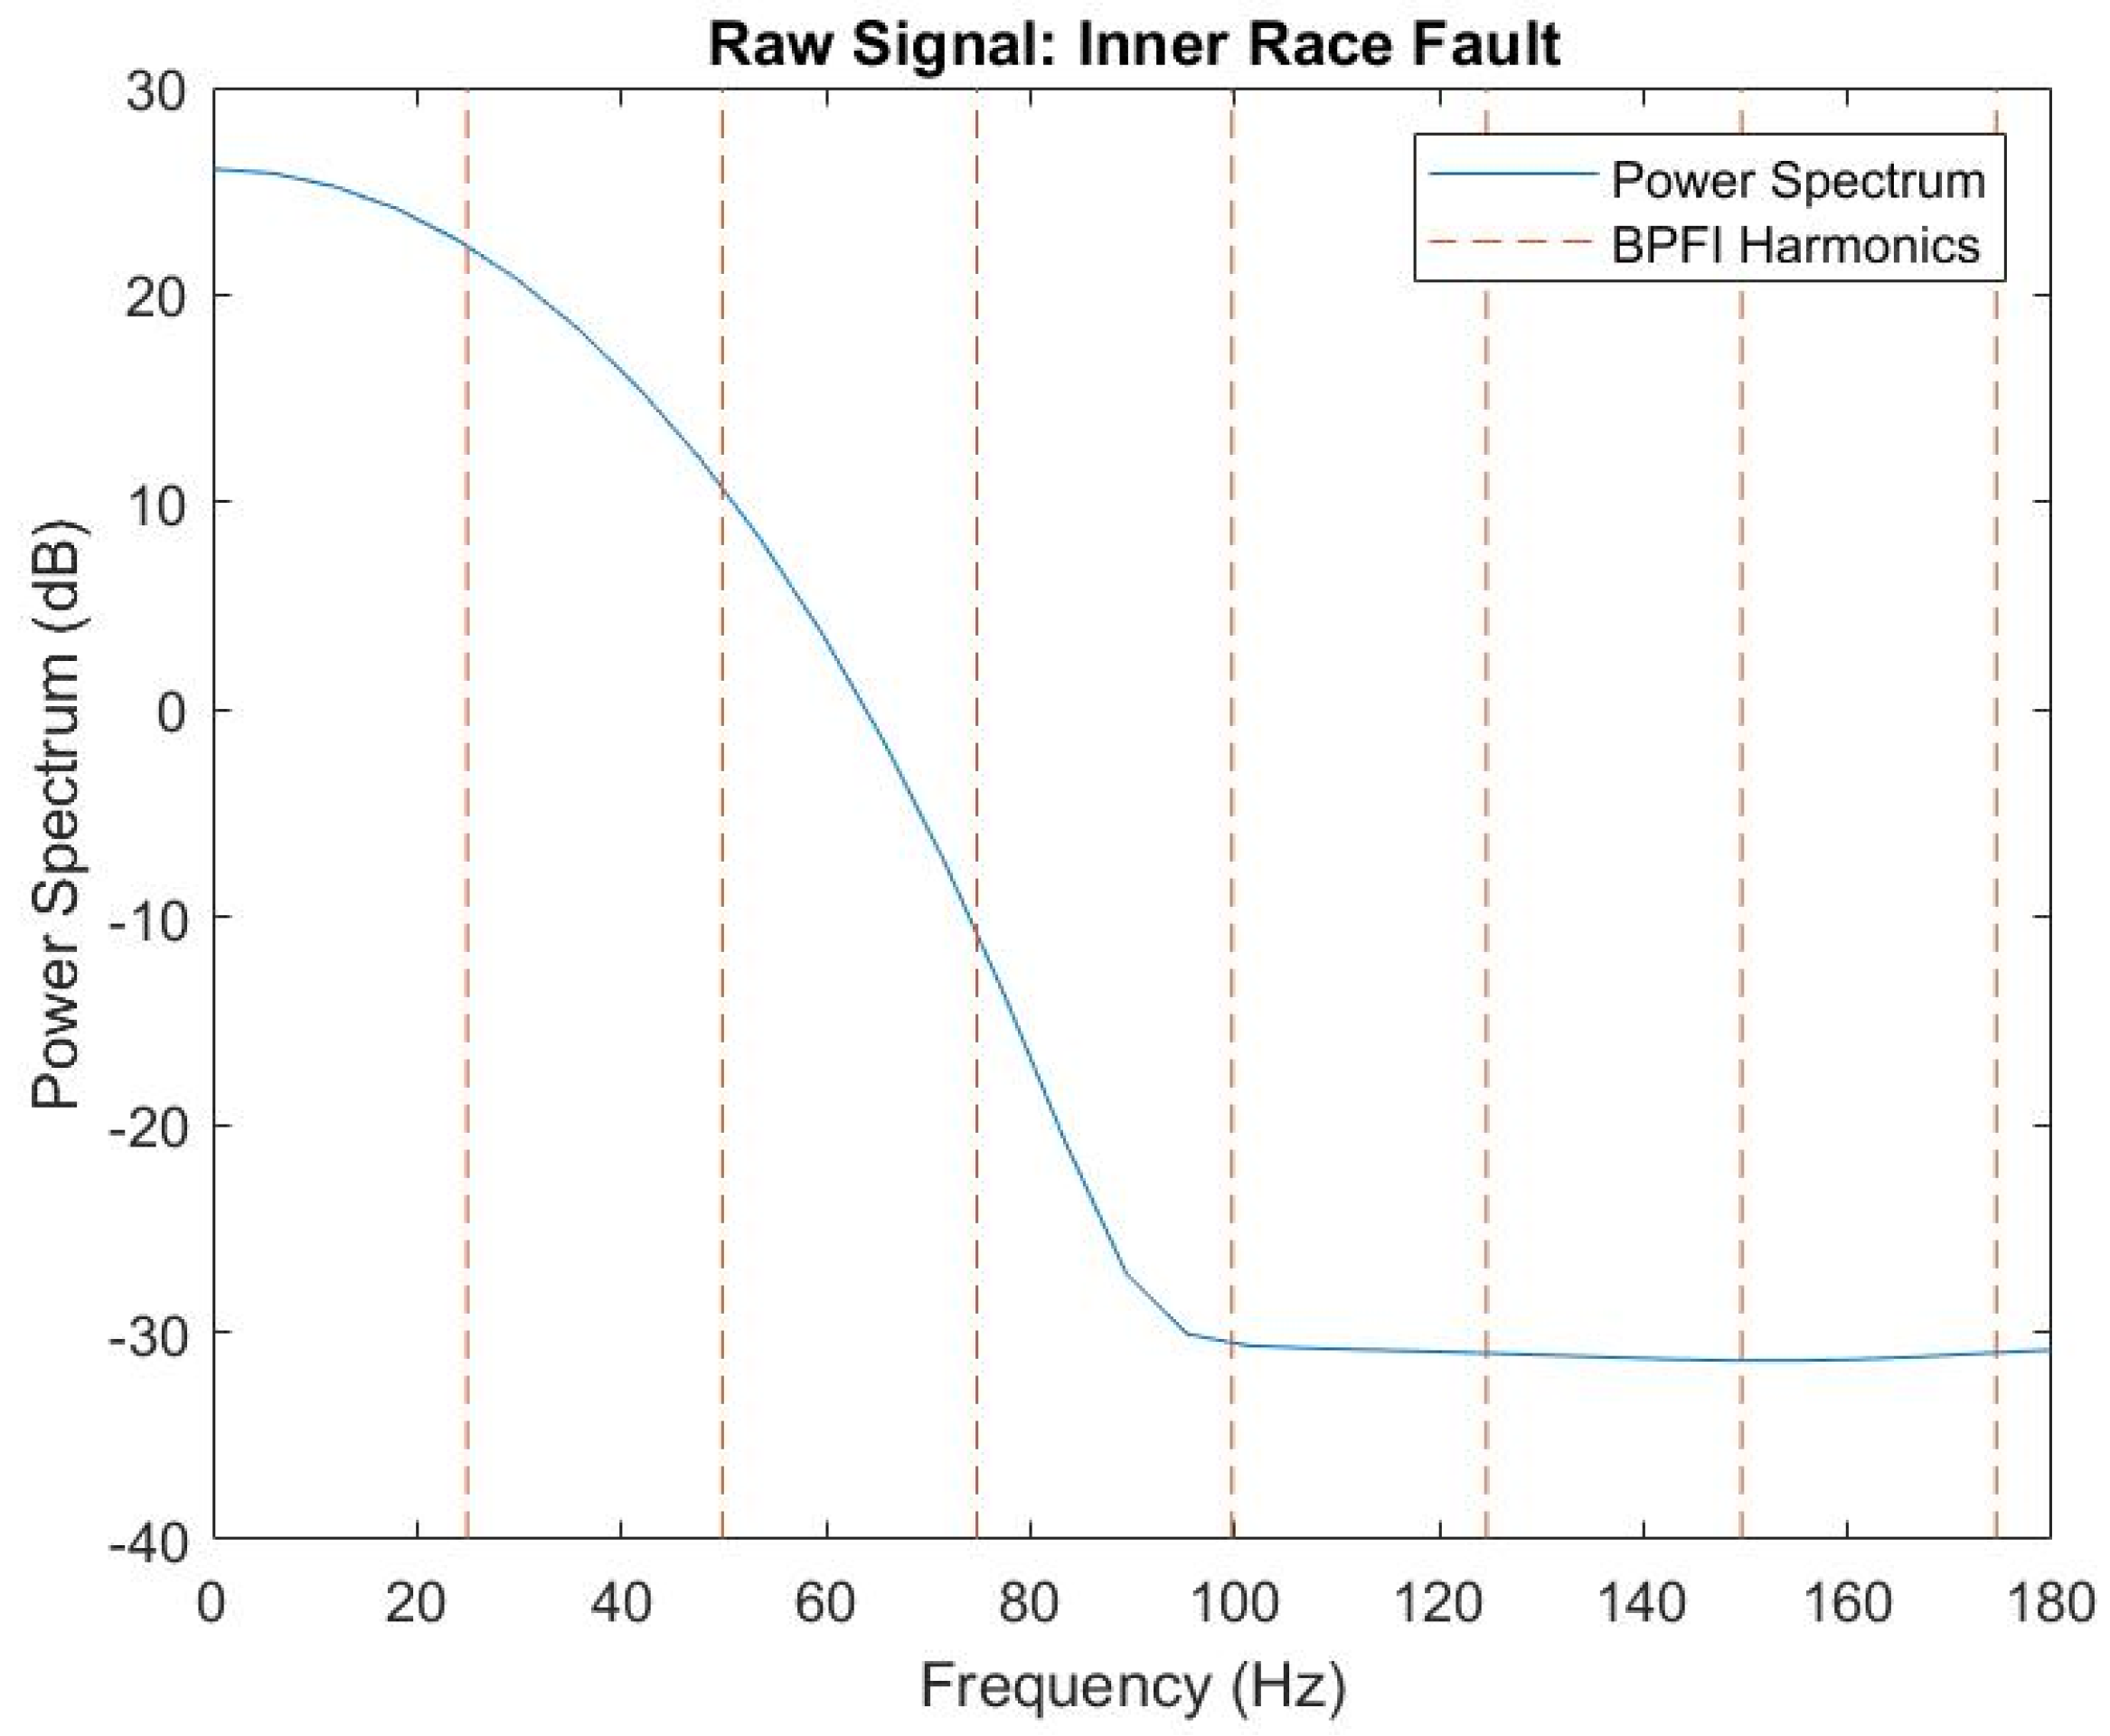
Figure 12 presents the power spectrum of the unprocessed signal in the low-frequency region. On an enlarged scale, it is possible to study the amplitude-frequency vibration spectrum of the acceleration envelope in the rolling bearing with defects on the inner ring.
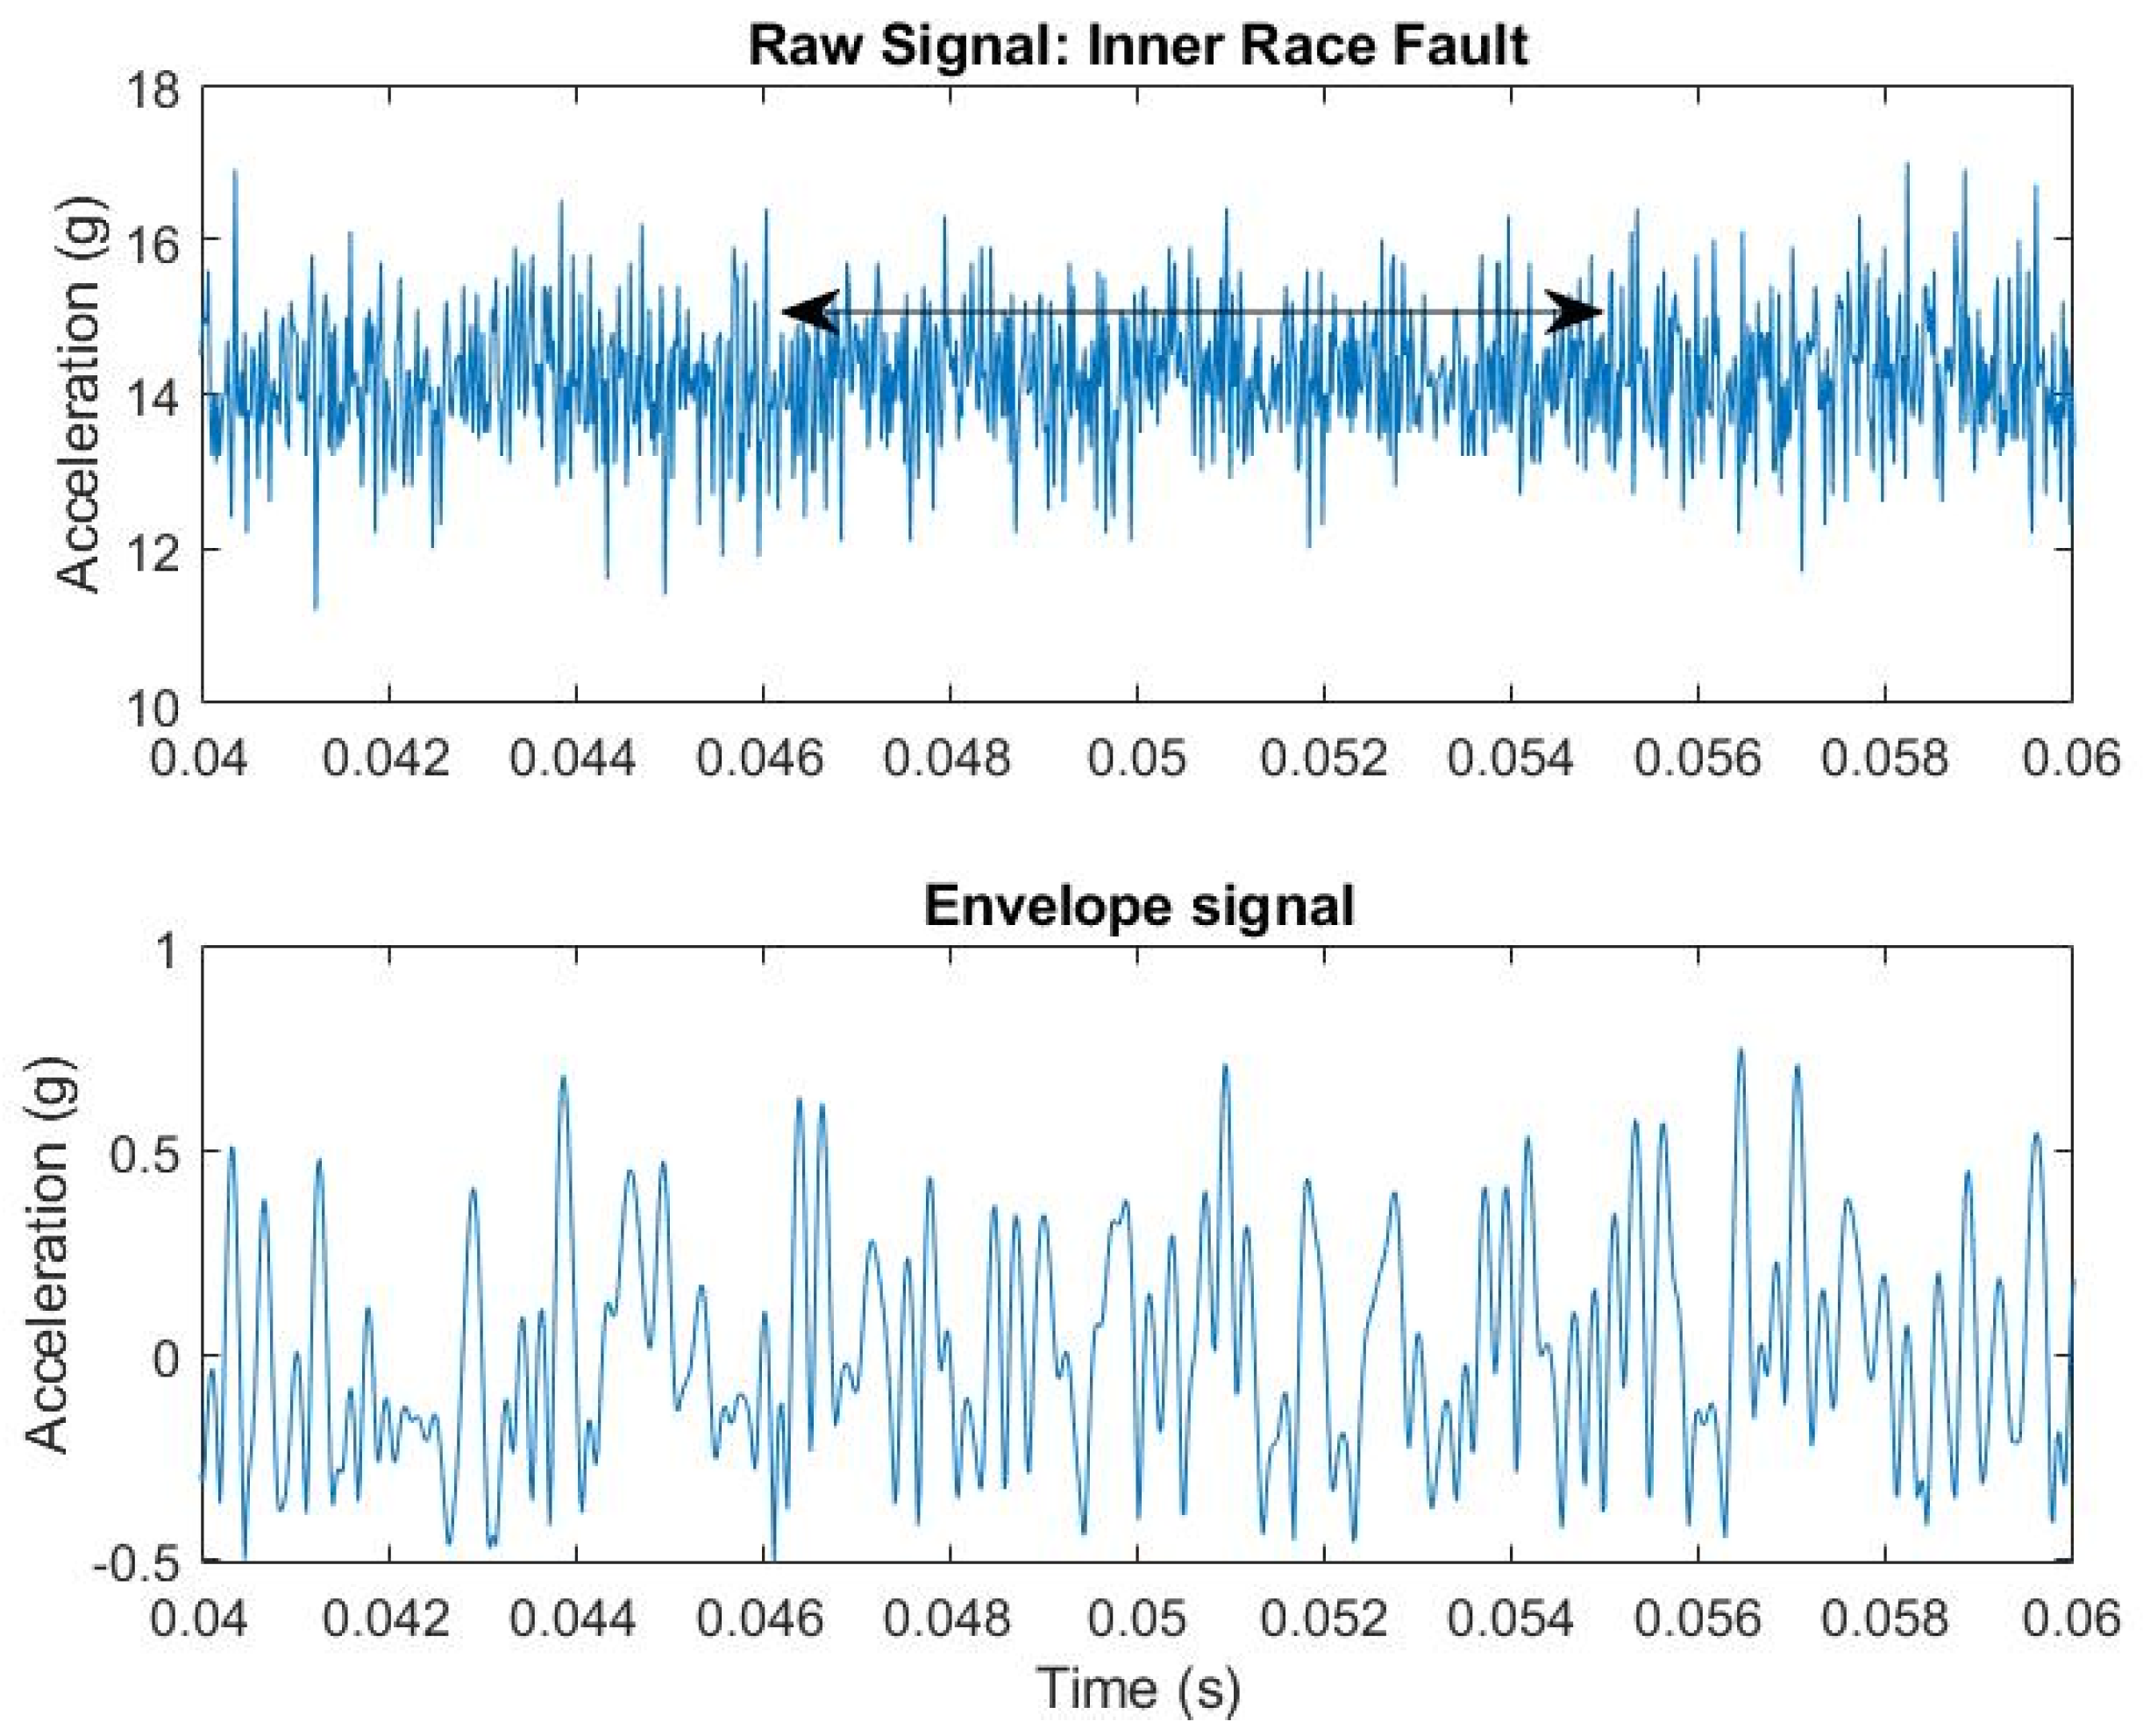
Time-frequency analysis of the raw signal does not accurately distribute the energy over frequency intervals for any partitioning of the frequency domain. At the frequency response, the modulation frequency can be observed at about 1/(0.055 − 0.0046) = 111 Hz. It indicates that the bearing has a potential problem in the inner ring, as shown in
Figure 13. In the graph, the horizontal arrow shows the time interval in order to determine the likelihood of detecting a potential damage in the inner ring of the bearing.
A similar method and vibration diagnostics with different signal transmission rates and intervals between signals were carried out for the etalon bearing with known damage on the inner ring and the bearing with expected damage on the inner ring. The information transfer rate was correlated with the intervals between the signals and varied from five measurements per second to 20 measurements per second. The intervals between the signals ranged from 70 milliseconds to 400 milliseconds. The results are shown in
Figure 14, where the spectrum of the acceleration envelope of a rolling bearing with defects in the inner rings presents a failure response frequency at 27.0182 Hz.
The accuracy of conducted experiments is presented in
Table 1. According to the calculations of the metrological characteristics of the measurement system, the error in transmitting signal information over communication lines is ±1 ms.
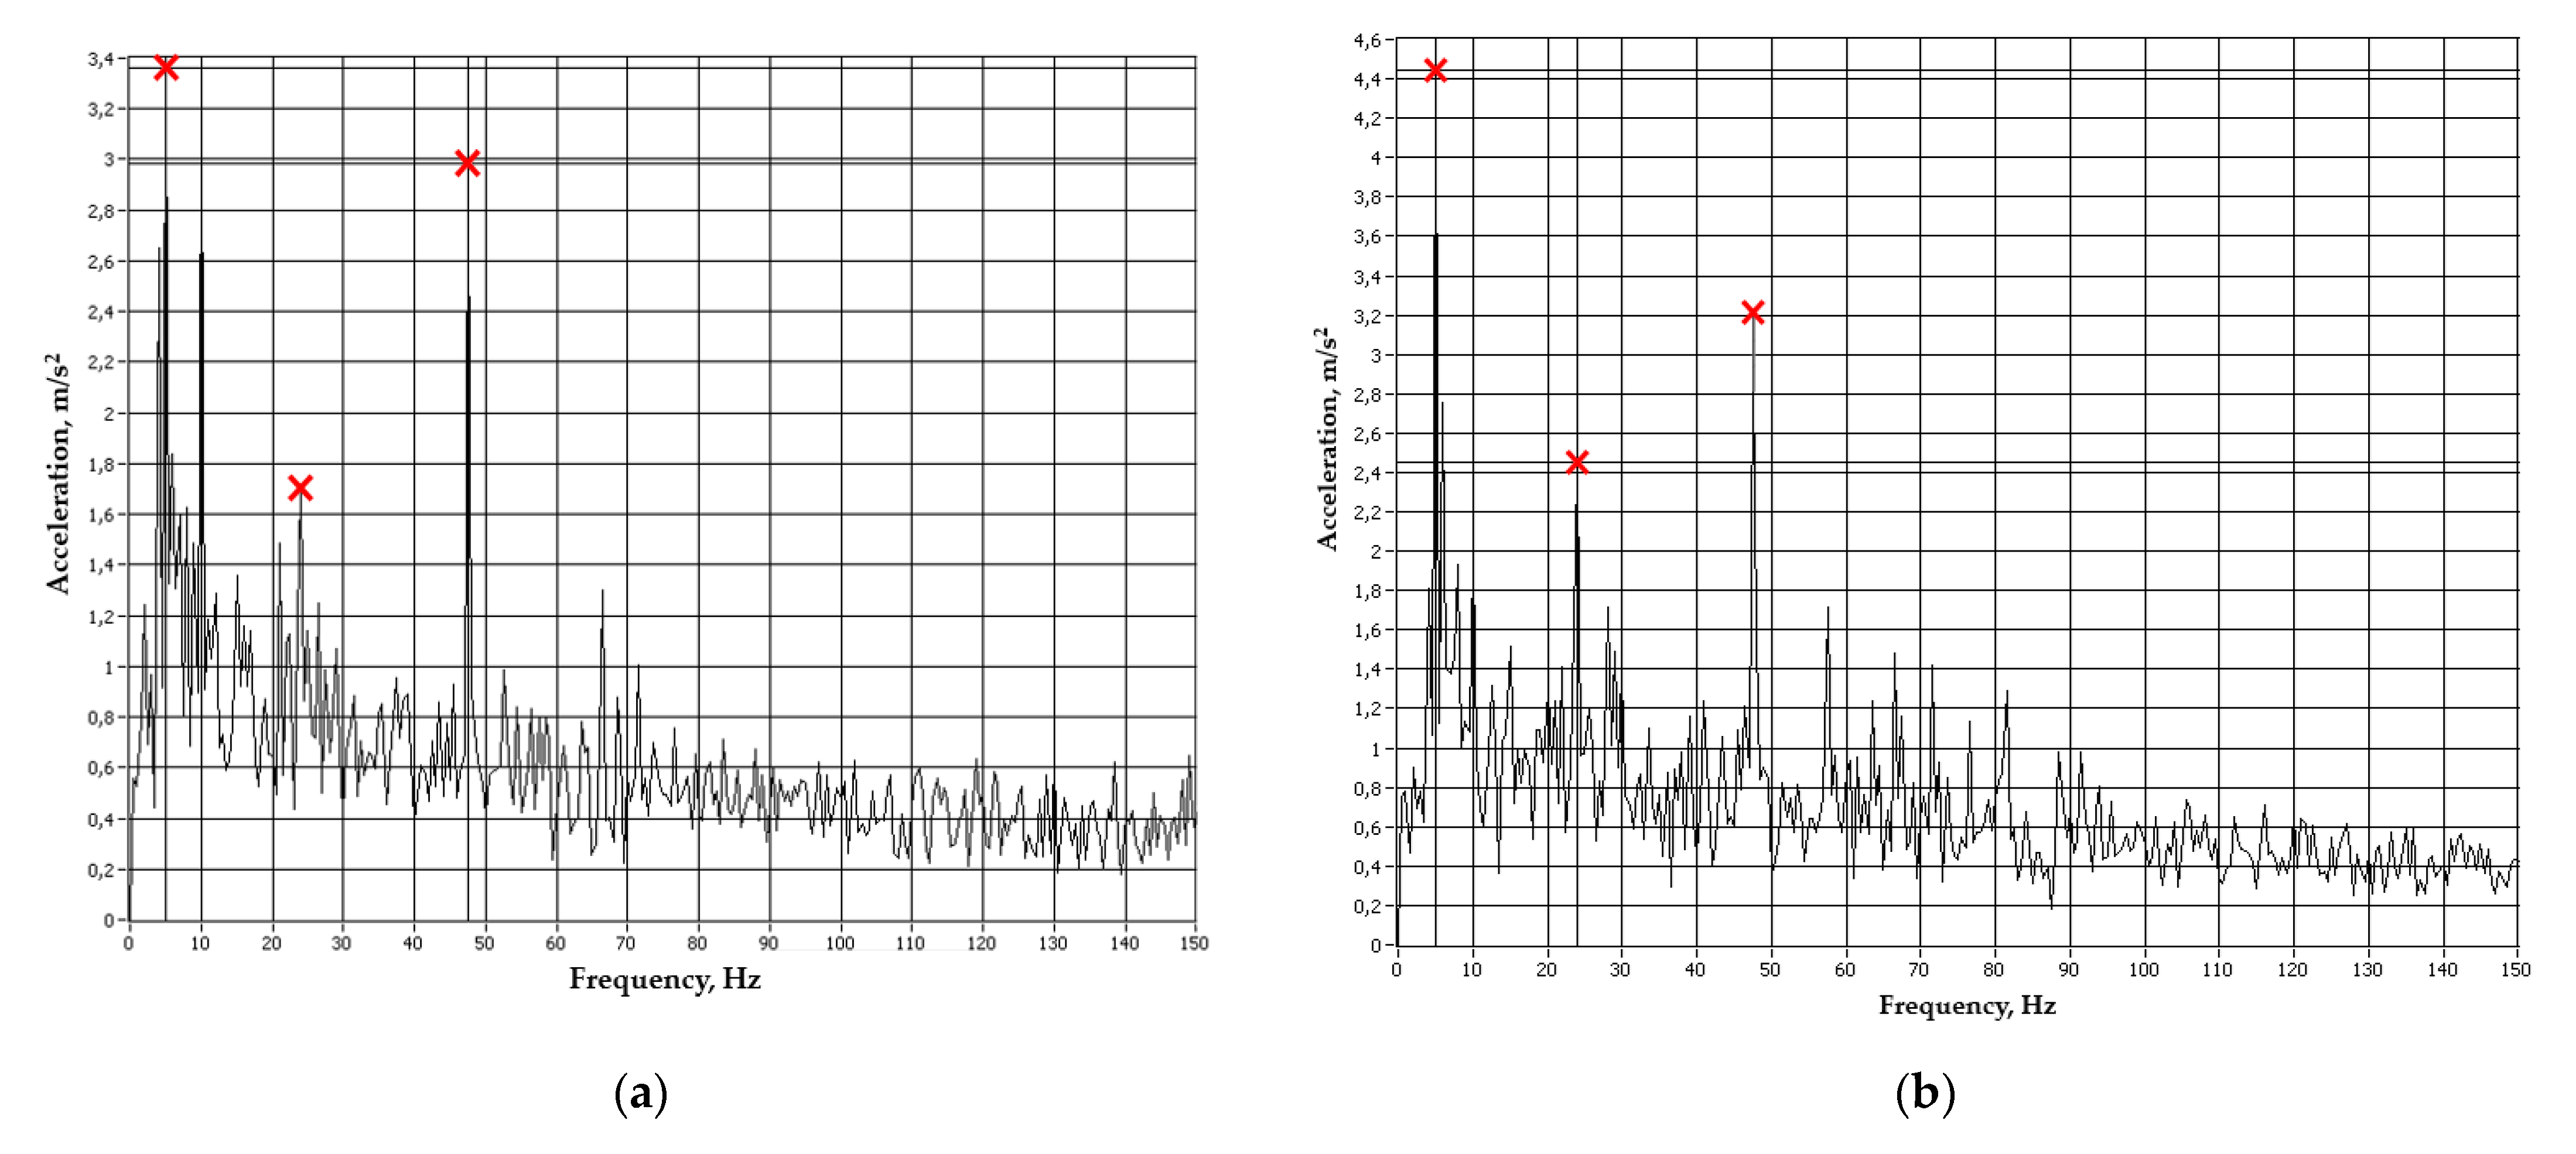
Figure 15 presents the vibration spectra of a healthy bearing and the bearing with the damaged inner ring. The speed of the motor shaft is presented at the frequency of 5 Hz, while the speed of the damaged V-belt measured at the bearing block for the small belt pulley in the vertical direction is presented at the frequency of 47.5 Hz. The faulty frequency of the bearing can be presented at the frequency of 23.5 ± 5.7 Hz. Noise pulses are identified here at the rotation frequency of 2 Hz in both cases. Comparing the frequency spectrum of the healthy bearing to the faulty bearing, the amplitude of the faulty one is significantly higher. The inner ring failure response frequency at a shaft speed of 300 rpm is 27.1 Hz.
Figure 16 present vibration spectra of faulty bearings. In these cases, the speed of the motor shaft is also presented at the frequency of 5 Hz, while the speed of the damaged V-belt is measured at 47.5 Hz. Faulty frequencies of the bearing are presented at the frequency of 23.5 ± 5.7 Hz.
The damage frequency of the outer ring is located at 23.5 Hz, which is the fundamental frequency. A higher harmonic component is presented in the case of a damaged cage due to the higher operating asymmetry. In the case of complex fault, harmonic features of the damage are visible but also depend on the fault development stage. The bearing with material fatigue demonstrates higher noise compared to the healthy bearing. The sidebands at the distance of the cage rotation frequency of 2 Hz are visible.


 ,
, 


