Article

Identification and Detection of Biological Information on Tiny Biological Targets Based on Subtle Differences

1
College of Engineering, South China Agricultural University, Guangzhou 510642, China
2
Guangdong Laboratory for Lingnan Modern Agriculture, Guangzhou 510642, China
3
College of Urban and Rural Construction, Zhongkai University of Agriculture and Engineering, Guangzhou 510225, China
4
Foshan-Zhongke Innovation Research Institute of Intelligent Agriculture and Robotics, Foshan 528200, China
*
Author to whom correspondence should be addressed.
Machines 2022, 10(11), 996; https://doi.org/10.3390/machines10110996
Submission received: 21 September 2022 / Revised: 19 October 2022 / Accepted: 27 October 2022 / Published: 30 October 2022

Abstract

:
In order to detect different biological features and dynamic tiny targets with subtle features more accurately and efficiently and analyze the subtle differences of biological features, this paper proposes classifying and identifying the local contour edge images of biological features and different types of targets and reveals high similarities in their subtle features. Taking pigeons as objects, there is little difference in appearance between female pigeons and male pigeons. Traditional methods need to manually observe the morphology near the anus of pigeons to identify their sex or carry out chromosome examination or even molecular biological examination to achieve accurate sex identification. In this paper, a compound marker region for extracting gender features is proposed. This area has a strong correlation with the gender difference of pigeons, and its area’s proportion is low, which can reduce calculation costs. A dual-weight image fusion feature enhancement algorithm based on edge detection is proposed. After the color information and contour information of the image are extracted, a new feature enhancement image is fused according to a pair of weights, and the difference between tiny features increased so as to realize the detection and identification of pigeon sex by visual methods. The results show that the detection accuracy is 98%, and the F1 value is 0.98. Compared with the original data set without any enhancement, the accuracy increased by 32% and the F1 score increased by 0.35. Experiments show that this method can achieve accurate visual sex classifications of pigeons and provide intelligent decision data for pigeon breeding.

1. Introduction

The feature detection and image processing algorithm of biological targets have not only always been focused on by image algorithms but they also are difficult problems for visual detection [1], especially with respect to plant image recognition [2] and animal feature classification. Take pigeons as an example. When people breed pigeons, they will identify and classify the sex of a batch of pigeons according to their paired living habits. Because the appearance characteristics of pigeons are highly similar, the difference is minimal, which leads to poor accuracies during manual classification, which then becomes time consuming and laborious. In order to realize a more accurate and efficient detection of targets with different biological features and small differences in appearance and to analyze subtle differences in biological features, this paper proposes classifying and identifying different types of targets in the local contour edge images of dynamic small targets, revealing subtle differences in their high similarity, and classifying and identifying females and males, which can provide intelligent decision data for pigeon breeding.
Among the existing birds, about 50% of them are monomorphic [3]. They do not have obvious external genitalia, and they cannot distinguish the individual sex of the same species from appearance. The pigeon is one of them, so it is difficult to accurately identify the individual sex via simple morphological examination. For the sex identification of monomorphic birds, it is common to dissect and observe their internal reproductive organs or to use chromosome and DNA molecular identification methods to observe cultured somatic cells with a microscope to see if there is a specific W chromosome to identify the sex. However, the number of birds’ chromosomes is large, and the distribution is chaotic, so it is easy to make classification errors by manually dividing their morphology [4]. Molecular identification methods have been applied to the sex classification of birds. Clinton, M and others have designed a chicken embryo sex identification scheme based on PCR, which uses tissue sample cells to complete the sex identification of chicken embryos and can identify the sex of chicken embryos at the early stage of development [5]. Romanov et al. carried out the sex detection of 84 bird species using molecular measurements [6].
Although the molecular-level detection method is currently an accurate nondestructive sex detection method, compared with morphological detection methods, its detection cycle is long and its cost is high. In large-scale poultry-breeding industries, morphological and behavioral detection still has certain potential and advantages: Quinn et al. can predict the sex of chicks by observing the characteristics of fluff color, stripe type, beak color, etc., and the accuracy rate can reach as high as 84.9% for specific species [7]. It is not only the appearance characteristics can be used as a certain criterion but also the information of sex differences in birds’ calls. Volodin et al. used acoustic methods to analyze the characteristics of the frequency spectrum of birds’ calls. Among the 69 tested species of birds, 25 species of adult birds achieved up to 100% sex detection accuracy [8]. In recent years, it has been proved that many monomorphic birds are only monomorphic to human vision, and the invisible spectrum properties of their feathers are not the same. Su Zhang detected and analyzed all feathers of six monomorphic passerines by spectroscopy, and based on the reflection spectrum results, Su Zhang constructed the index and function of sex discrimination and realized the optical sex detection of birds [3].
Currently, the morphological or behavioral analysis of birds mainly depends on artificially summarizing and comparing a certain index or several indexes of species [7,9,10]. Currently, there is no research on deep learning combined with visual information to detect the sex of birds. However, face recognition and detection methods have become focuses of research studies. From the morphological point of view, the morphological indexes of different faces are quite similar, and the difference is very small. Based on the geometric features of faces, Turk et al. studied the location and tracking of the target head, which can realize real-time unsupervised specific face recognition. This method relies on the gray correlation between the images of the training set and the test set and requires that the test image be similar to the face image used for training, so it has limitations [11]. Penev et al. put forward a new mathematical structure-local feature analysis based on principal component analysis. Compared with principal component analysis, local feature analysis is more suitable for biological targets, but the recognition accuracy of this model cannot meet the requirements [12].
Deep learning and its neural network are applied in biometric identification. Compared with traditional methods, deep learning combined with principal component analysis and other methods can achieve accurate target recognition. Aggarwal et al. used neural network methods to recognize faces, improved image quality by using image enhancement methods such as bilateral filtering and histogram equalization, and then used principal component analysis and linear discrimination to recognize identities [13]. To overcome problems of slow speed and the easy overfitting of RCNN, Xia et al. studied sparse PCA-CNN algorithms based on multi-RPN fusion and achieved good results [14]. The detection effect based on deep learning is mainly related to training set, training set quality, and detection effect. There are some problems in the collected image data, such as noise, blur, etc. [15], including that the features detected may be too small and the differences between the objects to be classified are too small, which will affect the image training quality, make it difficult to converge, reduce the detection accuracy, etc. [16]; so, it is necessary to enhance the image’s data. Peters et al. proposed a morphological image cleaning algorithm, which realized the detection of subtle features of targets [17]. Laine et al. proposed a multi-scale feature enhancement method, which realized the undistorted enhancement of almost-invisible features in mammograms [18]. Using image enhancement, Agarwal et al. combined multi-source image fusion to locate tiny lesions [19]. Shao et al., based on depth convolution neural networks, extracted salient features of the target [20], and scholars fused RGB and depth images to develop algorithms for fruit locations [21] and attitude estimation [22].
Using geometric feature analyses to detect the sex of monomorphic birds by visual methods in visible light bands is difficult because both sexes have highly similar morphological characteristics. At the same time, due to the lack of large-capacity and high-quality training sets, the effect of deep learning is not ideal.
In view of the above problems, this paper studies the fast visual sex detection method of pigeon features based on the YOLO v5 model and explores the image recognition algorithm of subtle feature differences in the high similarity of biological targets. In the stage of the data set building, a sex feature extraction area for fast visual detection is proposed, and the edge detection algorithm is fused. The color distribution information and the edge contour information are extracted, and the enhanced image is fused according to a certain weight as the training set. The main contributions of this paper are as follows:
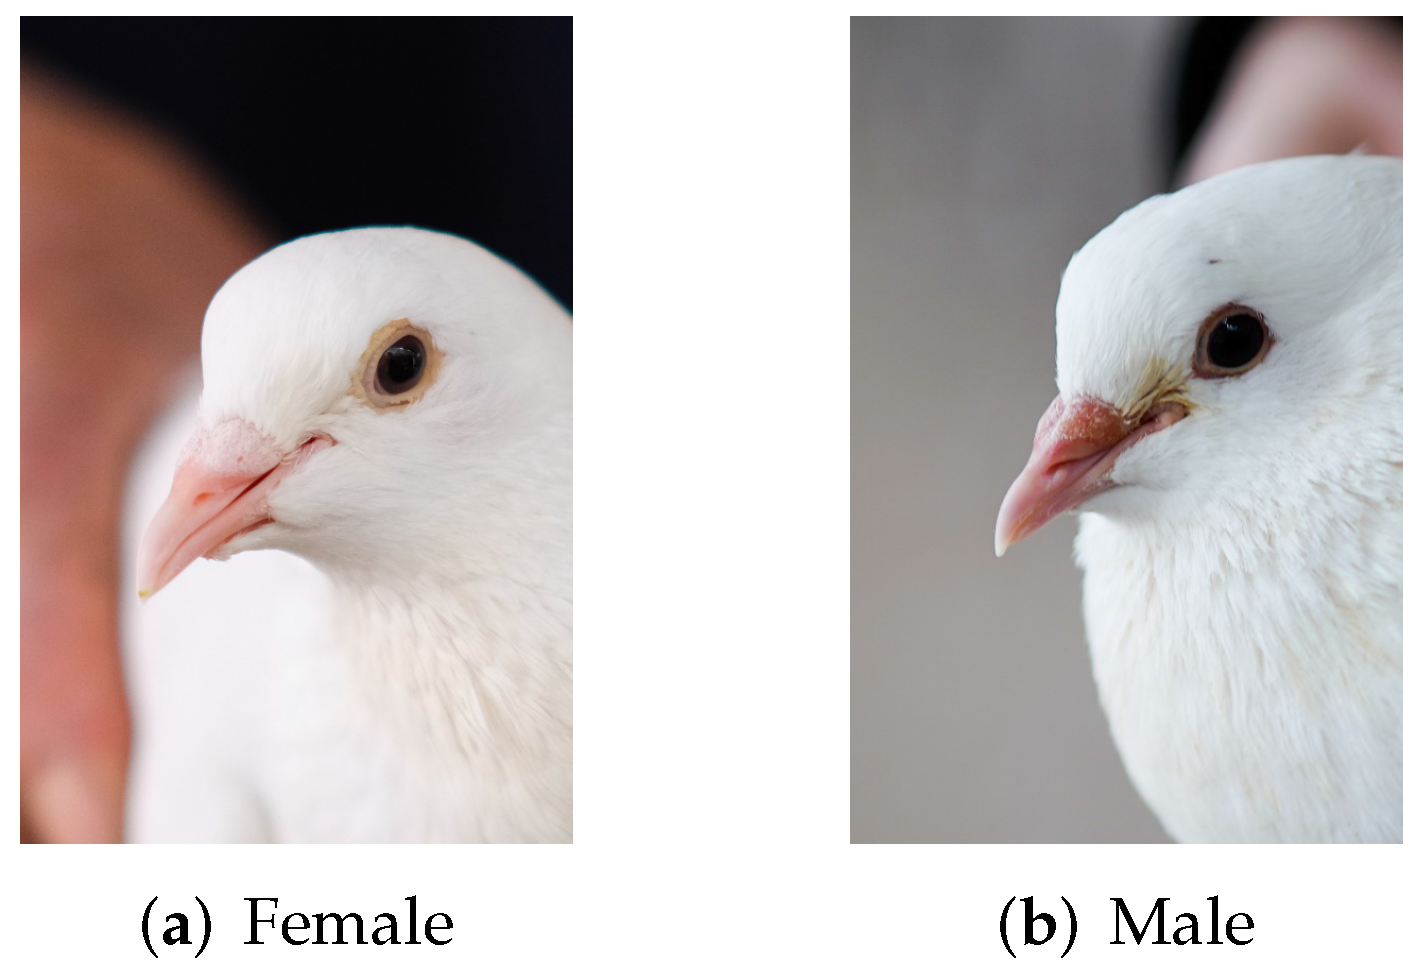
  • According to the analysis of the tiny differences of biological characteristics, the detection area of pigeon’s sex characteristics is proposed, which has a strong correlation with pigeon’s sex, and the image of this area is easy to obtain in the breeding process;
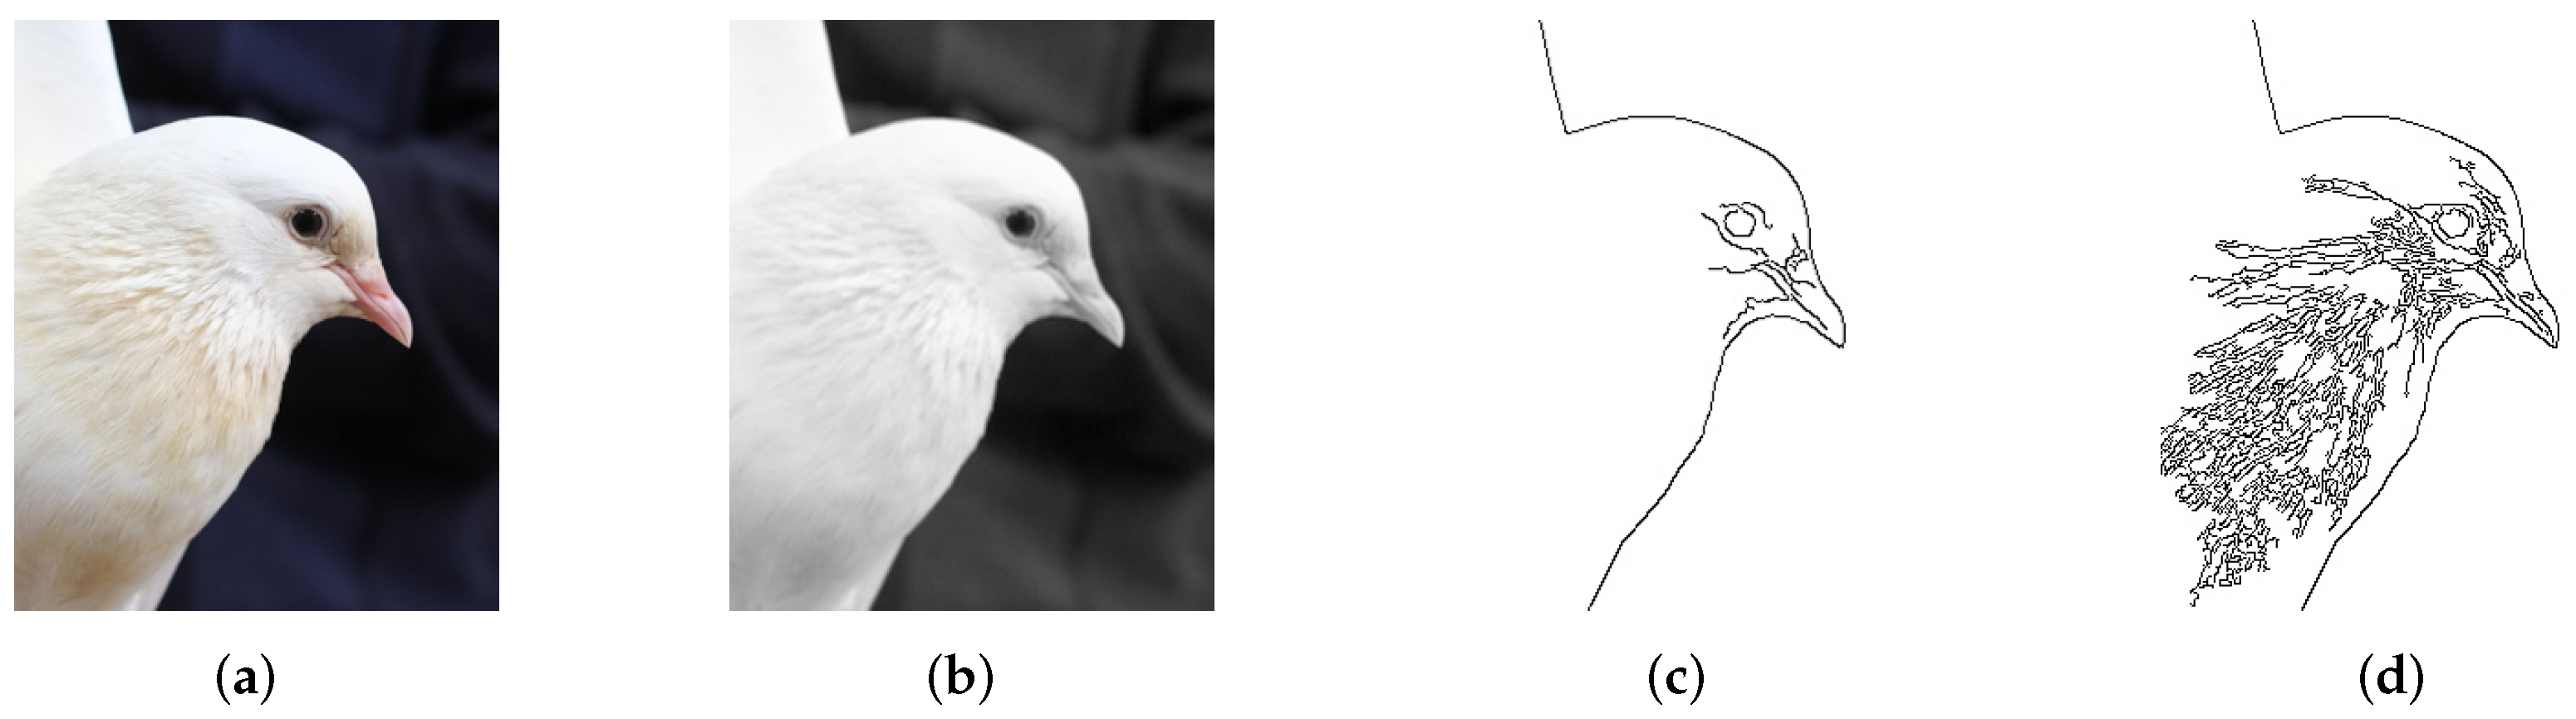
  • A feature enhancement method based on edge detection is proposed. The color distribution information and edge contour information of the image are extracted by stripping brightness information and edge detection, and then they are fused into a new enhanced image as required.

2. Materials and Data

2.1. Experimental Equipment

The experimental platform is based on Windows, and the main hardware configuration is: the processor is intel(R) Core(TM) i7-10700F, the memory is 16GB DDR4 RAM, and the graphics card is NVIDIA RTX 2060 Super 8GB GDDR5. The software is written based on OpenCV library and YOLO v5 framework.

2.2. Image and Data Acquisition

The image was collected on 9 April 2021 at the Yongyu Zhengguo Pigeon Farm, Guangzhou, Guangdong Province. Two mirrorless interchangeable lens cameras were used as the image acquisition equipment, Sony ILCE-7M3, Fujifilm, Japan. and Fuji XT30, Fujifilm, Japan, and both were equipped with equivalent 85MM lenses under the full frame and shot under the same exposure parameters and the same light environment. In order to eliminate data leakage caused by factors such as the preset color tendency of the camera, 1447 pictures of pigeons of different sexes in different lighting environments were taken with these two cameras. After screening, 1200 photos were retained, including 600 male pigeons and 600 female pigeons, and the photos were converted into JPG images with a resolution of 3000*2000. After manual labeling with Labellmg software, the total sample set is automatically and randomly divided into three subsets by writing scripts: 960 training sets, accounting for 80% of the total sample set; 60 verification sets, accounting for 5% of the total sample set; and 180 test sets, accounting for 15% of the total sample set.

3. Build Enhanced Image Data Set

3.1. Image Preprocessing

The light environment of the pigeon farm is complicated, the ambient light is dark, and the shutter speed and aperture value set by the camera are high, which leads to a lot of noise in the image. These noises will not only affect the image quality but also greatly increase the image’s file size for pictures with the JPG compression format, which will result in the inability to train with a large Bach-size and affect the effect of subsequent model training and detection. Therefore, the average sampling method is adopted to downsample the training set, as shown in Figure 1.
Several 2 × 2 windows are used to downsample the original image, which significantly suppresses the obvious brightness noise in the image and does not destroy the color distribution information in the image. After downsampling, the resolution of the image is reduced to 1500*1000, and the file size is also significantly reduced.

3.2. Data Set Annotation Based on Eye-Beak Compound Area

As shown in Figure 2, the pigeon head mainly includes the eyes, the top of the head, the front of the eyes, the beak, the chin, the cheek, and other parts. For non-monomorphic birds, the heads of different sex often have obvious differences in appearance, while for monomorphic birds, the heads of different sex have no or small differences. As shown in Figure 3, male pigeons and female pigeons are highly similar in this area, but there are still subtle differences in characteristics, such as the shape of the top of the head, the shape of the eyes, the relative position of each part of this area, etc. Traditional pigeon breeding industry also uses the manual visual inspection of this area to judge the sex, and it has certain accuracies.
In this paper, the eye-beak compound area is labeled, and the features are extracted in this area. As shown in Figure 4, one side of the annotation box is tangent to the edge of the beak, and the other side is tangent to the eye, thus limiting the detection network to only extract features from the inside of this area. As a control, the entire head of the pigeon is labeled.

3.3. Generate Enhanced Image Data Set

3.3.1. Extract Color Information

Color distributions in color images contain a lot of information, which can be used for object detection and semantic segmentation to realize environmental perception. Wu et al. realized the detection and recognition of banana flowers by the hue threshold segmentation method [2] and eliminated the interference of ambient light changes on the detection results. Benallal et al. achieved real-time road sign segmentation on a simple hardware platform via color segmentation [23]. For computer-stored color images, the color of each pixel is usually recorded, represented, and transmitted by RGB methods; that is, the color of each parent pixel is given by the values of R, G, and B channels. However, the disadvantage of this representation method is that the brightness and saturation of a single pixel are controlled by values of the R, G, and B channels together, which is not in line with human visual intuition and also makes the effect of visual detection largely dependent on the brightness of the environment.
In order to eliminate the influence of the complex light environment, we convert the color of the image into the HSV color space:
h = 0 60 × G B max min + 0 , max = R and G B 60 × G B max min + 360 , max = R and G < B 60 × B R max min + 120 , max = G 60 × R G max min + 240 , max = B
s = 0 , max = 0 max min max 1 min max , max 0
v = max
where
  • h—hue value;
  • s—saturation value;
  • v—brightness value;
  • R—red channel value;
  • G—green channel value;
  • B—blue channel value;
  • max—The maximum value of R, G, and B;
  • min—The minimum value R, G, and B.
In HSV color space, the color of a single pixel is determined by hue value h, saturation value s, and lightness value v. The change in light environments only affects the change in lightness value V but hardly affects hue value H and saturation value S. Therefore, the color distribution information in the original picture can be extracted by changing the V channel of all pixels to a certain value. The process of extracting color distribution information is shown in Figure 5.

3.3.2. Edge Information Extraction

Edge detection is an important feature extraction method. The possible edges can be obtained by finding and connecting points with sharp intensity changes in all directions, and the edges with weak confidence can be filtered out by the threshold [24]. Wu et al. used edge detection algorithms to obtain the edge contour of banana flower and its inflorescence axis and realized the detection of its growth direction [2]. Zhan et al. improved the judgment and recognition of moving objects in the picture based on the difference between consecutive frames and the edge detection method [25]. For the color image to be detected, it is necessary to first convert the image into a single-channel grayscale image, and the conversion formula is shown in Formula (4).
G r a y = R × 0.299 + G × 0.587 + B × 0.114
  • Gray—The brightness value of gray image
  • R—The brightness value of red channel in color image
  • G—The brightness value of green channel in color image
  • B—The brightness value of blue channel in color image
There is no uniform texture orientation with respect to the pigeon’s head feathers. In this paper, the Canny algorithm is selected as the edge search algorithm, which keeps the contour information in all directions. At the same time, in order to keep as much edge information as possible for detection and recognition, the image will not be blurred before edge detection. As shown in Figure 6, compared with the image with Gaussian blur, the image without blur can detect more contours and keep the complete contour information of pigeon’s head.

3.3.3. Generate Enhanced Image

Color information and contour information are fused in HSV space to generate enhanced images. For any point P in the image, the values of its three channels (HFusion, SFusion, VFusion) can be calculated by the following formula.
H F u s i o n = H C o l o r
S F u s i o n = 0 , V E d g e = 0 α × S C o l o r , V E d g e = 255
V F u s i o n = V C o l o r , V E d g e = 255 ( 1 β ) × 255 , V E d g e = 0
  • α —The weight of color information in the enhanced image, α ( 0 , 1 )
  • β —The weight of edge information in the enhanced image, β ( 0 , 1 )
  • H C o l o r —Hue channel of color information
  • S C o l o r —Saturation channel of color information
  • V C o l o r —Brightness channel of color information
  • V E d g e —Brightness channel of edge information
This weight determines the ratio of color distribution information and edge information, and it can change according to different biological species and detection requirements, as shown in Figure 7: For those with large color distribution differences and similar contours, a smaller weight can be selected; on the contrary, those with large contour differences and similar color distributions can choose larger weights. When two weights are equal, we consider that color information and contour information have the same contribution value to the difference.

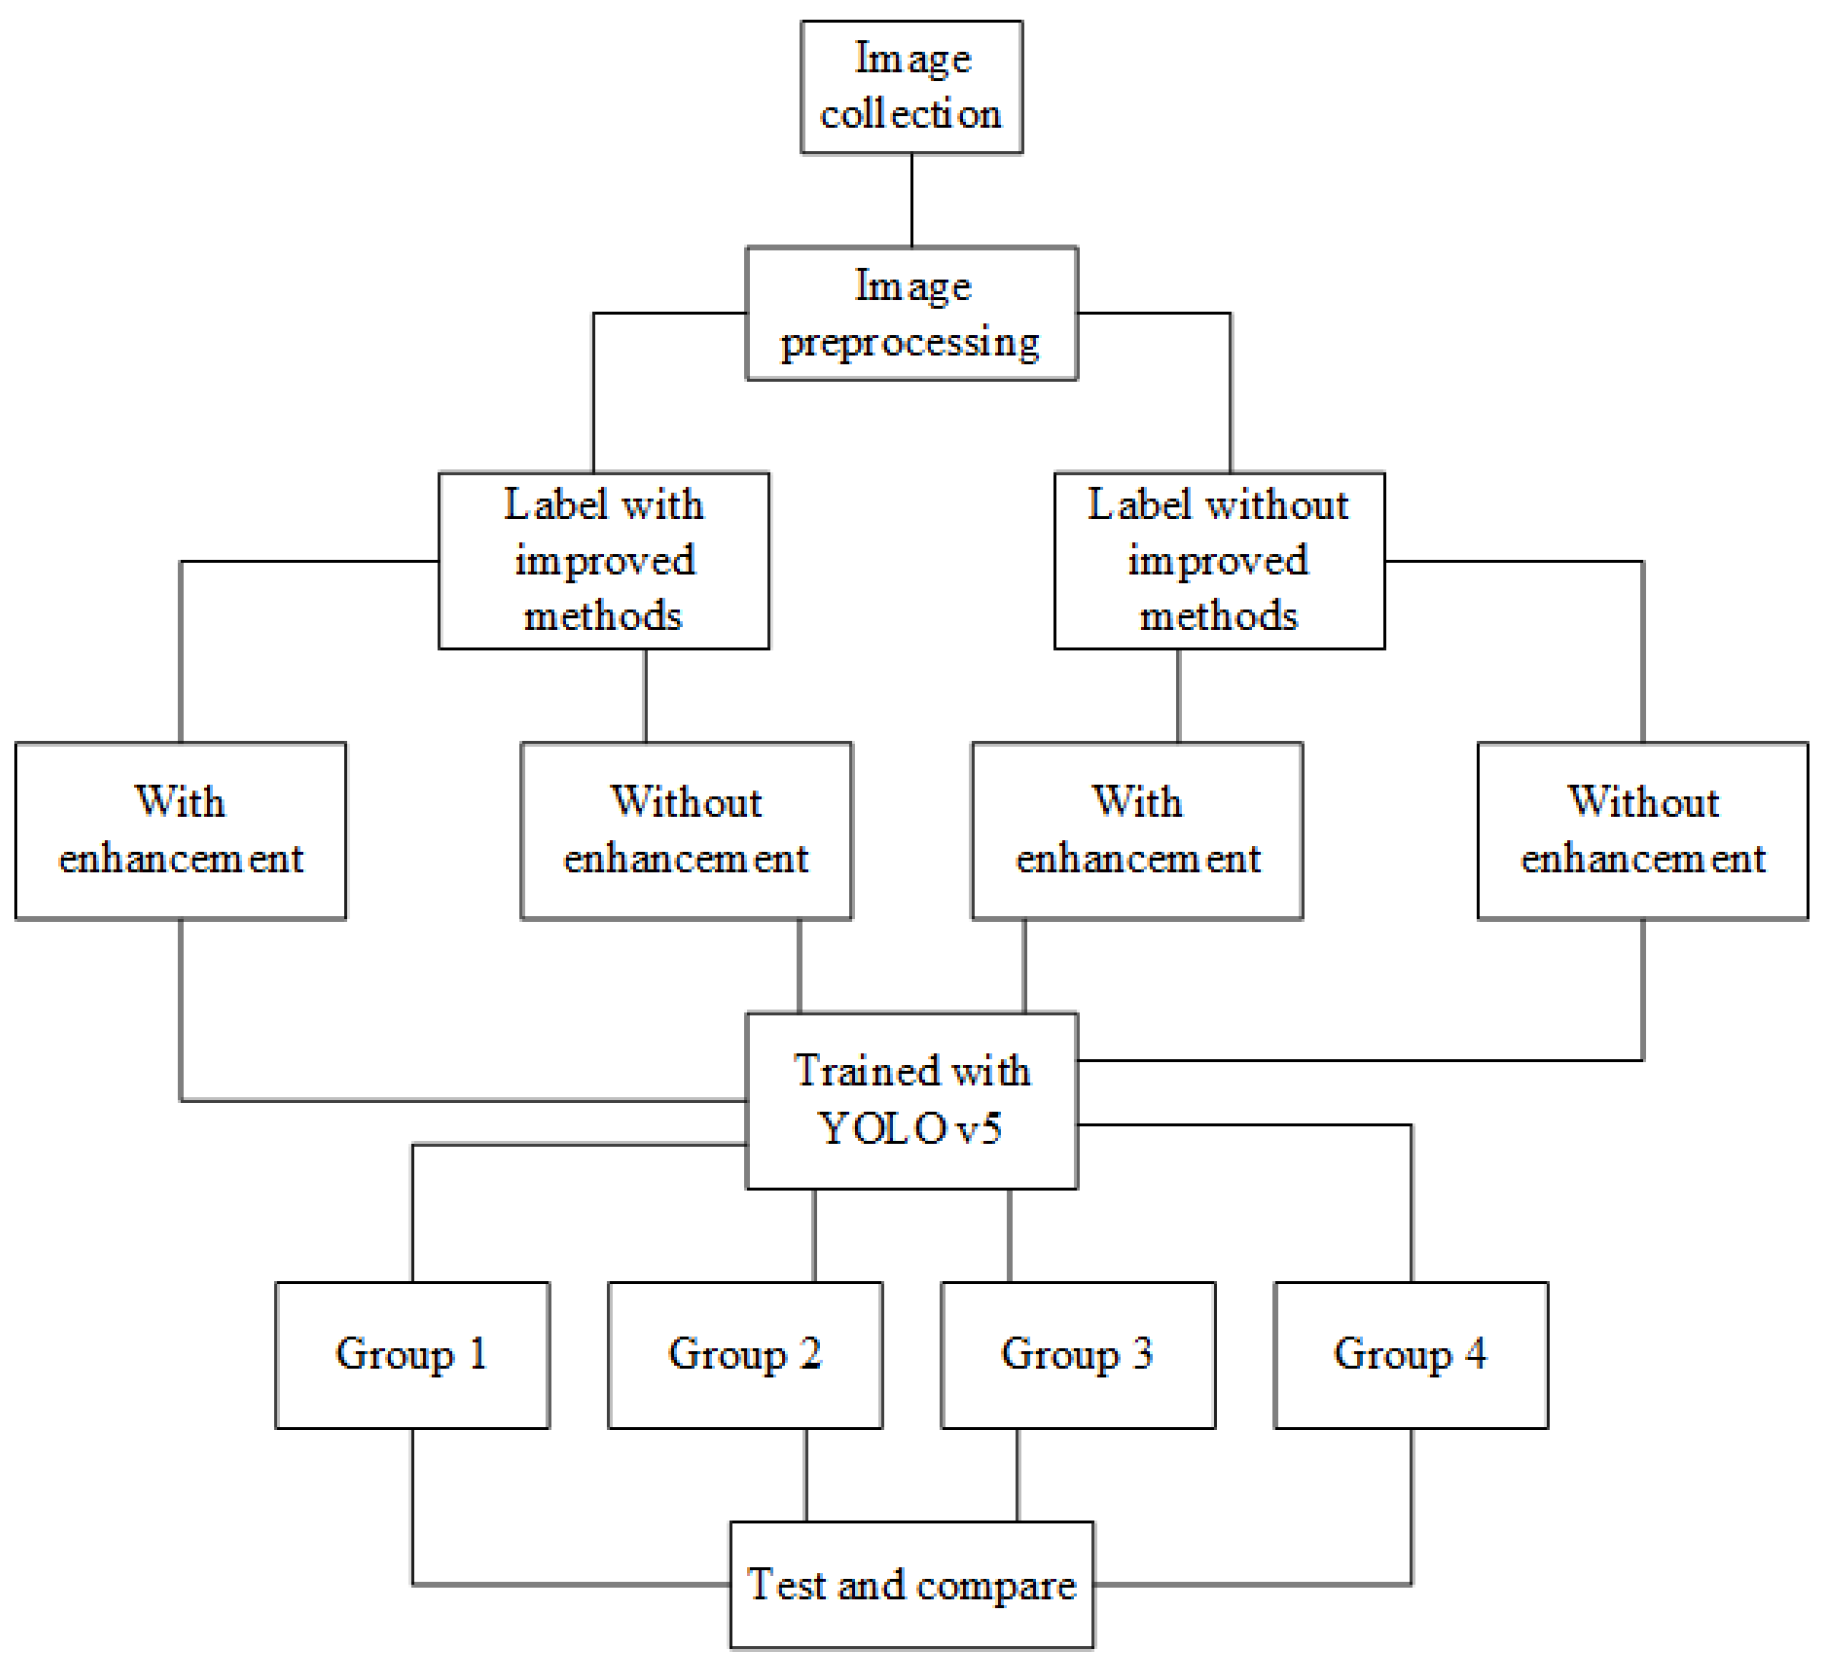
4. Test and Result Analysis

4.1. Model Training

YOLO (You Only Look Once) [26]: The target detection framework was first proposed in 2016. Compared with Fast R-CNN [27], YOLO’s advantages include high speed and being light weight. Via iterative upgrades, its recognition accuracy rate correspondingly improves [28,29,30], but there are still some problems such as the confusion of subtle features [28]. YOLO v5 [31] improves the detection of small targets and subtle differences, and its architecture diagram is shown in Figure 8, which is mainly composed of three parts: Backone, Neck, and Output. Compared with YOLO v4, YOLO v5 resamples more efficiently by introducing the Focus mechanism into the Backbone part, which reduces the computational cost while retaining more original information. It is more suitable for the sex identification of male and female pigeons with high similarity and can realize the deep feature extraction of objects with slight differences.
YOLO v5 has four network structure models: YOLO V5s, YOLO V5m, YOLO V5l, and YOLO V5x. Among them, YOLO V5’s network structure is the one with the smallest depth and the smallest width of the characteristic graph among the four network structures. YOLO V5m, YOLO V5l, and YOLO V5x all deepen the network’s structure and complexity on the basis of YOLO V5s. Using a more complex structure will improve the ability of feature extraction, but it will also require higher computational power and reduce real-time detection performances.
In this paper, the YOLO v5 framework is used to train the enhanced image, and the smallest Yolo V5 model is selected as the detection network. The test set and the verification set are copied into four groups, and each group is treated as follows: The first group does not have any enhancements, the second group is only enhanced with features (weight α = 1 and weight β = 1 ), the third group only uses the improved labeling method, and the fourth group is enhanced with the improved labeling method and features (weight α = 1 and weight β = 1 ). After training, the test sets are used for testing and data analysis. The overall test flow chart is shown in Figure 9.

4.2. Results and Analysis

After training with the YOLO v5 network, four weight files are obtained, which correspond to four different images and enhancement methods, respectively, and the partial detection results of four groups of different models are given, as shown in Table 1. The detection accuracy, recognition rate, and recall rate of four groups of different models are tested, and their detection effects are compared, as shown in Table 2.
When dividing the data set, 180 pictures were randomly and automatically divided into test sets by scripts, including 90 males and 90 females. We use the same image enhancement method as the corresponding training set, and then we send it to the YOLO v5 network for detection and summarize the statistical detection results, as shown in Table 2:
In order to evaluate the detection accuracy and generalization performance of the models trained with different data sets, the accuracy, precision, recall, and F1-Score are used as the evaluation indexes of the models for this binary classification problem, and their calculation formulas are as follows.
A c c = T p + T n T p + T n + F p + F n
P r e = T p T p + F p
R = T p T p + F n
F 1 S c o r e = 2 × P r e × R P r e + R
  • T p —Number of samples to predict males as males
  • T n —Number of samples to predict females as females
  • F p —Number of samples to predict females as males
  • F n —Number of samples to predict males as females
  • A c c —Accuracy of the model
  • P r e —Precision of the model
  • R—Recall rate of the model
  • F 1 Score— F 1 score of the model
We use data from Table 2 in Formulas (8)–(11) to calculate the accuracy rate, precision rate, recall rate, and F1 score, and we show the obtained statistics in Table 3 below.
A total of 720 images of detection results were analyzed in four groups. In the first group, the number of detected targets was more than 180 without any treatment, and a single target in some images was predicted to be male and female at the same time. Compared with control group 1, group 2 achieved a 0.1 increase in F1 score only via image enhancement, but there was still the phenomenon that a single target was predicted to be male and female at the same time. In the third group, only the improved labeling method was used to label the compound area, and there was no phenomenon that a single target was predicted to be male and female at the same time. All 180 targets were detected, and compared with control group 1, the F1 score increased by 0.31. In the fourth group, the compound area was marked, and after image enhancement, no single target was predicted to be male and female at the same time, and all 180 targets were detected, achieving an F1 score increase of 0.35 compared with the control group 1.
The experimental results show that, compared with the data of four groups of detection results, for monomorphic birds, labeling the proposed compound area can greatly improve the detection effect, and image enhancements alone can improve the feature difference between male pigeons and female pigeons, but the improvement effect is substantially lesser than that of labeling the proposed compound area. Combining the two improved methods can achieve the best detection effect.

5. Conclusions

In this paper, the algorithms of small target images with different biological features and subtle differences of features are studied. By enhancing the subtle differences of their high similarity, an algorithm of partial image classification and the recognition of biological features based on edge extraction is proposed. An improved compound feature labeling area and deep learning algorithm are adopted, and a double-weight image fusion feature enhancement algorithm based on edge detection is proposed. After the color information and contour information of the image are extracted separately, a new feature-enhanced image is fused according to a pair of weights, which can increase the difference between small features. Taking pigeons as the research object, this paper studies the visual sex classification of monomorphic birds, proposes a compound detection area for extracting hidden features, and a feature enhancement algorithm based on edge detection and double-weight image fusion. Combined with the YOLO v5 network, the visual sex detection of pigeons is realized. In this paper, four methods are used to process data sets, and four groups of comparative experiments are carried out. Among them, the fourth group uses the data set processed by the method proposed in this paper, and its detection accuracy reaches 98%, and its F1 score reaches 0.98. Compared with the first group using the initial data set without any enhancement, it achieves a 32% increase in accuracy and a 0.35 increase in F1 score.
In the future, this method will be further extended to the sex identification of other monomorphic birds, and the invisible spectrum images other than visible light can be collected. Via multi-spectral image fusion and feature enhancement, combined with deep learning, sex detection and identification with higher accuracy can be realized.

Author Contributions

Data curation, S.C. and H.H.; Project administration, X.Z.; Software, S.C.; Supervision, Y.T. and X.Z.; Validation, S.C., Y.T., X.Z., K.H., B.H. and Y.P.; Writing—original draft, S.C.; Writing—review & editing, Y.T. and X.Z. All the listed authors have made substantial, direct and intellectual contributions to this work and approved its publication. All authors have read and agreed to the published version of the manuscript.

Funding

This research was developed in the project “(NT 2021009) Guangdong Laboratory for Lingnan Modern Agriculture Project”, which was funded by Guangdong Laboratory for Lingnan Modern Agriculture, and the project “(2120001008424) Dongguan wisdom aquaculture and unmanned processing equipment technology innovation platform”.

Data Availability Statement

Not applicable.

Conflicts of Interest

The author states that the research was conducted without any commercial or financial relationship that could be interpreted as a potential conflict of interests.

References

  1. Tang, Y.; Chen, M.; Wang, C.; Luo, L.; Li, J.; Lian, G.; Zou, X. Recognition and localization methods for vision-based fruit picking robots: A review. Front. Plant Sci. 2020, 11, 510. [Google Scholar] [CrossRef] [PubMed]
  2. Wu, F.; Duan, J.; Chen, S.; Ye, Y.; Ai, P.; Yang, Z. Multi-target recognition of bananas and automatic positioning for the inflorescence axis cutting point. Front. Plant Sci. 2021, 12. [Google Scholar] [CrossRef] [PubMed]
  3. Su, C. Study on Sex Identification of Six Species of Monotypic Passerine Birds by Reflectance Spectroscopy. Master’s Thesis, Northeast Forestry University, Harbin, China, 2019. (In Chinese). [Google Scholar] [CrossRef]
  4. Li, G.; Yang, S.; Zhou, H.; Ren, J.; Ma, Q.; Wang, W. Research progress of bird sex identification technology. Dong Wu Xue Za Zhi 2003, 106–108. (In Chinese) [Google Scholar] [CrossRef]
  5. Clinton, M.; Haines, L.; Belloir, B.; McBride, D. Sexing chick embryos: A rapid and simple protocol. Br. Poult. Sci. 2001, 42, 134–138. [Google Scholar] [CrossRef]
  6. Romanov, M.N.; Betuel, A.M.; Chemnick, L.G.; Ryder, O.A.; Kulibaba, R.O.; Tereshchenko, O.V.; Payne, W.S.; Delekta, P.C.; Dodgson, J.B.; Tuttle, E.M. Widely applicable PCR markers for sex identification in birds. Russ. J. Genet. 2019, 55, 220–231. [Google Scholar] [CrossRef]
  7. Quinn, J.P.; Knox, C.W. Sex identification of Barred Plymouth Rock baby chicks by down, shank, and beak characteristics. Poult. Sci. 1939, 18, 259–264. [Google Scholar] [CrossRef]
  8. Volodin, I.A.; Volodina, E.V.; Klenova, A.V.; Matrosova, V.A. Gender identification using acoustic analysis in birds without external sexual dimorphism. Avian Res. 2015, 6, 1–17. [Google Scholar]
  9. Henderson, E.W. Sex identification by down color of silver laced and “Red Laced Silver” chicks. Poult. Sci. 1959, 38, 599–602. [Google Scholar] [CrossRef]
  10. Homma, K.; Siopes, T.D.; Wilson, W.O.; McFarland, L.Z. Identification of sex of day-old quail (Coturnix coturnix japonica) by cloacal examination. Poult. Sci. 1966, 45, 469–472. [Google Scholar] [CrossRef]
  11. Turk, M.; Pentland, A. Eigenfaces for recognition. J. Cogn. Neurosci. 1991, 3, 71–86. [Google Scholar] [CrossRef]
  12. Penev, P.S.; Atick, J.J. Local feature analysis: A general statistical theory for object representation. Network: Comput. Neural Syst. 1996, 7, 477–500. [Google Scholar] [CrossRef]
  13. Aggarwal, R.; Bhardwaj, S.; Sharma, K. Face Recognition System Using Image Enhancement with PCA and LDA. In Proceedings of the 2022 6th International Conference on Computing Methodologies and Communication (ICCMC), Erode, India, 29–31 March 2022; pp. 1322–1327. [Google Scholar]
  14. Xia, C.K.; Zhang, Y.Z.; Zhang, P.F.; Qin, C.; Zheng, R.; Liu, S.W. Multi-RPN Fusion-Based Sparse PCA-CNN Approach to Object Detection and Recognition for Robot-Aided Visual System. In Proceedings of the 2017 IEEE 7th Annual International Conference on CYBER Technology in Automation, Control, and Intelligent Systems (CYBER), Honolulu, HI, USA, 31 July–4 August 2017; pp. 394–399. [Google Scholar]
  15. Liu, C.; Tao, Y.; Liang, J.; Li, K.; Chen, Y. Object detection based on YOLO network. In Proceedings of the 2018 IEEE 4th Information Technology and Mechatronics Engineering Conference (ITOEC), Chongqing, China, 14–16 December 2018; pp. 799–803. [Google Scholar]
  16. Foody, G.; McCulloch, M.; Yates, W. The effect of training set size and composition on artificial neural network classification. Int. J. Remote Sens. 1995, 16, 1707–1723. [Google Scholar] [CrossRef]
  17. Peters, R.A. A new algorithm for image noise reduction using mathematical morphology. IEEE Trans. Image Process. 1995, 4, 554–568. [Google Scholar] [CrossRef] [PubMed] [Green Version]
  18. Laine, A.F.; Schuler, S.; Fan, J.; Huda, W. Mammographic feature enhancement by multiscale analysis. IEEE Trans. Med. Imaging 1994, 13, 725–740. [Google Scholar] [CrossRef] [Green Version]
  19. Agarwal, J.; Bedi, S.S. Implementation of hybrid image fusion technique for feature enhancement in medical diagnosis. Hum.-Centric Comput. Inf. Sci. 2015, 5, 1–17. [Google Scholar] [CrossRef] [Green Version]
  20. Shao, Z.; Cai, J. Remote sensing image fusion with deep convolutional neural network. IEEE J. Sel. Top. Appl. Earth Obs. Remote Sens. 2018, 11, 1656–1669. [Google Scholar] [CrossRef]
  21. Lin, G.; Tang, Y.; Zou, X.; Li, J.; Xiong, J. In-field citrus detection and localisation based on RGB-D image analysis. Biosyst. Eng. 2019, 186, 34–44. [Google Scholar] [CrossRef]
  22. Lin, G.; Tang, Y.; Zou, X.; Xiong, J.; Li, J. Guava detection and pose estimation using a low-cost RGB-D sensor in the field. Sensors 2019, 19, 428. [Google Scholar] [CrossRef] [PubMed] [Green Version]
  23. Benallal, M.; Meunier, J. Real-time color segmentation of road signs. In Proceedings of the CCECE 2003—Canadian Conference on Electrical and Computer Engineering. Toward a Caring and Humane Technology (Cat. No. 03CH37436), Montreal, QC, Canada, 4–7 May 2003; pp. 1823–1826. [Google Scholar]
  24. Torre, V.; Poggio, T.A. On edge detection. IEEE Trans. Pattern Anal. Mach. Intell. 1986, PAMI-8, 147–163. [Google Scholar] [CrossRef] [PubMed]
  25. Zhan, C.; Duan, X.; Xu, S.; Song, Z.; Luo, M. An improved moving object detection algorithm based on frame difference and edge detection. In Proceedings of the Fourth International Conference on Image and Graphics (ICIG 2007), Chengdu, China, 22–24 August 2007; pp. 519–523. [Google Scholar]
  26. Redmon, J.; Divvala, S.; Girshick, R.; Farhadi, A. You only look once: Unified, real-time object detection. In Proceedings of the 2016 IEEE Conference on Computer Vision and Pattern Recognition, Las Vegas, NV, USA, 27–30 June 2016; pp. 779–788. [Google Scholar]
  27. Girshick, R. Fast r-cnn. In Proceedings of the 2015 IEEE International Conference on Computer Vision (ICCV), Santiago, Chile, 7–13 December 2015; pp. 1440–1448. [Google Scholar]
  28. Jiang, P.; Ergu, D.; Liu, F.; Cai, Y.; Ma, B. A Review of Yolo algorithm developments. Procedia Comput. Sci. 2022, 199, 1066–1073. [Google Scholar] [CrossRef]
  29. Redmon, J.; Farhadi, A. Yolov3: An incremental improvement. arXiv 2018, arXiv:1804.02767. [Google Scholar]
  30. Han, X.; Chang, J.; Wang, K. Real-time object detection based on YOLO-v2 for tiny vehicle object. Procedia Comput. Sci. 2021, 183, 61–72. [Google Scholar] [CrossRef]
  31. Jocher, G.; Stoken, A.; Borovec, J.; Chaurasia, A.; Changyu, L.; Laughing, A.; Hogan, A.; Hajek, J.; Diaconu, L.; Marc, Y.; et al. ultralytics/yolov5: V5. 0-YOLOv5-P6 1280 models AWS Supervise. ly and YouTube integrations. Zenodo 2021, 11. [Google Scholar] [CrossRef]
Figure 1. Average-down sampling. (a) Ideal image. (b) Images with noise. (c) Image downsampled by the averaging method.
Machines 10 00996 g001
Figure 2. Names of several areas in the pigeon head.
Machines 10 00996 g002
Figure 3. Comparison of the heads of female pigeons and male pigeons.
Machines 10 00996 g003
Figure 4. Labeled area for feature extraction. (a) The eye-beak compound area is labled. (b) The entire head is labeled.
Machines 10 00996 g004
Figure 5. Extract color distribution information. (a) Original image. (b) Hue channel. (c) Saturation channel. (d) Color distribution information.
Machines 10 00996 g005
Figure 6. Extract outline information. (a) Original image. (b) Gray image. (c) Contour information obtained with Gaussian blur. (d) Contour information obtained without Gaussian blur.
Machines 10 00996 g006
Figure 7. Enhanced images generated with different weights.
Machines 10 00996 g007
Figure 8. The network structure of YOLO v5.
Machines 10 00996 g008
Figure 9. Overall flow chart.
Machines 10 00996 g009
Table 1. Partial test results display of different models.
Original ImageDetection Result
Group 1Group 2Group 3Group 4
Machines 10 00996 i001Machines 10 00996 i002Machines 10 00996 i003Machines 10 00996 i004Machines 10 00996 i005
Machines 10 00996 i006Machines 10 00996 i007Machines 10 00996 i008Machines 10 00996 i009Machines 10 00996 i010
Machines 10 00996 i011Machines 10 00996 i012Machines 10 00996 i013Machines 10 00996 i014Machines 10 00996 i015
Machines 10 00996 i016Machines 10 00996 i017Machines 10 00996 i018Machines 10 00996 i019Machines 10 00996 i020
Table 2. Summary of test results of different models.
Group NumberLabel the Compound Area?Is the Image Enhanced?Total Number of Detected TargetsTpTnFpFn
1falsefalse20459763633
2falsetrue19972742132
3truefalse180848664
4truetrue180888921
Table 3. Detection performance of different models.
Group NumberLabel the Compound Area?Is the Image Enhanced?AccuracyPrecisionRecall RateF1 Score
1FalseFalse0.660.620.640.63
2FalseTrue0.730.770.690.73
3TrueFalse0.940.930.950.94
4TrueTrue0.980.980.990.98
Publisher’s Note: MDPI stays neutral with regard to jurisdictional claims in published maps and institutional affiliations.

