Article

A Hierarchical Energy Management Strategy for 4WD Plug-In Hybrid Electric Vehicles

1
State Key Laboratory of Automotive Simulation and Control, Jilin University, No. 5988, Renmin Street, Nanguan District, Changchun 130022, China
2
Changsha Automobile Innovation Research Institute of Jilin University, Changsha 410006, China
3
Department of Aeronautical and Automotive Engineering, Loughborough University, Leicestershire LE11 3TU, UK
*
Author to whom correspondence should be addressed.
Machines 2022, 10(10), 947; https://doi.org/10.3390/machines10100947
Submission received: 4 September 2022 / Revised: 28 September 2022 / Accepted: 8 October 2022 / Published: 18 October 2022
(This article belongs to the Special Issue Emerging Technologies in New Energy Vehicle)

Abstract

:
In the field of new energy vehicles, 4WD PHEVs show strong energy-saving potential. A single energy management strategy, nevertheless, has difficulty achieving the energy-saving potential due to the complex, nonlinear energy system of the 4WD PHEV. To cope with it, a hierarchical energy management strategy (H-EMS) for 4WD PHEVs is proposed in this paper to achieve energy management optimization. Firstly, the future speed information is predicted by the speed prediction method, and the upper energy management strategy adopts the model predictive control (MPC) based on the future speed information to carry out the power source distribution between the engine and the battery. Secondly, the lower energy management strategy performs the power component distribution of the front motor and the rear motor based on an equivalent consumption minimization strategy (ECMS). Finally, the simulation based on MATLAB/Simulink is performed, validating that the proposed method has more energy-saving capabilities, and the economy is improved by 11.87% compared with the rule-based (RB) energy management strategies.

1. Introduction

Nowadays, plug-in hybrid electric vehicles (PHEVs) have a high-fuel utilization efficiency to alleviate the crisis of fossil fuels [1,2,3]. They have gradually become the focal point for scientific research and the automobile industry [4,5]. Compared with two-wheel-drive PHEVs (2WD PHEVs) [6,7], four-wheel-drive PHEVs (4WD PHEVs) are equipped with extra motors in the rear axle to guarantee a dynamic performance in adverse driving conditions. However, the power system of 4WD PHEVs with multiple degrees of freedom leads to a complex energy flow, and thus, it requires a more stringent energy management strategy to release the advanced energy-saving potential, creating an urgent requirement for the control structure of high nonlinear systems of 4WD PHEVs.
Designing an extraordinary energy management strategy for PHEVs to release their energy-saving potential is difficult, especially for 4WD PHEVs with more power resources [8,9]. Additionally, the calculation of multiple control variables for 4WD PHEVs needs the basis of the determination of exact constraints. Additionally, the real-time capacity of the energy management strategy is also a key point affecting the energy-saving effect. During the development of the energy management strategy, the existing methods can be divided into two categories: rule-based energy management strategies and optimization-based energy management strategies [10]. Although a single control strategy can evaluate the effect on the vehicle economy, the adaptiveness of variable configurations of PHEVs is not fully evaluated, especially for 4WD PHEVs with complex energy use.
Rule-based control strategies can be further divided into strategies with determined rules [11,12,13] and strategies with fuzzy rules [14,15,16]. Both of them can be equipped with brilliant real-time capacity, and they can be easily deployed in the vehicle controller due to the mild calculating requirement. However, the stable thresholds for driving mode switching and the limited changing of the power distribution among power resources still restrict the energy-saving potential of the complex configuration of PHEVs. As for optimization-based energy management strategies, different subcategories perform variable effects on the vehicle economy and real-time practice. Global optimization-based control strategies, such as dynamic programming (DP) [17,18,19] and Pontryagin’s minimum principle (PMP) [20,21,22], can obtain the global optimal sequence of control variables based on the prior driving information. However, the long calculating time resulting from global searching and the difficulty of grabbing accurate predictive driving conditions both make the DP and PMP unpractical strategies for real-time driving.
The instantaneous optimization-based control strategies, such as the equivalent consumption minimization strategy (ECMS) [23,24,25] and model predictive control (MPC) [26,27,28], can give consideration to the real-time application capacity and suboptimization of the vehicle economy. By using an equivalent factor, ECMS can minimize the equivalent fuel consumption by equating electric power consumption to fuel consumption [29,30,31]. However, the shortcomings of ECMS are also obvious. Firstly, the ECMS only considers the current information of the driving condition and state of the vehicle, resulting in limited energy saving. Secondly, although the ECMS is used for optimizing the instantaneous economy of the vehicle, the sequence of the control variables during the whole driving process, calculated by the ECMS, has a worse performance on the economy than DP and PMP, and the gap of the performance on economic optimization between the ECMS and DP will be widened if the number of control variables is increased, resulting in the unsuitableness of developing the control strategy for 4WD PHEVs. Thirdly, the equivalent factor is a bad choice for balancing different types of energy consumption, as there is not an objective evaluation and optimal effect for energy saving. Therefore, reasonably narrowing the characteristic gap of power sources is an effective guarantee for the ECMS to evaluate the vehicle economy more objectively. To sum up, aiming to fully release the energy-saving potential of the ECMS, choosing suitable control objects, and limiting the number of control variables are necessary.
The MPC can obtain the optimized control sequence with relatively better global characteristics to enhance the economic performance based on obtaining short-time future driving conditions [32,33,34]. The advantage of MPC is the cooperativeness between the fast calculation speed and partially global optimal characteristics in the predictive domain. However, the shortcomings of MPC are also obvious. Firstly, the MPC needs relatively hard requirements for computational capacity. Secondly, the state function in the MPC has a direct impact on the performance of the economy. Due to there being a gap between the state function and the practical system of the vehicle, the gap will be widened if the complexity of the state function becomes hard. Additionally, it can also make the effect of the energy management strategy become poor. Thus, the prior problem design of simplifying the state function and decreasing the number of control variables to achieve reasonable use of the computing power of the vehicle controller is necessary.
The 4WD PHEVs have multiple power components, and energy management strategies have become a key technology to improve the economy of driving [35,36,37]. The global optimization-based control strategy is adopted to optimize the distribution between engine and battery and the management of the gear ratio [38]. However, the real-time capability of the global optimization-based control strategy is difficult to guarantee. As for 4WD pure electric vehicles, the transmission ratio of front/rear motors is optimized to improve the driving economy [39]. Not only does the power distribution between engine and battery in 4WD PHEVs have an influence on the economy, but also, the power distribution between different motors in the front and the rear axle has an impact on the economy. Thus, advancing the design of the energy management strategy is necessary to give full play to the energy-saving potential of 4WD PHEVs with multiple degrees of power freedom, as it not only considers the suitable distribution between engine and battery, but also the distribution between different motors in the front and rear axle.
To sum up, to strengthen the real-time capacity of the energy management strategy, using an instantaneous optimization-based energy management strategy is necessary. As for fully implementing the advantages of the ECMS and MPC, a reasonable design of energy-saving problems that decrease the number of control variables of each method is important for optimizing the energy-saving effect. When it comes to the energy management strategy of 4WD PHEVs, advancing the design of the controlling structure to release the energy-saving potential based on the multiple degrees of power freedom cannot be ignored. In order to realize the progressive design of the energy management strategy for 4WD PHEVs, the reasonable separation of energy management problems is necessary, and a hierarchical structure with a multilevel framework and with suitable methods of energy management can lead to an advanced economic effect.
In this context, this paper presents a hierarchical energy management strategy (H-EMS). The H-EMS divides the energy management structure into two parts to separate the controlling complexity and fully release the energy-saving potential of each control method. The high level of the H-EMS adopts the MPC with just one control variable, namely. the distribution between engine and battery, for achieving the relatively long-time optimal economic performance, aiming at fully using the calculational capacity of the vehicle controller. Besides, a speed predictor is used for obtaining the prior short-time driving information, and the information is used to support the high level of the H-EMS to optimize the power distribution between the engine and battery. The low level of the H-EMS uses the ECMS with just one control variable, namely, the distribution between different motors in the front and rear axle, aiming at enhancing the electric energy utilization efficiency and giving full play to the calculation characteristics of the ECMS by reducing the gap between the control characteristics of the control objects, namely, the motors in the front and rear axle.
The contributions of this paper are presented as follows:
  • A hierarchical structure of the energy management strategy, namely, the H-EMS for a 4WD PHEV, is used for suitably separating the complexity of energy management, leading to obtaining the reasonable sequence of control variables to release the energy-saving potential of the 4WD PHEV with multiple degrees of power freedom.
  • The MPC is used for establishing the high-level framework of the H-EMS to solve the separated problem of energy management, aiming at reasonably distributing the power between engine and battery and decreasing the number of control variables to meet the calculating capacity of the vehicle controller.
  • The ECMS is adopted to establish the low-level framework of the H-EMS to innovatively solve the subproblem of energy management with regard to the distribution of electricity, aiming at obtaining a suitable distribution between the motor in the front axle and rear axle.
This study is organized as follows: Section 2 presents the introduction to 4WD PHEV models. Section 3 elaborates on the novel methodology of the energy management strategy for 4WD PHEV. Section 4 analyzes and compares simulation results. The conclusions are given in Section 5.

2. Models

2.1. The Studied 4WD PHEV

The 4WD PHEV is preferred in this paper, and its structure is shown in Figure 1. The vehicle consists of an engine, two motors, and a generator. The engine and the front motor jointly drive the front wheels to work, and the rear motor drives the rear wheels to work independently. The front axle is equipped with a generator to adjust the operating points of the engine. In the series mode, the engine drives the generator to provide energy for the front/rear motors. The detailed parameters are shown in Table 1 and Table 2.
In this paper, the 4WD PHEV is divided into three modes: pure electric mode, series mode, and parallel mode. In pure electric mode, the front/rear motors drive the front/rear axles to work, respectively, and the engine is in a shutdown state. In series mode, the clutch is disconnected, and the engine drives the generator to provide energy for the front/rear motors; In parallel mode, the clutch is connected, and the engine directly drives the front wheels to work, as shown in Table 3.

2.2. Vehicle Dynamics Model

This paper studies the fuel economy and establishes the longitudinal dynamics model of the vehicle. The driving resistance in the longitudinal direction includes the rolling resistance, air resistance, slope resistance, and acceleration resistance. The equations of the driving force and wheel-end torque are Equations (1) and (2) [40].
F t = m g f cos α s l a p + C D A v 2 21.15 + m g sin α s l a p + σ m d v d t
T r e q = F t r = r ( m g f cos α s l a p + C D A v 2 21.15 + m g sin α s l a p + σ m d v d t )
where F t is the tangential driving force generated by the driving wheel; m is the curb weight of the vehicle; g is the gravitational acceleration; f is the coefficient of rolling resistance; a s l a p is the road slope; C D is the air resistance coefficient; A is the frontal area of the vehicle; σ is the rotational mass conversion factor; T r e q is the required torque; and r is the wheel rolling radius.

2.3. Engine Model

Engine fuel consumption can be obtained by looking up the table of engine speed and torque. The engine map is shown in Figure 2. Since the research focus of this paper is the fuel economy, the physical part of the engine model is simplified, and only the fuel consumption characteristics of the engine are considered. The static engine diagram modeling method is adopted to establish the engine model, and the instantaneous fuel consumption of the engine can be calculated by Equation (3).
f u e l e n g = P e n g b e n g t 3600
where f u e l e n g is the fuel consumption; b e n g is the instantaneous fuel consumption rate (g/Kwh); t is the time (s); and P e n g is the power of the engine.

2.4. Motor/Generator Model
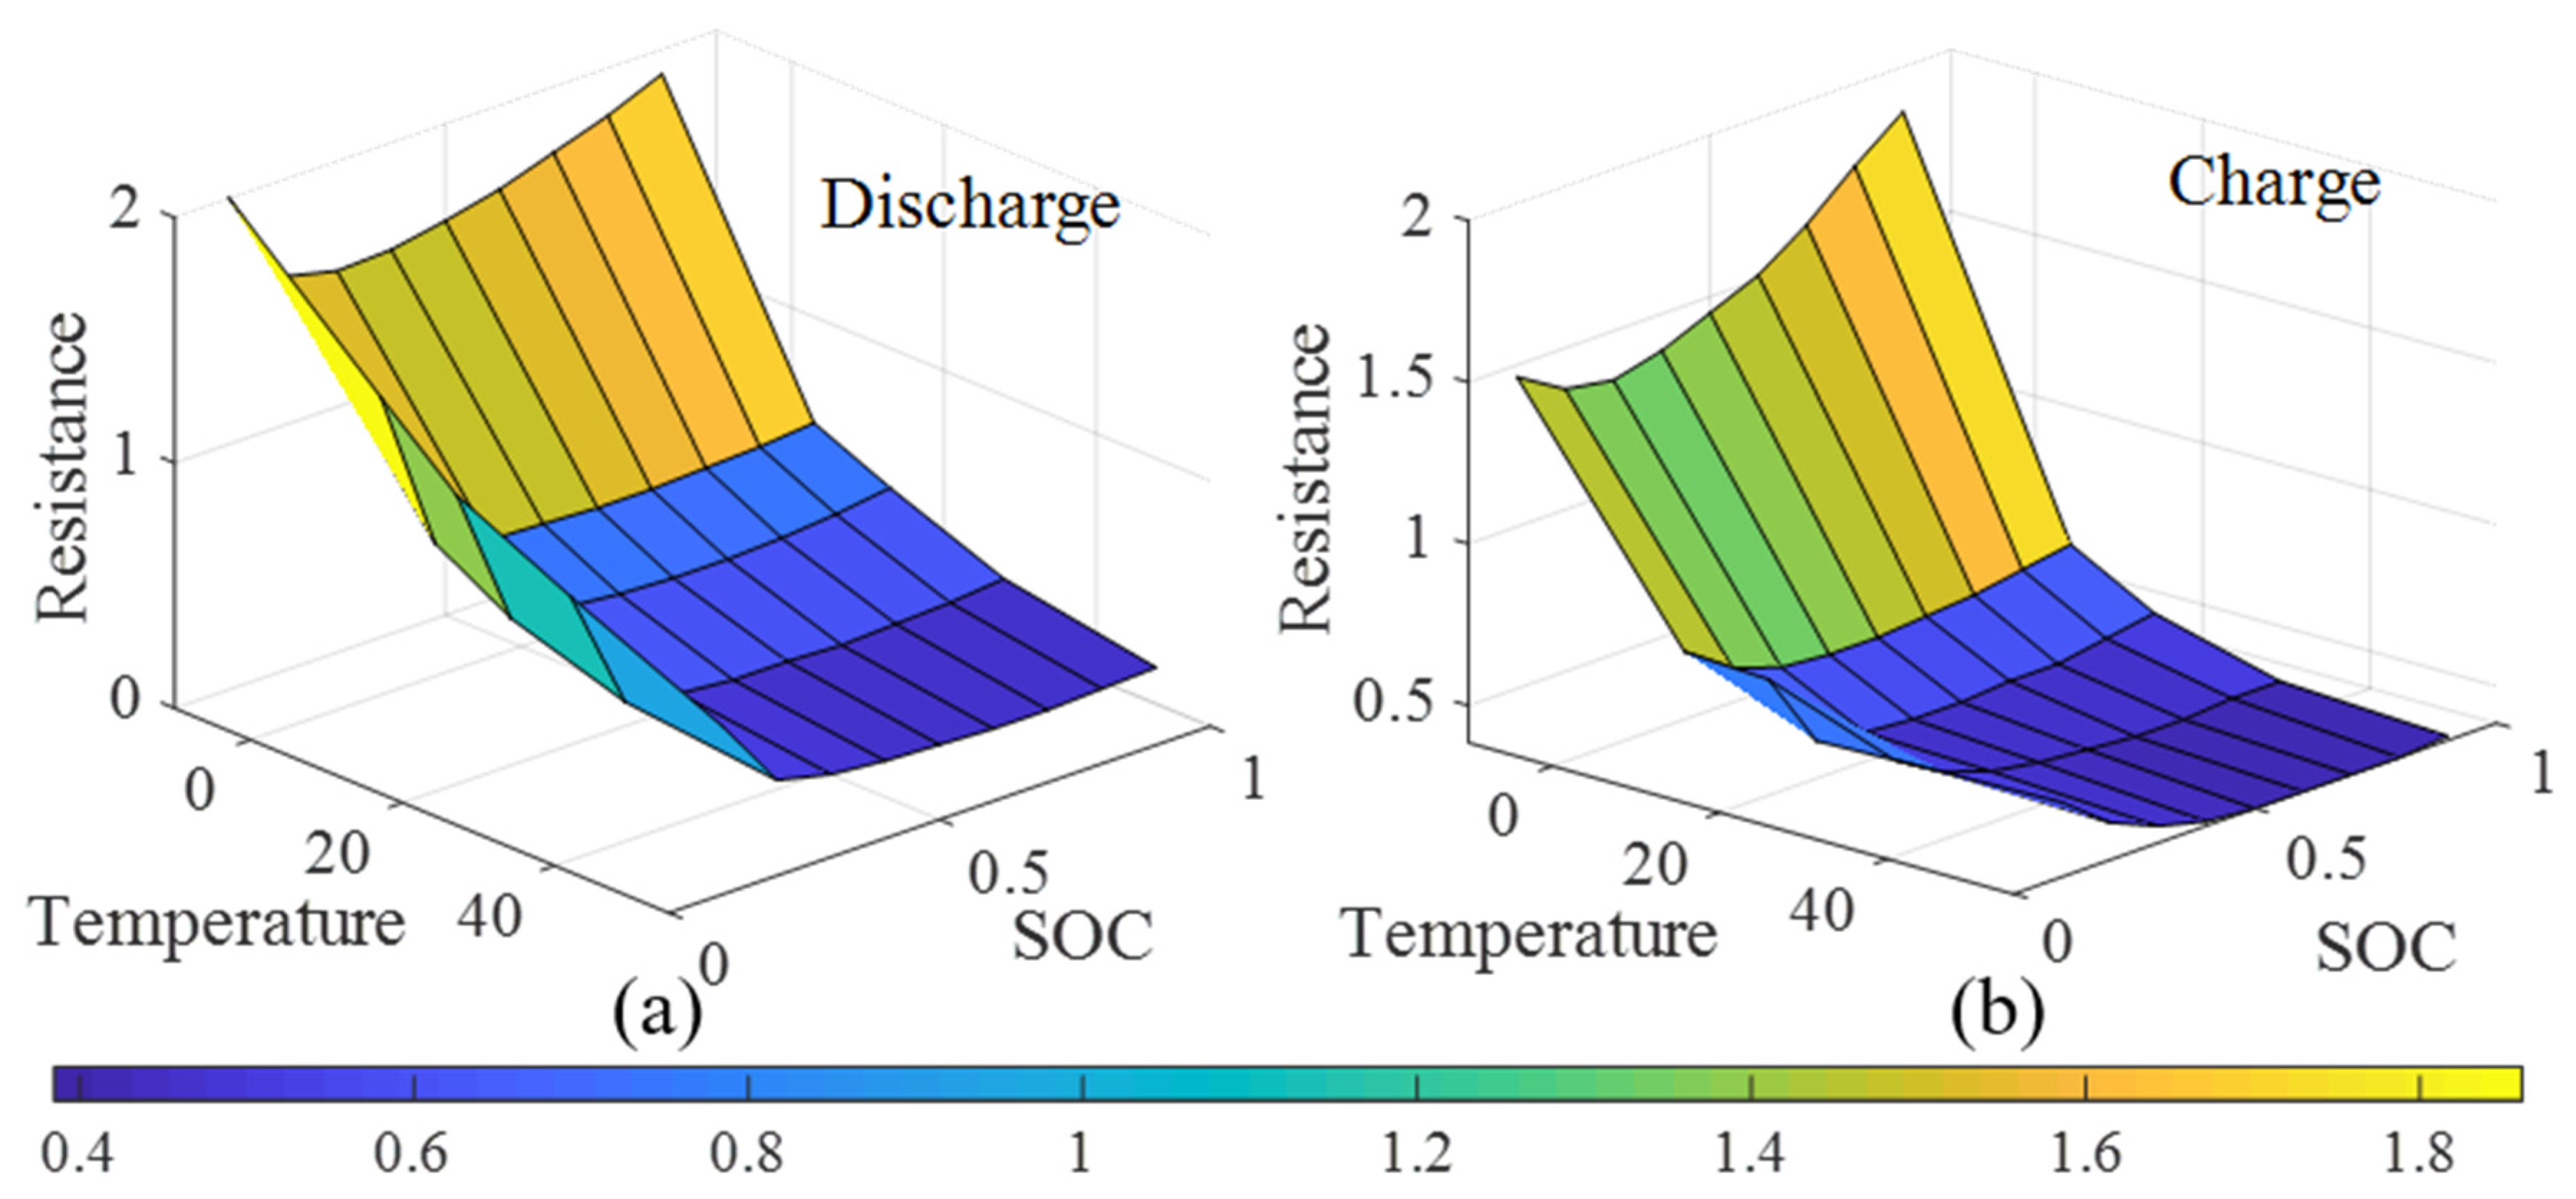
In this paper, the front/rear motors and generators are permanent magnet synchronous motors (PMSMs), and the efficiency can be obtained by looking up the speed/torque table. According to the calibration data of the experiment, the front/rear motors and generator maps are shown in Figure 3. This paper ignores the dynamic performance and thermal performance of synchronous motors in the process of establishing models. According to different driving modes, the efficiency of the motors and the generator can be calculated by Equations (4) and (5).
P m = { n m T m 9550 η m , T m 0 n m T m 9550 η m , T m < 0
P g e n = n g e n T g e n 9550 η g e n
where P m is the power of the front/rear motors; n m is the speed of the front/rear motors; T m is the torque of the front/rear motors; η m is the efficiency of the front/rear motors; P g e n is the power of the generator; n g e n is the speed of the generator; T g e n is the torque of the generator; and η g e n is the efficiency of the generator.

2.5. Battery Model

The physical and chemical characteristics of the battery are very complex; therefore, it is difficult to establish an accurate battery model through an accurate mathematical model. In this paper, according to the calibration data of the experiment, the internal-resistance map of the battery is established with the look-up table method, which can quickly and effectively obtain the internal resistance of the battery. The internal-resistance diagrams of the battery are shown in Figure 4.
In this paper, the electrochemical characteristics and temperature-rise characteristics during the charging and discharging process of the battery are ignored. Only the open-circuit voltage, internal resistance, and current of the battery are studied, and the first-order RC model of the battery is established. The power of the battery can be expressed in Equation (6) [41].
P b = V L I b = V O C I b I b 2 R 0
The current of the battery can be expressed in Equation (7).
I b = V O C V O C 2 4 P b R 0 2 R 0
where P b is the power of the battery; V L is the terminal voltage of the battery; V O C is the open-circuit voltage of the battery; R 0 is the internal resistance of the battery; and I b is the current of the battery.
By adopting the ampere-hour integration method, the SOC of the battery can be expressed in Equation (8).
S O C = S O C i 1 Q b I b d t
The SOC change rate of the battery is expressed in Equation (9).
S O ˙ C = I b Q b = V O C V O C 2 4 P b R 0 2 R 0 Q b
where S O C i is the initial SOC value and Q b is the capacity of the battery.

3. Methodology

This chapter illustrates the structure of the novel energy management strategy. The strategy can be divided into two subframeworks, which are at the level for obtaining future driving conditions and the level for suitably managing the energy flow of the complex energy system in the 4WD PHEV.
The high level needed for obtaining driving conditions requires the use of the GRNN to predict the short-time future speed of the vehicle accurately. The input of the GRNN is historical, short-time speed data that can be transferred by the controller area network (CAN). The level of energy management adopts a hierarchical structure for the optimal economic performance of the complex energy system, which is named the H-EMS in this paper. The MPC and ECMS are both functional, but have a unique function in the H-EMS. The MPC is used for optimal cooperation between the engine and battery based on using the predicted speed by the GRNN, which can give full play to the perspectives of predictive control in the MPC. The ECMS is used for optimal collaboration efficiency between the front motor and rear motor, aiming at entirely using the calculating speed of the ECMS to alleviate the calculating load of the vehicle controller. Therefore, the control framework of the H-EMS in the 4WD-PHEV depends on the driving modes, which can be divided into three subcategories: pure electric mode, series mode, and parallel mode. Regardless of the driving mode, the priority of power distribution between the engine and battery by using the MPC is always higher than that of the power distribution of electrical components by using the ECMS.
The details of the novel energy management strategy process are presented in Figure 5.

3.1. Vehicle Speed Prediction Based on GRNN

As a radial basis neural network, the General Regression Neural Network (GRNN) adds a summation layer between the hidden layer and the output layer, and it is suitable for solving nonlinear problems. The GRNN is composed of four layers: the input layer, model layer, summation layer, and output layer.
In this paper, the vehicle speed information V H i s t o r y [ ] in the past ten seconds is taken as the GRNN input, and the vehicle speed information V F u t u r e [ ] from the next five seconds is the output. During the GRNN training process, the training sample is shown as T r x = { t r x 1 , t r x 2 , , t r x m } , and the dimension of each sample is 10; thus, t r x i is shown as t r x i = [ v 1 , v 2 , , v 10 ] . Similarly, the label set is shown as T r y = { t r y 1 , t r y 2 , , t r y m } , and t r y i is shown as t r y i = [ y 1 , y 2 , , y 5 ] . The structure diagram is shown in Figure 6.
In the GRNN, the number of neurons in the input layer is equal to the dimension of the sample input, and each neuron directly transmits the input variables to the model layer. The model layer and the input layer are fully connected. In the model layer, the neurons have the same number as samples, and the transfer function is expressed in the exponential form of the square of the Euclid distance, as shown in Equation (10).
p i = exp [ ( V T r x i ) T ( V T r x i ) 2 σ 2 ] i = 1 , 2 , , m
where p i is the output value of the i-th neuron and V is the input sample.
In the summation layer, the neurons are divided into two categories. The first category is the sum of the output of the model layer. Furthermore, the connection weight between the pattern layer and each neuron is 1. Additionally, the other category is calculated as a weighted summation of neurons in all mode layers. The transfer functions are shown in Equations (11) and (12).
S D = i = 1 m exp [ ( V T r x i ) T ( V T r x i ) 2 σ 2 ]
S N j = i = 1 m q i j exp [ ( V T r x i ) T ( V T r x i ) 2 σ 2 ] j = 1 , 2 , , k ( k = 5 )
where q i j is the weight value of the i-th neuron in the model layer and the j-th neuron in the summation layer.
In the output layer, the number of nodes is equal to the dimension of t r y i . The output function is shown in Equation (13).
y k = S D S N j
In the actual application process, the historical vehicle speed information is composed of high-dimensional data sets, and some noise points appear in it. The GRNN is highly fault-tolerant and robust. The vehicle speed prediction method of the GRNN can be more suitable for the application in this paper.

3.2. Optimal Management of Power Sources Based on MPC

The optimal management of the 4WD PHEV power sources directly affects the driving economy of the vehicle. In this paper, the MPC is applied in the 4WD PHEV for the cooperated optimization between engine and battery, and quadratic programming (QP) is adopted to obtain the optimal distribution coefficient and improve the driving economy of the vehicle. The MPC has the advantages of rolling optimization and feedback correction, and it can solve the optimization problems of multi-input and multi-output systems. In this paper, the SOC is selected as the state variable, the equivalent fuel consumption as the observed variable, P a l l as the disturbance variable, and the proportion of the battery output energy to the vehicle demand energy as the control variable. The equation of the state and the equation observation are established in Equations (14) and (15).
x ( t + 1 ) = x ( t ) + x ˙ ( t ) = x ( t ) V O C V O C 2 4 P a l l ( t ) u ( t ) R ( t ) 2 R ( t ) C b
y ( t + 1 ) = m f u e l ( t ) + m e q u ( t ) = P a l l ( t ) ( 1 u ( t ) ) η e 3600 + P a l l ( t ) u ( t ) λ Q b
where P a l l ( t ) is the demand power of the vehicle at time k; u ( t ) is the proportion of battery output power to vehicle demand power at time k; R ( t ) is the internal resistance of the battery at time k; C b is the capacitor of the battery; m f u e l is the fuel consumption of the engine; m e q u is the electricity that is equivalent to the fuel consumption; η e is the fuel consumption rate of the engine (g/Kwh); and λ is the equivalent factor.
In the process of establishing the MPC model, the input of the power P a l l of the vehicle is involved. This paper assumes driving on a flat and straight road and does not consider the influence of the slope on the vehicle. Only the acceleration resistance, rolling resistance, and air resistance are considered in the driving process. According to the obtained predicted vehicle speed and vehicle dynamics model, the power required to meet the normal driving of the vehicle is calculated, and the calculation formula is established in Equation (16).
p a l l = p j + p f + p w = σ m v a 1000 η + m g f v 1000 η + C D A 1632 η v 3
where P a l l is the demand power of the vehicle; P j is the power of the accelerate resistance; P f is the power of the rolling resistance; P w is the power of the air resistance; v is the vehicle speed (m/s); a is the acceleration; and η is the total efficiency of the motors.
The above-mentioned model is highly nonlinear, which makes it very difficult to solve it. In this paper, the Taylor first-order expansion is adopted to linearize the engine-generator set near the high-efficiency operating points. The expansion equations are established in Equations (17) and (18).
x ˙ = V O C V O C 2 4 P a l l u R 2 R C b = A ^ x + B ^ u + C ^ v
y = D ^ x + E ^ u + F ^
According to A ^ = f x | x = x 0 , u = u 0 , P a l l = P a l l 0 , R = R 0 , B ^ = f u | x = x 0 , u = u 0 , P a l l = P a l l 0 , R = R 0 , C ^ = f v | x = x 0 , u = u 0 , P a l l = P a l l 0 , R = R 0 and Equation (15), the linearization coefficients are established in Equation (19).
{ A ^ = 0 ; B ^ = P a l l 0 C b ( V o c 2 4 R 0 P a l l 0 u 0 ) 1 2 ; C ^ = u 0 C b ( V o c 2 4 R 0 P a l l 0 u 0 ) 1 2 ; D ^ = 0 ; E ^ = 3600 P a l l λ P a l l η e Q 3600 Q ; F ^ = P a l l η e 3600 ;
where x 0 , u 0 , P a l l 0 , and R 0 are the initial values of the state variable, control variable, disturbance variable, and battery internal resistance in the linearization process, respectively.
In this paper, the driving modes of the 4WD PHEV are subdivided into three modes: the pure electric mode, series mode, and parallel mode. There are some differences in the selection of initial values for the series model and the parallel model in the linearization process. In series mode, the engine is completely decoupled from the ground, and the initial value should be selected near the optimal operating points of the engine. In parallel mode, the engine is coupled with the ground, and the initial value should be selected near the optimal operating points of the engine speed. In the actual calculation process, the above-linearized model needs to be transformed into a discrete model, as shown in Equations (20) and (21).
x ( t + 1 ) = A ¯ x ( t ) + B ¯ u ( t ) + C ¯ v ( t ) = x ( t ) + P a l l 0 C b ( V o c 2 4 R 0 P a l l 0 u 0 ) 1 2 u ( t ) + u 0 C b ( V o c 2 4 R 0 P a l l 0 u 0 ) 1 2 v ( t )
y ( t + 1 ) = E ¯ u ( t ) + F ¯ = 3600 P a l l ( t ) λ P a l l ( t ) η e ( t ) Q 3600 Q u ( t ) + P a l l ( t ) η e ( t ) 3600
The iterative process of the state variable x and the observed variable y in the controlled time domain T are established in Equations (22) and (23).
x ( t + 1 ) = A ¯ x ( t ) + B ¯ u ( t ) + C ¯ v ( t ) x ( t + 2 ) = A ¯ 2 x ( t ) + A ¯ B ¯ u ( t ) + B ¯ u ( t + 1 ) + A ¯ C ¯ v ( t ) + C ¯ v ( t + 1 ) x ( t + T ) = A ¯ T x ( t ) + A ¯ T 1 B ¯ u ( t ) + + B ¯ u ( t + T 1 ) + A ¯ T 1 C ¯ v ( t ) + C ¯ v ( t + T 1 )
y ( t + 1 ) = E ¯ u ( t ) + F ¯ y ( t + 2 ) = E ¯ u ( t + 1 ) + F ¯ y ( t + T ) = E ¯ u ( t + T 1 ) + F ¯
Finally, the iterative expression of the state variable matrix and the observed variable matrix in the controlled time domain T are established in Equations (24) and (25).
X ( t ) = A x ( t ) + B U ( t ) + C V ( t )
Y ( t ) = E U ( t ) + F
In the 4WD PHEV, in order to prevent excessive power consumption of the battery, the terminal SOC in the controlled time domain needs to be limited in the charge-retention stage (CS). The terminal expression of the SOC is established in Equation (26).
x ( t + T ) = A ¯ T x ( t ) + ψ U ( t ) + φ V ( t )
where ψ = [ A ¯ T 1 B ¯ A ¯ T 2 B ¯ B ¯ ] ; φ = [ A ¯ T 1 C ¯ A ¯ T 2 C ¯ C ¯ ] .
In practice, the low SOC influences the life of the battery. Therefore, the SOC must be limited while ensuring the minimum equivalent fuel consumption. The optimization problem is solved at each sampling moment in the controlled time domain T, and the objective function is established in Equation (27).
J = R M Y ( t ) Y r e f 2 + Q s i g n ( [ x ( t + T ) x o p t ] ) [ x ( t + T ) x o p t ] s . t . x ( t + T ) = A ¯ T x ( t ) + ψ U ( t ) + φ V ( t ) Y ( t ) = E U ( t ) + F x min x x max u min u u max
where Y r e f is the reference value of the observed variable, and in order to obtain the smallest actual objective value, Y r e f should be set as a small value; R and Q are the weight matrices in the objective function; M is the weight matrix of each step in the controlled time domain T ; x o p t is the reference value of the state variable; x min and x max are the minimum and maximum values of the state variables, respectively; and u min and u max are the minimum and maximum values of the control variables, respectively.
Many constraints are involved in the MPC solution process, and the analytical solution is difficult to obtain. This paper adopts the numerical solution method to convert the objective function into the quadratic programming (QP) problem to solve. The QP problem is established in Equation (28).
u = arg min ( 1 2 U ( k ) T H U ( k ) + f T U ( k ) + d ) s . t . β u ω
where H is the diagonal positive definite matrix. f T and d are constant matrices, where the constant matrix d has nothing to do with the control variable U ( t ) , and for the convenience of calculation, the constant matrix d can be ignored in the process of solving the QP problem. In the control process, certain constraints should be imposed on the control variable to ensure that the power components work within a reasonable range, and β and ω are the constraint matrices.
Converting Equation (27) into the QP problem, the parameters of the matrices are established in Equations (29)–(32).
H = E T R M E
f = F T R M E + Y r e f T R M E + s i g n ( x ( t + T ) x o p t ) Q ψ T
β = [ P a l l 0 0 0 0 0 0 P a l l ] T × T
ω = [ P E n g i n e _ max P a l l ; P E n g i n e _ max P a l l ] T × 1
where P E n g i n e _ max is the maximum power of the engine.
Solving the above QP problem can obtain the optimal control variable for each step in the controlled time domain. The MPC is adopted to solve the optimal local solution. In the controlled time domain, multiple control variables can be solved, but only the first set of control variables is applied at the current moment, and the above process is repeated at the next moment to realize rolling optimization. The power source distribution coefficient of each step is obtained, and finally, the driving economy of the vehicle is improved.

3.3. Optimal Management of Power Components between the Front Motor and the Rear Motor Based on ECMS

As an energy management strategy of instantaneous optimization, the ECMS essentially equates the power consumption of the battery with fuel consumption. In Section 3.2, the MPC is adopted to solve the optimal power source distribution coefficient. The front/rear motors are coupled with the ground to drive the front/rear wheels directly, and there are certain differences in the map diagrams of the front/rear motors. Due to the difference in the map diagrams between the front motor and rear motor, the power component distribution coefficient between the front motor and the rear motor also directly affects the economy of driving.
In this paper, the ECMS is adopted to realize the energy distribution between the front motor and the rear motor, and the equivalent fuel consumption expression is established in Equation (33).
m ˙ e q v ( x ( t ) , u ( t ) , t ) = λ m ˙ F _ M o t o r ( x ( t ) , u ( t ) , t ) η F + λ m ˙ R _ M o t o r ( x ( t ) , u ( t ) , t ) η R
where m ˙ e q v ( x ( t ) , u ( t ) , t ) is the instantaneous equivalent fuel consumption at time t ; λ m ˙ F _ M o t o r ( x ( t ) , u ( t ) , t ) is the instantaneous equivalent fuel consumption of the front motor at time t ; and λ m ˙ R _ M o t o r ( x ( t ) , u ( t ) , t ) is the instantaneous equivalent fuel consumption of the rear motor at time t . λ is the equivalent factor, where the electricity consumption of the vehicle is equivalent to the fuel consumption through the equivalence factor, and thus, the value is mainly related to the fuel price and the operating efficiency of the vehicle. This paper adopts a constant equivalent factor through real data, which is 3.5; x ( t ) is the value of the S O C at time t ; η F is the efficiency of the front motor; η R is the efficiency of the rear motor; and u ( t ) is the proportion of the front motor output energy to the front/rear motor output total energy at time t .
In order to improve the economy of the actual driving, the equivalent fuel consumption of the front/rear motors should reach the minimum value. Therefore, the ECMS optimization objective function is established in Equation (34).
J ( t ) = min 0 t [ m ˙ e q v ( x ( t ) , u ( t ) , t ) ] d t = min 0 t [ λ m ˙ F _ M o t o r ( x ( t ) , u ( t ) , t ) η F + λ m ˙ R _ M o t o r ( x ( t ) , u ( t ) , t ) η R ] d t
The Hamilton function is established in Equation (35).
H ( x ( t ) , u ( t ) ,   λ ( t ) , t ) = λ m ˙ F _ M o t o r ( x ( t ) , u ( t ) , t ) η F + λ m ˙ R _ M o t o r ( x ( t ) , u ( t ) , t ) η R
The optimal solution is obtained through calculation, which makes the Hamilton function obtain the minimum value in the finite set, and the formula is established in Equation (36).
u * ( t ) = arg min H ( x ( t ) , u ( t ) , λ ( t ) , t )
When the Hamilton function obtains the optimal solution, Equation (37) should reach the minimum value:
x ˙ ( t ) = H λ = m ˙ F _ M o t o r ( x ( t ) , u ( t ) , t ) η F + m ˙ R _ M o t o r ( x ( t ) , u ( t ) , t ) η R s . t . T F _ M o t o r _ min ( t ) T F _ M o t o r ( t ) T F _ M o t o r _ max ( t ) T R _ M o t o r _ min ( t ) T R _ M o t o r ( t ) T R _ M o t o r _ max ( t ) S O C min ( t ) S O C S O C max ( t ) u min ( t ) u ( t ) u max ( t )
where T F _ M o t o r _ min ( t ) and T F _ M o t o r _ max ( t ) are the minimum torque and maximum torque of the front motor at time t , respectively; T R _ M o t o r _ min ( t ) and T R _ M o t o r _ max ( t ) are the minimum torque and maximum torque of the rear motor at time t , respectively; u min ( t ) and u max ( t ) are the minimum and maximum values of the control variables at time t , respectively; and S O C min ( t ) and S O C max ( t ) are the minimum and maximum values of the SOC at time t , respectively.
According to the characteristics of the different maps between the front motor and rear motor in the 4WD PHEV, the ECMS is adopted to reasonably distribute the power output of the front/rear motors, and the economy of the vehicle is further improved. Aiming at the complex energy system of the 4WD PHEV, the H-EMS is adopted to realize multilayer energy management, and it can give full play to the energy-saving potential of the vehicle.

4. Simulation Results and Analysis

This chapter introduces the simulation results. Firstly, aiming to evaluate the predictive accuracy of the GRNN, this chapter uses three methods, namely, random forest (RF), support vector machine (SVM), and GRNN, to compare the accuracy. Secondly, in order to prove the effectiveness of the H-EMS, this paper adopts the MATLAB/Simulink simulation platform to build a 4WD PHEV model. In the simulation of the World Light Vehicle Test Cycle (WLTC), the four different energy management strategies based on the RB strategy, ECMS, MPC strategy, and H-EMS are compared and analyzed. Validating the H-EMS proposed in this paper can better improve the economy of driving, and the economy of the H-EMS strategy is improved by 11.87% compared with the RB strategy.

4.1. Comparison and Analysis of Predictive Speed

The accuracy of the predicted vehicle speed directly affects the economic effect of the H-EMS. In this paper, three types of predictive methods based on the GRNN, SVM, and RF are analyzed and compared to prove that the GRNN has a very good prediction effect. The prediction results are shown in Figure 7, and the error comparison table is shown in Table 4.
In this paper, the vehicle speed information in the past 10 s is adopted to predict the speed information in the next 5 s. The prediction results are shown in Figure 7. The vehicle is in the acceleration state from 600 s to 610 s, and the predicted speed change is closer to the actual speed based on the GRNN and SVM, but the predicted results based on the RF have a large deviation from the actual speed. Compared with the SVM, the predicted speed is closer to the real speed based on the GRNN in the first 2 s, but the SVM shows a better prediction of the speed trend from 3 s to 5 s. The vehicle is in the deceleration state from 600 s to 610 s. Compared with the RF, the predictive speed decline is relatively gentle and closer to the decline of the actual vehicle speed based on the GRNN and SVM. From 1600 s to 1700 s, the vehicle is in the high-speed stage, the speed is relatively stable, and the different speed prediction methods based on the GRNN, SVM, and RF all show good prediction effects. As shown in Figure 7, the predicted velocity based on the RF has a large deviation from the actual velocity at the inflection point, but the prediction results based on the GRNN and SVM change gently with small fluctuations.
As shown in Table 4, compared with the RF, the prediction results based on the RF and SVM have more minor errors and a good prediction effect. The error of the GRNN in the first 2 s is lower than that in the SVM, but the SVM shows more minor errors than the GRNN from 3 s to 5 s. In this paper, the MPC as an upper energy management strategy adopts the [0.5 0.2 0.1 0.1 0.1] credibility allocation in the application of future information; thus, this paper pays more attention to the prediction information in the first 2 s. In summary, the GRNN is more suitable for the application of the predictive speed scene in this paper.

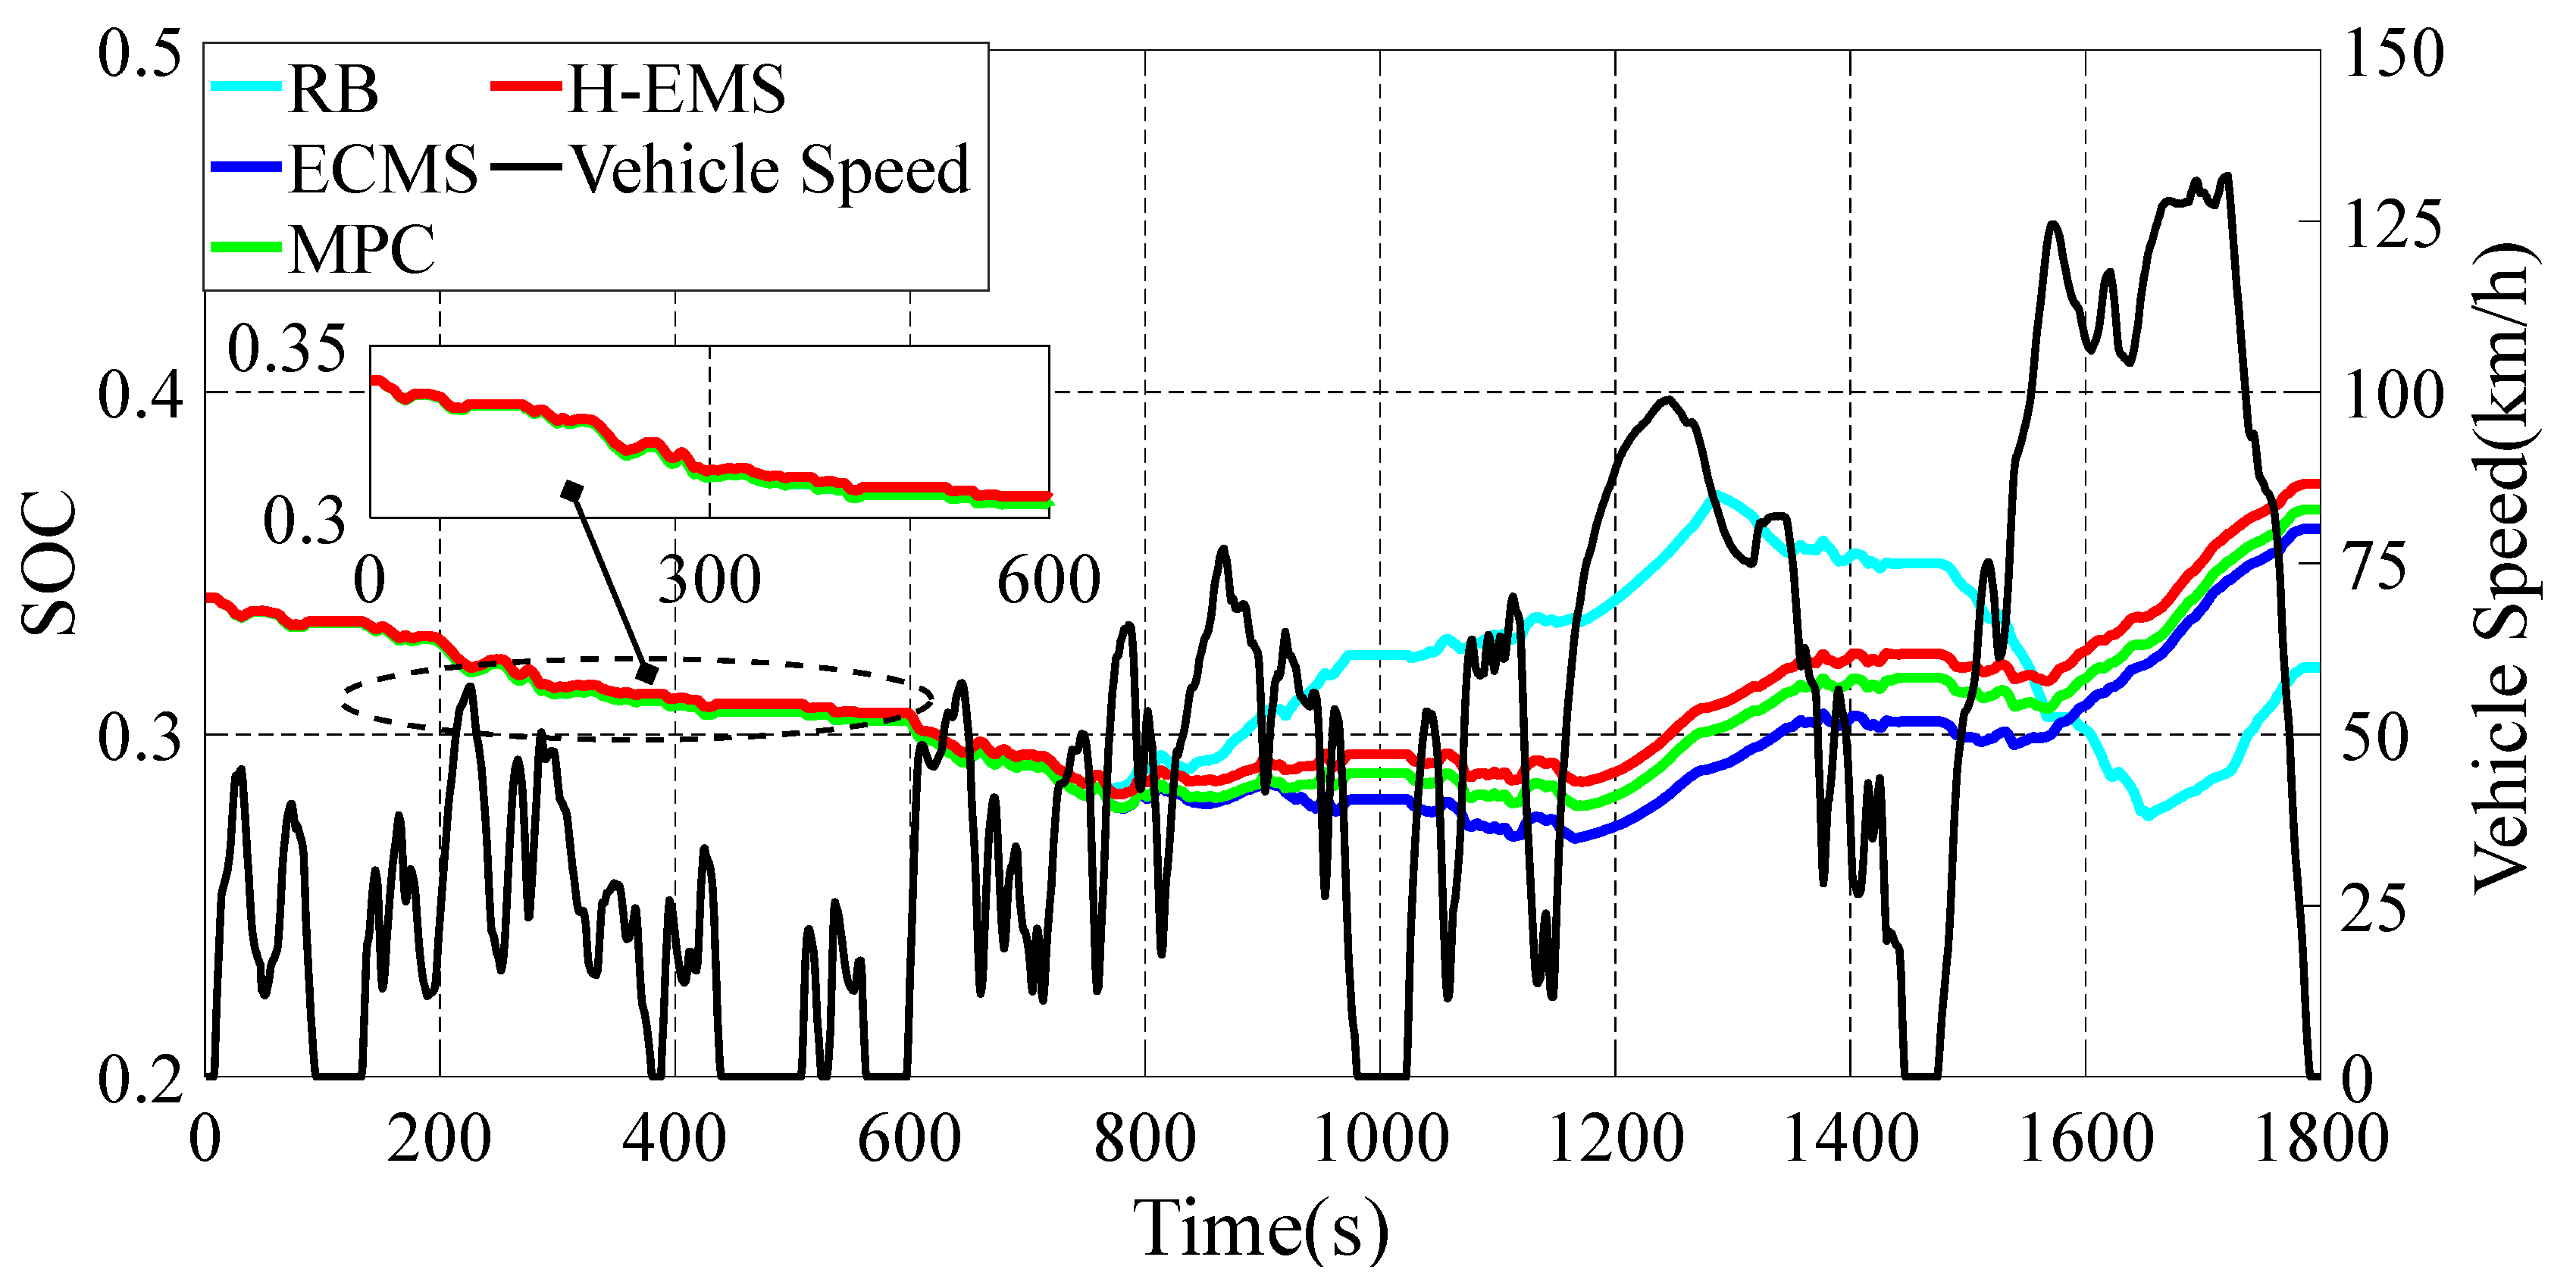
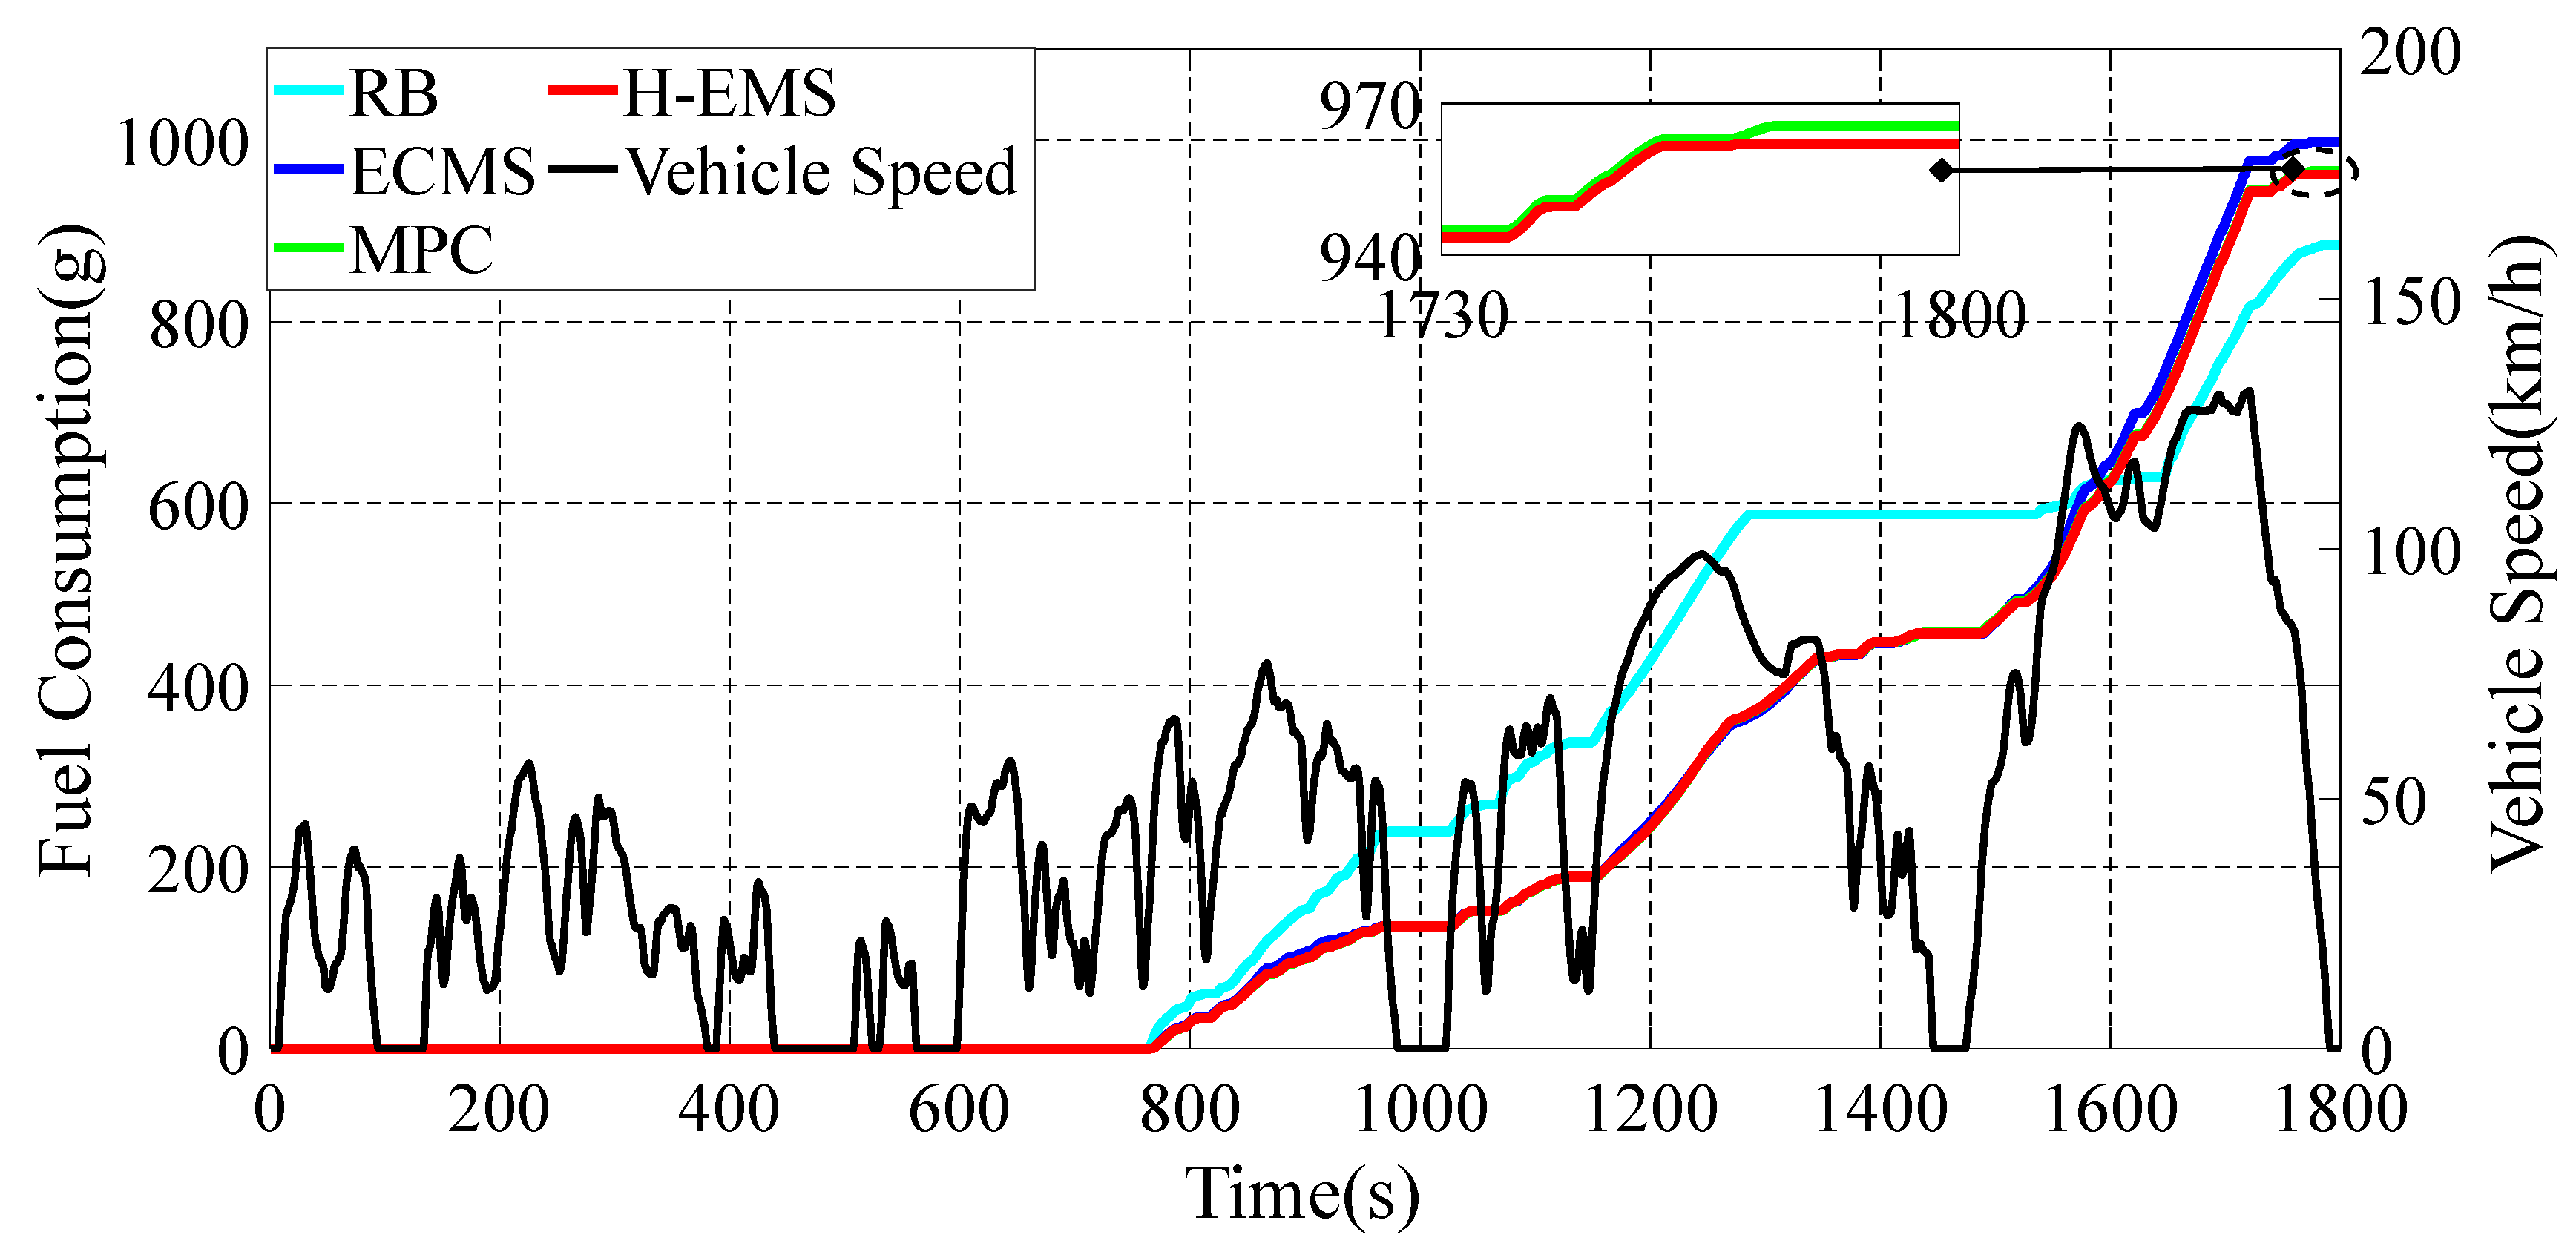
4.2. Comparison and Analysis of SOC, Fuel Consumption, and Equivalent Fuel Consumption

This paper adopts the equivalent fuel consumption to compare the economy of the vehicle under different energy management strategies. Firstly, the 4WD PHEV model is built by the MATLAB/Simulink simulation platform. Secondly, the WLTC simulation driving condition is selected, and the initial SOC of the battery and equivalent factor are set as 34.4% and 3.5, respectively. The MPC prediction time domain is five simulation steps, and the weight matrix M = [0.5 0.2 0.1 0.1 0.1]. The simulation results are shown in Figure 8, Figure 9 and Figure 10.
As shown in Figure 8, the SOC of the RB strategy fluctuates between 0.28 and 0.36. When the SOC reaches 0.28, the CS mode is chosen. In CS mode, the engine generates extra power to make the generator charge the battery, resulting in an increase in the SOC. When the SOC reaches 0.36, the CD mode is chosen. In CD mode, the vehicle tends to use battery power to drive the vehicle. The SOC curves of the ECMS, MPC, and H-EMS have a similar trend across the whole driving cycle, but the SOC curve of the H-EMS is always higher than that of the ECMS and MPC, and the gap between the SOC curve of the H-EMS and others gradually becomes large, demonstrating the advanced electricity-saving potential of the H-EMS.
As shown in Figure 9, when it comes to fuel consumption, the consumption of the RB strategy has the smallest value amongst the whole control strategy. From 1500 s to 1600 s, the fuel consumption of the RB strategy remains unchanged, illustrating that the engine is not working during that duration. However, in that duration, the speed is rising, and the acceleration is relatively high. The economy cannot be promised if the motors provide all the required power for driving. The trend of other curves of fuel consumption is similar, but the one of the H-EMS is the lowest. It is obvious that the gap between the fuel consumption of the H-EMS and others becomes larger. Thus, for the fuel-saving potential, the H-EMS has a relatively better performance than the ECMS and MPC.
Aiming to evaluate the comprehensive energy-saving potential, Figure 10 shows the comparison of the equivalent fuel consumption among control methods, and the detailed statistics are shown in Table 5. Compared with others, the value of the equivalent fuel consumption of the H-EMS is the lowest, indicating the best energy-saving potential. Although the fuel consumption of the RB strategy is the smallest, the value of the equivalent fuel consumption is the highest, reaching 972.7 g. As for the value of the ECMS, the equivalent fuel consumption of the vehicle is 897.6 g, which is 7.72% lower than that of the RB strategy. As for the MPC strategy, the equivalent fuel consumption of the vehicle is 888.0 g, which is 8.71% lower than that of the RB strategy. As for the H-EMS, the equivalent fuel consumption of the vehicle is 857.2 g, which is 11.87% lower than that of the RB strategy. Therefore, the H-EMS has the best energy-saving potential compared with other energy management strategies in the equivalent fuel consumption. Aiming at analyzing the energy-saving ability of each framework in the H-EMS, an analysis of the operating points of the engine and motors is necessary.

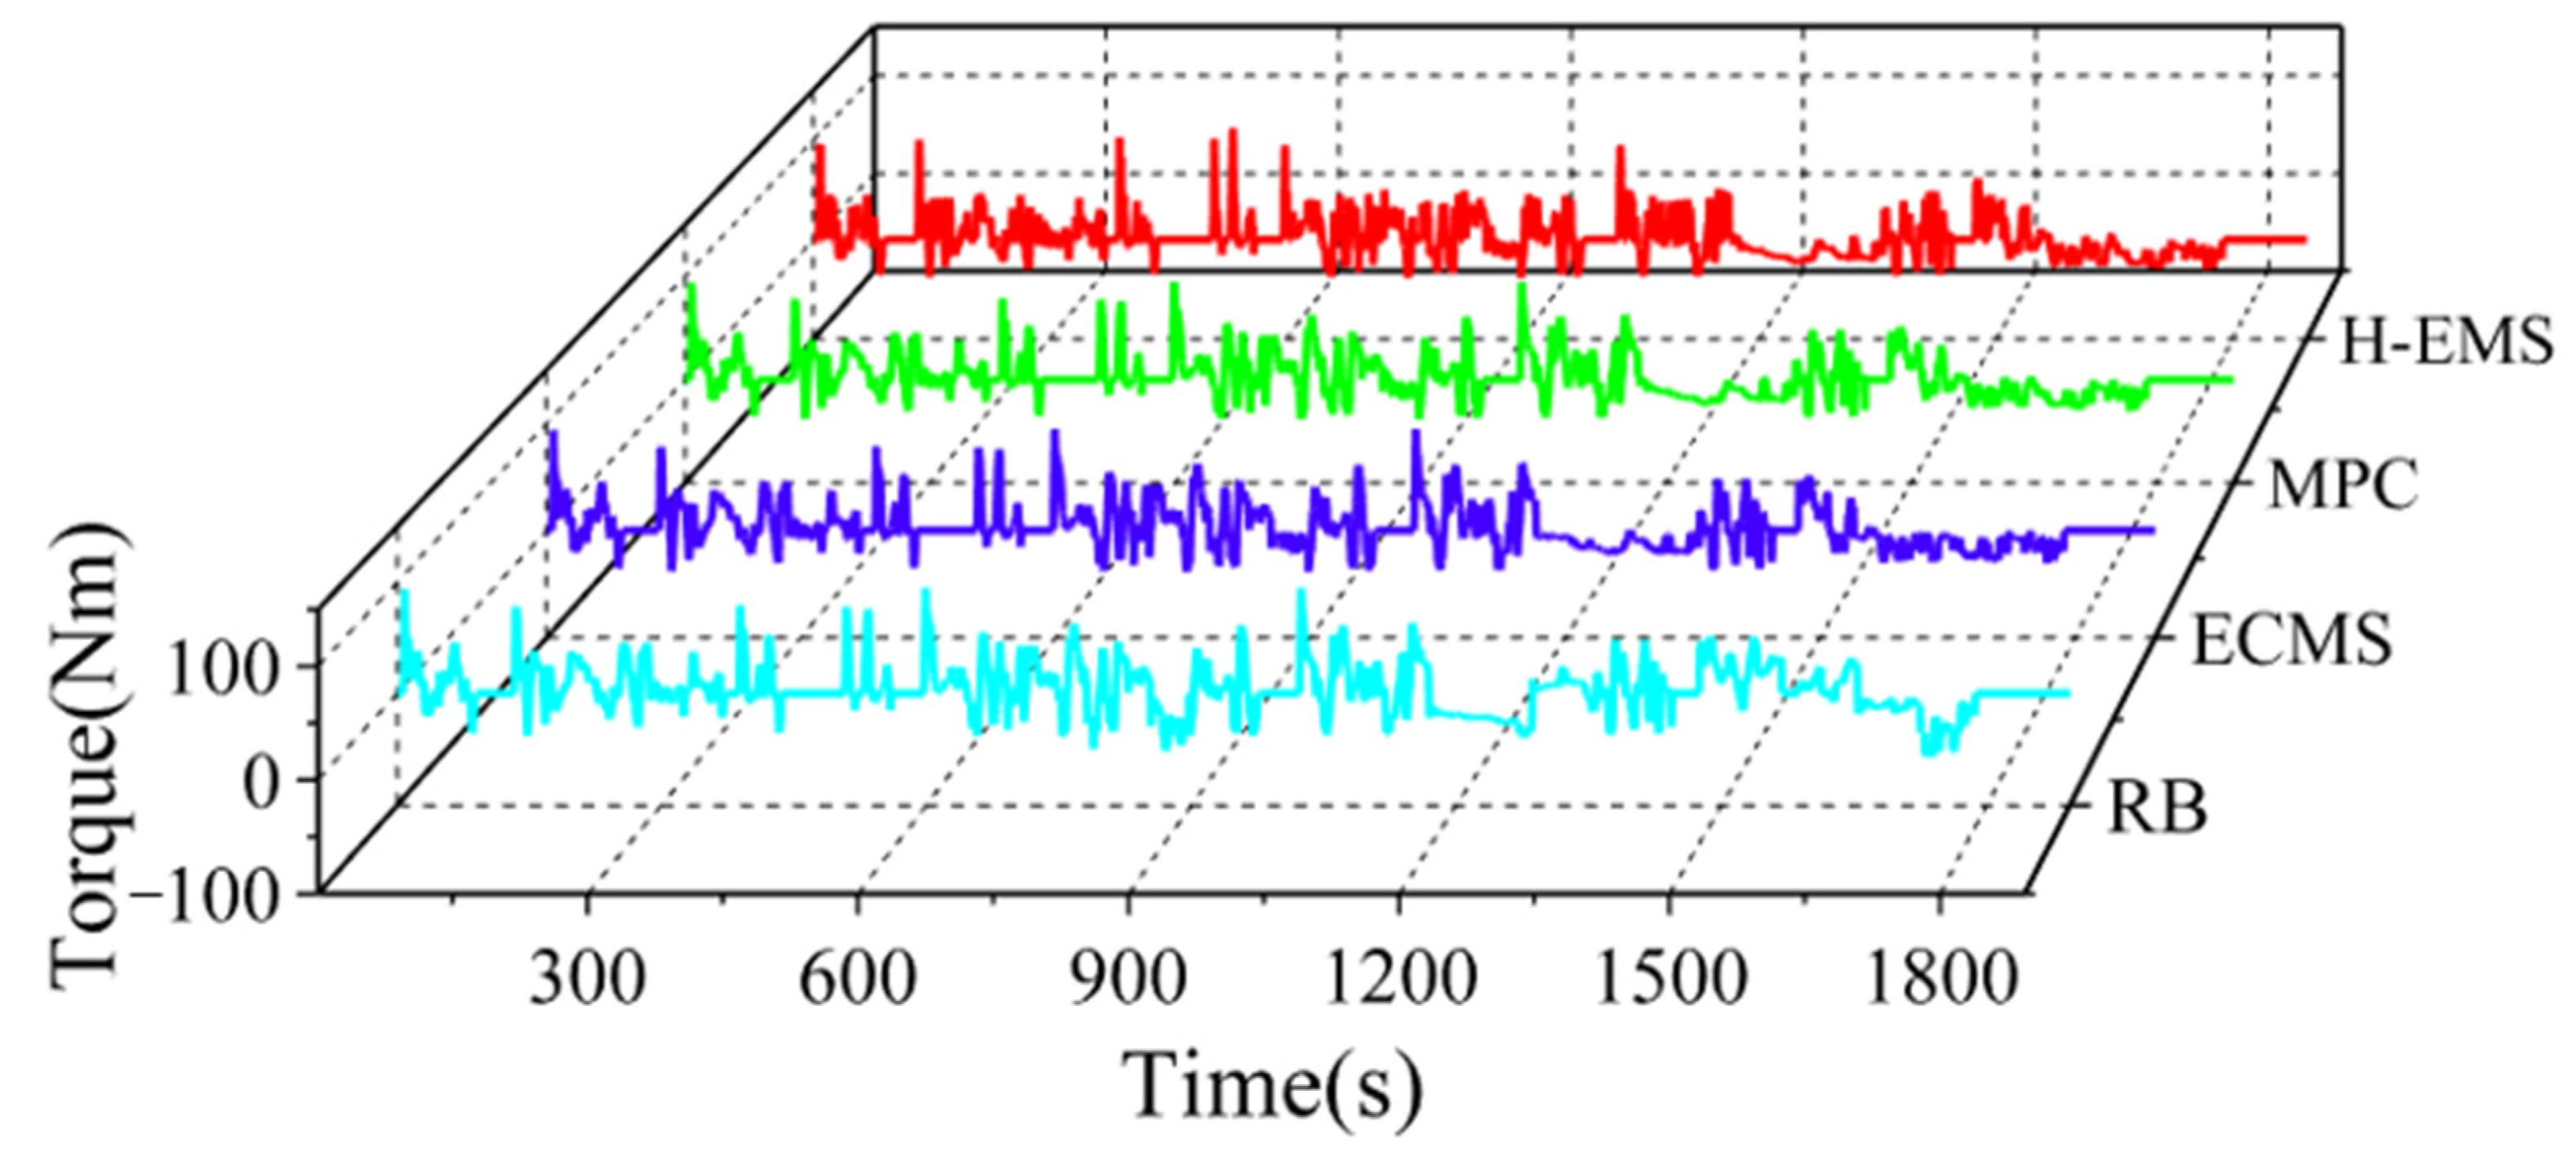
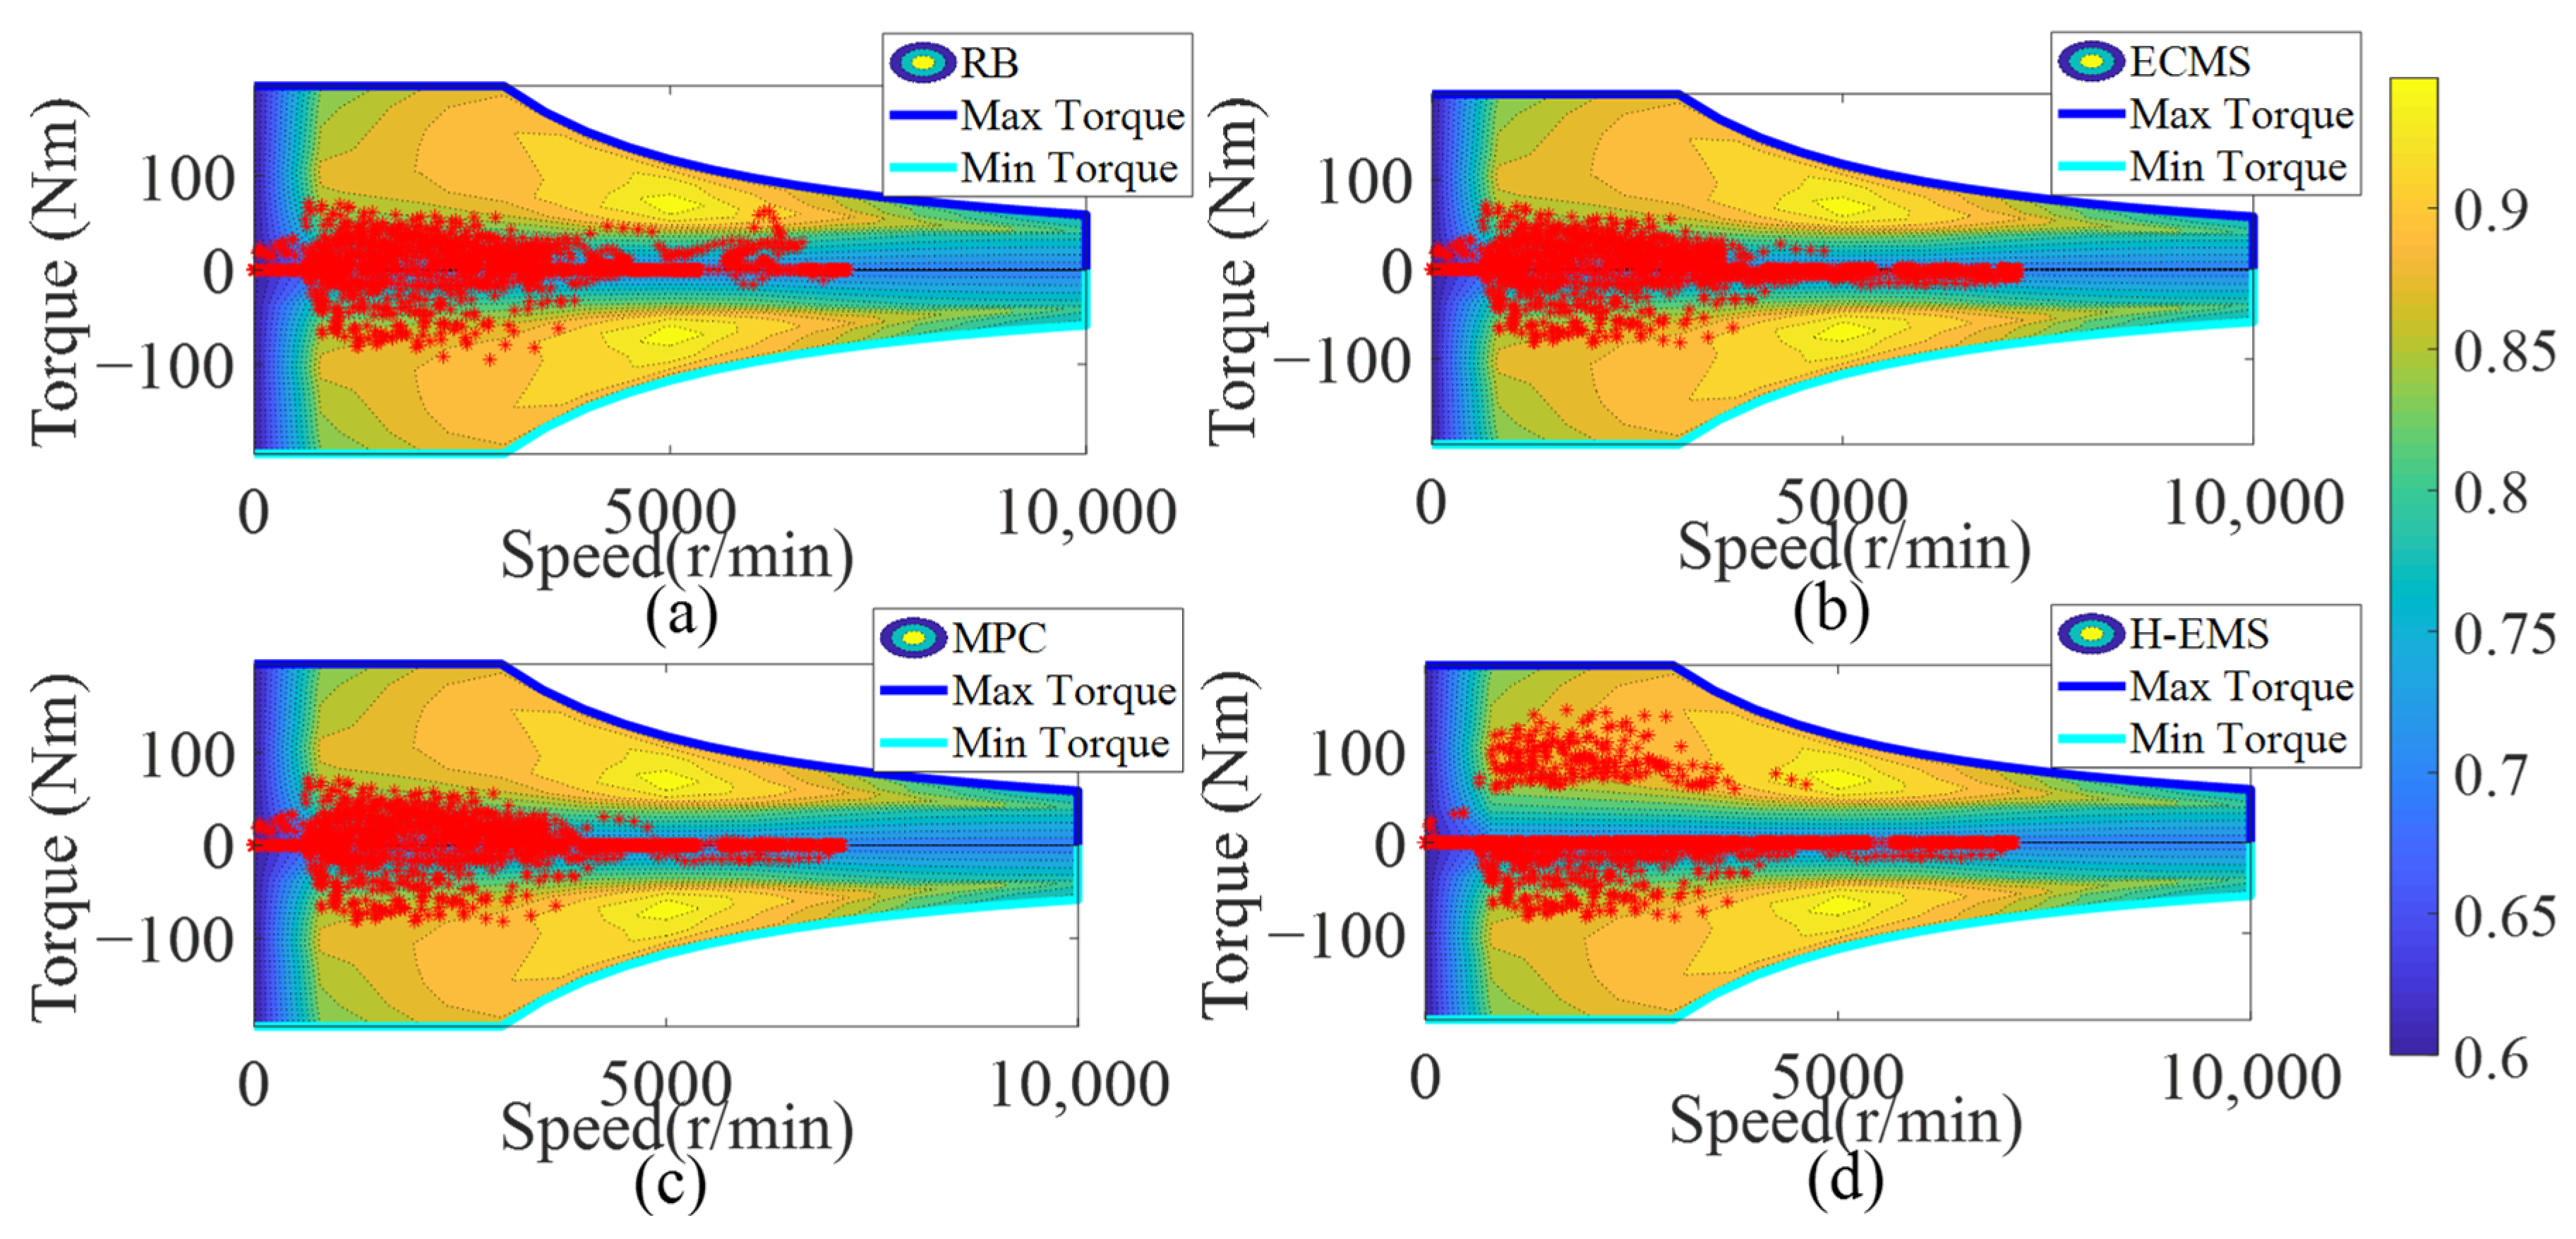
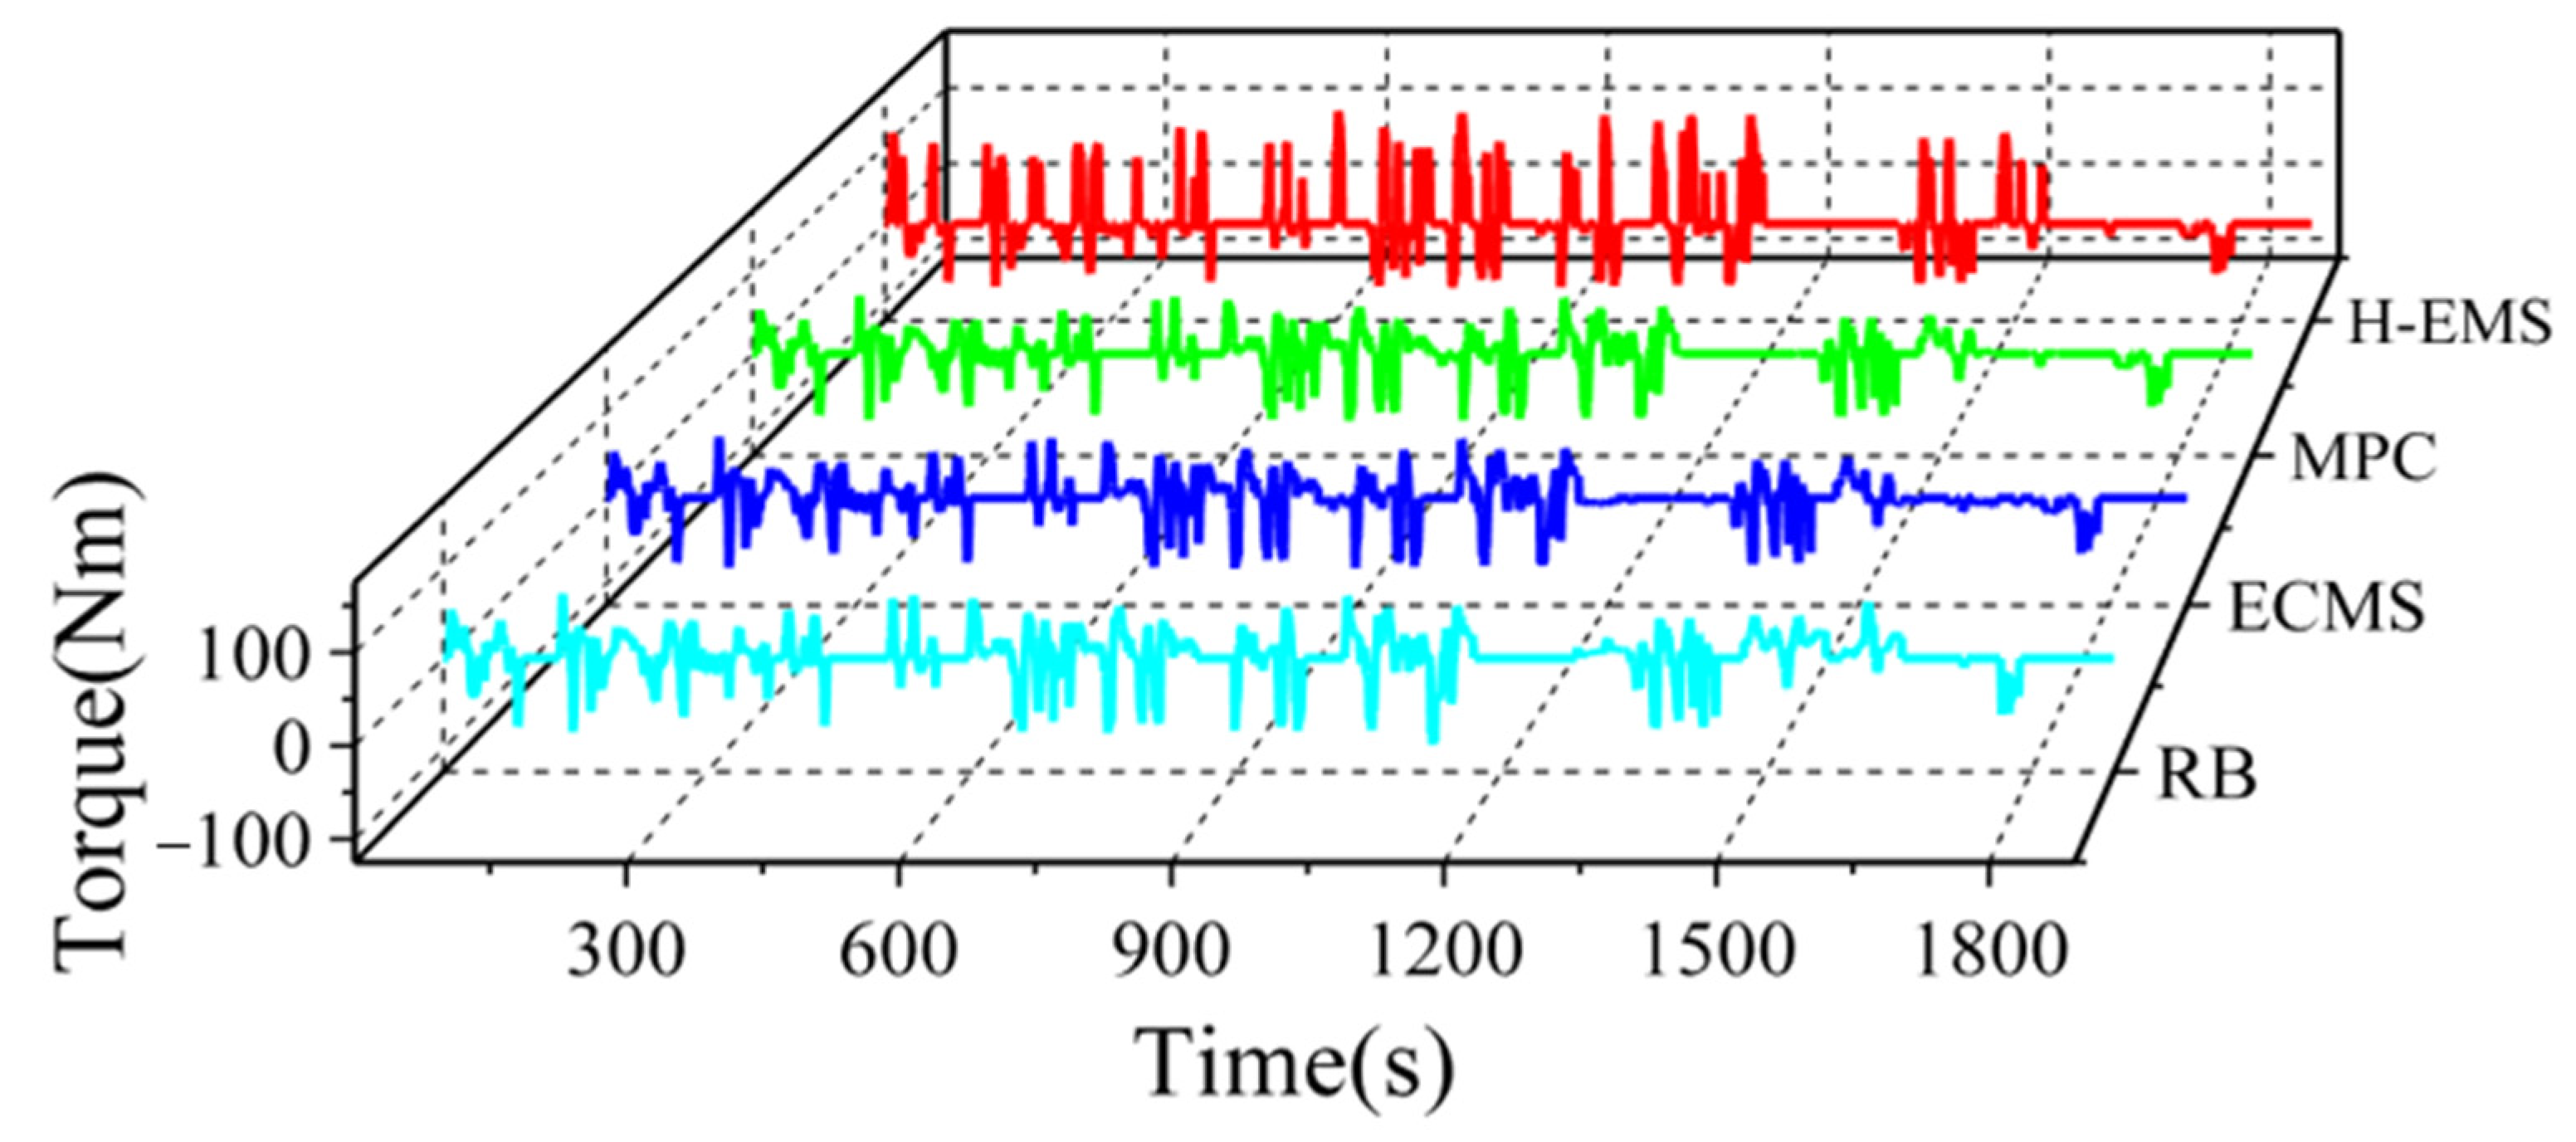
4.3. Qualitative Comparison and Analysis of Component Performance

In order to reveal the performance of different energy management strategies, the operating state of each component is analyzed and compared.
As shown in Figure 11, for the RB strategy, the engine operating points are distributed near the brake-specific fuel consumption (BSFC), proving the rationality of the RB strategy in engine control. However, the distribution of some operating points is higher than that of the BSFC. The distribution of these operating points is concentrated from 2400 r/min to 2800 r/min, and the torque from 100 Nm to 140 Nm, whose fuel consumption per unit time of the engine is high. This proves that the RB control strategy is not robust with regard to the energy-saving control of the engine. As for the ECMS, it is hard to conclude a regular distribution of operating points of the engine, indicating the ability to adjust for the engine through the ECMS during energy management. The operating points of the MPC and H-EMS are similar. The operating points in both strategies are near the BSFC, illustrating the fuel-saving capacity of the strategies. However, the adjusting ability of both strategies is also obvious because the distributions of some operating points in both strategies are under the BSFC, and they have scattered states.
Aiming to deeply analyze the performance of the engine in different energy management strategies, the torque curves are shown in Figure 12. From 800 s to 1150 s, the engine torque in the RB strategy is relatively high because of the battery-charging requirement. However, at that time, other energy management strategies operate the engine at a lower torque to balance the consumption of electricity and fuel, resulting in better energy savings than the RB strategy. From 1600 s to 1800 s, the ECMS, MPC, and H-EMS operate the engine in a high-torque state, and the vehicle speed and required power are high at that time, which means the efficiency of the engine is high. Compared with the RB strategy, although the trend of the torque curves in the ECMS, MPC, and H-EMS is different, the values of curves are close. However, the more reasonable distribution statement of the engine in the H-EMS and MPC compared to the ECMS can illustrate an advanced adjustment and operating ability, which also illustrates the good performance of the high-level H-MPC. Aiming to further analyze the comparison of electric components to discuss the energy-saving ability of the low-level H-EMS, the simulation results of front/rear motors are shown in Figure 13, Figure 14, Figure 15 and Figure 16.
As shown in Figure 13, Figure 14, Figure 15 and Figure 16, the RB strategy adopts fixed thresholds to control the vehicle, and the front/rear motors still output a larger torque at a high speed than others. As shown in Figure 14, when the front motor is around 1200 s, the RB strategy has a larger negative torque than the other three strategies, indicating that the engine provides more torque to drive the front motor to charge the battery. As shown in Figure 16, the rear motor is in a shutdown state at around 1200 s. The engine is fixedly connected with the front motor at around 1200 s, and the engine outputs more torque to drive the front motor to charge the battery. Compared with the MPC and ECMS, since the front/rear motors adopt a fixed distribution coefficient, the front/rear motors’ operating point distribution and torque output are basically the same under these two different strategies.
As shown in Figure 13, the front motor based on the H-EMS has a higher efficiency at around 4000 r/min than that of the MPC and ECMS. As shown in Figure 15, for the H-EMS, the operating points of the rear motor are obviously located in a higher efficiency range than that of the MPC and ECMS. According to the difference between the front motor map and the rear motor map, the low-level framework of the H-EMS reasonably distributes the proportion of the power output of the front motor and the rear motor, which further improves the driving economy of the vehicle.

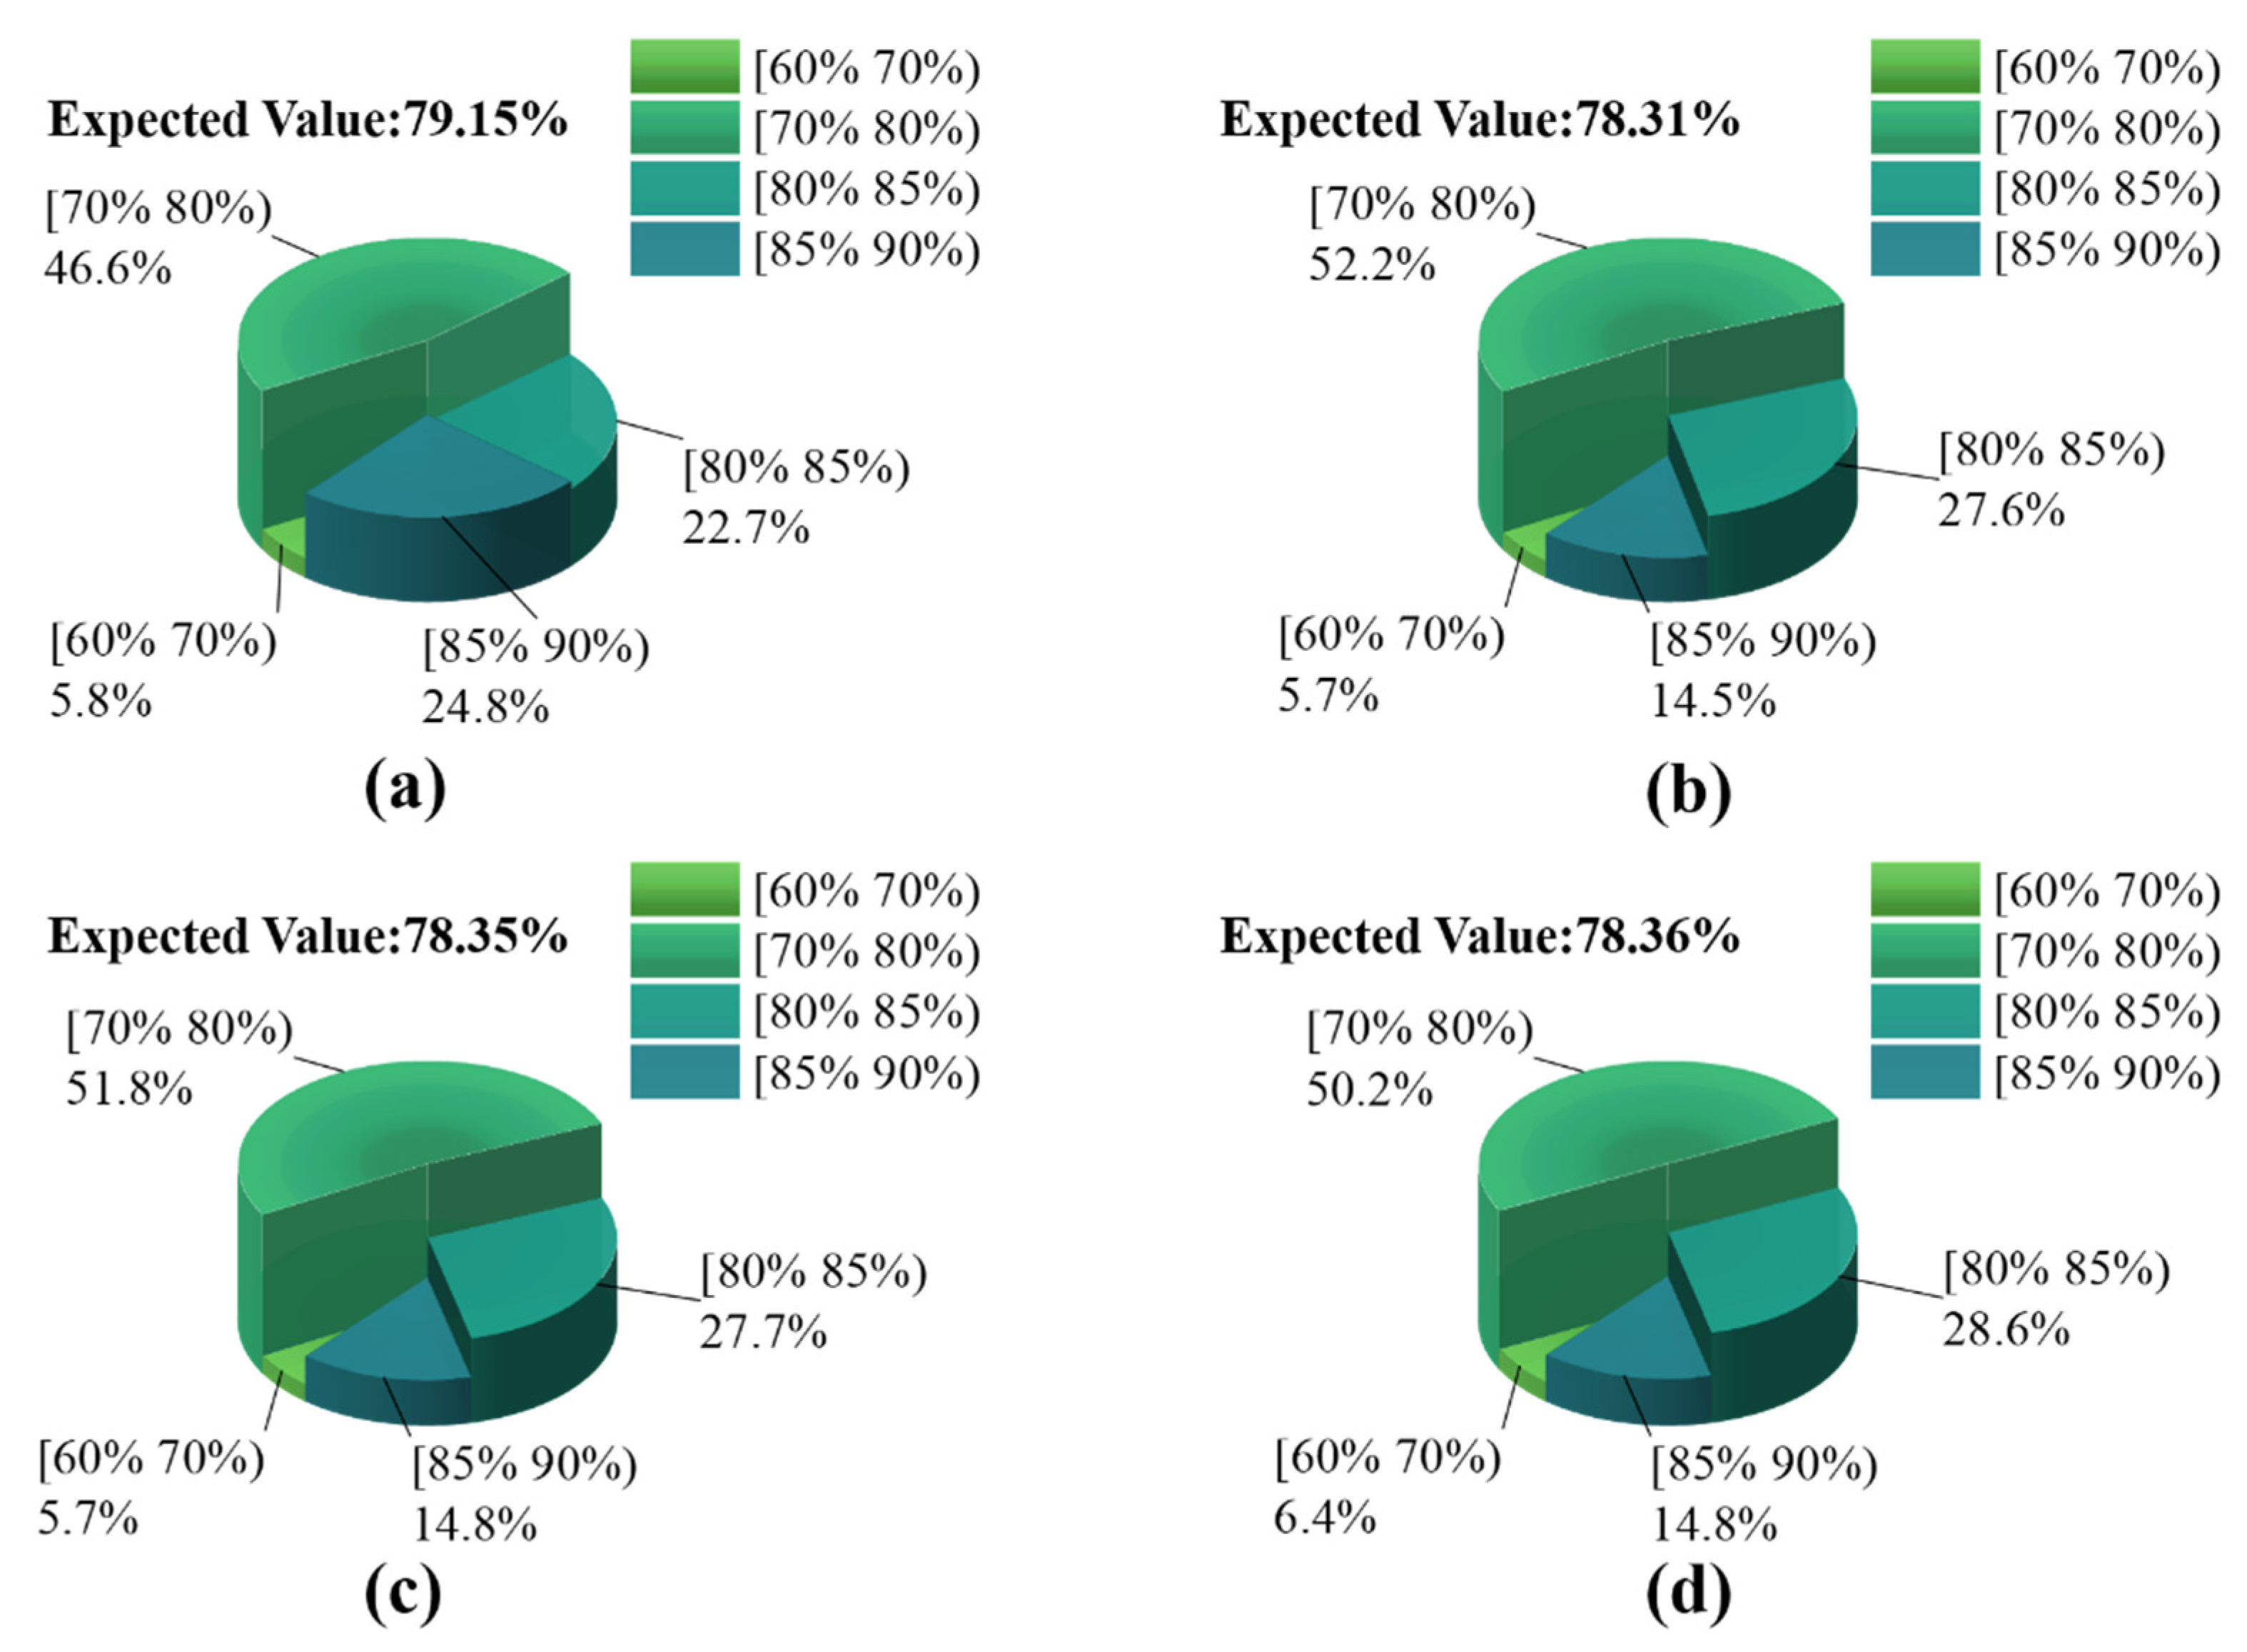
4.4. Quantitative Comparison and Analysis of Component Performance

Aiming to quantitatively analyze the performance of energy management strategies, this chapter illustrates the proportion of operating points of power components in the different operating states.
As shown in Figure 17, the proportions in [ 0 , 1 ) of the instantaneous equivalent fuel consumption in other strategies are obviously larger than the one in the RB strategy. The proportions in [ 3 , 0 ) in the four strategies are similar, as are the proportions in [ 2 , 6 ) . Furthermore, the proportion in [ 1 , 2 ) has the lowest value in the H-EMS among these strategies. For determining the average instantaneous equivalent fuel consumption, the mathematical expectation of the one in each strategy is calculated. The expectation in the H-EMS is 0.35 g, which is the lowest one among these strategies. It can indicate that the H-EMS is equipped with the best comprehensive energy-saving potential. On the contrary, the RB strategy has the poorest energy-saving potential, which has an expectation of 0.40 g based on the pie chart.
As shown in Figure 18, the pie chart of the efficiency of the front motor in each strategy is illustrated. Although the proportion in [ 85 % , 90 % ) of the front motor in the RB strategy has the max occupation, the proportions in [ 70 % , 80 % ) and [ 80 % , 85 % ) are smaller than that of others. The proportion in each field is close among the ECMS, MPC, and H-EMS; therefore, the analysis of mathematical expectations for the efficiency of the front motor in these strategies is necessary. The value of each expectation is 79.15%, 78.31%, 78.35%, and 78.36% in the RB strategy, ECMS, MPC, and H-EMS, respectively. These expectations are close, and thus, the energy-saving potential demonstrated in the front motor is similar to these energy management strategies.
As shown in Figure 19, obviously, the proportions of the high efficiency of [ 85 % , 90 % ) and [ 80 % , 95 % ) in the rear motor occupy the relatively largest area in the pie compared with the one in other strategies. However, the proportion in [ 60 % , 65 % ) is also the biggest among that of other strategies. As for calculating the mathematical expectation with regard to the efficiency of the rear motor in these strategies, the expectation has a similar amount in the RB strategy, ECMS, and MPC, which reaches 75.27%, 74.82%, and 75.20%, respectively. However, the expectation in the H-EMS, which reached 78.58%, has a nearly 3% advantage compared with the others. It can illustrate the advanced energy-saving ability in the electricity distribution in the low-level framework of the H-EMS.
Based on the above analysis, the H-EMS improves the remarkable economy by reasonably separating the energy-saving problem into the subproblem. Additionally, the hierarchical structure of the H-EMS has an advanced energy-saving ability as it uses suitable energy management methods, and it contains the high-level framework that is established by the MPC for optimizing the distribution between fuel consumption and electricity, and the low-level framework that is established by the ECMS for optimizing the electric distribution between front motor and rear motor.

5. Conclusions

In this paper, an energy management strategy based on the H-EMS is proposed for a 4WD PHEV and gives full play to the energy-saving potential of cooperative control between a 4WD PHEV’s multipower sources and multipower components. The GRNN is adopted to predict the future speed of the vehicle, which can provide future driving information for the energy management strategy. The H-EMS adopts a hierarchical control strategy, where the upper strategy adopts the MPC strategy to distribute the power output among multipower sources, and the lower strategy adopts the ECMS with relatively less computational load to distribute the energy of the front/rear motors. In order to verify the effectiveness of the novel method proposed in this paper, the simulation results are compared using MATLAB/Simulink, and the economy of the H-EMS strategy is improved by 11.87% compared with the RB strategy.
However, the deviation of speed prediction and the error of the linearization process of the MPC lead to the final control effect not reaching the best state. In future scientific research, the speed prediction error and MPC linearization error shall be solved to improve the vehicle economy further.

Author Contributions

Conceptualization, Z.G. and J.G.; methodology, Z.G.; software, J.G.; validation, J.G., L.C. and Z.H.; formal analysis, C.G. and Z.H.; investigation, J.H. and C.G.; resources, L.C. and Z.H.; data curation, Z.G., J.G., L.C. and Z.H.; writing—original draft preparation, Z.G.; writing—review and editing, Z.H.; visualization, C.G. and J.H.; supervision, J.H. and Z.H.; project administration, J.G.; funding acquisition, J.G. All authors have read and agreed to the published version of the manuscript.

Funding

This research was funded by the Changsha Automotive Innovation Research Institute Innovation Project—Research on Intelligent Trip Planning System of Pure Electric Vehicles Based on Big Data (CAIRIZT20220105), the Science and Technology Planning Project in Yibin city (2020GY001), and the Science and Technology Planning Project in Tianjin city (20YFZCGX00770).

Conflicts of Interest

The authors declare no conflict of interest.

References

  1. Mohr, S.H.; Ward, J.; Ellem, G.; Giurco, D. Projection of world fossil fuels by country. Fuel 2015, 141, 120–135. [Google Scholar] [CrossRef]
  2. West, J.G.W. DC, induction, reluctance and pm motors for electric vehicles. Power Eng. J. 1994, 77, 77–88. [Google Scholar] [CrossRef]
  3. Wyczalek, F.A. Hybrid electric vehicles: Year 2000 status. IEEE Aerosp. Electron. Syst. Mag. 2001, 16, 15–25. [Google Scholar] [CrossRef]
  4. Zeng, Y.; Cai, Y.; Kou, G.; Gao, W.; Qin, D. Energy Management for Plug-In Hybrid Electric Vehicle Based on Adaptive Simplified-ECMS. Sustainability 2018, 10, 2060. [Google Scholar] [CrossRef] [Green Version]
  5. Yang, C.; Zha, M.; Wang, W.; Liu, K.; Xiang, C. Efficient energy management strategy for hybrid electric vehicles/plug-in hybrid electric vehicles: Review and recent advances under intelligent transportation system. IET Intell. Transp. Syst. 2020, 14, 702–711. [Google Scholar] [CrossRef]
  6. Zhang, Y.; Chu, L.; Fu, Z.; Xu, N.; Guo, C.; Zhang, X.; Chen, Z.; Wang, P. Optimal energy management strategy for parallel plug-in hybrid electric vehicle based on driving behavior analysis and real time traffic information prediction. Mechatronics 2017, 46, 177–192. [Google Scholar] [CrossRef]
  7. Wu, G.; Boriboonsomsin, K.; Barth, M. Development and Evaluation of Intelligent Energy Management Strategy for Plug-in Hybrid Electric Vehicle. In Proceedings of the Transportation Research Board Meeting, Washington, DC, USA, 13–17 January 2013. [Google Scholar]
  8. Deng, T.; Lu, R.; Li, Y.; Lin, C. Adaptive energy control strategy of hev based on driving cycle recognition by lvq algorithm. China Mech. Eng. 2016, 27, 420. [Google Scholar]
  9. Wang, Y.; Qian, L.; Niu, L. Multi-objective optimization of control strategies for four-wheel drive phev based on immune algorithm. China Mech. Eng. 2017, 28, 1683. [Google Scholar]
  10. Bayindir, K.A.; Gözüküçük, M.A.; Teke, A. A comprehensive overview of hybrid electric vehicle: Powertrain configurations, powertrain control techniques and electronic control units. Energy Convers. Manag. 2011, 52, 1305–1313. [Google Scholar] [CrossRef]
  11. Zhang, B.; Mi, C.; Zhang, M. Charge-depleting control strategies and fuel optimization of blended-mode plug-in hybrid electric vehicles. IEEE Trans. Veh. Technol. 2011, 60, 1516–1525. [Google Scholar] [CrossRef]
  12. Mirko, S.; Rashad, M.; Benjamin, T.; Peter, E.; Ferit, K. Energy management in a parallel hybrid electric vehicle for different driving conditions. SAE Int. J. Altern. Powertrains 2014, 3, 193–212. [Google Scholar]
  13. Ahn, K.; Papalambros, P.Y. Engine optimal operation lines for power-split hybrid electric vehicles. Proceedings of the Institution of Mechanical Engineers. Part D J. Automob. Eng. 2009, 223, 1149–1162. [Google Scholar] [CrossRef]
  14. Chen, J.; Xu, C.; Wu, C.; Xu, W. Adaptive fuzzy logic control of fuel-cell-battery hybrid systems for electric vehicles. IEEE Trans. Ind. Inform. 2016, 14, 292–300. [Google Scholar] [CrossRef]
  15. Xu, Q.; Luo, X.; Jiang, X.; Zhao, M. Research on double fuzzy control strategy for parallel hybrid electric bus. In Advanced Computational Methods in Energy, Power, Electric Vehicles, and Their Integration; Springer: Singapore, 2017. [Google Scholar]
  16. Zi, X.; Du, C.; Zhang, Z.; Yan, F. Fuzzy Logic-Based Energy Management Strategies for Hybrid Electric Vehicles. J. Wuhan Univ. Technol. (Inf. Manag. Eng.) 2008, 133, 200–205. [Google Scholar]
  17. Lempert, J.; Vadala, B.; Arshad-Aliy, K.; Roeleveld, J.; Emadi, A. Practical Considerations for the Implementation of Dynamic Programming for HEV Powertrains. In Proceedings of the 2018 IEEE Transportation Electrification Conference and Expo (ITEC), Long Beach, CA, USA, 13–15 June 2018; pp. 755–760. [Google Scholar]
  18. Chen, Z.; Mi, C.C.; Xu, J.; Gong, X.; You, C. Energy management for a power-split plug-in hybrid electric vehicle based on dynamic programming and neural networks. IEEE Trans. Veh. Technol. 2014, 63, 1567–1580. [Google Scholar] [CrossRef]
  19. Zhang, S.; Xiong, R. Adaptive energy management of a plug-in hybrid electric vehicle based on driving pattern recognition and dynamic programming. Appl. Energy 2015, 155, 68–78. [Google Scholar] [CrossRef]
  20. Zhang, N.; Ma, X.; Jin, L. Energy management for parallel HEV based on PMP algorithm. In Proceedings of the 2017 2nd International Conference on Robotics and Automation Engineering (ICRAE), Shanghai, China, 29–31 December 2017. [Google Scholar]
  21. Lee, W.; Jeoung, H.; Park, D.; Kim, N. An adaptive concept of pmp-based control for saving operating costs of extended-range electric vehicles. IEEE Trans. Veh. Technol. 2019, 68, 11505–11512. [Google Scholar] [CrossRef]
  22. Wu, T.; Ding, Y.; Xu, Y. Energy optimal control strategy of phev based on pmp algorithm. J. Control Sci. Eng. 2017, 2017, 6183729. [Google Scholar] [CrossRef] [Green Version]
  23. Rezaei, A.; Burl, J.B.; Solouk, A.; Zhou, B.; Rezaei, M.; Shahbakhti, M. Catch energy saving opportunity (ceso), an instantaneous optimal energy management strategy for series hybrid electric vehicles. Appl. Energy 2017, 208, 655–665. [Google Scholar] [CrossRef]
  24. Wu, J.; Ruan, J.; Zhang, N.; Walker, P.D. An optimized real-time energy management strategy for the power-split hybrid electric vehicles. IEEE Trans. Control Syst. Technol. 2018, 27, 1194–1202. [Google Scholar] [CrossRef]
  25. Wang, J.; Jiao, Z. Energy management strategy of four-wheel drive hybrid electric vehicle based on ecms algorithm. DEStech Trans. Environ. Energy Earth Sci. (Iceee) 2019, 2475–8833. [Google Scholar] [CrossRef]
  26. Xie, S.; Hu, X.; Xin, Z.; Li, L. Time-efficient stochastic model predictive energy management for a plug-in hybrid electric bus with adaptive reference state-of-charge advisory. IEEE Trans. Veh. Technol. 2018, 67, 5671–5682. [Google Scholar] [CrossRef]
  27. Guo, L.; Gao, B.; Ying, G.; Hong, C. Optimal energy management for hevs in eco-driving applications using bi-level mpc. IEEE Trans. Intell. Transp. Syst. 2017, 18, 2153–2162. [Google Scholar] [CrossRef]
  28. Sun, C.; Moura, S.J.; Hu, X.; Hedrick, J.K.; Sun, F. Dynamic traffic feedback data enabled energy management in plug-in hybrid electric vehicles. IEEE Trans. Control. Syst. Technol. 2015, 23, 1075–1086. [Google Scholar]
  29. Zeng, Y.; Jing, S.; Ming, L. Adaptive real-time energy management strategy for plug-in hybrid electric vehicle based on simplified-ecms and a novel driving pattern recognition method. Math. Probl. Eng. 2018, 2018, 5816861. [Google Scholar] [CrossRef]
  30. Xie, S.; Chen, H.; Liu, T.; Wei, L. A research on energy management strategy for a plug-in hybrid electric bus based on dp-ecms strategy. Qiche Gongcheng/Automot. Eng. 2017, 39, 736–741, 781. [Google Scholar]
  31. Li, J.; Liu, Y.; Qin, D.; Li, G.; Chen, Z. Research on equivalent factor boundary of equivalent consumption minimization strategy for phevs. IEEE Trans. Veh. Technol. 2020, 69, 6011–6024. [Google Scholar] [CrossRef]
  32. Zhou, W.; Chen, Y.; Zhai, H.; Zhang, N. Predictive energy management for a plug-in hybrid electric vehicle using driving profile segmentation and energy-based analytical soc planning. Energy 2020, 220, 119700. [Google Scholar] [CrossRef]
  33. Lian, J.; Liu, S.; Li, L.; Liu, X.; Zhou, Y.; Yang, F.; Yuan, L. A Mixed Logical Dynamical-Model Predictive Control (MLD-MPC) Energy Management Control Strategy for Plug-in Hybrid Electric Vehicles (PHEVs). Energies 2017, 10, 74. [Google Scholar] [CrossRef]
  34. Guo, J.; He, H.; Peng, J.; Zhou, N. A novel mpc-based adaptive energy management strategy in plug-in hybrid electric vehicles. Energy 2019, 175, 378–392. [Google Scholar]
  35. Qiu, L.; Qian, L.; Zomorodi, H. Global optimal energy management control strategies for connected four-wheel-drive hybrid electric vehicles. Iet Intell. Transp. Syst. 2017, 11, 264–272. [Google Scholar] [CrossRef]
  36. Ju, F.; Zhuang, W.; Wang, L.; Zhang, Z. Optimal sizing and adaptive energy management of a novel four-wheel-drive hybrid powertrain. Energy 2019, 187, 116008. [Google Scholar] [CrossRef]
  37. Qiu, L.H.; Qian, L.J.; Hesam, Z.; Pierluigi, P. Design and optimization of equivalent consumption minimization strategy for 4wd hybrid electric vehicles incorporating vehicle connectivity. Sci. China Technol. Sci. 2018, 61, 147–157. [Google Scholar] [CrossRef]
  38. Ju, F.; Zhuang, W.; Wang, L.; Jiang, Y. A novel four-wheel-drive hybrid electric sport utility vehicle with double planetary gears. IFAC-Pap. 2018, 51, 81–86. [Google Scholar] [CrossRef]
  39. Nguyen, C.T.P.; Nguyễn, B.H.; Trovão, J.P.F.; Ta, M.C. Optimal drivetrain design methodology for enhancing dynamic and energy performances of dual-motor electric vehicles. Energy Convers. Manag. 2021, 252, 115054. [Google Scholar] [CrossRef]
  40. Santini, S. Distributed nonlinear model predictive control for connected autonomous electric vehicles platoon with distance-dependent air drag formulation. Energies 2021, 14, 5122. [Google Scholar]
  41. Maia, R.; Silva, M.; Araujo, R.; Nunes, U. Electrical vehicle modeling: A fuzzy logic model for regenerative braking. Expert Syst. Appl. 2015, 42, 8504–8519. [Google Scholar] [CrossRef]
Figure 1. The schematic of the 4DW PHEV configuration.
Machines 10 00947 g001
Figure 2. The fuel consumption map of the engine.
Machines 10 00947 g002
Figure 3. Efficiency maps of the front/rear motors and generator. (a) Front motor; (b) Rear motor; (c) Generator motor.
Machines 10 00947 g003
Figure 4. The battery of discharging/charging internal-resistance diagrams. (a) Discharge; (b) Charge.
Machines 10 00947 g004
Figure 5. The illustration of the energy management strategy process.
Machines 10 00947 g005
Figure 6. The structure diagram of GRNN.
Machines 10 00947 g006
Figure 7. Variation curves of the predictive speed based on GRNN, RF, and SVM.
Machines 10 00947 g007
Figure 8. Variation curves of vehicle speed and SOC under different strategies.
Machines 10 00947 g008
Figure 9. Variation curves of vehicle speed and fuel consumption under different strategies.
Machines 10 00947 g009
Figure 10. Variation curves of vehicle speed and equivalent fuel consumption under different strategies.
Machines 10 00947 g010
Figure 11. Engine operating points of energy management strategies. (a) RB strategy; (b) ECMS strategy; (c) MPC strategy; (d) H-EMS strategy.
Machines 10 00947 g011
Figure 12. Engine torque of energy management strategies.
Machines 10 00947 g012
Figure 13. Front motor operating points of energy management strategies. (a) RB strategy; (b) ECMS strategy; (c) MPC strategy; (d) H-EMS strategy.
Machines 10 00947 g013
Figure 14. Front motor torque of energy management strategies.
Machines 10 00947 g014
Figure 15. Rear motor operating points of energy management strategies. (a) RB strategy; (b) ECMS strategy; (c) MPC strategy; (d) H-EMS strategy.
Machines 10 00947 g015
Figure 16. Rear motor torque of energy management strategies.
Machines 10 00947 g016
Figure 17. Distribution of equivalent fuel consumption per unit time. (a) RB strategy; (b) ECMS strategy; (c) MPC strategy; (d) H-EMS strategy.
Machines 10 00947 g017
Figure 18. Efficiency distribution of front motor operating points. (a) RB strategy; (b) ECMS strategy; (c) MPC strategy; (d) H-EMS strategy.
Machines 10 00947 g018
Figure 19. Efficiency distribution of rear motor operating points. (a) RB strategy; (b) ECMS strategy; (c) MPC strategy; (d) H-EMS strategy.
Machines 10 00947 g019
Table 1. Vehicle and dynamic component parameters in the 4DW PHEV.
ParameterUnitValue
Vehicle curb weightkg1860
Vehicle weightkg2370
Vehicle maximum velocitykm/h170
Wheel rolling radiusm0.35
Frontal aream22
Engine maximum powerkW @ rpm110 @ 5200
Engine maximum torqueNm @ rpm200 @ 5200
Front motor maximum powerkW60
Front motor maximum torqueNm137
Rear motor maximum powerkW61
Rear motor maximum torqueNm195
Battery capacitykWh15
Battery rated voltageV300
Table 2. Driveline ratio information.
Transmission Ratio ParametersValue
Front axle engine transmission ratio i E = 3.425
Front axle motor transmission ratio i F _ M = 9.663
Rear axle motor transmission ratio i R _ M = 7.065
Front axle engine-generator transmission ratio i R _ M = 2.736
Table 3. Operating states of vehicle components under different modes.
Operating ModesIllustration
Pure electric modeThe battery provides all the power for the front/rear motors to drive the vehicle, and the engine and generator are in shutdown state.
Series modeThe engine drives the generator to provide electric energy for the front/rear motors, and the battery also provides electric energy output.
Parallel modeThe clutch is closed, and the engine directly drives the vehicle. The front/rear motors assist the engine to drive the vehicle.
Table 4. The error comparison table based on RF, SVM, and GRNN.
MethodError TypeFuture_1 sFuture_2 sFuture_3 sFuture_4 sFuture_5 s
RFRMSE0.54851.87643.52225.06596.4615
MSE0.30093.520812.406025.662541.7512
MAE0.19251.43982.69713.92595.0814
SVMRMSE0.54801.27542.59123.79714.8743
MSE0.30031.62666.714214.418323.7588
MAE0.35431.56842.82854.05165.1991
GRNNRMSE0.54611.27482.59593.80344.8855
MSE0.29821.62526.738714.466023.8681
MAE0.35601.56702.82744.04975.1976
Table 5. Data comparison table under different strategies.
Control StrategyFuel Consumption (g)Terminal SOCEquivalent Fuel Consumption (g)Economy (Relative to RB)
RB884.40.320972.7
ECMS997.90.360897.67.72%
MPC965.50.366888.08.71%
H-CMS962.00.373857.211.87%
Publisher’s Note: MDPI stays neutral with regard to jurisdictional claims in published maps and institutional affiliations.

