Article

Horizontal Bi-Stable Vibration Energy Harvesting Using Electromagnetic Induction and Power Generation Efficiency Improvement via Stochastic Resonance

1
Department of Mechanical Engineering, Saitama Institute of Technology, Saitama 369-0293, Japan
2
Weichai Global Axis Technology Co., Ltd., Tokyo 107-0062, Japan
*
Author to whom correspondence should be addressed.
Machines 2022, 10(10), 899; https://doi.org/10.3390/machines10100899
Submission received: 12 September 2022 / Revised: 29 September 2022 / Accepted: 1 October 2022 / Published: 6 October 2022
(This article belongs to the Special Issue New Advances in Energy Harvesters)

Abstract

:
In this study, a vibration energy-harvesting system is developed by first proposing a horizontal bi-stable vibration model comprising an elastic spring and a mass block and then applying an electromagnetic induction power generation device composed of a magnet and a coil. Subsequently, based on a weight function that considers the mutual positional relationship between the magnet and conducting coil, a set of simultaneous governing equations that consider the elastic force of the elastic spring and the Lorentz force of electromagnetic induction is derived. Additionally, a numerical analysis method employing the Runge–Kutta method is utilized to obtain a numerical solution for the vibration response displacement and vibration power generation voltage simultaneously. Experiments are performed to verify the results yielded by the proposed bi-stable vibration energy-harvesting system. The results shows that the measured vibration response displacement and the vibration power generation voltage are consistent with the analytical results. Moreover, issues including the identification of damping coefficients that consider the mutual effects of normal kinetic friction and electromagnetic induction damping forces, as well as the effects of electromagnetic induction damping on the vibration response displacement, are discussed comprehensively. Simultaneously adding random and periodic signals to the bi-stable vibration model results in stochastic resonance and improves both the vibration amplification effect and vibration power generation.

1. Introduction

To further develop natural renewable energy sources, including the ocean and wind, studies pertaining to vibration energy harvesting have received considerable attention, and numerous findings have been reported [1,2,3,4]. Vibration energy harvesting is a power generation method in which vibrational energy can be converted into electrical energy. The development of vibration devices with large amplitudes is desirable as greater vibration amplitudes result in higher amounts of vibration power generated.
Previously, vibration energy harvesting was conducted using amplitudes amplified via resonance, where the natural frequency of the vibration system had to match the frequency of the environmental vibration [5,6,7]. However, the disadvantage of the linear resonance system is that large amplitudes cannot be stably continued due to complex frequency components in natural environment. Hence, a method of installing multiple vibration models featuring different natural frequencies in a single vibration system has been proposed; however, it can be used for only a limited range of applications and requires a larger device [8,9]. Therefore, nonlinear vibration systems have been suggested for vibration environments featuring multiple frequency components; however, their low vibration amplitudes hamper their practical application in vibration energy harvesting [10,11,12].
Hence, new research and development programs for vibration energy harvesting have been proposed that exploit the advantages of stochastic resonance, which can magnify the vibration amplitude of a bi-stable vibration model considerably in a random noise environment [13,14]. Stochastic resonance is a physical phenomenon in which the response signal may be amplified significantly at a specified probability via the addition of a weak periodic signal to a nonlinear system subjected to a random excitation signal. In fact, numerous theoretical discussions for elucidating this phenomenon have been published [15,16,17,18,19].
In the field of mechanical systems, for bi-stable vibration systems subjected to random excitation signals, use of a stochastic resonance phenomenon, in which the response vibration of the system may be amplified significantly by adding a periodic input signal, has been applied for vibration power generation [20,21,22,23]. Therefore, bi-stable vibration systems that allow stochastic resonance to occur in mechanical systems must be developed.
Currently, the most frequently investigated bi-stable vibration systems for mechanical systems are those that employ cantilevered beams with mass blocks mounted at their tips [24,25,26]. Two approaches are typically employed to achieve bi-stable vibrational characteristics. The first uses the opposing repulsive forces between permanent magnets placed at the tip of a cantilever beam and at a short distance from it [27,28,29,30]. The other uses the elastic force caused by the gravity of the mass block attached to the tip of an inverted cantilever, which causes the cantilever to bend in the lateral direction [31,32,33]. In addition, to improve the bi-stable vibration performance, a number of bi-stable vibration models have been investigated, including a bi-stable vibration model [34,35,36] that combines multiple cantilever beams, a bi-stable vibration model featuring a modified cantilever beam shape [37,38,39], a bi-stable vibration model comprising two end-support beams bent to the side via the application of a compressive load in the axial direction [40,41,42,43], and a tri-stable vibration model [44,45,46,47,48,49] comprising a modified number of magnets to be installed at and near the tip of a cantilever beam.
In practical applications of vibration energy harvesting, bi-stable vibration models of mechanical systems in natural vibration environments often oscillate at relatively low amplitudes induced by random excitation signals. Utilizing significantly amplified bi-stable vibrations by intentionally introducing periodic excitation signals to a bi-stable vibration model to achieve stochastic resonance is a promising method.
To achieve the abovementioned objective, Zheng et al. developed a bi-stable vibration model comprising a horizontally mounted cantilever beam and a magnet attached to the tip of the beam. By inputting random noise and an external periodic force in the vertical direction, stochastic resonance was re-created in the bi-stable model and the findings were discussed [50]. Nakano et al. investigated the conditions under which the input vibration of a cantilever beam is modified in the horizontal direction and stochastic resonance occurs [51]. In addition, Zhang et al. evaluated the utility of a vibration energy-harvesting system for power generation equipment with bi-static vibrations, which is appropriate for automotive tire applications [52,53].
Nevertheless, a stable vibration limit exists when cantilevered beams are used. Moreover, the cantilevered beam structure cannot accommodate accidental disturbance loads, which suggests the significance of large-scale vibration models that allow for steadier long-term vibrations [54].
Therefore, Zhao et al. suggested a large-scale bi-stable vibration model that comprises a spring sustained from an oblique direction and a mass block for developing a bi-stable vibration system that can stably produce stochastic resonance while ensuring an exceptionally large amplitude, which is better than the conventional bi-stable vibration systems [55].
Methods for converting vibration energy into electric power, including piezoelectric methods based on piezoelectric and electromagnetic induction methods based on magnets and coils, have been considered for vibration power generation [56]. The electromagnetic induction method has become a typical method for generating vibrations.
Herein, a vibration energy-harvesting system is developed by first proposing a horizontal bi-stable vibration model comprising an elastic spring and a mass block and then applying an electromagnetic induction power generation device composed of a magnet and a coil. By proposing a weight function that considers the mutual positional relationship between the magnet and coil during bi-stable vibration motions, a simultaneous set of governing equations that simultaneously considers the elastic force of the spring and the Lorentz force of electromagnetic induction was derived. By applying the Runge–Kutta method to the simultaneous equations, numerical solutions for the vibration response displacement and vibration generation voltage of the mass block were investigated simultaneously. Furthermore, the identification of damping coefficients while considering the mutual effects of kinetic friction and electromagnetic induction damping forces and the effects of electromagnetic induction damping on the vibration response displacement are discussed comprehensively. When random and periodic excitation signals are applied to a large-scale bi-stable vibration model, stochastic resonance is generated, which allows the effect of vibration amplification and the amount of electricity generated via vibration power to be determined.

2. Material and Method

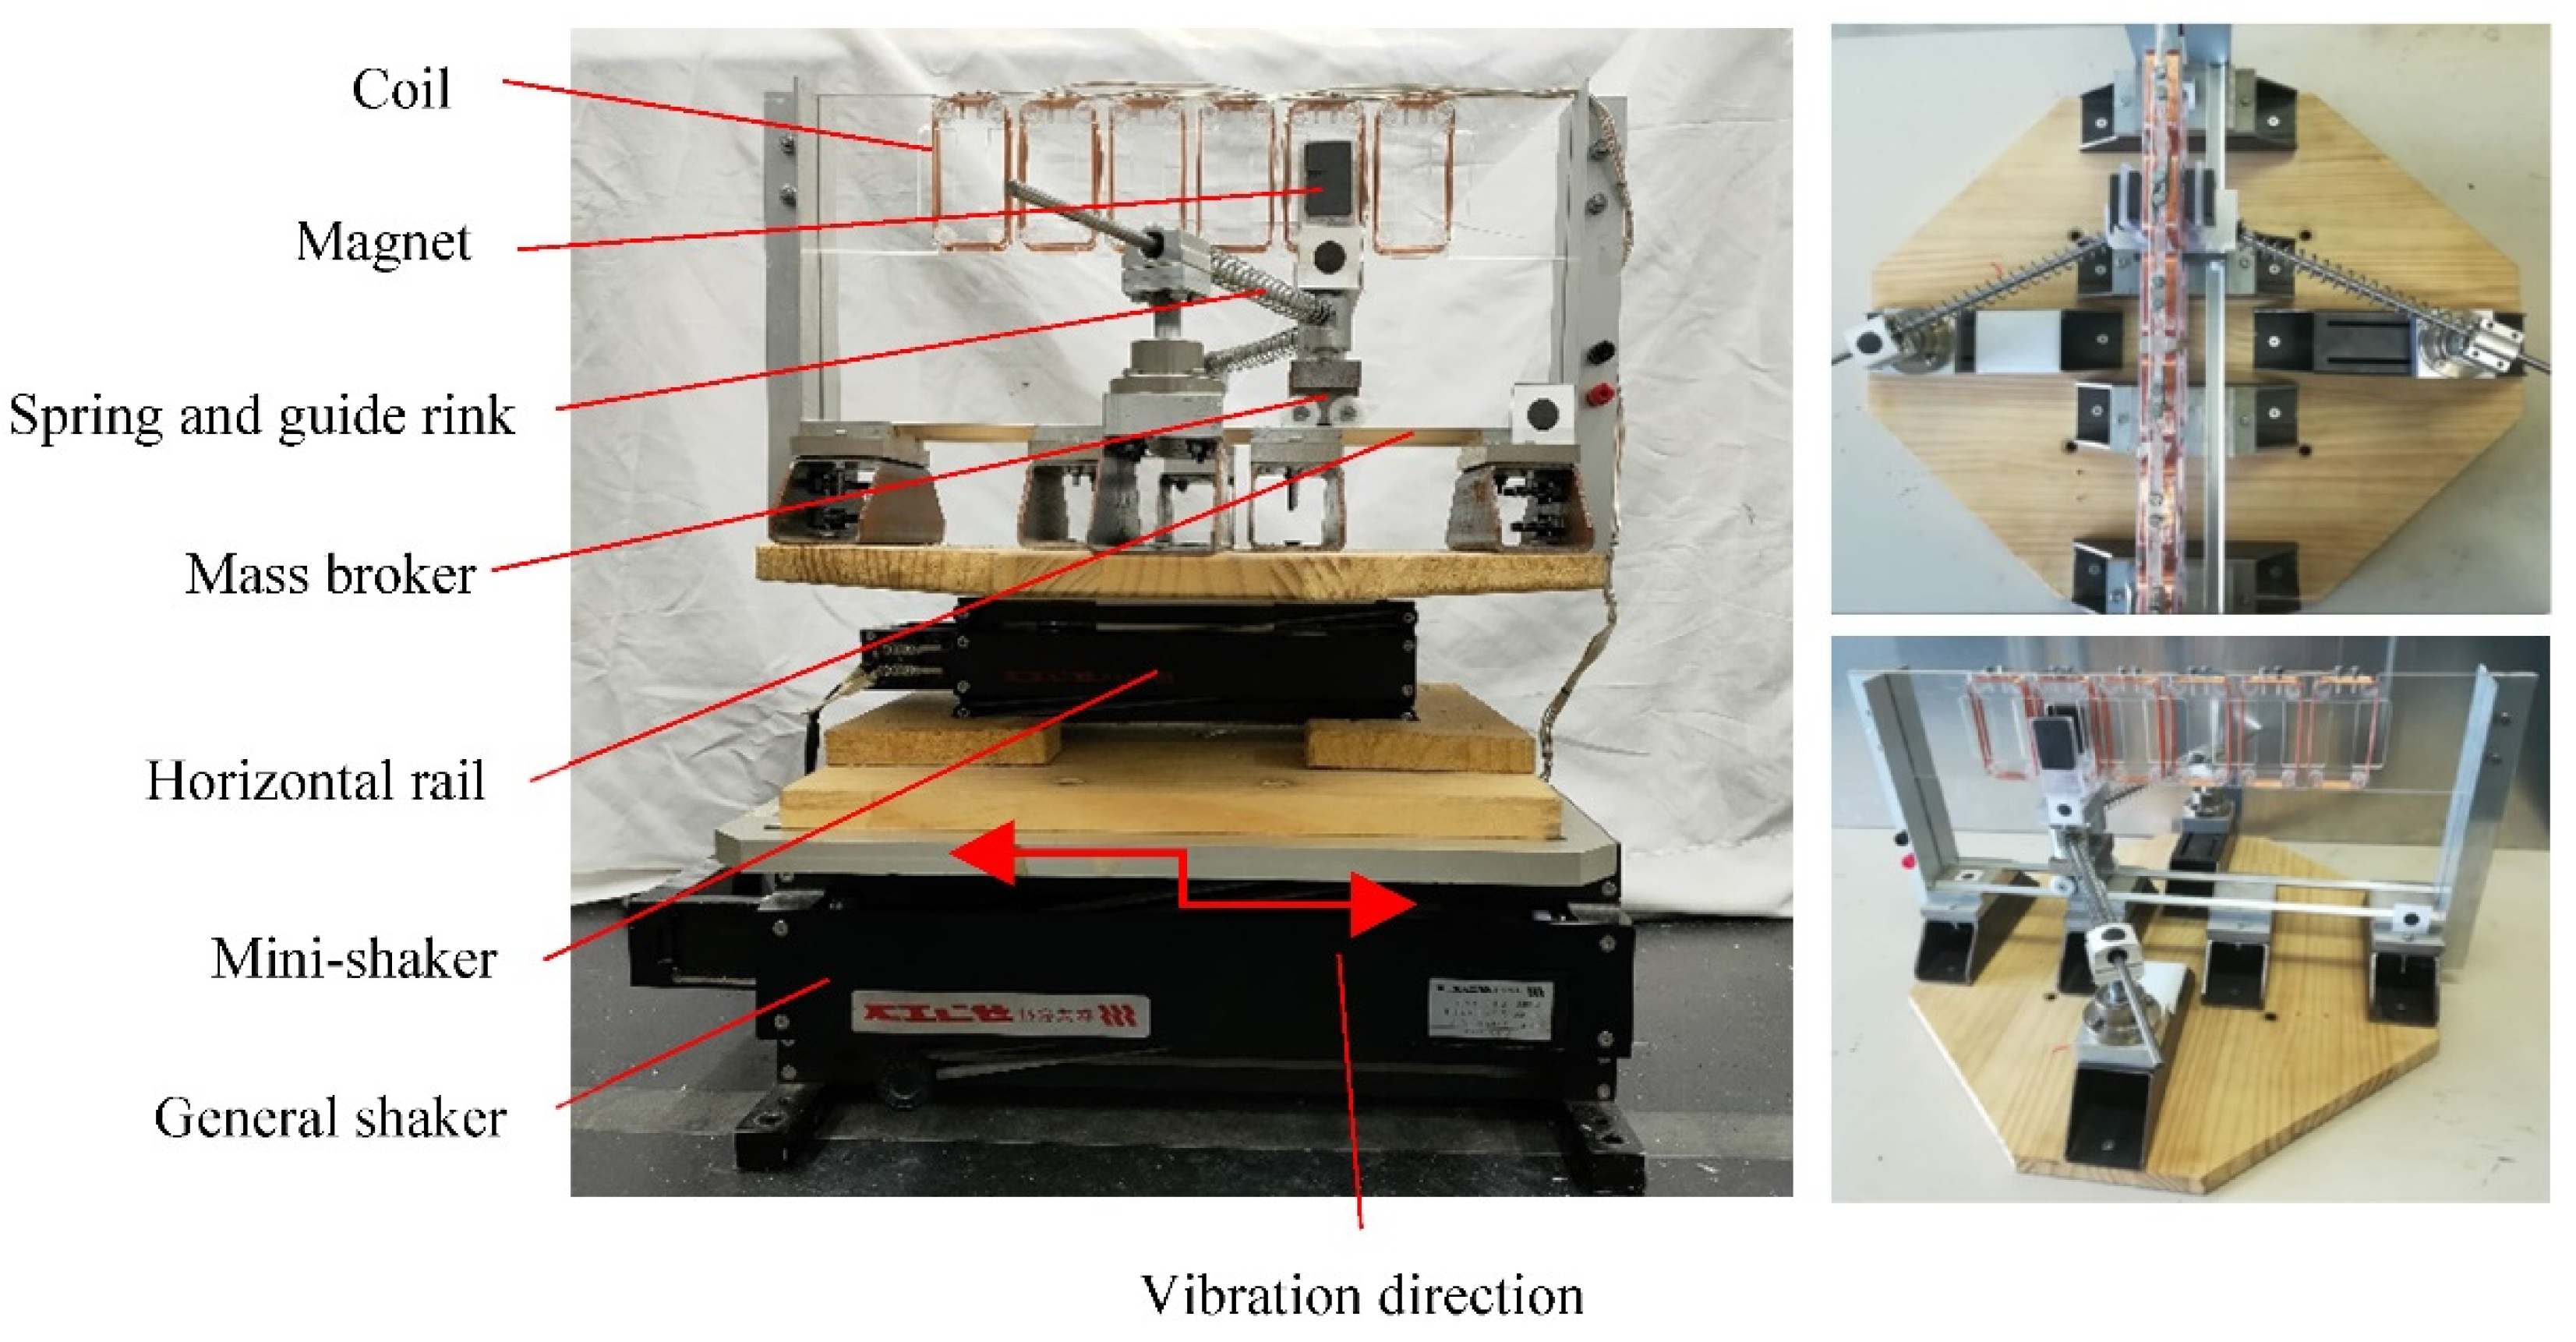
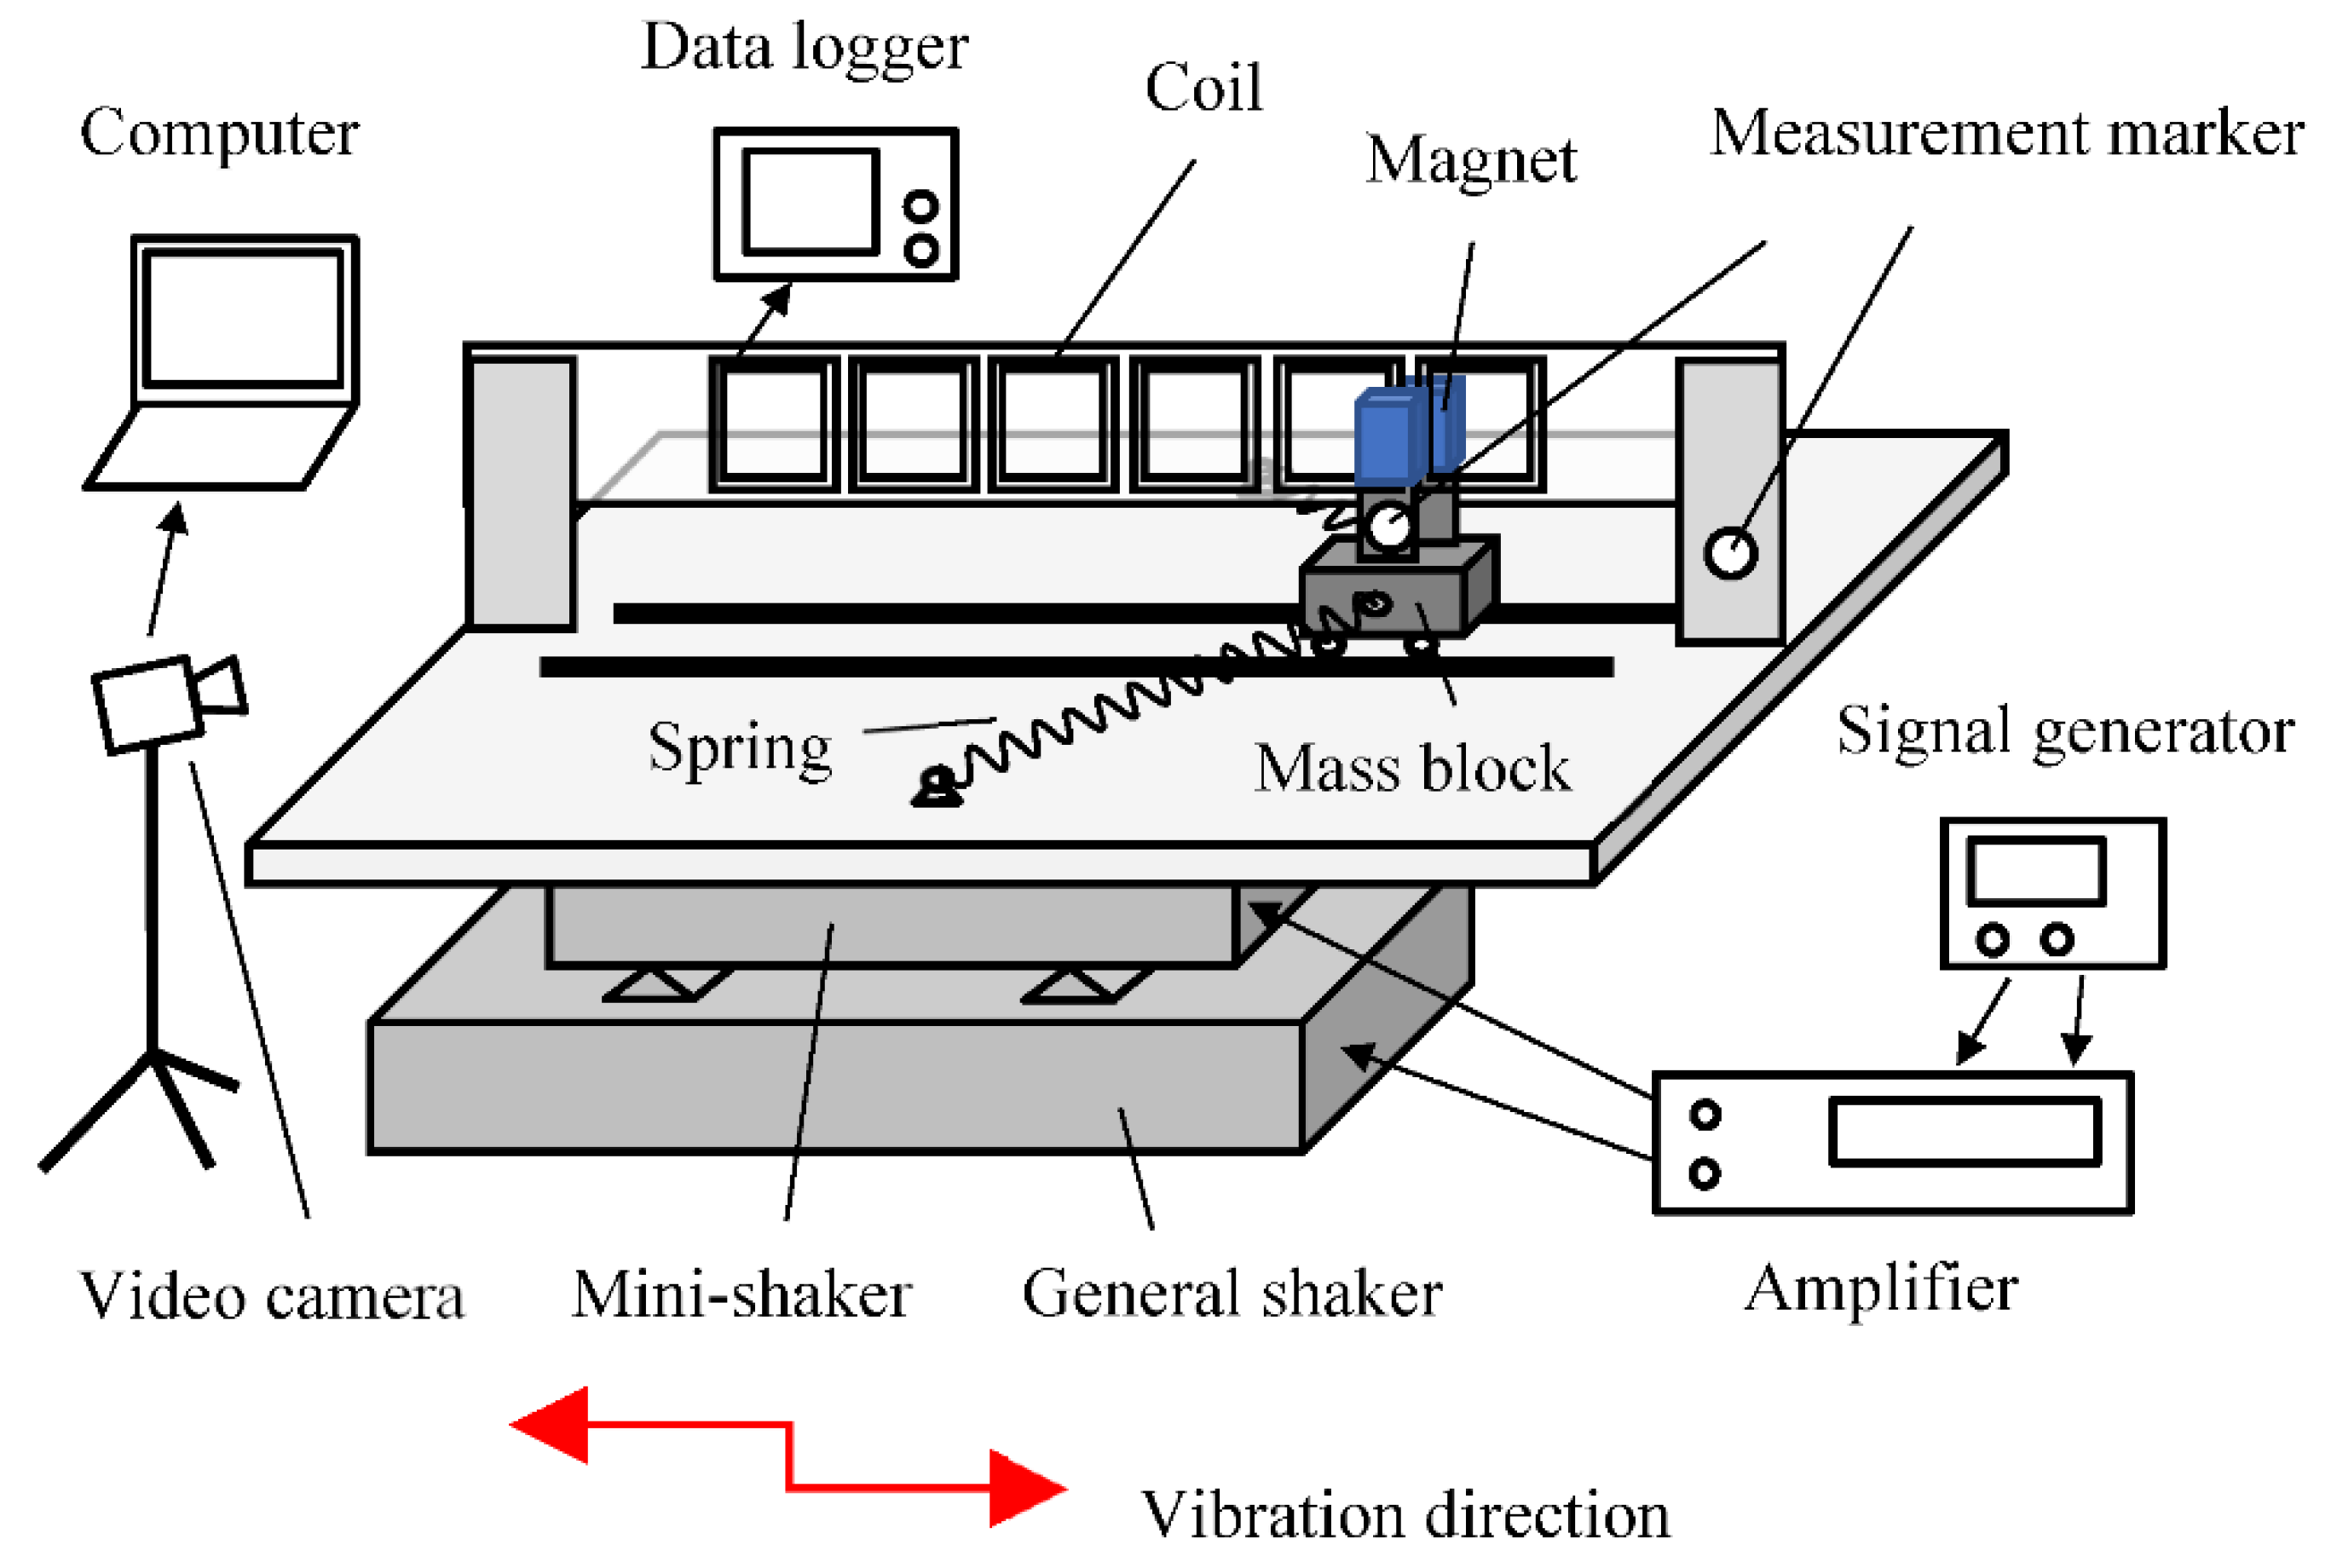
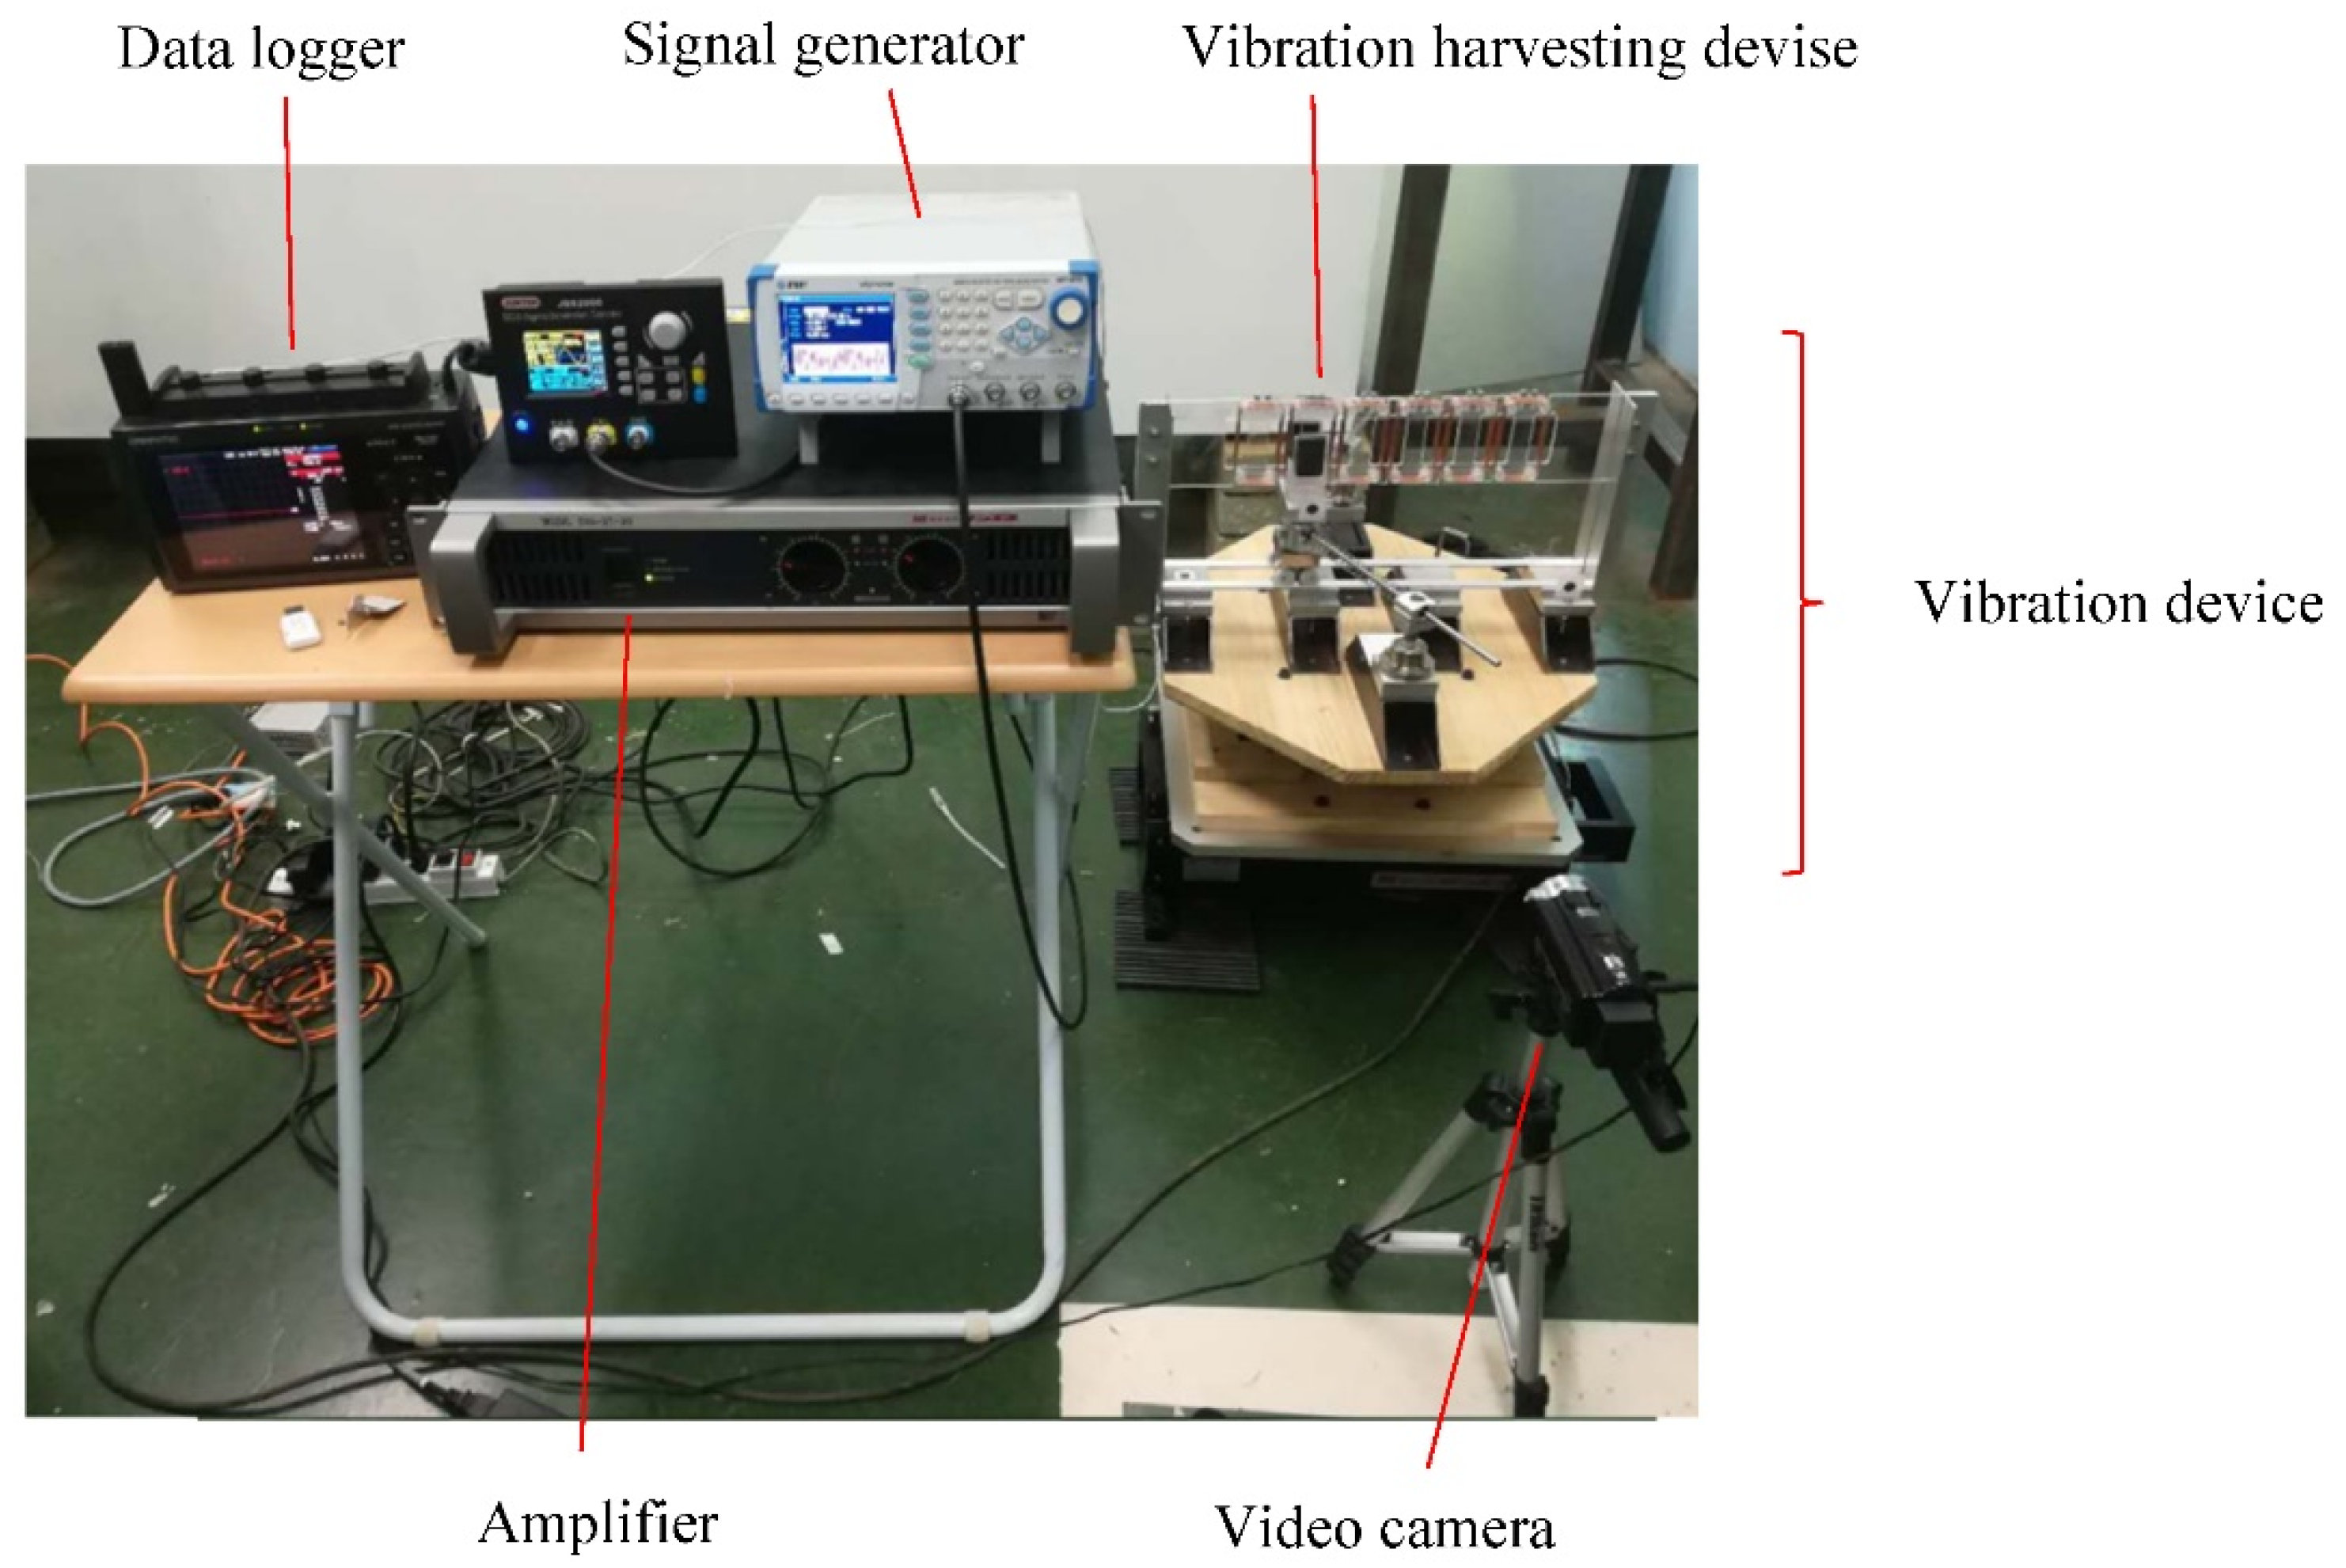
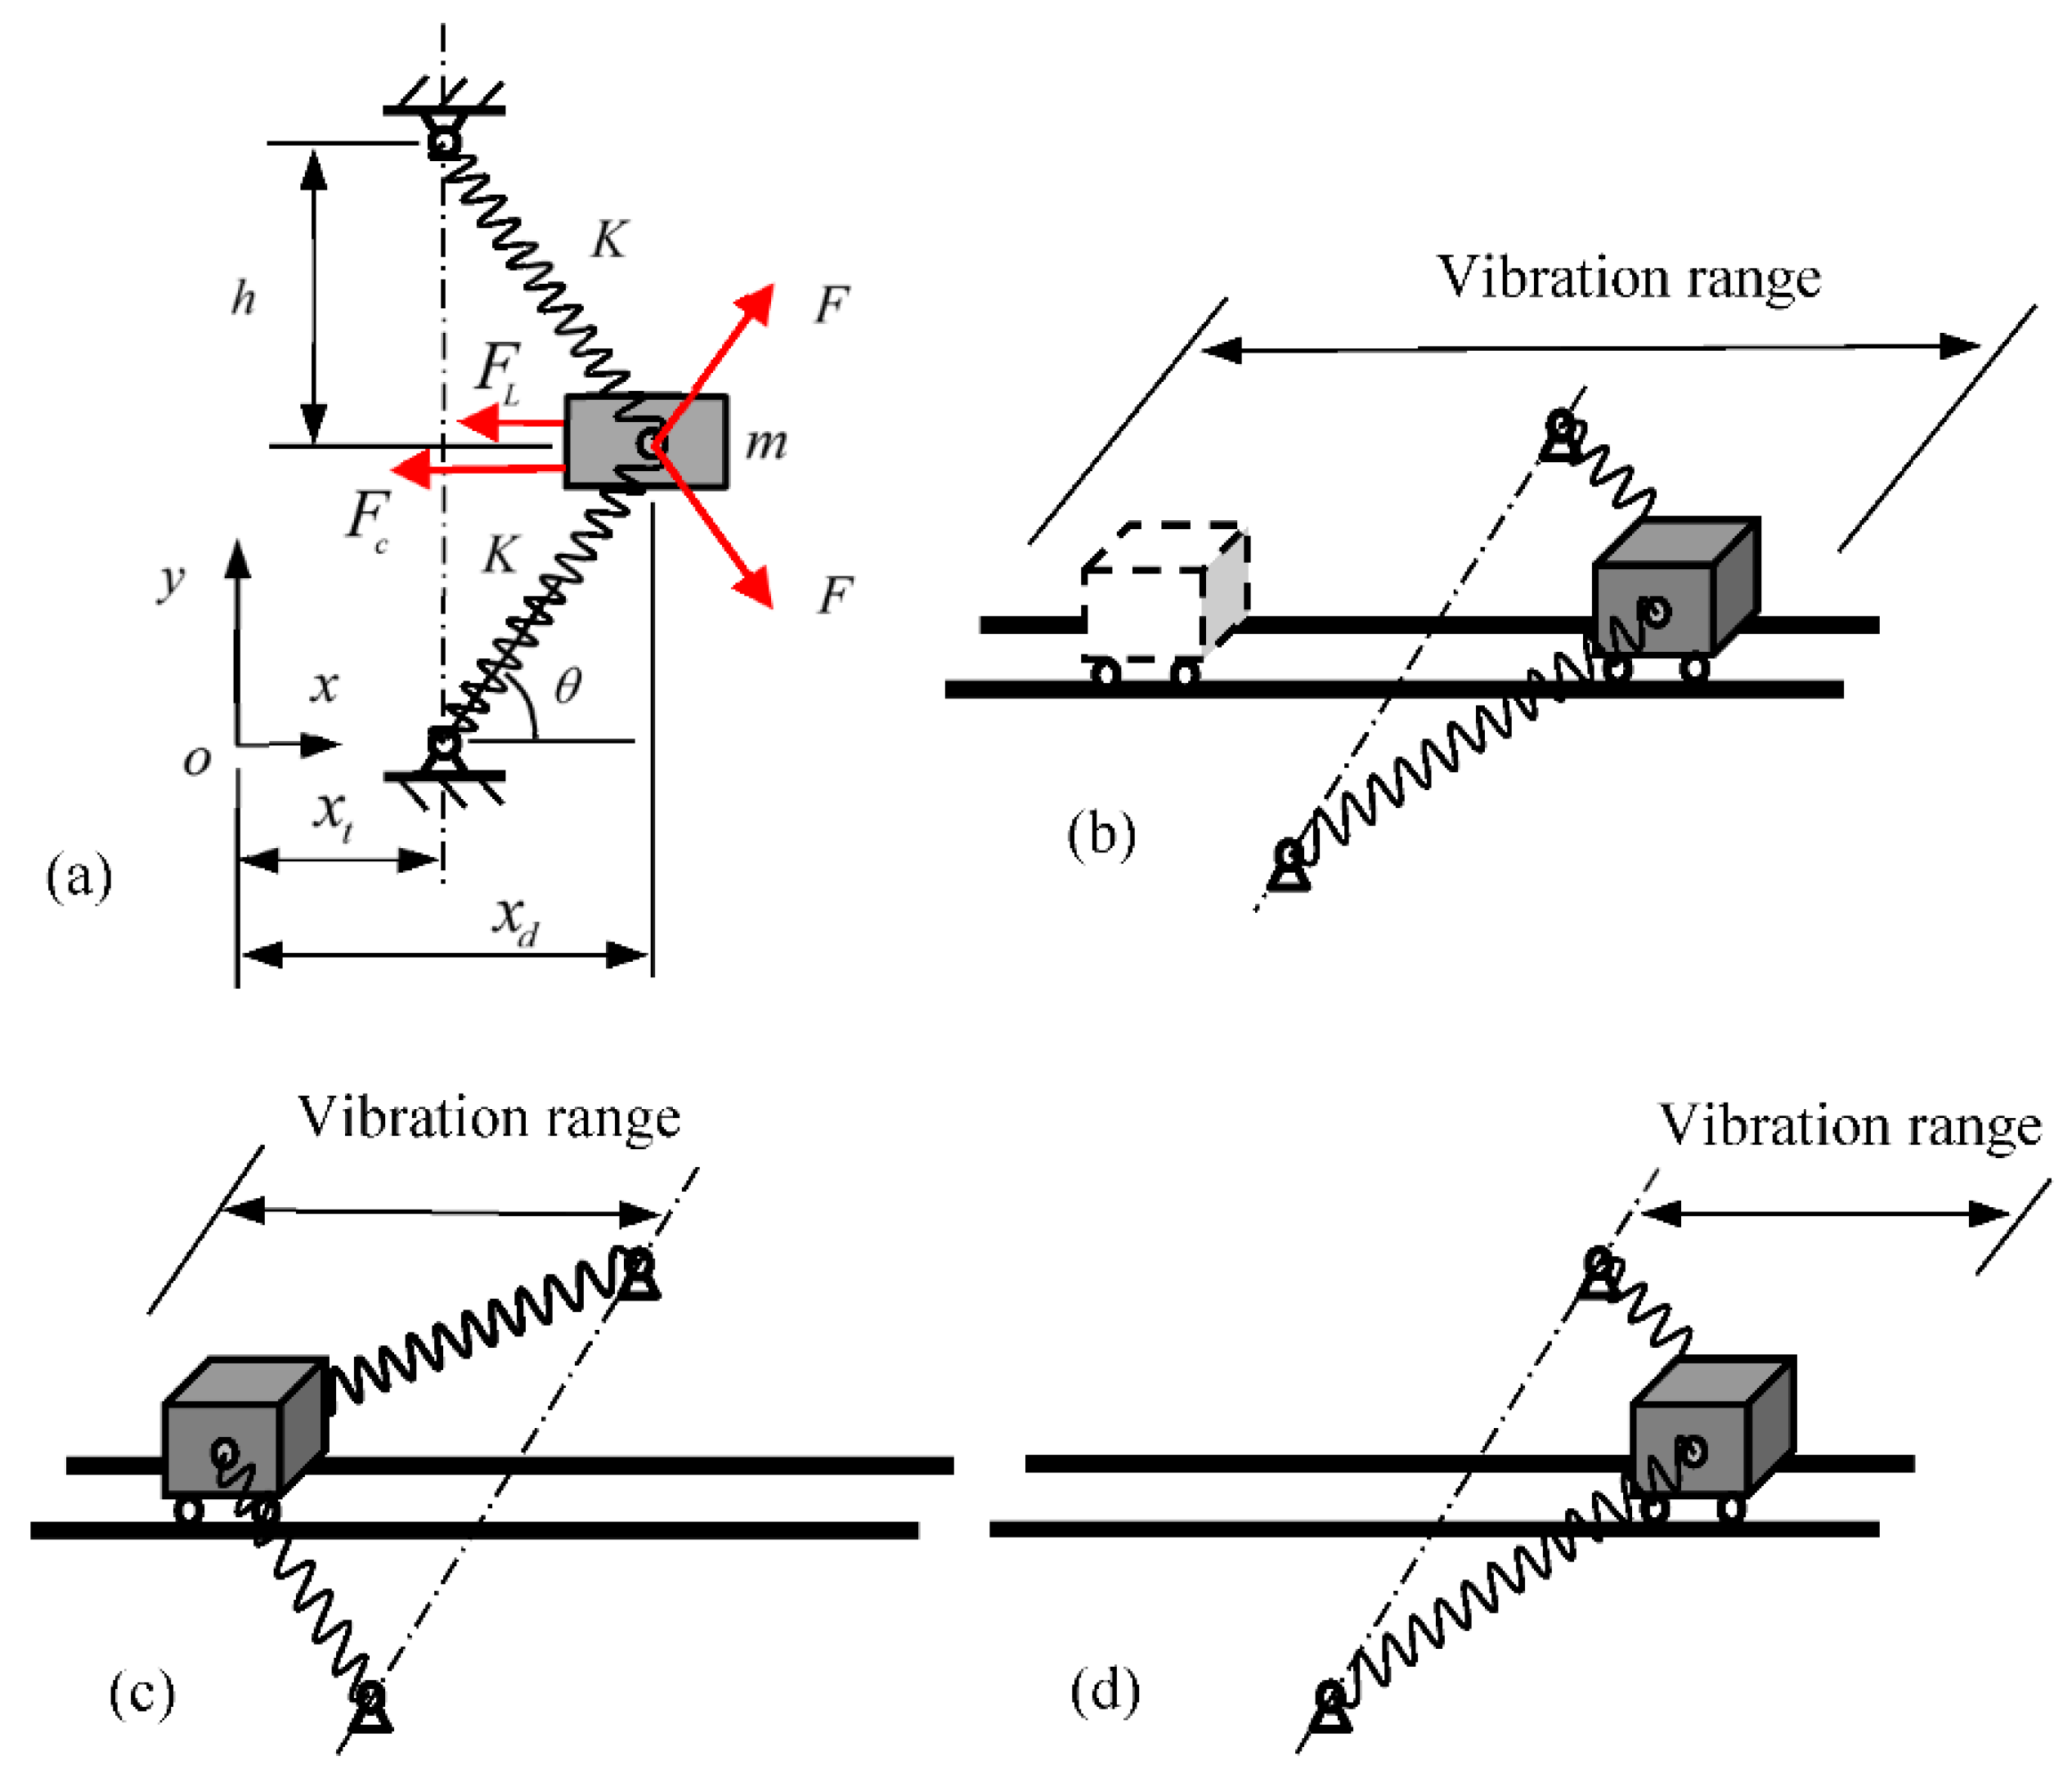
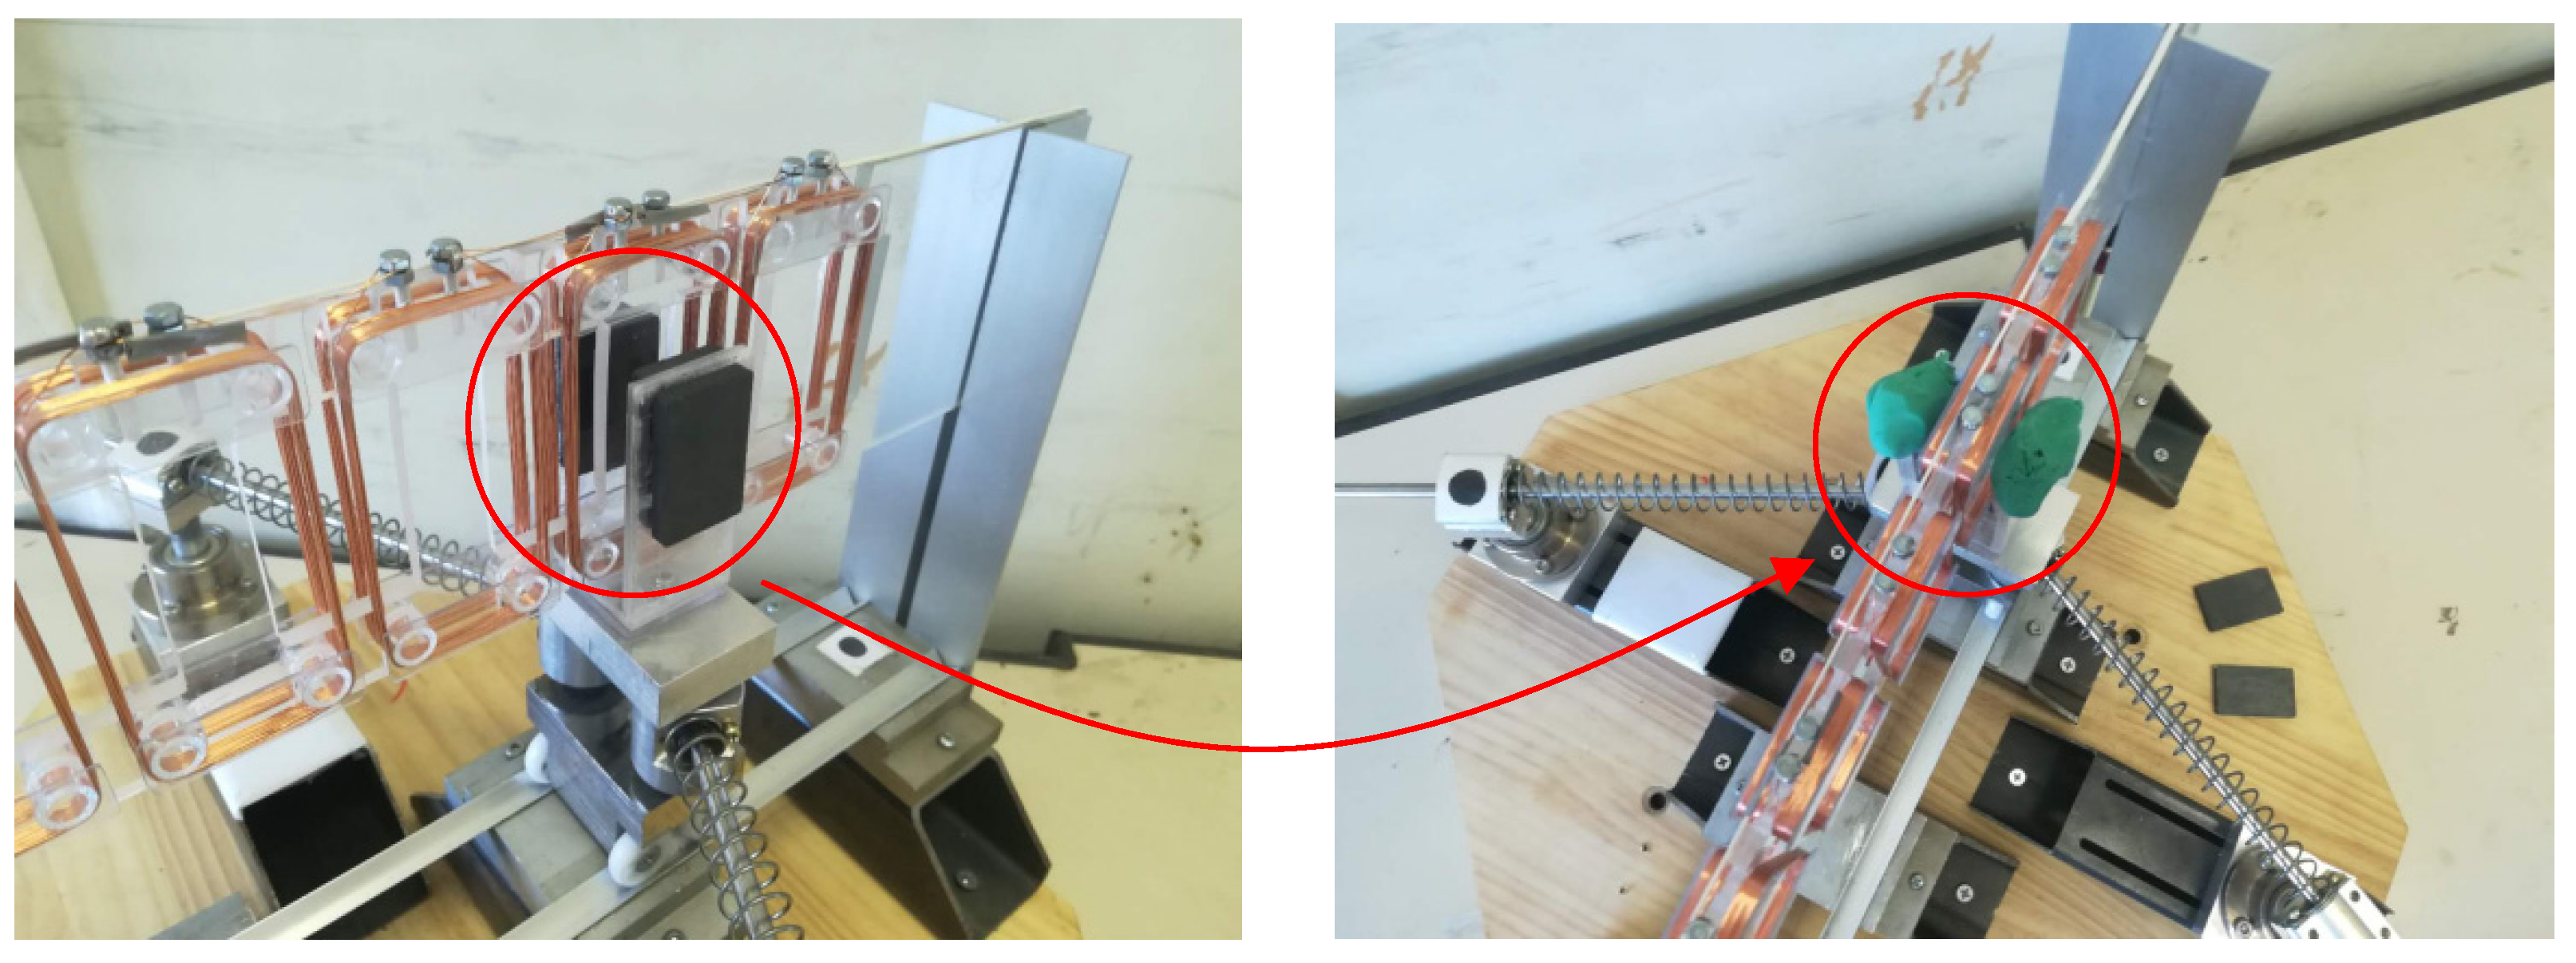
2.1. Horizontal Bi-Stable Vibration Harvesting System

A horizontal bi-stable vibration energy-harvesting model, as illustrated in Figure 1, is proposed herein. The mass block with rotating rolls on the horizontal rail is allowed to propagate in the left and right directions. Similar elastic springs are joined to each side of the mass block by a rotating pin, and a guide rink is attached to the center of the elastic spring. Two permanent magnets are placed parallel to each other in the mass block, and several conductive coils are arranged in the central space between the two permanent magnets. An induced voltage can be generated across the coils when a relative motion exists between the magnets and coils. The experimental apparatus is placed in a mini-shaker, which is then placed in a general shaker. Therefore, the mini- and general shakers can be vibrated simultaneously.
The results of the experimental results are measured using a high-speed camera to capture images of the mass block and the measurement markers affixed to the support stand (see Figure 2). Subsequently, the resulting video data are loaded into the computer, and tracking software is used to create a time series of the vibration displacement data. A data logger is used to record the vibration-generated voltage in the coil. A photograph of the experimental apparatus is shown in Figure 3, and the specifications of its components are listed in Table 1.
The main vibration unit of the motion model is simplified, as depicted in Figure 4a, where m represents the mass of the mass block, xd the displacement of the mass block from the axis of symmetry, xt the displacement of the support point from the axis of symmetry, K the spring coefficient, F the elastic force of the spring, Fc the damping force resulting from the motion friction, FL the Lorentz force yielded by the coil current in the magnetic field, and h the vertical distance from the support point to the center point of the mass block, θ the angle between the axis of the spring and the horizontal direction. However, because the initial length l0 of the elastic spring is larger than the distance h, two static equilibrium positions exist on the mass block, i.e., one on each side of the axis of symmetry, thus yielding three states of vibration, as indicated in Figure 4b–d. Figure 4c,d show monostable vibrations, whereas Figure 4b show as bi-stable vibration.
Based on a bi-stable vibration system that vibrates monostatically within practical random vibration environments, the key point of this study is to exploit the characteristics of the large amplification effect yielded the moment when the mass block is subjected to periodic excitations and transcends the potential energy peak in the center of the system.
Based on Figure 4a, the equation of motion of the mass block along the x -direction is formulated as follows:
m x ¨ d + c ( x ˙ d x ˙ t ) + F L + 2 F cos θ = 0
where c is the damping coefficient. Therefore, the elastic force F and angle θ can be estimated as follows:
F = K ( ( x d x t ) 2 + h 2 l 0 )
cos θ = x d x t ( x d x t ) 2 + h 2
Here, K is the spring constant. The equation of vibration is obtained by substituting Equations (2) and (3) into Equation (1), and the resulting equation is as follows:
m x ¨ d + c ( x ˙ d x ˙ t ) + F L + 2 K ( 1 l 0 ( x d x t ) 2 + h 2 ) ( x d x t ) = 0
The relative displacement between the mass block and support point is expressed as follows:
x = x d x t
The equation of vibration for a relative displacement x is expressed as follows after substituting Equation (5) into Equation (4).
m x ¨ + c x ˙ + F L + 2 K ( 1 l 0 x 2 + h 2 ) x = m x ¨ t
The magnet and coil sections are illustrated in a simplified form in Figure 5, where a and b are the width and height of the magnets, respectively. Six sets of coils are mounted in a row with the same spacing between the magnets, and the terminals between the coils are joined, as illustrated in Figure 5. The width Lc of the coils is wider than the width a of the magnets. If the magnets are considered in vibration, as depicted by the blue arrows, then a current I is yielded in the direction of the red arrow as the magnets transit the front of the coils, and the voltage magnitude thereof can be estimated as follows:
V max = B n b x ˙
Here, n represents the number of coils turns, and x ˙ the velocity of the magnet vibration. Because the voltage decreases to zero when the magnet transits the center of the coil, the placement weight function W(x) illustrated in Figure 5 is expressed as follows:
W ( x ) = { sin π L c x 2 L c x 2 L c 1 2 sin π L c x o t h e r
Substituting the placement weight function W(x) in Equation (8), the electromagnetic induction voltage V yielded in the coil is expressed as follows:
V = B n b W ( x ) x ˙
The Lorentz force FL generated against the mass block by the current in a coil in the magnetic field is expressed as follows:
F L = V R B n b
where R represents the electrical resistance of the coil. Subsequently, substituting Equation (9) into Equation (10) yields:
F L = B 2 n 2 b 2 R W ( x ) x ˙
Next, substituting Equation (11) into Equation (6) yields the following equation of motion:
m x ¨ + [ c + B 2 n 2 b 2 R W ( x ) ] x ˙ + 2 K ( 1 l 0 x 2 + h 2 ) x = m x ¨ t
Equation (12) indicates that a damping force due to electromagnetic induction occurs in addition to one due to kinetic friction.
To examine the static potential energy characteristics of the vibration model, x ¨ = 0 and x ˙ = 0 are substituted into Equation (12), which results in the following equation expressing the potential energy:
U = K x 2 2 K l 0 x 2 + h 2
Next, the distribution characteristics of the potential energy can be examined by differentiating it from Equation (13) to obtain the roots of equation.
K ( 1 l 0 x 2 + h 2 ) x = 0
For the extremes of the derived potential energy, which yields the following results:
x 1 = l 0 2 h 2 x 2 = 0 x 3 = l 0 2 h 2
Here, x1, x2, and x3 in Equation (15) are the extreme values of the potential energy and correspond to the static equilibrium positions of the mass block. A graphical representation of the potential energy expressed in Equation (13) is presented in Figure 6, where x1, x2, and x3 correspond to the extreme values of the potential energy in Equation (15). x1, and x3 in the valley correspond to the centers of two monostable vibrations on the left and right, respectively, whereas x2 in the peak corresponds to the center of the bi-stable vibrations on the central axis of symmetry. Δ U represents the barrier value of the bi-stable vibration to the left and right.
Typically, bi-stable motion models that are placed in a random vibration environment exhibit monostable motion, whereas when they are vibrating simultaneously with random and periodic signals, a large amount of bi-stable vibration occurs, and resonance may be realized, where the vibration displacement is amplified significantly. However, in terms of the uncertain factors that arise in a random excitation environment, this type of resonance phenomenon is referred to as stochastic resonance.

2.2. Numerical Analysis

In the equation of vibration for the mass block, i.e., Equation (12), the following symbols are adopted:
ξ = c 2 m k
β = B 2 n 2 b 2 m R
ω n = K m
Here, ξ represents the damping ratio, β the extent of the damping effect caused by electromagnetic induction, and ω n the natural angular frequency of the spring-mass model. The relative expansion/contraction ratio of the spring is expressed as a function of L(x), which is expressed as.
L ( x ) = l 0 x 2 + h 2 1
The equation of vibration for the mass block is.
x ¨ + [ 2 ξ ω n + β W ( x ) ] x ˙ ω n 2 L ( x ) x = x ¨ t
Subsequently, the equation of vibration above can be rewritten in the form of simultaneous equations, as follows:
d x ˙ d t = [ 2 ξ ω n + β W ( x ) ] x ˙ + ω n 2 L ( x ) x x ¨ t
d x d t = x ˙
Because the relative displacement x i and relative velocity x ˙ i of the mass block are derived at each time step using the Runge–Kutta method for Equations (21) and (22), the relative displacement equation, i.e., Equation (9), and the electromagnetic induction equation, i.e., Equation (5) can be employed to obtain the following numerical solution for the vibrational displacement and voltage at each time step.
x d i + 1 = x i + 1 + x t i
V i + 1 = B n b W ( x i + 1 ) x ˙ i + 1

2.3. Magnetic Flux Density

Using the numerical analysis method described in the previous section, the magnetic flux density B of the magnetic field near the coil must be provided to analyze the vibrational displacement of the mass block and the voltage of the vibrational power generation. In this study, the magnetic flux density B near the coil was measured directly using a Tesla meter (model number WT10A), as illustrated in Figure 7. The B near the coil was measured thrice and averaged, which yielded a value of 70 mT.

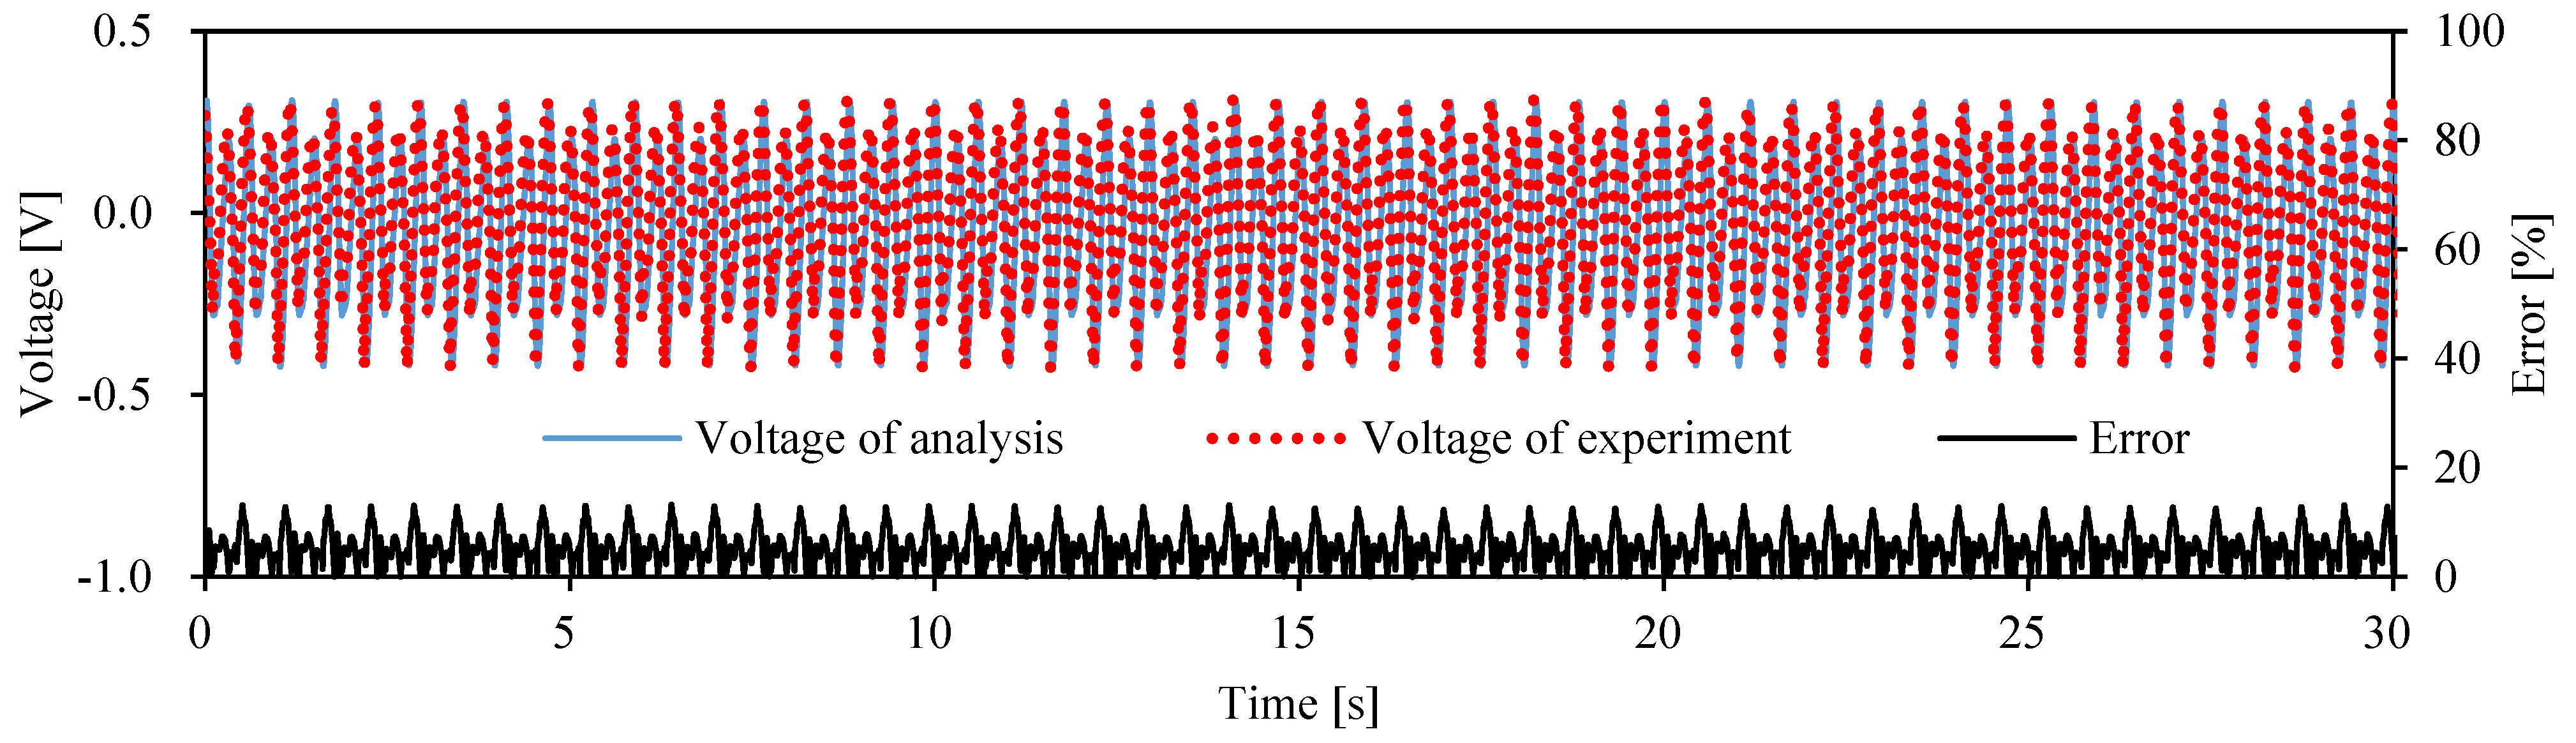
2.4. Identifying Damping Coefficients and Confirming Accuracy of Analysis

The damping effect occurring in a vibrating mass block includes the damping force Fc caused by kinetic friction and the Lorentz force FL yielded by the induced current flowing in the magnetic field. The Lorentz force FL can be estimated using Equation (11), whereas the damping force Fc is uncertain, and the damping coefficients must be identified in advance. In this study, the damping coefficients were identified by performing the following steps:
(1)
The general shaker maintained stationary and measured using only the mini-shaker as the excitation source.
(2)
The bi-stable vibration model was vibrated with a sinusoidal wave of frequency 1.5 Hz. Subsequently, the vibration displacement x exp e r and induced voltage V exp e r were measured and recorded under conditions of electromagnetic inductive damping.
(3)
A damping coefficient c was assigned as a tentative value.
(4)
The vibration displacement xi and voltage Vi were estimated based on a numerical analysis method derived using the Runge–Kutta method.
(5)
The values of xi and Vi obtained numerically were compared with the values of x exp e r and V exp e r measured experimentally. If the errors are significant, then the damping factor c is adjusted, and the analysis is continued by re-performing step (4) until both errors become adequately small. Finally, a damping coefficient c is obtained.
Here, when adjusting the damping coefficient, there is only one adjustment parameter, and the numerical analysis is a simple calculation performed in Excel. The area where the attenuation coefficient exists is equally divided, and the results of each analysis are compared with the experimental values. The damping coefficient of the case with the smallest error was taken as the identified value.
Using the structural parameters of the experimental model, an identification process was performed for damping coefficient A, which resulted in damping coefficient c = 2.31 Ns/m. The corresponding vibration displacements and voltages are shown in Figure 8 and Figure 9, respectively. The blue line shows the numerical values, the dotted red line shows the experimental measurements, and black line shows the error between experimental and analytical values; as shown, although there are some errors during the vibration process, the trends of the two results are well agree with each other. c = 2.31 Ns/m is intended to be used as all the damping coefficients of the bi-stable vibration model in this study. Results obtained using the proposed numerical analysis method and the configuration weight function in Equation (8) indicate that the analytical accuracy is adequate.

3. Results

To confirm the adequacy of the analytical accuracy, measurement experiments were performed for three experimental cases: (1) random signal excitation, (2) periodic signal excitation, and (3) simultaneous excitation of both excitation signals (i.e., random and periodic signals).
The natural frequencies f1 at the stable vibration points on both sides of the bi-stable vibration system and f2 at the central unstable vibration point are determined using Equations (25) and (26), respectively.
f 1 = 1 2 π | U ( l 0 2 h 2 ) | m = 1 2 π 2 K m ( 1 h 2 l 0 2 )
f 2 = 1 2 π | U ( 0 ) | m = 1 2 π 2 K m ( l 0 2 h 1 )
Substituting the structural parameters into Equations (25) and (26), the results show that the natural frequencies at the stable vibration points on both sides are f1 = 1.65 Hz, whereas those at the unstable vibration point in the center are f2 = 1.33 Hz. Furthermore, based on the results of preliminary experiments conducted in advance, the frequency of the periodic vibration signal was set from 1.0 to 2.2 Hz at intervals of 0.3 Hz, and the amplitude of the periodic vibration signal was set uniformly at 20 mm.
To quantitatively evaluate the effect of stochastic resonance amplification, the standard deviation S (in mm), which was calculated using the following formula, was applied as an index for evaluating the vibration displacement.
S = 1 N i = 1 N ( x i x ¯ ) 2
Here, xi is the measured value of the vibration displacement, x ¯ the average value of the vibration displacement, and N the number of discrete vibration displacement values in the time series.
The efficiency of the vibration power generation is estimated using the power quantity P (in mW), which is calculated as follows:
P = 1 T V 2 R d t = 1 T R i = 1 N V exp e r i 2 Δ Δ t
Here, R represents the electrical resistance, V exp e r i the measured voltage at each sampling measurement point in the vibration experiment, N the total number of steps in the total measurement time, Δ t the step time width, and T the total measurement time.

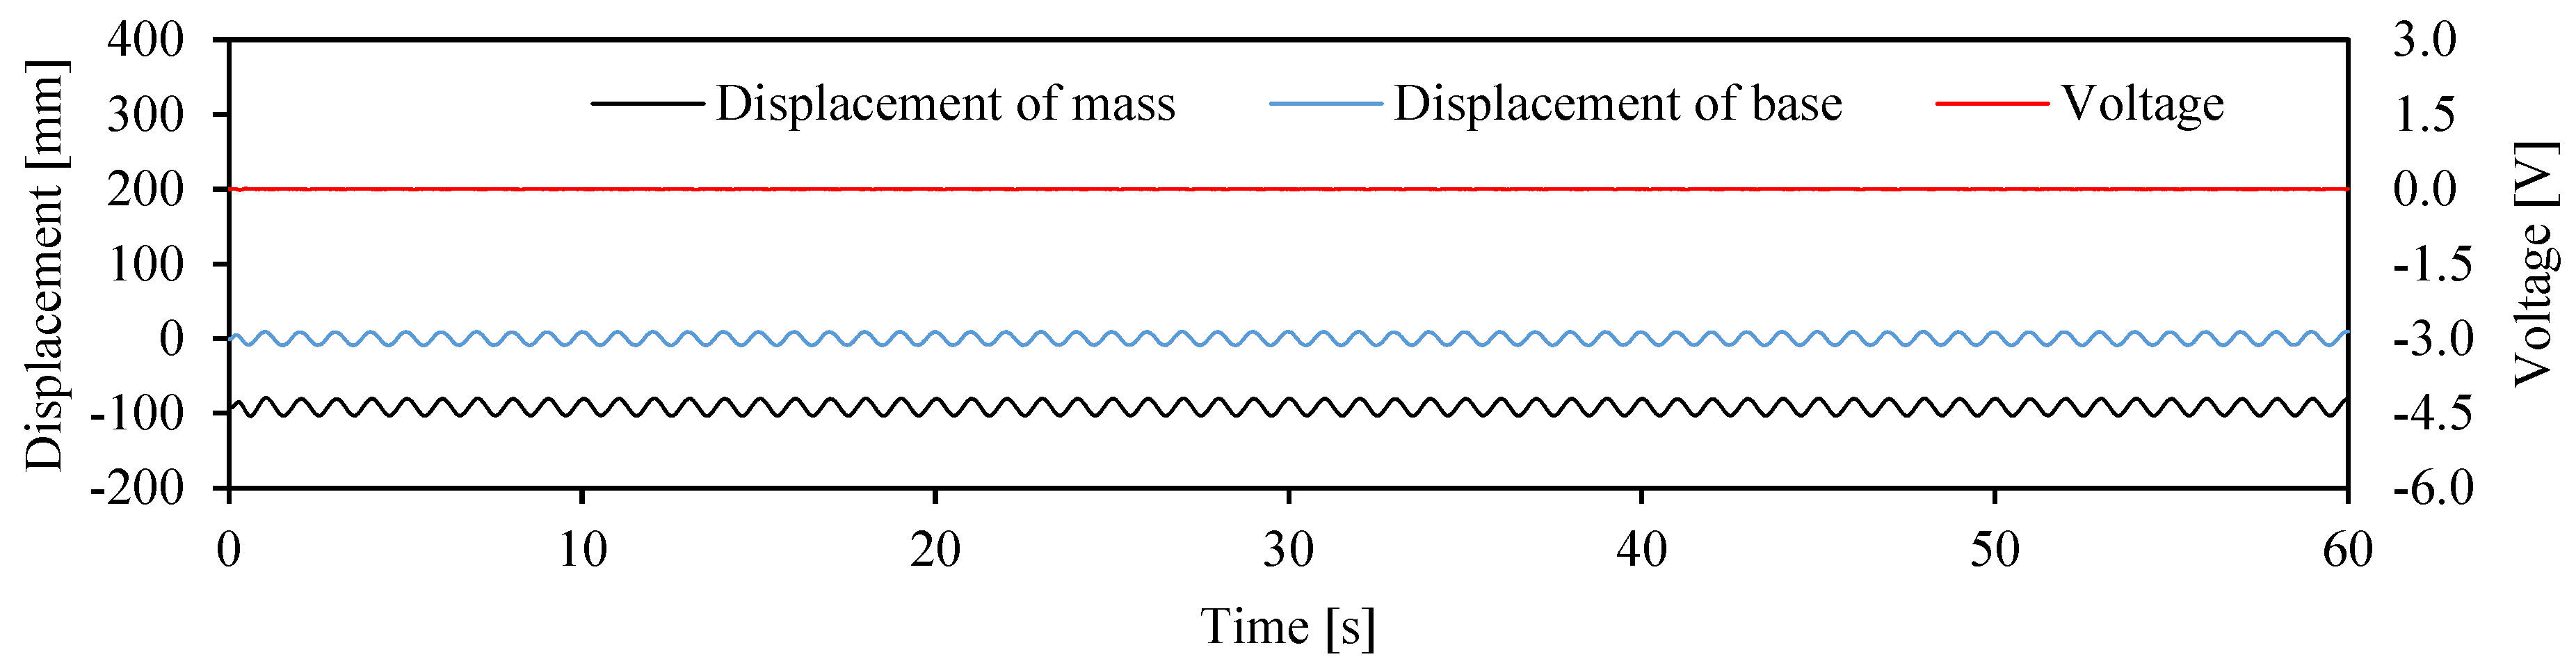
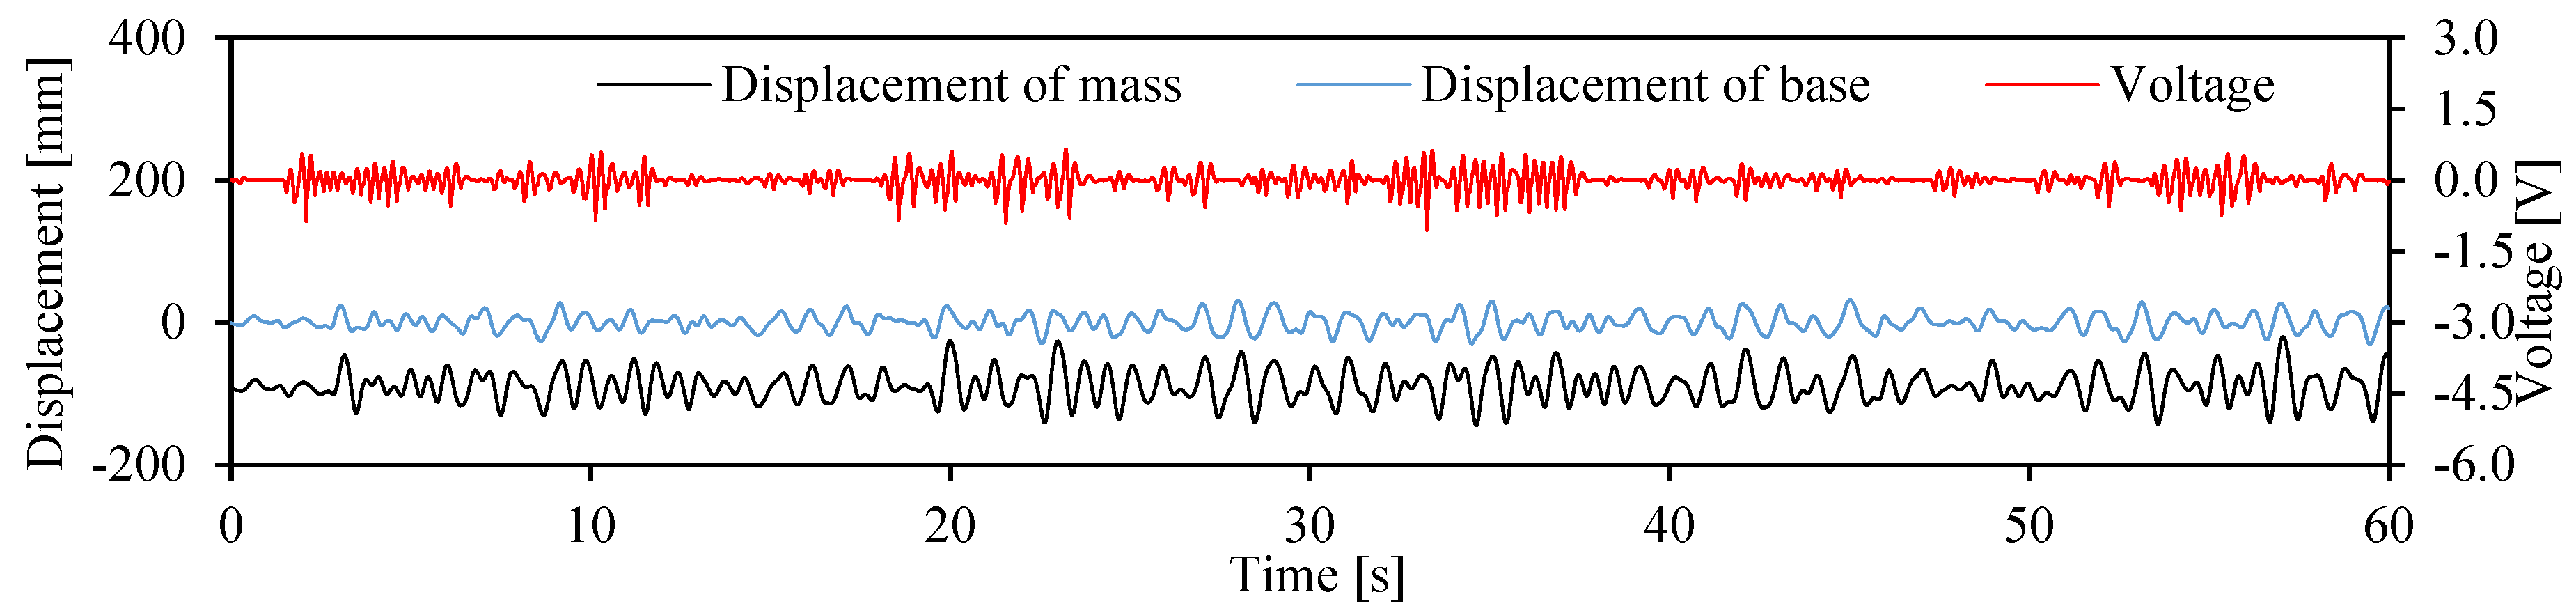
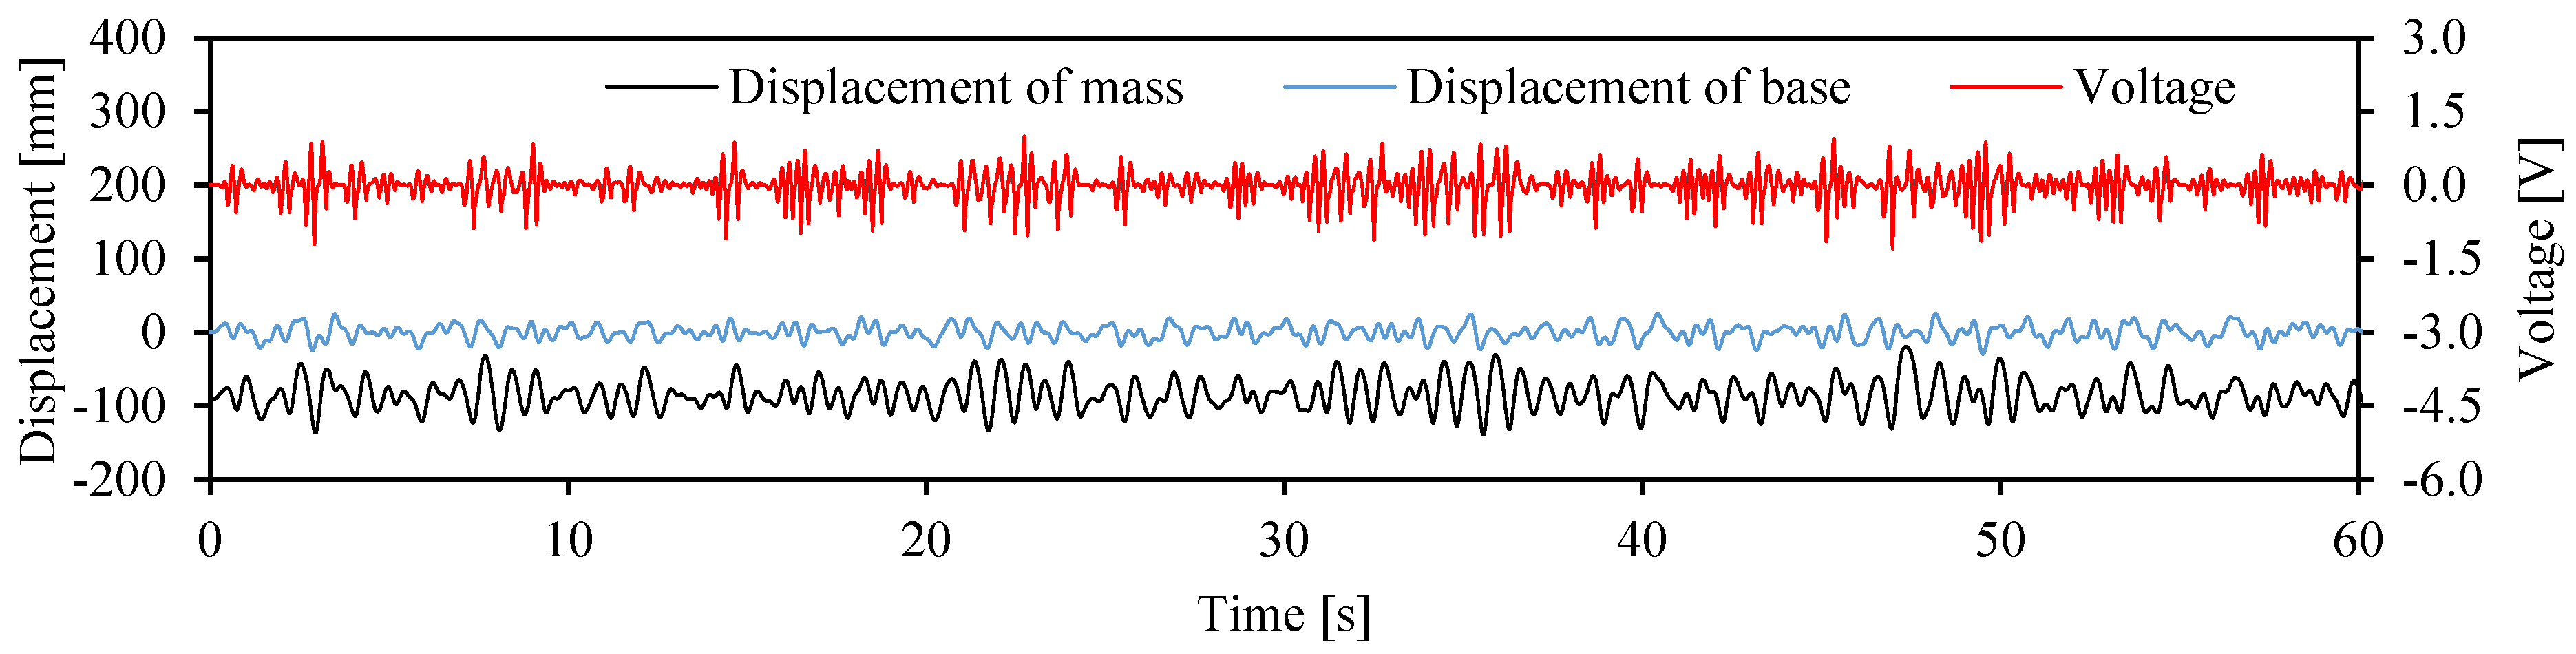
3.1. Measurement Results Yielded by Random Signal Excitation

The results yielded by the random signal excitation were measured and are shown in Figure 10. The black line represents the vibration displacement of the mass block, the blue line indicates the vibration displacement of the support point, and the red line indicates the voltage of the vibration power generation.
Based on Figure 10, the vibration displacement was relatively small when a random signal excitation was applied, and the mass block featured a single stable vibration on the right side of the central axis of symmetry because the vibration originated from the right side of the mass block. The standard deviation of the vibration displacement of the mass block was 17.22 mm, and that of the support point was 7.92 mm, thus resulting in a vibration power of 1.99 mW.

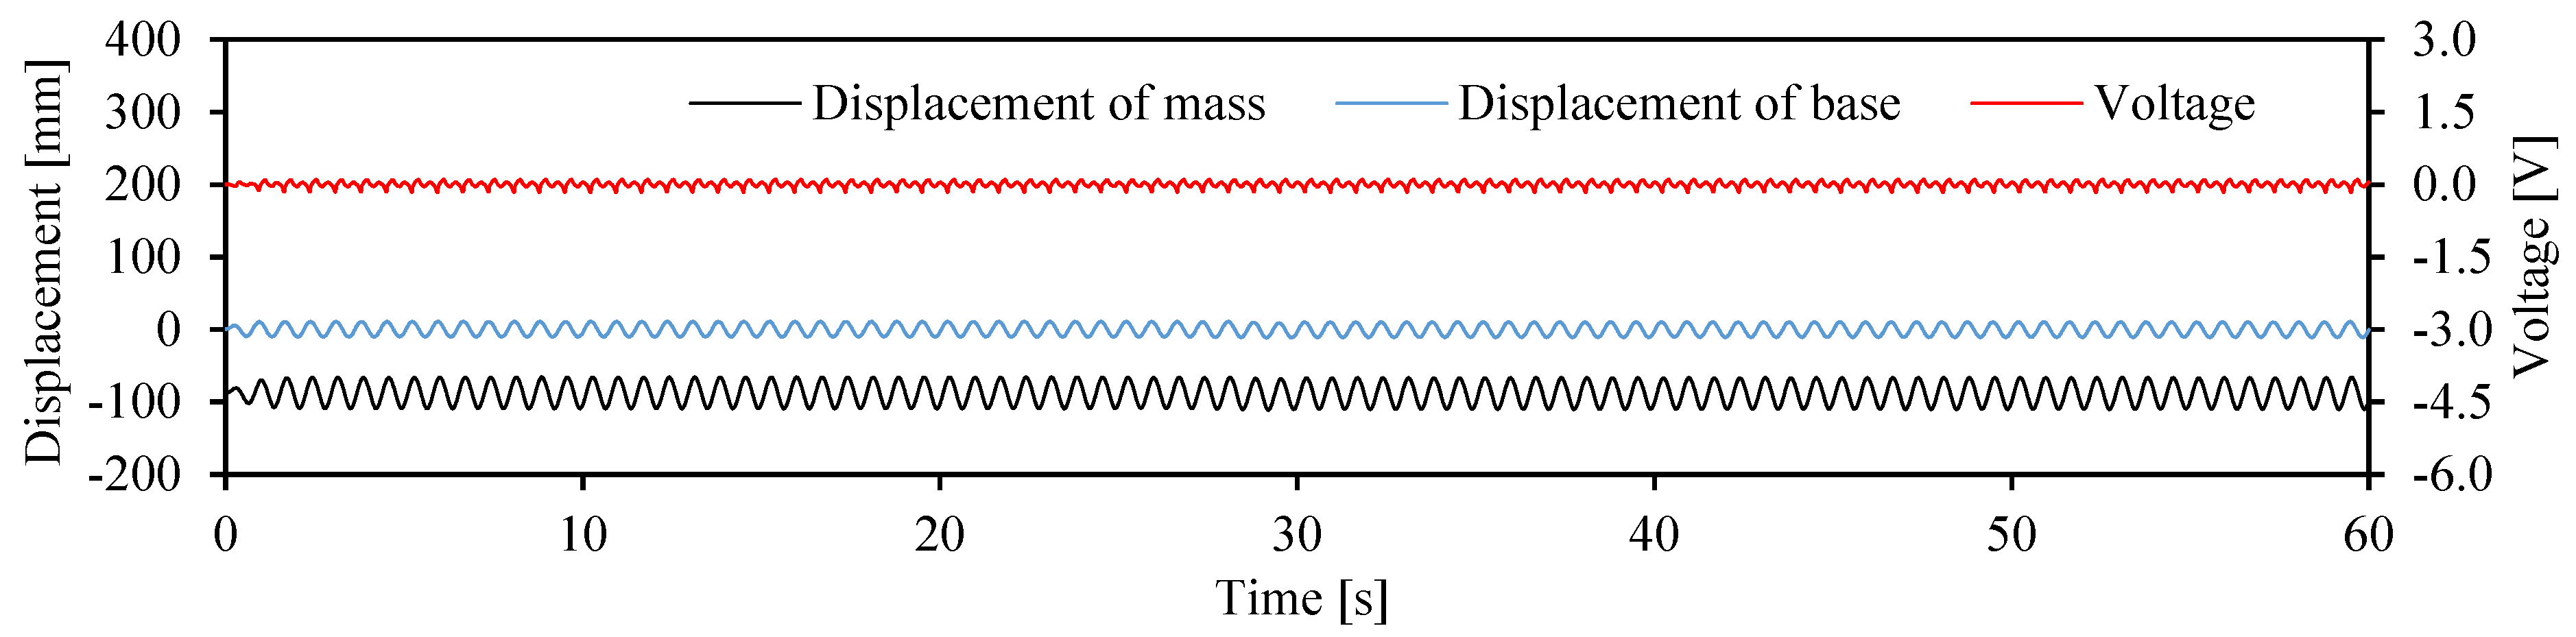
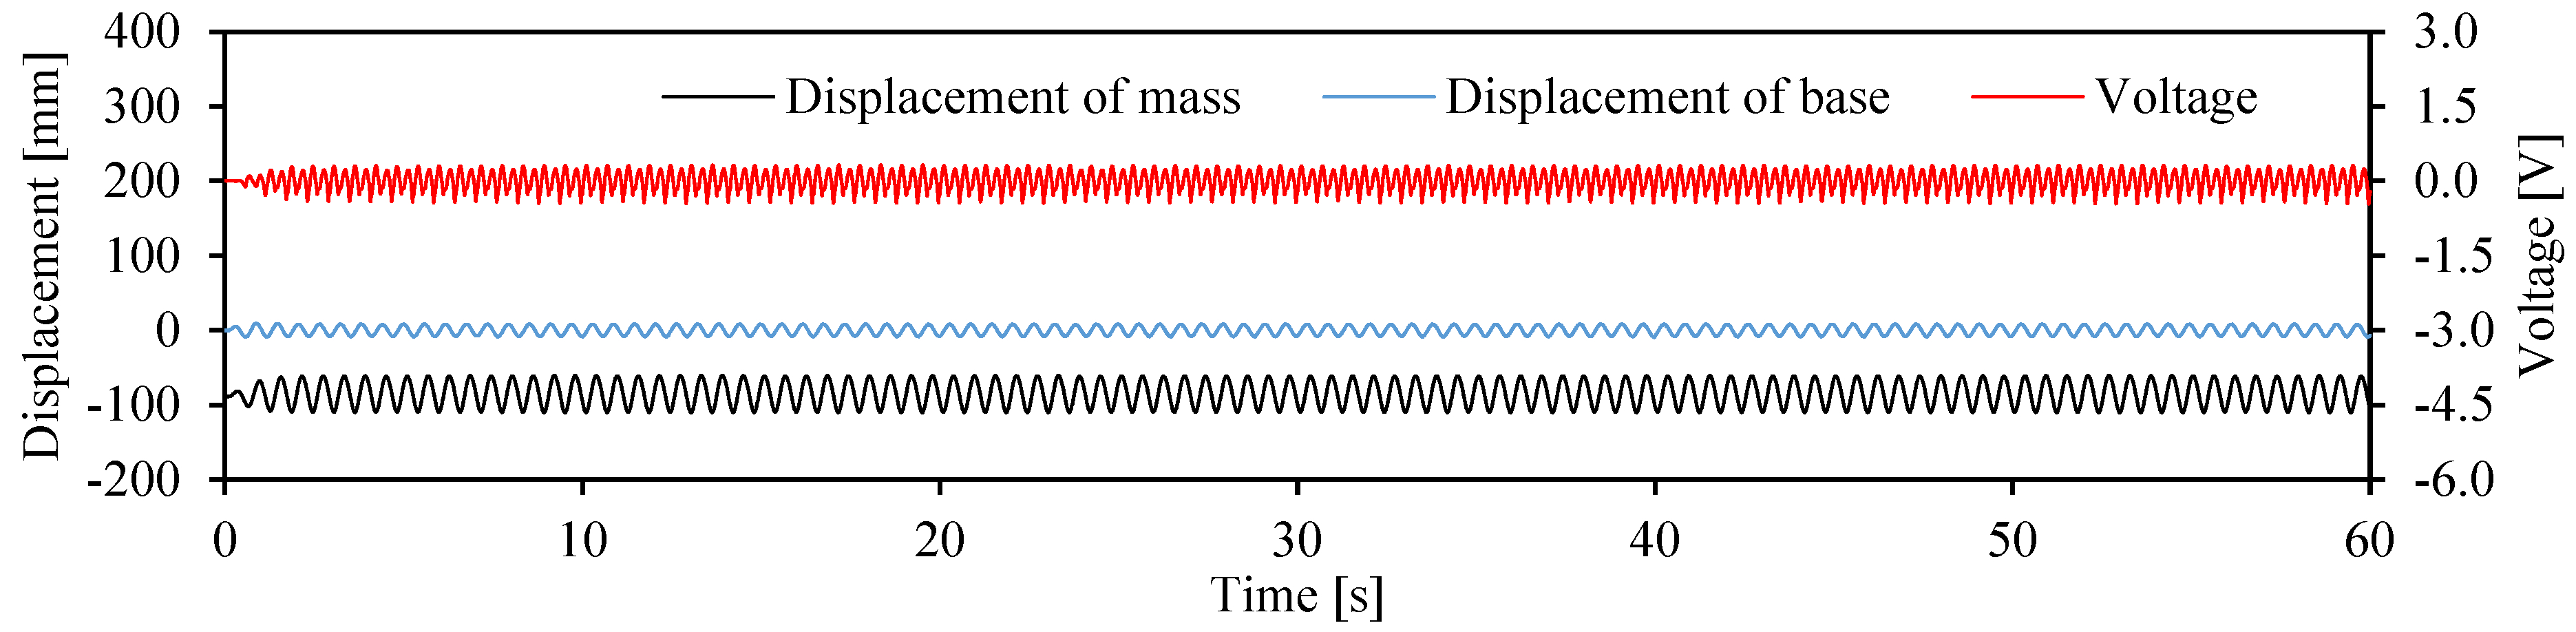
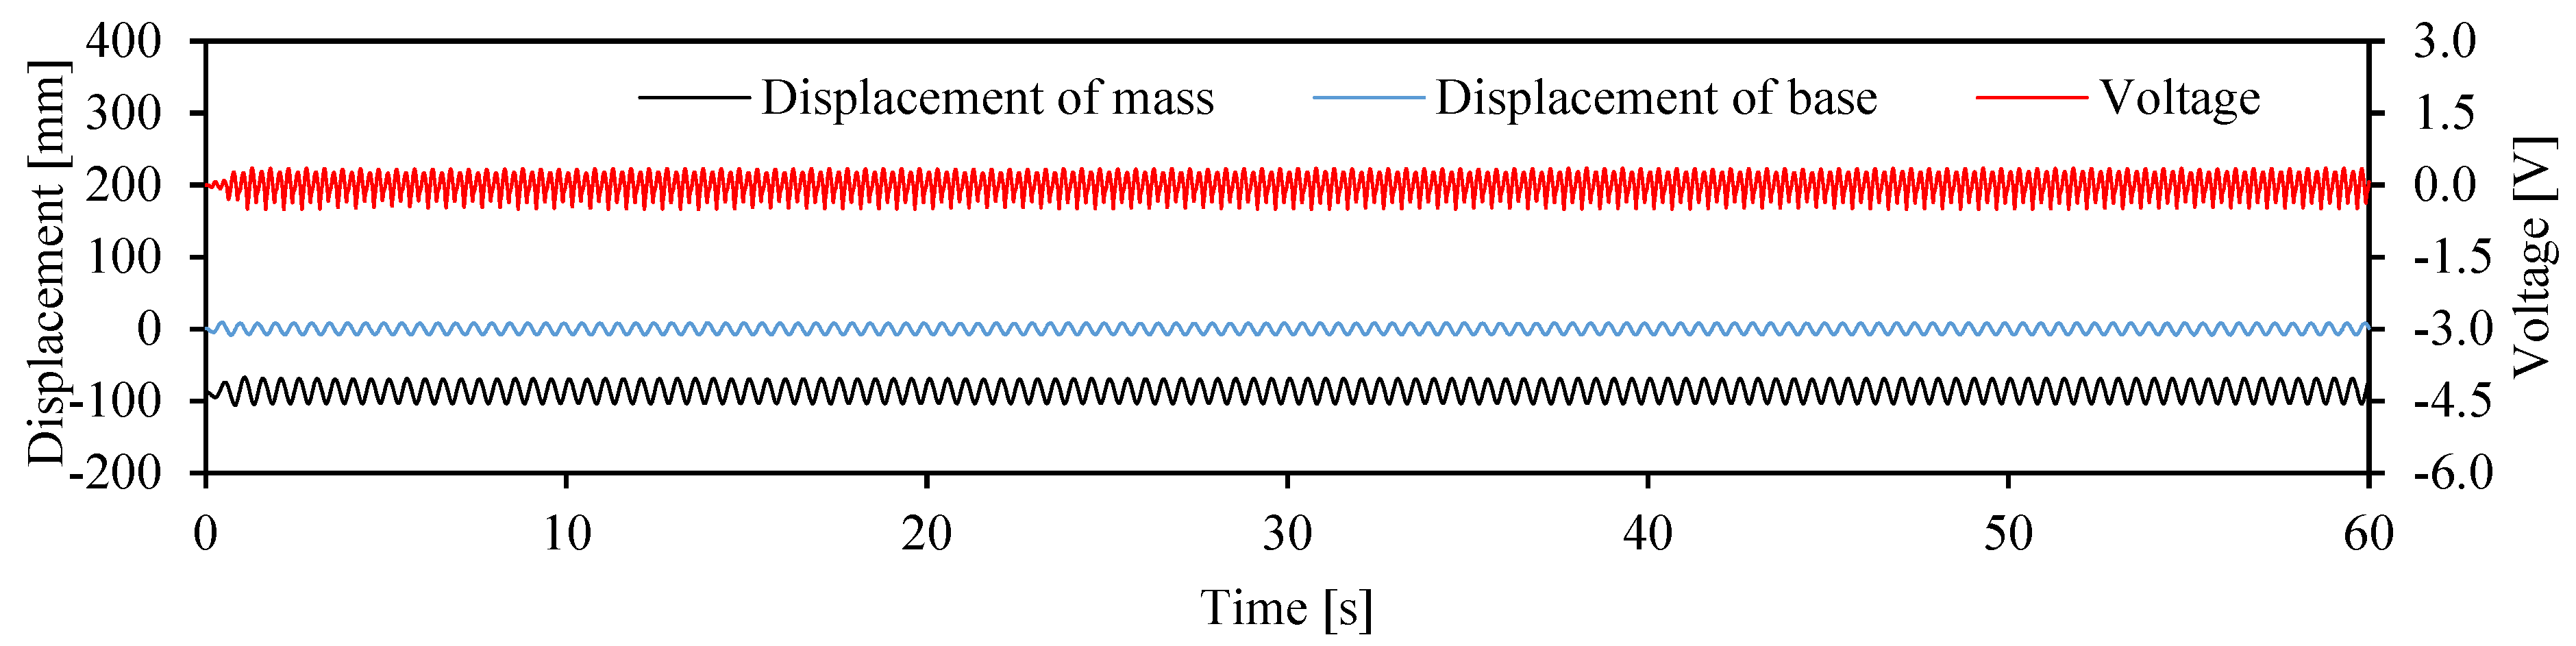
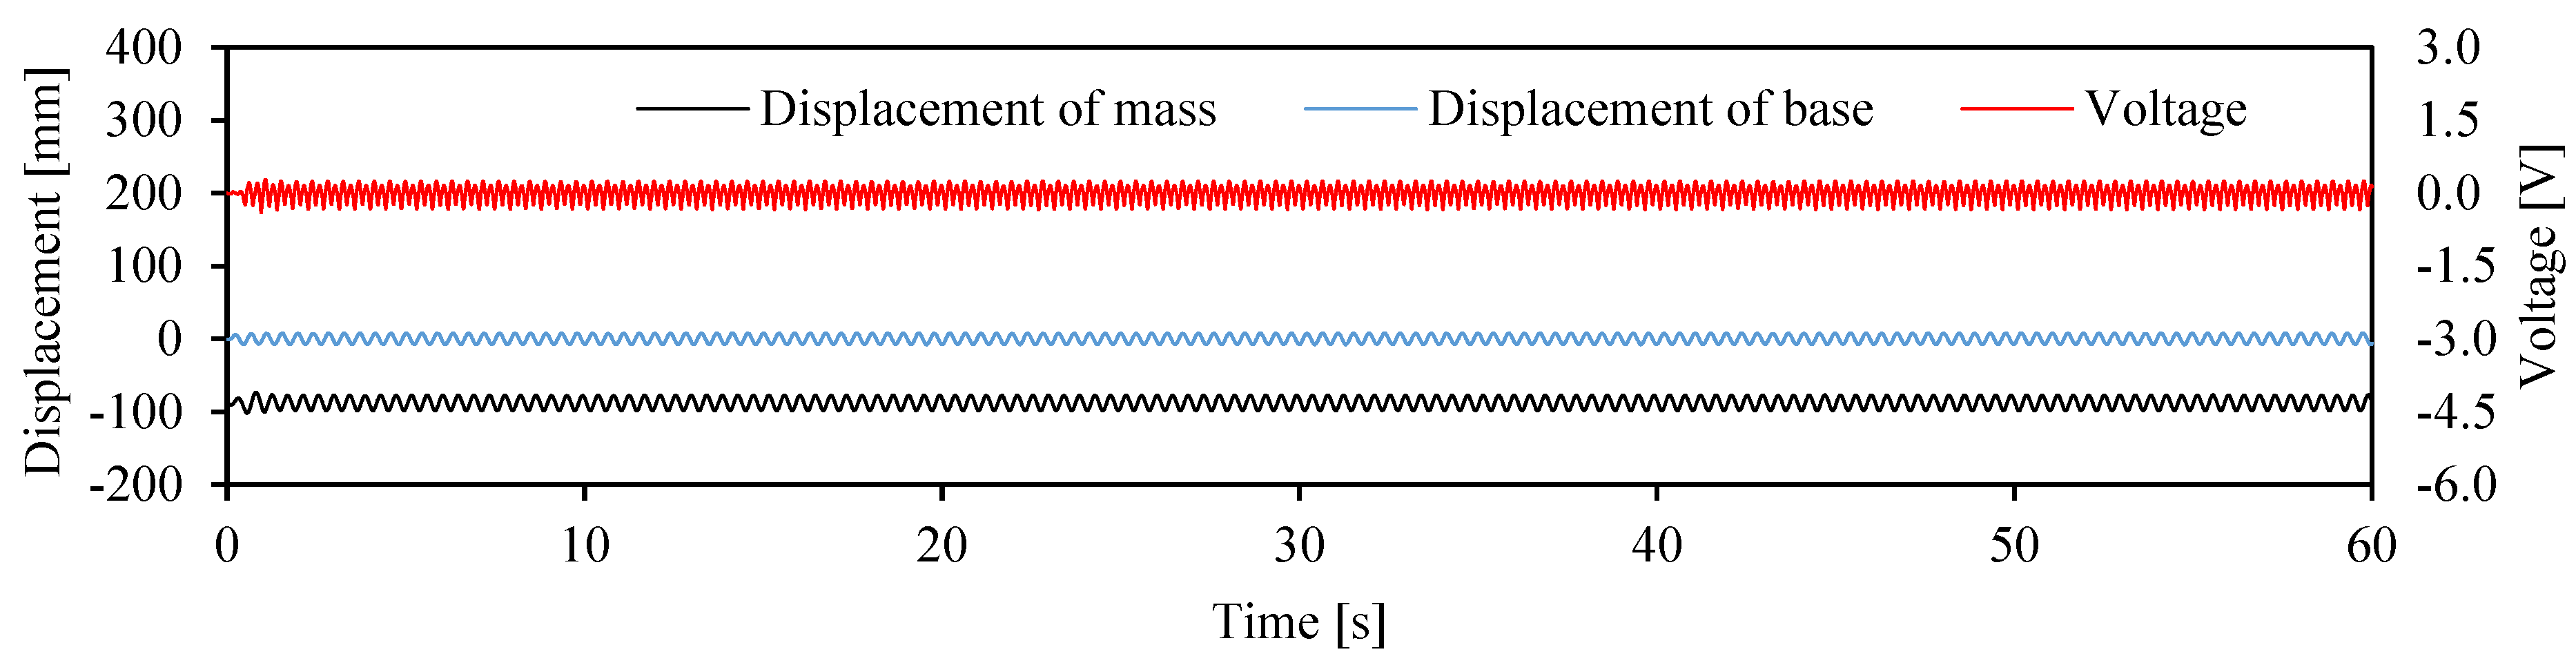
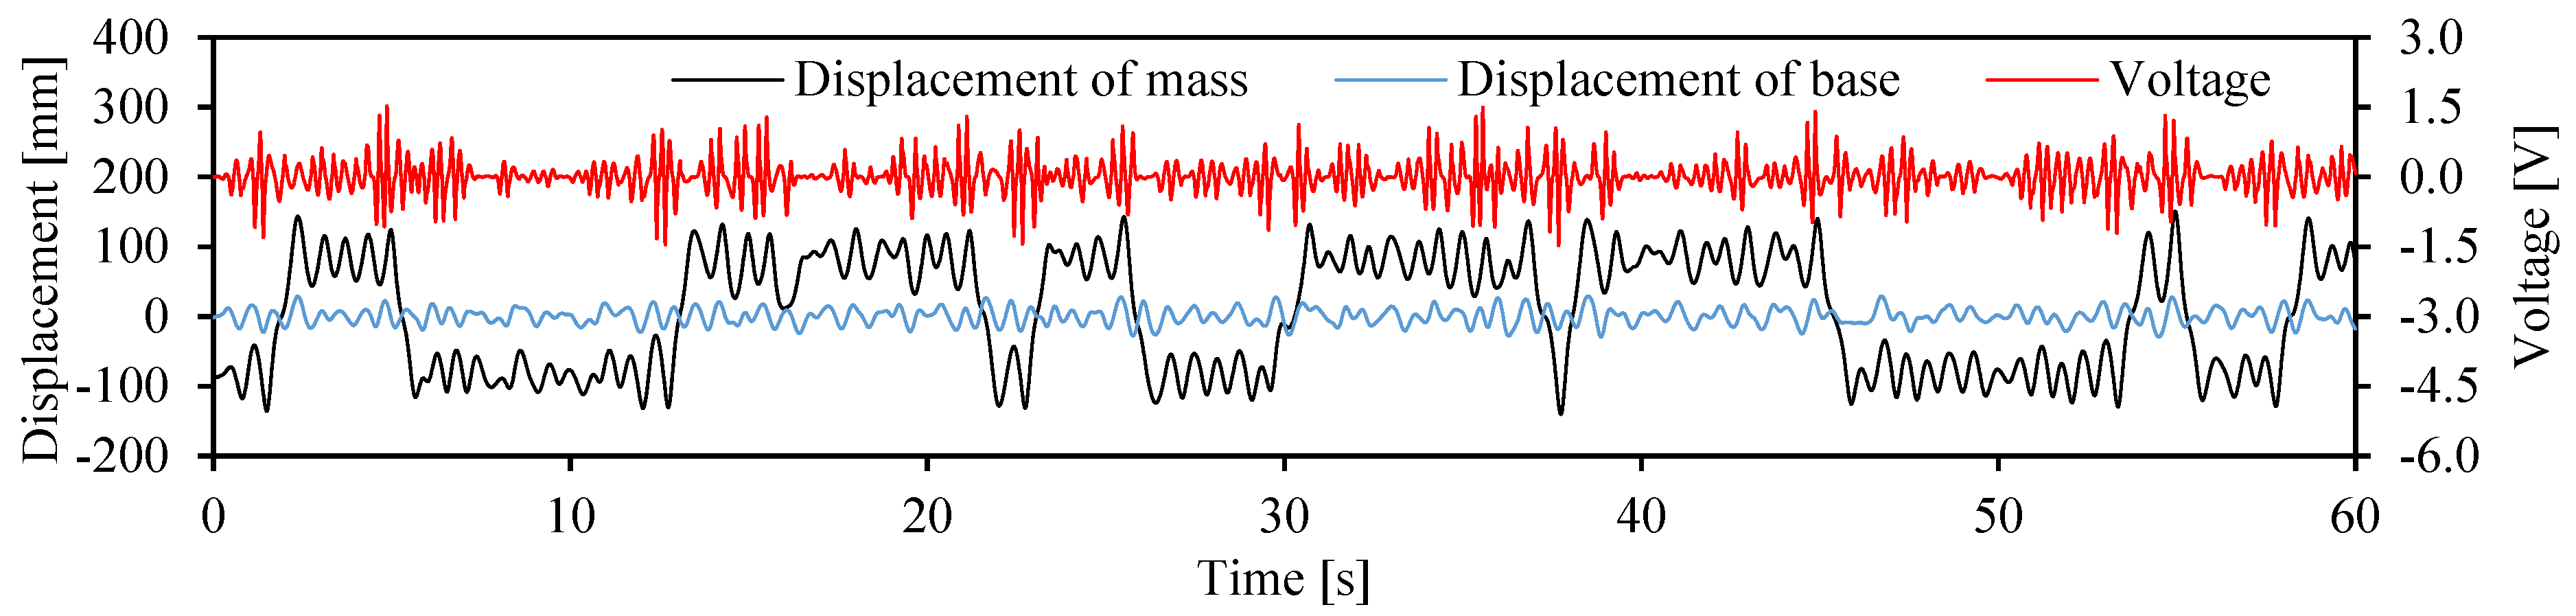
3.2. Measurement Results Yielded by Periodic Signal Excitation

As shown in Figure 11, Figure 12, Figure 13, Figure 14 and Figure 15, owing to the periodic signal excitation, the vibration displacements exhibited the same periodicity, whereas the voltage of the vibration power exhibited a little different periodic distribution as it was affected by the frame shape of the coil.
No relative displacement was observed between the mass block and support point, as they both vibrated periodically simultaneously and did not generate power when vibrating at a low frequency such as 1.0 Hz, as shown in Figure 11. The standard deviations of the vibration displacements of the mass block and support point were 7.93 and 6.35 mm, respectively, which resulted in 0.00 mW power generated.
When the excitation frequency was set to 1.3 Hz, as illustrated in Figure 12, the mass block vibrated periodically with an amplitude greater than that of the support point. The standard deviations of the vibration displacement of the mass block and support point were 14.94 and 7.39 mm, respectively, which resulted in 0.12 mW of power generated.
The amplitude of the mass block increased further and exceeded that of the support point when the excitation frequency was 1.6 Hz, as shown in Figure 13, which might be because the excitation frequency was similar to the natural frequency of the vibration model. The standard deviations of the vibration displacement of the mass block and support point were 16.87 and 5.71 mm, respectively, which resulted in 1.28 mW of power generated.
When the excitation frequency was 1.9 Hz, as shown in Figure 14, the vibration of the mass block was less intense than that at the excitation frequency was 1.6 Hz. The standard deviations of the vibration displacement of the mass block and support point were 12.03 and 5.62 mm, respectively, which resulted in 1.63 mW of power generated.
When the excitation frequency was 2.2 Hz, as shown in Figure 15, the amplitude of the mass block was smaller than that at a lower excitation frequency, such as 1.0 Hz. The standard deviations of the vibration displacement of the mass block and support point were 7.34 and 5.33 mm, respectively, which resulted in 0.80 mW of power generated.
The effects of the periodic signal frequency on the vibrational displacement and the amount of vibrational power generated are summarized in Figure 16 and Figure 17, respectively. In Figure 16, the red and blue bar graphs show the vibration displacements of the mass block and support point, respectively. As the excitation frequency increased, the vibration displacement of the support point increased significantly, whereas that of the mass block peaked at approximately 1.6 Hz.
Based on Figure 17, one might assume that the amount of vibration power generated increases with the frequency. However, the amount of vibration power generated reached its maximum at approximately 1.9 Hz, whereas at 1.0 Hz, the amount of vibration power generated was zero as no relative displacement was indicated between the mass block and support point.

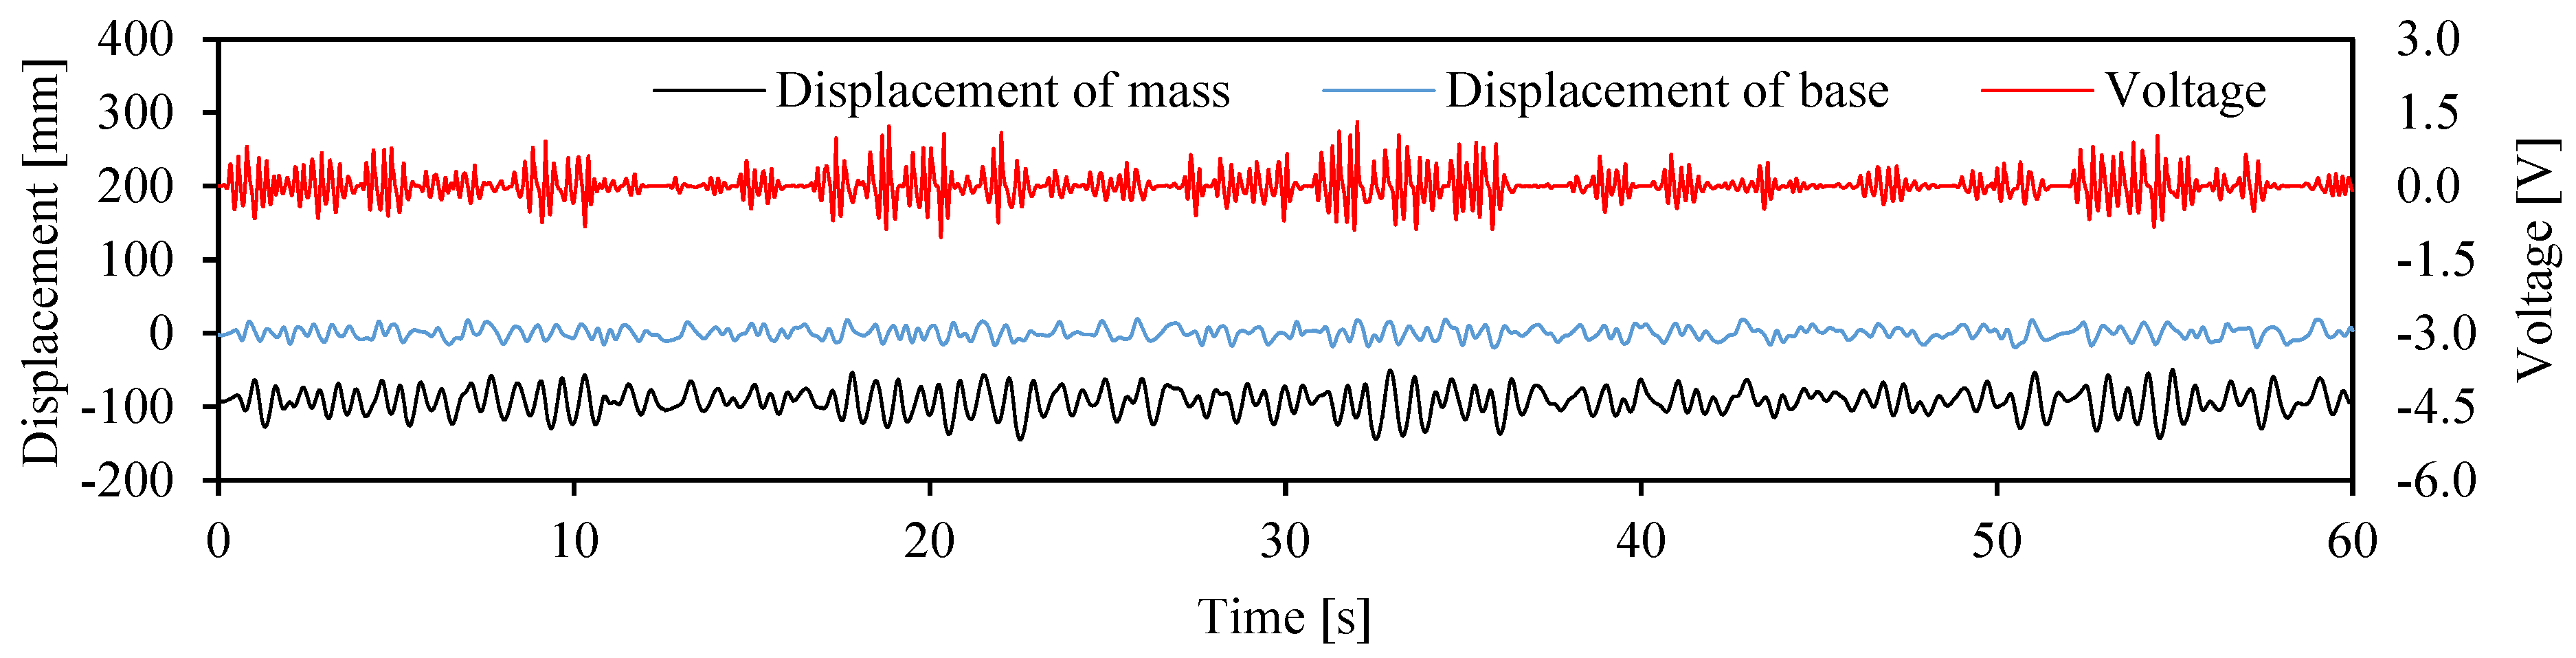
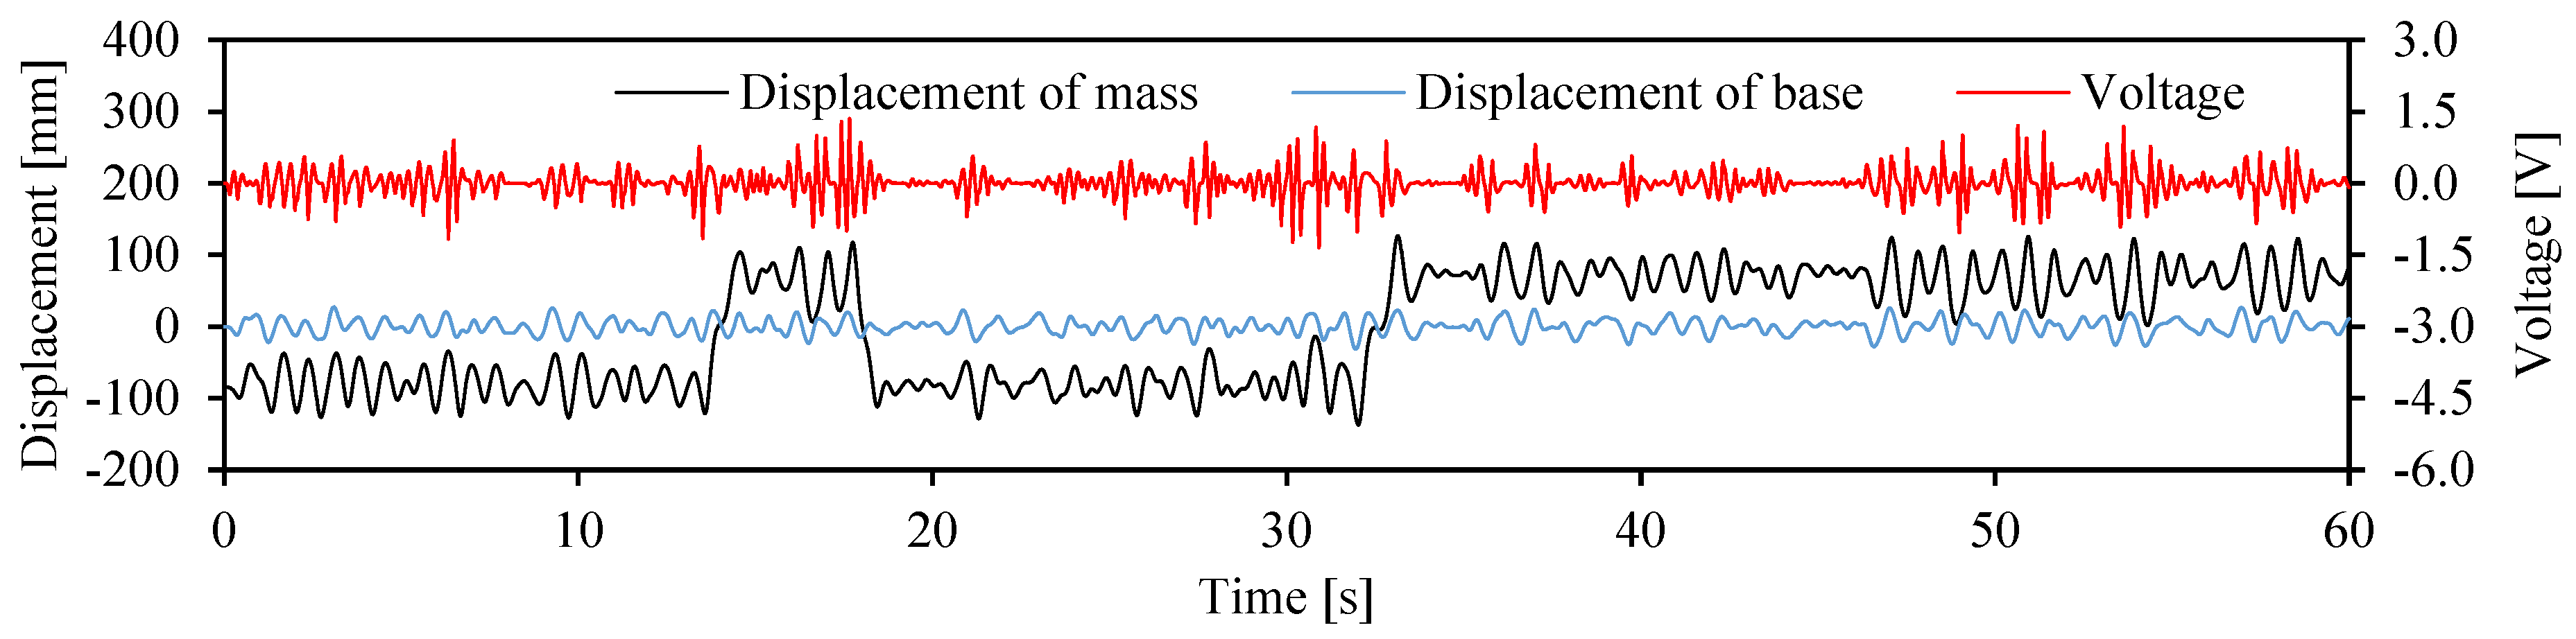
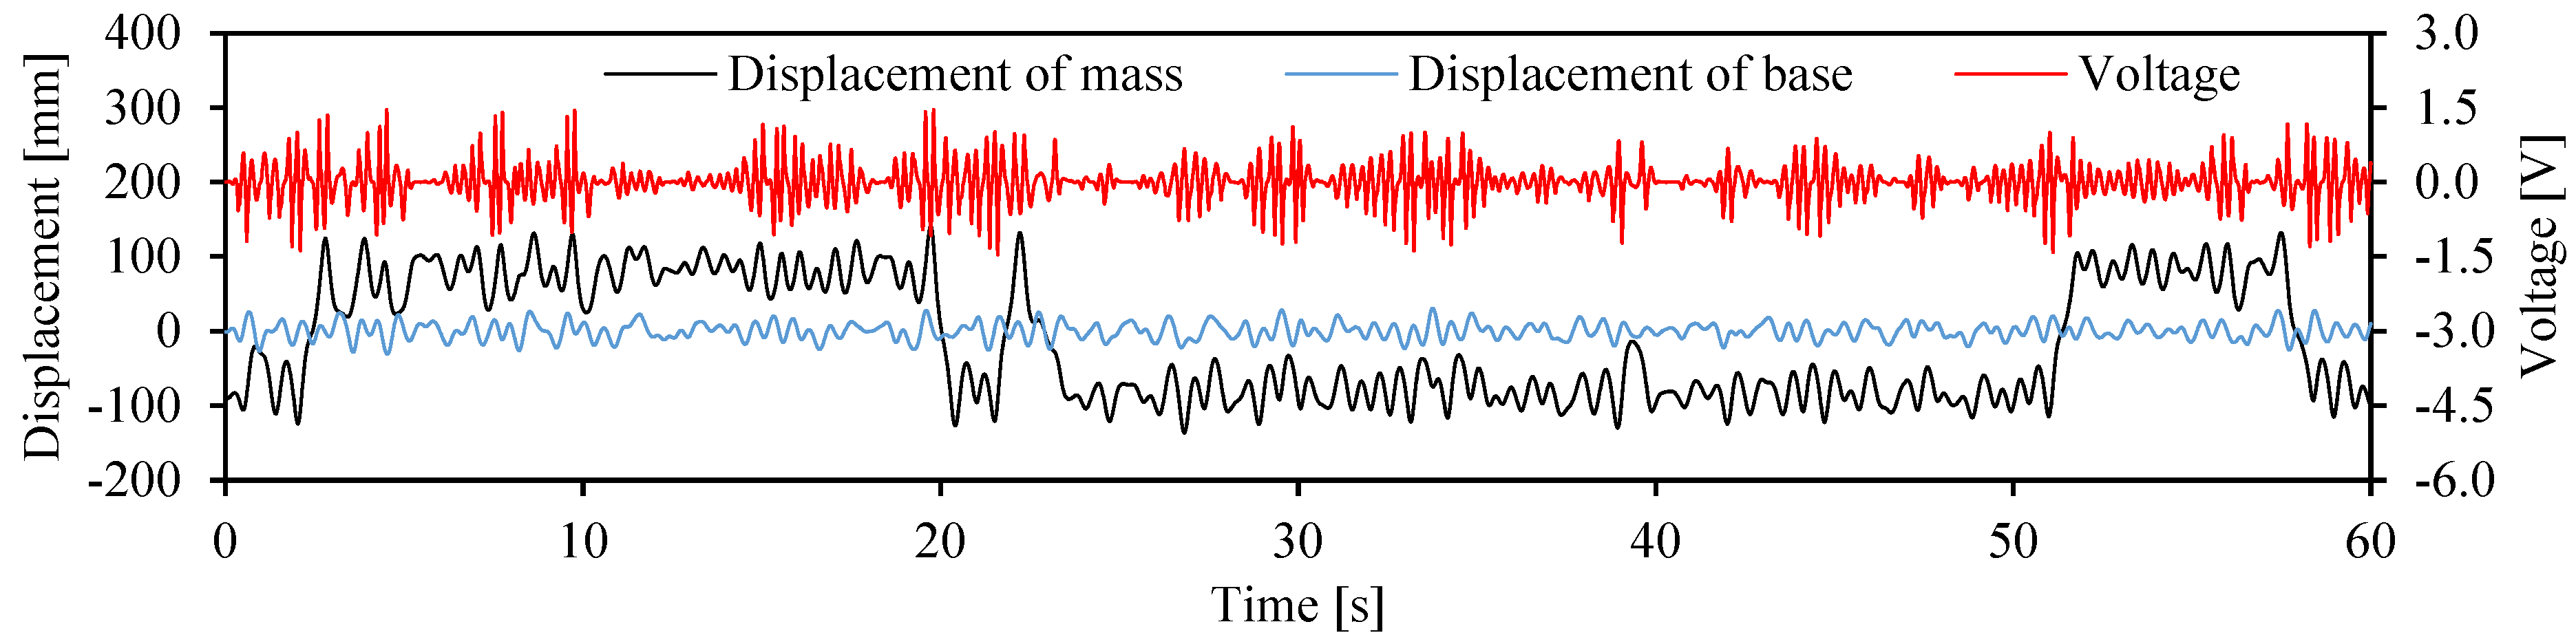
3.3. Measurement Results Yielded by Random and Periodic Signal Co-Excitation

The results yielded by the joint excitation of the random and periodic signals are shown in Figure 18, Figure 19, Figure 20, Figure 21 and Figure 22. At the periodic signal of 1.0 Hz (see Figure 18), the vibration displacement of the mass block slightly exceeded that of the support point, which resulted in a single stable motion with standard deviations of 21.45 and 11.76 mm for the vibration displacements of the mass block and support point, respectively; consequently, 1.04 mW of power was output.
When the periodic signal frequency was 1.3 Hz, as shown in Figure 19, the vibration of the mass block became more intense, and a stochastic resonance phenomenon occurred that caused the monostable vibration of the mass block to evolve to a bi-stable vibration with standard deviations of 77.64 and 10.85 mm in the vibration displacements of the mass block and support point, respectively; consequently, 2.08 mW of power was output.
Meanwhile, at a higher periodic signal frequency of 1.6 Hz, the mass block vibrated more intensely, as shown in Figure 20, and the number of occurrences of bi-stable vibration increased, indicating that stochastic resonance is most likely to occur in this excitation frequency range. The standard deviations of the vibration displacement of the mass block and support point were 83.47 and 11.53 mm, respectively, which resulted in 3.51 mW of power generated.
The number of occurrences of bi-stable vibration in the mass block began decreasing as the periodic signal frequency approached 1.9 Hz, as presented in Figure 21, with standard deviations of 80.74 and 10.92 mm for the vibration displacements of the mass block and support point, respectively, which resulted in 3.76 mW of power generated. When the periodic signal frequency shown in Figure 22 approached 2.2 Hz, the vibration of the mass block reduced, the bi-stable vibrations disappeared, and the mass block indicated monostable vibrations. The standard deviations of the vibration displacement of the mass block and support point were 20.70 and 9.84 mm, respectively, which resulted in 2.18 mW of power generated.
The effects of periodic signal frequencies on the vibration displacement and vibration power generated are summarized in Figure 23 and Figure 24, respectively. Based on Figure 23, the vibration displacement of the support point did not change substantially as the excitation frequency increased, but the vibration displacement of the mass block amplified significantly from 1.3 to 1.9 Hz owing to the stochastic resonance associated with the bi-stable vibration. The increase rate of vibration displacement was 615.50% at 1.3 Hz, 623.94% at 1.6 Hz and 639.38% at 1.9 Hz, respectively.
Based on Figure 24, the highest vibration power was generated from 1.3 to 1.9 Hz, owing to the mutual effect of the increase in vibration frequency and the stochastic resonance. The rate of increase in power generation was 71.90% at 1.3 Hz, 48.10% at 1.6 Hz, and 38.24% at 1.9 Hz, respectively.

4. Discussion

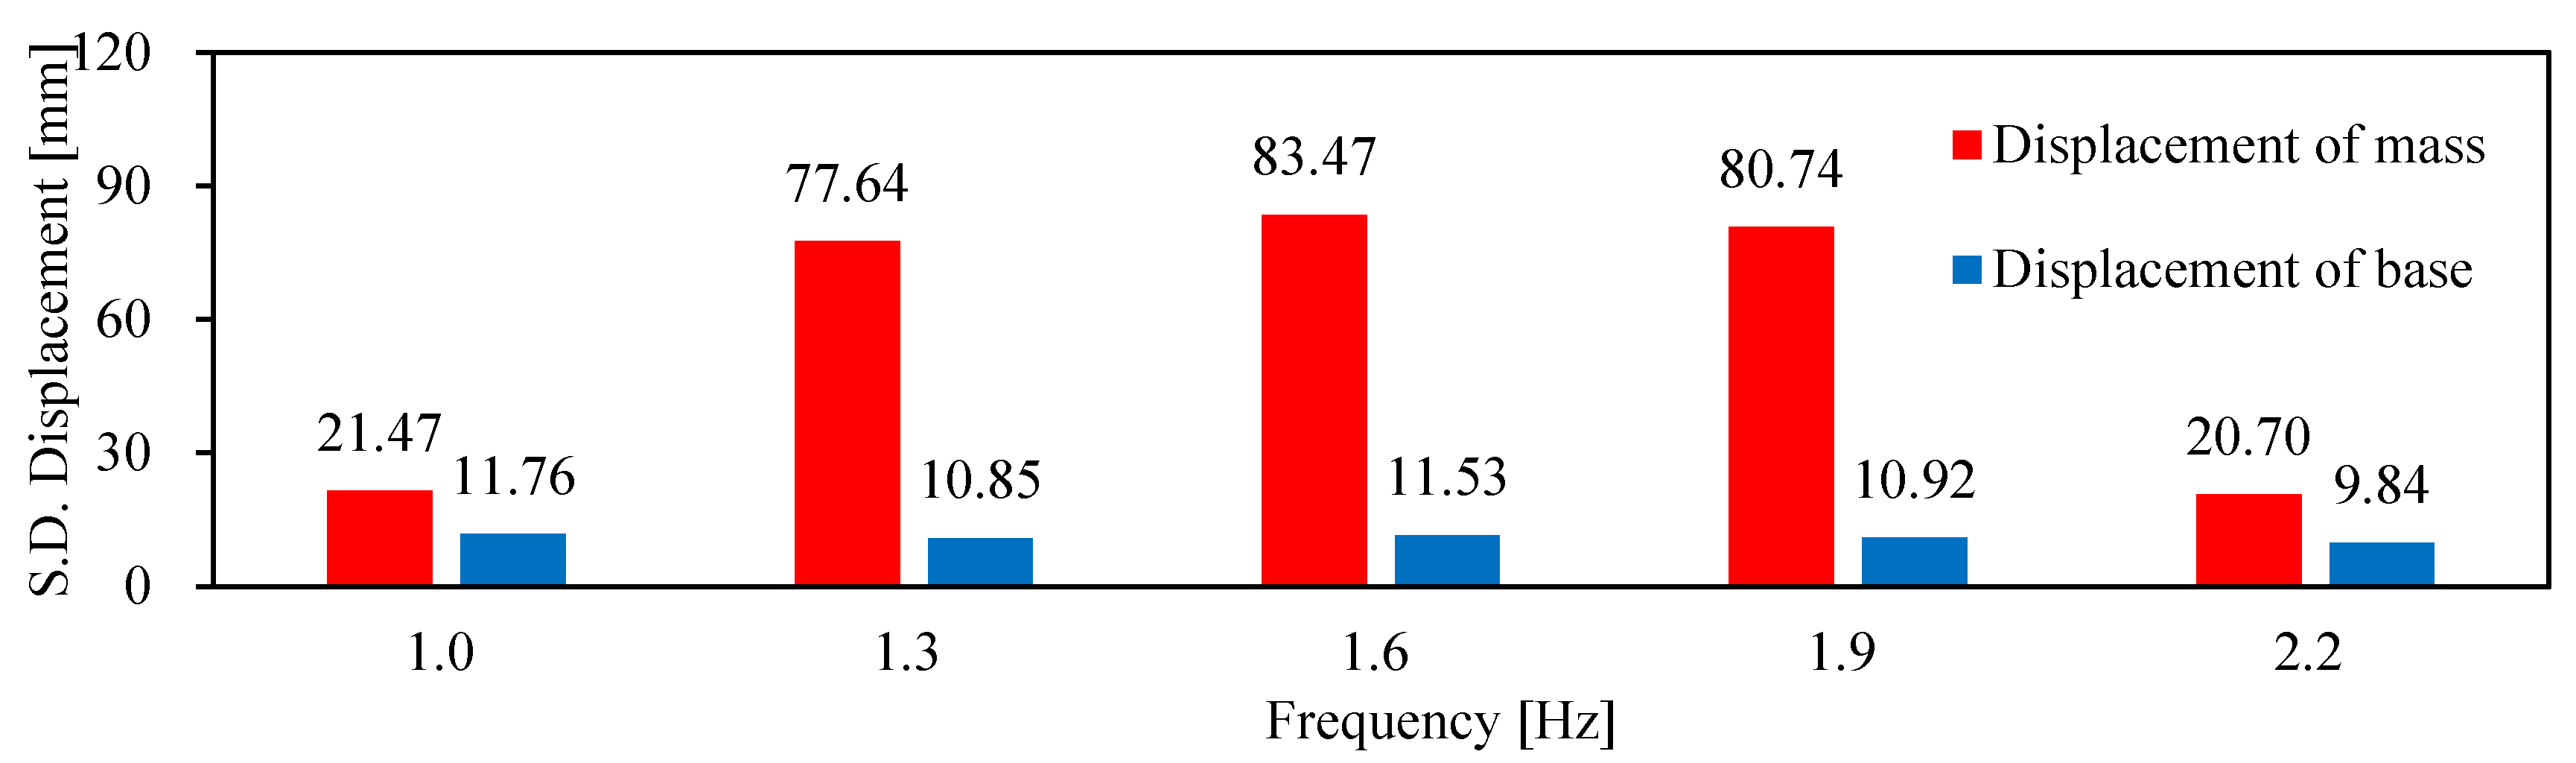
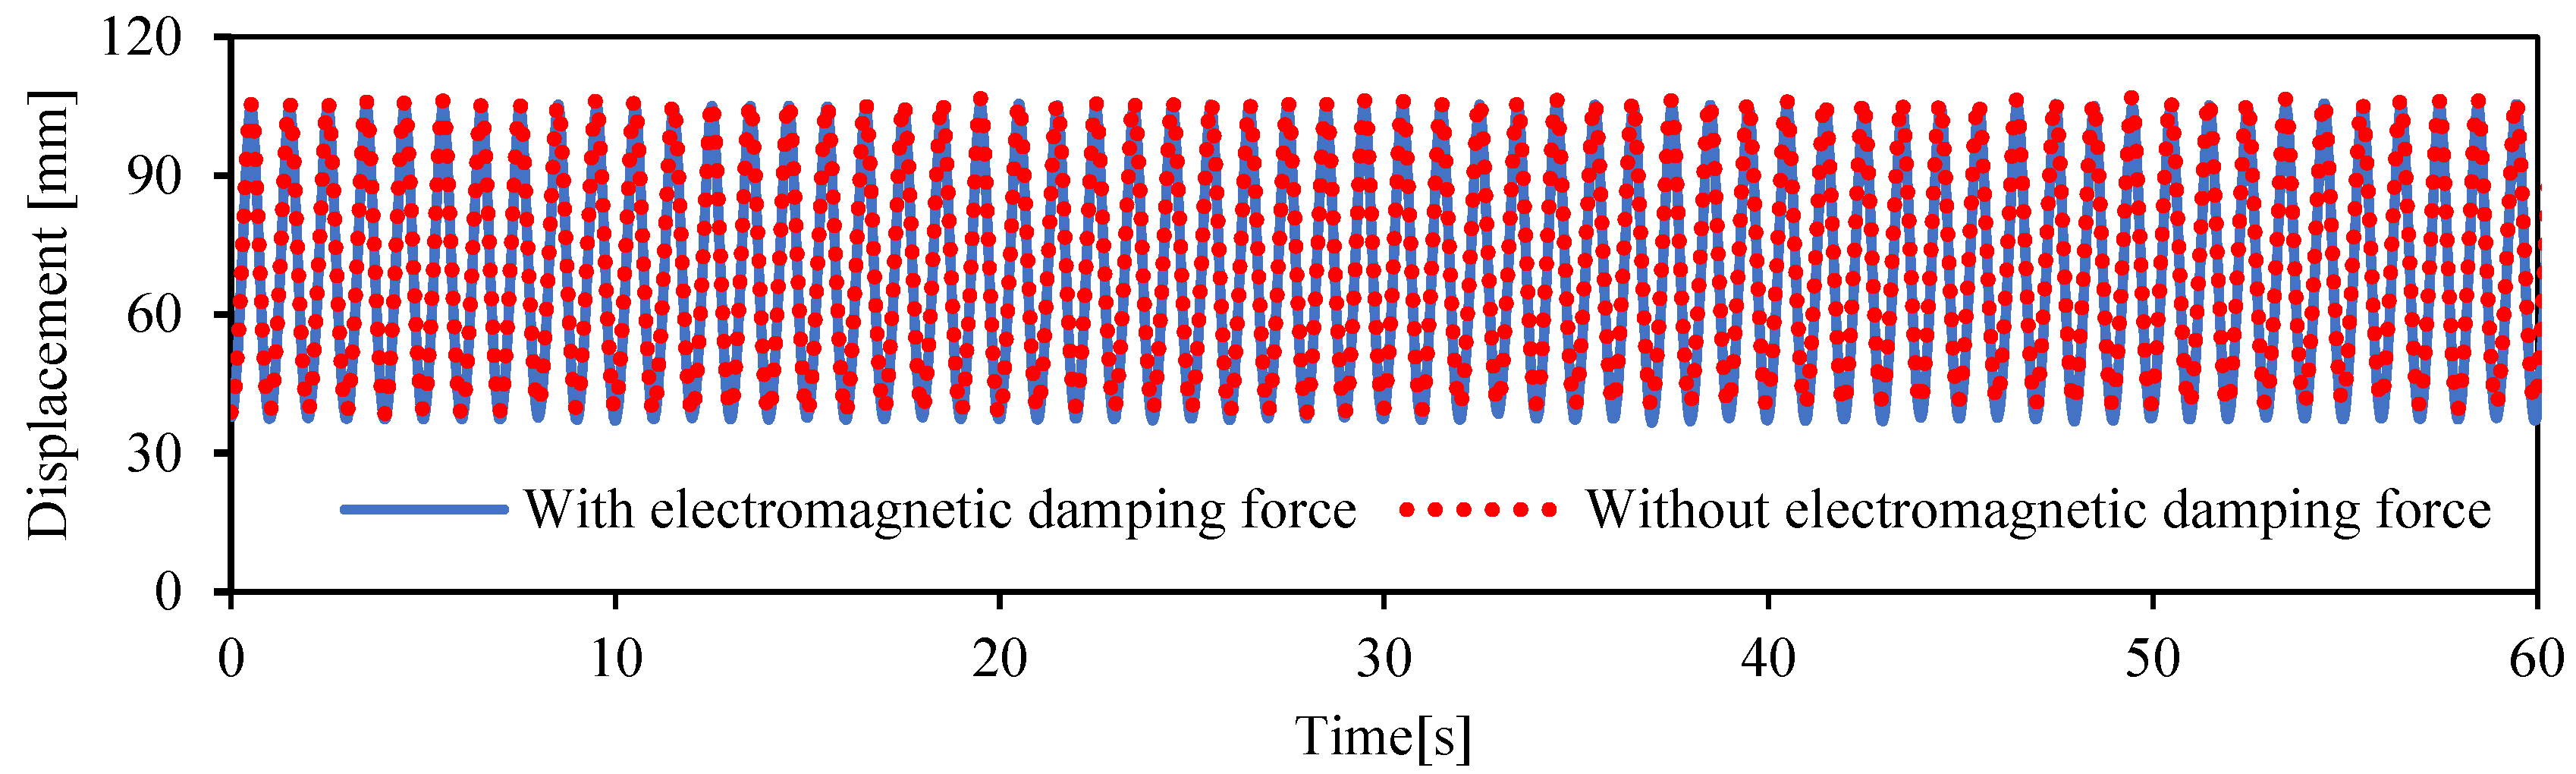
4.1. Effect of Electromagnetic Induction Damping on Vibration Displacement

To examine the effect of the electromagnetic induction damping newly generated by the Lorentz force produced when the current derived from the vibration power generated flows in the coil in the magnetic field on the vibration of the mass block, two experimental cases, as illustrated in Figure 25, were established for a comparative study. (1) An ordinary magnet, illustrated on the left in Figure 25, was affixed to the surface of the mass block to measure the vibration resulting from the electromagnetic induction damping effect. (2) The magnet was removed, as illustrated in the right figure of Figure 25, and a clay of the same weight was adhered onto the top of the mass block to measure the vibration resulting from the absence of the electromagnetic induction damping effect.
For the two experimental cases under the same conditions except for the electromagnetic induction damping effect, the measurements obtained are shown in Figure 26. The blue and red lines indicate the vibration displacements resulting from the presence and absence of the electromagnetic induction damping effect, respectively. Figure 26 shows that the effect of electromagnetic inductive damping on the vibration response displacement is minimal, and that the overall vibration amplitude of the mass block is marginally lower when the electromagnetic inductive damping effect is considered.
This distinction above can be investigated quantitatively by comparing the coefficients of the damping force in Equation (12). The equivalent damping coefficient cL resulting from the electromagnetic induction for the measured damping coefficient c = 2.15 is calculated as follows:
c L = B 2 n 2 b 2 R W ( x )
By substituting the detailed parameters of the bi-stable vibration model in Table 1 into Equation (29) and considering the configuration weighting factor | W ( x ) | 1 , an equivalent damping coefficient resulting from electromagnetic induction is obtained as follows:
c L 0.0199
Therefore, the damping force resulting from electromagnetic induction is less than 2% of the total damping force.

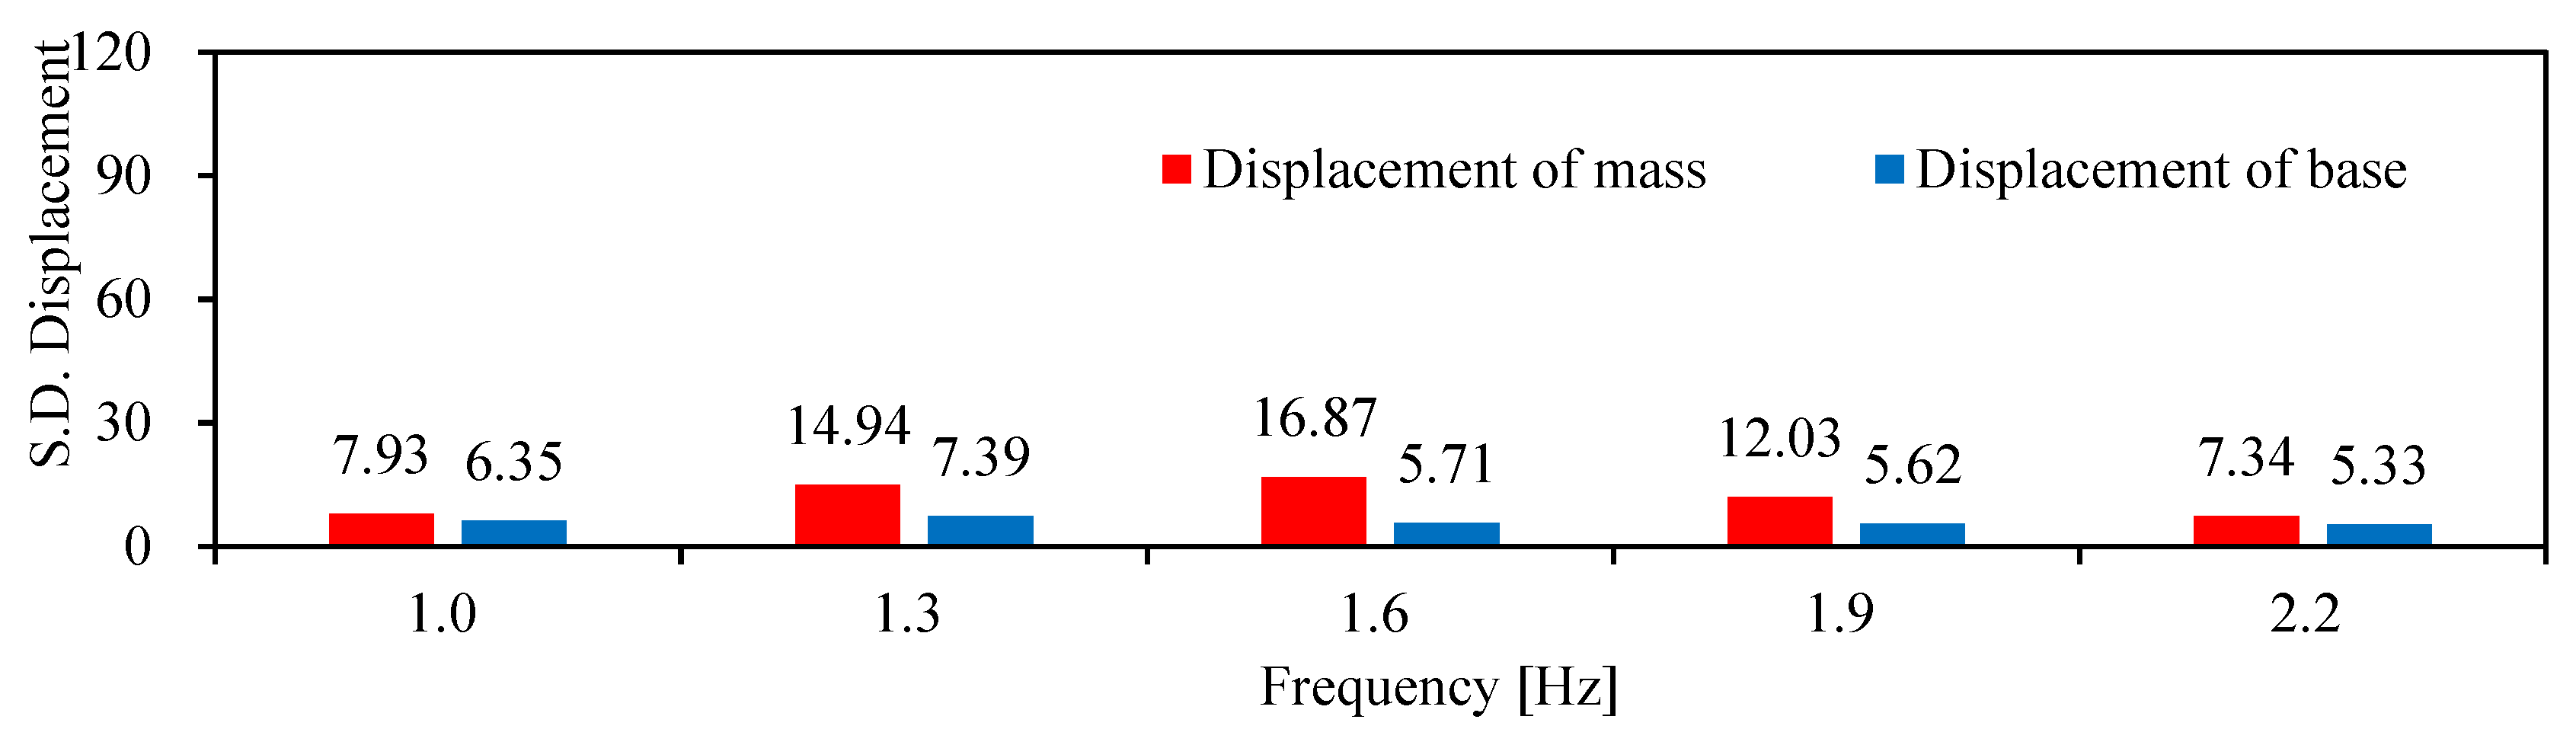
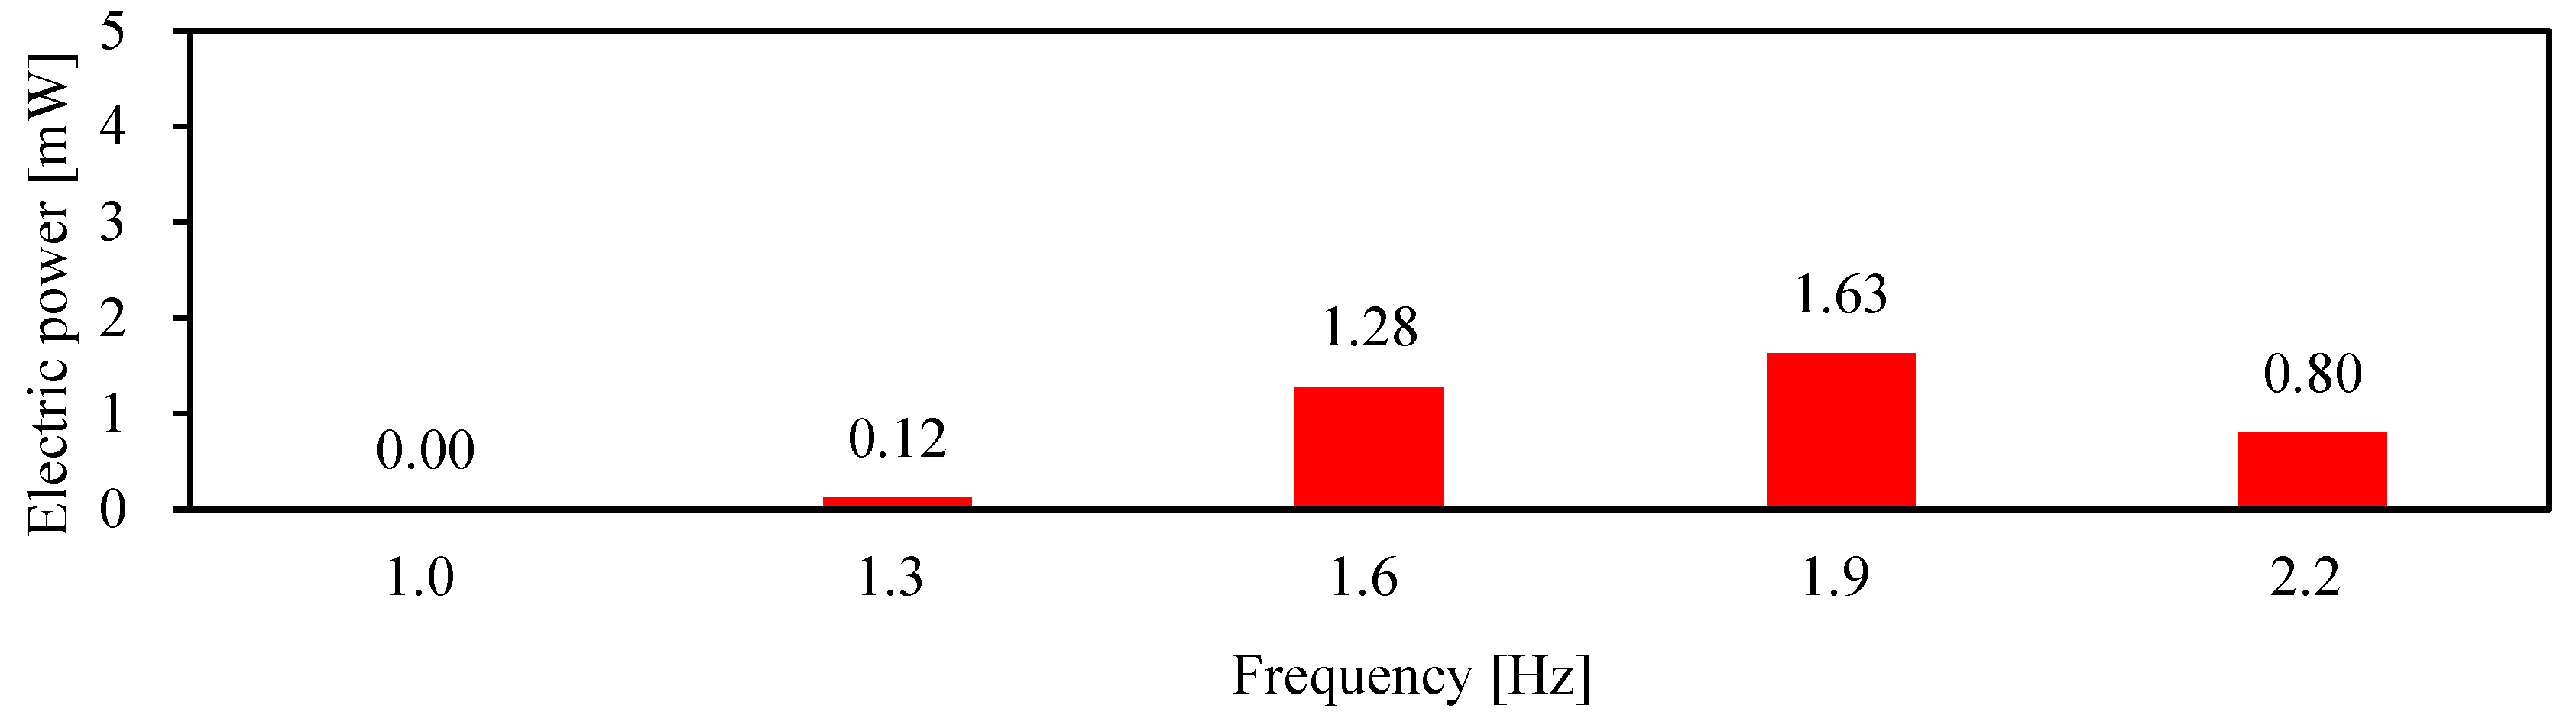
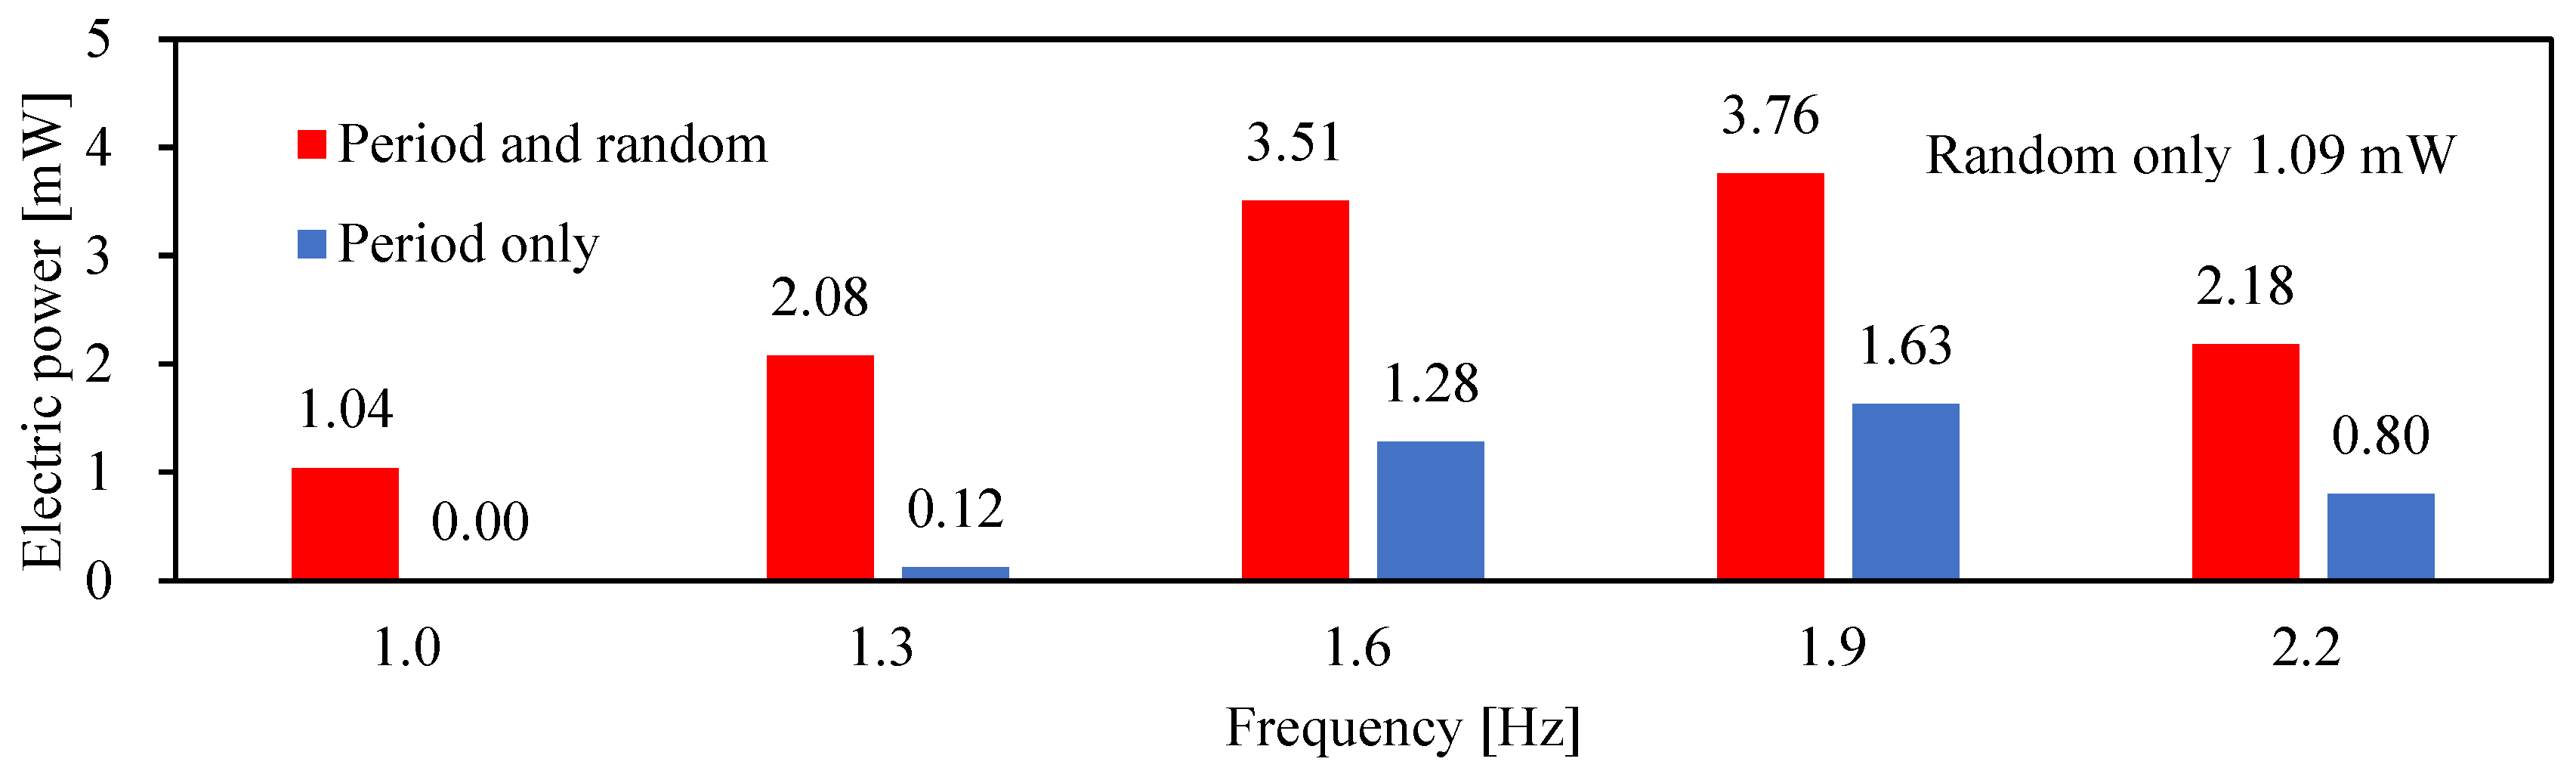
4.2. Forecasting the Most Likely Frequency at Which Stochastic Resonance Occurs

The periodic excitation frequency at which the stochastic resonance is the most likely to occur can be determined using Kramer’s rate, as follows [15]:
f k = ω 1 ω 2 4 π q exp ( Δ U ¯ D )
Here, ω 1 refers to the equivalent natural angular frequency at the stable equilibrium point x 1 = ± l 0 2 h 2 , ω 2 the equivalent natural angular frequency at the unstable equilibrium point x2 = 0, Δ U ¯ the barrier value of potential energy calculated using Equation (20), q the damping factor including electromagnetic induction damping effects, and D the random signal intensity. ω 1 , ω 2 , Δ U ¯ , and q are expressed as follows:
ω 1 = | U ( l 0 2 h 2 ) | m
ω 2 = | U ( 0 ) | m
Δ U ¯ = 1 m [ U ( 0 ) U ( l 0 2 h 2 ) ] = K m ( l 0 h ) 2
q = 1 m ( c + B 2 n 2 b 2 2 R )
The random signal intensity D was calculated using the time-series response displacement of the support table, which was measured when only the random signal alone was excited. The calculated D was 0.319 J/kg.
Substituting Equations (32)–(34) and D into Equation (31), the periodic signal frequency at which stochastic resonance tends to be generated can be expressed as follows:
f k = K ( l 0 h ) 2 π q l 0 l 0 + h h exp ( K ( l 0 h ) 2 m D )
Substituting the structural parameters into Equation (36) yields fk = 1.64 Hz as the frequency at which stochastic resonance is the most likely to occur, which is within the frequency range of 1.3–1.9 Hz discussed in the previous section.

5. Conclusions

A horizontal bi-stable vibration energy-harvesting system was proposed herein. The conclusions inferred from investigating the system are as follows:
(1)
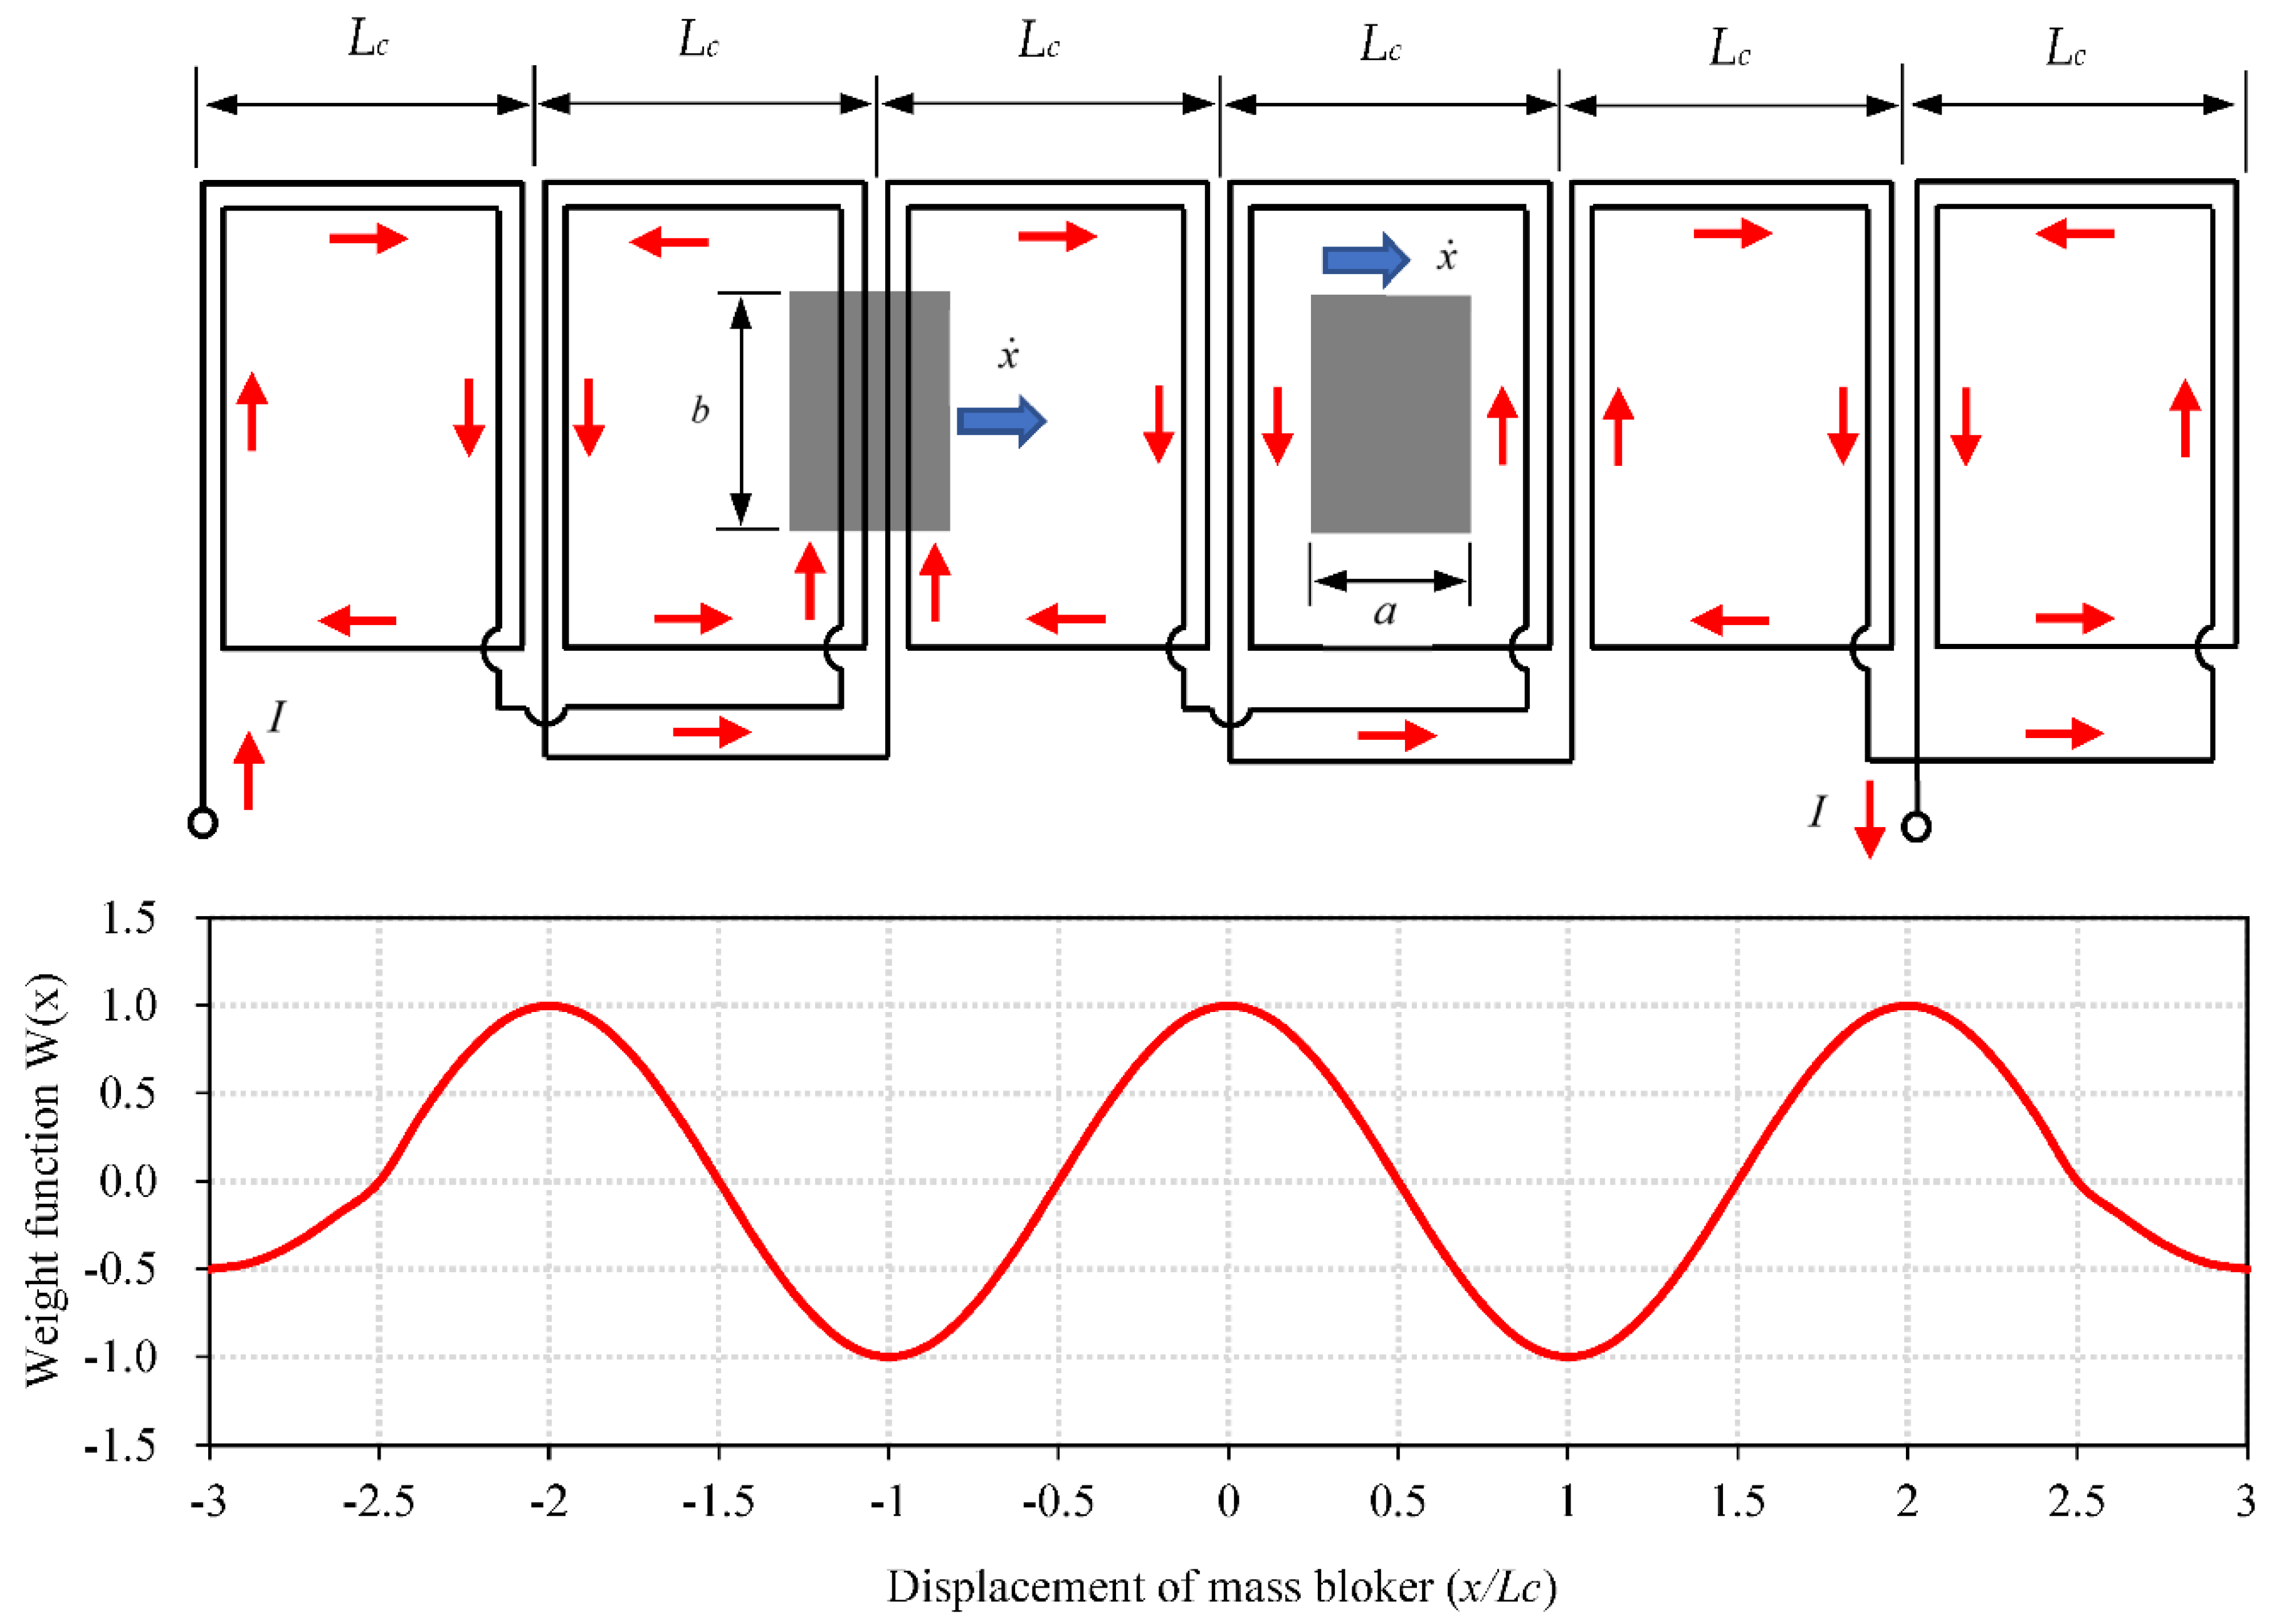
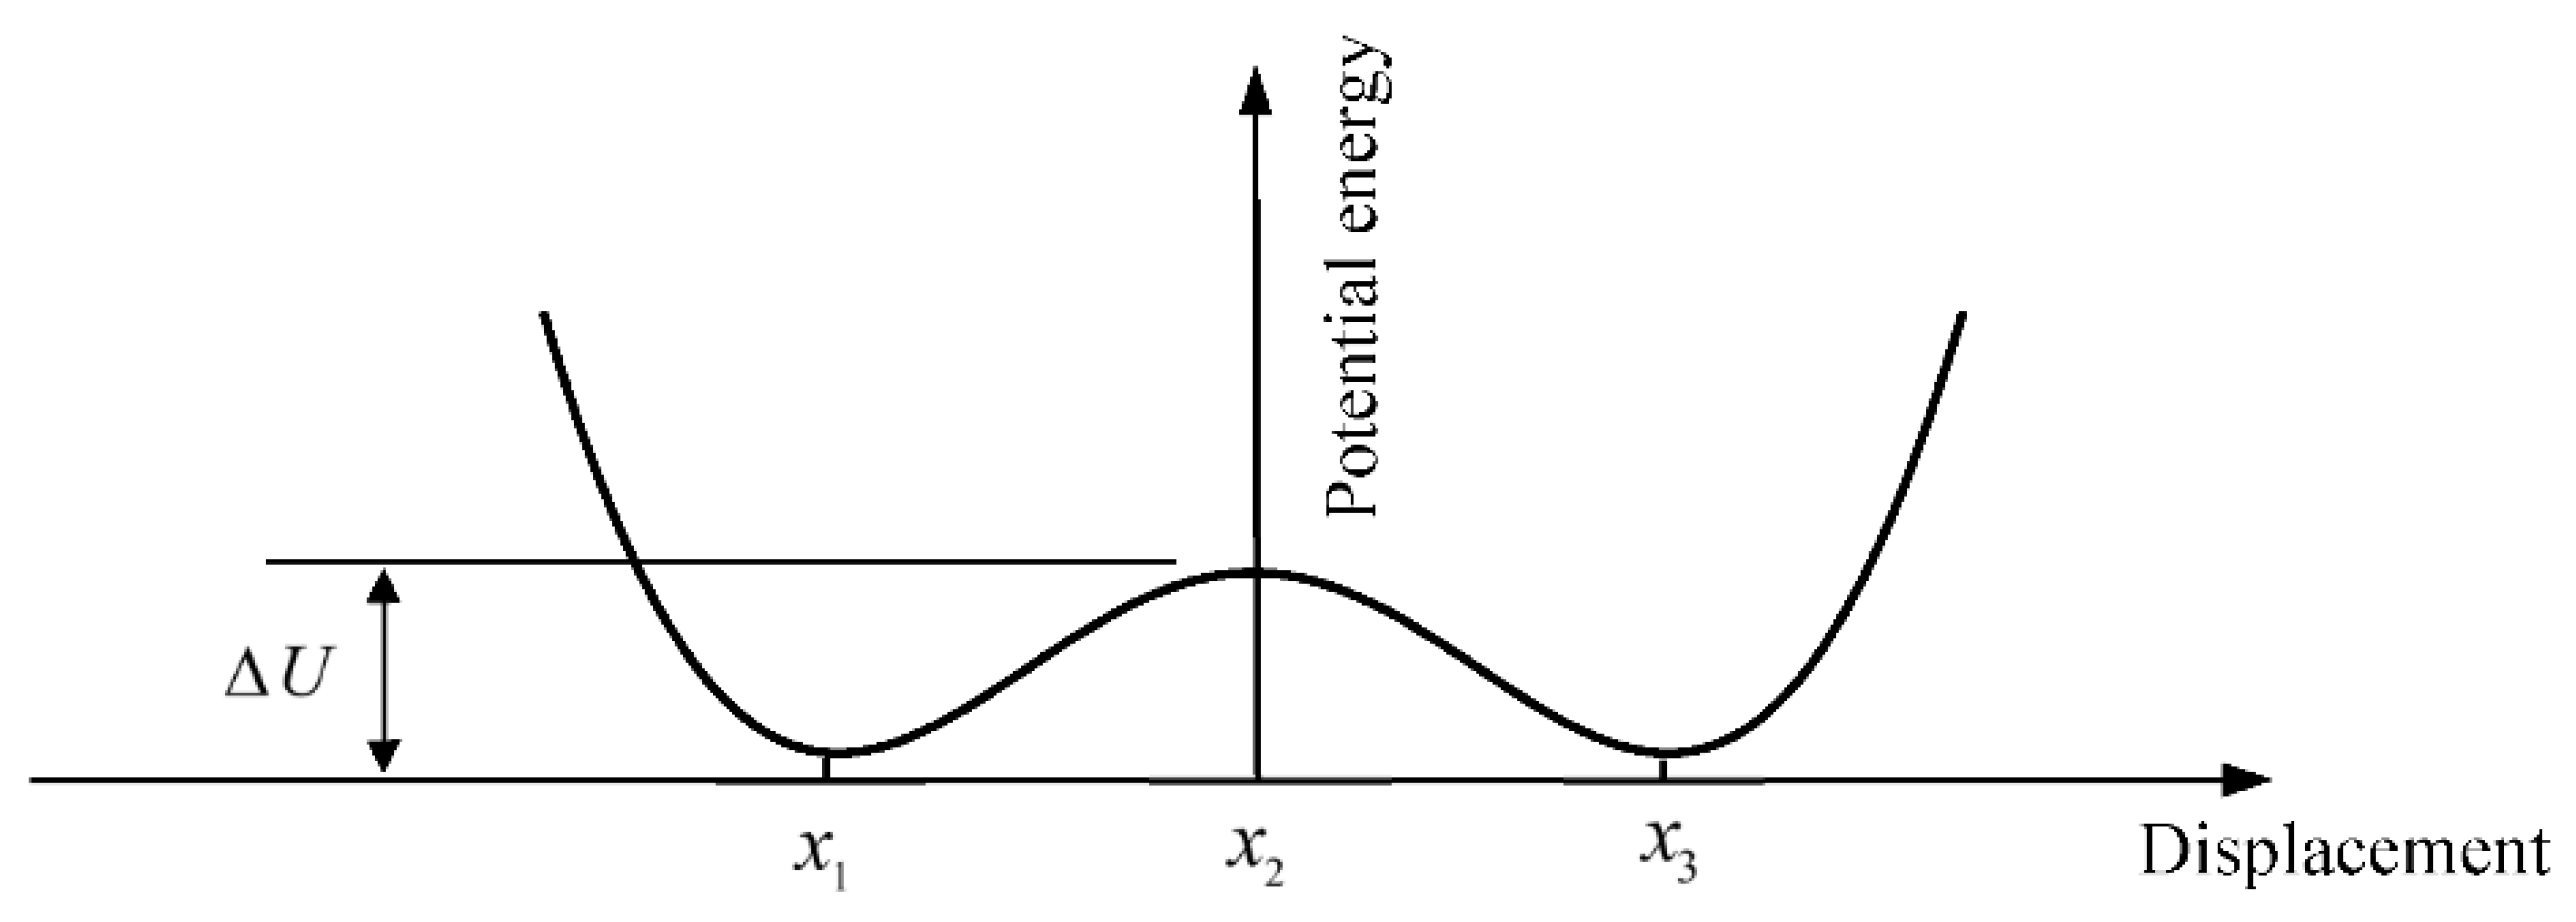
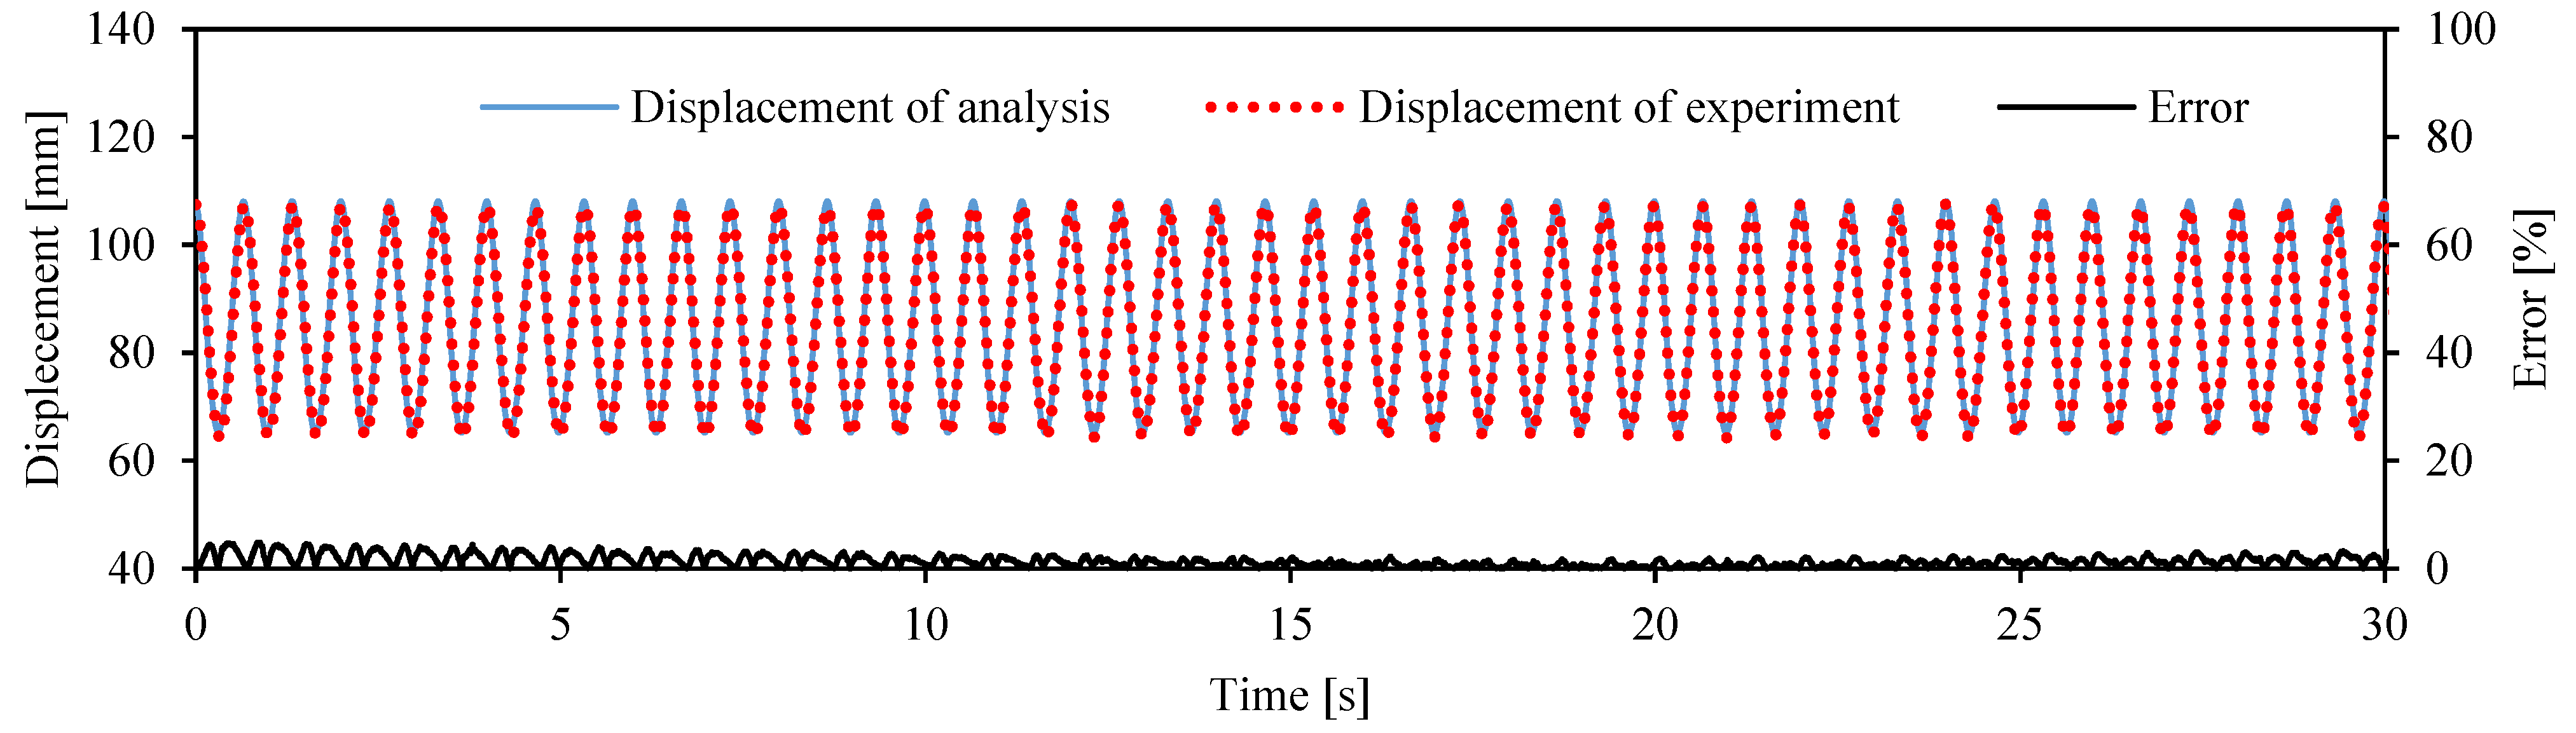
An energy-harvesting system was proposed for application to random vibration environments by employing a vibration power generation unit comprising magnets and coils. By establishing a set of governing equations that simultaneously consider the elastic force of the spring and the Lorentz force of electromagnetic induction, the potential energy performance of the proposed system was analyzed, and the results showed that the system exhibited bi-stable vibrational characteristics over the entire range of motion. An arrangement weight function W(x) as proposed that incorporated the mutual positional relationship between the magnet and coil during the vibration process, thus enabling a quantitative analysis of the voltage generated in the coil. The analytical values of vibration displacement and voltage derived from numerical analysis were consistent with the measured experimental values.
(2)
To determine the friction damping and electromagnetic induction damping of the bi-stable vibration model, a damping coefficient identification method combining numerical analysis and experimental measurements was employed to analyze the actual damping coefficients. The results yielded showed agreement with the experimental values. The average error of the vibration displacement was 2.46%, and the average error of the voltage was 5.27%. To quantitatively investigate the effect of electromagnetic induction damping on the vibration power generated, the experiment results showed that the electromagnetic induction damping force was about 2% smaller than the normal friction damping force.
(3)
The appropriate frequency range of periodic signals were added to generate stochastic resonance. Subsequently, by investigating with Kramer’s rate, a prediction equation for the frequency range of periodic signals within which stochastic resonance can be generated easily was derived, and its validity was verified based on comparison with the results of experimental measurements. When random and periodic signals were excited simultaneously, the proposed bi-stable vibration energy-harvesting system effectively improved the vibration amplification and vibration power generation performance by ensuring the generation of stochastic resonance. Its average vibration displacement increased by 629.29%, and the average power generation increased by 52.75%.

Author Contributions

Writing—original draft preparation, L.G.; writing—review and editing, J.G.; data curation, X.Z.; investigation, N.G.; software, W.Z.; conceptualization, L.G. and X.Z.; methodology, J.G.; validation, W.Z. and N.G. All authors have read and agreed to the published version of the manuscript.

Funding

This research received no external funding.

Data Availability Statement

Data available in a publicly accessible repository.

Conflicts of Interest

The authors declare no conflict of interest.

References

  1. Zhang, H.; Corr, L.R.; Ma, T. Issues in vibration energy harvesting. J. Sound Vib. 2018, 2421, 79–90. [Google Scholar] [CrossRef]
  2. Halim, M.A.; Tao, K.; Towfighian, S.; Zhu, D. Vibration energy harvesting: Linear, nonlinear and rotational approaches. Shock. Vib. 2019, 2019, 5381756. [Google Scholar] [CrossRef]
  3. Stephen, N.G. On energy harvesting from ambient vibration. J. Sound Vib. 2006, 293, 409–425. [Google Scholar] [CrossRef] [Green Version]
  4. Khan, F.U.; Ahmad, I. Review of Energy Harvesters Utilizing Bridge Vibrations. Shock Vib. 2016, 2016, 1340402. [Google Scholar] [CrossRef] [Green Version]
  5. Lallart, M.; Anton, S.R.; Inman, D.J. Frequency self-tuning scheme for broadband vibration energy harvesting. J. Intell. Mater. Syst. Struct. 2010, 21, 897–906. [Google Scholar] [CrossRef]
  6. Kubba, A.E.; Jiang, K. Efficiency enhancement of a cantilever-based vibration energy harvester. Sensors 2014, 14, 188–211. [Google Scholar] [CrossRef] [Green Version]
  7. Dong, L.; Grissom, M.; Fisher, F.T. Resonant frequency of mass-loaded membranes for vibration energy harvesting applications. AIMS Energy 2015, 3, 344–359. [Google Scholar] [CrossRef]
  8. Chen, Z.; He, J.; Wang, G. Vibration bandgaps of piezoelectric metamaterial plate with local resonators for vibration energy harvesting. Shock Vib. 2019, 2019, 1397123. [Google Scholar] [CrossRef]
  9. Dai, X. A vibration energy harvester with broadband and frequency-doubling characteristics based on rotary pendulums. Sens. Actuators A Phys. 2016, 241, 161–168. [Google Scholar] [CrossRef]
  10. Yang, W.; Towfighian, S. A hybrid nonlinear vibration energy harvester. Mech. Syst. Signal Process. 2017, 90, 317–333. [Google Scholar] [CrossRef]
  11. Gafforelli, G.; Corigliano, R.; Xu, R.; Kim, S. Experimental verification of a bridge-shaped, nonlinear vibration energy harvester. Appl. Phys. Lett. 2014, 105, 203901. [Google Scholar] [CrossRef] [Green Version]
  12. Gammaitoni, L.; Neri, I.; Vocca, H. Nonlinear oscillators for vibration energy harvesting. Appl. Phys. Lett. 2009, 94, 164102. [Google Scholar] [CrossRef] [Green Version]
  13. Jiang, W.; Chen, L. Stochastic averaging of energy harvesting systems. Int. J. Non-Linear Mech. 2016, 85, 174–187. [Google Scholar] [CrossRef]
  14. McInnes, C.R.; Gorman, D.G.; Cartmell, M.P. Enhanced vibrational energy harvesting using nonlinear stochastic resonance. J. Sound Vib. 2008, 318, 655–662. [Google Scholar] [CrossRef] [Green Version]
  15. Gammaitoni, L.; Hanggi, P.; Jung, P.; Marchesoni, F. Stochastic resonance. Rev. Mod. Phys. 1999, 70, 223–287. [Google Scholar] [CrossRef]
  16. Benzit, R.; Sutera, A.; Vulpiani, A. The mechanism of stochastic resonance. J. Phys. A Math. Gen. 1981, 14, 453–457. [Google Scholar] [CrossRef]
  17. McNamara, B.; Wiesenfeld, K. Theory of stochastic resonance. Phys. Rev. A 1989, 39, 4854–4869. [Google Scholar] [CrossRef] [PubMed]
  18. Tretyakov, M.V. Numerical technique for studying stochastic resonance. Phys. Rev. E 1998, 57, 4789–4794. [Google Scholar] [CrossRef] [Green Version]
  19. Rosas, A.; Pinto, L.D., II; Lindenberg, K. Kramers’ rate for systems with multiplicative noise. Phys. Rev. E 2016, 94, 012101. [Google Scholar] [CrossRef] [PubMed] [Green Version]
  20. Harne, R.L.; Wang, K.W. A review of the recent research on vibration energy harvesting via bistable systems. Smart Mater. Struct. 2013, 22, 023001. [Google Scholar] [CrossRef]
  21. Pellegrini, S.P.; Tolou, N.; Schenk, M.; Herder, J.L. Bistable vibration energy harvesters: A review. J. Intell. Mater. Syst. Struct. 2012, 24, 1303–1312. [Google Scholar] [CrossRef]
  22. Baltana, J.P.; Lopez, L.; Blechman, I.I.; Landa, P.S.; Zaikin, A.; Kurths, J.; Sanjua MA, F. Experimental evidence, numerics, and theory of vibrational resonance in bistable systems. Phys. Rev. E 2003, 67, 066119. [Google Scholar] [CrossRef] [PubMed] [Green Version]
  23. Yao, C.; Liu, Y.; Zhan, M. Frequency-resonance-enhanced vibrational resonance in bistable systems. Phys. Rev. E 2011, 83, 061122. [Google Scholar] [CrossRef] [PubMed]
  24. Basquerotto, C.H.C.C.; Chavarette, F.R.; Silva, S.D. Analysis of bistable and chaotic piezoelectric energy harvesting device coupled with diode bridge rectifier. Indian J. Pure Appl. Math. 2015, 98, 275–289. [Google Scholar] [CrossRef] [Green Version]
  25. Li, Y.; Zhou, S.; Litak, G. Uncertainty analysis of bistable vibration energy harvesters based on the improved interval extension. J. Vib. Eng. Technol. 2020, 8, 297–306. [Google Scholar] [CrossRef] [Green Version]
  26. Stanton, S.C.; McGehee, C.C.; Mann, B.P. Nonlinear dynamics for broadband energy harvesting: Investigation of a bistable piezoelectric inertial generator. Phys. D 2010, 239, 640–653. [Google Scholar] [CrossRef]
  27. Wang, K.; Dai, X.; Xiang, X.; Ding, G.; Zhao, X. Optimal potential well for maximizing performance of bi-stable energy harvester. Appl. Phys. Lett. 2019, 115, 143904. [Google Scholar] [CrossRef]
  28. Ibrahim, A.; Towfighian, S.; Younis, M.I. Dynamics of transition regime in bi-stable vibration energy harvesters. ASME J. Vib. Acoust. 2017, 139, 051008. [Google Scholar] [CrossRef] [Green Version]
  29. Kumar, A.; Sharma, A.; Vaish, R.; Kumar, R.; Jain, S.C. A numerical study on flexoelectric bistable energy harvester. Appl. Phys. A 2018, 124, 483. [Google Scholar] [CrossRef]
  30. Ali, S.F.; Adhikari, S.; Friswell, M.I.; Narayanan, S. The analysis of piezomagnetoelastic energy harvesters under broadband random excitations. J. Appl. Phys. 2011, 109, 074904. [Google Scholar] [CrossRef]
  31. Friswell, M.I.; Ali, S.F.; Bilgen, O.; Adhikari, S.; Lees, A.W.; Litak, G. Non-linear piezoelectric vibration energy harvesting from a vertical cantilever beam with tip mass. J. Intell. Mater. Syst. Struct. 2012, 23, 1505–1521. [Google Scholar] [CrossRef]
  32. Lan, C.B.; Qin, W.Y. Energy harvesting from coherent resonance of horizontal vibration of beam excited by vertical base motion. Appl. Phys. Lett. 2014, 105, 113901. [Google Scholar] [CrossRef]
  33. Bilgen, O.; Friswell, M.I.; Ali, S.F.; Litak, G. Broadband vibration energy harvesting from a vertical cantilever piezocomposite beam with tip mass. Int. J. Struct. Stab. Dyn. 2015, 15, 2. [Google Scholar] [CrossRef]
  34. Zhou, S.; Cao, J.; Wang, W.; Liu, S.; Lin, J. Modeling and experimental verification of doubly nonlinear magnet-coupled piezoelectric energy harvesting from ambient vibration. Smart Mater. Struct. 2015, 24, 055008. [Google Scholar] [CrossRef]
  35. Gao, Y.; Leng, Y.; Javey, A.; Tan, D.; Liu, J.; Fan, S.; Lai, Z. Theoretical and applied research on bistable dual-piezoelectric-cantilever vibration energy harvesting toward realistic ambience. Smart Mater. Struct. 2016, 25, 115032. [Google Scholar] [CrossRef]
  36. Lan, C.; Tang, L.; Qin, W.; Xiong, L. Magnetically coupled dual-beam energy harvester: Benefit and trade-off. J. Intell. Mater. Syst. Struct. 2017, 29, 1216–1235. [Google Scholar] [CrossRef]
  37. Zhang, X.; Yang, W.; Zuo, M.; Tan, H.; Fan, H.; Mao, Q.; Wan, X. An Arc-shaped piezoelectric bistable vibration energy harvester: Modeling and experiments. Sensors 2018, 18, 4472. [Google Scholar] [CrossRef] [PubMed] [Green Version]
  38. Podder, P.; Amann, A.; Roy, S. Combined effect of bistability and mechanical impact on the performance of a nonlinear electromagnetic vibration energy harvester. IEEE/ASME Trans. Mechatron. 2016, 21, 727–739. [Google Scholar] [CrossRef]
  39. Bouhedma, S.; Zheng, Y.; Lange, F.; Hohlfeld, D. Magnetic frequency tuning of a multimodal vibration energy harvester. Sensors 2019, 19, 1149. [Google Scholar] [CrossRef] [Green Version]
  40. Cottone, F.; Basset, P.; Vocca, H.; Gammaitoni, L.; Bourouina, T. Bistable electromagnetic generator based on buckled beams for vibration energy harvesting. J. Intell. Mater. Syst. Struct. 2013, 25, 1484–1495. [Google Scholar] [CrossRef]
  41. Huguet, T.; Lallart, M.; Badel, A. Orbit jump in bistable energy harvesters through buckling level modification. Mech. Syst. Signal Process. 2019, 128, 202–215. [Google Scholar] [CrossRef]
  42. Liu, W.Q.; Badel, A.; Formosa, F.; Wu, Y.P.; Agbossou, A. Novel piezoelectric bistable oscillator architecture for wideband vibration energy harvesting. Smart Mater. Struct. 2013, 22, 035013. [Google Scholar] [CrossRef]
  43. Liu, W.Q.; Badel, A.; Formosa, F.; Wu, Y.P.; Agbossou, A. Wideband energy harvesting using the combination of optimized synchronous electric charge extraction circuit and bistable harvester. Smart Mater. Struct. 2013, 22, 125038. [Google Scholar] [CrossRef]
  44. Zou, H.; Zhang, W.; Li, W.; Hu, K.; Wei, K.; Peng, Z.; Meng, G. A broadband compressive-mode vibration energy harvester enhanced by magnetic force intervention approach. Appl. Phys. Lett. 2017, 110, 163904. [Google Scholar] [CrossRef]
  45. Zou, H.; Zhang, W.; Li, W.; Wei, K.; Hu, K.; Peng, Z.; Meng, G. Magnetically coupled flextensional transducer for wideband vibration energy harvesting: Design, modeling and experiments. J. Sound Vib. 2018, 416, 55–79. [Google Scholar] [CrossRef]
  46. Mei, X.; Zhou, S.; Yang, Z.; Kaizuka, T.; Nakano, K. A tri-stable energy harvester in rotational motion: Modeling, theoretical analyses and experiments. J. Sound Vib. 2020, 469, 115142. [Google Scholar] [CrossRef]
  47. Mei, X.; Zhou, S.; Yang, Z.; Kaizuka, T.; Nakano, K. A passively self-tuning nonlinear energy harvester in rotational motion: Theoretical and experimental investigation. Smart Mater. Struct. 2020, 29, 045033. [Google Scholar] [CrossRef]
  48. Zhou, S.; Cao, J.; Litak, G.; Lin, J. Numerical analysis and experimental verification of broadband tristable energy harvesters. Tech. Mess. 2018, 85, 9. [Google Scholar] [CrossRef]
  49. Cao, J.; Zhou, S.; Wang, W.; Lin, J. Influence of potential well depth on nonlinear tristable energy harvesting. Appl. Phys. Lett. 2015, 106, 173903. [Google Scholar] [CrossRef]
  50. Zheng, R.; Nakano, K.; Hu, H.; Su, D.; Matthew, P.C. An application of stochastic resonance for energy harvesting in a bistable vibrating system. J. Sound Vib. 2014, 333, 2568–2587. [Google Scholar] [CrossRef]
  51. Nakano, K.; Cartmell, M.; Hu, H.; Zheng, R. Feasibility of energy harvesting using stochastic resonance caused by axial periodic force. J. Mech. Eng. 2014, 60, 314–320. [Google Scholar] [CrossRef] [Green Version]
  52. Zhang, Y.; Zheng, R.; Ejiri, K.; Su, D.; Nakano, K. Modelling analysis for vibration energy harvesting excited by low-speed automobile tires. Trans. JSME 2016, 82, 840. (In Japanese) [Google Scholar]
  53. Zhang, Y.; Zheng, R.; Kaizuka, T.; Su, D.; Nakano, K.; Cartmell, M.P. Broadband vibration energy harvesting by application of stochastic resonance from rotational environments. Eur. Phys. J. Spec. Top. 2015, 224, 2687–2701. [Google Scholar] [CrossRef]
  54. Zuo, L.; Tang, X. Large-scale vibration energy harvesting. J. Intell. Mater. Syst. Struct. 2013, 21, 1405–1430. [Google Scholar] [CrossRef]
  55. Zhao, W.; Wu, Q.; Zhao, X.; Nakano, K.; Zheng, R. Development of large-scale bistable motion system for energy harvesting by application of stochastic resonance. J. Sound Vib. 2020, 473, 115213. [Google Scholar] [CrossRef]
  56. Mohanty, A.; Parida, S.; Behera, R.K.; Roy, T. Vibration energy harvesting: A review. J. Adv. Dielectr. 2019, 9, 4. [Google Scholar] [CrossRef]
Figure 1. Horizontal large-scale bi-stable vibration-harvesting experimental equipment.
Machines 10 00899 g001
Figure 2. Measurement system for bi-stable vibration harvesting.
Machines 10 00899 g002
Figure 3. Experimental equipment for verification of bi-stable vibration harvesting system.
Machines 10 00899 g003
Figure 4. Analytical model and bi-stable vibration: (a) Bi-stable vibration model, (b) monostable vibration on right side, (c) monostable vibration on right side, and (d) bi-stable vibration.
Machines 10 00899 g004
Figure 5. Magnet and coil positioning and placement weight function W ( x ) for vibratory power generation.
Machines 10 00899 g005
Figure 6. The distribution of potential energy with displacement of mass block.
Machines 10 00899 g006
Figure 7. Measurement of flux density of magnetic field around coil.
Machines 10 00899 g007
Figure 8. Graphs of displacement based numerical analysis vs. time for confirming damping coefficient.
Machines 10 00899 g008
Figure 9. Graphs of voltage-based analysis voltage vs. time for confirming damping coefficient.
Machines 10 00899 g009
Figure 10. Measurement results yielded by random signal excitation.
Machines 10 00899 g010
Figure 11. Measurement results for 1.0 Hz periodic signal excitation.
Machines 10 00899 g011
Figure 12. Measurement results for 1.3 Hz periodic signal excitation.
Machines 10 00899 g012
Figure 13. Measurement results for 1.6 Hz periodic signal excitation.
Machines 10 00899 g013
Figure 14. Measurement results for 1.9 Hz periodic signal excitation.
Machines 10 00899 g014
Figure 15. Measurement results for 2.2 Hz periodic signal excitation.
Machines 10 00899 g015
Figure 16. Effect of periodic excitation signal frequency on vibration displacement.
Machines 10 00899 g016
Figure 17. Effect of periodic excitation signal frequency on vibration power generated.
Machines 10 00899 g017
Figure 18. Results based on co-excitation of random and 1.0 Hz periodic signals.
Machines 10 00899 g018
Figure 19. Results based on co-excitation of random and 1.3 Hz periodic signals.
Machines 10 00899 g019
Figure 20. Results based on co-excitation of random and 1.6 Hz periodic signals.
Machines 10 00899 g020
Figure 21. Results based on co-excitation of random and 1.9 Hz periodic signals.
Machines 10 00899 g021
Figure 22. Results based on co-excitation of random and 2.2 Hz periodic signals.
Machines 10 00899 g022
Figure 23. Comparison of S.D. displacements of random and period excitation.
Machines 10 00899 g023
Figure 24. Effect of periodic excitation frequency on power output.
Machines 10 00899 g024
Figure 25. Displacement measurement with and without magnet.
Machines 10 00899 g025
Figure 26. Effect of electromagnetic damping on vibration displacement.
Machines 10 00899 g026
Table 1. Settings of experimental system.
ItemDetailParameter
Mass blockweight910 g
Horizontal railLength350 mm
Width50 mm
Vertical distanceFrom rail to support base150 mm
Elastic springSpring coefficient157 N/m
Initial length180 mm
Permanent magnetLength40 mm
Width30 mm
Thickness15 mm
Surface magnetic flux density80 mT
Conductor coilFrame width50 mm
Frame height85 mm
number of coil turns150
Electric resistance30 Ω
Mini-ShakerSSV-105SAN ESU Co., Ltd.
General ShakerSSV-125SAN ESU Co., Ltd.
AmplifierSVA-ST-30, two channelsSAN ESU Co., Ltd.
Video recording informationVideo cameraGZ-E765, JVC Co., Ltd.
Frames per second (FPS)300
Dot per inch (DPI)1920 × 1080
Diameter of the marker10 mm
General function GeneratorNF-WF1973NF Corporation
Mini-function GeneratorJDS2800Hangzhou Measurement Instrumentation Co.
Data loggerGL2000Graphtec Co.
Marker tracking softwareMOVIS Neo V3.0NAC Image Technology Inc.
Publisher’s Note: MDPI stays neutral with regard to jurisdictional claims in published maps and institutional affiliations.

