Article

Political Signed Temporal Networks: A Deep Learning Approach

by
Alejandro Chinea Manrique de Lara
1,* and
Elka Korutcheva
1,2
1
Departamento de Fisica Fundamental, Facultad de Ciencias de la UNED, Paseo Senda del Rey n∘9, 28040 Madrid, Spain
2
G. Nadjakov Institute of Solid State Physics, Bulgarian Academy of Sciences, 72, Tzarigradsko Chaussee, Blvd., 1784 Sofia, Bulgaria
*
Author to whom correspondence should be addressed.
Axioms 2022, 11(9), 464; https://doi.org/10.3390/axioms11090464
Submission received: 31 July 2022 / Revised: 1 September 2022 / Accepted: 2 September 2022 / Published: 8 September 2022

Abstract

:
The evolution analysis of networks whose links are either positive or negative, representing opposite relationships such as friendship and enmity, has been revealed to be particularly useful in sociological contexts. Using a large relational dataset containing the last two centuries of state-wise geopolitical information (the correlates of war–alliance conflicts), a machine learning approach is presented to predict network dynamics. The combination of geometric as well as information–theoretic measures to characterize the resulting discrete time series together with the power of deep learning machines is used to generate a model whose predictions are even accurate on the few days in two centuries of international relations when the typical value (i.e., Alliance or Neutral) changed to a war or a conflict. In other words, the model can predict the next state of the network with a probability of error close to zero.
MSC:
34D45; 37M10; 62M10; 37N40; 62B10; 68T05; 68T10

1. Introduction

Time evolving networks are currently one of the subjects of active research in the field of complex networks. The increasing availability of large relational datasets during the last decades has favored a widely extended study of complex networks [1,2,3], represented as a set of relationships/links between pairs of actors/nodes. The qualified term complex is given to those graphs whose topology departs from the regularity of classical lattices. This complex architecture, with properties, such as scale invariance and high clustering, is found in real networks from a variety of fields [4] such as biology and medicine in the context of biological temporal networks, which describes the mechanisms and evolution of the cellular functions and their resistance to stimuli [5], deterministic/stochastic model of epidemic spreading on temporal networks [6,7], symptom networks in cancer diseases [8], blockchain implementation [9], wireless intelligent control in healthcare [10], or psychology in the context of the construction of temporal networks models that examine directionality between symptoms over time [11].
While static network topologies are now well understood, time-evolving networks are still the subject of active research [12,13,14,15,16,17]. One important problem is that of link prediction, which is the prediction of the next state of the network, which has a direct interest in applications. Indeed, the study of temporal network evolution can identify the relevant mechanisms that drive network dynamics. Link prediction methods are essentially related to social networks, where rapid social network growth is related to link prediction analysis such as dynamic network, weighted network, heterogeneous network, cross-network, and so on [18]. Recommender systems and link prediction techniques have also been widely used in areas such as online information filtering and improving user retrieval [19]. In addition, graph embedding for link prediction, which effectively preserves the network structure and converts node information into a low-dimensional vector space, has been recently proposed [20]. An interesting application of these methods is the prediction in criminal networks, such as the case study of the Sicilian Mafia [21], where an original dataset extracted from judicial documents of the Italian law enforcement agencies against Individuals affiliated with the Sicilian Mafia has been used.
Signed networks constitute the simplest multilayer networks [22]. Here, positive–negative links are used to represent two opposite relationship types, such as activation–inhibition, friendship–enmity, or alliance–conflict [23,24,25]. The study of signed networks is especially relevant in sociological contexts where it leads to the notion of Structural Balance: For example, establishing notions of weak and strong balance and comparing their performance on a range of tasks [26] have a direct application in sociology and psychology in the study of how signed networks move towards and away from the balance at different points over time [27].
The study of international relations over time as an analysis of network evolution for alliance, war, and relation graphs by considering the roles of individual nodes, structural motifs, and graph-level communities permits to support of many historical results of how countries interact. Research has been performed by previous authors using different datasets, including Correlates of War data, by applying pre-specified signed block modeling to characterize the structure of the network [28]. Structural balance theory is very useful by pointing to the more important study of how signed networks move towards and away from the balance at different points over time.
The evolution of political networks has also been modeled by spectral transformation on the signed graph Laplacian [29,30] or using statistical physics approaches [31]. Unfortunately, none of these works can reproduce with enough precision empirical signed networks. Results have been obtained in the context of political corruption networks [32], political parties [33], the European Parliament [34], and the US Congress [25]. In the latter case, signed networks of political collaboration and opposition are analyzed to identify the members of polarized coalitions in the US Congress to use these coalitions to examine the impact of polarization on effectiveness in passing bills.
Recent research results in the field [28,35] have pointed out that temporal predictability of political networks is harder compared to their topological-temporal predictability suggesting the need for more accurate predictive algorithms, especially for conflictual events [36]. Applying measures of predictability to detect the changing points of temporal networks and investigating the impact of predictability on dynamical processes and control on temporal networks, in general, are challenges that need to be resolved.
The purpose of this paper is to investigate whether deep learning machines can learn the link state prediction problem with enough accuracy. The outline of the paper is as follows. We first present the general steps of the approach and its theoretical foundations. Particularly how the network state prediction problem can be re-casted in terms of a classification problem, and especially how the model selection procedure is carried out based on the theory of dynamical systems [37,38]. Section 3 is focused on the presentation of the geometrical and information-theoretic measures and their interpretation. Then, in Section 4, the model selection procedure based on deep networks is presented together with results derived from the approach. Section 5 is devoted to discussing the drawbacks and advantages of the approach. Specifically, the fact of considering pairwise relationships between countries rather than global patterns together with the influence of the under-represented samples in the predictive power of the model. Furthermore, the influence of historical events is also discussed within the context of international signed relations. Finally, a summary of the present study and some concluding remarks are provided in Section 6.

2. Proposed Approach

The link state prediction problem basically consists of predicting the next state of every single link associated with the entire set of nodes comprising the structure of the network. The motivation of this problem is principally due to the interest not only in understanding the relevant mechanisms that drive network dynamics for its strong implications with the theory of structural balance [26,39], that is, the theoretical approach that has been traditionally used to study international relations, but especially because of the fact that current state of the art approaches [28,35] agree that their temporal predictability is harder compared to their topological-temporal predictability suggesting the need of more accurate predictive algorithms. This work focuses on predictive analysis of the individual time series associated with every single link of the international network of signed relations extracted from the correlates of war projects [40], that is, a large relational database containing the last two centuries of state-wise geopolitical information. Therefore, countries are only considered pairwise.

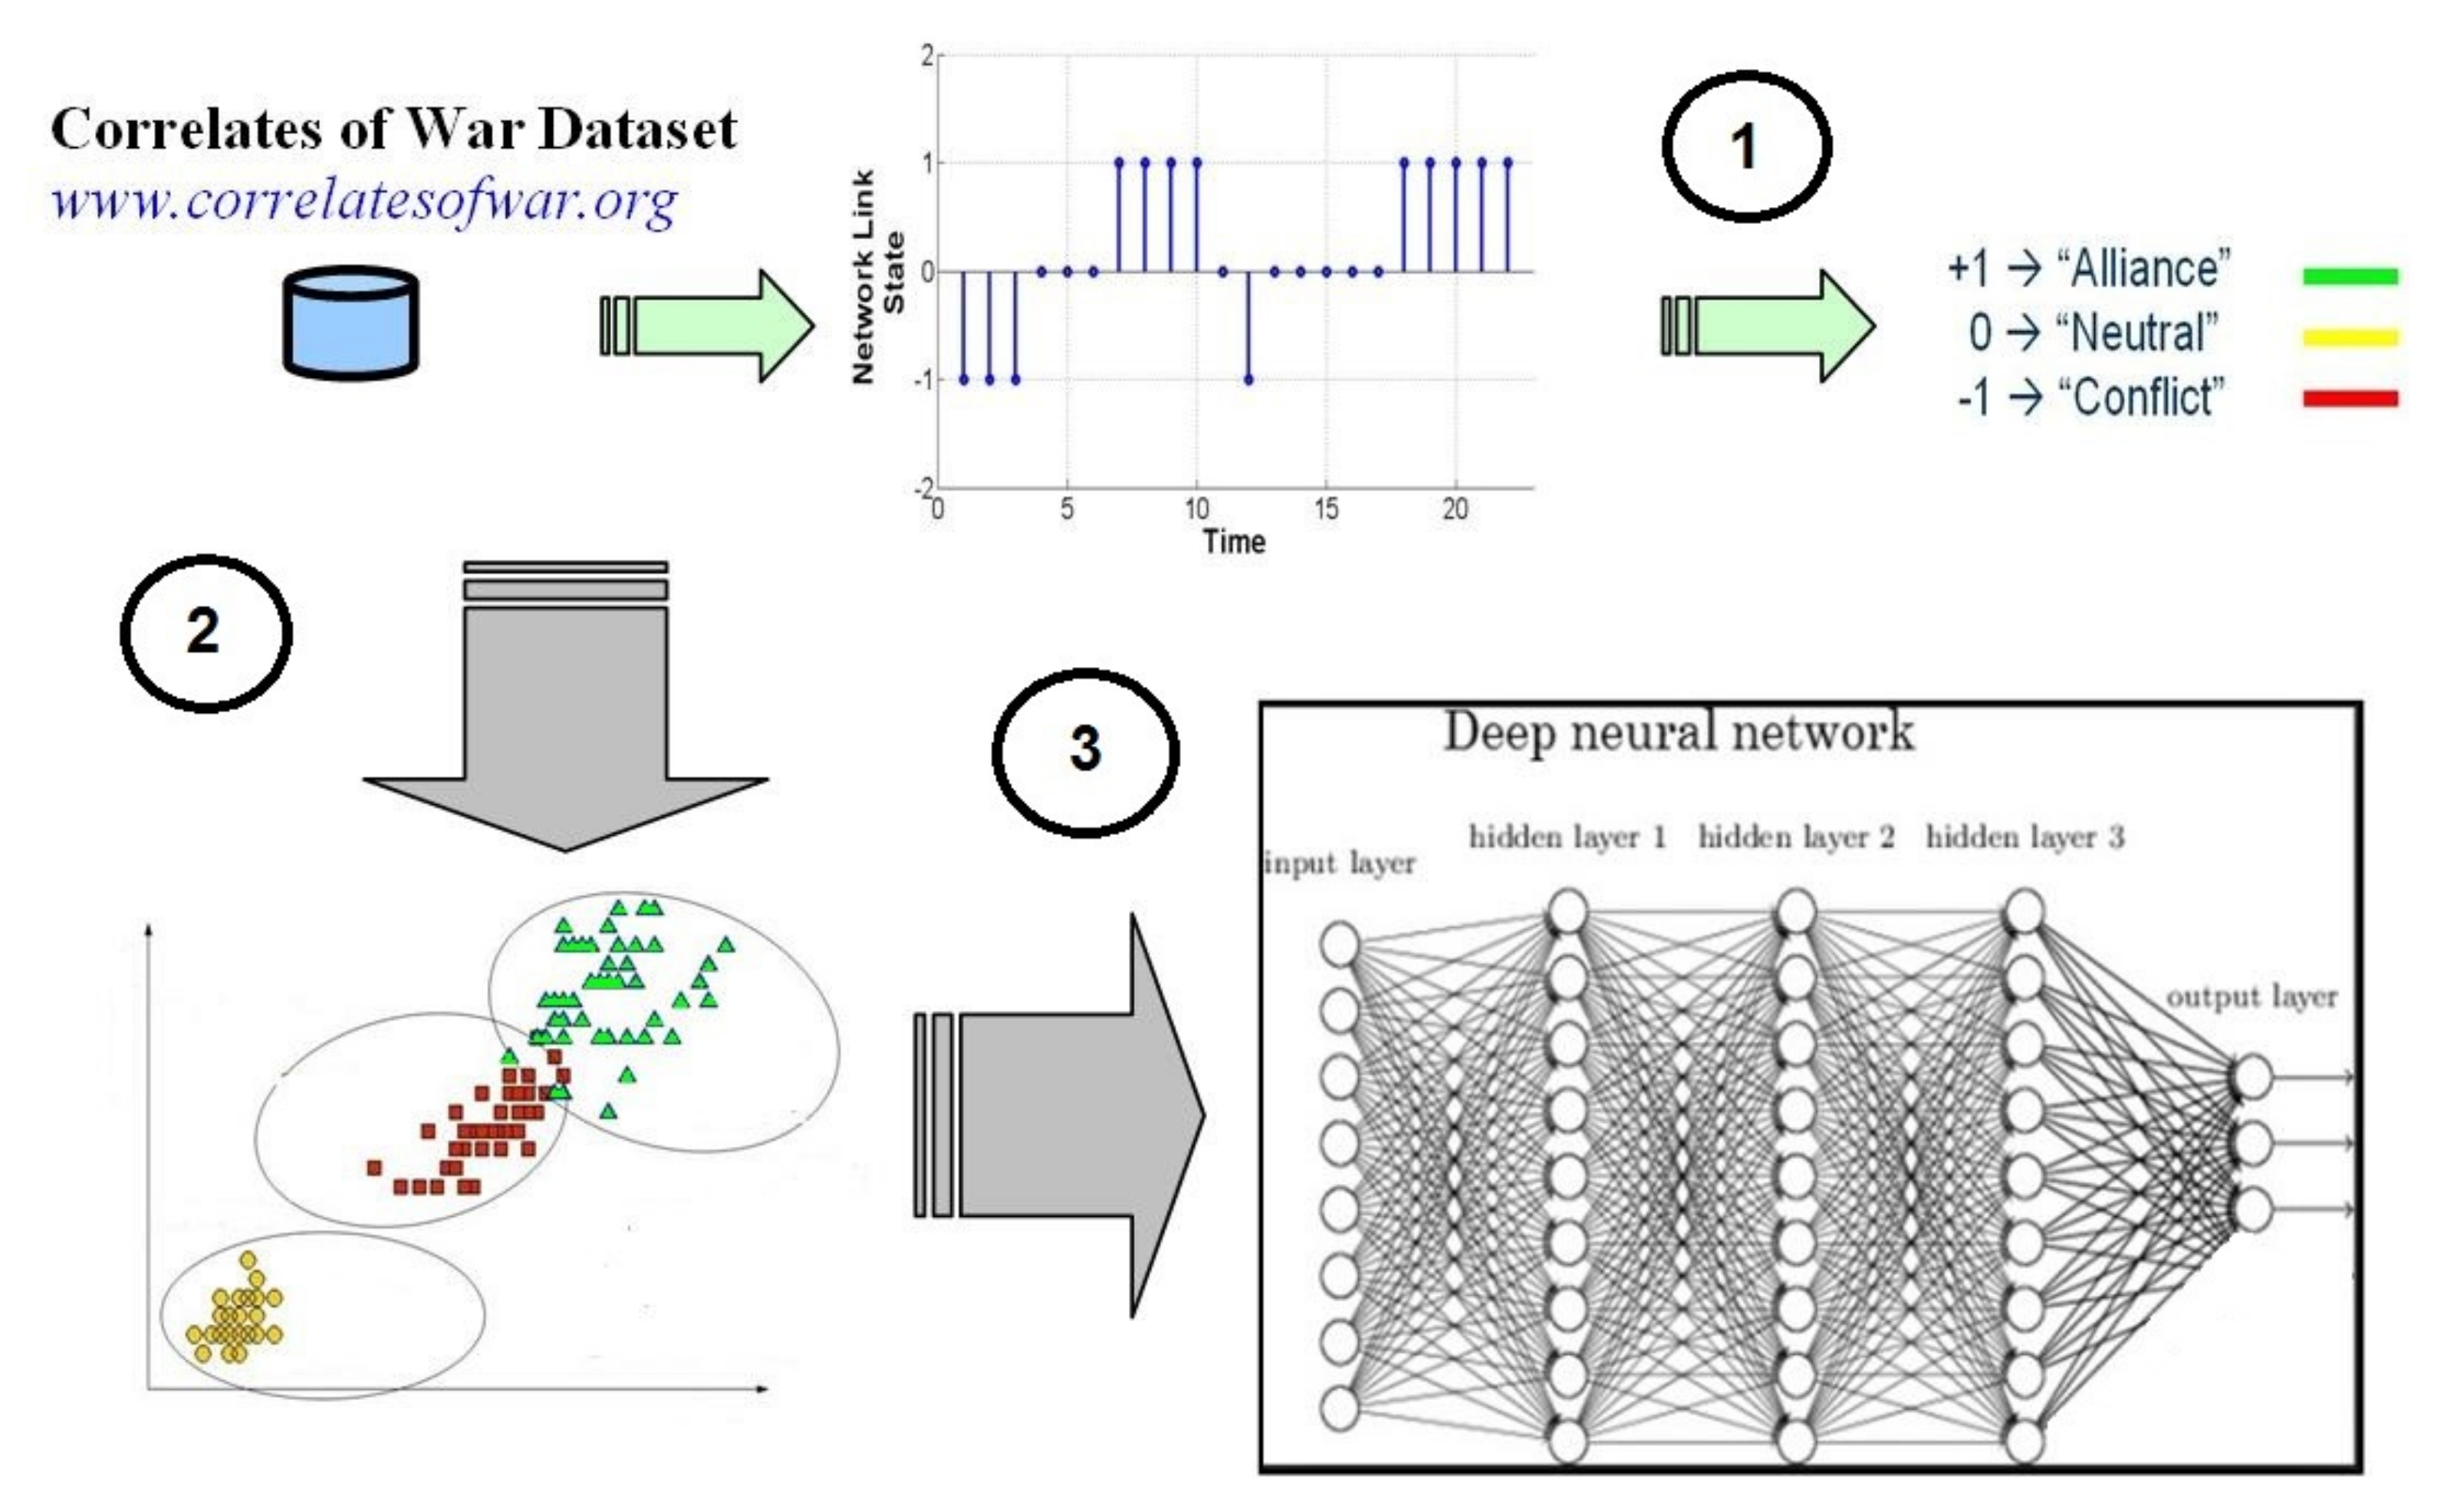
2.1. Theoretical Background and Main Steps of the Approach

From a theoretical point of view, the network of international relations can be seen as a discrete-time dynamical system whose only available information is contained within the set of discrete time series associated with the links of the network (the observables of the system). Accordingly, the pillars of the approach (yet to be presented) are grounded on two facts: Firstly, the embedding theorem [41] that is a fundamental result in dynamic reconstruction theory that provides the conditions under the phase space of a dynamical system can be reconstructed from the information contained in a time series obtained from measurements on one of the observables of the system. Secondly, the fact that the information about the features of the phase space of the dynamical system (i.e., the network of international signed relations) is shared and, at the same time, embedded in the temporal evolution of any of the links that model the pairwise relationships between countries.
Thus, if one can extract such information from the temporal evolution of any given link (a single observable of the dynamical system), hopefully, such information might be used to predict the next state of any other link of the network. In other words, global patterns going beyond pairwise relationships are not considered, firstly, because our goal here is to generate a simple model as much as possible but at the same time able to reproduce with enough precision the temporal evolution of political international relations between countries. Secondly, because of the reasons stated before, that is, the idea that the features of the phase space of the network of international signed relations are shared and embedded within the individual time series associated with the network links. Furthermore, achieving a model with good accuracy at the local level (i.e., predicting the next state of network links) may be used as a starting point to develop more complex models to understand patterns at regional and/or global levels in these kinds of temporal networks [28].
Bearing in mind the considerations stated above, the approach is conceived in three steps (see Figure 1): Firstly, using the public correlates of the war dataset [40], the network state prediction problem is re-casted in terms of a supervised learning classification problem. Specifically, each node of the network graph represents a country, and the time-evolving values of its links describe the political relationship between countries. Namely, alliance (or friendship) relationships (i.e., discrete value +1), conflict (or enmity) relationships (i.e., discrete value −1), and neutral relationships (discrete value 0). It is important to note that a conflict does not mean strictly a “War” between the countries involved, a conflict may be simply a political tension (e.g., a diplomacy incident, an increase in taxes for certain products imported by one of those countries, and so forth).
Secondly, the dynamics of every single link of the network graph are represented in terms of a discrete time series whose values represent the state of the link at any given instant of time. Geometric and information-theoretic measures (yet to be described) are used to characterize the complexity of the discrete time series, the resulting datasets, and to help with the model selection procedure. Finally, Deep learning machines (the model) [42,43] are used to learn the categories representing the state of network links to predict the next state of the network (one step ahead prediction).
Taking these considerations into account and to show the suitability of the approach, we focus the analysis hereafter (without a loss of generality) on a subset of four nodes of the entire signed network corresponding to the countries of England, France, Spain, and the United States of America.

2.2. The Correlates of War Data

The Correlates of War project (CoW project hereafter) is explained, [40] where an overview of the war typology, the description of the basic variables, and coding rules are provided. The database covers the period ranging from 1816 to 2007, and it reflects the evolution of the network of international signed relations. This dataset encompasses wars and/or conflicts that took place between or among the recognized countries, that is, states that possess the status of a territorial entity. Furthermore, in the aforementioned dataset, positive ties between countries are assigned with a numerical value equal to +1, whereas negative ties are assigned with a value −1.
Moreover, positive ties are defined by joint memberships in alliances, being in unions of countries, and/or sharing inter-governmental agreements. In contrast, negative ties are used to describe two countries being at war or in conflict with each other without military involvement, being involved in border disputes, or having sharp ideological or policy disagreements [28].
This network, as expected, changes over time. For example, in 1946 the network was composed of only 64 nodes (i.e., countries) and 362 links: 320 Alliance links (positive ties with assigned value equal to +1) and 42 Conflict links (negative ties with assigned value equal to −1). Surprisingly, in 1990 the number of countries in the network had increased up to 155, and the network was composed of a total of 1288 links, specifically, 1160 positive ties and 128 negative ties. For example, certain countries, such as USA and USSR, or China and North Korea, are involved in an unusually large number of negative ties with other countries.
Finally, it is important to note that in our study, as in others, to build the discrete time series associated with each link of the network, the absence of information in the CoW database during certain periods of time of the signed relations (not a positive tie nor a negative tie) is treated by the category Neutral, with an assigned numerical value equal to zero.

3. Geometric and Information-Theoretic Measures

Let us suppose a dataset D N composed of N patterns belonging to a space dimension d. Furthermore, it is assumed that each sample of the dataset belongs to a category w i where i = 1 , 2 , , C . In other words, there are C different pattern categories (or classes) defined in the input space. If the input variables x i are grouped into a vector x = ( x 1 , x 2 , x 3 , , x d ) , the dataset can be formally defined as a set of vectors x k in d dimensions where 1 k N , where each pattern belongs to one of the categories defined in the input space, x k D N the category of a pattern x k is represented using the notation c l a s s ( x k ) = w i where 1 i C .

3.1. Inertias

Inertia [44] is a classical measure for the variance of high-dimensional data. Three types of inertia can be distinguished, namely, global inertia ( I G ), within-class inertia ( I W ), and between-class inertia ( I B ):
I G = 1 N n = 1 N x n 2
I w i = 1 N i l = 1 N i x l g i 2 x l | c l a s s ( x l ) = w i
I W = 1 N i = 1 C N i I w i
I B = 1 N i = 1 C N i g i 2
where . 2 is the square of the Euclidean norm: x = x x t , and the coefficients g i = 1 N i n = 1 N i x n represent the centers of gravity of category i, where 1 i C . Global inertia I G (1) is computed over the entire dataset. In contrast, within-class inertia I W (see expressions (2) and (3)) is the weighted sum of the inertia computed on each category where w i , where the weighting is the a priori probability of each category ( N i is representing the number of patterns belonging to category w i ). Between-class inertia I B (4) is computed on the centers of gravity of each category. They are typically used to characterize the variance of high-dimensional data [44].
Within the context of this study, inertias are used hereafter simply as a part of the definition of the geometrical measures presented in the next section.

3.2. Dispersion and Fisher Criterion

Generally speaking, in a supervised classification problem, classification performance depends on the discrimination power of the features, that is to say, the set of input dimensions that compose the patterns of the dataset. Dispersion and the Fisher criterion are two measures [44] for the discrimination between classes (categories defined in the input space). The overlapping rate between categories is measured by the Fisher criterion and is defined as the quotient between the between-class inertia ( I B ) and the within-class inertia ( I W ) (see expression (5)). In addition, a simple measure for the dispersion between categories is the mean dispersion of category w i in category w j defined in expression (6)). It is important to note that the dispersion matrix is not symmetric.
F C = I B I W
D i s p e r s i o n ( i , j ) = g i g j I w j 1 i , j C
As it can be deduced, the discrimination is better if the Fisher criterion is large. Similarly, if the dispersion measure (6) between two categories is large, then these categories are well separated, and the between-category distance is larger than the mean dispersion of the classes. Furthermore, if this measure is close to or lower than one, the categories are highly overlapped. To apply the Fisher criterion and dispersion measures, the dataset is normally pre-processed using a linear re-scaling [45] to arrange all the input dimensions to have similar values. In addition, it is important to note that a high degree of overlap between two categories does not necessarily imply significant confusion between them from the classification point of view. For instance, that is the case for multi-modal or very elongated categories.
Having said this, it is important to note that the methodology used to generate the datasets associated with every single network link basically consists of the following: a window containing a number of data points equal to λ is displaced from the first data point till arriving to the last but one point of the discrete time series, where λ represents the number of delayed signals used as regressors to model the dynamics of the time series (the calculation of λ is described in Section 4.1). Specifically, at each window displacement step, the features of each pattern are composed of the data points under the window, and its target is the category represented by the next data point found after the window.
Thus, a dataset D N with a total of N = L λ + 1 patterns in a dimension equal to λ is generated, being L the number of data points of the discrete time series. It is important to remember that the categories of the patterns belonging to the aforementioned datasets are those corresponding to the possible states of the links, that is, Alliance, Neutral, and Conflict. For example, the dataset associated to the link France–Spain contains 62,206 patterns ( N = 62,206) in dimension 16,499 ( d = 16,499), the corresponding dataset to the link England–Spain contains 63,203 patterns in dimension 14,219, and so forth.
Table 1 shows the a priori probabilities of each category for the datasets associated with the network links under consideration. It is important to note that the category Conflict as expected is under-represented in the whole dataset. Specifically, the number of patterns associated with this category ranges from one up to three orders of magnitude lower (network link France–Spain) compared to the rest of the categories, thus, potentially affecting the performance of any machine learning classifier. It is important to note that the interest here is to explore the possibility of generating a predictive model able to be correct in the few days where the state of a link changed to a Conflict as in most of the cases the state of a link will remain the same from one day to the next with a high probability (e.g., state of Alliance or Neutral). Furthermore, to avoid the bias imposed by the pattern generation procedure, a random shuffle of the rows of the matrix representing each dataset was performed in a number of steps big enough to avoid the aforementioned bias.
Moreover, applying the Fisher criterion to the datasets associated to the four links under study the following values were obtained: F C S P - - F R = 0.3418 , F C S P - - U K = 0.4744 , F C U K - - F R = 0.2087 , and F C U K - - U S A = 1.4286 for the link England–USA. Thus, indicating a high degree of overlap between the patterns for all the links under study except for the link England–USA. This fact is of particular interest taking into consideration the high dimension of the patterns associated to the considered datasets (e.g., d = 16,499 for the link France–Spain, d = 14,219 for the link Spain–England, d = 9181 for the link England–France, and d = 6408 for the link England–USA).
The dispersion matrix for the link France–Spain is shown below:
D F r a n c e S p a i n = 0 0.0566 0.0874 4.4028 0 0.0753 6.6242 0.0734 0
The first dimension of the matrix corresponds to the category Conflict, whereas dimension two and three correspond to the categories Neutral, and Alliance, respectively. Of particular interest is the fact that the dispersion between the categories Alliance–Conflict is almost two orders of magnitude larger (remember that the dispersion is not commutative) compared to the dispersion Conflict–Alliance, indicating that the average distance of the patterns belonging to the category Alliance to its center of gravity is larger compared to those of category Conflict. In other words, the dispersion of the patterns belonging to the category Alliance is larger compared to those belonging to the category Conflict. Independently of those facts, the dispersion matrix suggests a high degree of overlap between the categories defined in the classification problem, and this is not surprising if one takes into account that the state of a link may remain constant for several years.
Similarly, the dispersion matrices for the network links England–Spain and England–USA are shown below:
D E n g l a n d - - S p a i n = 0 0.0349 0.0712 0.2162 0 0.0601 0.4209 0.0575 0
D E n g l a n d - - U S A = 0 0.0307 0.0890 0.1503 0 0.0945 0.5266 0.1142 0
As occurred before (i.e., link France–Spain) the dispersion between the categories Alliance–Conflict is larger compared to the dispersion Conflict–Alliance (one order of magnitude larger in this case), indicating that the dispersion of the patterns belonging to the category Alliance is larger compared to those of the category Conflict. This fact appears to suggest that the mechanism (or strategies) used by countries to generate alliances are, in general, more complex (i.e., there are more possibilities) compared to those mechanisms leading to a conflict, and thus, it would permit one to speculate with the possibility that the transitions from a state of Alliance to a state of Conflict would be easier to detect compared to the opposite transitions (lower dispersion value).
Independently of those facts, the dispersion matrices suggest a high degree of overlap between the categories defined in the classification problem. Of particular interest is the fact that the dispersion of the category Neutral with respect to the category Alliance is one order of magnitude larger in the dispersion matrix corresponding to the link England–USA compared to the rest of matrices considering this fact is responsible for a value of the Fisher criterion, which is slightly larger for this dataset.

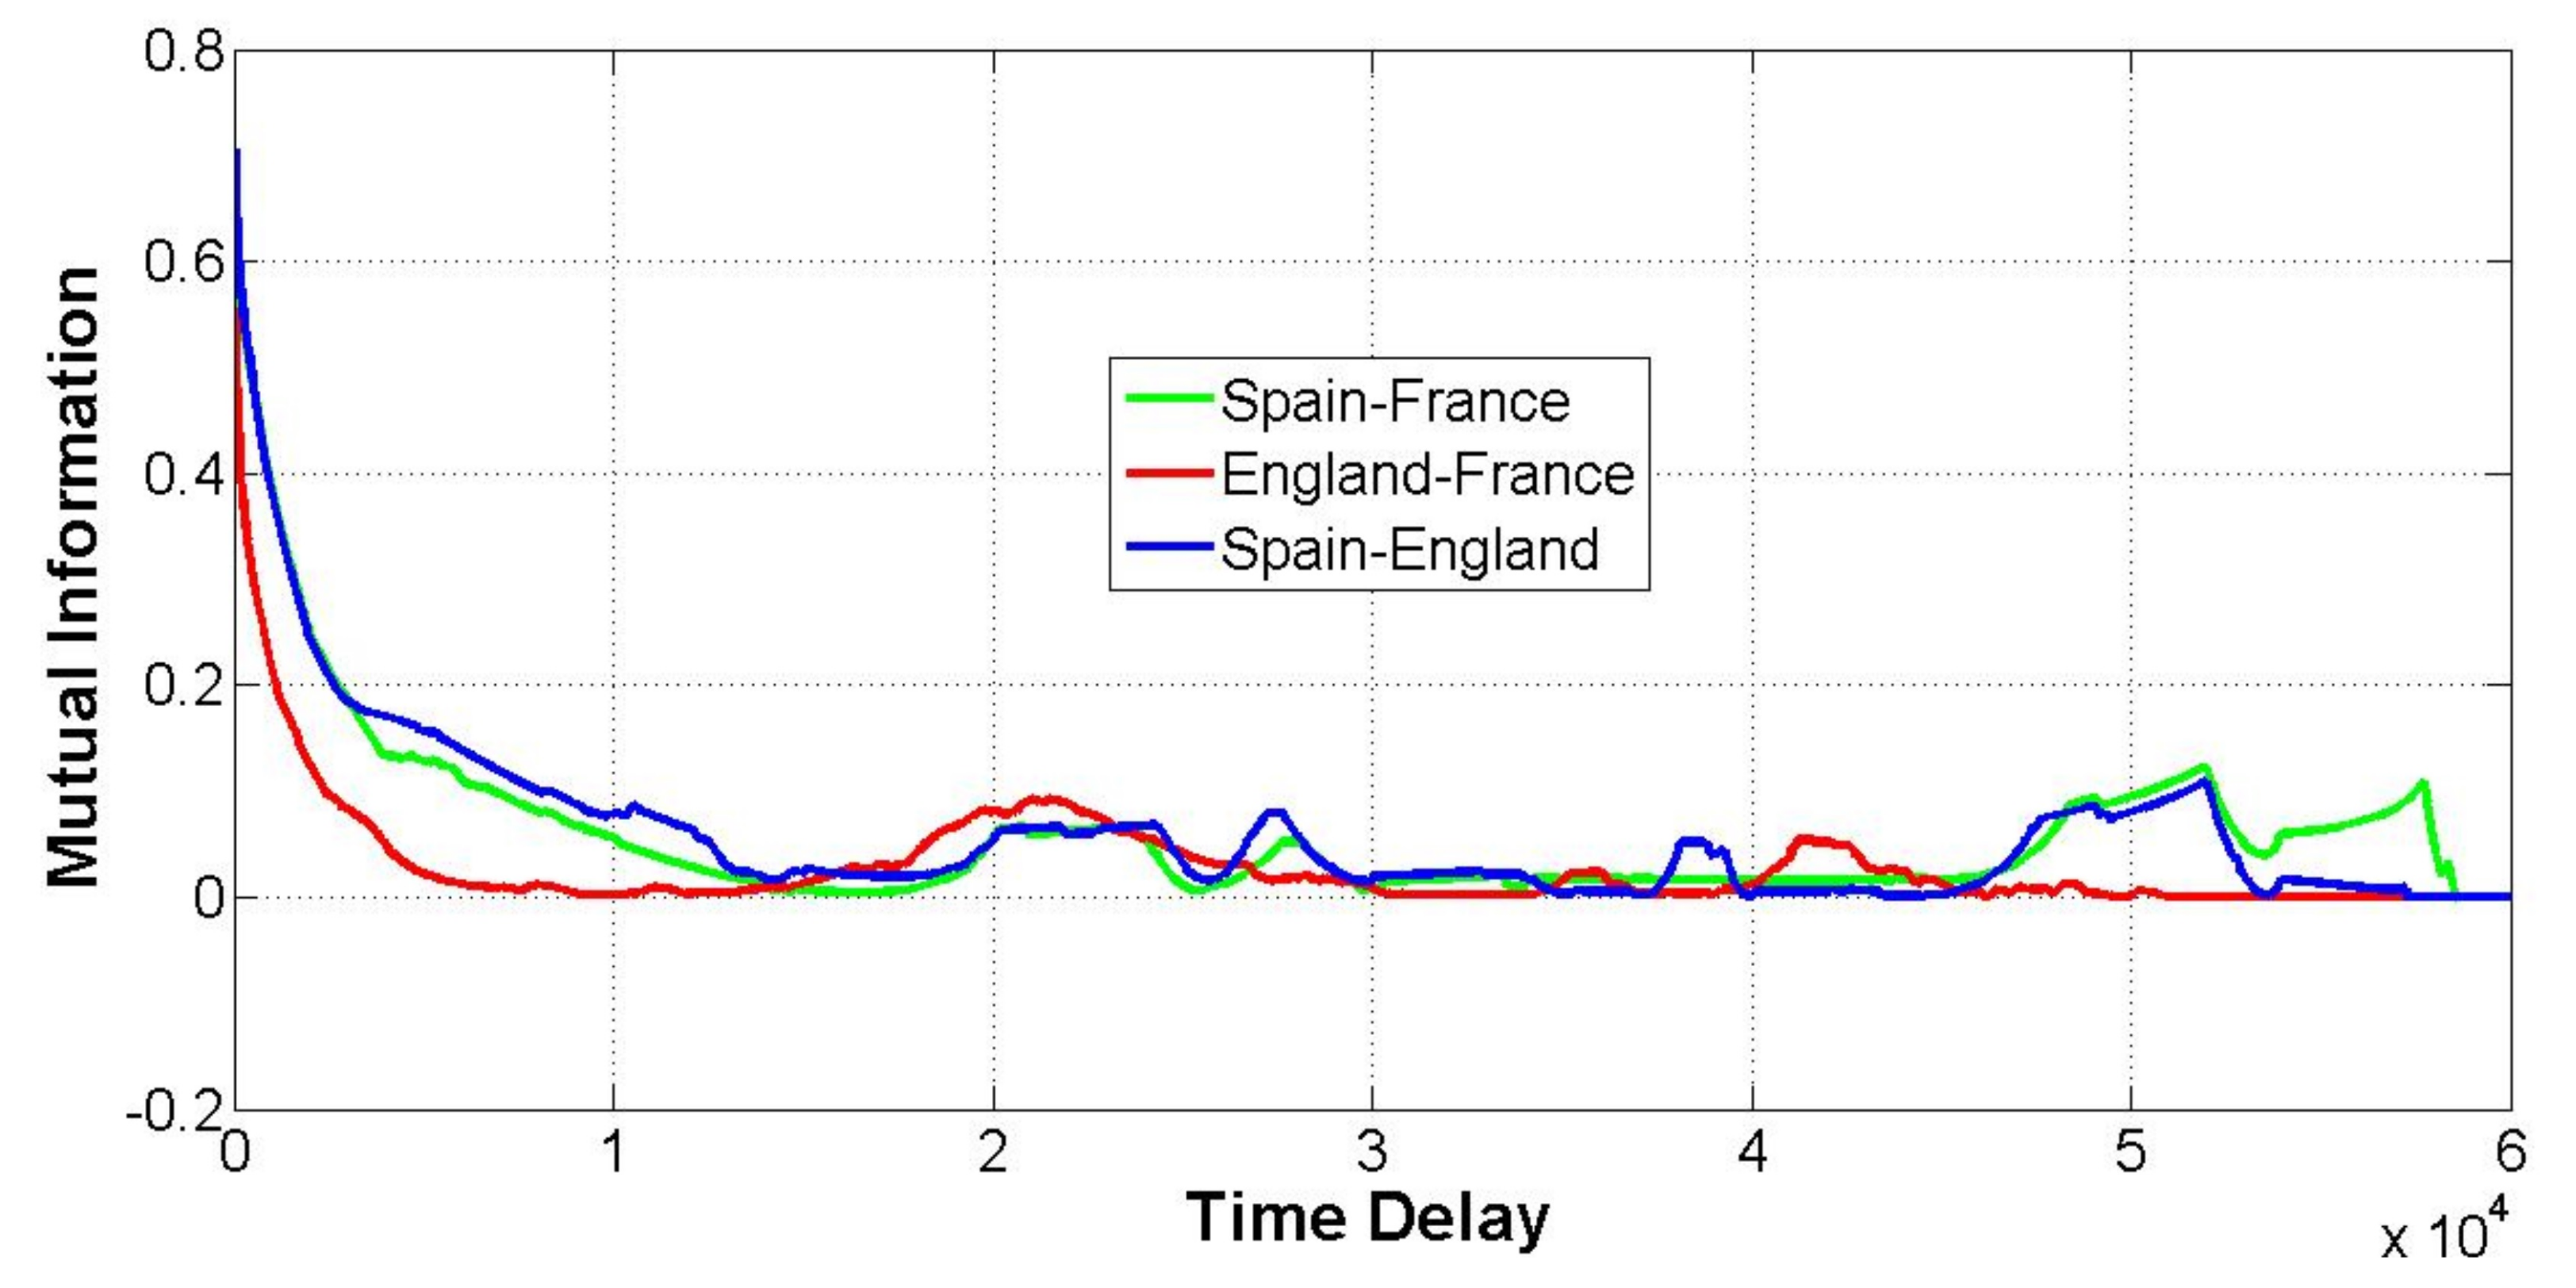
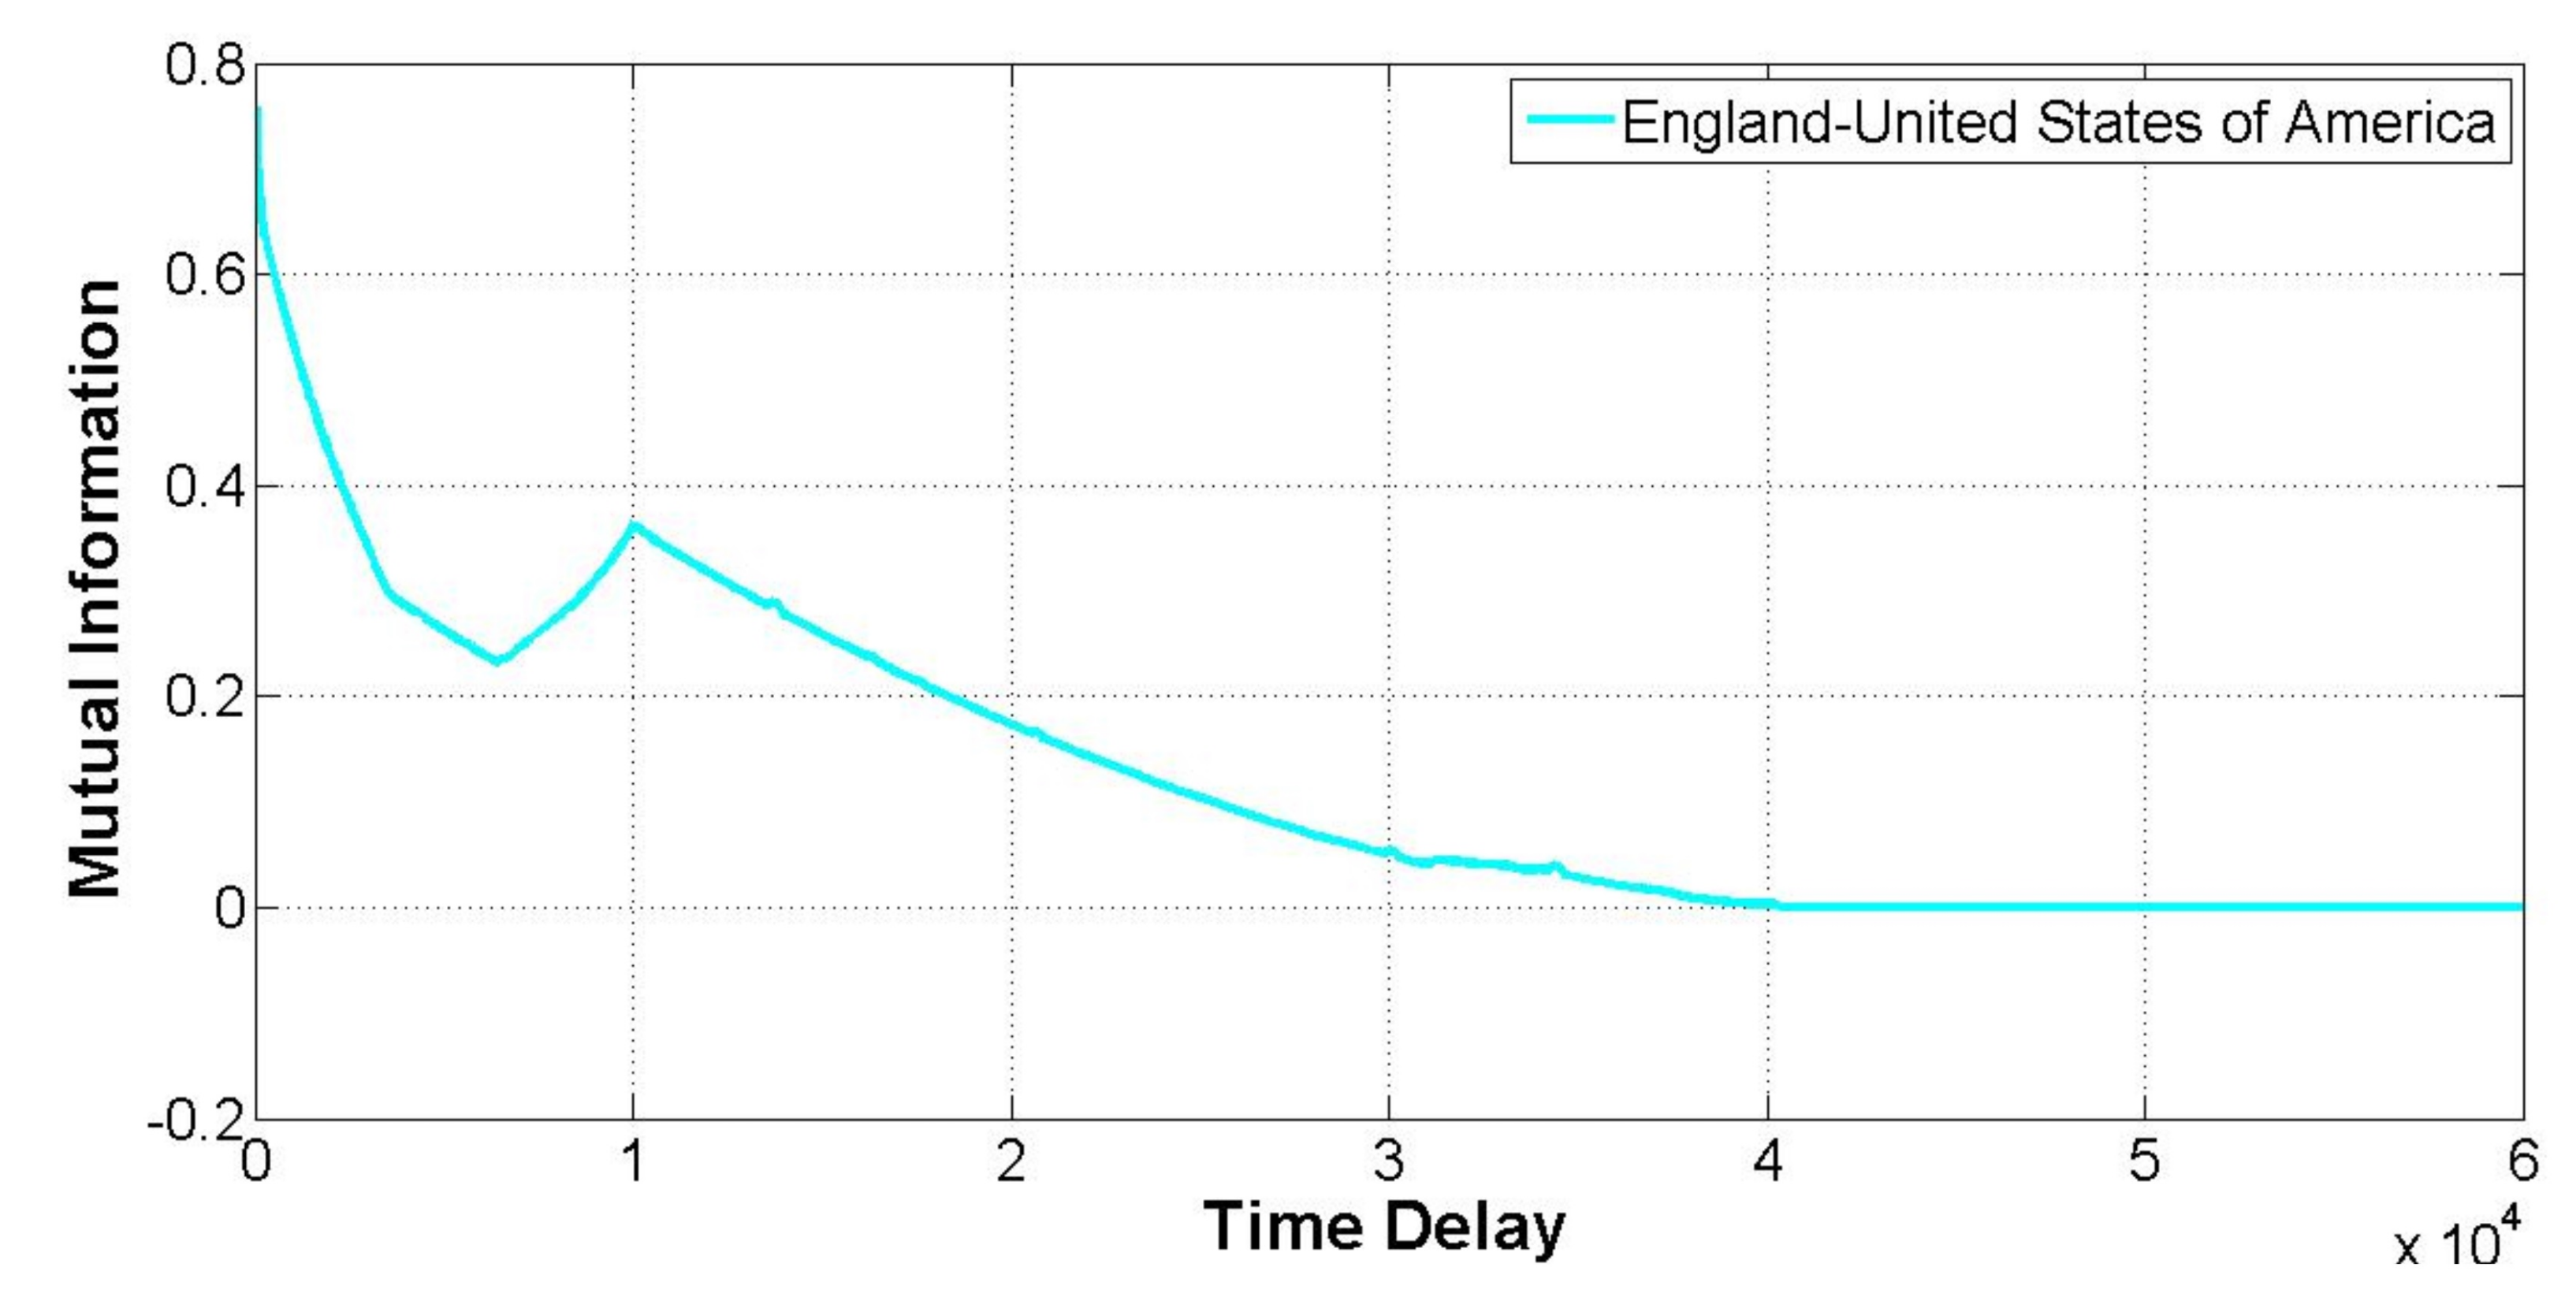
3.3. Mutual Information

The mutual information of two random variables [46] x and y, I ( x , y ) is defined in terms of the entropy as I ( x , y ) = S ( x ) + S ( y ) S ( x , y ) , and is interpreted as the reduction in the uncertainty about the random variable x as a consequence of the new observation of random variable y. The mutual information I ( x , y ) is zero if and only if the random variables x and y are statistically independent. Furthermore, one of the most interesting characteristics of mutual information is that it permits the detection of nonlinear correlations between the variables involved.
Figure 2 represents the time delayed mutual information [47] from the discrete time series representing the evolution of the political relationships between Spain, France, and England using the database containing the last two centuries (i.e., covering the period from 1816 up to 2007) of state-wise geopolitical information of those countries included in the Correlates of War Project [40]. The time-delayed mutual information was computed using the nonlinear time series analysis software package presented in [48]. Furthermore, the unit of time employed in the graphs are days (see also Figure 3 which contains the graph representing the link England–USA).
In the following, these graphs are used to determine the number of regressors needed to reconstruct the dynamics of the nonlinear systems that generated the data.

4. Deep Networks

This section aims to introduce the model structure selection procedure used to identify the nonlinear dynamical systems driving link dynamics. Selecting a model structure in a time-dependent predictive model using deep networks implies selecting the number of delayed signals used as regressors (i.e., the number of inputs of the network) and specifying how to combine those regressors into a one-step ahead prediction (i.e., the architecture of the deep network). The qualifier lag space is used hereafter to denote the number of delayed signals used as regressors [49].

4.1. The Optimal Number of Regressors

Selecting the appropriate number of regressors is crucial to developing a good predictive model. A wrong choice of lag space may have a disastrous impact on the predictive model. Too small obviously implies that essential dynamics of the nonlinear system will not be modeled, but too large can also be a problem, for example, due to the computational complexity (e.g., memory requirements and/or training times for the case of deep networks) [49]. The optimal choice for the lag space λ is that value of λ that makes the discrete time series y ( n ) and its delayed version y ( n λ ) independent, that is, having no correlation with each other. It is important to remember that the mutual information is zero if and only if the input and output of the system are statistically independent. This requirement is best satisfied by using the particular λ for which the mutual information between y ( n ) and y ( n λ ) attains its first minimum [47].
Taking these considerations into account the optimal lag space for the time series France–Spain, England–Spain, England–France, and England–USA was computed leading respectively to the values λ F r a n c e - - S p a i n = 16,499 days, that is, approximately 45 years, λ E n g l a n d - - S p a i n = 14,219 days (39 years), λ E n g l a n d - - F r a n c e = 9181 days (25 years), and λ E n g l a n d - - U S A = 6408 days (16 years). In other words, the datasets to be learned by the machine learning classifier were generated using this information.
Denoting as L the length of the discrete time series, the patterns of the datasets are generated by displacing a window containing a number of data points equal to the lag space λ from the first data point until arriving at the end of the time series to generate a dataset D N with a total of N = L λ + 1 patterns in a dimension equal to λ . For example, the dataset associated to the link France–Spain contains 62,206 patterns in dimension 16,499, the corresponding dataset to the link England–Spain contains 63,203 patterns in dimension 14,219, and so forth. Furthermore, to avoid the bias imposed by the pattern generation procedure, a random shuffle of the rows of the matrix representing each dataset was performed in a number of steps big enough (i.e., the length of the random walk) to avoid the aforementioned bias.

4.2. Deep Networks Structure

The architecture of the deep learning machines was selected according to the theory presented in [50,51]. Specifically, the criterion used was roughly to fix a number of neurons big enough to ensure that the overparameterization condition was largely fulfilled (i.e., W N ) for the entire set of learning datasets, afterward selecting those networks attaining larger entropy values for those links with associated datasets leading to lower values of the Fisher criterion. To this end deep learning machines with a hierarchical structure composed of 756 units, and five hidden layers were used with the following architectures: 293 × 248 × 143 × 51 × 18 × 3 for the link France–Spain, 292 × 239 × 150 × 53 × 19 × 3 for the link England–Spain, and finally 281 × 280 × 134 × 43 × 15 × 3 for the link England–France. The three units that are present at the output of the networks implement a 1-to-c coding [45], where c represents the number of categories defined in the input space, that is, three in our case.

4.3. Results from the Deep Learning Approach

Table 2 shows the results of the one step ahead link state prediction problem. Specifically, the table shows the probability of error of the model associated with each of the defined categories in the supervised learning problem (i.e., the possible states of network links: Alliance, Neutral, and Conflict). Deep learning machines were used with a total of 756 units with a hierarchical topology, and the set of architectures described in the previous section. The networks were trained 1000 Epochs with the scaled conjugate gradients algorithm [45,52]. The generalization capability of the networks was validated using a statistical ten-fold cross-validation procedure [53] obtaining the probabilities of error that are shown in the table.
It is important to remember that the goal is to generate a predictive model able to reproduce with enough precision the dynamics of the links. This is equivalent to developing a predictive model being right on the few days in 200 years of state-wise geopolitical information (see Table 1) when the typical relationship (i.e., Alliance or Neutral) changed to a war or a conflict (i.e., category Conflict) as in most cases the state of the link will remain at the same state as it was today. That is the reason to show the probability of error of the model associated with each category to show the goodness of the model at predicting those big events.
The most important fact is that the predictive models are obtained with a probability of error close to zero, including those events leading to a conflict except for the link France-Spain although this is due to the extremely low number of samples belonging to the category Conflict, that is, only 10 days of conflict in 200 years compared for example to 891 days of conflict for the link England–USA (see Table 1). These kinds of nodes are scarce from the point of view of the dynamics of international signed relations, that is, countries that are neighbors and have no conflicts, at least within the period of time covered by the correlates of war database.
Moreover, of particular interest is also the fact that predictive models obtained using lower learning times (200 Epochs) lead to probabilities of error close to zero with respect to the categories well represented in the datasets (Alliance and Neutral categories). However, they are unable to predict those big events mentioned before (i.e., patterns belonging to the category Conflict). Independently of those facts, we can conclude that the proposed methodology can reproduce with enough precision empirical signed networks time series. More specifically, for each category, an accurate indicator of the predictions of the model can be obtained by averaging the probabilities of error associated with the subset of nodes considered in Table 2. Thus, for the category Alliance the model produce on average 1 error each 10,000 predictions. Similarly, for the category Neutral 5 errors are obtained on average each 10,000 predictions. Finally, for the category Conflict, excluding the link France–Spain for the reasons explained above the predictive model produces approximately 84 errors each 10,000 predictions.
Having said this, with respect to the time of the training procedure it is important to note that, as expected, it is computationally expensive principally due to the dimensionality of the samples. For example, the ten-fold cross-validation procedure (i.e., each fold comprises a learning and test phase) for the links France–Spain, and England–United States of America took 80 and 37 days, respectively, using a computer with 4 GB of RAM with a dual-core Intel Celeron CPU at 1.6 GHz, and using Windows 10 as the operating system. For the links England–France and England–Spain, the time of the cross-validation procedure was reduced to 11 and 12 days, respectively, using a computer with 12 GB of RAM with an iCore 7 Intel CPU (first Generation) at 2.66 GHz. Furthermore, those times were further reduced to the range of a few days using a computer running windows with 8 GB of RAM with an Intel iCore 5 CPU (eleventh Generation) at 2.4 GHz. For example, the time of the cross-validation procedure for the link England–Spain took only 5 days.
Finally, it is important to emphasize that the lag space can be interpreted as the memory of the underlying stochastic process driving link dynamics, and the values obtained are huge, for instance, λ = 45 years for the link France–Spain, or λ = 39 years for the link Spain–England. In other words, current political relationships between countries are influenced to a great extent by past historical events. Indeed, the complexity of the processes driving link state dynamics, and thus, of the resulting supervised learning datasets, was evidenced not only by the aforementioned values of the lag space but also by the information obtained from the geometrical measures explained before. Clearly, the complex interactions of the countries comprising the signed network graph are implicitly embedded in the temporal dynamics exhibited by the state of network links. However, deep learning machines can extract such information that permits the reconstruction of the underlying dynamical process.

5. Discussion

The study of complex social and political phenomena from the perspective and methods of complex networks has proven fruitful in a variety of areas [14], including applications in political science and, more specifically, in the field of international relations. Within this context, understanding the temporal evolution of international signed relationships is currently a subject of active research. Particularly, in these kinds of networks, the existence of processes operating at different levels (i.e., local, regional, and global) shape the level of organization and interconnectivity of international relations. Furthermore, the existence of those processes operating at different scales plays an important role in interpreting network dynamics and function, especially in understanding the strategies and actions of the actors involved. Unfortunately, the dynamics of conflicts, both regional and global, have led to the notion that constructing a general modeling strategy for change in signed networks over time will be very difficult.
Using the data produced by the Correlates of War project in this study, we have proposed a predictive model that captures the regularities of international signed relations. The main contributions of this work and the methodology employed can be summarized as follows:
  • The fact of employing information-theoretic measures such as mutual information provides substantial information not only with regards to the influence of certain historical events but especially in a better comprehension of international signed relations (e.g., to better understand the role and actions of the actors involved).
  • The predictive model can capture with enough accuracy the regularities of international signed relations (i.e., an average accuracy ranging from 1 up to 5 errors each 10,000 predictions for the well-represented categories), including the prediction of conflictual events at the local level (i.e., the under-represented category Conflict achieving an average accuracy of 84 errors each 10,000 predictions) thus, outperforming state of the art approaches.
  • Given the accuracy of the predictions obtained at the local level, our results suggest that this model might be extended by incorporating both temporal and topological aspects of networks to improve predictions of dynamical processes at regional and global levels aimed at achieving a complete understanding of the overall pattern of signed international relations.

5.1. Under-Represented Samples: The Conflict Category

One of the important implications of the present study was to show that even though the patterns leading to conflictual events, that is, patterns belonging to the category Conflict are under-represented (i.e., the number of available samples for this category is around 1% of the total number of samples contained in the generated datasets) the set of predictive models obtained using the Deep Network Architectures shown in Table 2 (Networks with 756 artificial neurons trained 1000 Epochs) were able to learn this category also with a probability of error close to zero. This fact is of particular interest as the same set of architectures trained lower learning times (200 Epochs) lead to probabilities of error close to zero with respect to the categories well represented in the datasets (Alliance and Neutral categories) but they were unable to learn the patterns belonging to the category Conflict. Furthermore, using a Deep Network with a higher quotient Entropy/Internal Energy [50], that is, a model with higher complexity 933 × 511 × 250 × 51 × 16 × 3 (1764 Artificial Neurons) trained only 200 Epochs was able to obtain the same prediction accuracy for the three categories (Alliance, Neutral, Conflict) as that obtained with the networks of 756 units but trained 1000 Epochs.
Having said this, it is important to note that in network links such as Spain–France where the number of samples available for the under-represented category are extremely scarce (i.e., around 0.016 % with respect to the total number of samples) the performance of the predictive model is clearly affected because of this fact. For any machine learning classifier learning under-represented categories is always a challenge principally because of the fact that the training phase of any supervised learning task (i.e., learning categories) selects patterns from the dataset randomly, that is, using a uniform distribution and thus, the probability of selecting a sample of the under-represented categories is extremely low, leading to a low exposure of the machine learning classifier to these kinds of samples impairing its classification performance.
However, it is important to emphasize that even though in this link, the category Conflict is extremely under-represented because of the absence of samples belonging to this category (≪1%), they are scarce from the point of view of the dynamics international signed relations (e.g., countries that are neighbors and having practically no conflicts at all in its history), it has been possible to show according to the conclusions presented before that using either a higher complexity model or larger learning times it was possible to circumvent this problem, something that it could be even enhanced using a uniform distribution for sampling the patterns of the datasets but focused on its number of categories rather than on its number of samples during the learning phase of the predictive models.

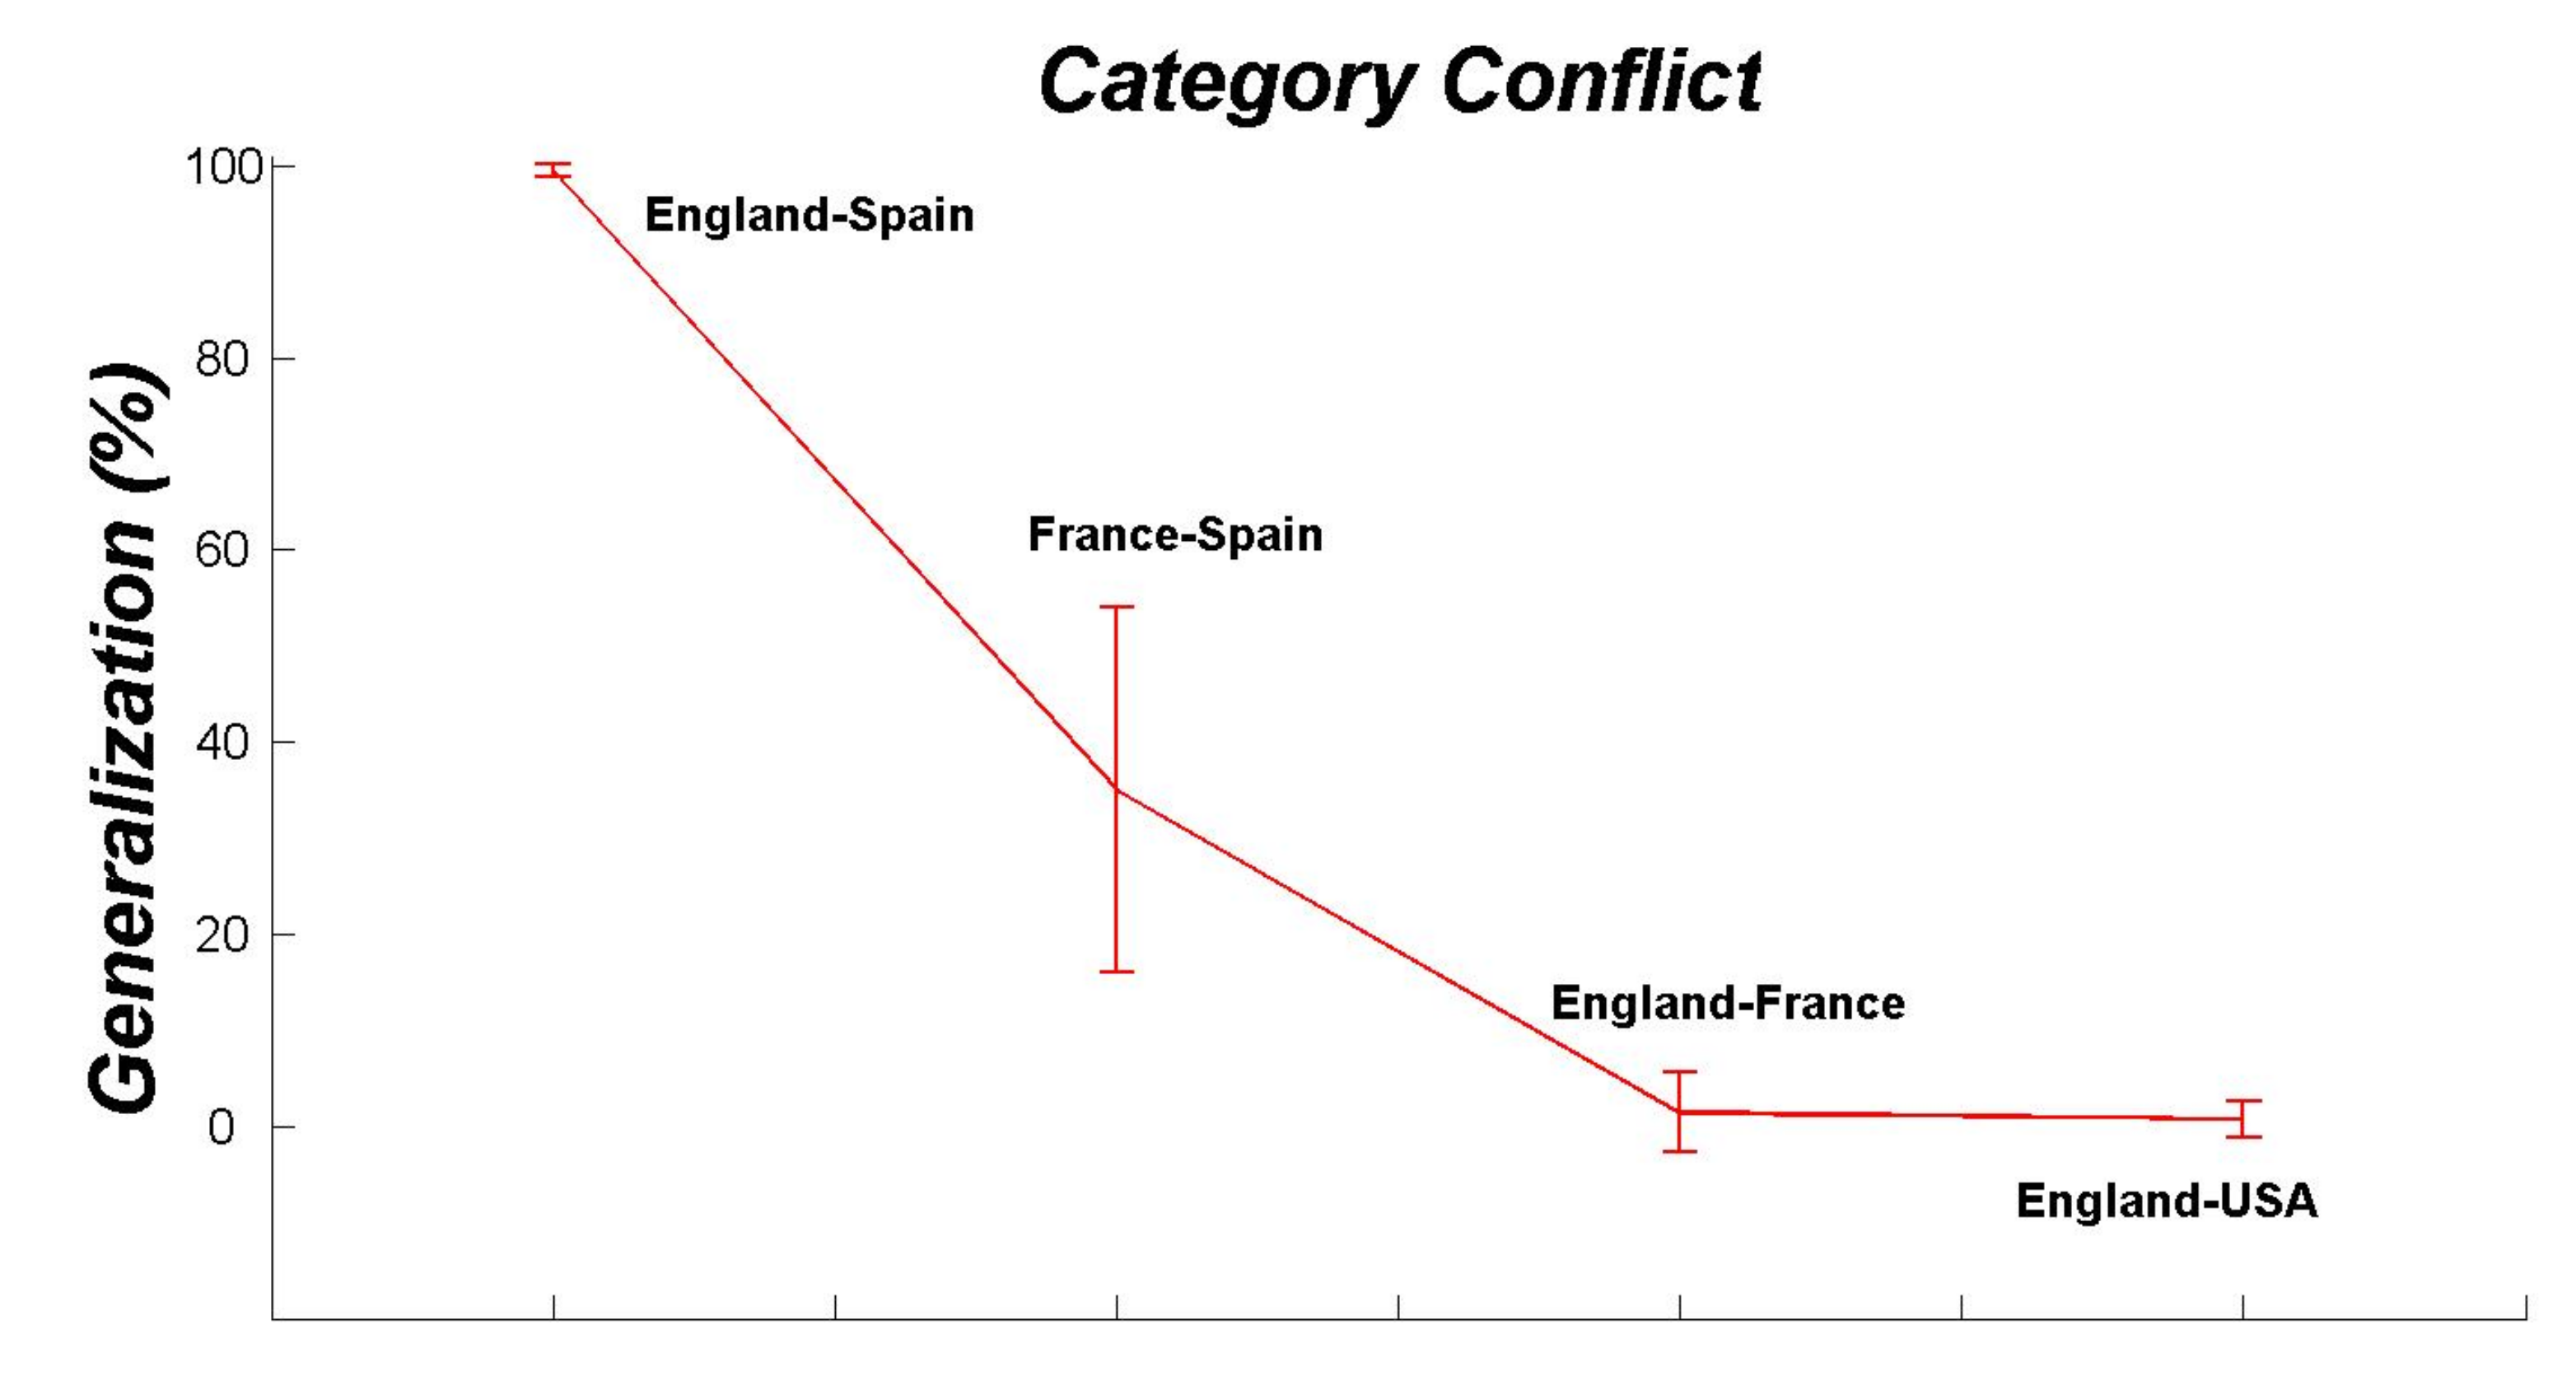
5.2. Global Patterns versus Pairwise Relationships

The first important implication of this study was to show that the proposed methodology can predict the temporal evolution of political signed networks with enough precision. Furthermore, according to the methodology proposed, developing a more complex model, for instance, using global patterns instead of pairwise relationships would be justified in case of the impossibility of obtaining an appropriate accuracy in the predictions, something that is not the case, but even in that case a model of that kind would be intractable from a computational point of view due to the memory requirements and the time required for the learning phase. For example, simply the dataset associated with the link France–Spain is composed of 62,206 patterns embedded in a space dimension equal to 16,499.
The second important implication was to show the possibility of the reconstruction of the phase space of the dynamical system (the first point of the theoretical foundations of the approach) to predict the next state of the network with enough precision, although this procedure is opaque as is carried out by deep networks (that act as black boxes) the advantage of the proposed methodology is the fact that is potentially comprehensible for experts outside the field of deep learning. Furthermore, the advantage of the proposed approach is that it might be easily extended by incorporating both temporal and topological aspects of networks, slightly increasing the complexity of the resulting model to achieve predictions of dynamical processes at regional and global levels. More specifically, the proposed model is principally based on a set of deep networks that locally learn with extreme accuracy the temporal evolution of the discrete states associated with the links of the network of political relations.
Thus, aimed at achieving a complete understanding of the relevant mechanism that drives the dynamics of international signed relations, this set of deep learning machines can be embedded in a message-passing probabilistic model that uses BeliefPropagation [54] to reconstruct the time-dependent information of the entire network of international relations in order to improve predictions of dynamical processes at regional and global levels. Precisely, the temporal structure of the problem may be exploited to generate a factor-graph [55] without cycles to ensure convergence of BeliefPropagation [56]. Afterward, the initial estimation of marginal probabilities can be achieved using the knowledge acquired by the set of deep learning machines. It is important to remember that the output of deep neural networks can be considered probabilities if the error function used for the learning phase of these models is the sum-of-squares error or the cross-entropy error function [45]. Furthermore, as opposed to a model that uses regional and/or global patterns to train deep learning machines, a model of this kind would not increase excessively complexity as the deep learning machines would be used in recall mode.
Having said this, it is also important to remember that the second point of the theoretical foundation of the approach was grounded on the idea that the features of the phase space of the dynamical system under study are shared and embedded within the individual time series associated with the political network links. In other words, the information and influences of the rest of the countries comprising the signed network are implicitly embedded in the particular evolution of the time series associated with a link (i.e., a pairwise relationship), and such information could be extracted given that the observation window of the strange attractor is big enough (remember that the public correlates of war datasets contains almost two centuries of state-wise geopolitical information). Rephrasing this hypothesis in complementary terms is equivalent to stating that if countries are considered pairwise, much information is lost as the relationship between countries depends on their relationships with other countries, something unlikely according to the results obtained, that is, probabilities of error close to zero in the predictions.
However, to shed more light on this issue, the following experiment was conducted: Using the discrete time-series associated with the links France–Spain, England–France, and England–USA three additional datasets were generated following the procedure explained in Section 4.2 but instead of using the lag λ associated to each of the aforementioned links those set were constructed using the lag obtained for the time series corresponding to the link England–Spain, that is, λ = 14,219.
Afterwards, a statistical cross-validation procedure was used to determine the average classification error for the three categories (Alliance, Neutral, Conflict) using exactly the same seed for the random number generator and the same Deep Network architecture 292 × 239 × 150 × 53 × 19 × 3 to obtain identical results to those reported in Table 2 for this link. Specifically, at each fold of the aforementioned procedure, the test set corresponding to the series England–Spain is passed to the deep network to check the generalization performance but also the three additional datasets generated from the time series associated to the links: France–Spain, England–France, and England–USA as described before.
Figure 4 represents the generalization performance obtained and its standard deviation (the error bars) resulting from the experiment described before for the categories Alliance and Neutral. Similarly, Figure 5 shows the generalization performance achieved for the under-represented category Conflict. The reason for separating the three categories into two graphs is to clarify the discrepancies in the results obtained for the under-represented category. For the link England–Spain, the generalization performance obtained and its standard deviation are exactly the same as those shown in Table 2. For the rest of the links studied, it can be deduced that the knowledge extracted from the time-series associated with the link England–Spain permits to reach values of the generalization performance practically above 98%, thereby appearing to confirm the likelihood of the hypothesis. Of particular interest is the fact that the worst generalization performance compared to the rest of the links together with the largest standard deviation (i.e., a value of 87% with a standard deviation around this value equal to 5.47) is obtained for the category Neutral, and the link England–France that is, precisely the link leading to the lowest value of the Fisher criterion F C U K - - F R = 0.2087 but also the category with the lowest a priori probability (approximately 15%) compared to the values for this category in the rest of links (values above 40%).
In contrast, the prediction results obtained for the category Conflict shown in Figure 5 appear to suggest (excepting, of course, for the link England–Spain) that the knowledge learned by the deep network for this under-represented category was not good enough to generalize for the rest of links used in the experiment. More specifically, a generalization values for the links France–Spain, England–France, and England–USA were, respectively, 35% ( σ = 19 ), 1.4% ( σ = 4.19 ), and 0.71% ( σ = 1.53 ). In other words, the results are poor compared to those obtained for the rest of the categories.
Summarizing, with the proposed methodology, the fact of considering pairwise relations between countries does not affect the accuracy of the predictions of the model at the local level with regards to the patterns of international signed relations allowing, at the same time, the possibility to use this model as the basis of a more general modeling strategy without increasing complexity excessively. Furthermore, the predictive capacities of the model are beyond strictly local predictions as the model can also provide accurate predictions at the regional or global level of the patterns belonging to the well-represented categories of international signed relations. However, conflictual patterns are only predicted with accuracy (probability of error close to zero) at the local level. In other words, the information extracted by deep learning machines from the pairwise relations between countries is not good enough to predict conflictual events in other links of the political network.

5.3. Influence of Historical Events

The temporality of links in the network of international relations encodes the ordering and causality of interactions between countries, and it was shown in previous sections that they have a profound effect on network dynamics and function. Time delayed mutual information was used in Section 3.3 to calculate the optimal number of regressors for predicting the discrete time series associated with the subset of links studied. The whole thing is that the set of delays obtained can be interpreted as the memory of the underlying stochastic process driving link dynamics, and the values obtained are huge, for instance, λ = 45 years for the link France–Spain, or λ = 39 years for the link Spain–England. In other words, current political relationships between countries are influenced to a great extent by past historical events.
Moreover, taking these considerations into account together with the fact that mutual information permits the detection of non-linear correlations between the variables involved it is plausible to assume that its temporal evolution (see Figure 1 and Figure 2) is clearly evidencing the existence of historical events that directly or indirectly affected the political relationships between those countries. For example, the graph of the time delayed mutual information for the links France–Spain, and England–Spain (see Figure 1) is correlated for λ [16,000, 22,600] corresponding (approximately) to the period ranging from 1860 up to 1878. Indeed, during this period, there was a reaction of these three European powers to the policy of president Juárez in Mexico, who suspended the payment of interest on foreign debt leading to the tripartite treaty of London in 1861. With regards to this graph, it is important to note the differences in the correlations of the countries involved suggesting differences in the closeness of the alliances between England–France compared to France–Spain or England–Spain.
Similarly, the saddle point of the graph of the time delayed mutual information for the link England–USA (see Figure 2) situated in a value of the time delay equal to 10,000 corresponds approximately to the year 1843, that is, a year of particular diplomatic tension between England and the United States due to the Oregon boundaries conflict. This conflict was partially resolved with the Oregon treaty signed in 1846, that is, an agreement between England and the United States that formalized the border between the USA and British North America west of the rocky mountain. Thus, the most important conclusion that can be extracted from a careful interpretation of these graphs is not only that past historical events of this kind can affect the political relationships that are observed nowadays between those countries, but especially that those graphs have the potential to provide a better comprehension of international signed relations [25,28,57,58,59] (e.g., the closeness of alliances and their actions between those countries, the existence of prominence in systems, coalitions forming to oppose the rise of dominant states, the choice of role partners in a multipolar system and the role of structural balance, just to mention a few).
In summary, the perspective offered by the time delayed mutual information on the study and analysis of the dynamics of the links of the network of international relations at regional and/or global levels of the network provides substantial information not only with regards to the influence of certain historical events but especially in a better comprehension of international signed relations (e.g., to better understand the role and actions of the actors involved).

6. Conclusions

From the data produced by the Correlates of War project in this paper, the possibility of modeling the evolution of political signed networks has been investigated using deep learning machines. The analysis of the discrete time series associated with the evolution of the state of network links, using a combination of geometric and information-theoretic measures, permitted us to characterize the complexity of the stochastic processes driving link dynamics and to design the deep network structure. The result of this analysis suggested the following conclusions:
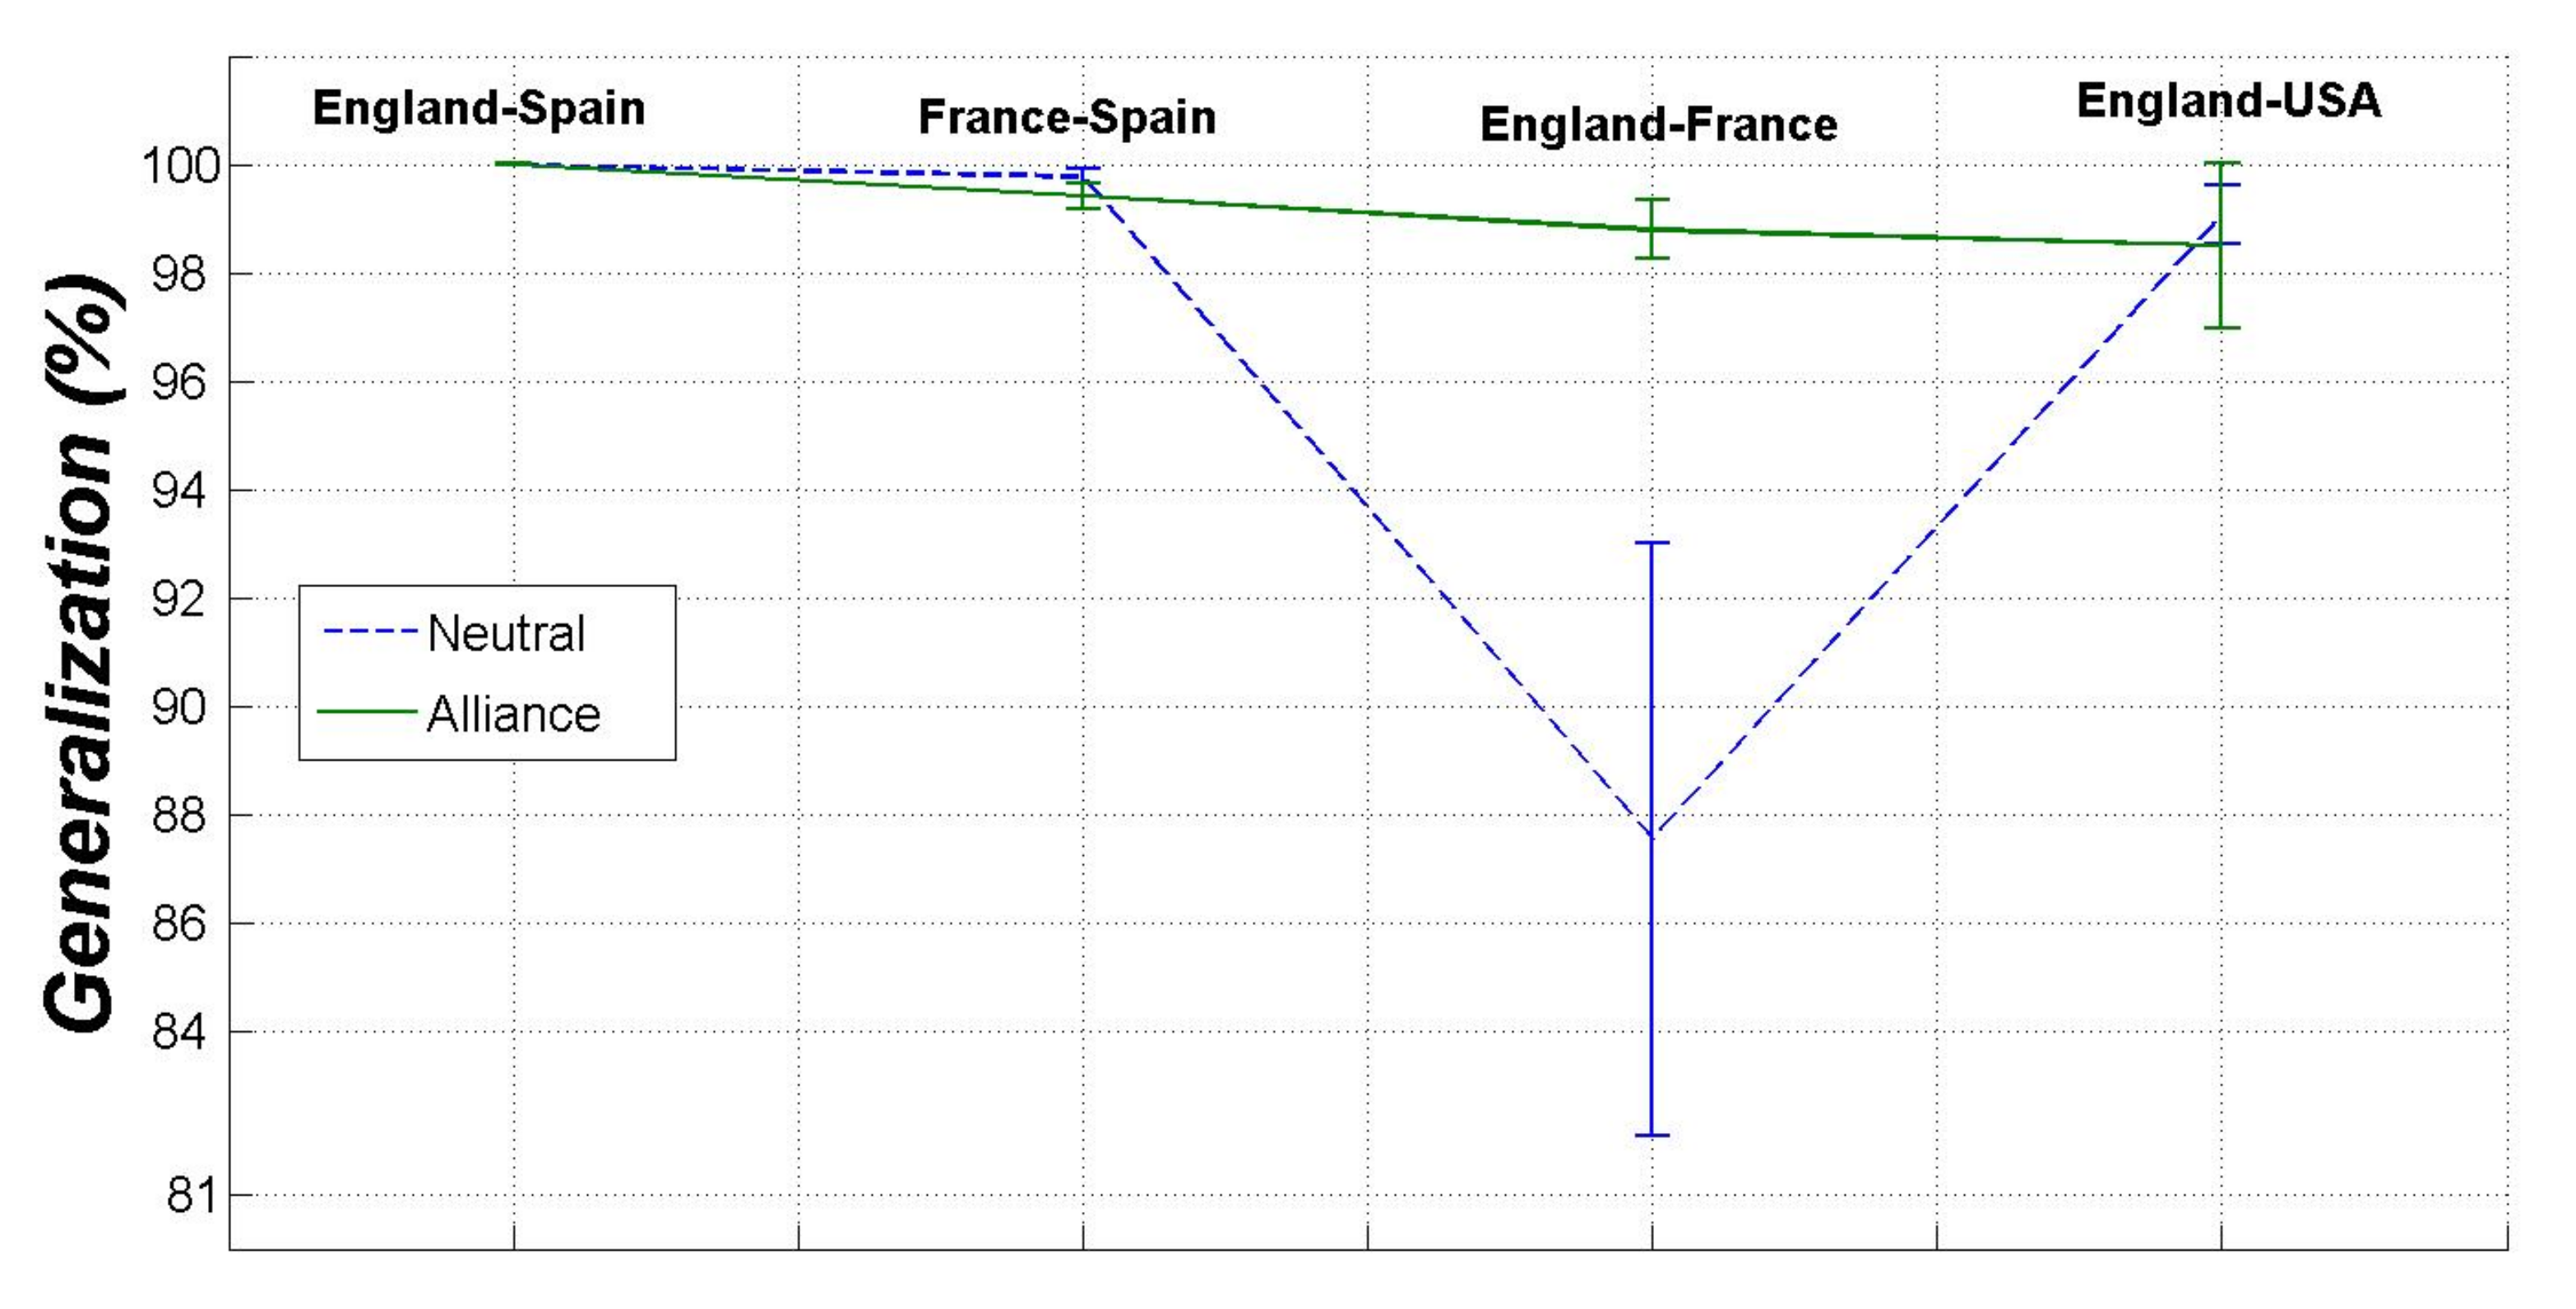
  • The dispersion values obtained between the categories representing the states of the links have shown that the mechanisms (or strategies) employed by countries to generate alliances are, in general, more complex compared to those leading to a conflict. The overlapping rate of the categories of the international signed relations measured by the Fisher criterion, together with their prior probabilities, were good indicators of the expected generalization performance of the models.
  • The interpretation of the time delayed mutual information permitted to show that the political relationships between countries are influenced to a great extent by past historical events, that is, the dependence on the past (the memory) of the stochastic processes driving link dynamics goes beyond to the previous state (Markov property). Furthermore, its correlations for a certain range of values of the delay across multiple links of the network evidenced the existence of historical events that directly or indirectly affected the political relationships between those countries, thus, potentially helping the interpretation of the strategies and actions of the actors involved.
  • Deep learning machines can capture with enough accuracy (probability of error close to zero) the regularities of international signed relations, including the prediction of conflictual events at the local level, specifically, the prediction of those big events in two centuries of state-wise geopolitical information when the typical relationship between countries changed to a war or a conflict.
  • The predictive capacities of the model are beyond strictly local predictions as the model can also provide accurate predictions at the regional or global levels of patterns belonging to the well-represented categories of the international signed relations.
Perhaps, the most important implication is the possibility of using the proposed methodology as the basis of a more general modeling strategy without excessively increasing the complexity of the resulting predictive model aimed at achieving a complete understanding of the relevant mechanism that drives the dynamics of international signed relations.

Author Contributions

Conceptualization, A.C.M.d.L.; Data curation, A.C.M.d.L.; Formal analysis, A.C.M.d.L.; Funding acquisition, E.K.; Investigation, A.C.M.d.L.; Methodology, A.C.M.d.L.; Software, A.C.M.d.L.; Supervision, E.K.; Validation, A.C.M.d.L.; Visualization, A.C.M.d.L.; Writing—review & editing, A.C.M.d.L. and E.K. All authors have read and agreed to the published version of the manuscript.

Funding

Elka Korutcheva acknowledges the financial support from the Spanish Government through grants PGC2018-094763 and PID2019-105182GB-100.

Data Availability Statement

The data used throughout this work is public and freely available at https://correlatesofwar.org.

Acknowledgments

The authors would like to thank the Alexander von Humboldt Foundation for inviting them to present part of this work at the Humboldt Colloquium Research without Borders: Alexander von Humboldt’s Legacy Today celebrated in Madrid in April 2019. The authors furthermore thank Manuel Jiménez for fruitful discussions at the beginning of the project.

Conflicts of Interest

The authors declare no conflict of interest.

References

  1. Dorogovtsev, S.N. Lectures on Complex Networks; Oxford University Press: Oxford, UK, 2010. [Google Scholar]
  2. Newman, M.E.J. Networks: An introduction; Oxford University Press: Oxford, UK, 2010. [Google Scholar]
  3. Newman, M.E.J. Network structure from rich but noisy data. Nat. Phys. 2018, 14, 542–545. [Google Scholar] [CrossRef]
  4. Watts, D.J.; Strogatz, S.H. Collective dynamics of `small-world’ networks. Nature 1998, 393, 440–442. [Google Scholar] [CrossRef] [PubMed]
  5. Elhesha, R.; Sarkar, A.; Boucher, J.; Kahveci, T. Identification of co-evolving temporal networks. BMC Genom. 2019, 20 (Suppl. 6), 434. [Google Scholar] [CrossRef]
  6. Masuda, N.; Holme, P. (Eds.) Temporal Network Epidemiology (Theoretical Biology), 1st ed.; Springer: Berlin/Heidelberg, Germany, 2017; Available online: https://link.springer.com/book/10.1007/978-981-10-5287-3 (accessed on 16 August 2022).
  7. Wang, W.; Wuang, L.; Gan, C. Epidemic Spreading Dynamics on Temporal Networks, Collection of Papers 2021. 2021. Available online: https://www.hindawi.com/journals/complexity/si/813208/ (accessed on 16 August 2022).
  8. Zhu, Z.; Sun, Y.; Kuang, Y.; Yuan, X.; Gu, H.; Zhu, J.; Xing, W. Contemporaneous symptom networks of multidimensional symptom experiences in cancer survivors: A network analysis. Cancer Med. 2022, 1–11. [Google Scholar] [CrossRef] [PubMed]
  9. Akbar, M.A.; Leiva, V.; Rafi, S.; Qadri, S.F.; Mahmood, A.; Alsanad, A. Towards roadmapto implement blockchain in healthcare systems based on a matrity model. Softw. Evol. Process. 2022, e2500. [Google Scholar] [CrossRef]
  10. Riatz, M.T.; Alsanad, A.A.; Ahmad, S.; Akbar, M.A.; AlSuwaidan, L.; Al-AlShaikh, H.A.; Alsagri, H. A wireless controlled intelligent healthcare system for diplegia patients. Math. Biosci. Eng. 2022, 19, 456–472. [Google Scholar] [CrossRef]
  11. Jordan, G.; Winer, S.; Salem, T. The Current Status of Temporal Network Analysis for Clinical Science: Considerations as the Paradigm Shifts? Available online: https:/onlinelibrary.wiley.com/doi/10.1002/jclp.22957 (accessed on 15 August 2022).
  12. Centola, D. The spread of behavior in an online social network experiment. Science 2010, 329, 1194–1197. [Google Scholar] [CrossRef]
  13. Holme, P. Modern temporal network theory: A colloquium. Eur. Phys. J. B 2015, 88, 1–30. [Google Scholar] [CrossRef]
  14. Kossinets, G.; Watts, D.J. Empirical analysis of an evolving social network. Science 2006, 311, 88–90. [Google Scholar] [CrossRef]
  15. Maulana, A.; Situngkir, H.; Suroso, R. Dynamics of Polarization and Coalition Formation in Signed Political Elite Networks. In Complex Networks and Their Applications; Complex Networks 2021, Studies in Computational Intelligence; Benito, R.M., Cherifi, C., Cherifi, H., Moro, E., Rocha, L.M., Sales-Pardo, M., Eds.; Springer: Berlin/Heidelberg, Germany, 2022; Volume 1015. [Google Scholar] [CrossRef]
  16. Musciotto, F.; Delpriori, S.; Castagno, P.; Pournaras, E. Mining social interactions in privacy-preserving temporal networks. In Proceedings of the IEEE/ACM International Conference on Advances in Social Networks Analysis and Mining (ASONAM), San Francisco, CA, USA, 18–21 August 2016; pp. 1103–1110. [Google Scholar] [CrossRef]
  17. Bassett, D.S.; Wymbs, N.F.; Porter, M.A.; Mucha, P.J.; Carlson, J.M.; Grafton, S.T. Dynamic reconfiguration of human brain networks during learning. Proc. Natl. Acad. Sci. USA 2011, 108, 7641–7646. [Google Scholar] [CrossRef]
  18. Nasuha-Daud, N.; Hafizah-Ab-Hamid, S.; Saadoon, M.; Sahran, F.; Badrul-Anuar, N. Applications of link prediction in social networks: A review. J. Netw. Comput. Appl. 2020, 166, 102716. [Google Scholar] [CrossRef]
  19. Ai, J.; Cai, Y.; Su, Z.; Zhang, K.; Peng, D.; Chen, Q. Predicting user-item links in recommender systems based on similarity-network resource allocation. Chaos Solitons Fractals 2022, 158, 112032. [Google Scholar] [CrossRef]
  20. Cheng, Y.L.; Hsiao, C.H.; Wu, C.C. An ensemble model for link prediction based on graph embedding. Decis. Support Syst. 2022, 157, 113753. [Google Scholar] [CrossRef]
  21. Calderoni, F.; Catanese, S.; De Meo, P.; Ficara, A.; Fiumara, G. Robust link prediction in criminal networks: A case study of the Sicilian Mafia. Expert Syst. Appl. 2020, 161, 113666. [Google Scholar] [CrossRef]
  22. Boccaleti, S.; Bianconi, G.; Criado, R.; Del Genio, C.I.; Gómez-Gardenes, J.; Romance, M.; Sendina-Nadal, I.; Wang, Z.; Zanin, M. The Structure and Dynamics of Multilayer Networks. Phys. Rep. 2014, 544, 1–122. [Google Scholar] [CrossRef]
  23. Aref, S.; Wilson, M.C. Balance and frustration in signed networks. J. Complex Netw. 2019, 7, 163–189. [Google Scholar] [CrossRef]
  24. Aref, S.; Mason, A.J.; Wilson, M.C. A modeling and computational study of the frustration index in signed networks. Networks 2020, 75, 95–110. [Google Scholar] [CrossRef]
  25. Aref, S.; Neal, Z. Detecting coalitions by optimally partitioning signed networks of political collaboration. Sci. Rep. 2020, 10, 1506. [Google Scholar] [CrossRef] [PubMed] [Green Version]
  26. Kirkley, A.; Cantwell, G.T.; Newman, M.E.J. Balance in signed networks. Phys. Rev. E 2019, 99, 0123120. [Google Scholar] [CrossRef]
  27. Antal, T.; Krapivsky, P.L.; Redner, S. Social Balance on Networks: The Dynamics of Friendship and Enmity. Phys. D Nonlinear Phenom. 2006, 224, 130. [Google Scholar] [CrossRef]
  28. Doreian, P.; Mrvar, A. Structural Balance and Signed International Relations. J. Soc. Struct. 2019, 16, 1–49. [Google Scholar] [CrossRef]
  29. Kunegis, J.; Schmidt, S.; Lommatzsch, A.; Lerner, J.; De Luca, E.W.; Albayrak, S. Spectral Analysis of Signed Graphs for Clustering, Prediction and Visualization. In Proceedings of the SIAM International Conference on Data Mining, SDM 2010, Columbus, OH, USA, 29 April–1 May 2010; pp. 559–570. [Google Scholar] [CrossRef]
  30. Musial, K.; Bródka, P.; De Meo, P. Analysis and Applications of Complex Social Networks. Complexity 2017, 2017, 3014163. [Google Scholar] [CrossRef]
  31. Xiang, B.B.; Ma, C.; Chen, H.S.; Zhang, H.F. Reconstructing signed networks via Ising dynamics. Chaos 2018, 28, 123117. [Google Scholar] [CrossRef] [PubMed]
  32. Ribeiro, H.V.; Alves, L.G.A.; Martins, A.F.; Lenzi, E.K.; Perc, M. The dynamical structure of political corruption networks. J. Complex Netw. 2018, 6, 989–1003. [Google Scholar] [CrossRef]
  33. Faustino, J.; Barbosa, H.; Ribeiro, E.; Menezes, R. A data-driven network approach for characterization of political parties’ ideology dynamics. Appl. Netw. Sci. 2019, 4, 48. [Google Scholar] [CrossRef]
  34. Arinik, N.; Figueiredo, R.; Labatut, V. Analysis of roll-calls in the European parliament by multiple partitioning of multiplex signed networks. Soc. Netw. 2019, 60, 83–102. [Google Scholar] [CrossRef]
  35. Tang, D.; Du, W.; Shekhtman, L.; Wang, Y.; Havlin, S.; Cao, X.; Yan, G. Predictability of real temporal networks. Natl. Sci. Rev. 2020, 7, 929–937. [Google Scholar] [CrossRef] [Green Version]
  36. Cranmer, S.J.; Menninga, E.J.; Mucha, P.J. Kantian Fractionalization Predicts the Conflict Propensity of the International System. Proc. Natl. Acad. Sci. USA 2014, 112, 11812–11816. [Google Scholar] [CrossRef]
  37. Kantz, H.; Schreiber, T. Nonlinear Time Series Analysis; Cambridge University Press: Cambridge, UK, 2003. [Google Scholar]
  38. Abarbanel, H. Analysis of Observed Chaotic Data; Springer: New York, NY, USA, 1996. [Google Scholar] [CrossRef]
  39. Lerner, J. Structural balance in signed networks: Separating the probability to interact from the tendency to fight. Soc. Netw. 2016, 45, 66–77. [Google Scholar] [CrossRef]
  40. Reid, M.; Wayman, F. Resort to War: 1816–2007; CQ Press: Washington, DC, USA, 2010. [Google Scholar]
  41. Takens, F. On the numerical determination of the dimension of an attractor. In Dynamical Systems and Turbulence, Annual Notes in Mathematics; Rand, D., Yound, L.S., Eds.; Springer: Berlin, Germany, 1981; Volume 898, pp. 366–381. [Google Scholar]
  42. Schmidhuber, J. Deep Learning in Neural Networks: An Overview. Neural Netw. 2015, 61, 85–117. [Google Scholar] [CrossRef]
  43. LeCunn, Y.; Bengio, Y.; Hinton, G. Deep Learning. Nature 2015, 521, 436–444. [Google Scholar] [CrossRef] [PubMed]
  44. Blayo, F.; Cheneval, Y.; Guérin-Dugué, A.; Chentouf, R.; Aviles-Cruz, C.; Madrenas, J.; Moreno, M.; Voz, J.L. Enhanced Learning for Evolutive Neural Architecture ESPRIT Basic Research Project Number 6891, Deliverable R3-B4-P, Task B4 (Benchmarks). 1995. Available online: https://cordis.europa.eu/project/id/6891/en (accessed on 16 August 2022).
  45. Bishop, C.M. Neural Networks for Pattern Recognition; Oxford University Press: Oxford, UK, 1995. [Google Scholar]
  46. Blahut, R.E. Principles and Practice of Information Theory; Addison-Wesley Longman Publishing Co.: Boston, MA, USA, 1987. [Google Scholar]
  47. Fraser, A.M.; Swinney, H.L. Independent coordinates for strange attractors from mutual information. Phys. Rev. A 1986, 33, 1134–1140. [Google Scholar] [CrossRef] [PubMed]
  48. Hegger, R.; Kantz, H.; Schreiber, T. Practical implementation of nonlinear time series methods: The TISEAN package. Chaos 1999, 9, 413–435. [Google Scholar] [CrossRef] [PubMed]
  49. Nørgaard, M.; Rvn, O.; Poulse, N.K.; Hansen, L.K. Neural Networks for Modelling and Control of Dynamic System; Springer: London, UK, 2000. [Google Scholar]
  50. Chinea, A. On the Theory of Deep Learning: A Theoretical Physics Perspective (Part I). 2020. Available online: https://www.preprints.org/manuscript/202010.0285/v1 (accessed on 1 January 2020).
  51. Anand, K.; Bianconi, G. Entropy measures for networks. Phys. Rev. E 2009, 80, 045102(R). [Google Scholar] [CrossRef]
  52. Haykin, S. Neural Networks: A Comprehensive Foundation; Prentice Hall: Hoboken, NJ, USA, 1999. [Google Scholar]
  53. Efron, B. Bootstrap Methods: Another Look at the Jacknife. Ann. Stat. 1979, 7, 1–26. [Google Scholar] [CrossRef]
  54. Yedidia, J.; Weiss, Y. Generalized Belief Propagation. In Advances in Neural Information Processing Systems; 2001; pp. 689–695. Available online: https://proceedings.neurips.cc/paper/2000/hash/61b1fb3f59e28c67f3925f3c79be81a1-Abstract.html (accessed on 16 August 2022).
  55. Bishop, C.M. Pattern Analysis and Machine Learning; Springer: London, UK, 2006. [Google Scholar]
  56. Furtlehner, C.; Lasgouttes, J.-M.; de La Fortelle, A. A BeliefPropagation Approach to Traffic Prediction Using Probe Vehicles. In Proceedings of the 10th International IEEE Conference on Intelligent Transportation Systems, Bellevue, WA, USA, 30 September–3 October 2007; pp. 1022–1027. Available online: https://hal.inria.fr/hal-00175627 (accessed on 18 August 2022).
  57. Srivastava, A.; Chelmis, C.; Prasanna, V.K. Social influence computation and maximization in signed networks with competing cascades. In Proceedings of the IEEE/ACM International Conference on Advances in Social Networks Analysis and Mining (ASONAM), Paris, France, 25–28 August 2015; pp. 41–48. [Google Scholar] [CrossRef]
  58. Huang, J.; Shen, H.; Cheng, X. SIGNLENS: A Tool for Analyzing People’s Polarization Social Relationship Based on Signed Graph Modeling. In Proceedings of the Fifteenth International AAAI Conference on Web and Social Media, Virtually, 7–10 June 2021; Volume 15. [Google Scholar]
  59. Bonchi, F.; Galimberti, E.; Gionis, A.; Ordozgoiti, B.; Ruffo, G. Discovering Polarized Communities in Signed Networks. arXiv 2019, arXiv:1910.02438. [Google Scholar] [CrossRef]
Figure 1. Schematic representation of the approach: Firstly, the link state prediction problem is re-casted in terms of a classification problem where the categories to discriminate are: Alliance, Neutral, and Conflict (point 1). Secondly, Geometric and Information-theoretic measures are used to characterize the complexity of the time series and the resulting classification dataset (point 2). Finally, Deep Learning Machines are used to learn the categories representing the state of network links (point 3).
Axioms 11 00464 g001
Figure 2. Time delayed mutual information I ( x , x λ ) [47] for the discrete time series corresponding to the nodes of the network representing the countries of Spain, France, and England. The time delay λ is expressed in days ranging from 1 up to approximately 164 years, a value that ensures the statistical independence of the stochastic processes and its delayed versions representing the temporal evolution of the political relationships of the aforementioned countries covering the period from 1816 till 2007. The correlations of the three graphs for a certain range of values of the delay evidence the existence of historical events that directly or indirectly affected the political relationships between those countries.
Axioms 11 00464 g002
Figure 3. Time delayed mutual information I ( x , x λ ) for the discrete time series corresponding to the nodes of the network representing the countries of England and the United States of America. As before, the time delay λ is expressed in days ranging from 1 up to approximately 164 years, a value that ensures the statistical independence of the stochastic processes and its delayed versions representing the temporal evolution of the political relationships of the aforementioned countries covering the period from 1816 till 2007.
Axioms 11 00464 g003
Figure 4. Generalization performance and its standard deviation (the error bars) for the categories Alliance, and Neutral obtained using a ten-fold cross-validation procedure for the time series associated to the link England–Spain. The goal was to check whether the knowledge learned by the predictive model for this link (the deep network with architecture 292 × 239 × 150 × 53 × 19 × 3 ) might be used to generalize the predictions of the categories associated with the links France–Spain, England–France, and England–USA.
Axioms 11 00464 g004
Figure 5. Generalization performance and its standard deviation (the error bars) for the category Conflict (the under-represented category). As before, the goal was to check whether the knowledge learned by the predictive model for this link (the deep network with architecture 292 × 239 × 150 × 53 × 19 × 3 ) might be used to generalize predictions in other links of the signed network.
Axioms 11 00464 g005
Table 1. Prior probabilities of each of the categories (Alliance, Neutral, Conflict) representing the possible states of network links for the generated supervised learning datasets (i.e., discrete time series). The data presented was generated using the database containing the last two centuries (i.e., covering the period from 1816 up to 2007) of state-wise geopolitical information of those countries included in the Correlates of War Project. [40].
Prior Probabilities
Network LinkAllianceNeutralConflict
England–France P = 81 , 147 97 , 135 = 0.8354 P = 14 , 907 97 , 135 = 0.1533 P = 1081 97 , 135 = 0.0111
England–Spain P = 23 , 061 63 , 203 = 0.36487 P = 38 , 959 63 , 203 = 0.6164 P = 1183 63 , 203 = 0.01872
England–USA P = 43 , 646 74 , 357 = 0.58698 P = 29 , 800 74 , 357 =0.4010 P = 891 74 , 357 = 0.01198
France–Spain P = 24 , 017 62 , 206 = 0.3861 P = 38 , 179 62 , 206 =0.6138 P = 10 62 , 206 = 0.0001608
Table 2. The table shows the results of the one step ahead link state prediction of the political signed network using deep learning machines with five hidden layers and a total of 756 units hierarchically arranged and trained 1000 Epochs with the scaled conjugate gradients algorithm [45,52]. The results were validated using a statistical ten-fold cross-validation procedure [53] using the datasets built from the discrete time series corresponding to the evolution of network links (i.e., the evolution of political relationships between pairs of countries). Clearly, the model can predict the next state of the network with a probability of error close to zero.
Probability of Error
Network LinkAllianceNeutralConflict
England–France 0.000098 ± 0.000052 0.0014 ± 0.00095 0.0084 ± 0.0053
England–Spain 0.00013 ± 0.00028 0.00015 ± 0.00028 0.0069 ± 0.0079
England–USA 0.000069 ± 0.00011 0.00027 ± 0.00026 0.0099 ± 0.0098
France–Spain 0.000086 ± 0.00018 0.000078 ± 0.00017 0.88 ± 0.27
Publisher’s Note: MDPI stays neutral with regard to jurisdictional claims in published maps and institutional affiliations.

