
Development of Patent Technology Prediction Model Based on Machine Learning


Abstract
:1. Introduction
- (1)
- Technology development risk:
- (2)
- Market competition risk:
- (3)
- Risk of an objective environment:
2. Literature Review
2.1. Technology Prediction Methods for Innovation and R&D
- (1)
- (2)
- (3)
2.2. Research on Innovation, R&D, and Patent Market Prediction
- (1)
- Research on traditional forecasting methods in patent technology and market demand.
- (2)
- Research on machine learning in patent technology prediction.
3. Model Construction of R&D Patent Market Trend
3.1. Stage 1: Machine Learning—The Construction of the Ensemble Learning Prediction Model
3.1.1. Data Mining and Machine Learning—Ensemble Learning Model
- Step 1: Determining the target objects.
- Step 2: Collecting data.
- Step 3: Analyzing data.
3.1.2. On the Basis of Machine Learning—The Construction of the Ensemble Learning Prediction Model
- Leo Breiman proposed bagging, also known as bootstrap aggregation or bootstrap, as a simple and powerful ensemble learning method. Meanwhile, many homogeneous weak learners are considered, and these weak learners are independent and parallel-constructed; their respective results are determined by averaging or voting [46].
- Boosting, first put forward by Freund [47], is also a weak learner with a good deal of homogeneity. Unlike bagging, these basic models adapt and learn sequentially and combine the results in a deterministic strategy.
- Stacking is a weak learner using heterogeneity. It can construct the respective models in parallel and combine the prediction results of different weak learners to train a metamodel and draw conclusions.
4. Research Analysis—Car Body Patent Forecasting for the Automobile Industry
4.1. The Research Analysis
- Step 1: The collection of sample data.
- Step 2: Pretest the predicted data.
- Step 3: The consistency test.
- Step 4: The error result prediction.
4.2. Validation and Discussion of the Model
- (1)
- The comparison of the accuracy with different prediction methods.
- (2)
- The posterior error test method.
- (3)
- Co-Integration and Error Correction Model (ECM).
- Step 1: The first step is to perform a unit root test on the actual value (variable A).
- Step 2: The second step is to perform unit root test on the theoretical predicted value (variable B).
- Step 3: Third step is to test the stationarity of the residual sequence.
- Step 4: Error correction model (ECM).
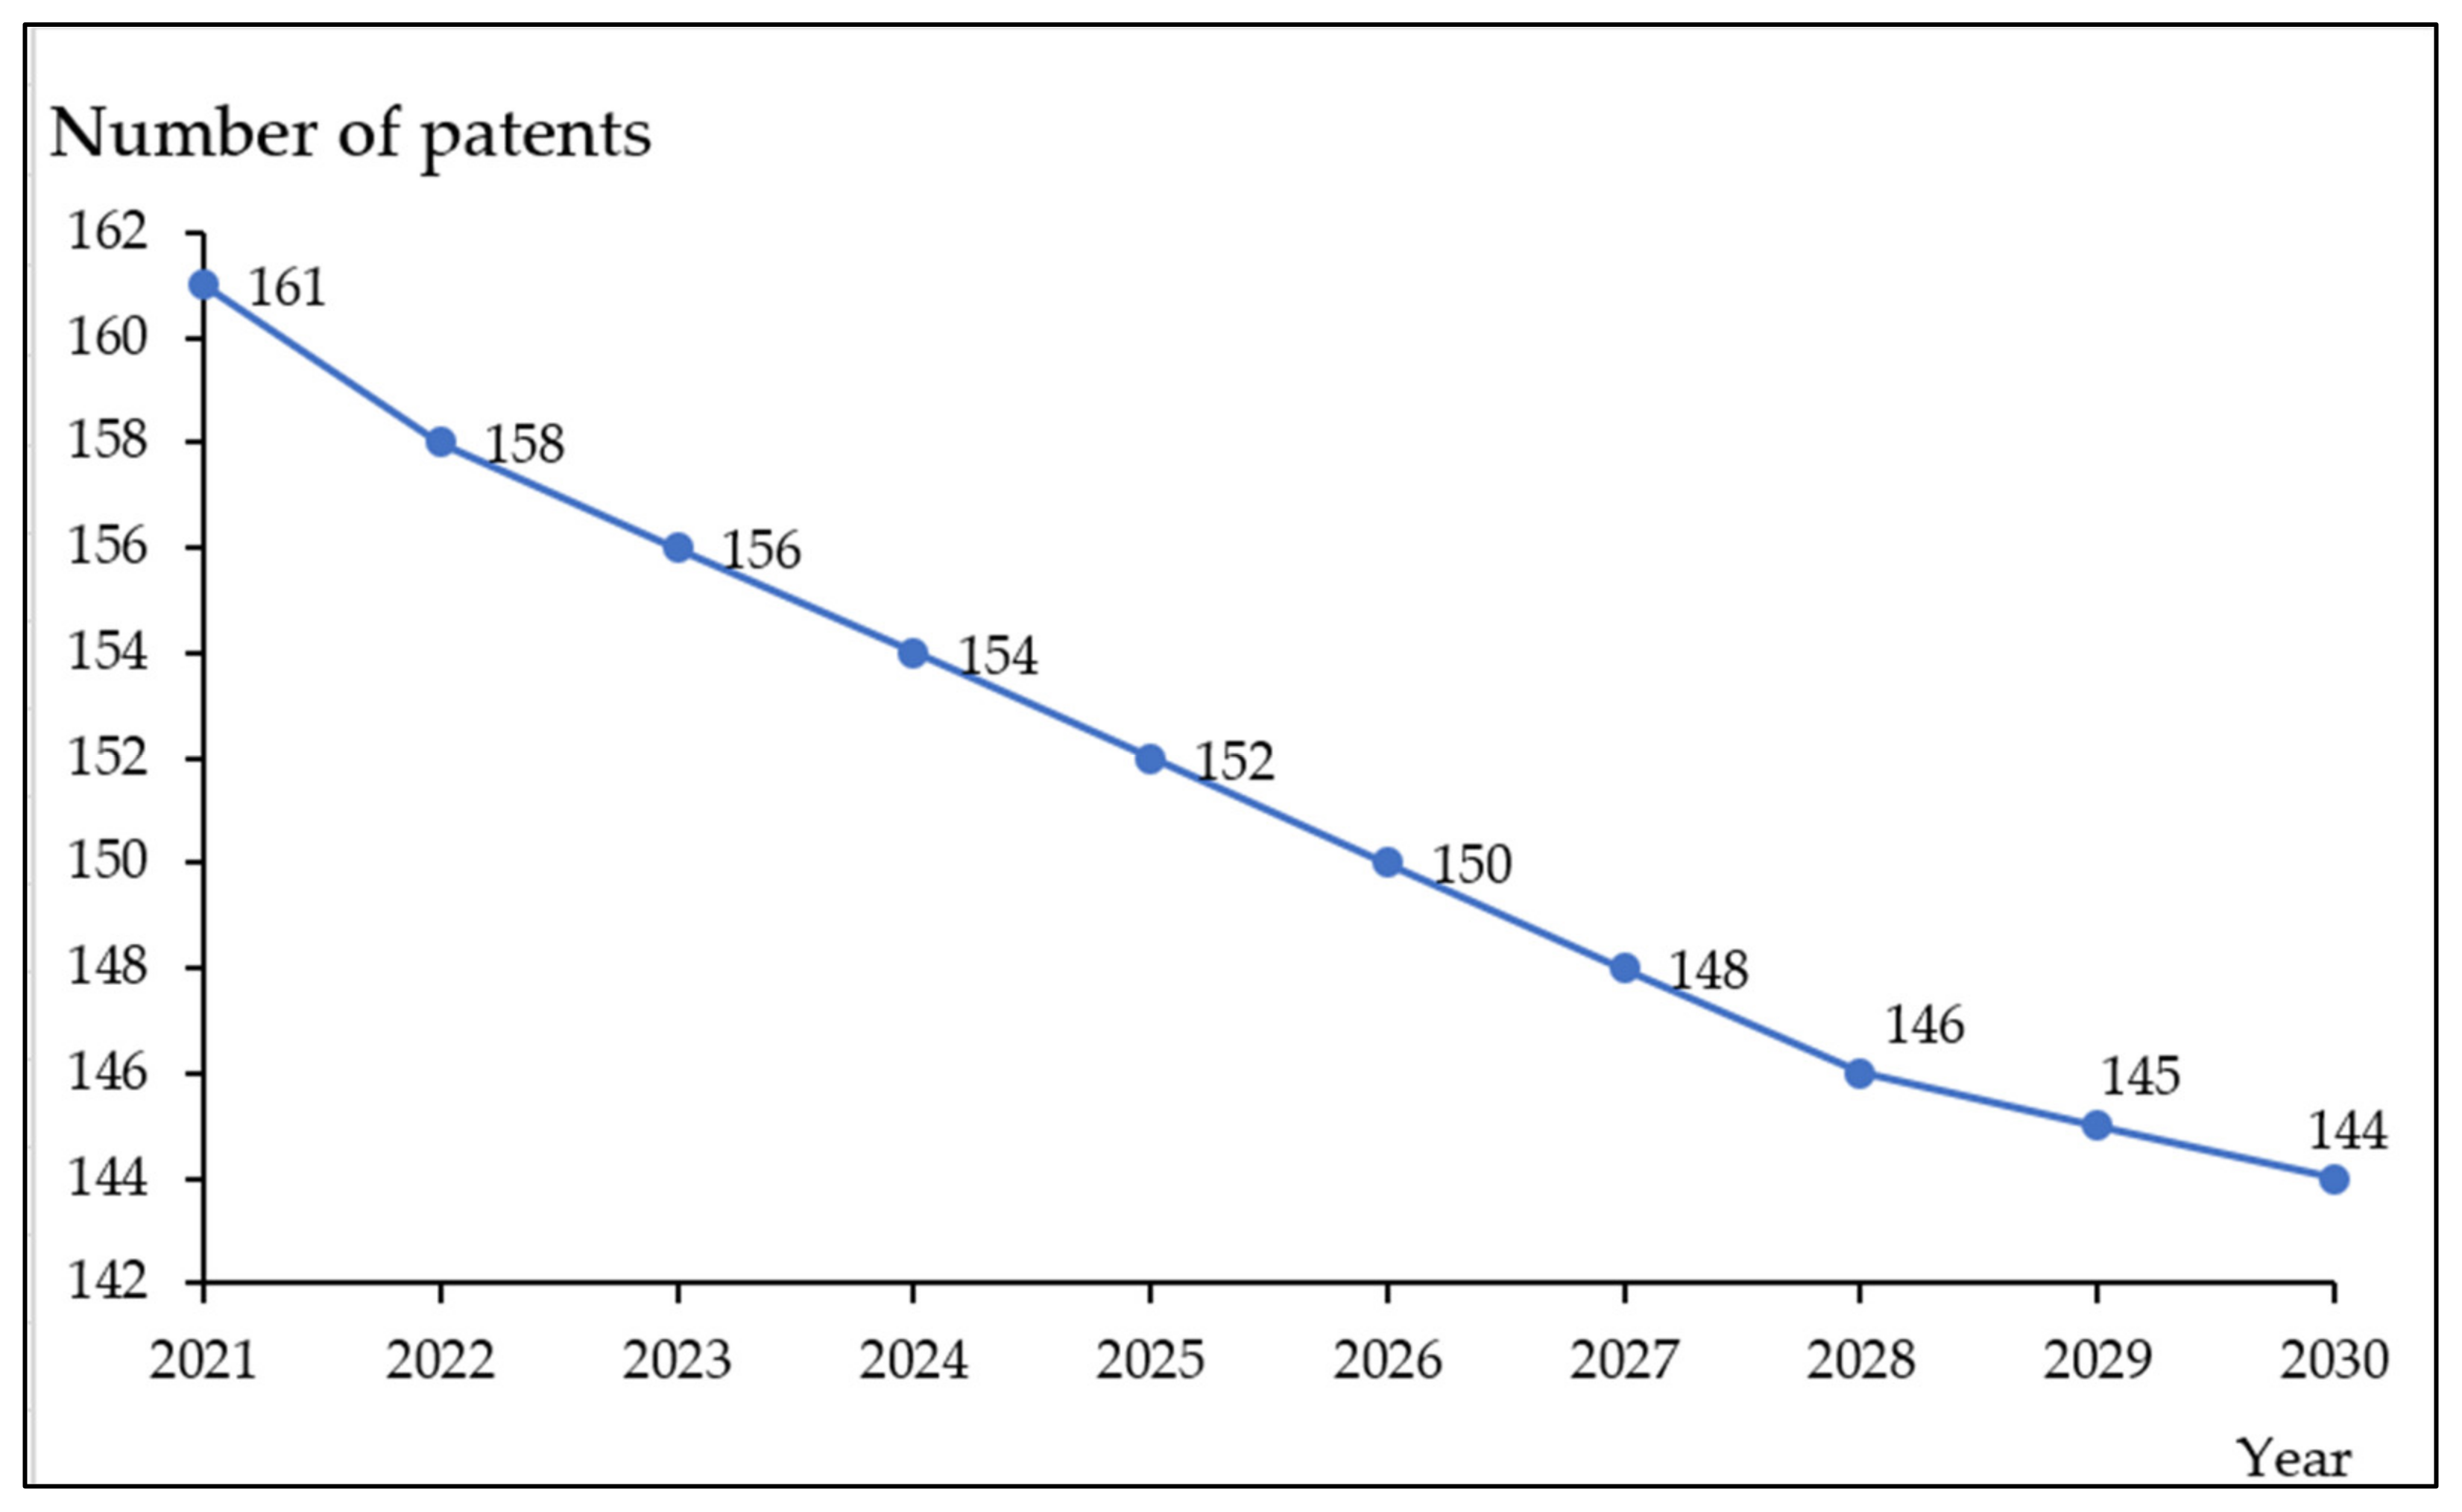
4.3. Forecast the Future Development Trend
5. Conclusions
- (1)
- Strategic objectives for short-term development (1–3 years):
- (2)
- Strategic objectives of medium-term development (1–5 years):
- (3)
- Strategic objectives of long-term development (1–10 years):
Author Contributions
Funding
Institutional Review Board Statement
Informed Consent Statement
Data Availability Statement
Conflicts of Interest
References
- Author Group of China Automobile Industry Association. Economic Operation of Automobile Industry in 2021, China; China Automobile Industry Association: Beijing, China, 2022; Available online: http://www.caam.org.cn (accessed on 1 January 2020).
- Vernon, R. The product cycle hypothesis in a new international environment. Oxf. Bull. Econ. Stat. 1979, 41, 255–267. [Google Scholar]
- Pryshlakivsky, J.; Searcy, C. Life Cycle Assessment as a decision-making tool: Practitioner and managerial considerations. J. Clean. Prod. 2021, 309, 127344. [Google Scholar] [CrossRef]
- Zhang, G.; Tang, C. How could firm’s internal R&D collaboration bring more innovation? Technol. Forecast. Soc. Change 2017, 125, 299–308. [Google Scholar]
- Canuto da Silva, G.; Kaminski, P.C. Proposal of framework to managing the automobilemotive product development process. Cogent Eng. 2017, 4, 1317318. [Google Scholar]
- Mousavi, S.A.; Seiti, H.; Hafezalkotob, A.; Asian, S.; Mobarra, R. Application of risk-based fuzzy decision support systems in new product development: An R-VIKOR approach. Appl. Soft Comput. 2021, 109, 107456. [Google Scholar] [CrossRef]
- Fontem, B.; Smith, J. Analysis of a chance-constrained new product risk model with multiple customer classes. Eur. J. Oper. Res. 2019, 272, 999–1016. [Google Scholar] [CrossRef]
- Adler, T.R.; Pittz, T.G.; Meredith, J. An analysis of risk sharing in strategic R&D and new product development projects. Int. J. Proj. Manag. 2016, 34, 914–922. [Google Scholar]
- Chin, K.S.; Tang, D.W.; Yang, J.B.; Wong, S.Y.; Wang, H. Assessing new product development project risk by Bayesian network with a systematic probability generation methodology. Expert Syst. Appl. 2009, 36, 9879–9890. [Google Scholar]
- Allayannis, G.; Ofek, E. Exchange rate exposure, hedging, and the use of foreign currency derivatives. J. Int. Money Financ. 2001, 20, 273–296. [Google Scholar] [CrossRef] [Green Version]
- Guay, W.; Kothari, S.P. How much do firms hedge with derivatives? J. Financ. Econ. 2003, 70, 423–461. [Google Scholar] [CrossRef] [Green Version]
- Gan, S.; Ge, S.; Han, X.; Yan, S.; Liu, J. 2020 China Patent Investigation Report; Intellectual Property Development Research Center of State Intellectual Property Office: Beijing, China, 2021. [Google Scholar]
- Yuan, X.; Cai, Y. Forecasting the development trend of low emission vehicle technologies: Based on patent data. Technol. Forecast. Soc. Change 2021, 166, 120651. [Google Scholar] [CrossRef]
- Hanggara, F.D. Forecasting Car Demand in Indonesia with Moving Average Method. J. Eng. Sci. Technol. Manag. JES-TM 2021, 1, 1–6. [Google Scholar]
- Babai, M.Z.; Chen, H.; Syntetos, A.A.; Lengu, D. A compound-Poisson Bayesian approach for spare parts inventory forecasting. Int. J. Prod. Econ. 2021, 232, 107954. [Google Scholar] [CrossRef]
- Wan, J.P.; Xie, L.Q.; Hu, X.F. Study on the electric vehicle sales forecast with TEI@ I methodology. Int. J. Knowl. Eng. Data Min. 2021, 7, 1–38. [Google Scholar] [CrossRef]
- Tsang, Y.P.; Wong, W.C.; Huang, G.Q.; Wu, C.H.; Kuo, Y.H.; Choy, K.L. A fuzzy-based product life cycle prediction for sustainable development in the electric vehicle industry. Energies 2020, 13, 3918. [Google Scholar] [CrossRef]
- Lee, M. An analysis of the effects of artificial intelligence on electric vehicle technology innovation using patent data. World Pat. Inf. 2020, 63, 102002. [Google Scholar] [CrossRef]
- Wang, X.; Zeng, D.; Dai, H.; Zhu, Y. Making the right business decision: Forecasting the binary NPD strategy in Chinese automotive industry with machine learning methods. Technol. Forecast. Soc. Change 2020, 155, 120032. [Google Scholar] [CrossRef]
- Choi, Y.; Park, S.; Lee, S. Identifying emerging technologies to envision a future innovation ecosystem: A machine learning approach to patent data. Scientometrics 2021, 126, 5431–5476. [Google Scholar] [CrossRef]
- Lee, C.; Kwon, O.; Kim, M.; Kwon, D. Early identification of emerging technologies: A machine learning approach using multiple patent indicators. Technol. Forecast. Soc. Change 2018, 127, 291–303. [Google Scholar] [CrossRef]
- Teng, F.; Sun, Y.; Chen, F.; Qin, A.; Zhang, Q. Technology opportunity discovery of proton exchange membrane fuel cells based on generative topographic mapping. Technol. Forecast. Soc. Change 2021, 169, 120859. [Google Scholar] [CrossRef]
- Suhail, Y.; Upadhyay, M.; Chhibber, A. Machine learning for the diagnosis of orthodontic extractions: A computational analysis using ensemble learning. Bioengineering 2020, 7, 55. [Google Scholar] [CrossRef]
- Barrera-Animas, A.Y.; Oyedele, L.O.; Bilal, M.; Akinosho, T.D.; Delgado, J.M.D.; Akanbi, L.A. Rainfall prediction: A comparative analysis of modern machine learning algorithms for time-series forecasting. Mach. Learn. Appl. 2022, 7, 100204. [Google Scholar] [CrossRef]
- Ensafi, Y.; Amin, S.H.; Zhang, G.; Shah, B. Time-series forecasting of seasonal items sales using machine learning—A comparative analysis. Int. J. Inf. Manag. Data Insights 2022, 2, 100058. [Google Scholar] [CrossRef]
- Lin, S.; Lin, R.; Sun, J.; Wang, F.; Wu, W. Dynamically evaluating technological innovation efficiency of high-tech industry in China: Provincial, regional and industrial perspective. Socio-Econ. Plan. Sci. 2021, 74, 100939. [Google Scholar] [CrossRef]
- Kim, J.E.; Cho, Y.S.; Kim, Y.R. The Major Common Technology Field Analysis of Domestic Mobile Carriers based on Patent Information Data. J. Korea Acad.-Ind. Coop. Soc. 2017, 18, 723–737. [Google Scholar]
- Chen, Y.H.; Chen, C.Y.; Lee, S.C. Technology forecasting and patent strategy of hydrogen energy and fuel cell technologies. Int. J. Hydrogen Energy 2011, 36, 6957–6969. [Google Scholar] [CrossRef]
- Altuntas, S.; Dereli, T. A Regression-Based “Patent Data Analysis” Approach: A Case Study for “Weapon Technology” Evaluation Process. IEEE Trans. Eng. Manag. 2021, 1–13. [Google Scholar] [CrossRef]
- Lin, H.L.; Ma, Y.Y. A New Method of Storage Management Based on ABC Classification: A Case Study in Chinese Supermarkets’ Distribution Center. SAGE Open 2021, 11, 21582440211023193. [Google Scholar] [CrossRef]
- Lin, C.W.; Kao, C.S.; Chien, C.S. The Evaluation of Venture Capital in the Biotech Investment of Taiwan Rice-Bran Polysaccharide. Adv. Manag. Appl. Econ. 2020, 10, 151–172. [Google Scholar]
- Lin, H.L.; Cho, C.C.; Ma, Y.Y.; Hu, Y.Q.; Yang, Z.H. Optimization plan for excess warehouse storage in e-commerce–based plant shops: A case study for Chinese plant industrial. J. Bus. Econ. Manag. 2019, 20, 897–919. [Google Scholar] [CrossRef] [Green Version]
- Karakan, G.; Koc, T. Technology forecasting methods and an application to white goods sector. J. Ind. Eng. Turk. Chamb. Mech. Eng. 2008, 20, 29–38. [Google Scholar]
- You, H.; Li, M.; Hipel, K.W.; Jiang, J.; Ge, B.; Duan, H. Development trend forecasting for coherent light generator technology based on patent citation network analysis. Scientometrics 2017, 111, 297–315. [Google Scholar] [CrossRef]
- Jose Basallo-Triana, M.; Rodriguez-Sarasty, J.A.; Dario Benitez-Restrepo, H. Analogue-based demand forecasting of short life-cycle products: A regression approach and a comprehensive assessment. Int. J. Prod. Res. 2016, 55, 2336–2350. [Google Scholar] [CrossRef]
- Phan, K.; Daim, T. Forecasting the maturity of alternate wind turbine technologies through patent analysis. In Research and Technology Management in the Electricity Industry; Springer: London, UK, 2013; pp. 189–211. [Google Scholar]
- Yun, J.; Geum, Y. Automobilemated classification of patents: A topic modeling approach. Comput. Ind. Eng. 2020, 147, 106636. [Google Scholar] [CrossRef]
- Altuntaş, F.; Yilmaz, M. Patent analizi ile teknoloji ağlarının oluşturulması. J. Entrep. Innov. Manag. 2017, 6, 97–129. [Google Scholar]
- Kyebambe, M.N.; Cheng, G.; Huang, Y.; He, C.; Zhang, Z. Forecasting emerging technologies: A supervised learning approach through patent analysis. Technol. Forecast. Soc. Change 2017, 125, 236–244. [Google Scholar] [CrossRef]
- Dutt, R.; Rathi, P.; Krishna, V. Novel mixed-encoding for forecasting patent grant duration. World Pat. Inf. 2021, 64, 102007. [Google Scholar] [CrossRef]
- Kim, G.; Bae, J. A novel approach to forecast promising technology through patent analysis. Technol. Forecast. Soc. Change 2017, 117, 228–237. [Google Scholar] [CrossRef]
- Cho, J.H.; Lee, J.; Sohn, S.Y. Predicting future technological convergence patterns based on machine learning using link prediction. Scientometrics 2021, 126, 5413–5429. [Google Scholar] [CrossRef]
- Chang, P.C.; Wu, J.L.; Tsao, C.C.; Lin, M.H. A patent quality classification system using a kernel-pca with svm. In Proceedings of the ADVCOMP 2015: The Ninth International Conference on Advanced Engineering Computing and Applications in Sciences, Nice, France, 19–24 July 2015. [Google Scholar]
- San Kim, T.; Sohn, S.Y. Machine-learning-based deep semantic analysis approach for forecasting new technology convergence. Technol. Forecast. Soc. Change 2020, 157, 120095. [Google Scholar]
- Lin, C.C.; Lin, C.L.; Shyu, J.Z. Hybrid multi-model forecasting system: A case study on display market. Knowl.-Based Syst. 2014, 71, 279–289. [Google Scholar] [CrossRef]
- Breiman, L. Bagging predictors. Mach. Learn. 1996, 24, 123–140. [Google Scholar] [CrossRef] [Green Version]
- Freund, Y.; Schapire, R.E. Experiments with a new boosting algorithm. In Proceedings of the ICML’96: Proceedings of the Thirteenth International Conference on Machine Learning, Bari, Italy, 3–6 July 1996; Morgan Kaufmann Publishers Inc.: San Francisco, CA, USA, 1996. [Google Scholar]
- Xiao, F.; Gao, X. The ring-shaped route body structure design and evaluation method. In Proceedings of the FISITA 2012 World Automotive Congress; Springer: Berlin/Heidelberg, Germany, 2013; pp. 447–461. [Google Scholar]
- Julong, D. Introduction to grey system theory. J. Grey Syst. 1989, 1, 1–24. [Google Scholar]
- Engle, R.F.; Granger, C.W.J. Cointegration and Error Correction: Representation, Estimation and Testing. Econometrica 1987, 55, 251–276. [Google Scholar] [CrossRef]
- Davidson, J.E.; Hendry, D.F.; Srba, F.; Yeo, S. Econometric modelling of the aggregate time-series relationship between consumers’ expenditure and income in the United Kingdom. Econ. J. 1978, 88, 661–692. [Google Scholar] [CrossRef]
- Duan, L.; Liu, Z.; Yu, W.; Chen, W.; Jin, D.; Li, D.; Sun, S.; Dai, R. Modeling Analysis and Comparision of Neural Network Simulation Based on ECM and LSTM. J. Phys. Conf. Ser. 2021, 2068, 012041. [Google Scholar] [CrossRef]
- Lin, Y.; Chen, J.; Chen, Y. Dynamic relationships of knowledge creation activities in supply chains: Evidence from patent data in the US auto industry. Afr. J. Bus. Manag. 2011, 5, 12563–12576. [Google Scholar]
- Altshuller, G.S.; Shapiro, R.B. On the psychology of inventive creativity. Quest. Psychol. 1956, 6, 37–49. (In Russian) [Google Scholar]


| Aspects | Prosed Method | Other Methods (Qualitative/Quantitative) |
|---|---|---|
| Advantages |
|
|
| Disadvantages |
|
|
| Summary | After comparison, there are three reasons for choosing this scheme: (1) the calculation will be faster; (2) the obtained model will be more accurate; (3) it is suitable for a large amount of data and for the method of applying mathematics to assist in making decisions. | |
| Level 1 Classification | Level 2 Classification | Level 3 Classification |
|---|---|---|
| Safe car body (B62D21, B62D23, B62D25) | Car body that reduces front impact damage (B62D 21/00; B62D 23/00; B62D 25/00) | Front cross member |
| Front rail | ||
| Impact energy absorbing device | ||
| A pillar | ||
| Upper rail | ||
| Door panel | ||
| Front floor | ||
| Front panel | ||
| Subframe | ||
| Splash shield stiffener | ||
| Combinatorial optimization and others | ||
| Car body that reduces side impact damage (B62D 21/00; B62D 23/00; B62D 25/00) | B pillar | |
| Lower rail | ||
| Door panel and guard assay | ||
| Floor assembly | ||
| Roof member | ||
| Combinatorial optimization and others | ||
| Car body that reduces rear impact damage (B62D 21/00; B62D 23/00; B62D 25/00) | C pillar | |
| Back floor | ||
| Back rail | ||
| Back cross member | ||
| Combinatorial optimization and others |
| Year | Patent | Pearl Curve | ARIMA | Regression | Support Vector Machine | Neural Network | Ensemble (Bagging) | ||||||
|---|---|---|---|---|---|---|---|---|---|---|---|---|---|
| Actual Value | Predictive Value | Error | Predictive Value | Error | Predictive Value | Error | Predictive Value | Error | Predictive Value | Error | Predictive Value | Error | |
| 2001 | 209 | 206 | 3 | 217.5 | 9 | 185 | 24 | 333 | 124 | 217 | 8 | 189 | 20 |
| 2002 | 178 | 222 | 44 | 230.8 | 53 | 182 | 4 | 251 | 73 | 251 | 73 | 176 | 2 |
| 2003 | 241 | 234 | 7 | 244.9 | 4 | 180 | 61 | 233 | 8 | 212 | 29 | 181 | 60 |
| 2004 | 243 | 243 | 0 | 258.1 | 15 | 178 | 65 | 343 | 100 | 215 | 28 | 188 | 55 |
| 2005 | 358 | 247 | 111 | 271.5 | 87 | 175 | 183 | 246 | 112 | 224 | 134 | 191 | 167 |
| 2006 | 304 | 246 | 58 | 284.4 | 20 | 173 | 131 | 372 | 68 | 227 | 77 | 232 | 72 |
| 2007 | 364 | 240 | 124 | 297.2 | 67 | 171 | 193 | 198 | 166 | 250 | 114 | 254 | 110 |
| 2008 | 405 | 231 | 174 | 309.7 | 95 | 169 | 236 | 256 | 149 | 224 | 181 | 286 | 119 |
| 2009 | 368 | 217 | 151 | 321.9 | 46 | 167 | 201 | 483 | 115 | 225 | 143 | 320 | 48 |
| 2010 | 376 | 201 | 175 | 334 | 42 | 165 | 211 | 322 | 54 | 228 | 148 | 349 | 27 |
| 2011 | 219 | 184 | 35 | 345.8 | 127 | 163 | 56 | 418 | 199 | 227 | 8 | 165 | 54 |
| 2012 | 69 | 221 | 152 | 357.3 | 288 | 161 | 92 | 408 | 339 | 240 | 171 | 155 | 86 |
| 2013 | 124 | 205 | 81 | 368.6 | 245 | 159 | 35 | 421 | 297 | 224 | 100 | 145 | 21 |
| 2014 | 89 | 187 | 98 | 379.7 | 291 | 157 | 68 | 450 | 361 | 224 | 135 | 168 | 79 |
| 2015 | 95 | 170 | 75 | 390.6 | 296 | 155 | 60 | 457 | 362 | 224 | 129 | 168 | 73 |
| 2016 | 91 | 152 | 61 | 401.2 | 310 | 153 | 62 | 444 | 353 | 224 | 133 | 98 | 7 |
| 2017 | 110 | 136 | 26 | 411.5 | 302 | 151 | 41 | 434 | 324 | 229 | 119 | 102 | 8 |
| 2018 | 92 | 120 | 28 | 421.7 | 330 | 149 | 57 | 440 | 348 | 225 | 133 | 113 | 21 |
| 2019 | 105 | 106 | 1 | 431.5 | 327 | 148 | 43 | 438 | 333 | 225 | 120 | 93 | 12 |
| 2020 | 164 | 92 | 72 | 441.2 | 277 | 146 | 18 | 415 | 251 | 226 | 62 | 100 | 64 |
| Mean absolute error | NA | NA | 73.8 | NA | 161.39 | NA | 92.05 | NA | 206.8 | NA | 102.25 | NA | 55.25 |
| p Index | C Index | Model Class |
|---|---|---|
| >0.95 | <0.35 | Level 1 (very satisfied) |
| >0.8 | <0.5 | Level 2 (satisfied) |
| >0.7 | <0.65 | Level 3 (generally satisfied) |
| <0.7 | ≤0.7 | Level 4 (unqualified) |
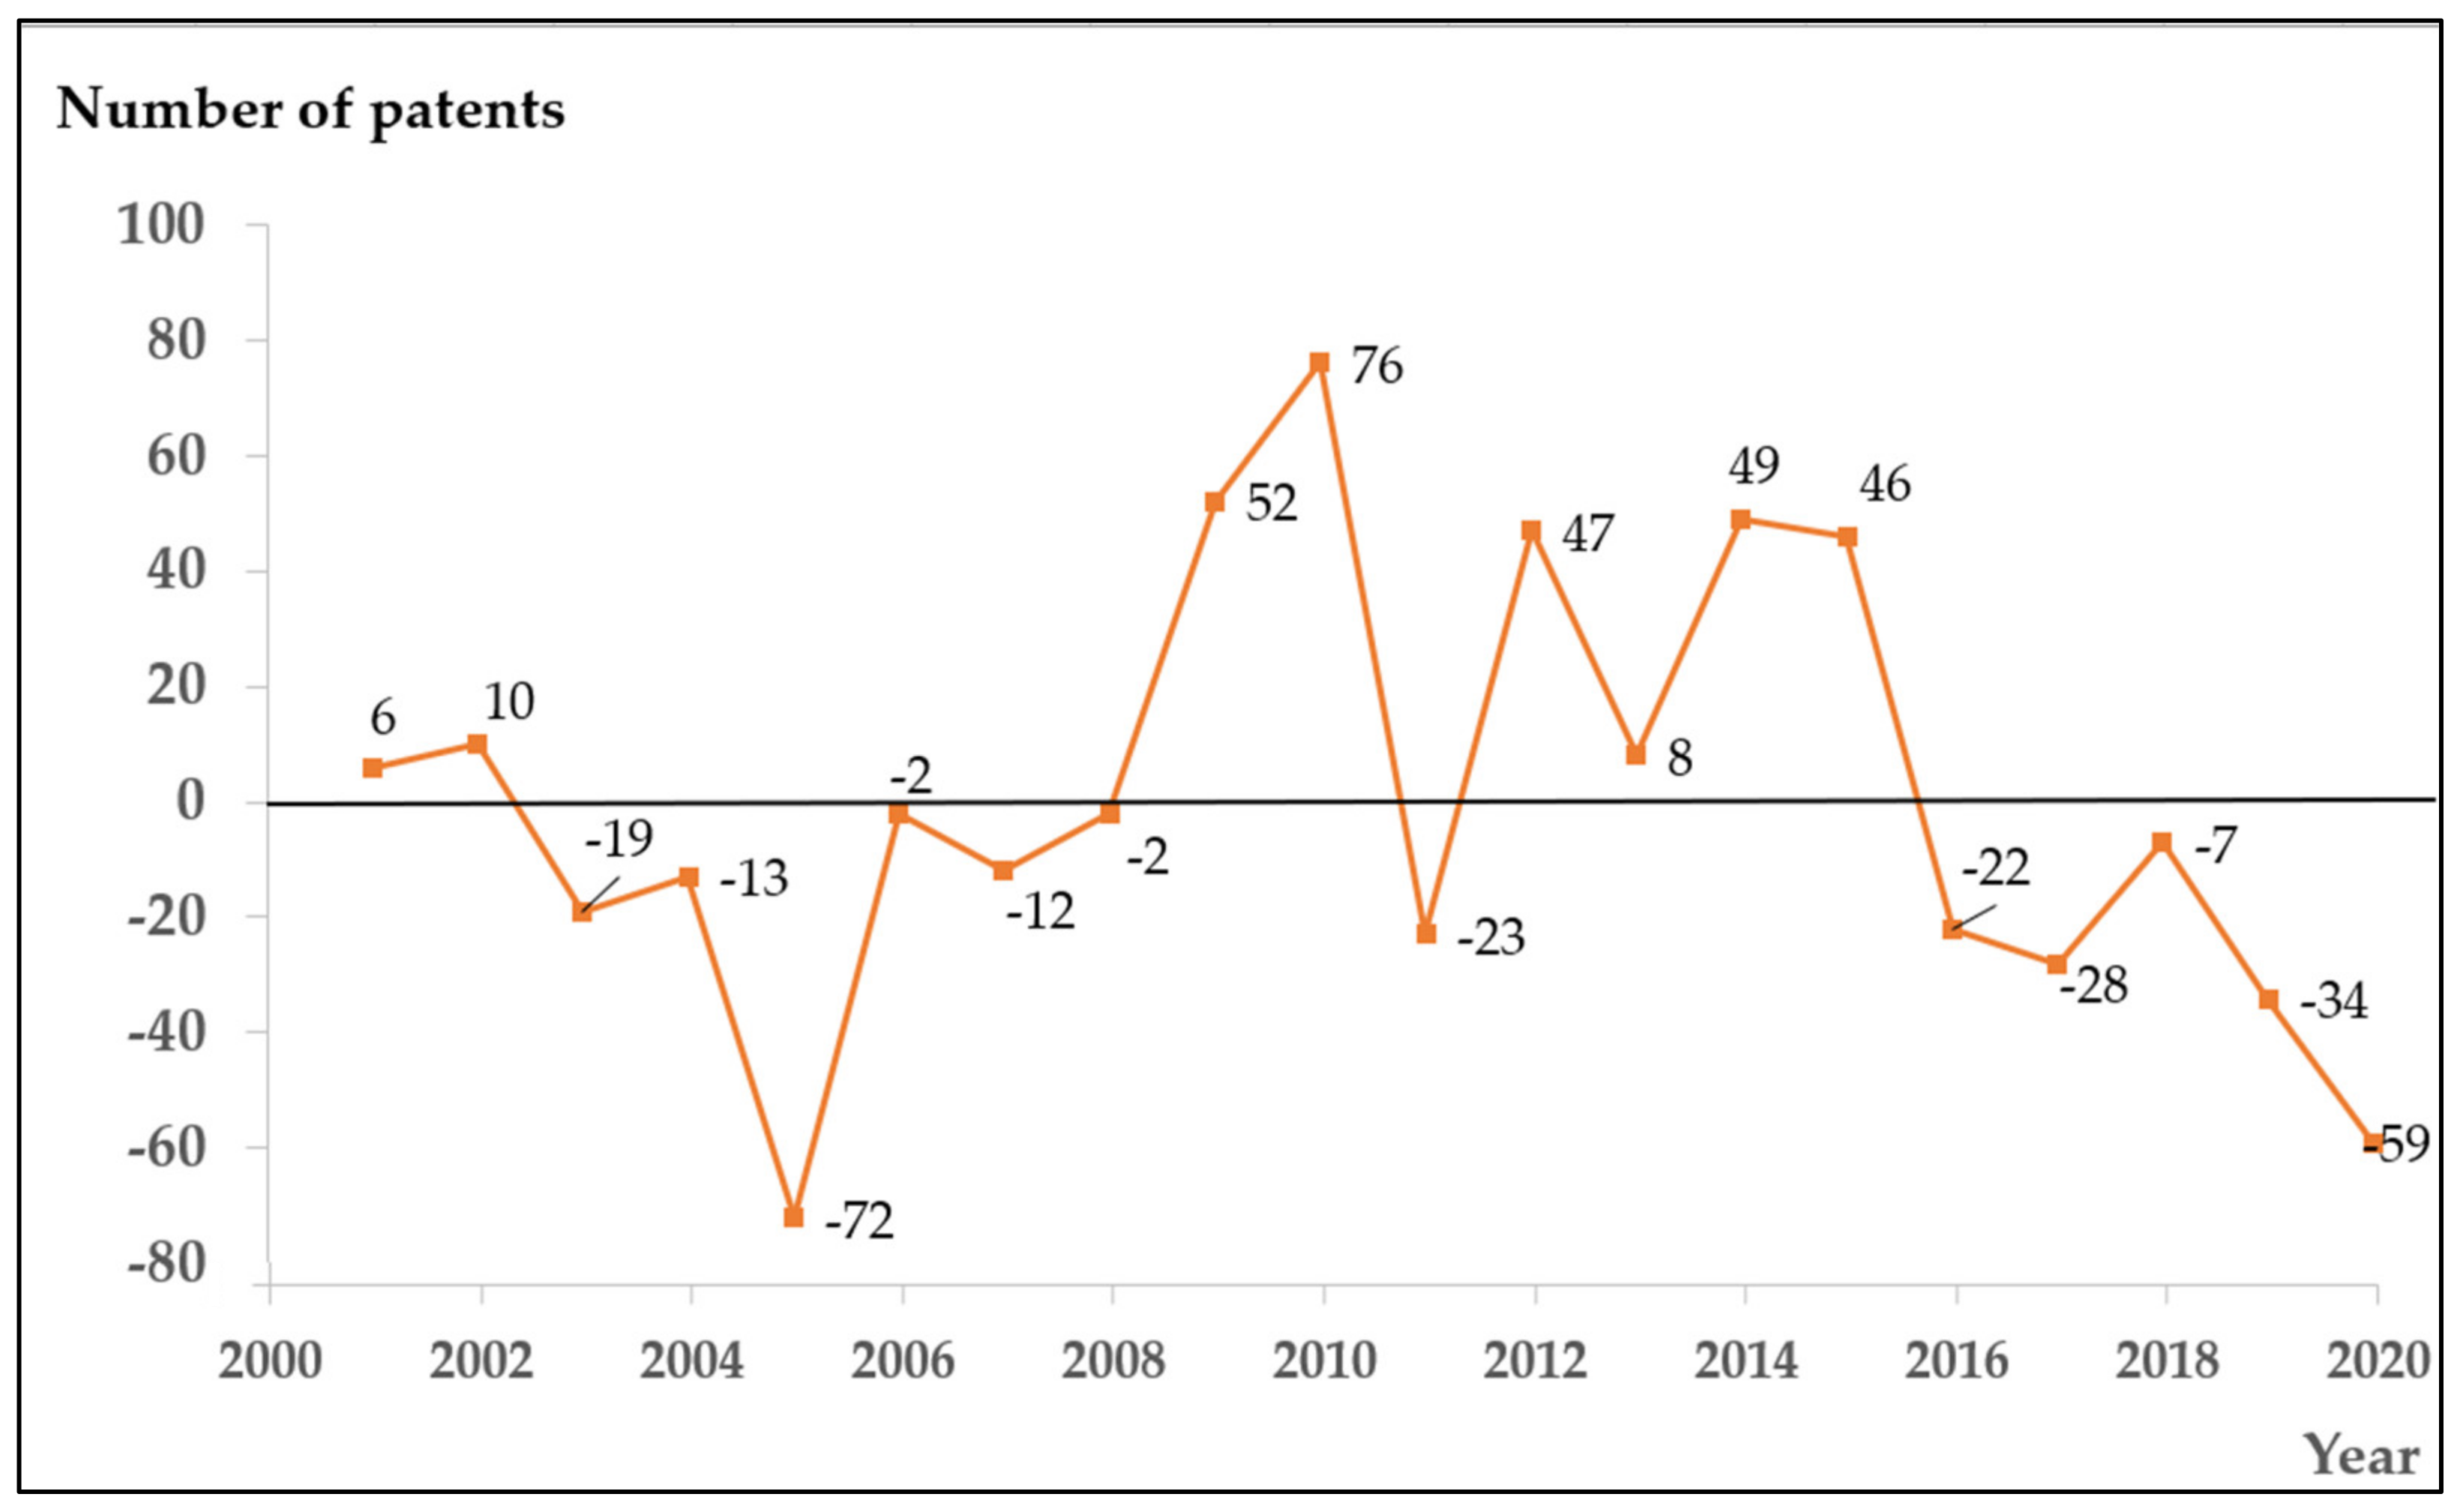
| Year | Quantity (Actual Value) | Forecast Quantity | Residual Error |
|---|---|---|---|
| 2001 | 209 | 189 | 20 |
| 2002 | 178 | 176 | 2 |
| 2003 | 241 | 181 | 60 |
| 2004 | 243 | 188 | 55 |
| 2005 | 358 | 191 | 167 |
| 2006 | 304 | 232 | 72 |
| 2007 | 364 | 254 | 110 |
| 2008 | 405 | 286 | 119 |
| 2009 | 368 | 320 | 48 |
| 2010 | 376 | 349 | 27 |
| 2011 | 219 | 165 | 54 |
| 2012 | 69 | 155 | −86 |
| 2013 | 124 | 145 | −21 |
| 2014 | 89 | 168 | −79 |
| 2015 | 95 | 168 | −73 |
| 2016 | 91 | 98 | −7 |
| 2017 | 110 | 102 | 8 |
| 2018 | 92 | 113 | −21 |
| 2019 | 105 | 93 | 12 |
| 2020 | 164 | 100 | 64 |
| Process | Level | t-Statistic | Prob. * | |
|---|---|---|---|---|
| Original sequence test | ADFTS | 1% | −1.752625 | 0.6869 |
| Test critical values | −4.532598 | |||
| First order difference sequence | ADFTS | 1% | −3.775465 | 0.0430 * |
| Test critical values | −4.571559 | |||
| Process | Level | t-Statistic | Prob. * | ||
|---|---|---|---|---|---|
| Original sequence test | ADFTS | 1% | −1.874321 | 0.6280 | |
| Test critical values | −4.532598 | ||||
| First order difference sequence | ADFTS | 1% | −4.087372 | 0.0245 * | |
| Test critical values | −4.571559 | ||||
| Values | t-Statistic | Prob.* | |
|---|---|---|---|
| Tests | |||
| ADFTS | −6.740233 | 0.0000 ** | |
| Test critical values: 1% level | −2.699769 | ||
| Process | Variable | Coefficient | Std. Error | t-Statistic | Prob. |
|---|---|---|---|---|---|
| EECM (short-term error level) | C | −2.503389 | 12.14467 | −0.206131 | 0.8397 |
| D(INC02) | 0.359942 | 0.177777 | 2.024687 | 0.0624 | |
| ECM(−1) | −0.107066 | 0.331128 | −0.323337 | 0.7512 | |
| EECM (long-term error level) | C | −3.844246 | 10.35557 | −0.371225 | 0.7151 |
| D(INC02) | 0.354652 | 0.156139 | 2.271378 | 0.0364 |
Publisher’s Note: MDPI stays neutral with regard to jurisdictional claims in published maps and institutional affiliations. |
© 2022 by the authors. Licensee MDPI, Basel, Switzerland. This article is an open access article distributed under the terms and conditions of the Creative Commons Attribution (CC BY) license (https://creativecommons.org/licenses/by/4.0/).
Share and Cite
Lee, C.-W.; Tao, F.; Ma, Y.-Y.; Lin, H.-L. Development of Patent Technology Prediction Model Based on Machine Learning. Axioms 2022, 11, 253. https://doi.org/10.3390/axioms11060253
Lee C-W, Tao F, Ma Y-Y, Lin H-L. Development of Patent Technology Prediction Model Based on Machine Learning. Axioms. 2022; 11(6):253. https://doi.org/10.3390/axioms11060253
Chicago/Turabian StyleLee, Chih-Wei, Feng Tao, Yu-Yu Ma, and Hung-Lung Lin. 2022. "Development of Patent Technology Prediction Model Based on Machine Learning" Axioms 11, no. 6: 253. https://doi.org/10.3390/axioms11060253