Article

Exploring the Limits of Euler–Bernoulli Theory in Micromechanics

by
Chrysoula K. Manoli
1,
Styliani Papatzani
1,2 and
Dionysios E. Mouzakis
1,*
1
Laboratory of Mechanics, Department of Mathematics and Engineering Sciences, Hellenic Army Academy, Evelpidon Avenue, Vari, 166 72 Attica, Greece
2
Department of Surveying and Geoinformatics Engineering, School of Engineering, University of West Attica, 250 P. Ralli & Thivon, 122 44 Egaleo, Greece
*
Author to whom correspondence should be addressed.
Axioms 2022, 11(3), 142; https://doi.org/10.3390/axioms11030142
Submission received: 17 December 2021 / Revised: 11 March 2022 / Accepted: 16 March 2022 / Published: 19 March 2022
(This article belongs to the Special Issue Applied Mathematics and Mechanics)

Abstract

:
In this study, the limits of the Euler–Bernoulli theory in micromechanics are explored. Raman spectroscopy, which is extremely accurate and reliable, is employed to study the bending of a microbeam of a length of 191 μm. It is found that at the micro-scale, the Euler–Bernoulli theory remains an exact and consistent tool, and, possibly, other elasticity theories (such as micropolar theory, gradient elasticity theory, and couple stress theory) are not always required to study this phenomenon. More specifically, good correlation was achieved between the theoretical and experimental results, the former acquired via the theoretical equations and the latter obtained with the use of atomic force microscopy and Raman spectroscopy. The exact predicted strain of an atomic force microscope microbeam under bending, by Euler–Bernoulli equations is confirmed by Raman spectroscopy.

1. Introduction

The limits of the Euler–Bernoulli theory in micromechanics are explored using solid experimental evidence. Micromechanics is a robust scientific field that studies mainly micro-electro-mechanical systems (MEMS) and nano-electro-mechanical systems (NEMS). MEMS generally refer to micro-scale devices involving one or more micromachined components that enable higher-level function. These devices have a characteristic length scale between 1 mm and 1 μm, whereas NEMS devices have a characteristic length scale below 1 μm [1,2].
These systems are becoming an integral part of our everyday life since they are used in many applications, from airbag triggers in automotive applications to adaptive optics for communications. MEMS are composed mainly of single-crystal silicon and silicon-based materials. According to their applications, MEMS and NEMS can be classified as sensors, actuators, and passive structures.
Several experimental techniques have been developed over the past decades that allow researchers to manipulate matter at a nanolevel and, also, monitor the changes. Of this significant list [3], with atomic force microscopy a surface of the material is probed by a selection of tips, and the topography of the surface is raster scanned and analyzed. Due to the fact that the depth of the pores or the height of the fibers/particles is measured, areas that other methods image as flat surfaces, it can provide data on the molecular forces of materials. In a frequent extension of the method, thin metallic probes can be used to perforate the surface of materials and, by analyzing the resisting material, the mechanical properties of the material can be determined.
Raman spectroscopy is useful in semiconductors since it is a powerful tool for mechanical testing by investigating mechanical stress and strain. The benefits of using Raman spectroscopy include the increased resolution of measurements, compared with the currently used methods, as well as the non-destructive nature of the process, which does not damage or otherwise alter the material under test [4,5].
The essence of this article is to declare that Euler–Bernoulli theory is more than enough to study the bending of microbeams of a length of at least 191 μm. It is experimentally proven that, for this dimension scale, other specialized theories are not always necessary (e.g., gradient elasticity, micropolar theory, etc.). The article continues with the determination of material properties in the micro-scale. The idea behind the bending of this microbeam is presented (Euler–Bernoulli theory); the experiments with AFM spectroscopy are described and, finally, the experimental and theoretical results are compared. Ultimately, conclusions are made, and discussion of the results is completed in the final section. The limits of the Euler–Bernoulli theory of the microbeam have, also, been studied in micro-Raman spectroscopy for strain measurement, including AFM, by Professor Wolfgang Müller and his team, at the Technische Universität in Berlin, DE, and is thoroughly described in a related book chapter [6]. In their pioneering work, they applied higher-order elasticity theories (coupled stress—gradient elasticity) in order to measure and compare strains at the micro-scale.

2. Materials, Methods, and Mathematical Background

2.1. Materials

The main material under focus in our study, or preferably our model material, was the pure silicon microbeam of the AFM used in the usual tapping mode or dynamic mode scanning procedures [7,8]. The beam is shown in Figure 1, and is usually referred to as the cantilever beam since it is usually loaded under single cantilever bending mode.

2.2. Methods

The testing procedure was simple and comprised of the following steps:
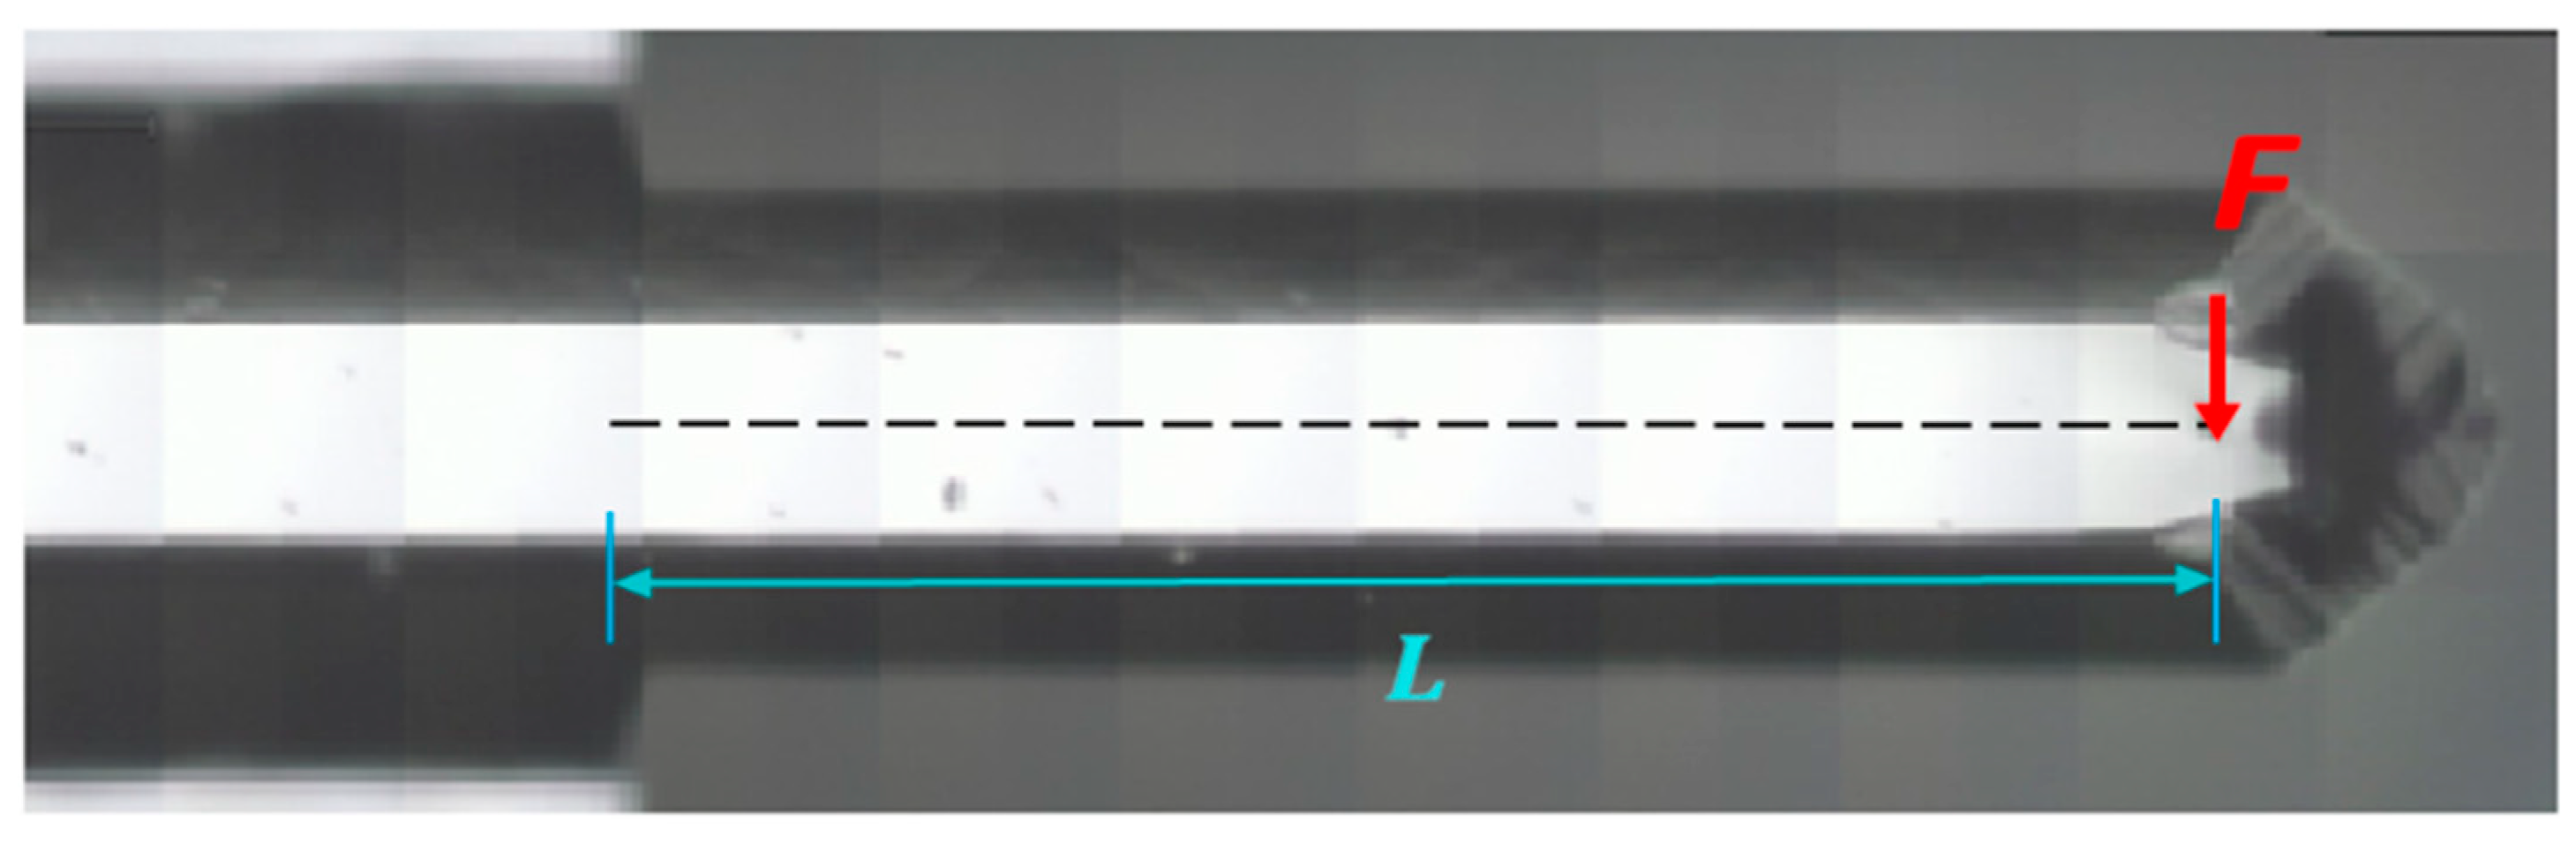
  • The Raman laser beam was set up under a microscope to focus on the AFM silicon microbeam.
  • An AFM experimental procedure on a clean glass substrate was started to gradually, and linearly, bend the AFM cantilever from z = 0 to z = 3.9259 × 10⁻⁶ m maximum deflection, as shown in Table 1.
3.
In each z-height of the tip of the silicon beam, a full scanning of the microbeam surface was performed to gain Raman data.
4.
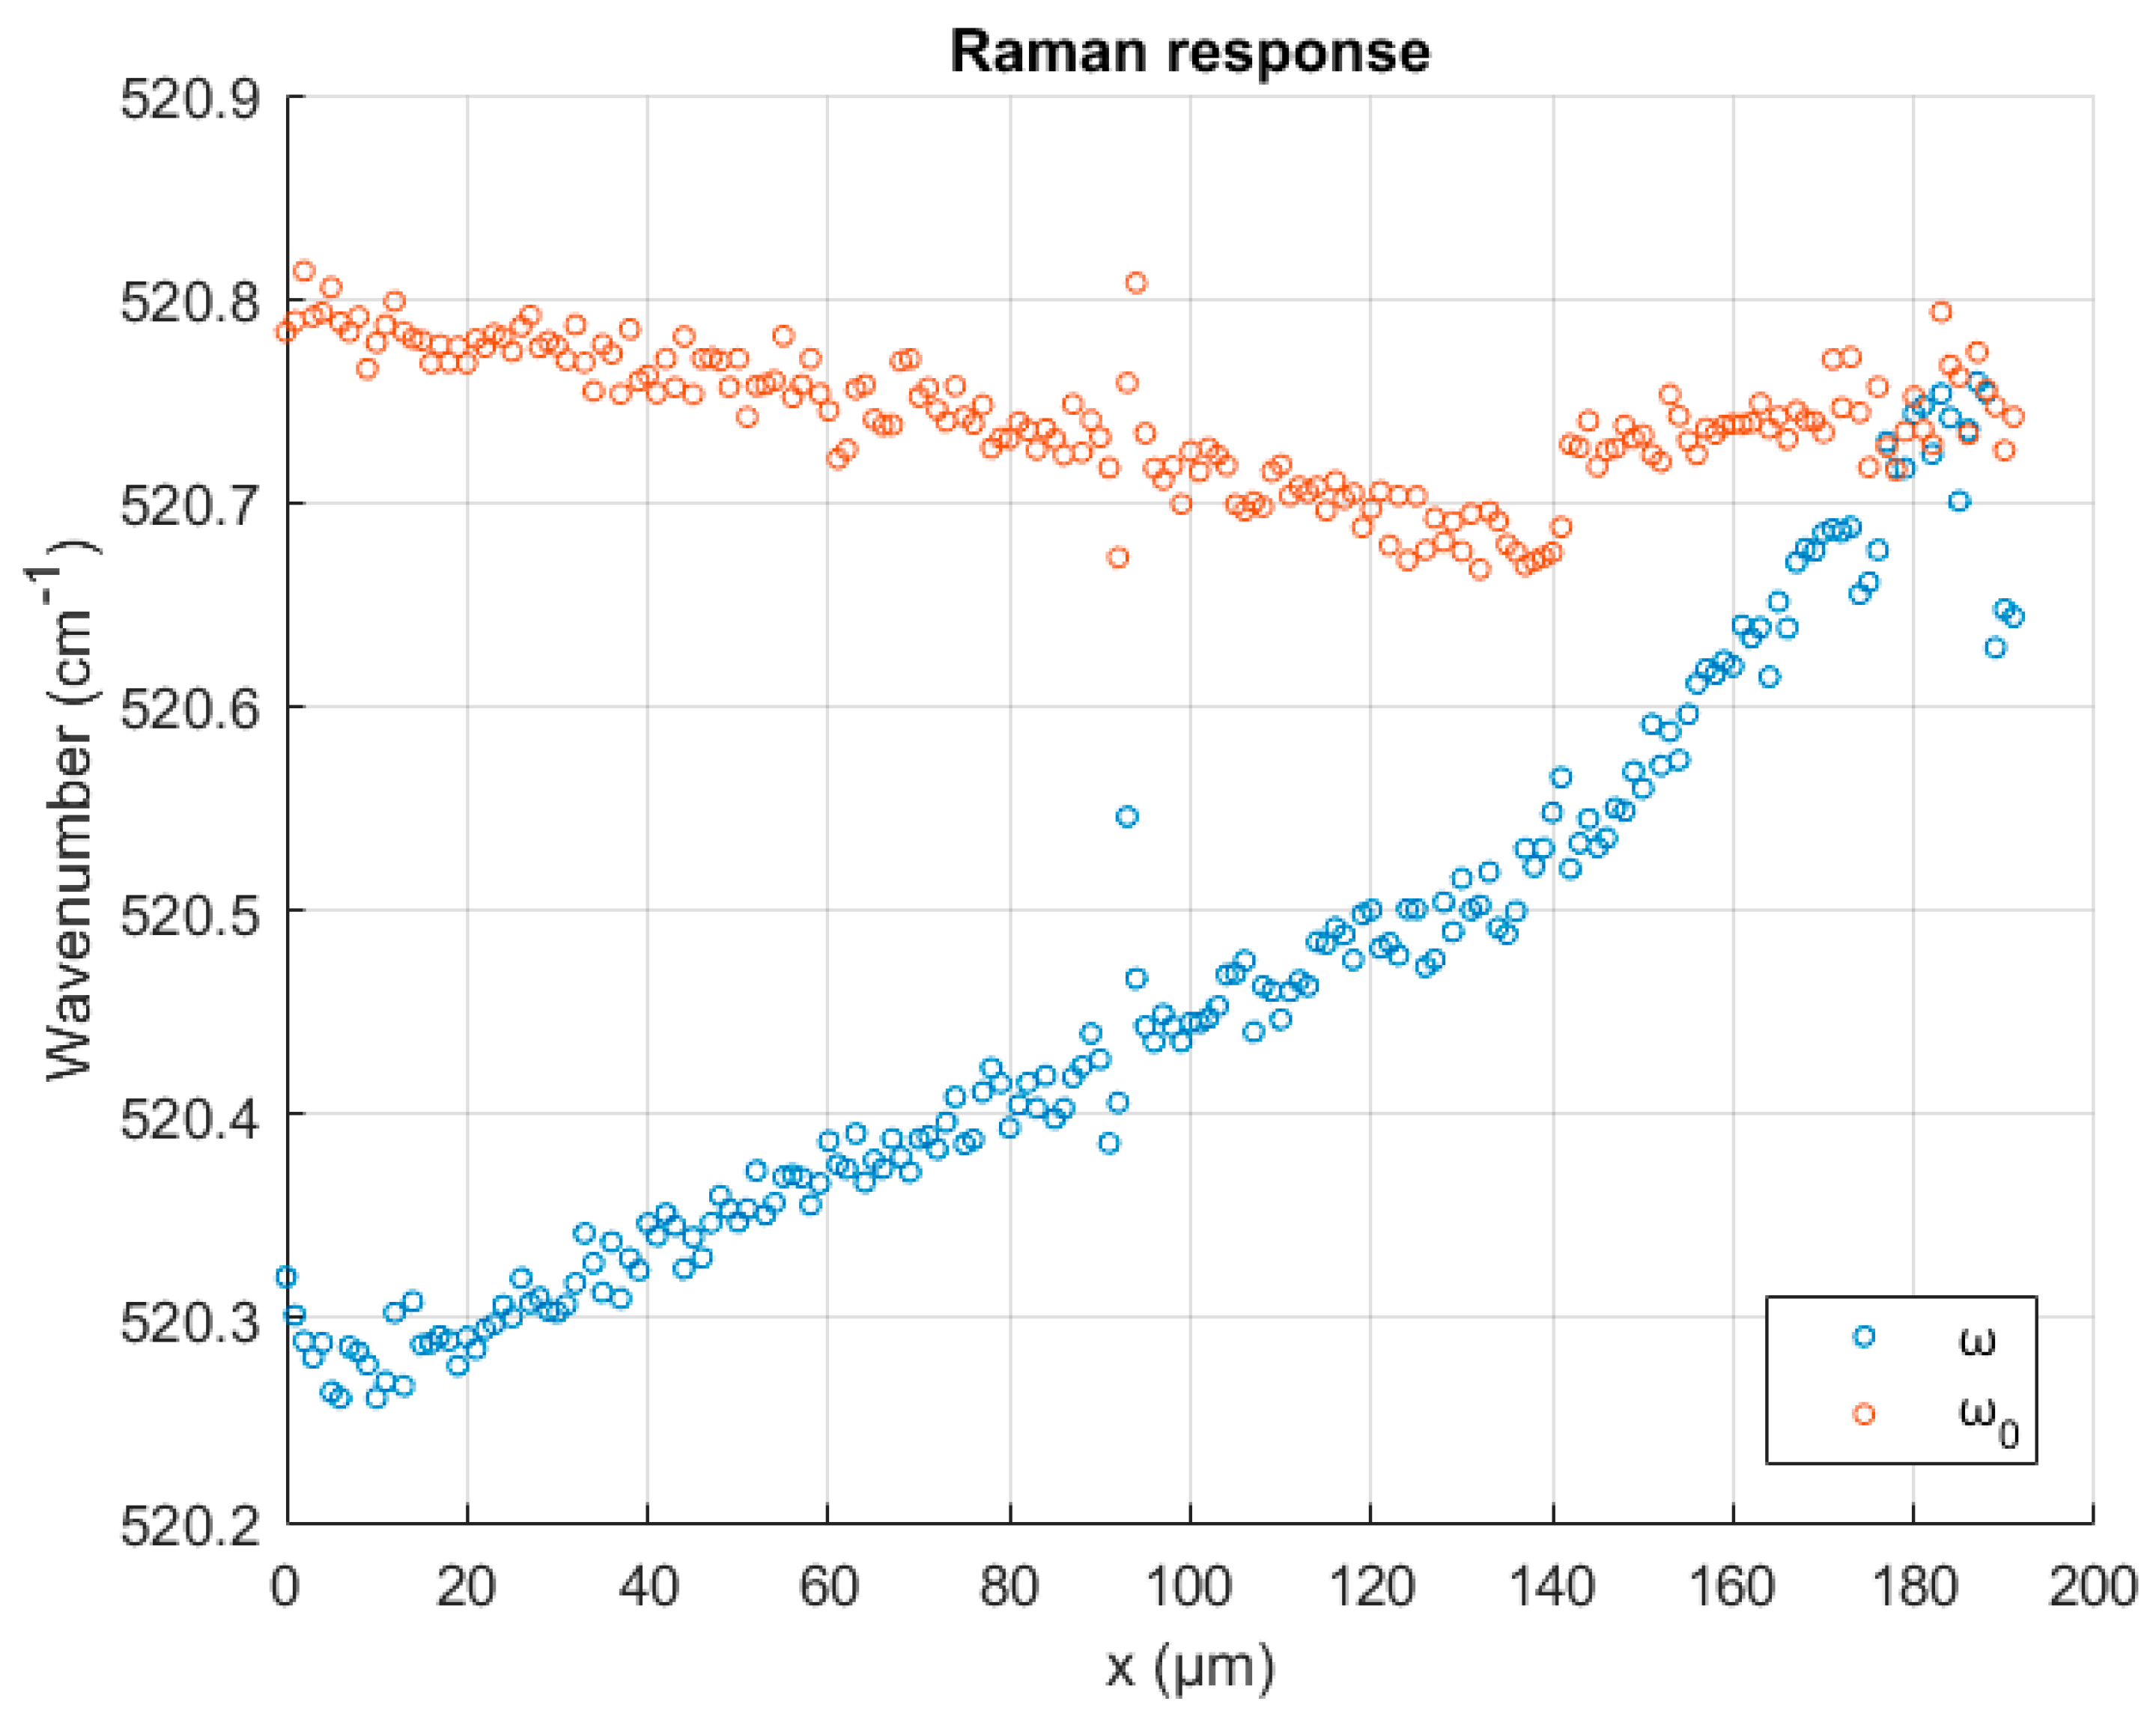
Raman shift data for the silicon beam was analyzed and the correlated linear strain was calculated via known Raman equations.
5.
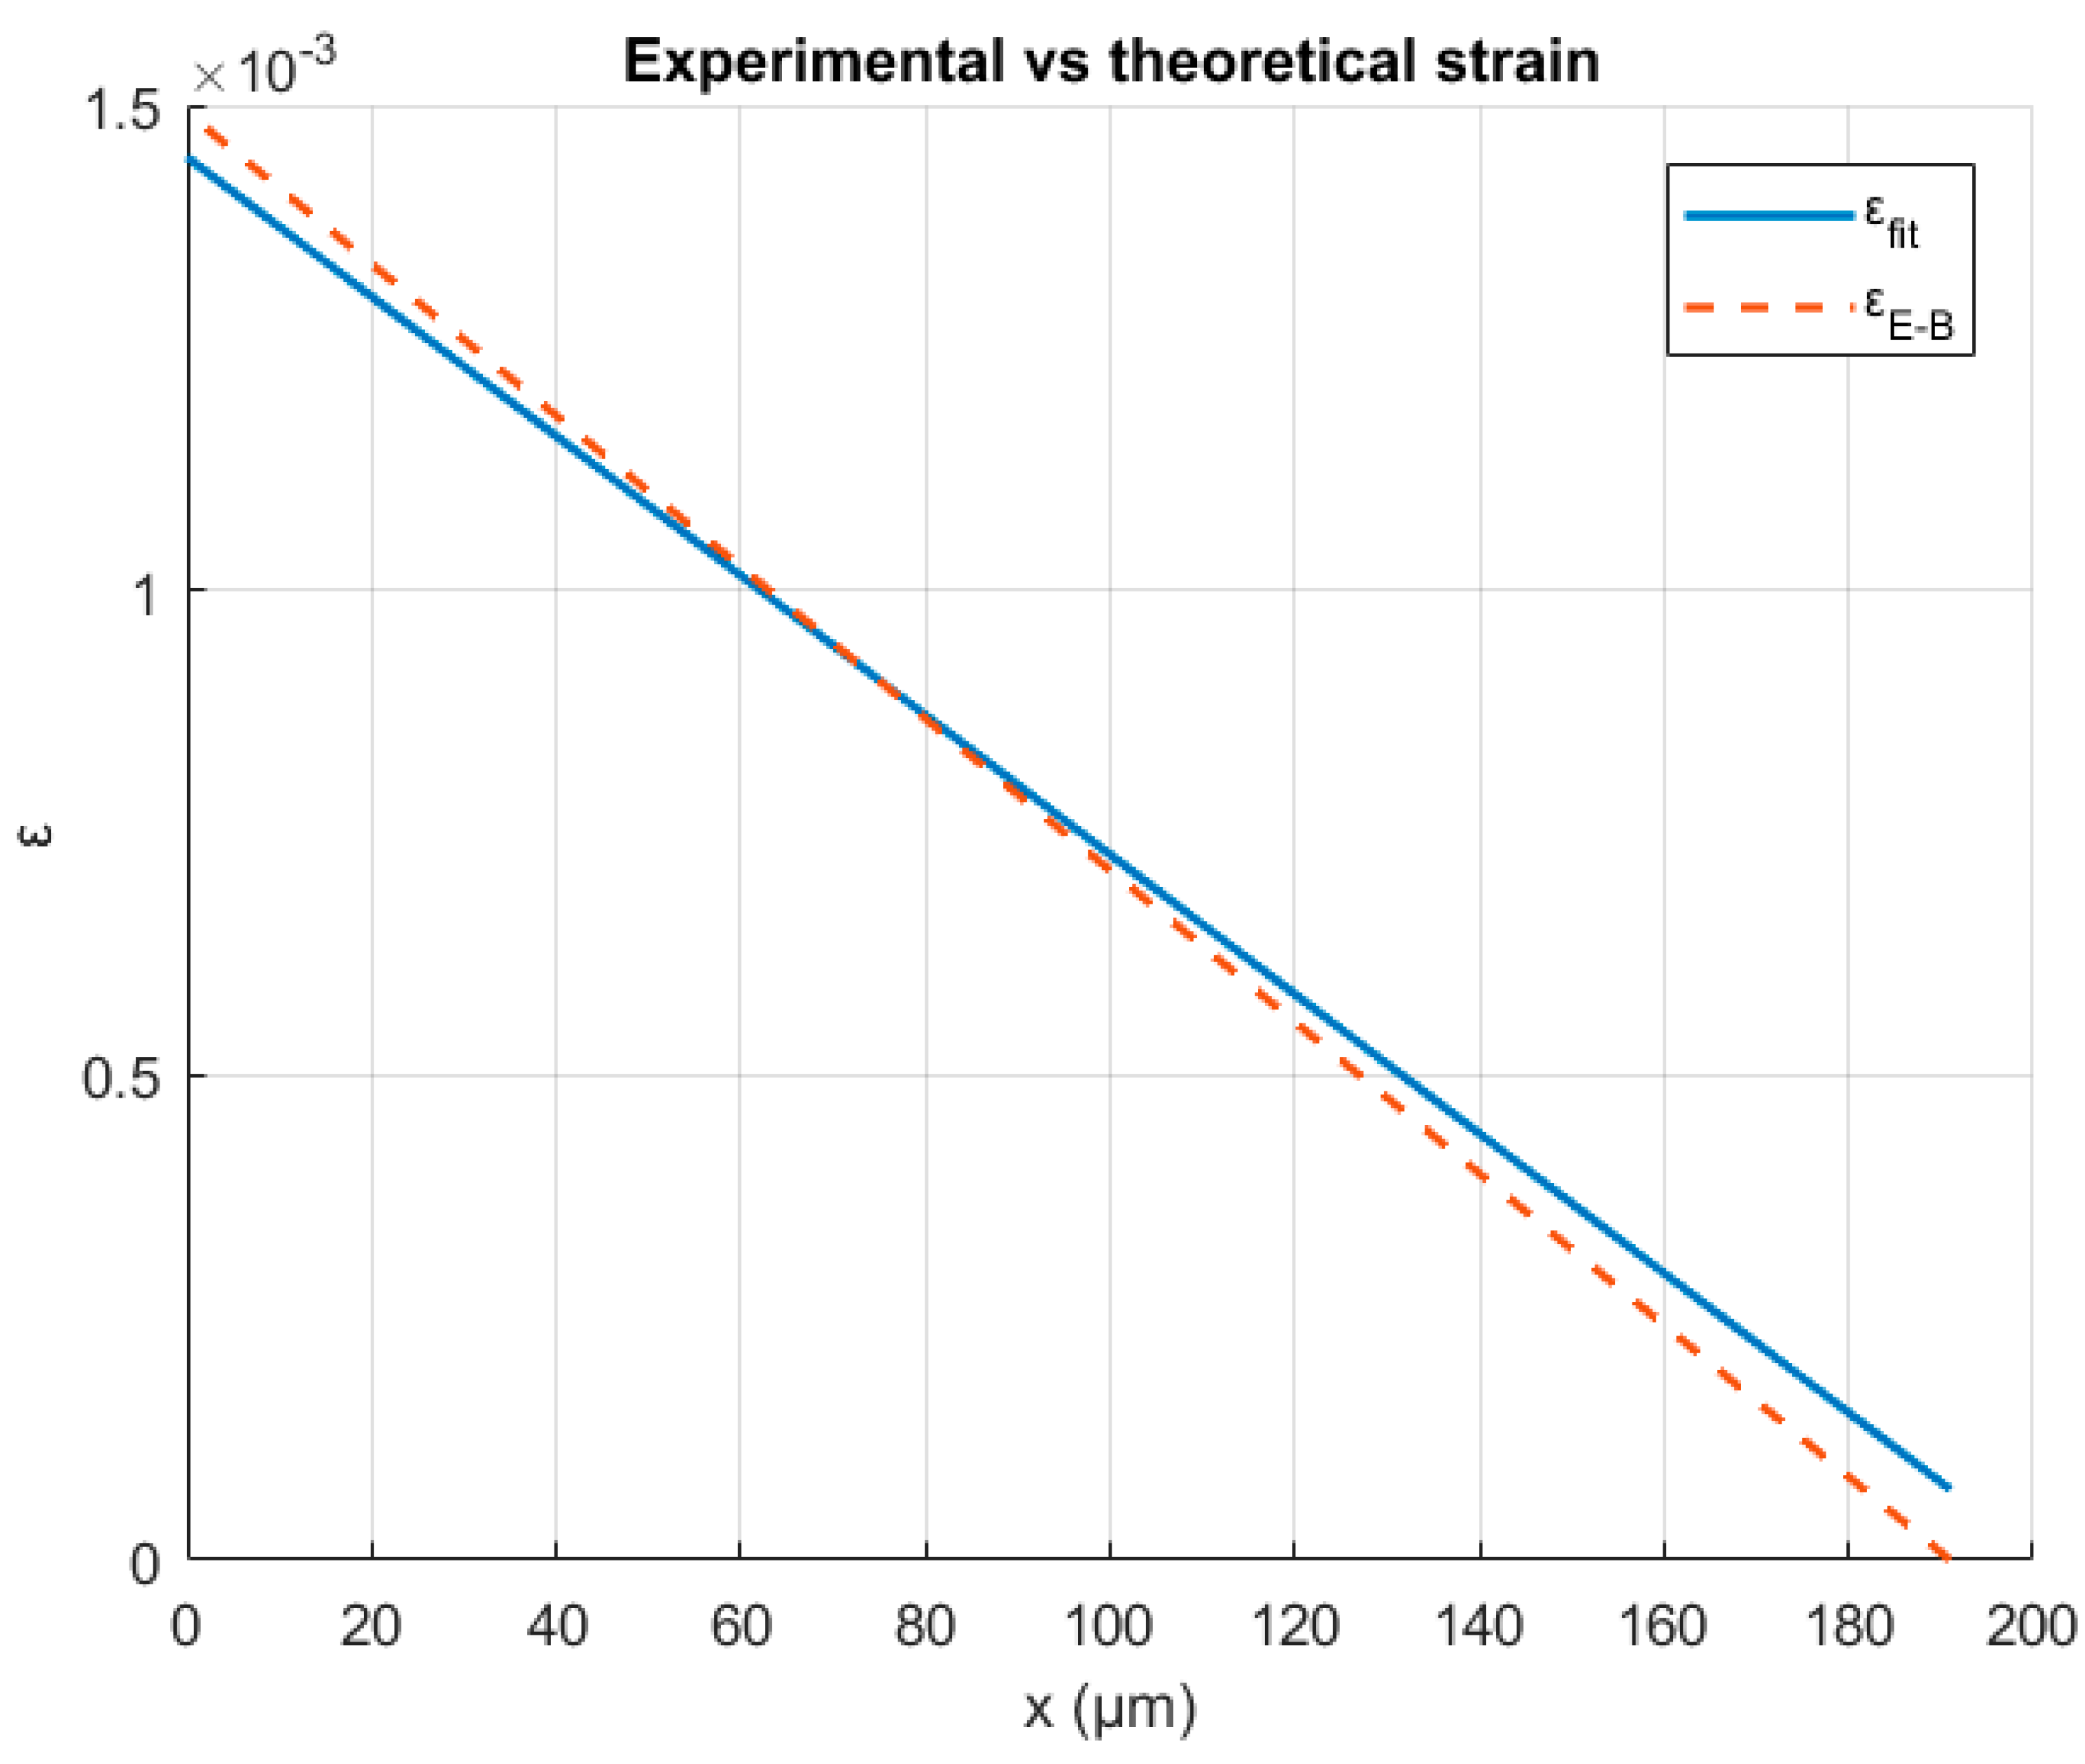
The theoretical linear strain for the microbeam surface was calculated through the Euler—Bernoulli theory.
6.
The linear strain calculations via Raman and Euler–Bernoulli were compared in graphs, as shown below in this paper.

2.3. Determination of Material Properties at the Micro-Scale

Most mechanical properties exhibit dependence on sample size. This is the reason that nanometer-scale experiments display some difficulties, such as fabrication of such small samples and problems associated with measuring ultra-small physical phenomena. For designing MEMS devices, it is very important to understand the mechanical properties of Si since these devices suffer thermal and mechanical stress during service.
Although atomic force microscopy has enabled the study of phenomena in the nanoscale, it can also be utilized for the purpose of measuring mechanical properties of nanostructures and nanomaterials. The quasi-static bending test technique is used to evaluate Young’s modulus, bending strength, and estimate the fracture toughness of the beams.
The fabrication of such structures, especially in the case of a silicon microbeam, is accomplished by means of enhanced-field anodization also using an AFM as part of a lithography-based process where it is used to evaluate the mechanical properties discussed above.
With respect to material parameters, the Raman effect, used with today’s progress in laser technology, allows us to determine local strains with a lateral precision of roughly one millimeter. The Raman effect is based on the inelastic scattering of monochromatic light that enters the system. The position of the Raman scattered light spectrum, or “frequency”, is determined by the state of strain on, and immediately beneath, the specimen’s surface. The specimen’s molecules are polarized by the laser light in this procedure. The frequency of the induced polarization is modulated by lattice vibrations (phonons). This is known as the Raman effect, and it can be seen in a spectrometer with a high sensitivity. These vibrational frequencies are used as chemical fingerprints for the identification of molecules. Usually, Raman shifts are typically in wavenumbers, which have units of inverse length (cm−1).

2.4. Theory of Bending for Small Deformations

The principle of atomic force microscopy is to measure the tip-sample forces (van der Waals, electrostatic, and damping) for studying a sample’s surface topography and properties. These forces cause bending which causes deformation to the beam.
One characteristic of the structure of the beam is that one of its dimensions is much larger than the others. The axis of the beam is defined along the longer dimension, which is the length, and a cross section, normal to this axis, is assumed to smoothly vary along the span or length of the beam. Based on this characteristic, there is the assumption that the beam follows linear elastic behavior which is simulated by Euler–Bernoulli beam theory [9,10,11].
The Euler–Bernoulli beam theory is a simplification of elasticity theory which provides a means of calculating the load carrying and deflection characteristics of beams. In general, as it deforms, every point on the beam would have a certain deformation and this deformation would be non-homogenous/non-linear. However, in order to be able to solve the differential equations of the equilibrium, we use the Euler–Bernoulli assumptions [12], and the corresponding well-known equations set with the corresponding theoretical assumptions.
To solve any equilibrium equation, we assume that the shear force and the bending moment are continuous and smooth over the length of the beam:
V   + V x d x 1 ,   M   + M x d x 1
and by using the equilibrium equation of force and bending moment, the above equations result in:
d V d x 1   =   q ,   d M d x 1   =   V
The beam extends from x = 0 to x = L and has a bending rigidity EI, which may be a function of x. The unknown field is the bending deflection w(x). The deflection w(x) is the vertical displacement of the neutral axis of the beam, and is a function only of the variable x. According to the assumption (1), the displacement field can be represented by the following functions:
u x   =   z w ( x ) x ,   u y   =   0 ,   u z   =   w ( x )
Another assumption is that the internal energy of beam member is entirely due to bending strains and stresses. Bending produces axial stresses σxx which are be abbreviated to σ and axial strains εxx which are abbreviated to ε.
The strains can be linked to the displacements by differentiating the axial displacement ux:
ε i j   =   1 2 ( u i , j + u j , i )
and because εyy = εzz = εxy = εxz = εyz = 0, the only effective strain is on x-axis, which is the normal strain and is provided by:
ε x x   =   z 2 w x 2
The bending stress can be represented mathematically according to Hooke’s law for isotropic materials as:
σ i j   =   2 μ ε i j   +   λ ε k k δ i j
where μ is the shear modulus, λ is Lame’s constant, δ is the Kronecker delta, and εkk are strains under Einstein’s summation convention.
Due to the fact that the z-axis strain and the Kronecker delta is zero in this case, σxy = σxz = σyz = 0, and the effective normal stresses are given by the following relations:
σ x x   =   ε x x   E   =   z 2 w x 2   E ,   σ y y   =   λ   z   2 w x 2 ,   σ z z   =   λ   z   2 w x 2
According to the literature [9], the differential equations of the deflection curve are the following well-known functions for bending:
E I 4 w ( x ) x 4 =   q ( x )   =   0 ,   E I 3 w ( x ) x 3 = Q ,   E I 2 w ( x ) x 2 = M ,     x     ( 0 ,   L )
Integrating the above equations in the case of a single cantilever beam with a single end load, and taking into consideration the appropriate boundary conditions, we obtained the following final expression for the bending deflection:
w ( x )   =   F E I x 2 ( x 6 L 2 )

3. Results and Discussion

3.1. AFM and Raman Spectroscopy

Atomic force microscopy was employed in order to apply a constant force, F, on the surface of the free end of the beam. This force caused bending to the AFM cantilever. Then, the Raman laser was applied to scan an area along the beam, in order to enable the maximum surface axial strain determination.
In Figure 1, the part of the silicon microbeam that was tested is from the point of the applied force (free end) to a small part of the rigid surface (fixed end). The microbeam was scanned in the form of a line (along its x-axis). The mechanical properties and bending data of the AFM cantilever are shown in Table 1 as provided by the manufacturer.
The results of the Raman test, as shown in Figure 2, present all the values of wavenumbers (ω) in the order of 520 cm−1 for each scanned point of the microbeam. With Raman spectroscopy, the wavenumbers in the same range as above, in the presence of stress (ω) and in absence of stress (ω0), were determined. In order to calculate the strain, the formula of the scalar relationship of shift and strain, as provided by [13,14,15,16], was employed. The Raman peak wavenumber sensitive to axial strain for a silica beam was obtained from the available literature [17,18], and was determined as 520 cm−1. For single-crystalline silicon, in a constricted polarization configuration and for a given uni-directional state of stress, the strain–shift equation can be represented as:
ε   =   1.4001   Δ ω ω 0

3.2. Comparison of Experimental Values with Theoretical Euler–Bernoulli Results

After the AFM cantilever bending, coupled with Raman spectroscopy, was conducted, the next step was to compare the experimental results with the theoretical values.
The equation of Euler–Bernoulli beam theory for the calculation of strain is provided by:
ε   =   z   F   ( L   x ) E   I
Firstly, as presented in Figure 2, the unloaded AFM cantilever beam wavenumbers around 520 cm−1 do not vary more than 0.1 cm−1 maximum. On the other hand, a linear increase in the wavenumber values can be observed in the loaded cantilever data. In fact, one can easily deduce that the free end of the cantilever which, according to bending assumptions, bears no strain, has wavenumbers almost identical to the non-loaded specimen. In Figure 3, a linear regression was applied through the experimental data of the bending strain, as calculated by the Raman spectroscopy formula in Equation (10). The results shown in Figure 3, clearly present the linear character for the bending strain as a function of the AFM cantilever beam x-axis length.
Finally, in Figure 4, the calculated Euler–Bernoulli theory results, for axial bending strain for an AFM cantilever beam, are plotted against the Raman linear regression strain data from Figure 3. As expected, the data determined from Raman spectroscopy strongly confirm not only the values but also the linear character of the axial bending strain for the single cantilever beam. Therefore, taking into account all the above findings, the Euler–Bernoulli theory assumptions are extremely valid in the micro-scale, as measured by the nano-accurate AFM bending results.
As reported in the introduction, in a thorough investigation which included many types of AFM microbeams, Liebold and Müller [6] explored the limits of the Euler–Bernoulli theory of microbeam bending, and they also employed micro-Raman spectroscopy for strain measurement with success for higher order elasticity theories.
The results presented in this paper and in [6] can be discussed in a wider frame. Many researchers have developed theoretical models for higher-order elasticity problems [19,20,21,22,23]. Few have been able to experimentally validate these, however. Especially in the field of MEMS/NEMS, things are complicated, as it is reported that the validity of the classical Euler–Bernoulli theory is strongly dependent on the material microstructure [24,25]. More true, Euler –Bernoulli theory is valid for solid bodies in single-dimension bending, preferably with homogeneous structures, and Timoshenko’s theory better describes problems in two-dimensional studies [26].
It has been demonstrated by others in the literature that when the microstructure is orthotetragonal Cosserat (nonlocal), and continua are equivalent to Cauchy continua. At the same time, it is known that the effect of the Cosserat constant (additional elastic moduli) is so small that, in fact, the Cosserat theory of elasticity does not provide any improvement in comparison with the classical theory of elasticity for homogeneous, solid bodies. Experiments on micro- and nano-mechanical systems (MEMS/NEMS) have shown that their behavior under bending loads differentiates from the classical predictions using Euler–Bernoulli theory and Hooke’s law [27,28,29]. This anomalous response has been interpreted as a material size effect.
The methodology of combining AFM measurements for a variety of silicon, or other material microbeams, alongside linear strain data derived by Raman spectroscopy is very useful for strain detection and comparison with other mechanical models too [30,31,32].

4. Conclusions

The aim of this study was to compare the experimentally determined axial strain of the AFM silicon microbeam by Raman spectroscopy with the theoretical values predicted by Euler–Bernoulli beam theory.
  • The experimental data show that, in the area of the maximum bending moment, the Raman response increases linearly.
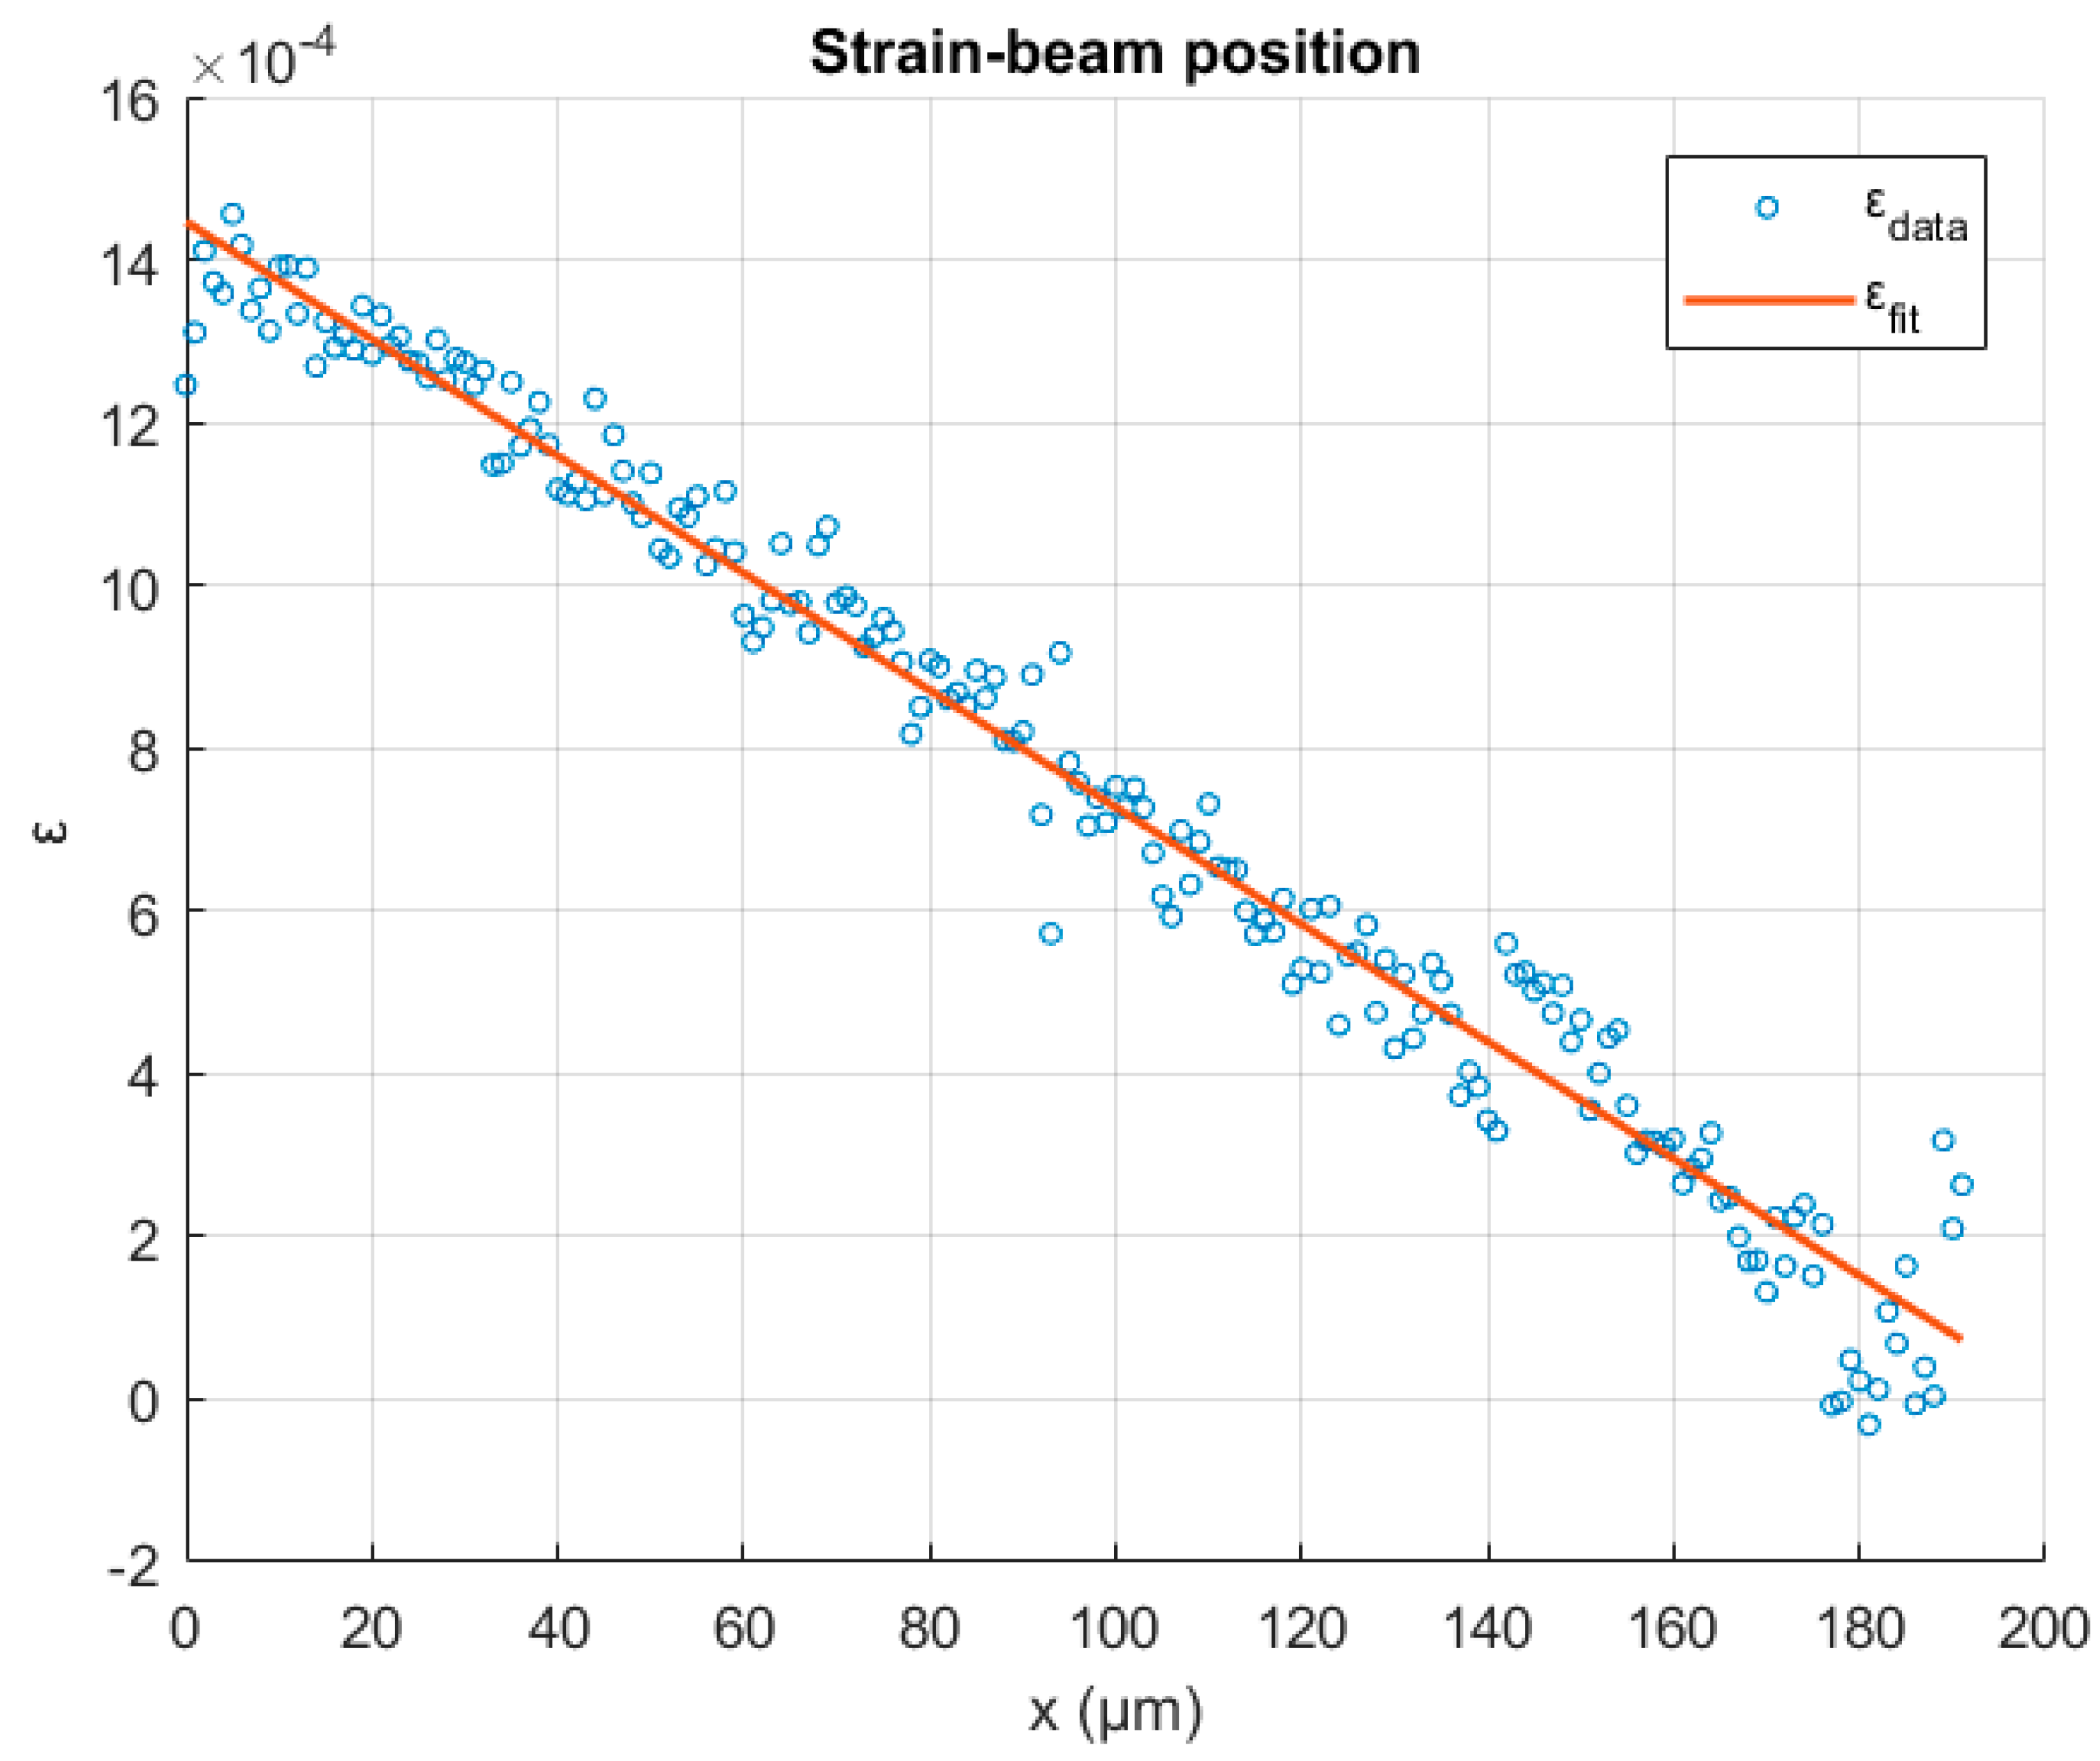
  • As shown in the strain–beam position graph, the maximum strain values appear in the fixed end area, whereas they are reduced to zero when the free end of the beam is approached.
  • The experimentally determined axial strain values for the silicon microbeam are almost identical to the theoretical ones provided by the Euler–Bernoulli approximation.
  • The combination of Raman spectroscopy with atomic force microscopy provides a useful means for the study of nanomechanical systems.

Author Contributions

Conceptualization, D.E.M.; methodology, C.K.M., D.E.M. and S.P.; formal analysis, C.K.M.; data curation, S.P.; writing—original draft preparation, C.K.M., D.E.M. and S.P.; writing—review and editing, C.K.M., D.E.M. and S.P. All authors have read and agreed to the published version of the manuscript.

Funding

This research received no external funding.

Acknowledgments

The authors gratefully acknowledge Wolfgang Müller at the Technische Universität Berlin, Institute of Mechanics, and his scientific team, for their grateful support and guidance during the experimental procedures.

Conflicts of Interest

The authors declare no conflict of interest.

References

  1. Srivastav, S.; Bhardwaj, P. Summit “Fabrication, sensing & application of MEMS/NEMS technology”. Int. J. Comput. Eng. Manag. 2011, 12, 57–60. [Google Scholar]
  2. Lyshevski, S.E. Mems and Nems: Systems, Devices, and Structures, 1st ed.; CRC Press: Boca Raton, FL, USA, 2002. [Google Scholar] [CrossRef]
  3. Papatzani, S.; Paine, K.; Calabria-Holley, J. A comprehensive review of the models on the nanostructure of calcium silicate hydrates. Constr. Build. Mater. 2015, 74, 219–234. [Google Scholar] [CrossRef]
  4. De Wolf, I. Micro-Raman spectroscopy to study local mechanical stress in silicon integrated circuits. Semicond. Sci. Technol. 1996, 11, 139–154. [Google Scholar] [CrossRef]
  5. De Wolf, I.; Senez, V.; Balboni, R.; Armigliato, A.; Frabboni, S.; Cedola, A.; Lagomarsino, S. Techniques for mechanical strain analysis in sub-micrometer structures: TEM/CBED, micro-Raman spectroscopy, X-ray micro-diffraction and modeling. Microelectron. Eng. 2003, 70, 425–435. [Google Scholar] [CrossRef]
  6. Khaloo, A.R.; Vayghan, A.G.; Bolhasani, M. Mechanical and Microstructural Properties of Cement Paste Incorporating Nano Silica Particles with Various Specific Surface Areas. Key Eng. Mater. 2011, 478, 19–24. [Google Scholar] [CrossRef]
  7. Veerapandian, M.; Yun, K. Study of Atomic Force Microscopy in Pharmaceutical and Biopharmaceutical Interactions-A Mini Review. Curr. Pharm. Anal. 2009, 5, 256–268. [Google Scholar] [CrossRef]
  8. Jung, S.-H.; Park, D.; Park, J.H.; Kim, Y.-M.; Ha, K.-S. Molecular imaging of membrane proteins and microfilaments using atomic force microscopy. Exp. Mol. Med. 2010, 42, 597–605. [Google Scholar] [CrossRef] [PubMed] [Green Version]
  9. Gere, J.M. Mechanics of Materials, 6th ed.; Thomson-Engineering: Riverside, CA, USA, 2003. [Google Scholar]
  10. Bauchau, O.A.; Craig, J.I. Euler-Bernoulli Beam Theory BT-Structural Analysis; Springer: Dordrecht, The Netherlands, 2009; pp. 173–221. [Google Scholar] [CrossRef]
  11. Civalek, Ö.; Demir, Ç. Bending analysis of microtubules using nonlocal Euler–Bernoulli beam theory. Appl. Math. Model. 2011, 35, 2053–2067. [Google Scholar] [CrossRef]
  12. Wang, C.M. Timoshenko Beam-Bending Solutions in Terms of Euler-Bernoulli Solutions. J. Eng. Mech. 1995, 121, 763–765. [Google Scholar] [CrossRef]
  13. Anastassakis, E.; Pinczuk, A.; Burstein, E.; Pollak, F.H.; Cardona, M. Effect of static uniaxial stress on the Raman spectrum of silicon. Solid State Commun. 1993, 88, 1053–1058. [Google Scholar] [CrossRef]
  14. Uchinokura, K.; Sekine, T.; Matsuura, E. Raman scattering by silicon. Solid State Commun. 1972, 11, 47–49. [Google Scholar] [CrossRef]
  15. De Wolf, I.; Maes, H.E.; Jones, S.K. Stress measurements in silicon devices through Raman spectroscopy: Bridging the gap between theory and experiment. J. Appl. Phys. 1996, 79, 7148–7156. [Google Scholar] [CrossRef]
  16. Prabhakara, V.; Nuytten, T.; Bender, H.; Vandervorst, W.; Bals, S.; Verbeeck, J. Linearized radially polarized light for improved precision in strain measurements using micro-Raman spectroscopy. Opt. Express 2021, 29, 34531–34551. [Google Scholar] [CrossRef] [PubMed]
  17. Kashyap, V.; Kumar, C.; Chaudhary, N.; Goyal, N.; Saxena, K. Comparative study of quantum confinements effect present in Silicon Nanowires using absorption and Raman spectroscopy. Opt. Mater. 2021, 121, 111538. [Google Scholar] [CrossRef]
  18. Malka, D.; Berke, B.A.; Tischler, Y.; Zalevsky, Z. Improving Raman spectra of pure silicon using super-resolved method. J. Opt. 2019, 21, 75801. [Google Scholar] [CrossRef]
  19. Trovalusci, P. Molecular Approaches for Multifield Continua: Origins and Current Developments BT-Multiscale Modeling of Complex Materials: Phenomenological, Theoretical and Computational Aspects; Sadowski, T., Trovalusci, P., Eds.; Springer: Vienna, Austria, 2014; pp. 211–278. [Google Scholar] [CrossRef]
  20. Tuna, M.; Leonetti, L.; Trovalusci, P.; Kirca, M. ‘Explicit’ and ‘implicit’ non-local continuous descriptions for a plate with circular inclusion in tension. Meccanica 2020, 55, 927–944. [Google Scholar] [CrossRef] [Green Version]
  21. Tuna, M.; Trovalusci, P. Scale dependent continuum approaches for discontinuous assemblies: ‘Explicit’ and ‘implicit’ non-local models. Mech. Res. Commun. 2020, 103, 103461. [Google Scholar] [CrossRef]
  22. Tuna, M.; Trovalusci, P. Stress distribution around an elliptic hole in a plate with ‘implicit’ and ‘explicit’ non-local models. Compos. Struct. 2021, 256, 113003. [Google Scholar] [CrossRef]
  23. Eringen, A.C. Theory of Micropolar Elasticity BT-Microcontinuum Field Theories: I. Foundations and Solids; Springer: New York, NY, USA, 1999; pp. 101–248. [Google Scholar] [CrossRef]
  24. Ebrahimi, F.; Selvamani, R. 2-Mechanics of Smart Flexoelectric Nanobeams; Ebrahimi, F., Ed.; Woodhead Publishing: Sawston, UK, 2021; pp. 23–73. [Google Scholar] [CrossRef]
  25. Ebrahimi, F.; Selvamani, R. 4-Mechanics of Magneto-Electro-Elastic (MEE) Nanostructures—Nanobeams; Ebrahimi, F., Selvamani, R.B.T.-M., Selvamani, S.M.N., Eds.; Woodhead Publishing: Sawston, UK, 2021; pp. 167–281. [Google Scholar] [CrossRef]
  26. Labuschagne, A.; van Rensburg, N.F.J.; van der Merwe, A.J. Comparison of linear beam theories. Math. Comput. Model. 2009, 49, 20–30. [Google Scholar] [CrossRef]
  27. Abazari, A.M.; Safavi, S.M.; Rezazadeh, G.; Villanueva, L.G. Modelling the Size Effects on the Mechanical Properties of Micro/Nano Structures. Sensors 2015, 15, 28543. [Google Scholar] [CrossRef]
  28. Villanueva, L.G.; Karabalin, R.B.; Matheny, M.H.; Chi, D.; Sader, J.E.; Roukes, M.L. Nonlinearity in nanomechanical cantilevers. Phys. Rev. B 2013, 87, 24304. [Google Scholar] [CrossRef]
  29. Eichler, A.; Moser, J.; Chaste, J.; Zdrojek, M.; Wilson-Rae, I.; Bachtold, A. Nonlinear damping in mechanical resonators made from carbon nanotubes and graphene. Nat. Nanotechnol. 2011, 6, 339–342. [Google Scholar] [CrossRef] [PubMed]
  30. Cuenot, S.; Demoustier-Champagne, S.; Fretigny, C.; Nysten, B. Size Effect on the Elastic Modulus of Nanomaterials as Measured by Resonant Contact Atomic Force Microscopy; Laudon, M., Romanowicz, B., Eds.; 2003 Nanotechnol. Conf. Trade Show. Nanotech 2003; Computational Publications: San Francisco, CA, USA, 2003; pp. 549–552. [Google Scholar]
  31. Nysten, B.; Fretigny, C.; Cuenot, S. Elastic modulus of nanomaterials: Resonant contact-AFM measurement and reduced-size effects. In Proceedings of the SPIE, Orlando, FL, USA, 28 March–1 April 2005. [Google Scholar] [CrossRef]
  32. Cuenot, S.; Frétigny, C.; Demoustier-Champagne, S.; Nysten, B. Surface tension effect on the mechanical properties of nanomaterials measured by atomic force microscopy. Phys. Rev. B 2004, 69, 165410. [Google Scholar] [CrossRef] [Green Version]
Figure 1. The tested area of the AFM cantilever across its length.
Axioms 11 00142 g001
Figure 2. The AFM cantilever Raman shift when free standing (ω) and in bending (ω0) along its x-axis.
Axioms 11 00142 g002
Figure 3. The AFM cantilever bending strain as calculated from the Raman shift and the fitted linear regression of data.
Axioms 11 00142 g003
Figure 4. The AFM cantilever bending strain as calculated from the Raman shift (linear regression) and compared with the Euler–Bernoulli approximation.
Axioms 11 00142 g004
Table 1. The mechanical properties and bending data values of the AFM cantilever.
LengthShear ForceMaximum DeflectionE-ModulusMoment of Inertia
L = 191 μmF = 251.8 μNz = 3.9259 × 10⁻⁶ mE = 169 GPaI = 7.4858 × 10⁻²² m4
Publisher’s Note: MDPI stays neutral with regard to jurisdictional claims in published maps and institutional affiliations.

