Article

Strategic Alliances for Sustainable Development: An Application of DEA and Grey Theory Models in the Coal Mining Sector

1
Department of Industrial Engineering and Management, National Kaohsiung University of Science and Technology, Kaohsiung 80778, Taiwan
2
School of Business, Ho Chi Minh International University, Thu Duc City, Ho Chi Minh City 70000, Vietnam
3
School of Business, Vietnam National University, Thu Duc City, Ho Chi Minh City 70000, Vietnam
4
Department of Information Management, Chihlee University of Technology, NewTaipei City 220305, Taiwan
*
Authors to whom correspondence should be addressed.
Axioms 2022, 11(11), 599; https://doi.org/10.3390/axioms11110599
Submission received: 8 October 2022 / Revised: 21 October 2022 / Accepted: 25 October 2022 / Published: 28 October 2022
(This article belongs to the Special Issue Advances in Mathematical Methods in Economics)

Abstract

:
Sustainable development is a global trend and an economic priority for many governments. Although new energies can be considered good investments in green growth, they may lead to financial barriers to developing countries. The purpose of the study concentrates on an alternative solution that increases the efficiency performance of current fossil energy industries. The study has combined two models of Data Envelopment Analysis (DEA) and Grey Theory in determining inefficient units to propose potential strategic alliances for sustainable development in the Vietnam Coal industry. Besides considering inputs and outputs in the models, the location of coal mines is also a key indicator in recommending good alliances. The results show that the collaborations between the Cao Son coal mine and the Coc Sau coal mine, and between the Nui Beo coal mine and the Vang Danh coal mine, bring the best improvement for sustainable development. The study suggests detailed strategies in action that enterprises and policymakers can refer to, to apply in practice.

1. Introduction

In 2020–2021, given the impact of the COVID-19 pandemic, Vietnam is one of few countries keeping a positive GDP growth rate due to its successful efforts in containing the spread of the virus nationwide. Vietnam’s economy is expected to develop through robust domestic demand and export-oriented manufacturing. It is accompanied by a surge in power demand and consumption to support its fast-growing economy. The energy demand is forecasted to rise by 8% per annum during 2021–2030 [1]. It boosts the demand for coal since this is still a cheap fuel source for power generation in a developing economy such as Vietnam. Since 2015, coal has overtaken hydropower in ranking as the most important energy source for the power industry, comprising 49.86% of the power generation share. With about 49 billion tons of coal reserves over the country, Vietnam has become a key coal supplier for both the domestic and the Asia Pacific regions. In the coming decades, coal mining is projected as a dominant investment of $150 billion from energy investors. Hence, the coal mining sector has contributed significantly to the economic growth of Vietnam.

1.1. The Coal Mining Sector in Vietnam

In Vietnam, all coal mines are owned by the government. Approximately 95% of the total coal is produced and mined by a state-owned holding company called the Vietnam National Coal-Mineral Industries Group (VINACOMIN). VINACOMIN was established in 2005 through the merger of Vietnam National Coal Corp. (Vinacoal) and Vietnam National Minerals Corp [2]. The corporation has become a major coal producer in Vietnam and has various activities such as providing anthracite for the power sector, and industries for both domestic and global markets. Most of Vietnam’s coal resources are located in the North. In the red river Delta coal basin, 39.4 billion tons of sub-bituminous accounted for 81% of four types of coal including anthracite; fat coal; sub-bituminous; and peat coal. VINACOMIN has operated five large surface coal mines with an annual capacity greater than 2 million tons (the Cao Son, Coc Sau, Deo Nai, Ha Tu, and Nui Beo mines); 15 surface coal mines with production from 0.1 to 0.7 million tons per year.

1.2. Environmental Issues from Mining Coal

Vietnam’s coal mining industry meets many difficulties in the increase of coal production, prospecting, exploration, and mining technologies. It would be more challenging when the Vietnamese government has many efforts to “go green”. Environmental problems and sustainable development are two significant issues that the Vietnam coal mining sector could encounter. In terms of the environmental aspect, mining coal causes land subsidence, damages to the water ecology, mining waste disposal, and air pollution. It may change either environmental pollution or the landscape [3]. Coal exploration could impact the water systems, and extraction can affect groundwater levels and acidity. For example, the amount of sulfur dioxide (SO2) released from coal burning is approximately 75 (Tg S yr−1). It causes acid rain and acidification of ecosystems [4]. Moreover, there are many problems from waste coal mines such as occurring settlements in tunnels, infrastructure, or arable land damages. In 2013, the head of the UN climate agency argued that the inefficient mining of underground coal contributes to global warming.

1.3. Strategic Alliance for Sustainable Development

The strategic alliance is a collaboration form to achieve mutual goals, for example, two different units collaborate to facilitate reciprocal learning processes [5]. Across the world, there are many examples of alliances for sustainable development. The Central American Council for Sustainable Development has promoted alliance agreements designed to support sustainable development in Central America at both the national and regional levels [6]. The Italian landscape applied alliance strategies to enhance the importance of the Sustainable Development Agenda for the Italian society and economic stakeholders. Participating in alliances supports them to pursue the Sustainable Development Goals of the United Nations [7].
There are many difficulties that an organization encounters if they have a sustainably developing orientation. These challenges are related to various aspects such as technical, social, and organizational innovations. Strategic alliances can be considered an important sustainability innovation in improving resource efficiency [5].

1.4. Problem Statement and Motivation

As mentioned above, the inefficiency of coal mining causes many environmental problems, especially significant barriers if the Vietnamese government wants to have sustainable development. VINACOMIN has encountered a lack of efficient performance measurement for mining projects operating independently. The motivation of this study is to find a novel way of measuring the efficiency performance of operating coal manufacturers, then to have recommendations for improving its performance.
This study proposes a hybrid research approach that combines a multiple-criteria decision-making (MCDM) model and a prediction model. The novelty of the research framework proposed is to take advantage of Grey Model (GM) and Data Envelopment Analysis (DEA) models in solving uncertain problems with inadequate information. The results of the Grey Theory model have interacted with the Data Envelopment Analysis (DEA) model. Then, the findings are used to evaluate the efficiency performance of major coal mines, then suggest possible strategic alliances. In addition, another motivation of the study is to contribute the proposed research framework to the relevant literature on evaluating efficiency performance.

2. Literature Review and Research Process

2.1. DEA Model, Grey Theory, and Its Application

2.1.1. DEA Model

The reference [8] implemented Data Envelopment Analysis (DEA) to evaluate the performance of business units by estimating the ratio between inputs and outputs as an efficiency index. There are two traditional versions of DEA models, namely, the Charnes–Cooper–Rhodes (CCR) and the Banker–Charnes–Cooper (BCC) models [8]. The former is used to determine the overall inefficiency, whereas the latter differentiates between technical efficiency and scale efficiency. After several years, the super slack-based measure (super SBM) model was developed to optimize the shortcomings of the traditional DEA model and obtain reasonable metrics. It has eliminated the slack problems while accurately ranking the effectiveness of decision-making units (DMUs) [5]. Many studies related to the application of DEA are studied across different fields such as logistics [9], automobile manufacturing [10], the steel industry [5], and the textile and garment industries [11]. In addition, the DEA models can be coordinated with other models such as the Analytic Hierarchy Process (AHP) model, the Grey model, and so on. For instance, related to sustainable development, a hybrid approach of the DEA and AHP model was applied to select the potential location for constructing wind power plants in Vietnam in 2021 [12].

2.1.2. Grey Theory Model

The reference [13] introduced an approach to construct forecasting models with limited samples. Due to the development of the Grey systems theory, these models are commonly named grey models (GM). The advantages of GM models are to solve uncertain problems with inadequate information. The research implemented in developing countries such as Vietnam often encounters a problem of disorderly and unsystematic data. Grey theory has been a powerful tool in projecting historical business data with a limited amount [14].
The Grey prediction models are applied widely in various fields from private to public sectors, such as economics, technology, science, or government policies. For example, the GM models are applied to forecast the number of COVID-19 cases and deaths in Turkey [15]. The reference [14] demonstrated the effectiveness of Grey theory models in predicting three real cases including natural gas consumption, electricity consumption, and the elderly population. In terms of sustainable development, the GM models are implemented to forecast the demand for green mental material in 2019 [16].

2.1.3. Research Gap

There is much literature on the application of DEA in efficiency evaluation; however, there are a limited number of studies on environmental efficiency or sustainable development [17]. There has been no research implemented for the case of the Vietnamese coal mining industry to evaluate the performance efficiency and give suggestions for sustainable development. This study aims to fill the gap in the existing literature by evaluating the efficiency performance of independent coal mining projects that are operated by VINACOMIN, then integrating the Grey Model to simulate strategic alliances between inefficient projects.
There is an existing issue related to limited and incomplete information on the coal projects operating. It causes unavoidable errors in data collection as well as getting a high-accuracy analysis. The advantage of the DEA model is to deal with such an issue by a non-parametric approach converting multiple inputs into outputs [8]. In addition, the DEA does not require the specification of a functional form for the production technology like other stochastic parametric methods. However, many researchers believe that the disadvantage of the DEA model is about sample size and not offering a prediction model of units’ performance [18]. The reference [19] argued that the number of DMUs should exceed the total number of inputs and outputs by several times. The references [5,20] argued that the number of DMUs selected needs to be at least double the number of inputs and outputs in total, so the problem of sample size can be solved by considering a sufficient size of the sample. To deal with the second limitation of DEA, [21] introduced the Grey Theory model as a time series prediction to forecast the future business operation of units in the next three-year period. The advantage of DEA is to reduce randomness and promote the regular pattern of disorderly and unsystematic data [17].
Therefore, a hybrid approach between the DEA model and the Grey Theory model is suitable to provide a prominent level of accuracy in predicting and evaluating performance when the information is limited and fluctuated.

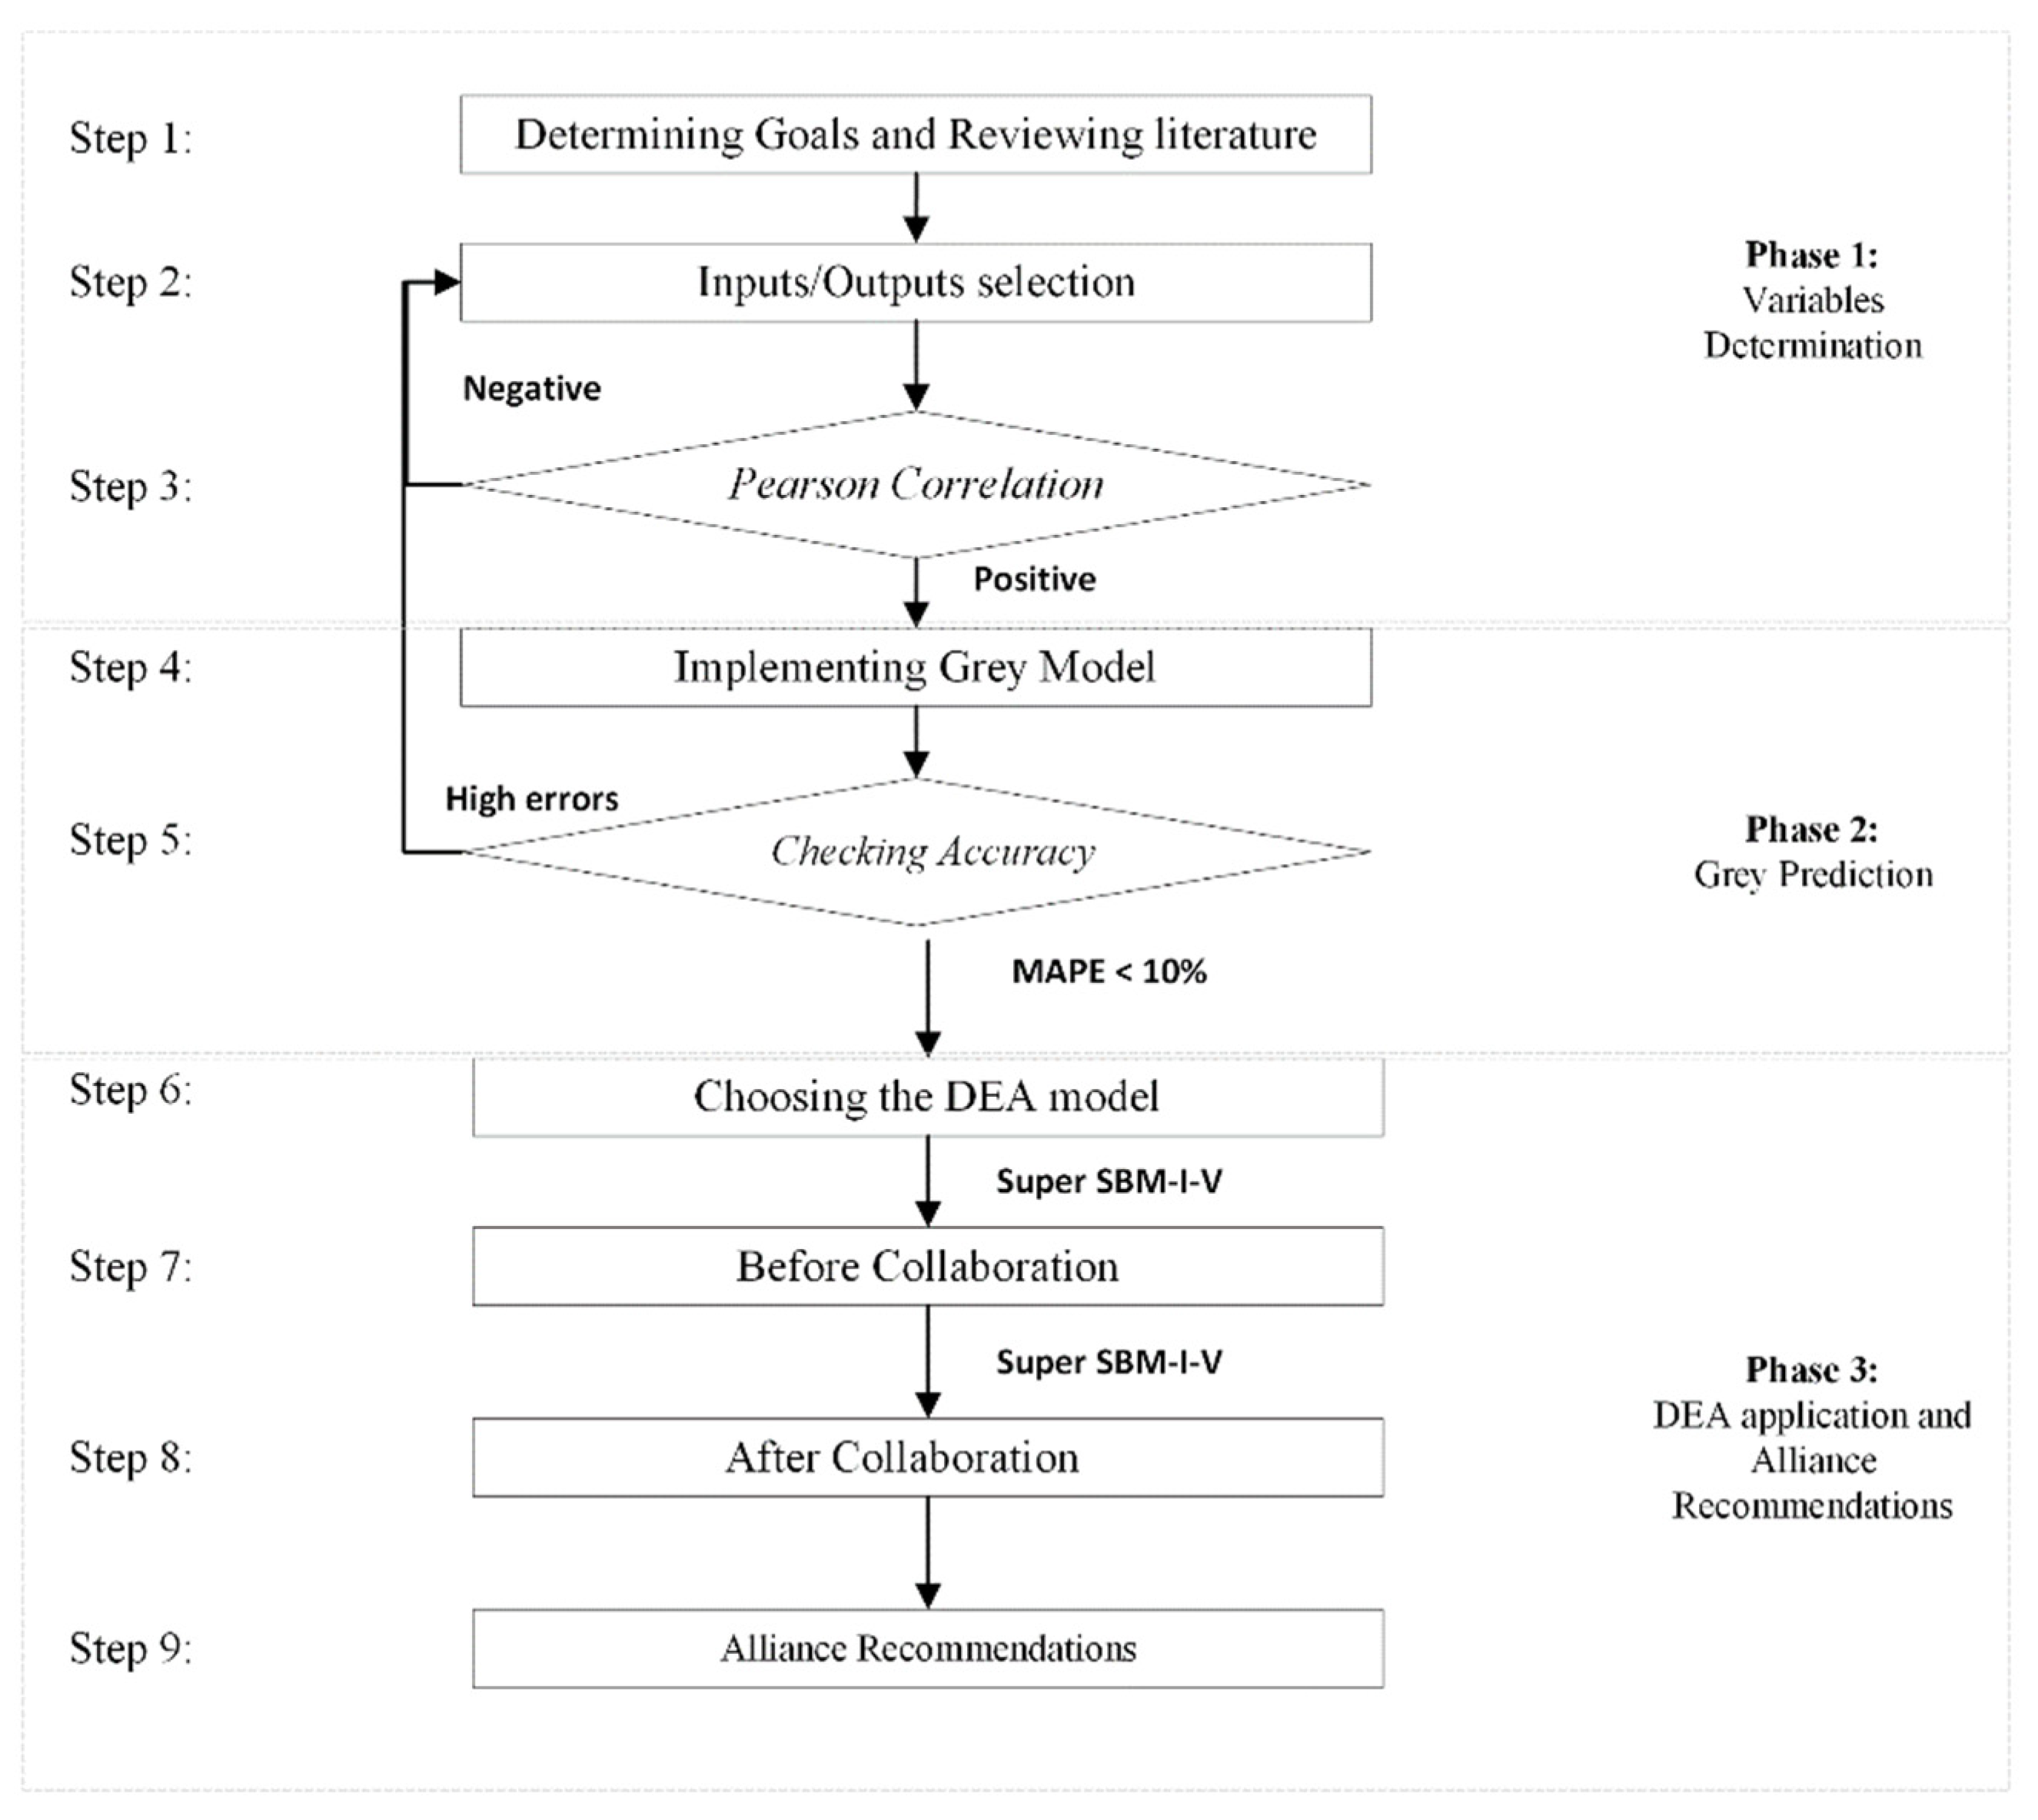
2.2. Research Process

There are three phases implemented in the research process in Figure 1.
  • Phase 1: Variables Determination
  • Step 1: Determining goals and reviewing the literature
There is 95% of the total coal production in Vietnam explored by e VINACOMIN. Regarding underground mining, VINACOMIN has operated thirty coal mines in which some mines produce less than 0.1 million tons per year. The goal of this study is to determine the inefficiency performance of coal mines by using two models (i.e., Grey Model and DEA), then recommend strategic alliances to improve as well as develop sustainably for the Vietnamese coal mining industry.
To select appropriate inputs and outputs, relevant studies are reviewed in Table 1. In this study, the top 10 major mines with high investments and a producing capacity greater than 1 million tons per year (see the list of mines in Table 2) are chosen as DMUs in the research model.
  • Step 2: Inputs/Outputs selection
Table 1 presented the studies that applied DEA in evaluating the efficiency performance of DMUs across sectors. In addition, different variables are also shown. The common variables that are used frequently across previous studies would be prioritized. In this study, DMUs are coal mining firms that consider many cashflow indicators. To evaluate performance efficiency for manufacturing and producing firms, variables related to expenditures and profits are important. For example, the references of [5] and [11], respectively, evaluated steel and textile-garment manufacturers on inputs including Fixed Assets, Cost of Goods Sold (COGS), and Operating Costs; and outputs including Revenue and Operating Profit. The reference of [10] additionally considered a long-term investment and total equity to assess the automobile industry. According to Table 1, a common point is that inputs are related to “cost” indicators and outputs are related to “benefit” indicators. Hence, in this study, three inputs including (I1) Fixed assets; (I2) Cost of goods sold; (I3) Operating Costs; and two Outputs including (O1) Revenues; (O2) Operating profit were selected.
  • Step 3: Pearson correlation
A requirement of applying DEA is the positive correlation between inputs and outputs. The Pearson correlation, hence, is implemented to ensure the accuracy of the selection of the indicators.
  • Phase 2: Grey Prediction
  • Step 4: Implementing Grey Model
The Grey Model (1,1) model is implemented to forecast the inputs and outputs of each DMU in the next 3-year period (i.e., 2022–2024).
  • Step 5: Checking Accuracy
To check the accuracy level of projections, the index of Mean Absolute Percent Error (MAPE) is estimated as M A P E = 100 % n t = 1 n A t F t A t , where A t , F t are the actual values and forecast values, respectively.
If the value of MAPE is higher than 10%, then the errors of forecasting are too high than the actual values [10,23]. It means that the data must be re-selected.
  • Phase 3: DEA application and Alliance Recommendations
  • Step 6: Choosing the DEA model
To eliminate the slack problems that traditional DEA models (i.e., CCR and BCC) cannot deal with, the advantage of the Super -SBM-I-V of DEA is considered to evaluate efficiency units and rankings of each coal mining project.
  • Step 7: Before collaboration
In this step, the super SBM-I-V model [20] is used to evaluate the efficiency of DMU(x0, y0) over the period 2017–2021. It aims to define a target DMU which received a high investment from VINACOMIN but has shown a low-efficiency score in performance.
  • Step 8: After Collaboration
After the target DMU is determined, “virtual alliances” are constructed by getting the forecasted values between the target and other DMUs. Then, the super SBM-I-V model is reimplemented to compare the difference.
  • Step 9: Alliance Recommendations
The study shows the coal mines operating inefficiently and then suggests possible strategic alliances for a sustainable development orientation at VINACOMIN as well as the government level.

3. Methodology

3.1. Grey Theory Model

The GM(1,1) model has five main steps described as follows:
Input original time series data X(0) [13]
X 0 = x 0 1 , x 0 2 ,   ,   x 0 n , n 4    
where X 0 is a non-negative sequence; n is the number of data observed; then, generate time-series data X(1)(k) by 1-Accumulating Generation Operator AGO (1-AGO) of X(0) and generate partial series data Z(1)(k) from X(1)(k), as in Equation (2) below
X 1 = x 1 1 , x 1 2 ,   ,   x 1 n ,   n     4
where
  x 1 k = i = 1 k x 0 i ,   k = 1 ,   2 ,   n .
Next, the data matrix is established by a least square method to acquire the value of coefficient a and grey input b
Z 1 = z 1 2 , z 1 3 ,   ,   z 1 n
where
z 1 k = 1 / 2 x 1 k + x 1 k 1   ,   k = 2 ,   3 ,   ,   n
Construct GM(1, 1) forecasting equation
d X 1 k d k + a x 1 k = b
where parameters a and b are called the developing coefficient and grey input, respectively. However, these parameters a and b are undetermined from Equation (6). Instead, the least square method as the Equations (7)–(11) below can be used:
X ^ 1 k + 1 = X 0 1 b a e a k + b a   ,   k = 1 ,   2 ,   3 ,  
where X 1 k + 1 denotes the prediction X at time point k + 1 and the coefficients [a,b]T can be obtained by the Ordinary Least Squares (OLS) method:
a b T = θ ^ = B T B 1 B T Y N
and   B = Z 1 2 1 Z 1 n 1
Y N = X 0 2 X 0 n
(B is the data matrix, YN is the data series, [a,b]T is the parameter series), X ^ 1 is acquired from Equation (7). Let X ^ 0 be the GM(1,1) fitted and predicted series:
X ^ 0 = X ^ 0 1 , X ^ 0 2 , , X ^ 0 n , where   X ^ 0 1 = X 0 1
Evaluate average residual γ, and calculate forecast values as Equation (11):
X 0 k + 1 = X 0 1 b a e a k 1 e a   ( k = 1 ,   2 ,   3 ,   )

3.2. Super Slacks-Based Measure DEA Model

The non-negative data input is a compulsory requirement in the application of DEA models. In 2001, [24] developed the Slacks-based measure of efficiency (SBM) to evaluate the efficiency of the DMUk by Equation (12):
min ρ 1 = 1 1 m i = 1 m s i x i k 1 + 1 s r = 1 s s r + y r k s . t . x i k = j = 1 n x i k λ j + s i ,   i = 1 , , m   y r k = j = 1 n y r j λ j s r + ,   r = 1 ,   ,   s λ j 0 ,   j = 1 ,   ,   n s i 0 ,   i = 1 ,   ,   m s r + 0 ,   r = 1 ,   ,   s
where x i j and y r j denote the ith input and the rth output of the DMUj, respectively.
Let x i 1 = x i k s i and y r 1 = y r k s r + . The SBM model can be rewritten by Equation (13)
min ρ 1 = 1 m i = 1 m x i 1 x i k 1 s r = 1 s y r 1 y r k s . t . x i 1 j = 1 n x i k λ j ,   i = 1 ,   ,   m y r 1 j = 1 n y r j λ j ,   r = 1 ,   ,   s λ j 0 ,   j = 1 , , n   x i k   x i 1 0 ,   i = 1 ,   ,   m y r 1 y r k ,   r = 1 ,   ,   s
In 2002, [20] proposed the following Super-SBM to evaluate the super-efficiency of the DMUk in Equation (14)
min ρ 2 = 1 m i = 1 m x i 2 x i k 1 s r = 1 s y r 2 y r k s . t . x i 2 j = 1 , j k n x i j λ j ,   i = 1 ,   ,   m y r 2 j = 1 , j k n y r j λ j ,   r = 1 ,   ,   s λ j 0 ,   j = 1 ,   ,   n ,   j k x i k   x i 2 ,   i = 1 ,   ,   m 0 y r 2 y r k ,   r = 1 ,   ,   s
Note that the optimal value of the objective function (14) is ρ 2   1 . If the DMUk is identified as efficient by Equation (13), then model (14) is used to calculate super-efficiency.

4. Empirical Analysis and Results

4.1. Collecting the DMUs

According to the rule of thumb from [5,20,23], the number of DMUs selected needs to be at least double the number of inputs and outputs in total. With five variables considered, the paper studied 10 major coal mining projects of VINACOMIN as DMUs in the research model.
The financial statements during 2017–2021 were collected from a reliable database source, the State Securities Commission of Vietnam (ssc.gov.vn), and double-checked with the official reports of VINACOMIN. Table 2 presents the list of DMUs and their market capitals in billions of Vietnam dong (Bil. VND).

4.2. Variables Collection

According to step 2 in Section 2.2, the selection of inputs is supported by reviewing the relevant literature of DEA and coal mining industry reports. There are three important factors to the sources of coal mining manufacturers, namely, fixed assets, operating cost, and cost of goods sold (COGS). In terms of outputs, Revenues and Operating profit are considered as two output factors, because the indicators are good signals to analyze the company’s financial effectiveness. The statistical description of input and output data is presented in Table 3, in millions of Vietnam dong (Mil. VND).
The inputs and outputs selection is also confirmed by the Pearson correlation test with all high positive correlations shown in Section 4.5 below:
Table 3. Input and output factors of 10 coal mining projects in 2017–2021 (in Mil. VND).
Inputs
(in Mil. VND)
Outputs
(in Mil. VND)
StatisticsFixed AssetsOperating CostCOGSRevenuesOperating Profit
2017Max3,037,449 6,081,202 398,600 6,464,727 110,727
Min95,942 984,287 135,054 1,221,125 961
Average1,122,746 2,602,439 220,473 2,940,333 38,723
SD1,059,424 1,476,634 84,500 1,551,590 33,002
2018Max3,139,566 3,945,504 351,387 4,201,420 150,130
Min89,514 1,115,936 112,735 1,444,347 21,089
Average1,145,740 2,421,367 203,947 2,773,617 54,974
SD1,086,383 972,039 67,187 1,035,770 41,038
2019Max2,988,038 5,361,165 386,748 5,712,483 279,104
Min90,632 1,740,493 62,385 1,957,178 21,622
Average1,111,524 3,172,208 177,928 3,541,372 91,345
SD996,001 1,158,668 103,099 1,224,661 72,455
2020Max2,661,291 10,066,757 671,218 10,867,337 409,852
Min92,990 1,841,387 116,821 2,087,359 1842
Average1,098,891 3,944,922 224,573 4,376,882 114,631
SD 826,271 2,466,641 180,541 2,612,602 108,327
2021Max 2,327,035 10,218,072 648,840 10,990,285 410,780
Min 85,277 1,835,560 72,209 2,193,027 4484
Average 1,116,725 3,741,347 218,920 4,146,550 89,518
SD 728,762 2,428,944 173,718 2,583,992 117,465

4.3. Variables Calculations—Forecast Inputs/Outputs by GM(1,1)

The GM(1,1) model is implemented on the realistic inputs/outputs factors from 2017 to 2021 to predict the values of all DMUs in 2022–2024. Table 4 has shown the projection of data for DMUs in 2022.

4.4. Accurate Checking

The imperfect information is a constraint in the prediction. To check the accuracy of applying GM(1,1), the study estimated the MAPE score in percentage and showed the results in Table 5.
The predicted values are good and qualified if the value of MAPE is less than 10% [23]. In Table 5, the average MAPE of 8.49% confirms that the estimations by using GM(1,1) are accurate to use in the next phases.

4.5. Pearson Correlation

Table 6 presents the results of the Pearson correlation test between inputs and outputs over the period 2017–2021. The significant positive associations confirm the “homogeneity” and “isotonicity” data that satisfied two requirements for applying the DEA model. In addition, the high correlation among variables shows that selecting inputs and outputs is reasonable; for example, the value of the correlation between COGS and RE is 0.997. It means that the reliability level of data collection is very high because a business that gets high revenues would obtain higher COGS than other peers.

4.6. Analysis before Alliance

The super-SBM-I-V algorithm based on the business performance of all DMUs in 2021 is implemented to evaluate the efficiency of 10 major coal mines.
Table 7 and Table 8 present the example of efficiency score ranking in 2020 and 2021, respectively, all the performance rankings in the period of 2017–2021 are reviewed to select the target DMU.
The Vang Danh coal mine referred to as TVD (i.e., DMU2) is one of the big projects invested in by VINACOMIN and a major unit in exploring the coal industry that accounts for the second-highest market capital with 350.71 billion VND in 2020 (Table 2). However, the TVD has performed with a “less 1” efficiency score over the 5-year period (2017–2021). It means that there are some issues in operating despite having good potential inputs. Therefore, TVD is selected as the target DMU to set up different virtual alliances.
In terms of geography, the four major coal mines, namely, Cao Son (TCS), Mong Duong (MDC), Deo Nai (TDN), and Coc Sau (TC6) are considered. Because the locations of these coal mines are very closed (highlighted in RED as Figure 2). However, TC6 has performed inefficiently (i.e., “less 1”) throughout 2017–2021. Three virtual alliances are constructed between TC6 with three neighbor coal mines.

4.7. Analysis after Alliance

With the data forecasted by the Grey model, 12 virtual alliances are formed, including 9 collaborations between DMU2 (i.e., TVD) and other DMUs and 3 virtual alliances between TC6 and other coal mines nearby (TCS; MDC; TDN), as shown in Table 9.
Then, Super-SBM-I-V is repeatedly implemented to estimate and rank the efficiency of these DMUs in 2022 and 2023.

4.8. Alliance Selection

The advantages of alliances are improving performance; enhancing productivity; raising a firm’s market power [25]. A key motivation to form alliances is improving performance efficiency.
This study aims to figure out the inefficient DMUs and suggest potential partners to improve performance. As the analysis in step 7, there are two target DMUs (i.e., TVD and TC6) that formed additional 12 virtual alliances. Then, the super SBM-I-V model is applied to estimate the performance efficiency scores. Table 10 and Table 11 showed that five potential good alliances improved the efficiency ranking of TVD and TC6 after cooperating. However, the two groups of these alliances are separated according to the level of priority.
A good strategic alliance should be a collaboration that brings benefits to every counterpart. In this context, the first group includes DMUs that improve the efficiency scores of the target DMUs and themselves. In Table 10 and Table 11, the virtual alliances in green cells (TCS and TC6; TVD and NBC) have increased the performance of counterparts. If there is a cooperation between TCS and TC6, the position of both in the efficiency ranking is 6th in 2022 (Table 10). It is better than the position of TCS and TC6 if they operate independently. Similarly, the virtual alliance TVD and NBC improves significant performance scores of TVD and NBC in 2022 and 2023. Without collaboration, the performance of TVD and NBC is ranked 16th and 17th in 2022 according to the estimation in Table 10, respectively. Hence, the most priority in the strategic alliance is recommended for VINACOMIN; including TCS andTC6 (Cao Son coal mine and Coc Sau coal mine); Nui Beo coal mine and Vang Danh coal mine (TVD).
In addition, the second priority group includes potential DMUs that support the target DMU to improve performance, although it may influence its performance. However, the study recommends these alliance strategies to VINACOMIN since the efficiency scores are still higher than 1, which is an acceptable level. In addition, these DMUs are all under-managed by VINACOMIN, so such alliances are possible to implement toward a common goal of sustainable development.

5. Discussion

Sustainable development has become a global trend and long-term orientation in most countries. There are many various approaches to achieve this goal; however, each government will choose different ways that are suitable for its contexts. For example, some nations have applied environmental taxes on sectors that have significant negative impacts on the environment such as steel manufacturing, mining, etc. On the other hand, some countries choose to support using alternative renewable energies such as hydrogen (water, solar, wind, etc.). Nevertheless, in a developing country like Vietnam, economic growth is still the most priority and fossil energies such as the coal mining industry have an important role in economic development. Although the Vietnamese government has some commitment to climate change, the internal energy market is still dominated mainly by fossil fuel-based technologies, and new thermal coal power plants are heavily invested during the last two decades. According to the Vietnam National Power Development Master Plan from government decision letter No. 428/QD-TTg, coal-fired thermal power is an energy source providing approximately 53.2% of national electricity and consuming approximately 129 million tons of coal per year by 2030. Therefore, if the Vietnam Government wants to integrate with global tendency as well as keep growth in the economy, it is necessary to improve the efficiency performance of current sectors.
There is no denying that the coal industry has a significant impact on the environment, especially in global climate change. With over 3.3 billion tons of proven coal reserves at the end of 2020, coal-fired plants in Vietnam mainly depend on domestic supply [26]. If coal mines have inefficient performance, it causes serious problems in terms of environmental, social, and economic aspects. Therefore, it is necessary to define the inefficiency of coal mines and have solutions such as M&A or involving partnership; because this is not only a common motivation among units but also is aligned with the orientation of the government.
The findings of this study are valuable references to answer the questions “what” and “how” to have good strategic alliances in sustainable development.
Which are inefficient units?
The study took an advantage of combing two models of DEA and Grey Theory to define inefficiency units. The ratio between the outputs and the inputs has been considered and made comparisons among units. Table 7 and Table 8 present the performance estimation of the top 10 coal mines managed by VINACOMIN. There are two units, namely, “Coc Sau coal mine” (TC6) and “Vang Danh coal mine” (TVD), that obtained performance scores less than 1, i.e., these mines have not optimized investments from the head corporation, VINACOMIN, to achieve an efficient performance as other units. Hence, these two coal mines are selected as target units to propose virtual alliances.
How to improve its performance?
Eliminating under-performance units is necessary for sustainable development. This is more important in sectors related to fossil energy such as coal mining due to its environmental impacts. A strategic alliance, hence, is worth taking into account as a solution.
Various enterprises with different missions and visions will have different forms of alliances [5]. For example, two firms will sign a formal contract regarding equity ownership; shared managerial control; cross-selling; or shared resources. The reference [27] introduced asymmetric alliances in which small firms accept to invest more than a larger partner, but they expect to gain more reputation in the market.
There are two key reasons that strategic alliance is a suitable and less costly solution. Firstly, an agreement toward a correlating business goal such as developing a more effective process; sharing the resources and risks; etc. is the foundation of a strategic alliance [28]. The scope of this study is related to all coal mines operated by VINACOMIN; hence, the goal of sustainable development is a key motivation in strategic alliances. In addition, setting alliances is possible to implement since all units are under-controlled by VINACOMIN. The study also considered the location of units as a key indicator in selection. Most coal mines in the study are located in nearby areas; hence, the process of cooperating is easy and feasible. Traditional methods of control and management as well as integrated operating procedures are not enough. Strategic alliances with such a new reorganization can improve the efficiency of resource allocation and sharing, minimize costs, and reduce waste.
In terms of literature contribution, a novel hybrid approach integrating between the DEA model and the Grey Model can support to evaluate and solve issues related to the efficiency improvement of decision-making units. The advantage of the research model is that estimations are based on realistic data in five consecutive years from 2017 to 2021. It is better than the only three-year period in many previous studies [5,10,11].
Moreover, the application of the research framework proposed by this study is not limited to the coal mining industry, but it is possible to apply it in various sectors. The findings and recommendations in this study are not only useful for managers in VINACOMIN but can also be seen as a good reference for decision-makers in other private and public sectors. Besides evaluations subjectively, managers can assess objectively with a high level of accuracy via estimations by such a mathematical model. Hence, policymakers can apply the proposed model to evaluate the performance in various fields for a common goal of sustainable development. For example, government officers apply the model to evaluate potential locations to develop industrial parks, new energy locations, etc. Furthermore, managers can apply the model in evaluating and selecting the “green suppliers”; “green materials”; “efficiency equipment”, or “green strategies” to construct sustainable development orientation for their organizations.
Limitations and further research
A limitation of this study is the condition of sample size, the condition on the number of inputs, outputs, and number of DMUs. If the number of DMUs is less than twice the total number of input-outputs or the negative correlation problem, it may lead to failures in obtaining correct calculations of the DEA model. For further research, it can consider other MCDM models such as AHP or The Technique for Order of Preference by Similarity to Ideal Solution (TOPSIS), which determine the most alternative on nearest the positive ideal solution and simultaneously farthest negative ideal solution. On the other hand, further research can combine the proposed model with the prospect theory which was introduced by [29] to study psychological aspects.

Author Contributions

All authors contributed to the study’s conception and design. Conceptualization, H.-P.N.; Data curation, H.-P.N.; Formal analysis, H.-P.N.; Funding acquisition, Y.-H.W.; Investigation, H.-P.N.; Methodology, H.-P.N. and N.-L.N.; Project administration, C.-N.W.; Software, N.-L.N.; Supervision, C.-N.W.; Validation, Y.-H.W.; Writing—original draft, H.-P.N.; Writing—review and editing, Y.-H.W. and N.-L.N. All authors have read and agreed to the published version of the manuscript.

Funding

This research received no external funding.

Data Availability Statement

The datasets generated and analyzed during the current study are available from the corresponding author on reasonable request.

Conflicts of Interest

The authors declare no conflict of interest.

References

  1. Christian, S. Vietnam Coal Supply & Demand 2021; Market Report; Reuters: London, UK, February 2021. [Google Scholar]
  2. Chuan, L.M. Current Status of Coal Demand and Supply in Vietnam and Plan of Vinacomin in the Coming Time; VINACOMIN: Hanoi, Vietnam, 2019. [Google Scholar]
  3. Zheng-fu, B.; Hilary, I.I.; John, L.D.; Frank, O.; Sue, S. Environmental issues from coal mining and their solutions. Min. Sci. Technol. 2010, 20, 215–223. [Google Scholar]
  4. UEIA. Primary Coal Exports; US Energy Information Administration: Washington, DC, USA, 26 July 2020.
  5. Nguyen, P.; Nguyen, T. Using optimization algorithms of DEA and Grey system theory in strategic partner selection: An empirical study in Vietnam steel industry. Cogent Bus. Manag. 2020, 7, 1832810. [Google Scholar] [CrossRef]
  6. UNHR. Alliance for the Sustainable Development of Central America; United Nations Human Rights: Geneva, Switzerland, 2015. [Google Scholar]
  7. Martino, C.M. ; Italian Alliance for Sustainable Development. Sustainable Developmental Goals 2016; Italian Alliance for Sustainable Development: Milano, Italy, 2016. [Google Scholar]
  8. Charnes, A.; Cooper, W.; Rhodes, E. Measuring the efficiency of decision making units. Eur. J. Oper. Res. 1978, 2, 429–444. [Google Scholar] [CrossRef]
  9. Nguyen-Nhu-Y, H.; Mai, N.P.; Thi-Minh-Ngoc, L.; Thi-Thuy-Anh, T. Selecting Partners in Strategic Alliances: An Application of the SBM DEA Model in the Vietnamese Logistics Industry. Logistics 2022, 6, 64. [Google Scholar]
  10. Wang, C.-N.; Nguyen, X.-T.; Wang, Y.-H. Automobile Industry Strategic Alliance Partner Selection: The Application of a Hybrid DEA and Grey Theory Model. Sustainability 2016, 8, 173. [Google Scholar] [CrossRef] [Green Version]
  11. Phu, N.; Duy, N. A two-stage study of grey system theory and DEA model in strategic alliance: An application in Vietnamese textile and garment industry. Asian J. Manag. Sci. Appl. 2019, 4, 77–98. [Google Scholar]
  12. Wang, C.-N.; Nguyen, H.-P.; Wang, J.-W. A Two-Stage Approach of DEA and AHP in Selecting Optimal Wind Power Plants. IEEE Trans. Eng. Manag. 2021, 1–11. [Google Scholar] [CrossRef]
  13. Deng, J.L. Control Problems of Grey Systems. Syst. Control Lett. 1982, 1, 288–294. [Google Scholar]
  14. Chong, L.; Wen-Ze, W.; Wanli, X. Study of the generalized discrete grey polynomial model based on the quantum genetic algorithm. J. Supercomput. 2021, 77, 11288–11309. [Google Scholar]
  15. Şahin, U.; Şahin, T. Forecasting the cumulative number of confirmed cases of COVID-19 in Italy, UK and USA using fractional nonlinear grey bernoulli model. Chaos Solitons Fract. 2020, 138, 109948. [Google Scholar] [CrossRef]
  16. Yi-Chung, H. Demand Forecasting of Green Metal Materials Using Non-Equidistant Grey Prediction with Robust Nonlinear Interval Regression Analysis. Environment, Development and Sustainability; Springer: Berlin/Heidelberg, Germany, 2021. [Google Scholar]
  17. Nan, W.C.; Phu, N.H.; Wen, C.C. Environmental Efficiency Evaluation in the Top Asian Economies: An Application of DEA. Mathematics 2021, 9, 889. [Google Scholar]
  18. Pankaj, D.; Bharath, J.; Manpreet, S.A. Applications of data envelopment analysis in supplier selection between 2000 and 2020: A literature review. Ann. Oper. Res. 2021, 315, 1399–1454. [Google Scholar]
  19. Cooper, W.W.; Li, S.; Seiford, L.M.; Tone, K.; Thrall, R.M.; Zhu, J. Sensitivity and Stability Analysis in DEA: Some Recent Developments. J. Product. Anal. 2007, 15, 140. [Google Scholar]
  20. Tone, K. A slacks-based measure of super-efficiency in data envelopment analysis. Eur. J. Oper. Res. 2002, 143, 32–41. [Google Scholar] [CrossRef] [Green Version]
  21. Erdal, K.; Baris, U.; Okyay, K. Grey system theory-based models in time series prediction. Expert Syst. Appl. 2010, 37, 1784–1789. [Google Scholar]
  22. Sheng-Hsiung, C.; Tzu-Yu, L. Two-Stage Performance Evaluation of Domestic and Foreign Banks in Taiwan. Asian J. Econ. Model. 2021, 6, 191–202. [Google Scholar]
  23. Gilliland, M. The Business Forecasting Deal: Exposing Myths, Eliminating Bad Practices, Providing Practical Solutions; SAS Institute Inc.: Cary, NC, USA, 2010; p. 195. [Google Scholar]
  24. Tone, K. A slacks-based measure of efficiency in data envelopment analysis. Eur. J. Oper. Res. 2001, 130, 498–509. [Google Scholar] [CrossRef] [Green Version]
  25. Anand, B.N.; Khanna, T. Do firms learn to create value? The case of alliances. Strateg. Manag. J. 2000, 21, 295–315. [Google Scholar] [CrossRef]
  26. BP-Organization. Statistical Review of World Energy; BP Organiztion: London, UK, 2021. [Google Scholar]
  27. Chen, H.; Chen, T.J. Asymmetric strategic alliances: A network view. J. Bus. Res. 2002, 55, 1007–1013. [Google Scholar] [CrossRef]
  28. Kogut, B. Joint ventures: Theoretical and empirical perspectives. Strat. Manag. J 1988, 9, 319–332. [Google Scholar] [CrossRef]
  29. Kahneman, D.; Tversky, A. Prospect Theory: An Analysis of Decision under Risk. Econom. Econom. Soc. 1979, 47, 263–291. [Google Scholar] [CrossRef]
Figure 1. Research development.
Axioms 11 00599 g001
Figure 2. Locations of the Cao Son, Mong Duong, Deo Nai and Coc Sau coal mines. Source: Google map.
Axioms 11 00599 g002
Table 1. Summary of methodologies and inputs/outputs selection in previous studies.
ReferencesYearInputsOutputs MethodologiesApplied Areas
[9]2022Net Fixed Assets Operating incomeCCR
BCC
Logistics
Salaries and Wages
Operating Expenses
Current Liabilities
[10]2016Fixed Assets Revenue
Total Equity
Net Income
Hybrid DEA
Grey Theory model
Automobile Industry
Cost of Goods Sold
Operating Expenses
Long-term Investment
[11]2019Fixed AssetsRevenue
Net Profit
DEA and Grey TheoryTextile and Garment Industry
Cost of Goods Sold
[5]2020Fixed AssetsNet revenue
Net Profit
Super-SBM-I-V
Grey Theory
Steel Industry
Cost of Goods Sold
Operating Cost
[22]2021Total AssetRevenue
Net profit
DEA-SBMBanking
Fixed Assets
Operating Expense
Equity
Deposits
Loans
Note: Charnes–Cooper–Rhodes (CCR), Banker–Charnes–Cooper (BCC), slack-based measure (SBM), epsilon-based measure (EBM).
Table 2. The list of DMUs.
No.DMUsStock CodeCompany NameMarket Capital
(in Bil.VND)
1DMU1MVB Vinacomin—Viet Bac Mining Industry Holding Corporation1627.50
2DMU2TVD Vinacomin—Vang Danh Coal Joint Stock Company350.71
3DMU3NBC Vinacomin—Nui Beo Coal Joint Stock Company270.09
4DMU4TDN Vinacomin—DeoNai Coal Joint Stock Company235.51
5DMU5TMB Vinacomin—Northern Coal Trading Joint Stock Company216.08
6DMU6TCS Vinacomin—Cao Son Coal Joint Stock Company214.07
7DMU7HLC Vinacomin—Ha Lam Coal Joint Stock Company210.95
8DMU8THT Vinacomin—Ha Tu Coal Joint Stock Company203.92
9DMU9TC6 Vinacomin—Coc Sau Coal Joint Stock Company149.48
10DMU10MDC Vinacomin—Mong Duong Coal Joint Stock Company147.79
Table 4. Forecasted inputs/outputs data for the year of 2022.
Inputs
(in Mil. VND)
Outputs
(in Mil. VND)
DMUSFixed AssetsOperating CostCOGSRevenuesOperating Profits
1DMU1 1,568,410.67 4,620,907.96 460,390.28 5,873,246.47 987,681.63
2DMU2 736,729.29 6,501,211.17 200,846.25 6,762,141.97 119,246.68
3DMU3 3,619,170.38 3,015,653.60 97,808.49 3,299,779.70 23,318.65
4DMU4 1,139,007.68 4,045,995.06 127,167.52 4,338,518.08 110,239.34
5DMU5 85,142.51 27,043,605.30 1,711,436.97 29,374,561.94 156,003.12
6DMU6 674,020.88 6,258,457.75 108,106.44 6,503,059.47 96,354.96
7DMU7 1,776,649.97 2,527,970.23 106,926.54 2,972,206.37 280,453.29
8DMU8 5,631,005.94 3,402,431.90 82,722.93 3,659,750.22 67,407.18
9DMU9 791,763.11 4,195,838.30 80,536.02 4,188,567.84 662.02
10DMU10 513,921.22 4,020,468.91 104,228.95 4,090,241.67 58,895.59
Table 5. Average MAPE of DMUs (in %).
DMUsFixed AssetsOperating CostCOGSRevenuesOperating ProfitsAverage MAPE of DMUs
DMU12.816.3410.6715.247.348.48
DMU210.283.387.7212.1114.759.648
DMU312.255.346.5410.3416.5410.202
DMU414.2810.5512.915.2213.4311.278
DMU55.2314.2212.275.657.328.938
DMU64.7612.029.654.784.717.184
DMU77.565.697.835.234.056.072
DMU83.092.358.344.8712.316.192
DMU912.346.122.6511.2315.239.514
DMU105.437.2315.345.123.787.38
Average MAPE of all 10 DMUs8.49
Table 6. Pearson Correlation of input and output data in 2017–2021.
FACOGSOCREOP
Fixed Asset (FA)Pearson Correlation10.927 **0.841 **0.775 **0.673 *
Sig. (2-tailed)0.0000.0000.0000.0000.000
Sample504504504504504
Cost of Goods Sold (COGS) Pearson Correlation0.927 **10.912 **0.997 **0.812 **
Sig. (2-tailed)0.0000.0000.0000.0000.000
Sample504504504504504
Operating Cost (OC)Pearson Correlation0.841 **0.912 **10.612 *0.854 **
Sig. (2-tailed)0.0000.0000.0000.0000.000
Sample504504504504504
Revenue (RE)Pearson Correlation0.775 **0.997 **0.612 *10.572 *
Sig. (2-tailed)0.0000.0000.0000.0000.000
Sample504504504504504
Operating Profit (OP)Pearson Correlation0.673 *0.812 **0.854 **0.572 *1
Sig. (2-tailed)0.0000.0000.0000.0000.000
Sample504504504504504
*; **. Correlation is significant at the 0.05; 0.01 level (2-tailed).
Table 7. Performance ranking of DMUs in 2020.
RankScoreDMUsRankScoreDMUs
1st1.83798HLC6th1.00001MVB
2nd1.45566TCS7th1TMB
3rd1.26283MDC8th0.88751TVD
4th1.18094TDN9th0.87454TC6
5th1.06304NBC10th0.85346THT
Table 8. Performance ranking of DMUs in 2021.
RankScoreDMUsRankScoreDMUs
1st1.71416HLC6th1.02582TDN
2nd1.30716THT7th1MVB
3rd1.13554MDC8th1TMB
4th1.1233NBC9th0.92088TVD
5th1.06334TCS10th0.88667TC6
Table 9. Forecasted inputs/outputs data for the year of 2022.
Inputs
(in Mil. VND)
Outputs
(in Mil. VND)
DMUsFixed AssetsOperating CostCOGSRevenuesOperating Profits
1MVB 1,568,410.67 4,620,907.96 460,390.28 5,873,246.47 987,681.63
2TVD 736,729.29 6,501,211.17 200,846.25 6,762,141.97 119,246.68
3NBC 3,619,170.38 3,015,653.60 97,808.49 3,299,779.70 23,318.65
4TDN 1,139,007.68 4,045,995.06 127,167.52 4,338,518.08 110,239.34
5TMB 85,142.51 27,043,605.30 1,711,436.97 29,374,561.94 156,003.12
6TCS 674,020.88 6,258,457.75 108,106.44 6,503,059.47 96,354.96
7HLC 1,776,649.97 2,527,970.23 106,926.54 2,972,206.37 280,453.29
8THT 5,631,005.94 3,402,431.90 82,722.93 3,659,750.22 67,407.18
9TC6 791,763.11 4,195,838.30 80,536.02 4,188,567.84 662.02
10MDC 513,921.22 4,020,468.91 104,228.95 4,090,241.67 58,895.59
11TVD + MVB 2,305,139.96 11,122,119.13 661,236.53 12,635,388.44 1,106,928.31
12TVD + NBC 4,355,899.67 9,516,864.77 298,654.74 10,061,921.67 142,565.33
13TVD + TDN 1,875,736.97 10,547,206.23 328,013.77 11,100,660.05 229,486.02
14TVD + TMB 821,871.80 33,544,816.47 1,912,283.22 36,136,703.91 275,249.80
15TVD + TCS 1,410,750.18 12,759,668.92 308,952.69 13,265,201.44 215,601.63
16TVD + HLC 2,513,379.27 9,029,181.40 307,772.79 9,734,348.34 399,699.97
17TVD + THT 6,367,735.24 9,903,643.07 283,569.18 10,421,892.19 186,653.85
18TVD + TC6 1,528,492.41 10,697,049.47 281,382.27 10,950,709.81 119,908.69
19TVD + MDC 1,250,650.51 10,521,680.08 305,075.20 10,852,383.64 178,142.27
20TC6+ TCS 1,465,784.00 10,454,296.04 188,642.46 10,691,627.32 97,016.97
21TC6 + MDC 1,305,684.33 8,216,307.21 184,764.97 8,278,809.52 59,557.61
22TC6 + TDN 1,930,770.79 8,241,833.36 207,703.54 8,527,085.92 110,901.36
Table 10. Performance ranking of virtual alliance 2022.
RankDMUScoreRankDMUScore
1stTMB 1.8900812thTVD + TMB1
2ndTHT 1.7202313thTDN 0.94399
3rdMVB 1.607414thTVD + MDC0.8995
4thHLC 1.4377515thTVD + TC60.86549
5thMDC 1.2276516thTVD 0.86385
6thTC6 + TCS1.1929817thNBC 0.8582
7thTVD+ NBC1.1197718thTVD + TDN0.84941
8thTCS1.0949719thTC6 + MDC0.83482
9thTC61.0933920thTC6 + TDN0.75497
10thTVD + MVB1.0296621stTVD + TCS0.73032
11thTVD + HLC1.002822ndTVD + THT0.71258
Table 11. Performance ranking of virtual alliance 2023.
RankDMUScoreRankDMUScore
1stTMB 2.4350612thTVD + TMB1
2ndTHT 1.8679813thTVD 0.959
3rdMVB 1.6507214thTVD + TC60.92934
4thHLC 1.5698315thTVD + TDN0.87388
5thTC6 + TCS1.2085916thTDN 0.86126
6thMDC 1.2018517thTC6 + MDC0.85962
7thTCS1.1600418thNBC 0.76097
8thTC6 1.1305219thTC6 + TDN0.74546
9thTVD + NBC1.0685920thTVD + MVB0.72076
10thTVD + MDC1.0605421stTVD + THT0.70813
11thTVD + HLC1.0008422ndTVD + TCS0.36444
Publisher’s Note: MDPI stays neutral with regard to jurisdictional claims in published maps and institutional affiliations.

