Article

A Novel Color Recognition Model for Improvement on Color Differences in Products via Grey Relational Grade

Department of Product and Media Design, Fo Guang University, Yilan 26247, Taiwan
Axioms 2021, 10(4), 266; https://doi.org/10.3390/axioms10040266
Submission received: 1 September 2021 / Revised: 17 October 2021 / Accepted: 18 October 2021 / Published: 20 October 2021
(This article belongs to the Special Issue Grey System Theory and Applications in Mathematics)

Abstract

:
ED light, a green energy-saving light source, can cause color cast. For this reason, LED light is seldom favored by designers. The purpose of the paper is to provide shoppers who are observing product colors in an LED-lighted setting with an innovative color identification model. Based on designers’ product color comparison, the paper employs high-reliability mechanic visual perception in combination with grey relational grade. Grey relational grade is applied to eliminate electrical fault pertaining to mechanic visual perception, whereby appropriate LED parameters and color cast inclination can be obtained. The paper first mimics retail store display windows. The color temperature and illuminance of LED light sources are adjustable. Two degrees of illuminance, including high illuminance (1500 lux) and low illuminance (500 lux), and two light source color temperatures, including yellow light (2700 K) and white light (4000 K), were assigned for study. Four colors, including red, yellow, blue and green of the natural color system, were selected as product colors. The mechanic visual perception sensor was used to identify the object (product) color, which is then converted into an RGB color model to serve as research data of color cast measurement, and the grey relational grade was applied to obtain the most appropriate LED light parameters and the color cast of the four colors. The data analysis reveals that green shows the least color cast when it is lighted by a yellow LED light source with low illuminance, yellow and blue have the least color cast when it is lighted by a white LED light source with high illuminance and red displays the least color cast when it is lighted by a white LED light source with low-illuminance. The analysis also indicates each color’s cast inclination in blackness, chromaticness and hue. As a result, LED light that is more acceptable to designers is suggested for display windows, thus reducing problems with product color cast.

1. Introduction

In order to attract buyers, stores tend to utilize display window illumination to create a more attractive store atmosphere and image. Some products, for example, need a warm and friendly light source, while other more rational products require cooler light sources. LED as an energy-saving light source is a good choice for stores that need to keep their display windows lit all day long. However, disputes can arise where LED light source is applied. Buyers’ visual perception of the true color of a product can be misleading. Buyers are likely to be surprised at finding that the color of the product in front of them is different from what they saw before. Store light and sunshine are accountable for this seeming color disparity. It is found empirically that light rays can extremely affect product color under observation. It is important, therefore, to appropriately implement a light source to reduce color cast [1]. Furthermore, a large number of customer complaints can influence businesses’ management sustainment.
Product color cast was analyzed as product color and LED light source. The three cones of the retina, which are especially sensitive to red, green and blue light rays, are mainly responsible for identifying colors [2]. According to research, RGB (red, green and blue color model) can display different colors on different computer monitors [3]. Scholars and experts were expecting to establish a reliable system, called “color system”, for describing color. A color system that is based on color theory can systematically organize color. Such systems use precise numbers and symbols to represent different colors for reference. There are currently a variety of color systems, including the Munsel color order system, the Ostwald color system, PCCS (the practical color coordinate system), CIE (the International Commission on Illumination) and NCS (the natural color system) [4].
The research on NCS can be traced back to as early as 1611. By 1979, it had become the national standard of Sweden after a series of experiments by colorists, psychologists, physicists and architects [5]. Of all systems mentioned above, NCS alone is based on designers’ perception of blackness, chromaticness and hue, which are the three dimensions of color. This system not only takes color quantification into consideration but fits humankind’s feelings about color [6]. For this reason, the present paper refers to it as a research instrument. LED can cause product color cast. White LED light, which is popular in the market, is cheap and simple. However, it lacks red on the spectrum. White LED light, therefore, is discredited with a limited color temperature range and poorer color rendering [7].
Despite being limited in the CCT range and having poorer color rendering, white LED light is credited with adjustable illuminance and CCT. A controller can be used to adjust the color temperature freely, and illuminance of white LED light. A majority of stores have installed LED for lighting. However, it causes a light cast to arise [7]. For this reason, many designers are reluctant to use LED light. They prefer, instead, to apply more energy-consuming traditional light sources. In view of this phenomenon, this research aims to set up an experimental scenario, where product responses to different combinations of illuminance and color temperatures are investigated. The data analysis establishes from which situation different colors of LED light can lead to less light cast. The finding can be referred to by designers.
Color cast is studied in terms of examinees’ direct watching and mechanic visual perception. The two-color cast analysis models are currently widely applied to product development [8,9]. It is found that LED light shows higher directivity when watched by examinees. According to research, a light source with low illuminance is more likely to cause reader eye fatigue. However, this does not mean higher illuminance is better. High illuminance can cause eye dazzling due to visual perception. As a result, in order to ensure optimal efficacy, the illuminance provided by a light source is determined by to what extent watchers’ visual perception can accept illuminance [10]. There is also research concerning how the color temperature of industry LED light affects perception, cognition and emotional status. Higher color temperature can boost positive emotion and sobriety on the one hand and enhance perception, cognition and task speed on the other hand [11].
This does not mean high color temperature light sources can be applied for all settings. The color manifested by a light source can affect watchers’ psychological feelings. Light, indeed, can create a pleasing indoor atmosphere. According to the paper, direct watching can reduce post-test reliability due to examinees’ psychological status and light atmosphere. Mechanical visual perception, though it has higher post-test reliability, can be affected, during the process of measurement, by the difference between lens and filter, electrical fault and uncertain signals [12]. Besides, as measurement value is equal to the number of RGB, there is a difficulty, therefore, satisfying designers’ visual feeling [13].
The grey theory conducts a relationship analysis on uncertain relationships between the various factors within the system, where part of the information is known, and another part is unknown. The present paper applies mechanic visual perception coupled with grey relationship analysis to multi-goal decision making [14]. It explores to what extent store LED illumination causes product color cast; how to adequately adjust LED light source illuminance, color temperature and product surface treatment; and color cast inclination of different colors. Based on minimum LED light source color cast, this research investigates the color cast value judged by watchers, who are exposed to different degrees of illuminance and color temperatures and product colors. Affecting factors of the color cast are obtained, and color cast inclination is established. A grey model of the color cast is thus established to provide designers with color cast inclination where products are lighted by LED light sources. Such a device enables designers to pre-adjust light sources.

2. Gray Relational Grade

The grey relational grade is a measurement method for analyzing the correlation degree among discrete sequences [15,16] and a cardinal method to measure the degree of relation between various factors [17,18]. The calculation process is very simple and very clear and does not require huge data; hence, it is easier to use than the traditional method, and it can effectively handle discrete data [19,20]. At present, the grey relational grade is widely used in multi-objective decision making, such as engineering, business and management for performance evaluation [21,22]. The main connotation of grey relational grade is based on the degree of similarity to find the difference among the sequences to be analyzed [23].
The basic mathematics analysis steps are described as follows.
In the grey relational space, { P ( X ) ; Γ } , exists sequences x i ( x i ( 1 ) , x i ( 2 ) , x i ( 3 ) , x i ( k ) ) X, where i = 0 , 1 , 2 , , m , k = 1 , 2 , 3 , , n N, mean
x 0 = ( x 0 ( 1 ) , x 0 ( 2 ) , x 0 ( 3 ) , , x 0 ( k ) ) x 1 = ( x 1 ( 1 ) , x 1 ( 2 ) , x 1 ( 3 ) , , x 1 ( k ) ) x 2 = ( x 2 ( 1 ) , x 2 ( 2 ) , x 2 ( 3 ) , x 2 ( k ) )       = x m = ( x m ( 1 ) , x m ( 2 ) , x m ( 3 ) , , x m ( k ) )
According to the grey system theory, if among all the sequences, the sequence x 0 ( k ) is taken as the reference sequence, and the other sequences x i ( k ) are comparison sequences, it is called localization grey relational grade. The paper uses Wen’s grey relational grade Γ 0 i , as shown in Equation (2).
Γ 0 i = Γ ( x 0 , x i ) = Δ min . + Δ max . Δ ¯ 0 i + Δ max . ,   Δ ¯ 0 i = { 1 n k = 1 n [ Δ 0 i ( k ) ] }
where i = 1 , 2 , 3 , , m , k = 1 , 2 , 3 , , n , j I
i. x 0 is standard sequence, x i are comparison sequences;
ii. Δ o i = | | x 0 ( k ) x i ( k ) | | : The norm between x 0 and x i ;
iii. Δ min . = j i min . min . k || x 0 ( k ) x j ( k ) || , Δ max . = j i max . max . k || x 0 ( k ) x j ( k ) || .

3. Research Method

The research method (including experimental content) regarding display window product color cast is divided into research experimental equipment, color selection and color cast assessment.

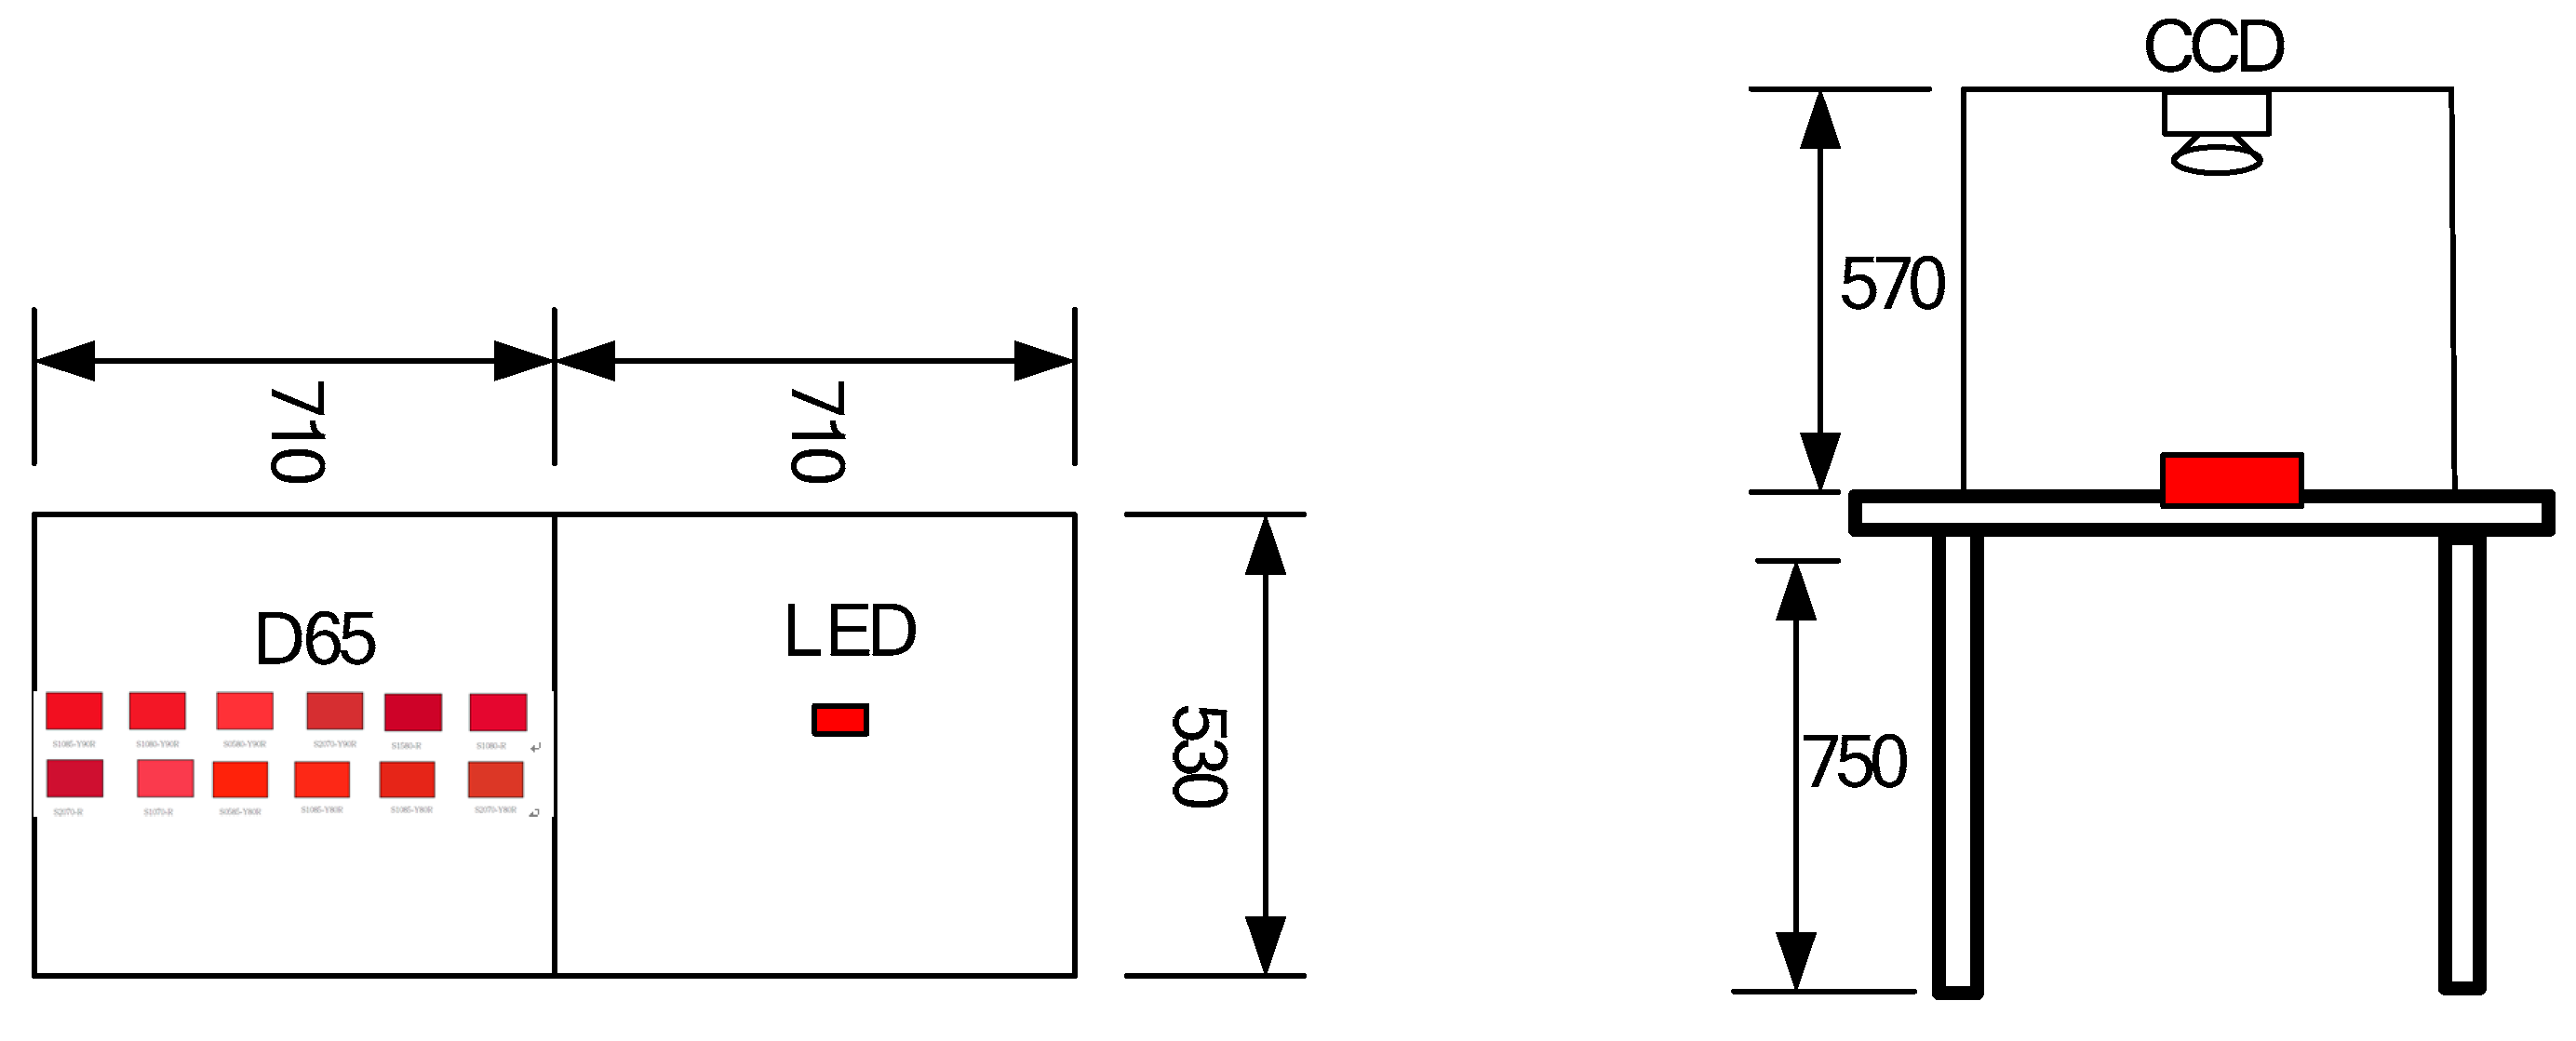
3.1. Experimental Equipment

Figure 1 shows the experimental equipment. Once a designer finishes product proof, they need to compare and contrast the sample color with the color chart. In this experiment, two light boxes, including an experimental standard color box and an LED light box, served for comparison. The experimental box (710 × 530 × 570 mm) was exposed to D65 international standard artificial daylight (specification: color temperature: 6500 K; power 18 W). The LED box for general physical retail stores, following Energy and Architecture, assumed 2700 K and 4000 K color temperatures. Taiwan’s CNS national standard illuminance was referred to for illuminance. The minimum illuminance for a general retail store assumes 500 lux, while counters and display windows in a large-sized store assume 1500 lux. Both boxes have the same standard color size.
LED for the experiment needed to be adjusted for luminance and color temperature. In the paper, color temperatures were set at 4000 K and 2700 K, with rendering being Ra = 85. Two light adjusters were set for adjusting luminance. Where the 4000 K color temperature with a luminance of 1500 lux was required, the 2700 K LED luminance was adjusted for minus; 4000 K luminance was adjusted for the required luminance. The experimental needs could therefore be met. The luminance adopts nom-segment adjustment. A luminance meter with a luminance range falling on ±20 lux was used for the actual measurement. LED light source affects watchers’ judgment of sample color cast. By utilizing LED adjustability, the paper provided four combinations using two degrees of luminance (1550 lux, 500 lux) and two color temperatures (2700 K, 4000 K).

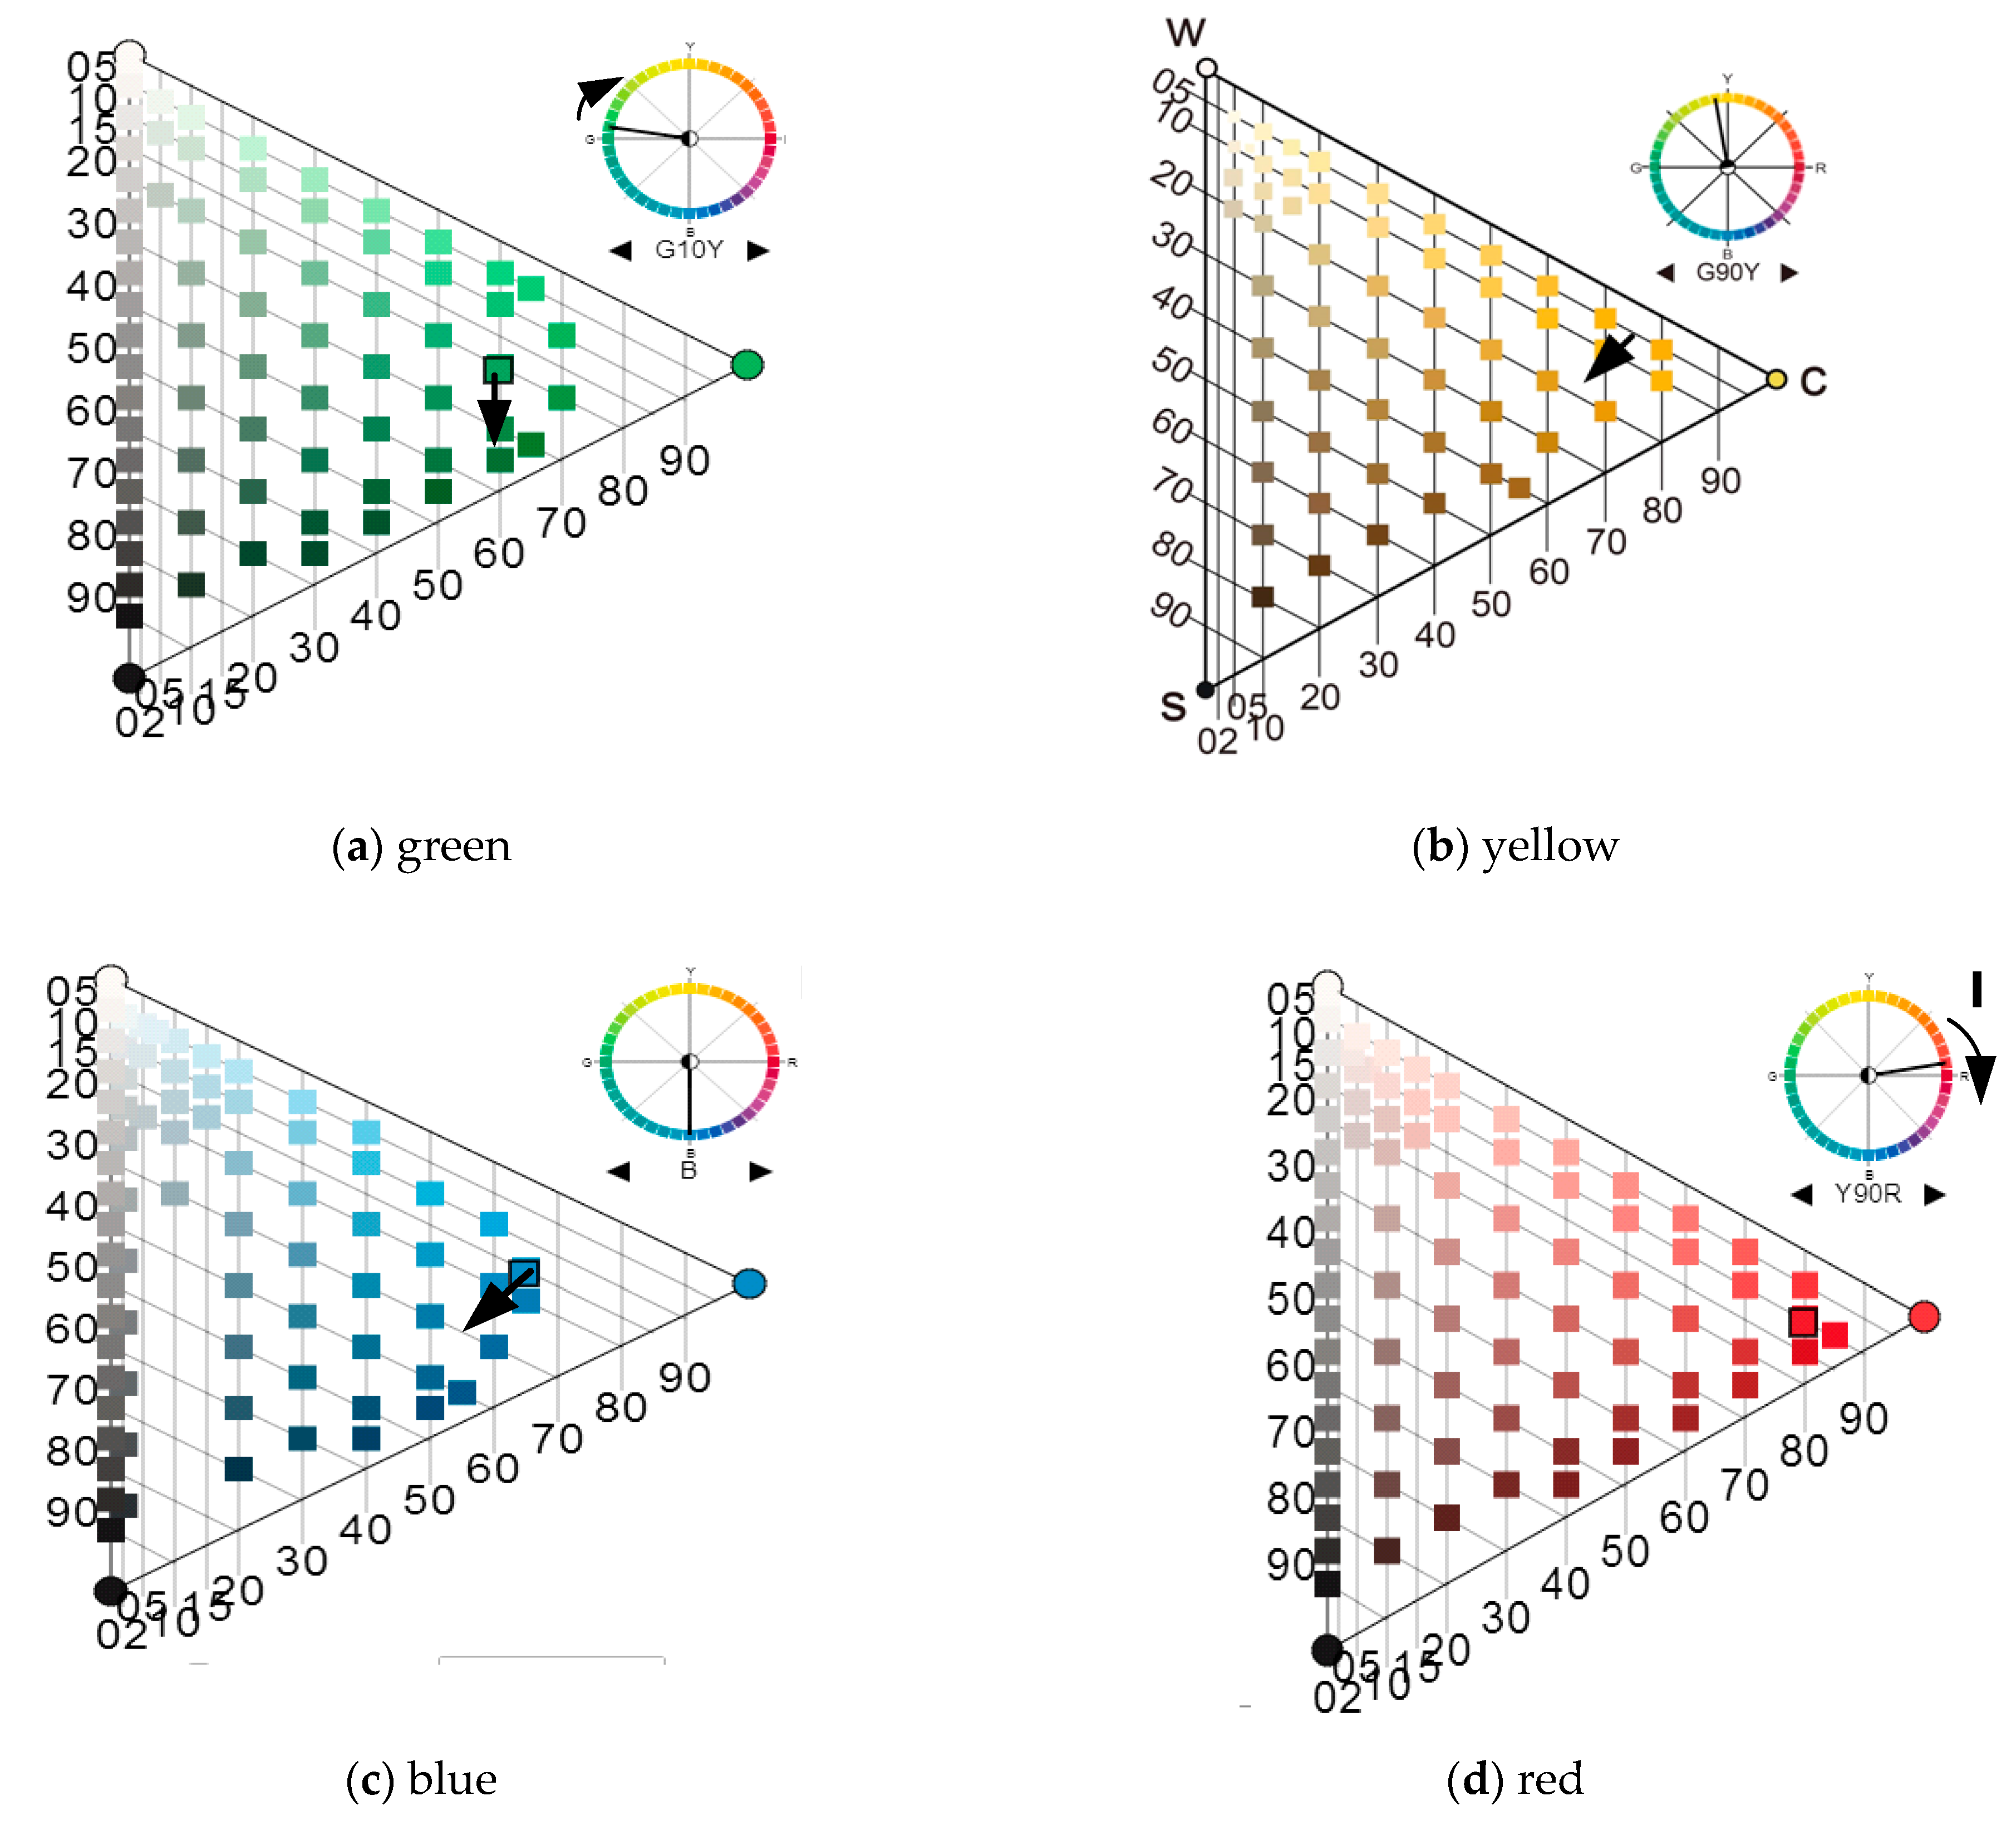
3.2. Color Selection

The paper refers to NCS. NCS code number 2050-Y90 R indicates a color falling between the Y and R range, and the characteristics are:
1. Ninety percent is red, with the remaining 10% being Y;
2. Twenty percent blackness can be seen;
3. Fifty percent of colors can be seen.
Thus, the selected YBRG four colors are placed on the Encycplordia website, corresponding to the NCS system color chart. The Y of YRGB corresponds to S0575-G90 Y; B, to S1565-B; R, to S1080-Y90R; G, to S2060-G10Y [24]. Four similar colors are selected out of the four basic colors and rendered in terms of blackness, chromaticness and hue. Table 1 shows the basic conception. Again, select from all 1950 basic colors of the NCS index. Table 1 demonstrates the color chart. The comparison colors are used to understand color cast inclination.

3.3. Assessing Color Cast

The color cast assessment consists of a treatment group and a control group. The variables of the treatment group included the light source and two degrees of illuminance and two color temperatures. The light sources of the control group included D65, standard color chart and comparison colors. A photoelectric sensor was used to trigger CCD charge-coupled device and the flash fixation device simultaneously. With the help of light source diffusion, dazzling light and shadow can be eliminated for clear images, thus benefiting color image treatment. MATLAB was implemented to convert image color space into an RGB value. Lastly, the grey relational grade was adopted for data analysis. Figure 2 shows the process.
Generally speaking, many papers discuss the research of noise [25,26,27]. In this study, deviation (ʋ), disturbance value (n) and amplification rate (g) are associated with CCD measurement. In the experiment, the standard color chart exposed to the LED light source and comparison light chart in the D65 light source (mimicking sunlight) were converted into RGB values applying the same CCD and capture card system. Due to color similarity, the generated values, including deviation amount, disturbance value and amplification rate, are the same.
( RGB ) m = g [ ( RGB ) t + υ ] + n
where: (RGB)m is measurement value, (RGB)t is true value.
Substituting the measurement values to Equation (4), wherein
Δ i j = ( RGB ) m i ( RGB ) m j = g [ ( RGB ) t i + υ + n ] g [ ( RGB ) t j + υ + n ] = g [ ( RGB ) t i g [ ( RGB ) t j ]
Again, substituting Equation (6) to Equation (3),
Γ i j = Γ ( x i , x j ) = Δ min m . + Δ max m . Δ ¯ i j m + Δ max m . = g ( Δ min t . + Δ max t . ) g ( Δ ¯ i j t + Δ max t . ) = Δ min t . + Δ max t . Δ ¯ i j t + Δ max t .
Therefore, applying grey relational grade can remove deviation (ʋ), disturbance value (n) and amplification rate (g).

4. Calculation Results

Table 2, which shows the RGB data of four colors exposed to standard light (D65) and four LED lights, helps understand how color temperature and illuminance affect product color cast.

4.1. Analysis of Color Temperature and Color Cast through Illuminance

1. Based on D65 standard light to calculate the grey relational grade of green light:
(1) Set the standard sequence from Table 2
x 0 = (30, 98, 61);
(2 ) List the comparison sequences
x 1 = (75,119,94), x 2 = (53,108,79), x 3 = (69,92,66), x 4 = (65,79,56);
(3) Establish the different sequences
Δ 01 = (45, 21, 33), Δ 02 = (23, 10, 18), Δ 03 = (39, 6, 5), Δ 04 = (35, 29, 5).
Thus, Δ max . = 45 and Δ min . = 5;
(4) Substitute into Equation (2) to obtain the grey relational grade (the results are shown in Table 3), which means that the closer the grey relational grade is to 1, the smaller the color cast.
2. As the calculation steps mentioned above, the grey relational grade of yellow light, red light and blue light are calculated. The results are shown in Table 4.

4.2. Analysis of Mechanic Visual Perception

Next, color cast inclination was investigated. Four colors were compared for exposition to four LED lights and standard light (D65). Table 1 indicates thirteen similar colors of each color on NCS. Table 5 and Table 6 indicate the RGB values analyzed in terms of mechanic visual perception.
Four colors of LED serve as basic designated standard series; take the green color for example:
1. First, establish the grey relational grade of green light; the 1500 lux × 4000 K is the standard sequence, and all of the D65 standard lights are comparison sequences; hence,
(1) Set standard sequence x 0 = (75,119,94);
(2) Set comparison sequences;
x 1 = (30, 98, 61), x 2 = (34, 89, 58), x 3 = (45, 79, 55), …, x 13 = (69, 98, 80).
(3) Establish the different sequences;
Δ 01 = (45, 21, 33), Δ 02 = (41, 30, 36), Δ 03 = (30, 40, 39),…, Δ 13 = (6, 21, 14).
(4) Substitute Equation (4) to obtain the grey relational grade.
2. Calculate the grey relational grade of green light under 500 lu × 4000 K, 1500 lu × 2700 K and 500 lu × 2700 K in three states.
3. As with the calculation steps mentioned above, the grey relational grade of the yellow light chart, red light chart and blue light chart was found. All are shown in Table 7.

5. Discussion

The purpose of the paper was to investigate how LED light sources affect basic product colors, including green, yellow, red and blue, in store display windows. Issues surround the color identification model, selection range on the color chart and analysis of product color cast inclination. Concerning the color identification model, the mechanic visual perception had a long history of development. It is widely applied to commerce, medical treatment, automation and security. The mechanic visual perception devices, in general, use CCD electric gadgets coupled with image capture signal amplifiers, environmental lighting and other signal disturbances, which jointly cause color cast. On the other hand, designers have difficulty adjusting visual feeling, given the values derived from the measurement. In this research experiment, the standard color chart exposed to LED light sources and the comparison color chart exposed to D65 light source (mimicking sun ray) are converted into RGB values by applying the same CCD and capture card system. In addition, there is color similarity. Grey relational grade shows that their cast amounts offset each other. The influence of light source and blackness on product color is obtained, accordingly. The closest RGB values of the standard color chart in LED light source and D65 light source indicate the value of blackness, hue and chromaticness. The result can be a guide for designers.
Let us turn to the analysis of selecting the color cast range. Concerning green, 13 comparison colors were selected. The RGB values in the D65 light source fall in the range of 21–78, 63–166 and 42–111. The RGB values of standard colors in LED light sources fall on the range of 53–75, 79–119, and 56–94. The range of select color charts is sufficient. Concerning green, 13 comparison colors were selected. The RGB values in the D65 light source fall in the range of 164–206, 136–157, and 11–13. The RGB values of standard colors in LED light sources fall in the range of 164–206, 130–188, and 11–41. The range of select color charts is sufficient. Concerning blue, 13 comparison colors were selected. The RGB values in the D65 light source fall in the range of 22–78, 73–138, and 03–181. The RGB values of standard color charts in LED light sources fall in the range of 23–28, 75–107, 105–155. The range of select color charts is sufficient. Concerning red, 13 comparison colors were selected. The RGB values in the D65 light source fall in the range of 132–188, 39–88, and 34–90. The RGB values of standard color charts in LED light sources fall in the range of 133–170, 39–86, 37–88. The select color range is sufficient.
Table 3 and Table 4 show the experimental data of color cast and light source. The data analysis indicates different color systems fit different LED light sources. According to Table 3, green system products have the least color cast in low illuminance (500 lux) and low color temperature (500 lux). Table 4 indicates the yellow system and the blue system products have the least color cast in high illuminance (1500 lux) and high color temperature (4000 K). The red system products have the least color cast in low illuminance (500 lux) and high color temperature (4000 K). Table 6, which combines the results shown in Table 3 and Table 4, shows green system products display higher blackness value, less chromaticness and yellow-inclined hue in low illuminance and low temperature LED light source. The result is shown in Figure 3a. The yellow system products display inadequate blackness value and chromaticness, and the hue is less inclined in high illuminance and high color temperature LED light sources, as shown by the arrow of Figure 3b. The blue system products display inadequate blackness value and chromaticness, and the hue is less inclined in high illuminance and high color temperature LED light source, as shown by the arrow of Figure 3c. The red system products display less variation in blackness value and chromaticness, and the hue is red-inclined in high illuminance and high color temperature LED light source, as shown by the arrow of Figure 3d.

6. Conclusions

This paper investigates display window products exposed to different LED light colors. Four basic colors of the NCS color chart system are subject to analysis in terms of mechanic visual perception in combination with grey relational grade. The color cast can be studied in terms of the examinees’ directly identified visual color. This method is similar to the store display windows model. However, the examinees’ color identification can be affected by personal subjective color favor. Furthermore, the examinees’ psychological status can also disturb their color identification. Both can lead to measurement instability. Mechanic visual perception, on the other hand, possesses a higher degree of measurement stability. However, in the process of measurement, numerical measurement offset can arise due to disturbance by electrical information and an ill-match between software and hardware. More importantly, measurement produces general RGB values, which may not satisfy designers’ feelings, and the measurement can neither be adjusted.
The present paper adopts the comparison colors system model used by designers. Instead of referring to the psychological status of watchers, this research implements mechanic visual perception. It can thus avoid subjective instability in color identification on the one hand, and by using grey relational color comparison, it can minimize hardware and software offset. Through NCS color system grey relational comparison, visual perception offset in blackness, chromaticness and hue can be obtained. This enables designers to know product color cast inclination in LED light, thus making it convenient for them to conduct color adjustment.
LED illuminance in store display windows is suggested to fall on 1500–500 lux, and color temperature is suggested to fall on 2700 K to 4000 K. Four NCS colors, including green, yellow, blue and red are different from each other in color cast. The yellow system products show the highest degree of color cast. LED light sources, therefore, should not be applied to yellow system products. Green system products show less color cast when lighted by low illuminance LED light sources. Blue system products manifest less color cast when lighted by high illuminance white LED light sources. Red system products are suggested to be lighted by low illuminance white LED light sources. The research result can be applied to the system of LED color cast. Designers will be more willing to apply energy and carbon-saving LED to lighting in retail stores.

Funding

The paper was financial supported by Ministry of Science and Technology, Taiwan (grant number MOST 109-2221-E-431-001).

Institutional Review Board Statement

Not applicable.

Informed Consent Statement

Not applicable.

Data Availability Statement

Not applicable.

Conflicts of Interest

The author declares no conflict of interest.

References

  1. Tantanatewin, W.; Inkarojrit, V. Effects of color and lighting on retail impression and identity. J. Environ. Psychol. 2016, 46, 197–205. [Google Scholar] [CrossRef]
  2. Rigos, A.; Chatzistamatis, S.; Tsekouras, G.E. A systematic methodology to modify color images for dichromatic human color vision and its application in art paintings. Int. J. 2020, 9, 5015–5025. [Google Scholar] [CrossRef]
  3. Agoston, G.A. Color Theory and Its Application in Art and Design; Springer: Berlin/Heidelberg, Germany, 2013; Volume 19. [Google Scholar]
  4. Fine, A. Color Theory: A Critical Introduction; Bloomsbury Publishing: London, UK, 2021. [Google Scholar]
  5. Wyszecki, G.; Stiles, W.S. Color Science: Concepts and Methods, Quantitative Data, and Formulae; Wiley: Hoboken, NJ, USA, 2000. [Google Scholar]
  6. Hård, A.; Enberg, K. NCS—The natural color system for the denotation of colour. In Colour for Architecture Today; Taylor & Francis: Abingdon, UK, 2019. [Google Scholar]
  7. Sommer, C.; Reil, F.; Krenn, J.R.; Hartmann, P.; Pachler, P.; Tasch, S.; Wenzl, F.P. The impact of inhomogeneities in the phosphor distribution on the device performance of phosphor-converted high-power white LED light sources. J. Lightwave Technol. 2010, 28, 3226–3232. [Google Scholar] [CrossRef]
  8. Wu, C.C.; Wu, C.F.; Hung, C.C.; Huang, W.S.; Cheng, P.J. Effects of color temperature and luminance of LEDs on color judgments involving various printing materials. J. Soc. Inf. Disp. 2016, 24, 137–143. [Google Scholar] [CrossRef]
  9. Sonka, M.; Hlavac, V.; Boyle, R. Image Processing, Analysis, and Machine Vision; Cengage Learning: Belmont, CA, USA, 2014. [Google Scholar]
  10. Sammarco, J.J.; Gallagher, S.; Reyes, M. Visual performance for trip hazard detection when using incandescent and led miner cap lamps. J. Saf. Res. 2010, 41, 85–91. [Google Scholar] [CrossRef] [PubMed]
  11. Hawes, B.K.; Brunyé, T.T.; Mahoney, C.R.; Sullivan, J.M.; Aall, C.D. Effects of four workplace lighting technologies on perception, cognition and affective state. Int. J. Ind. Ergon. 2012, 42, 122–128. [Google Scholar] [CrossRef]
  12. Divya, Y.; Kumar, C.P. Machine Vision based Color Recognition by Robotic Arm using LabVIEW. CVR J. Sci. Technol. 2020, 18, 100–104. [Google Scholar] [CrossRef]
  13. Xu, C.; Wu, C.F.; Xu, D.D.; Lai, Y.S. Have the display Illumination design misled customers on color perception? A study on differences of color caused by LED lighting on leather products. In International Conference on Applied Human Factors and Ergonomics, Proceedings of the AHFE 2020 Virtual Conferences on Design for Inclusion, Affective and Pleasurable Design, Interdisciplinary Practice in Industrial Design, Kansei Engineering, and Human Factors for Apparel and Textile Engineering, Virtual, 16–20 July 2020; Springer: Cham, Switzerland, 2020. [Google Scholar]
  14. Sun, X.; Hu, Z.; Li, M.; Liu, L.; Xie, Z.; Li, S.; Liu, F. Optimization of pollutant reduction system for controlling agricultural non-point-source pollution based on grey relational analysis combined with analytic hierarchy process. J. Environ. Manag. 2019, 243, 370–380. [Google Scholar] [CrossRef] [PubMed]
  15. Li, G.-D.; Yamaguchi, D.; Nagai, M. A grey-based decision-making approach to the supplier selection problem. Math. Comput. Modeling. 2007, 46, 573–581. [Google Scholar] [CrossRef]
  16. Vatansever, K.; Akgűl, Y. Performance evaluation of websites using entropy and grey relational analysis methods: The case of airline companies. Decis. Sci. Lett. 2018, 7, 119–130. [Google Scholar] [CrossRef]
  17. Kung, C.Y.; Yan, T.M.; Lai, C.S. Analyzing service quality in the mobile communications industry—A comparison between GRA and LISREL. J. Grey Syst. 2009, 12, 49–58. [Google Scholar]
  18. Liou, J.J.; Chang, C.S. The Grouping of Local Cultural Product via Grey Relational Analysis. J. Grey Syst. 2013, 16, 149–156. [Google Scholar]
  19. Sarraf, F.; Nejad, S.H. Improving performance evaluation based on balanced scorecard with grey relational analysis and data envelopment analysis approaches: Case study in water and wastewater companies. Eval. Program Plan. 2020, 79, 101762. [Google Scholar] [CrossRef] [PubMed]
  20. Canbolat, A.S.; Bademlioglu, A.H.; Arslanoglu, N.; Kaynakli, O. Performance optimization of absorption refrigeration systems using Taguchi, ANOVA and Grey Relational Analysis methods. J. Clean. Prod. 2019, 229, 874–885. [Google Scholar] [CrossRef]
  21. Li, X.; Wang, Z.; Zhang, L.; Zou, C.; Dorrell, D.D. State-of-health estimation for Li-ion batteries by combing the incremental capacity analysis method with grey relational analysis. J. Power Sources. 2019, 410, 106–114. [Google Scholar] [CrossRef]
  22. Sun, G.; Guan, X.; Yi, X.; Zhou, Z. Grey relational analysis between hesitant fuzzy sets with applications to pattern recognition. Expert Syst. Appl. 2018, 92, 521–532. [Google Scholar] [CrossRef]
  23. Wen, K.L. Grey System Theory, 2nd ed.; Wunan Publisher: Taipei, Taiwan, 2013. [Google Scholar]
  24. Dou, X.; Wu, C.F.; Lin, K.C.; Liou, J.J. What color does the consumer see? perceived color differences in plastic products in an LED-Lit environment. Sustainability 2019, 11, 5985. [Google Scholar] [CrossRef] [Green Version]
  25. Hu, T.; Zhao, J.; Zheng, R.; Wang, P.; Li, X.; Zhang, Q. Ultrasonic based concrete defects identification via wavelet packet transform and GA-BP neural network. PeerJ Comput. Sci. 2021, 7, e635. [Google Scholar] [CrossRef] [PubMed]
  26. Schimmack, M.; Mercorelli, P. A Wavelet Packet Tree Denoising Algorithm for Images of Atomic-Force Microscopy. Asian J. Control 2018, 4, 1367–1378. [Google Scholar] [CrossRef]
  27. Mercorelli, P. Denoising and harmonic detection using nonorthogonal wavelet packets in industrial applications. J. Syst. Sci. Complex. 2007, 20, 325–343. [Google Scholar] [CrossRef]
Figure 1. The structure of experimental equipment.
Axioms 10 00266 g001
Figure 2. The analysis steps of the experiment.
Axioms 10 00266 g002
Figure 3. The trend of color cast.
Axioms 10 00266 g003
Table 1. The color chart between standard color and comparison color.
StandardComparison Color
Axioms 10 00266 i001
S2060-G10Y
Axioms 10 00266 i002
S2070-G10Y
Axioms 10 00266 i003
S3060-G10Y
Axioms 10 00266 i004
S1070-G10Y
Axioms 10 00266 i005
S3065-G10Y
Axioms 10 00266 i006
S1075-G20Y
Axioms 10 00266 i007
S3060-G20Y
Axioms 10 00266 i008
S2070-G20Y
Axioms 10 00266 i009
S2060-G20Y
Axioms 10 00266 i010
S2060-G
Axioms 10 00266 i011
S2565-G
Axioms 10 00266 i012
S1060-G
Axioms 10 00266 i013
S3060-G
Axioms 10 00266 i014
S0575-G90Y
Axioms 10 00266 i015
S0570-G90Y
Axioms 10 00266 i016
S1070-G90Y
Axioms 10 00266 i017
S1075-G90Y
Axioms 10 00266 i018
S2070-G90Y
Axioms 10 00266 i019
S0570-G80Y
Axioms 10 00266 i020
S1075-G80Y
Axioms 10 00266 i021
S0565-G80Y
Axioms 10 00266 i022
S1070-G80Y
Axioms 10 00266 i023
S0570-Y
Axioms 10 00266 i024
S0580-Y
Axioms 10 00266 i025
S1080-Y
Axioms 10 00266 i026
S1070-Y
Axioms 10 00266 i027
S1565-B
Axioms 10 00266 i028
S1550-R90B
Axioms 10 00266 i029
S1560-R90B
Axioms 10 00266 i030
S2065-R90B
Axioms 10 00266 i031
S2060-R90B
Axioms 10 00266 i032
S1555-B10G
Axioms 10 00266 i033
S1050-B10G
Axioms 10 00266 i034
S2055-B10G
Axioms 10 00266 i035
S3060-B10G
Axioms 10 00266 i036
S1060-B
Axioms 10 00266 i037
S2060-B
Axioms 10 00266 i038
S2065-B
Axioms 10 00266 i039
S3060-B
Axioms 10 00266 i040
S1080-Y90R
Axioms 10 00266 i041
S1085-Y90R
Axioms 10 00266 i042
S1580-Y90R
Axioms 10 00266 i043
S0580-Y90R
Axioms 10 00266 i044
S2070-Y90R
Axioms 10 00266 i045
S1580-R
Axioms 10 00266 i046
S1080-R
Axioms 10 00266 i047
S2070-R
Axioms 10 00266 i048
S1070-R
Axioms 10 00266 i049
S0585-Y80R
Axioms 10 00266 i050
S1085-Y80R
Axioms 10 00266 i051
S1585-YR
Axioms 10 00266 i052
S2070-Y80R
Table 2. The RGB value in different lights.
Green (R,G,B)Yellow (R,G,B)Blue (R,G,B)Red (R,G,B)
D65 Standard(30,98,61)(194,186,41)(56,118,159)(182,70,82)
1500 lux × 4000 K (75,119,94)(185,157,13)(23,105,155)(170,86,88)
500 lux × 4000 K(53,108,79)(164,151,13)(27,107,128)(165,69,73)
1500 lux × 2700 K(69,92,66)(194,136,11)(23,75,105)(160,62,49)
500 lux × 2700 K(65,79,56)(206,146,13)(28,79,118)(133,39,37)
Table 3. The grey relational grade of green light.
TypeGrey Relational GradeRank
1500 lux × 4000 K0.641
500 lux × 4000 K0.658
1500 lux × 2700 K0.810
500 lux × 2700 K0.8151
Table 4. The grey relational grade of yellow light, red light and blue light.
YellowRankBlueRankRedRank
1500 lux × 4000 K0.69110.82010.829
500 lux × 4000 K0.615 0.747 0.8621
1500 lux × 2700 K0.652 0.596 0.714
500 lux × 2700 K0.679 0.644 0.551
Table 5. The RGB value of the experimental planning color chart under different lighting and mechanical vision perception analysis.
TypeColor ChartGreen (R,G,B)Color ChartYellow (R,G,B)
1500 lux × 4000 KS2060-G10 Y(75,119,94)S0575-G90 Y(185,157,13)
500 lux × 4000 KS2060-G10Y(53,108,79)S0575-G90Y(164,151,13)
1500 lux × 2700 KS2060-G10Y(69,92,66)S0575-G90Y(194,136,11)
500 lux × 2700 KS2060-G10Y(55,79,56)S0575-G90Y(206,146,13)
D65S2060-G10Y(30,98,61)S0575-G90Y(171,162,11)
S2070-G10Y(34,89,58)S0570-G90Y(194,175,19)
S3060-G10Y(45,79,55)S1070-G90Y(185,163,26)
S1070-G10Y(21,96,57)S1075-G90Y(164,130,38)
S3065-G10Y(30,63,42)S2070-G90Y(171,137,47)
S1075-G20Y(41,111,61)S0570-G80Y(197,188,21)
S3060-G20Y(60,96,70)S1075-G80Y(194,186,41)
S2070-G20Y(42,94,56)S0565-G80Y(184,181,28)
S2060-G20Y(39,100,59)S1070-G80Y(179,173,33)
S2060-G(74,113,92)S0570-Y(206,171,39)
S2565-G(78,116,91)S0580-Y(203,166,16)
S1060-G(63,135,111)S1080-Y(197,146,21)
S3060-G(69,98,80)S1070-Y(198,155,27)
Table 6. The RGB value of the experimental planning color chart under different lighting and mechanical vision perception analysis (cont.).
TypeColor ChartBlue (R,G,B)Color ChartRed (R,G,B)
1500 lux × 4000 KS1565-B(23,105,155)S1080-Y90R(170,86,88)
500 lux × 4000 KS1565-B(27,107,128)S1080-Y90R(165,69,73)
1500 lux × 2700 KS1565-B(23,75,105)S1080-Y90R(160,62,49)
500 lux × 2700 KS1565-B(28,79,118)S1080-Y90R(133,39,37)
D65S1565-B(56,118,159)S1080-Y90R(182,70,82)
S1050-R90B(65,138,181)S1085-Y90R(184,67,76)
S1560-R90B(73,138,178)S1080-Y90R(188,66,77)
S2065-R90B(66,127,171)S0580-Y90R(183,61,72)
S2060-R90B(35,96,143)S2070-Y90R(157,57,55)
S1555-B10G(31,114,148)S1580-R(152,60,71)
S1050- B10G(30,119,161)S1080-R(168,65,70)
S2055- B10G(36,105,136)S2070-R(132,39,34)
S3060- B10G(36,81,114)S1070-R(176,54,69)
S1060-B(22,117,176)S0585-Y80R(185,88,90)
S2060-B(38,109,155)S1085-Y80R(186,79,87)
S2065-B(30,88,128)S1085-Y80R(171,70,78)
S3060-B(29,73,103)S2070-Y80R(156,55,61)
Table 7. The closest grey relational grade under different lights.
ColourGreenYellow
TypeLEDD65LEDD65
1500 lux × 4000 KS2060-G10YS3060-G10YS0575-G90YS1070-G90Y
500 lux × 4000 KS2060-G10YS3060-G20YS0575-G90YS0575-G90Y
1500 lux × 2700 KS2060-G10YS2565-GS0575-G90YS0580-Y
500 lux × 2700 KS2060-G10YS3060-GS0575-G90YS1080-Y
ColourBlueRed
TypeLEDD65LEDD65
1500 lux × 4000 KS1565-BS2060-BS1080-Y90RS1085-Y80R
500 lux × 4000 KS1565-BS2060-BS1080-Y90RS1080-R
1500 lux × 2700 KS1565-BS2065-BS1080-Y90RS2070-Y90R
500 lux × 2700 KS1565-BS3060-BS1080-Y90RS2070-R
Publisher’s Note: MDPI stays neutral with regard to jurisdictional claims in published maps and institutional affiliations.

