Article

The Ordered Weighted Average Human Development Index

by
Ernesto Leon-Castro
1,*,
Fabio Blanco-Mesa
2,
Alma Montserrat Romero-Serrano
3 and
Marlenne Velázquez-Cazares
3
1
Faculty of Economics and Administrative Sciences, Universidad Católica de la Santísima Concepción, Concepción 4070129, Chile
2
Facultad de Ciencias Económicas y Administrativas, Universidad Pedagógicay Tecnológica de Colombia, Tunja 150003, Colombia
3
Unidad Regional Culiacán, Universidad Autónoma de Occidente, Culiacán 80200, Mexico
*
Author to whom correspondence should be addressed.
Axioms 2021, 10(2), 87; https://doi.org/10.3390/axioms10020087
Submission received: 23 February 2021 / Revised: 3 April 2021 / Accepted: 30 April 2021 / Published: 7 May 2021
(This article belongs to the Special Issue Multiple-Criteria Decision Making)

Abstract

:
The main aim is to propose a new method for estimating the Human Development Index using ordered weighted average. To develop this method, ordered weighted geometric average (OWGA), induced OWGA prioritized OWA (POWA) operator are studied. Using Human Development Index formulation in combination to aggregations operators presented above is proposed the prioritized induced ordered weighted geometric average (PIOWGA) operator. A mathematical application is carried out to estimate the Human Development Index and compare it with the traditional method and other existing methods. Finally, it is noted that decision makers have an influence on the order given in the ranking by its attitude and criterion, and method can capture the subjective information prioritized by them.

1. Introduction

Human Development Index (HDI) is a social-economic indicator that shows the status of the countries in terms of progress and human development [1]. This index was proposed by Mahub ul Haq [1], and functions as a social-economic indicator that allows us to observe the status of countries in terms of progress and human development. However, before this index, economist Amartya Sen X presented a more inclusive method that defines it as development as freedom. This index takes an approach related to the inequality of capabilities, which prioritizes people as the real wealth of a nation and their capabilities for assessing its development [2]. Although the two proposals may seem distant, they have a common element of aggregating information and obtaining averages that allow for ranking of countries. As the HDI is accepted by the international community, it emphasizes that people, their capabilities and expending human choices should be the ultimate criteria for assessing the development of a country, not only economic progress (UNIDP, 2020)
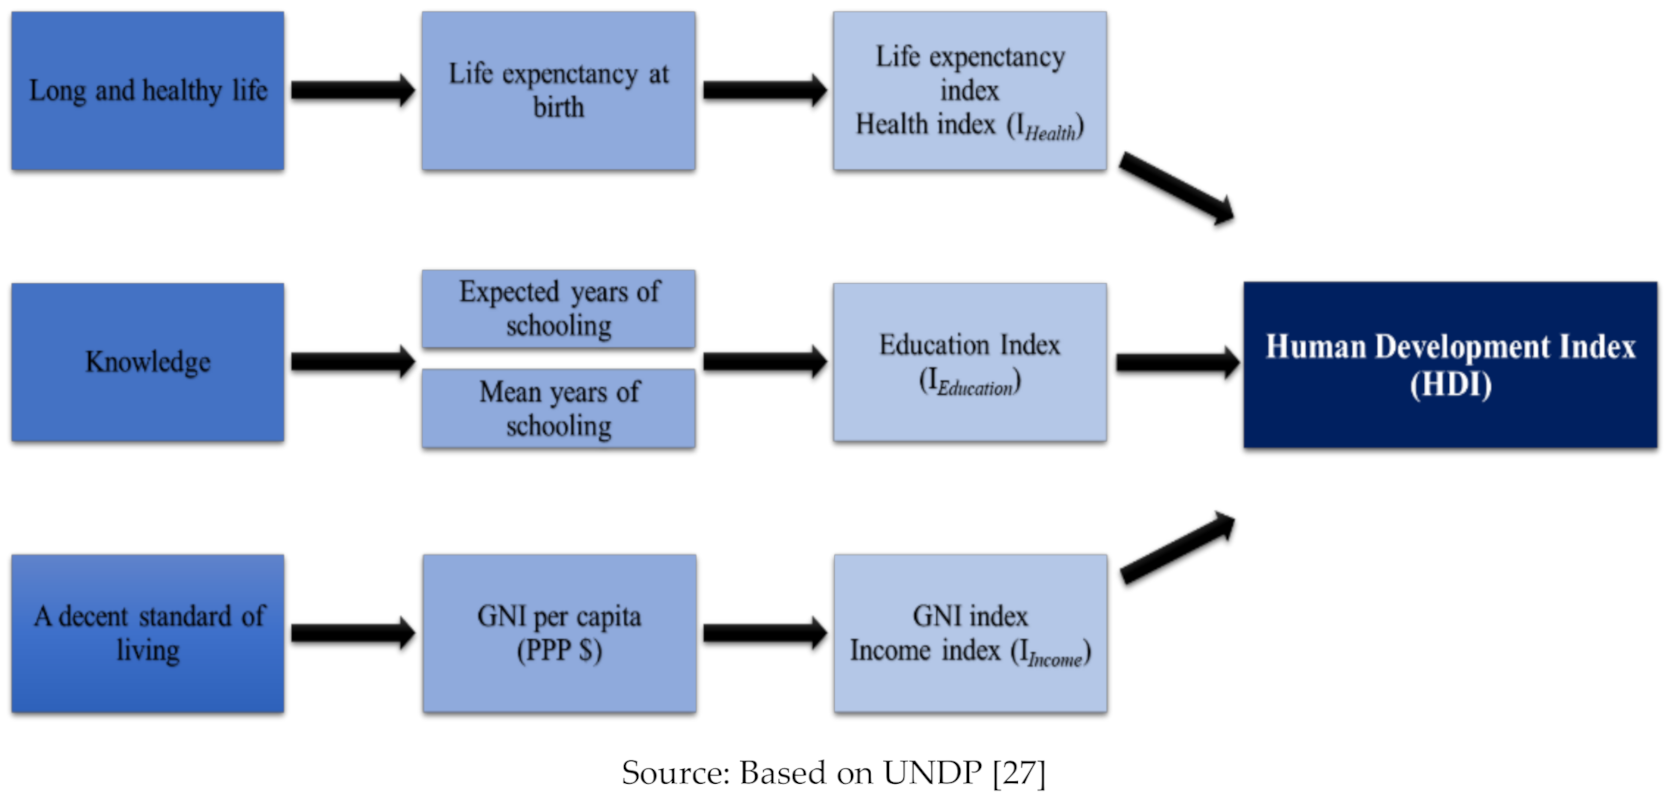
HDI is composed of three key dimensions; human development, long and healthy life, knowledge, and a decent standard of living, which consider several indicators and are measured between maximum and minimum values, and it is calculated through the geometric mean of normalized indices for each of the three key dimensions of human development. This index is apparently reliable but still needs to be improved, as inequalities and development are different from one nation to another. Thus, the index is susceptible to improvement as there are components that change over time, where dominant positions are reinforced, and new inequalities are emerging. This becomes a challenge to generate new ways of assessing the changes, inequality and inequity faced in the new context.
One of the problems that can be seen in the formulation of the HDI is in the way the index considers each key dimension. The results of each country are based on a geometric average where the relative importance of each component is the same ( 1 n ). Due to that, the analysis that has been conducted with the data is limited. Based on that, there is a possibility of generating different analyses using the same information but considering a different relative importance for each of the components, based on the realities experienced by each of the countries or the expectations of different decision makers or experts. The purpose is to be able to visualize how the ranking behaves using different data analysis, allowing us, in turn, to generate new positions in the countries and thus be able to confirm whether they have a high or low human development.
Based on the above, with the development of information science and mathematics, new ways of making closer approximations to reality have emerged. Of these advances, aggregation operators stand out, which allow information from different sources and types to be aggregated to obtain a single significant value [3]. Of all the methodologies proposed, the Ordered Weighted Average Operator (OWA) stands out [4]. This operator has the characteristic of taking into account the attitude of the decision maker (subjective information) [5]. Among its developments are the following operators: OWA Induced [6], OWA Heavy [7], OWA Prioritized [8], OWA Probabilistic [9], OWA Bonferroni [10], OWA Logarithmic [11], OWA Pythagorean [12], etc. Applications have also been developed in entrepreneurship [13], finance [14,15,16,17], management [18,19,20], as well as proposals for indices such as transparency [21,22]. In this sense, using these new methodologies can improve the index by being able to include more variables to generate a better assessment.
The main aim is to propose a new method for estimating the Human Development Index using ordered weighted average. For this purpose, we study the characteristics and properties of the following aggregation operators: ordered weighted geometric average (OWGA), and induced OWGA prioritized OWA (POWA) operator. In combination of the studied operators and the formula for determining the Human Development Index, a new method is proposed, called the prioritized induced ordered weighted geometric average (PIOWGA) operator. Using this new method, a mathematical application is made to estimate the Human Development Index and compare it with the traditional method and other existing methods. Finally, it is noted that decision makers have an influence on the order given in the ranking by its attitude and criterion, since they prioritize the three elements according to different resources, different developments and more or less stable political and economic systems throughout the subjective information prioritized by them.
This work is structured as follows: Section 2 presents in a concrete way the theoretical concepts related to the Human Development Index. Section 3 reviews the aggregation operators that will be useful to construct the proposed method. Section 4 presents the mathematical application of the HDI. Finally, the conclusions are presented in Section 5.

2. Theoretical Framework

The following are the most important aspects of the Human Development Index and the definitions of the three variables used for its calculation.

2.1. Human Development Index

For a long time, and during the last few years of the 20th century, economists and policymakers debated and questioned the so “classical” theory of economic development, where the Gross National Income (GNI) per capita as the only measure for national and social development, as it fails to capture the distribution of the benefits of economic growth [23], and key social outcomes for humans. For this matter, and since 1990, the United Countries Development Program (UNDP) uses the Human Development Index (HDI), developed and guided by the economist Mahub ul Haq [1], as a social-economic indicator that shows the status of the countries in terms of progress and human development
The economist Amartya Sen developed a new approach to human development, with inequalities and people’s capabilities [24] and presented the concept of development as freedom [2]. Sen´s work argues about the freedom and capability to make life choices as fundamental for human development. In this sense, Sen´s approach for inequality of capabilities, the Human Development Index (HDI) prioritizes people as the real wealth of a nation and their capabilities for assessing its development. In other words, human development is a “process of enlarging people´s choices” [1], and its main purpose is to ensure an enabling environment for people to enjoy long, healthy, productive, and creative lives, to be educated and to have easy access to resources for a decent standard of living. Additionally, there are some valued choices as social, economic and political freedom, protection of human rights, security, environmental sustainability, self-esteem, gender equity, among others [25,26].
HDI is a composite index that summarized and measures the average achievements in three key dimensions of human development; long and healthy life, knowledge, and a decent standard of living. In the first dimension, the health dimension is determined by life expectancy at birth. The second dimension is knowledge or education attainment and is assessed by two criteria: expected years of schooling for children of school entering age and average of years of adult schooling (25 years and more). The third dimension, the standard of living or income dimension, is estimated by GNI per capita on a natural logarithmic scale, to reflect the diminishing importance of income with increasing GNI. Thus, each dimension has its indicator as it is shown in Figure 1. The three HDI dimension indices are aggregated into a composite index as a geometric mean of normalized indices [27].
A long and healthy life is undeniably a very valuable capacity; in this sense, a high life expectancy of birth indicator represents a significant measure of human development, which leads to guaranteed physical and mental health, a healthy environment and lifestyle. Access to knowledge allows individuals´ freedom and self-sufficiency. A person without a good education these days finds it more difficult to have security, self-determination, opportunities and a productive life that human development demands. As income increases, people have access to shelter, medical care, food, education, and a higher standard of life. Improvement in HDI is correlated with economic growth and the incrementation of a healthy and educated populations, leading to a virtuous cycle [28].
The Human Development Report Office (HDRO) has been using HDI to rank countries every year since 1990, as an objective metric for human development that relies on indicators that can be compared independently from the development of the countries. Since its creation the HDI has had important adjustments in its methods and has been criticized by some authors because of its formula or calculation [29], its limitations as the absence of sustainability indicator [30,31], social and freedom dimension [28,31], and of these dimensions are the top priority for the 2030 Agenda on Sustainable Development Goals (SDGs) [30].
As mentioned before, HDI has evolved and has gradually been improved for more realistic measures [32], and the main changes in calculation technicalities were made in 2010 and 2015. For example, the index aggregation formula has changed from the arithmetic mean to the geometric mean of the three-dimension indices, and equally assigns weightings to each dimension. Furthermore, the HDI is a simple index that captures only a part of human development. Therefore, there are more Human Development Indices developed by UNDP that broader proxy on some more key aspects of human development such as inequality, gender disparity, and poverty [32]: Inequality-adjusted Human Development Index (IHDI) [33], Gender Development Index (GDI), Gender Inequality Index (GII) [34], and Multidimensional Poverty Index (IMPI) [35].
Human Development Index has become the internationally most prominent and widely used composite indicator for human development [30]. Human development creates fair opportunities, freedom and improves human welfare, allowing people to lead the kind of life they choose and value the most. For this matter, the HDI emphasizes that people, their capabilities and expending human choices should be the ultimate criteria for assessing the development of a country, not only economic progress (UNIDP, 2020). HDI is a starting point to understand how countries respond to different social, economic, and environmental challenges. This index can be used for national policy analysis, identifying countries with the same level of income per capita but with a large discrepancy in human development outcomes, stimulating political and priorities changes, benchmarking and evaluating country´s progress through time [36].
There is a notable improvement in all HDI components over time on average, which seems to highlight the idea that the world is becoming less unequal; in other words, more people have escaped poverty and disease, and have progressed to better living standards. Nevertheless, inequalities and disparities remain or even have increased within countries, hurting society, economy, and the environment, and preventing people from reaching their full potential. For this reason, the last HDI report in 2019 emphasizes that human development goes beyond income, averages and time. The key message in this report is that disparity remains widespread and extreme deprivations have decreased; new inequalities are emerging, and the old ones accumulate through life, reinforcing the demand for a revolution in measurement to assessed and responded to this inequalities and changes, and finally be able to act now (UNPD, 2019).

2.2. HDI Calculation

The current HDI is the geometric mean of normalized indices for each of the three key dimensions of human development: a long and healthy life, access to knowledge and a decent standard of living.
The normalizing parameters scale component indices (Table 1), mapping the three statistics in the unit interval (0, 1). They also debunk any part of a statistic that is above its prescribed range. It is not necessary to scale each component since it affects the classification, and it is not necessary that any subscript falls in the unit interval [32].

2.2.1. Life Expectancy at Birth

Life expectancy at birth contributes to human development without any upper limit (“having a long and healthy life”).
Progress in many factors such as lifestyle, nutrition, social equality, advancement in the medical sciences, accident prevention, etc., should, in the not too distant future, make it possible for most people in advanced countries live beyond the age that is now the highest life expectancy at birth, more than 80 years, aimed at reaching a level of 100 years and more [37].
Based on historical evidence, it is observed that no 20th century country has a life expectancy below the age of 20 years, which is why it is used as a natural zero in this indicator [38]. For the maximum value of life expectancy, 85 years of age are defined, which is a realistic goal for many economies worldwide due to constant improvements in living conditions and health [27].

2.2.2. Education: Expected Years of Schooling Mean Years of Schooling

The expected years of schooling is defined as the “number of years of schooling that a child of school entrance age can expect to receive if prevailing patterns of age specific enrolment rates persist throughout the child’s life” [27]. Education and income have no upper limits and will always contribute to “human development".
The mean years of schooling is the “average number of years of education received by people ages 25 and older, converted from education attainment levels using official durations of each level” [27].
There are societies that can subsist without formal education, and 0 years is defined as the lower limit in the item expected years of schooling (years); as the upper limit, we have 18 years, which is equivalent to the years of formal education if a graduate degree is obtained. For the item mean years of schooling (years), the lower limit is defined as 0 years and the upper limit is 15 years, which is the average number of years that formal education is received in most countries [27].

2.2.3. Gross National Income

To justify the upper limit on the income variable, Anand and Sen [37] states “that there is virtually no gain in human development” beyond USD 75,000. Kahneman and Deaton [39] studied two aspects of well-being: emotional well-being and life evaluation. They conclude that high income buys life satisfaction but not happiness, and that low income is associated both with low life evaluation and with low emotional well-being. The low minimum value for gross national income (GNI) per capita, USD 100, is justified by the considerable amount of unmeasured subsistence and nonmarket production in economies close to the minimum, which is not captured in the official data.
Once we have defined the minimum and maximum values, the dimension indices are calculated as:
D i m e n s i o n   i n d e x = a c t u a l   v a l u e m i n i m u m   v a l u e m a x i m u m   v a l u e m i n i m u m   v a l u e

3. Methodology

3.1. Basic Formulations

This section explains the different formulations that will be used in the paper. The first one to be explained will be the actual formula that use UNPD (2019) to calculate the final score for each country that is based on a geometric mean. The definition is as follows:
Definition 1. The HDI is the geometric mean of three-dimensional indices as follows.
HDI = I Health · I Education · I Income 1 3
where HDI is Human Development Index, I Health is health index, I Education is education index and I Income is income index. It is important to note that the formulation can be change its representation to include a weight associated to each value as follows.
HDI = I Health 1 3 · I Education 1 3 · I Income 1 3 .
The actual formulation of HDI index will be expanded using the OWA operator (Yager, 1988). The main idea is to include the knowledge and expectations of the decision maker in the results through the weighting vector and by adding a reordering step generate the minimum and the maximum scenario [40,41]. As the formulation is based geometric means, the extension of the OWA operator that will be used is the ordered weighted geometric average (OWGA) operator [42]. The definition is as follows
Definition 2. A OWGA operator of dimension n is a mapping R + n R + that has associated with it a weighting vector w = w 1 , , w n T , with w i 0 , 1 and i = 1 n w i = 1 , such that.
OWGA α 1 , , α n = j = 1 n b j w j ,
where b j is the jth largest of the α i   i = 1 , 2 , , n .
Another extension that will be used is the induced OWGA (IOWGA) operator [43]. The main idea of this operator is that the reordering step will be done based on induced variables determined by the decision maker, by doing this, is possible to add some weights to certain attributes instead of only taking into account the value of the attribute. The formulation is as follows.
Definition 3. An induced OWGA (IOWGA) operator is defined as.
IOWGA u 1 , α 1 , , u n , α n = j = 1 n b j w j ,
where w = w 1 , , w n T is the associated exponential weighting vector such that w j 0 , 1 , j = 1 n w j = 1 , and b j is a value of u i , a i having the jth largest u value. The term u i is referred as the ordered inducing variable and a i is referred as the argument variable.
An extension that will be also included in the paper is the prioritized OWA (POWA) operator. This operator is important in group decision making when not all the decision makers have the same importance in the decision. Usually, this operator is important when different experts are questioned about the situations and each of them give different values and to everyone to be included in the results each one of them are given a weight based on their experience and importance in the decision [44,45]. The formulation is as follows.
Definition 4. Assume that we have a collection of criteria portioned into q distinct groups, H 1 , H 2 , , H q for which H i = C i 1 , C i 2 , , C in   denotes the criteria of the ith category (i = 1,…,q) and n i is the number of criteria in the class. Furthermore, we have a prioritization between the groups as H 1 > H 2 > > H q . That is, the criteria in the category H i have a higher priority than those in H k for all i < k and i , k 1 , , q . Denote the total set of criteria as C = U i = 1 q H i and the total number of criteria as n = i = 1 q n i . Additionally, suppose X = x 1 , , x m indicates the set of alternatives. For a given alternative x, let C ij x measure the satisfaction of the jth criteria in the ith group by alternative   x X , for each i = 1 , , q ,   j = 1 , , i i . The formula is as follows:
POWA C x = i = 1 q j = 1 n i w ij C ij x ,
where w ij , is the corresponding weight of the jth criteria in the ith category, i = 1 , , q ,   j = 1 , , i i . If w i = 1 / n for all i, the PrOWA becomes the prioritized average (PrA).

3.2. Prioritized Induced Ordered Weighted Geometric Average

The paper introduces a new extension of the OWGA operator that includes in the same formulation the idea of a reordering step based on induced value of the IOWGA operator and includes the contribution of the POWA operator for group decision making where not all the decision makers have the same importance in the result. This new operator is called the prioritized induced ordered weighted geometric average (PIOWGA) operator. The formulation is as follows.
Definition 5. Assume that we have a collection of criteria portioned into q distinct groups, H 1 , H 2 , , H q for which H i = C i 1 , C i 2 , , C in denotes the criteria of the ith category (i = 1,…,q) and n i is the number of criteria in the class. Furthermore, we have a prioritization between the groups as H 1 > H 2 > > H q . That is, the criteria in the category H i have a higher priority than those in H k for all i < k and i , k 1 , , q . Denote the total set of criteria as C = U i = 1 q H i and the total number of criteria as n = i = 1 q n i . Additionally, suppose X = x 1 , , x m indicates the set of alternatives. For a given alternative x, let C ij x measure the satisfaction of the jth criteria in the ith group by alternative   x X , for each i = 1 , , q ,   j = 1 , , i i . The formula is as follows:
PIOWGA C x = i = 1 q j = 1 n i b j w j C ij x ,
where w = w 1 , , w n T is the associated exponential weighting vector such that w j 0 , 1 , j = 1 n w j = 1 , and b j is the a value of u i , a i having the jth largest u value. The term u i is referred as the ordered inducing variable and a i is referred as the argument variable.
Additionally, note that if the induced values are u i = 1 / n the PIOWGA operator becomes the POWGA operator and its formulation is the following.
Definition 6. Assume that we have a collection of criteria portioned into q distinct groups, H 1 , H 2 , , H q for which H i = C i 1 , C i 2 , , C in denotes the criteria of the ith category (i=1,…,q) and n i is the number of criteria in the class. Furthermore, we have a prioritization between the groups as H 1 > H 2 > > H q . That is, the criteria in the category H i have a higher priority than those in H k for all i < k and i , k 1 , , q . Denote the total set of criteria as C = U i = 1 q H i and the total number of criteria as n = i = 1 q n i . Additionally, suppose X = x 1 , , x m indicates the set of alternatives. For a given alternative x, let C ij x measure the satisfaction of the jth criteria in the ith group by alternative   x X , for each i = 1 , , q ,   j = 1 , , i i . The formula is as follows:
POWGA C x = i = 1 q j = 1 n i b j w j C ij x ,
where b j is the jth largest of the α i   i = 1 , 2 , , n .
The PIOWGA operator is monotonic, bounded, and idempotent (Blanco-Mesa et al., 2019; 2020).
Theorem 1 (Monotonicity). Assume f is the PIOWGA operator; if ai ≥ ei, for all ai, then
f (〈u1,a1〉,…,〈un,an〉) ≥ f (〈u1,e1〉,…,〈un,en〉),
Theorem 2 (Boundedness). Assume f is the PIOWGA operator; then,
min(ai) ≤ f (〈u1, a1〉,…,〈un, an〉) ≤ max(ai),
Theorem 3 (Idempotency). Assume f is the PIOWGA operator; if ai = a, for all ai, then
f (〈u1, a1〉,…,〈un, an〉) = a,

3.3. Numerical Example

As the paper will use the PIOWGA operator in calculating the HDI value for 189 countries in the world, the numerical example will serve as an example of how the calculus are done and how it is different from the traditional formulation. The country that will be used to make the example will be Norway (see Table 2). The data for this country is the following.
The formula to calculate I H e a l t h ,   I E d u c a t i o n   and I I n c o m e we used the information provided by [27] and explained in Section 2 of the paper. Note that in calculating the HDI value, expected years of schooling is capped at 18 years and GNI per capita is capped at USD 75,000.
The results are the following.
I H e a l t h = 82.3 20 85 20 = 0.9580
I E d u c a t i o n = 18 0 18 0 + 12.60 0 15 0 = 0.9189
I I n c o m e = ln ( 68059 ln 100 ln 75000 ln 100 = 0.9853
With the use of the traditional formulation (Definition 1) the result is H D I = 0.9580 1 3 · 0.9189 1 3 · 0.9580 1 3 = 0.9537 .
For the use of the PIOWGA operator and other operators the information provided by one expert will be used. In this case, the weights that the expert provided are W = 0.40 , 0.30 , 0.030 , the induced values are U = 5 , 10 , 15 and for the prioritized operators the results of the traditional formulation and the expert will be unified by traditional = 40% and expert = 60%. With this information, the results are the following:
O W G A = 0.9853 0.40 · 0.9580 0.30 · 0.9189 0.30 = 0.9572
I O W G A = 0.9580 0.40 · 0.9853 0.30 · 0.9189 0.30 = 0.9541
P O W G A = 0.9537 · 0.40 + 0.9572 · 0.60 = 0.9558
I P O W G A = 0.9537 · 0.40 + 0.9541 · 0.60 = 0.9539
As can be seen with the different results, the importance of each index can drastically change the result of the HDI. A further analysis of the results and the importance of the use of aggregation operators instead of traditional ones will be discussed at the end of results section.

4. The Human Development Index by Using PIOWGA Operator

Having presented the arguments on the Human Development Index and using the aggregation operators for the development of the new methodological proposal for its calculation called prioritized induced ordered weighted geometric average, we proceed to apply it to the calculation of the HDI. To carry out the application of the new HDI estimation method, a 4-step process is established, which is explained below:
Step 1. Initially taken into account is the information of I H e a l t h ,   I E d u c a t i o n   and I I n c o m e , which is obtained by UNDP [46], then the experts must be selected. In this step, the experts will be determined based on their experience in the topic. It is recommended that they have worked in different governmental organizations that work in the different fields that the HDI considers, that is, health, education, and income, and that also have experience in public policy making. These two aspects are very important because in that way they will know at first-hand how the different elements of how HDI works and how public policies are enacted to improve in that field.
Step 2. In this step, the weighting vector, induced and prioritized values are established. For the weighting vector, for expert 1 W = 0.40 ,   0.30 ,   0.20 , expert 2 W = 0.25 ,   0.25 ,   0.50 and expert 3 W = 0.30 ,   0.40 ,   0.30 . In the case of the induced values, for expert 1 U = 5 , 10 , 15 , expert 2 U = 10 , 15 , 5 and expert 3 U = 10 , 5 , 15 . Finally, the prioritized importance of each experts is e 1 = 0.30 ,   e 2 = 0.50   and   e 3 = 0.20 . These last values are determined based on the expertise and research time in the field.
Step 3. The calculations are done for each country following the same process explained in Section 3.3. All the results for the OWGA, IOWGA, POWGA and PIOWGA operator are found in Appendix A.
Step 4. All results are obtained. To present the results, three different tables were produced, organized into the Top 10 countries (evaluation from position 1 to 10, see Table 3), Middle 10 countries (evaluation from position 91 to 100, see Table 4) and Worst 10 (evaluation from position 180 to 189, see Table 5). As can be seen, with the analysis made from Top 10, Middle 10, and Worst 10 is possible to visualize how much the ranking can change depending in the weights assigned to each dimension of the HDI calculation.
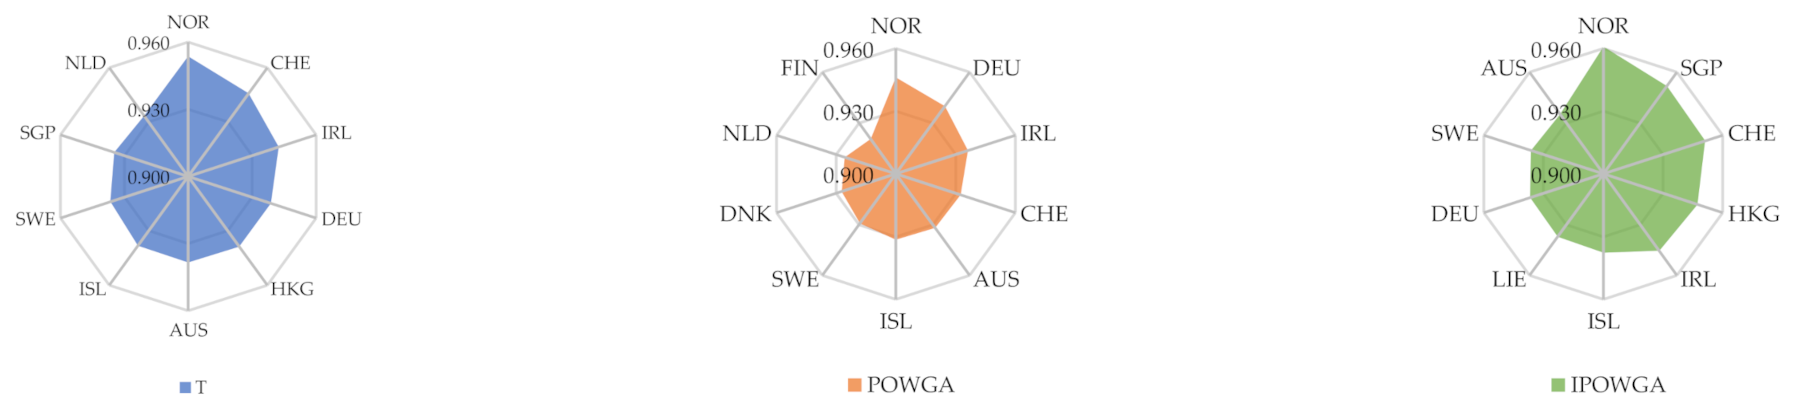
The first analysis is performed based on Top 10 countries. With this information, it is possible to detect that Norway is the country with the highest score even when different aggregation operators were used. After that, Switzerland and Singapore are usually between number 2 and 3 in many of the operators. An interesting case can be Germany because in the traditional formulation, its position is number 5 and within the I O W G A e 3 it is number 2. Additionally, Liechtenstein is not considered in the traditional Top 10 but can be in the ranking according to the O W G A e 2 , O W G A e 3 , I O W G A e 2   or P O W G A operators. Hence, it is possible to visualize that even when the weights of the dimension are changed, Norway is always number 1, but after that, some important changes in the ranking can be seen.
In the Middle 10 countries, it is possible to find some notorious changes, for example, Fiji is presented in the traditional and IPOWGA operator only. Botswana presents important changes, being in position 95 in the traditional score and number 91 in the POWGA operator. Another example can be Jamaica, which is just presented in 4 of the 9 operators that are being compared. The ranking with more changes is Middle 10. This is because the ranking in that section is sensitive to changes, and because of that, if a dimension has more weight than another one, the results can change drastically. Additionally, we observe the ultimate idea that the aggregation operators, such as the IPOWGA operator, can help to generate new scenarios.
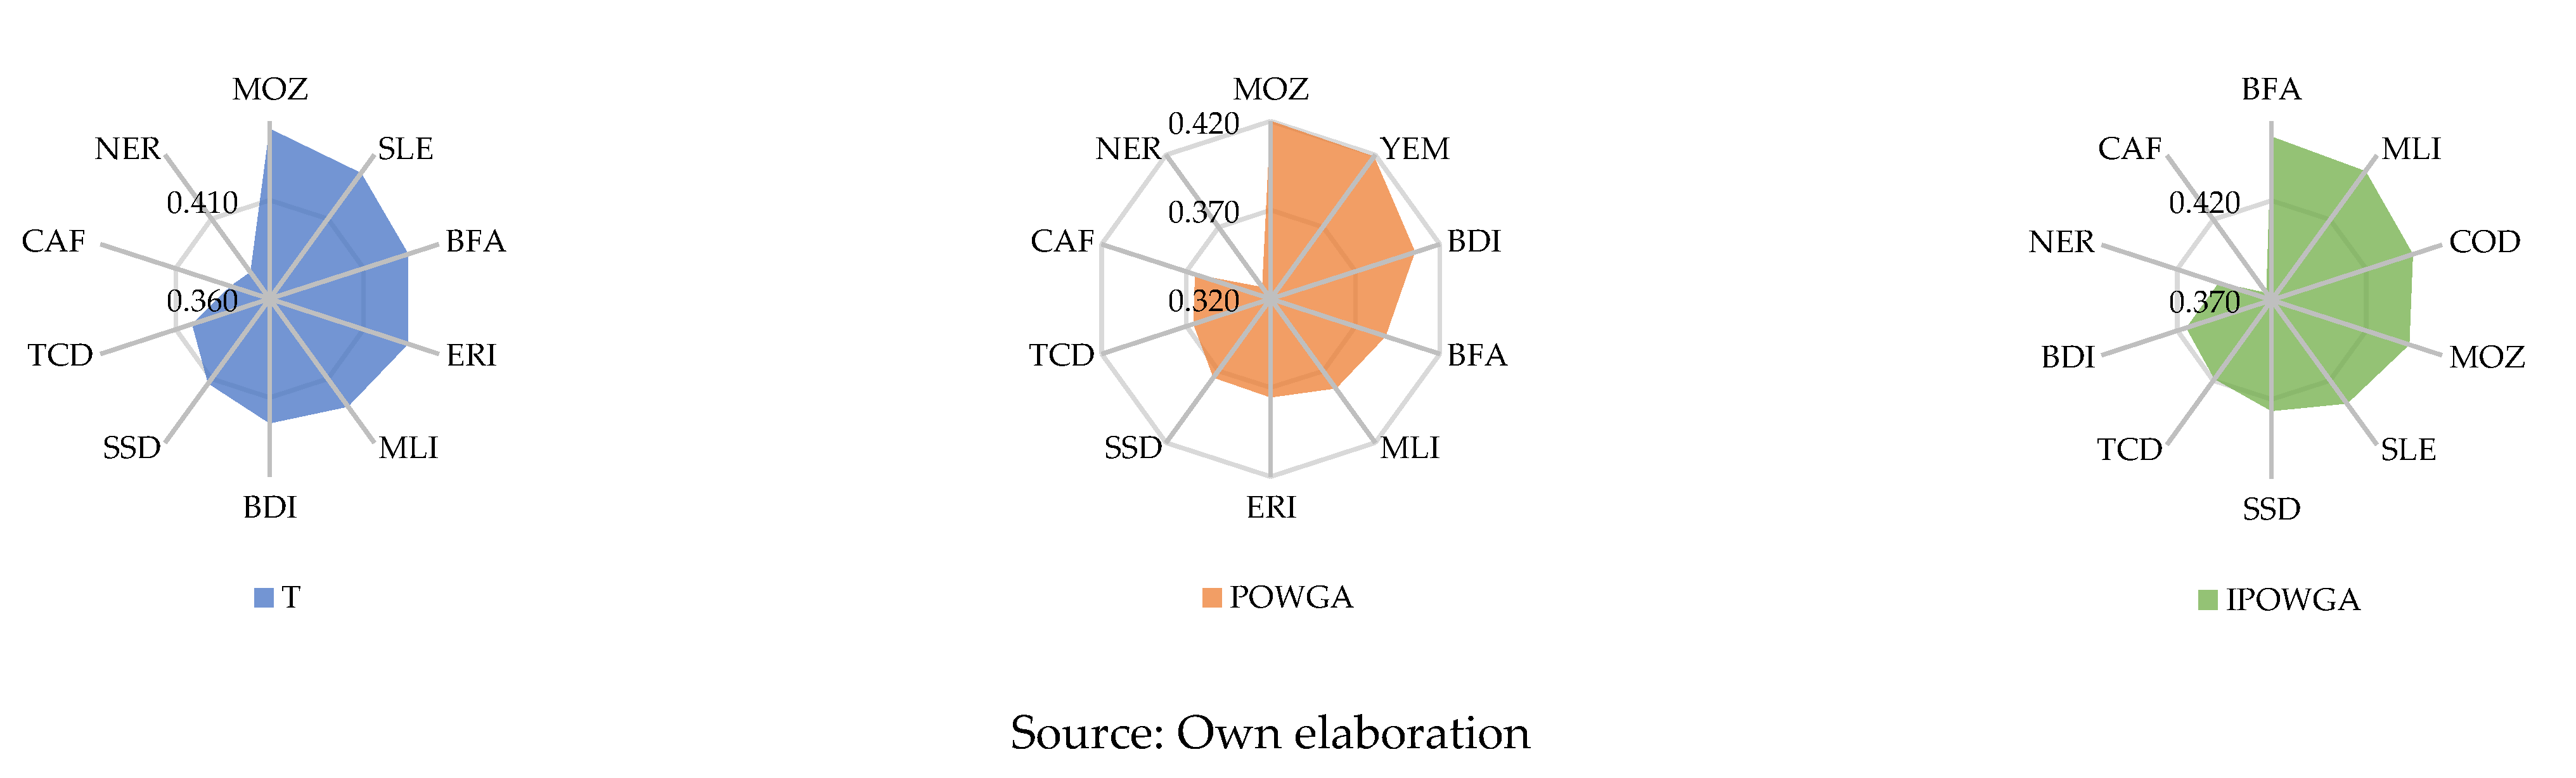
Finally, the Worst 10 countries is the ranking that present fewer changes. In the case of position 188–189, there is always Niger or Central Africa; Chad goes from rank 187–186, South Sudan from 186–185 and in some cases, for example, Congo can be in or out of the ranking. The Worst 10 presented the least changes in comparison to another two rankings because even when the weights to each dimension are changed, they are usually the lowest score in all of them. In this sense, it is a must that the politics that are assigned to these countries and the help that they receive from other ones improve, in a general way, the three dimensions.
The following figures show a graphical comparison of the results obtained from the traditional ranking (T) and the rankings generated by the proposed POWGA and IPOWGA operators (see Figure 2, Figure 3 and Figure 4). Initially, the radials for all methods show a spiral shape and their desiccant sequence is clockwise. Secondly, it is observed that the results for the proposed operators have two main changes; the order of the ranking where they change position and enter and leave countries according to their results; the distance of the results as their distances are wider and the spirals are steeper. The results for the POWGA and IPOWGA operators show that the countries within the ranking vary according to the traditional one. The shape of the graph is easier to see these changes, as it differs at different points, showing lower results in a more concave manner and higher results in a more convex manner, while the traditional graph has straighter aspects. Likewise, the lowest scores are even more pronounced in the 10 worst-ranked countries. These changes are due to the amount of information that is aggregated. Here, in the proposed methods, the shape of the radial marks a more pronounced spiral, which indicates that the distances between each of the countries’ results. Hence, the influence that the different criteria of those evaluated can have on the levels of development of the countries is evident.
These results lead us to address aspects related to the notion of average. The mean is most commonly understood as the average value of a set of numerical data, which is calculated by dividing the sum of the set of values by the amount of data. For the topic under discussion, the geometric mean is used, which is the calculation of the n-th root of a joint product, and its characteristic is to have positive numbers. For our proposal, we take into account the ordered weighted average (OWA) as an operator that provides a parameterized family of aggregation operators between maximum and minimum values, allowing us to over or underestimate the information according to the attitude of the decision maker in the studied problem [4,5,47]. This operator has the versatility to allow aggregation of those degrees of truth or optimism in a formal method, i.e., it has the ability to model in a linguistic way through instructions that aggregate subjective information to obtain a single representative value [4].
In this sense, averaging and geometric averaging allow you to efficiently measure the data you aggregate in your operation, although it is quite complicated to give meaning to a broad mass valuation to a mere numerical value. With the OWA operator being able to follow subjective instructions for the aggregation of arguments, it has a greater versatility in responding to situations in the environment that link individual’s reasoning and situations that deserve to be explained in terms of their meaning [48]. Likewise, it allows us to propose wider extensions that help to take into account data that is not possible with traditional methods. Comparing the three methods, it is evident that the OWA operator has more advantages by being able to add in its formulation soft aspects (approximate reasoning and degrees of truth) that have an influence on the final result. Thus, the two proposed methods contain the characteristics of the mean, geometric mean and OWA operator and additionally, the characteristics of the induced and prioritized variables. The latter two aspects are closely related to the judgement and subjectivity of the individuals. Finally, the figures presented show those nuances, some more prominent than others, but which can help to give meaning to the information by the origin of the data, i.e., one can always turn to the expert or individual who provided the initial judgement (soft information).
Based on the above, the main idea of the HDI is to generate a vision to each country and that in results can improve and generate new politics, but not all the countries have the same amount of resources to make changes in all three dimensions at the same time and, because of that, a ranking based on dimensions that have different weights will make them visualize if the politics that are being implemented are changing their position in the ranking and, also, not all the countries have the same problems and, because of that, the prioritization of one dimension above another is something that has to be taken into account.
It is important to note that this type of operator has some limitations. First, the weighting vector is proposed by the experts or decision makers and, because it is an essential element for the calculation, if different weights are proposed, the results can vary. Additionally, this flexibility has a positive effect because the results can change depending on the attitude and expectations of the decision maker. Second, these operators are useful when the relative importance of each of the variables that compose the HDI is not the same, if the expert considers that each variable should weight 1 n there is no reason to use the different aggregation operators. Finally, with the use of these operators, different results can be obtained and, because of that, it is not possible to assume that only one result is correct, because each result is based on the weighting vector proposed, and if there is not a consensus, it is possible to obtain as many different results as there are decision makers, making it difficult to achieve only one result; however, the idea of this type of operator is that they produce different scenarios based on the aptitude, expectations and knowledge of the decision makers that can be considered in the decision making process, and, with that, there is a better understating and general vision of the phenomenon to study.
Another limitation of the paper is that the study is based on the OWA operator and its extensions, but there are many other operators whose formulation is interesting and can be useful in this type of analysis of information. Such is the case of the Hami means that are used to aggregate values, simultaneously including mutual correlation among multiple arguments [49,50], Bonferroni means that are an averaging aggregation function that allows capturing the interrelationship between arguments [51,52], the use of different Dombi operators [53,54,55], among others.

5. Conclusions

This paper has reviewed the main aspects of the Human Development Index and its components. By revising the general formula for determining the HDI, a new method is proposed using the aggregation operators [3]. The proposed method is called the prioritized induced ordered weighted geometric average (PIOWGA) operator. The main idea of this operator is that the reordering step will be performed based on induced variables determined by the decision maker, and allows for considering different values and to everyone to be included in the results. Each one of them are given a weight based on their experience and importance in the decision [44,45]. Thus, by having induced variables and decision-prioritizing aspects in a group of experts, it is possible to consider both the information derived from the data and the opinions of the decision makers in group decisions.
The mathematical application developed follows a 4-stage process that considers objective input information on education, health and standard of living and subjective information that allows different scenarios to be considered to observe the usefulness and applicability of the methodological proposal. In this sense, three different levels, Top 10, Middle 10 and Worst 10 are shown. For the Top 10, comparing the traditional method with IPOWGA, there are significant variations in general, and the ten countries only move a little in the ranking from position 5 to position 10. For Middle 10, changes are evident, such as Fiji being present in the traditional and IPOWGA operator only. Botswana presents important changes, being in position 95 in the traditional score and position 91 in the POWGA operator. Ranking in this section is sensitive to changes, because it is a dimension that has more weight than another one; therefore, the results can change drastically. For Worst 10, the rankings show no major alterations, only a change of positions in the country of Niger, Central Africa, Chad, and South Sudan. This smaller variation is because when the weight to each dimension is changed, they are usually the lowest score in all of them. In addition, looking at the results graphically, it can be seen that the proposed new method leads to changes in the rankings, the order of countries and the exit and entry of countries in the three boundaries presented. These changes are due to the amount of information that is aggregated. Hence, the influence that the different criteria of those evaluated can have on the levels of development of the countries is evident. Thus, with these results, it can be assumed that the valuation given by the different decision makers has an influence on the order given in the ranking, either by extreme positions of pessimism or optimism. This can occur because of how decision makers prioritize the three elements that make up the HDI, given that each country has different resources, different developments, and more or less stable political and economic systems. Hence, the proposed method brings us closer to the reality that each country has in terms of human development because of the importance given to the subjective information prioritized by decision makers.
Additionally, it is important to visualize the different applications that the IPOGWA operator can has, because any problem that is analyzed by the geometric average (GA) and where the relative importance of each variable that compose the GA is considered by the decision maker that should not be the same these operators can be done. For example, The OGWA operator can be used when only one decision maker is considered, and the weights are ordered based on maximum or minimums; the IOGWA operator is useful when the ordering between weights and attributes want to be induced by specific values and the POWGA operator can be used when more than one decision maker is considered and their importance in the results is not the same. Additionally, the IPOWGA operator is used when the complexity of the problem requires it, that is, in a group decision making problem where the problem is analyzed by a geometric average where the variables that compose it do not have the same relative importance and the reordering of the weights is based on induced values. Thus, the two proposed methods contain the characteristics of the mean, geometric mean and OWA operator and additionally, the characteristics of the induced and prioritized variables. The latter two aspects are closely related to the judgement and subjectivity of the individuals. Finally, the figures presented show those nuances, some more prominent than others, but which can help to give meaning to the information by the origin of the data, i.e., one can always turn to the expert or individual who provided the initial judgement (soft information).
Finally, the research provides a different vision of how to approach the evaluation of the different indices that measure and provide reliable information for decision making at the governmental level in each country. In addition, it shows the usefulness of aggregation operators to consider different types of information. For future lines of research, new proposals can be made with indices such as the happiness, GINI, or competitiveness indices. Likewise, in the development of methodological proposals, these tools can be improved by complementing them with Bonferroni means [56], multi-person aggregation [57], soft multi-set [58], among others.

Author Contributions

Conceptualization, E.L.-C.; methodology, F.B.-M.; formal analysis, M.V.-C.; writing—original draft preparation, A.M.R.-S. All authors have read and agreed to the published version of the manuscript.

Funding

This research was funded by Universidad Pedagogica y Tecnologica de Colombia, grant number SGI 3134 and Chilean Government through FONDECYT initiation, grant number 11190056.

Institutional Review Board Statement

The study was conducted according to the guidelines of the Universidad Católica de Santísima Concepción.

Informed Consent Statement

All subjects gave their informed consent for inclusion before they participated in the study. The study was conducted in accordance with the Declaration of Helsinki.

Acknowledgments

Author Leon-Castro acknowledges support from the Chilean Government through FONDECYT initiation grant No. 11190056.

Conflicts of Interest

Declare conflicts of interest or state “The authors declare no conflict of interest.”

Appendix A

Table A1. Results of the HDI index using different aggregation operators.
RTraditionalOWGAe1OWGAe2OWGAe3IOWGAe1IOWGAe2IOWGAe3POWGAPIOWGA
1Norway0.95370.95720.96190.96380.95410.96150.94620.9609
2Switzerland0.94590.94840.95120.95530.94920.95060.93260.9512
3Ireland0.94250.94390.94570.94760.94380.94560.93620.9455
4Germany0.93880.93790.93640.93620.93900.93640.94000.9368
4Hong Kong, China (SAR)0.93880.94330.94720.95400.94430.94570.91710.9474
6Australia0.93840.93680.93400.93650.94180.93370.93180.9353
6Iceland0.93850.93800.93680.93930.94130.93670.93150.9377
8Sweden0.93660.93640.93580.93820.93930.93560.92940.9364
9Singapore0.93480.94390.95330.96020.93890.95070.91040.9519
10The Netherlands0.93350.93420.93500.93750.93570.93480.92580.9353
11Denmark0.92990.93050.93130.93210.93050.93130.92730.9312
12Finland0.92520.92400.92190.92370.92760.92180.92070.9229
13Canada0.92210.92210.92140.92480.92570.92110.91220.9223
14New Zealand0.92090.91770.91230.91400.92430.91190.91780.9143
15United Kingdom0.92040.91880.91620.91750.92250.91600.91740.9172
16United States0.91990.92390.92930.92960.91850.92890.91720.9277
17Belgium0.91880.91910.91900.92170.92150.91880.91090.9196
18Liechtenstein0.91670.92760.93960.94480.91820.93690.89670.9371
19Japan0.91470.91570.91440.92150.92210.91300.89410.9162
20Austria0.91380.91560.91750.92120.91690.91710.90200.9177
21Luxembourg0.90870.91900.92910.93680.91330.92600.88180.9276
22Israel0.90620.90440.90010.90460.91210.89930.89440.9023
22Korea (Republic of)0.90580.90540.90320.90850.91180.90240.89100.9050
24Slovenia0.90160.89910.89450.89700.90550.89410.89600.8964
25Spain0.89280.89400.89250.90010.90080.89080.87080.8944
26Czechia0.89080.88880.88550.88650.89280.88540.88900.8867
26France0.89110.89470.89670.90430.89790.89500.86770.8976
28Malta0.88530.88680.88640.89350.89240.88490.86440.8879
29Italy0.88260.88610.88670.89580.89140.88440.85530.8884
30Estonia0.88150.87990.87710.87820.88350.87700.87940.8782
31Cyprus0.87300.87460.87490.88120.87900.87380.85430.8761
32Greece0.87200.86980.86370.86980.87990.86220.85620.8667
32Poland0.87180.86970.86630.86800.87460.86610.86780.8677
34Lithuania0.86930.86850.86720.86550.86810.86710.87470.8673
35United Arab Emirates0.86640.88320.89980.90700.86870.89420.83830.8962
36Andorra0.85680.87140.88190.89410.86570.87560.81620.8812
36Saudi Arabia0.85700.86670.87840.88100.85590.87620.84510.8754
36Slovakia0.85690.85800.85920.86210.85940.85890.84760.8594
39Latvia0.85390.85280.85090.84980.85340.85080.85790.8513
40Portugal0.85020.85350.85310.86270.85980.85040.82180.8551
41Qatar0.84840.87550.89630.90950.85580.88400.80010.8927
42Chile0.84690.84520.84010.84590.85430.83870.83160.8428
43Brunei Darussalam0.84460.86800.89000.89770.84580.88100.81290.8850
43Hungary0.84470.84520.84540.84820.84740.84510.83620.8459
45Bahrain0.83780.84770.85750.86460.84180.85450.81270.8560
46Croatia0.83730.83680.83430.83940.84320.83340.82310.8360
47Oman0.83380.84290.85130.85910.83890.84830.80730.8503
48Argentina0.83010.82590.81850.81980.83400.81760.82860.8210
49Russian Federation0.82400.82520.82670.82540.82220.82660.82750.8260
50Belarus0.81710.81350.80720.80740.81930.80660.81870.8091
50Kazakhstan0.81720.81710.81690.81700.81740.81690.81700.8170
52Bulgaria0.81570.81410.81140.81340.81860.81120.81070.8126
52Montenegro0.81590.81330.80780.81160.82150.80690.80660.8102
52Romania0.81560.81770.81930.82420.81990.81850.80030.8198
55Palau0.81420.81070.80440.80350.81540.80380.81920.8061
56Barbados0.81330.81090.80340.81020.82240.80120.79620.8070
57Kuwait0.80840.83990.86530.87670.81260.85080.76370.8600
57Uruguay0.80780.80850.80640.81360.81550.80480.78720.8085
59Turkey0.80650.81220.81570.82430.81390.81320.77950.8164
60Bahamas0.80550.81160.81850.82290.80760.81720.79000.8173
61Malaysia0.80420.81110.81700.82450.80970.81470.77960.8167
62Seychelles0.80140.80550.81030.81370.80330.80950.78930.8095
63Serbia0.79930.79620.79000.79390.80510.78900.79020.7927
63Trinidad and Tobago0.79900.80620.81410.81880.80120.81240.78200.8127
65Iran (Islamic Republic of)0.79750.79780.79580.80210.80440.79460.77950.7977
66Mauritius0.79640.80010.80340.80910.80100.80210.77820.8035
67Panama0.79510.79970.80040.81040.80470.79720.76500.8022
68Costa Rica0.79350.79410.78750.79790.80570.78360.76560.7916
69Albania0.79140.78800.77780.78490.80160.77480.77470.7823
70Georgia0.78640.77970.76460.76310.79010.76080.79600.7688
71Sri Lanka0.78010.77640.76670.77260.78900.76420.76650.7708
72Cuba0.77770.77160.75270.75840.78950.74600.76870.7595
73Saint Kitts and Nevis0.77680.78800.79740.80630.78290.79320.74640.7963
74Antigua and Barbuda0.77620.78540.79050.80150.78550.78600.74120.7912
75Bosnia and Herzegovina0.76920.76880.76260.77130.77970.75960.74590.7662
76Mexico0.76740.77150.77310.78120.77500.77090.74270.7742
77Thailand0.76460.76930.76910.77960.77510.76540.73350.7712
78Grenada0.76340.76080.75590.75850.76750.75530.75750.7579
79Brazil0.76120.76250.76000.76840.77020.75760.73740.7624
79Colombia0.76090.76210.75740.76720.77190.75410.73400.7608
81Armenia0.76000.75500.74320.74750.76810.74030.75180.7476
82Algeria0.75900.76120.75810.76790.76960.75480.73120.7610
82North Macedonia0.75940.75950.75520.76330.76860.75290.73750.7581
82Peru0.75910.75930.75390.76280.76950.75100.73510.7573
85China0.75760.76360.76430.77550.76840.76010.72420.7663
85Ecuador0.75790.75550.74590.75380.76880.74240.73830.7503
87Azerbaijan0.75390.75580.75640.76240.75960.75520.73580.7574
88Ukraine0.74970.74350.72990.73000.75460.72670.75410.7340
89Dominican Republic0.74460.74900.75040.75900.75270.74790.71850.7517
89Saint Lucia0.74490.74610.74130.75100.75590.73790.71840.7447
91Tunisia0.73920.74060.73470.74530.75130.73060.71070.7386
92Mongolia0.73470.73230.72810.72960.73760.72770.73160.7296
93Lebanon0.73010.73750.73330.74840.74600.72550.68780.7376
94Botswana0.72780.73300.73850.74330.73080.73720.71160.7378
94Saint Vincent and the Grenadines0.72790.72920.72760.73470.73540.72590.70740.7295
96Jamaica0.72570.72270.71230.71960.73610.70880.70860.7169
96Venezuela (Bolivarian Republic of)0.72580.72300.71600.72110.73310.71430.71340.7191
98Dominica0.72380.72780.72050.73420.73920.71360.68710.7254
98Fiji0.72370.72020.71380.71200.72420.71290.73100.7153
98Paraguay0.72430.72790.72650.73650.73450.72320.69560.7289
98Suriname0.72370.72540.72490.73150.73040.72340.70430.7263
102Jordan0.72340.72140.71230.72020.73410.70890.70380.7166
103Belize0.72020.71670.70470.71210.73120.70050.70350.7098
104Maldives0.71870.73170.73140.74830.73520.72150.66930.7349
105Tonga0.71740.71090.69460.69510.72360.68970.72160.6996
106Philippines0.71190.71120.70740.71340.71900.70600.69560.7097
107Moldova (Republic of)0.71150.70680.69530.69980.71960.69240.70270.6997
108Turkmenistan0.71010.71860.72720.73280.71300.72470.69020.7258
108Uzbekistan0.71050.70530.69270.69640.71840.68940.70410.6972
110Libya0.70760.71320.71420.72440.71730.71040.67700.7159
111Indonesia0.70690.71050.71100.71940.71500.70850.68180.7126
111Samoa0.70680.70200.68760.69340.71720.68280.69530.6931
113South Africa0.70490.70680.70900.70670.70190.70870.71120.7078
114Bolivia (Plurinational State of)0.70280.69880.68880.69370.71100.68620.69220.6928
115Gabon0.70160.70970.71890.72260.70250.71690.68700.7169
116Egypt0.69970.70420.70460.71410.70890.70140.67160.7064
117Marshall Islands0.69760.69250.67360.67970.70970.66600.68750.6805
118Viet Nam0.69270.69260.68120.69240.70710.67480.66490.6869
119Palestine, State of0.69000.68690.67240.68090.70280.66640.67150.6784
120Iraq0.68880.70310.71270.72380.69710.70610.65150.7121
121Morocco0.67640.68530.67970.69580.69360.67020.63230.6846
122Kyrgyzstan0.67420.66860.64530.64810.68490.63450.67500.6528
123Guyana0.67030.67180.66890.67720.67930.66630.64710.6714
124El Salvador0.66670.67130.66620.67880.68040.66020.63220.6703
125Tajikistan0.65600.65110.63200.63750.66770.62380.64780.6388
126Cabo Verde0.65070.65730.65290.66660.66530.64570.61260.6570
126Guatemala0.65100.66260.66040.67650.66720.65070.60520.6643
126Nicaragua0.65110.65400.64240.65580.66750.63380.61750.6485
129India0.64690.65070.64860.65870.65740.64470.61800.6513
130Namibia0.64500.65120.65780.66200.64720.65620.62980.6566
131Timor-Leste0.62590.63710.63970.65280.63800.63250.58600.6416
132Honduras0.62300.63200.62110.63830.64250.60840.57890.6278
132Kiribati0.62320.62080.60970.61720.63410.60520.60600.6145
134Bhutan0.61730.63920.64480.66230.63290.63080.56310.6466
135Bangladesh0.61370.61920.60920.62380.63060.59960.57630.6151
135Micronesia (Federated States of)0.61420.61200.60090.60870.62530.59620.59600.6058
137Sao Tome and Principe0.60860.60760.59220.60240.62320.58370.58590.5989
138Congo0.60850.61150.61180.61890.61540.60970.58720.6132
138Eswatini (Kingdom of)0.60810.61840.62960.63290.60790.62660.59420.6269
140Lao People’s Democratic Republic0.60410.61440.61640.62900.61580.60950.56600.6183
141Vanuatu0.59680.59730.58170.59320.61260.57210.57110.5887
142Ghana0.59570.59430.58870.59440.60300.58680.58110.5915
143Zambia0.59150.58860.58060.58550.59880.57830.58030.5840
144Equatorial Guinea0.58840.62250.64920.65670.58870.63190.55510.6427
145Myanmar0.58430.59680.59940.61280.59670.59120.54340.6013
146Cambodia0.58150.58820.58030.59470.59750.57110.54380.5856
147Kenya0.57860.57830.56790.57730.59080.56240.55600.5729
147Nepal0.57950.58340.56960.58340.59670.55860.54650.5765
149Angola0.57450.58040.58480.59120.57960.58240.55340.5847
150Cameroon0.56270.55990.55450.55630.56620.55380.55950.5565
150Zimbabwe0.56310.55890.54840.55160.56980.54540.55750.5522
152Pakistan0.56040.57820.58130.59720.57500.56930.51240.5835
153Solomon Islands0.55730.56620.54760.56480.57880.52960.51840.5567
154Syrian Arab Republic0.54890.56340.55270.57180.56970.53600.50030.5598
155Papua New Guinea0.54310.55170.55060.56310.55550.54350.50710.5534
156Comoros0.53780.53900.52950.53960.55050.52320.51270.5344
157Rwanda0.53600.54170.52630.54090.55430.51290.50220.5339
158Nigeria0.53410.54170.55030.55240.53350.54840.52480.5482
159Tanzania (United Republic of)0.52830.53600.53060.54410.54280.52200.49180.5350
159Uganda0.52820.52590.51040.51770.54020.50250.51390.5165
161Mauritania0.52710.54190.54280.55780.54130.53210.48300.5456
162Madagascar0.52070.52290.50220.51350.53770.48720.49870.5107
163Benin0.51980.51920.50970.51780.53060.50480.50040.5142
164Lesotho0.51800.51880.51990.52030.51800.51980.51630.5196
165Côte d’Ivoire0.51570.52120.52450.53130.52150.52190.49430.5249
166Senegal0.51380.53590.53430.55340.53240.51680.45960.5386
167Togo0.51270.50960.49440.50000.52320.48720.50280.5001
168Sudan0.50750.53210.53610.55380.52360.51920.45370.5384
169Haiti0.50270.50500.49170.50300.51750.48200.47670.4979
170Afghanistan0.49600.50190.49020.50380.51220.47910.46290.4965
171Djibouti0.49540.52560.52820.54840.51410.50650.43570.5314
172Malawi0.48540.48780.46820.47890.50160.45360.46440.4762
173Ethiopia0.46980.48800.47920.49800.48970.46090.42130.4856
174Gambia0.46570.47150.46090.47370.48090.45060.43430.4667
174Guinea0.46550.47930.47730.49200.48010.46610.42400.4809
176Liberia0.46470.46980.45050.46300.48220.43410.43920.4588
177Yemen0.46270.47780.46520.48330.48290.44680.41870.4726
178Guinea-Bissau0.46140.46320.45570.46480.47250.45020.43830.4598
179Congo (Democratic Republic of the)0.45870.46040.43600.44230.47280.41730.45180.4446
180Mozambique0.44600.44980.43640.44780.46080.42550.42000.4427
181Sierra Leone0.43850.43780.43090.43720.44670.42760.42310.4342
182Burkina Faso0.43350.45150.44770.46430.45030.43230.38780.4521
182Eritrea0.43360.46420.45830.48020.45530.43230.37530.4644
184Mali0.42720.44640.44690.46240.44180.43280.38220.4499
185Burundi0.42290.42980.40570.41650.44040.38320.40520.4151
186South Sudan0.41280.42550.42200.43590.42690.41070.37450.4258
187Chad0.40120.41490.41730.42900.41190.40800.36560.4189
188Central African Republic0.38070.38120.36920.37680.39160.36150.36450.3743
189Niger0.37660.40170.39040.41040.39750.36540.32800.3978

References

  1. UNDP. Human Development Report 1990; Concept and Measurament of Human Development, United Nations: New York, NY, USA, 1990; Available online: http://www.hdr.undp.org/en/reports/global/hdr1990 (accessed on 27 June 2017).
  2. Sen, A. Development as Freedom, 2nd ed.; Oxford University Press: New York, NY, USA, 2001. [Google Scholar]
  3. Blanco-Mesa, F.; León-Castro, E.; Merigó, J.M. A bibliometric analysis of aggregation operators. Appl. Soft Comput. 2019, 81, 105488. [Google Scholar] [CrossRef]
  4. Yager, R.R. On ordered weighted averaging aggregation operators in multicriteria decisionmaking. IEEE Trans. Syst. Man Cybern. 1988, 18, 183–190. [Google Scholar] [CrossRef]
  5. Baez-Palencia, D.; Olazabal-Lugo, M.; Romero-Muñoz, J. Toma de decisiones empresariales a través de la media ordenada ponderada. Inquietud Empresarial 2019, 19, 11–23. [Google Scholar]
  6. Yager, R.R. Induced aggregation operators. Fuzzy Sets Syst. 2003, 137, 59–69. [Google Scholar] [CrossRef]
  7. Yager, R.R. Heavy OWA operators. Fuzzy Optim. Decis. Mak. 2002, 1, 379–397. [Google Scholar] [CrossRef]
  8. Yager, R.R. Prioritized aggregation operators. Int. J. Approx. Reason. 2008, 48, 263–274. [Google Scholar] [CrossRef] [Green Version]
  9. Merigó, J.M. Probabilities in the OWA operator. Expert Syst. Appl. 2012, 39, 11456–11467. [Google Scholar] [CrossRef]
  10. Yager, R.R. On generalized Bonferroni mean operators for multi-criteria aggregation. Int. J. Approx. Reason. 2009, 50, 1279–1286. [Google Scholar] [CrossRef] [Green Version]
  11. Alfaro-García, V.G.; Merigó, J.M.; Gil-Lafuente, A.M.; Kacprzyk, J. Logarithmic aggregation operators and distance measures. Int. J. Intell. Syst. 2018, 33, 1488–1506. [Google Scholar] [CrossRef] [Green Version]
  12. Yager, R.R. Pythagorean membership grades in multicriteria decision making. IEEE Trans. Fuzzy Syst. 2013, 22, 958–965. [Google Scholar] [CrossRef]
  13. Blanco-Mesa, F.; Gil-Lafuente, A.M.; Merigó, J.M. New aggregation operators for decision-making under uncertainty: An applications in selection of entrepreneurial opportunities. Technol. Econ. Dev. Econ. 2018, 24, 335–357. [Google Scholar] [CrossRef] [Green Version]
  14. León-Castro, E.; Avilés-Ochoa, E.; Merigó, J.M. Induced heavy moving averages. Int. J. Intell. Syst. 2018, 33, 1823–1839. [Google Scholar] [CrossRef]
  15. León-Castro, E.; Espinoza-Audelo, L.F.; Merigó, J.M.; Herrera-Viedma, E.; Herrera, F. Measuring volatility based on ordered weighted average operators: Agricultural products prices case of use. Fuzzy Sets Syst. 2020, 395, 197–198. [Google Scholar] [CrossRef]
  16. Fonseca-Cifuentes, G.; León-Castro, E.; Blanco-Mesa, F. Predicting the future price of a commodity using the OWMA operator: An approximation of the interest rate and inflation in the brown pastusa potato price. J. Intell. Fuzzy Syst. 2021, 40, 1970–1981. [Google Scholar]
  17. Espinoza-Audelo, L.F.; Olazabal-Lugo, M.; Blanco-Mesa, F.; León-Castro, E.; Alfaro-Garcia, V. Bonferroni Probabilistic Ordered Weighted Averaging Operators Applied to Agricultural Commodities’ Price Analysis. Mathematics 2020, 8, 1350. [Google Scholar] [CrossRef]
  18. Blanco-Mesa, F.; Rivera-Rubiano, J.; Patino-Hernandez, X.; Martinez-Montana, M. The importance of enterprise risk management in large companies in Colombia. Technol. Econ. Dev. Econ. 2019, 25, 600–633. [Google Scholar] [CrossRef] [Green Version]
  19. Blanco-Mesa, F.; León-Castro, E.; Merigó, J.M. Bonferroni induced heavy operators in ERM decision-making: A case on large companies in Colombia. Appl. Soft Comput. 2018, 72, 371–391. [Google Scholar] [CrossRef]
  20. Mariño-Becerra, G.; Blanco-Mesa, F.; León-Castro, E. Pythagorean membership grade distance aggregation: An application to new business ventures. J. Intell. Fuzzy Syst. 2021, 40, 1827–1836. [Google Scholar] [CrossRef]
  21. Avilés-Ochoa, E.; León-Castro, E.; Perez-Arellano, L.A.; Merigó, J.M. Government transparency measurement through prioritized distance operators. J. Intell. Fuzzy Syst. 2018, 34, 2783–2794. [Google Scholar] [CrossRef] [Green Version]
  22. Perez-Arellano, L.A.; Leon-Castro, E.; Blanco-Mesa, F.; Fonseca-Cifuentes, G. The ordered weighted government transparency average: Colombia case. J. Intell. Fuzzy Syst. 2020, 40, 1837–1849. [Google Scholar] [CrossRef]
  23. Kelley, A.C. The human development index: “Handle with care”. Popul. Dev. Rev. 1991, 17, 315–324. [Google Scholar] [CrossRef]
  24. Sen, A. Equality of what? Tann. Lect. Hum. Values 1980, 1, 197–220. [Google Scholar]
  25. Yakunina, R.P.; Bychkov, G.A. Correlation analysis of the components of the human development index across countries. Procedia Econ. Financ. 2015, 24, 766–771. [Google Scholar] [CrossRef] [Green Version]
  26. Zirogiannis, N.; Krutilla, K.; Tripodis, Y.; Fledderman, K. Human development over time: An empirical comparison of a Dynamic Index and the standard HDI. Soc. Indic. Res. 2019, 142, 773–798. [Google Scholar] [CrossRef]
  27. UNDP. Human Development Report 2019; UNDP: New York, NY, USA, 2019. [Google Scholar]
  28. Ranis, G.; Stewart, F. Success and failure in human development, 1970–2007. J. Hum. Dev. Capab. 2012, 13, 167–195. [Google Scholar] [CrossRef]
  29. Chaaban, J.; Irani, A.; Khoury, A. The composite global well-being index (CGWBI): A new multi-dimensional measure of human development. Soc. Indic. Res. 2016, 129, 465–487. [Google Scholar] [CrossRef]
  30. Hickel, J. The sustainable development index: Measuring the ecological efficiency of human development in the anthropocene. Ecol. Econ. 2020, 167, 106331. [Google Scholar] [CrossRef]
  31. Biggeri, M.; Mauro, V. Towards a more ‘sustainable’ human development index: Integrating the environment and freedom. Ecol. Indic. 2018, 91, 220–231. [Google Scholar] [CrossRef]
  32. Lind, N. A development of the human development index. Soc. Indic. Res. 2019, 146, 409–423. [Google Scholar] [CrossRef]
  33. Kovacevic, M. Measurement of inequality in Human Development–A review. Measurement 2010, 35, 1–65. [Google Scholar]
  34. Gaye, A.; Klugman, J.; Kovacevic, M.; Twigg, S.; Zambrano, E. Measuring key disparities in human development: The gender inequality index. Hum. Dev. Res. Pap. 2010, 46, 1–37. [Google Scholar]
  35. Alkire, S.; Jahan, S. The New Global MPI 2018: Aligning with the Sustainable Development Goals 2018; University of Oxford: Oxford, UK, 2018. [Google Scholar]
  36. Sayed, H.; Hamed, R.; Hosny, S.H.; Abdelhamid, A.H. Avoiding ranking contradictions in human development index using goal programming. Soc. Indic. Res. 2018, 138, 405–442. [Google Scholar] [CrossRef]
  37. Anand, S.; Sen, A. The income component of the human development index. J. Hum. Dev. 2000, 1, 83–106. [Google Scholar] [CrossRef]
  38. Maddison, A. Historical Statistics of the World Economy; OECD Publishing: Paris, France, 2003. [Google Scholar] [CrossRef]
  39. Kahneman, D.; Deaton, A. High Income Improves Evaluation of Life but not Emotional Well-being. Proc. Natl. Acad. Sci. USA 2010, 107, 16489–16493. [Google Scholar] [CrossRef] [PubMed] [Green Version]
  40. Merigó, J.M. Fuzzy decision making with immediate probabilities. Comput. Ind. Eng. 2010, 58, 651–657. [Google Scholar] [CrossRef]
  41. Olazabal-Lugo, M.; Leon-Castro, E.; Espinoza-Audelo, L.F.; Maria Merigo, J.; Gil Lafuente, A.M. Forgotten effects and heavy moving averages in exchange rate forecasting. Econ. Comput. Econ. Cybern. Stud. Res. 2019, 53, 79–96. [Google Scholar]
  42. Xu, Z.S.; Da, Q.-L. The uncertain OWA operator. Int. J. Intell. Syst. 2002, 17, 569–575. [Google Scholar] [CrossRef]
  43. Xu, Z.; Da, Q.-L. An overview of operators for aggregating information. Int. J. Intell. Syst. 2003, 18, 953–969. [Google Scholar] [CrossRef]
  44. Avilés-Ochoa, E.; Perez-Arellano, L.A.; León-Castro, E.; Merigó, J.M. Prioritized induced probabilistic distances in transparency and access to information laws. Fuzzy Econ. Rev. 2017, 22, 45–55. [Google Scholar] [CrossRef]
  45. Pérez-Arellano, L.A.; León-Castro, E.; Avilés-Ochoa, E.; Merigó, J.M. Prioritized induced probabilistic operator and its application in group decision making. Int. J. Mach. Learn. Cybern. 2019, 10, 451–462. [Google Scholar] [CrossRef]
  46. UNDP. Human Development; UNDP: New York, NY, USA, 2018. [Google Scholar]
  47. Merigo, J.M. La Media Ponderada Ordenada Probabilística: Teoría y Aplicaciones; Fundación Universitaria ESERP: Barcelona, Spain, 2014. [Google Scholar]
  48. Blanco-Mesa, F.; Merigó, J.M.; Gil-Lafuente, A.M. Fuzzy decision making: A bibliometric-based review. J. Intell. Fuzzy Syst. 2017, 32, 2033–2050. [Google Scholar] [CrossRef] [Green Version]
  49. Hara, T.; Uchiyama, M.; Takahasi, S.-E. A refinement of various mean inequalities. J. Inequalities Appl. 1998, 1998, 932025. [Google Scholar] [CrossRef]
  50. Sinani, F.; Erceg, Z.; Vasiljević, M. An evaluation of a third-party logistics provider: The application of the rough Dombi-Hamy mean operator. Decis. Mak. Appl. Manag. Eng. 2020, 3, 92–107. [Google Scholar]
  51. Bonferroni, C. Sulle medie multiple di potenze. Boll. dell’Unione Mat. Ital. 1950, 5, 267–270. [Google Scholar]
  52. Blanco-Mesa, F.; León-Castro, E.; Merigó, J.M.; Xu, Z. Bonferroni means with induced ordered weighted average operators. Int. J. Intell. Syst. 2019, 34, 3–23. [Google Scholar] [CrossRef] [Green Version]
  53. Dombi, J. Basic concepts for a theory of evaluation: The aggregative operator. Eur. J. Oper. Res. 1982, 10, 282–293. [Google Scholar] [CrossRef]
  54. Dombi, J. The Generalized Dombi Operator Family and the Multiplicative Utility Function. In Soft Computing Based Modeling in Intelligent Systems; Springer: Berlin/Heidelberg, Germany, 2009; pp. 115–131. [Google Scholar]
  55. Pamucar, D. Normalized weighted Geometric Dombi Bonferoni Mean Operator with interval grey numbers: Application in multicriteria decision making. Rep. Mech. Eng. 2020, 1, 44–52. [Google Scholar] [CrossRef]
  56. Blanco-Mesa, F.; Merigó, J.M. Bonferroni distances and their application in group decision making. Cybern. Syst. 2020, 51, 27–58. [Google Scholar] [CrossRef]
  57. Blanco-Mesa, F.; Gil-Lafuente, A.M.; Merigó, J.M. Subjective stakeholder dynamics relationships treatment: A methodological approach using fuzzy decision-making. Comput. Math. Organ. Theory 2018, 24, 441–472. [Google Scholar] [CrossRef] [Green Version]
  58. Riaz, M.; Çagman, N.; Wali, N.; Mushtaq, A. Certain properties of soft multi-set topology with applications in multi-criteria decision making. Decis. Mak. Appl. Manag. Eng. 2020, 3, 70–96. [Google Scholar] [CrossRef]
Figure 1. Graphical presentation of the Human Development Index (HDI).
Axioms 10 00087 g001
Figure 2. Comparison of the proposed methods for the top 10 countries.
Axioms 10 00087 g002
Figure 3. Comparison of the proposed methods for the middle 10 countries.
Axioms 10 00087 g003
Figure 4. Comparison of the proposed methods for Worst 10 countries.
Axioms 10 00087 g004
Table 1. Variables and parameters of the most recent Human Development Index HDI.
DimensionIndicatorMinimumMaximum
HealthLife expectancy (years)2085
EducationExpected years of schooling (years)018
Mean years of schooling (years)015
Standard of living Gross national income per capita (2011 PPP $)10075,000
Source: Based on UNDP [27].
Table 2. Information for calculating HDI index for Norway.
CountryLife Expectancy at BirthExpected Years of SchoolingMean Years of SchoolingGross National Income (GNI) per Capita
Norway82.318.112.668,059
Table 3. Top 10 countries.
RTOWGAe1OWGAe2OWGAe3IOWGAe1IOWGAe2IOWGAe3POWGAIPOWGA
1NORNORNORNORNORNORNORNORNOR
2CHECHESGPSGPCHESGPDEUFINAUS
3IRLSGPCHECHEHKGCHEIRLNLDSWE
4HKGIRLHKGHKGIRLHKGCHEDNKDEU
5DEUHKGIRLIRLAUSIRLAUSSWELIE
6ISLISLLIELIEISLLIEISLISLISL
7AUSDEUISLISLSWEISLSWEAUSIRL
8SWEAUSDEUSWEDEUDEUDNKCHEHKG
9SGPSWESWENLDSGPSWENLDIRLCHE
10NLDNLDNLDLUXNLDNLDFINDEUSGP
Source: Own elaboration. R: Rank; T: Traditional; NOR: Norway; CHE: Switzerland; IRL: Ireland; HKG: Hong Kong, China (SAR); DEU: Germany; ISL: Iceland; AUS: Australia; SWE: Sweden; SGP: Singapore; NLD: The Netherlands; LIE: Liechtenstein; LUX: Luxembourg, DNK: Denmark; FIN: Finland.
Table 4. Middle 10 countries.
RTOWGAe1OWGAe2OWGAe3IOWGAe1IOWGAe2IOWGAe3POWGAIPOWGA
91TUNTUNTUNARMTUNTUNTONMNGTUN
92MNGLBNLBNTUNLBNMNGDOMFJIBWA
93LBNBWAMDVBWADMAUKRLCATONLEB
94VCTMNGUKRPRYMNGVCTVENVENMDV
95BWAMDVMNGVCTJAMLBNBWABWAMNG
96VENVCTVCTDMAVCTTKMZAFTUNVCT
97JAMPRYTKMTKMMDVSURTUNJAMPRY
98PRYDMAPRYSURPRYPRYJAMVCTSUR
99DMASURSURUKRJORMDVVCTSURTKM
100FJIVENDMAMNGVENGABSURJORDMA
Source: Own elaboration. R: Rank; T: Traditional; TUN: Tunisia; MNG: Mongolia; LBN: Lebanon; VCT: Saint Vincent and the Grenadines; BWA: Botswana; VEN: Venezuela; JAM: Jamaica; PRY: Paraguay; DMA: Dominica; FJI: Fiji; MDV: Maldives; SUR: Suriname; UKR: Ukraine; TKM: Turkmenistan; ARM: Armenia; JOR: Jordan; GAB: Gabon; TON: Tonga; DOM: Dominican Republic; LCA: Saint Lucia; ZAF: South Africa.
Table 5. Worst 10 countries.
RTOWGAe1OWGAe2OWGAe3IOWGAe1IOWGAe2IOWGAe3POWGAIPOWGA
180MOZZARBFALBRMOZERIMOZMOZBFA
181SLEBFAMLIMLIERIBFAYDRYEMMLI
182ERIMOZMOZMOZBFASLEBDIBDICOD
183BFAMLIZARZARSLEMOZBFABFAMOZ
184MLISLESLESLEMLIZARMLIMLISLE
185BDIBDISSDSSDBDISSDERIERISSD
186SSDSSDTCDTCDSSDTCDSSDSSDTCD
187TCDTCDBDIBDITCDBDITCDTCDBDI
188CAFNERNERNERNERNERCAFCAFNER
189NERCAFCAFCAFCAFCAFNERNERCAF
Source: Own elaboration. R: Rank; T: Traditional; MOZ: Mozambique; SLE: Sierra Leone; ERI: Eritrea; BFA: Burkina Faso; MLI: Mali; BDI: Burundi; SSD: South Sudan; TCD: Chad; CAF: Central African: NER: Niger: ZAR; LBR: Liberia; COD: Congo; YDR: Yemen.
Publisher’s Note: MDPI stays neutral with regard to jurisdictional claims in published maps and institutional affiliations.

