1. Introduction
At present, with the popularization and development of media technology, a growing number of netizens are frequently posting opinions about enterprise products on social platforms, including some comments about poor experiences. However, this open transmission of information sometimes leads to comments about negative experiences, which are likely to cause negative public opinion. Some users may post negative comments via Weibo, for example, to compromise an enterprise, bringing huge damage to the business and resulting in a negative impact on business operations. However, due to the large number of users who post comments online, enterprises cannot monitor the public opinion of all users. Therefore, personalized classification and identification of users can help enterprises develop more targeted solutions for public opinion and can also greatly reduce the cost of controlling public opinion for enterprises. Based on this, the monitoring and identification of users’ online comments are particularly critical to improving the efficiency of managing public opinion and maintaining the corporate image.
Generally speaking, monitoring online public opinion for enterprises mainly refers to capturing the relevant public opinion information through a series of technical means to realize the monitoring and tracking of public opinion [
1]. At present, the academic research on enterprises’ online public opinion focuses on both macro and micro levels. With regard to research on the macro level, most scholars carry out a theoretical analysis on the communication characteristics of enterprise public opinion and propose suggestions to deal with negative public opinion. However, much of the macro research ignores the characteristics of the event content itself and is short of user tracking of negative public opinion events because such research is focused on the overall perspective. On the micro level, many scholars have introduced natural language processing tools to identify the emotional polarity of user comments and described the emotional distribution of product users. Although such studies are helpful for enterprises to understand the emotional tendencies of users, they lack personalized identification and monitoring of users in enterprises’ negative public opinion events. In addition, in the study of recognition and detection algorithms, many scholars use neural network algorithms for classification and prediction, but this often requires manual classification of training samples in advance, and the recognition accuracy needs to be improved.
In this context, this paper combines user portrait technology and random forest algorithm to create a supervised model to recognize and monitor high-risk users expressing a public opinion on enterprises. The traditional technique of manually classifying training samples is abandoned in this model, while user portrait technology is adopted to classify the public opinion data of users. Further, such data are used as the training samples of the random forest algorithm, which lowers the workload of manual labeling and eliminates subjectivity, making it more scientific and objective. Specifically, Python (3.8 32-bit) is firstly used to crawl the information of users participating in the discussion of product experience. In turn, indicators are quantified according to the user’s portrait technology. Consequently, the users are divided into high-risk, moderate-risk, and low-risk types in terms of the size of quantized indicators. Moreover, a high-risk user identification model based on a supervised random forest algorithm is established, which can learn and train the random forest classifier and predict whether newly released public opinion information users are high-risk users. Finally, by analyzing the public opinion of Hive Box and optimizing the parameters of the random forest algorithm, the parameters applicable to “Hive Box Charges” are selected to demonstrate the feasibility of the model. Compared with the BP (Back Propagation) neural network, the proposed model is verified by recognition results with high accuracy.
2. Literature Review
Negative public opinion caused by negative product experience has a significant impact on corporate image, and this has attracted the attention of many scholars. In this paper, user portrait technology and a random forest algorithm are used to monitor enterprise public opinion. Therefore, the applications of these two methods in enterprise public opinion are summarized.
Many scholars have studied the public opinion of enterprises from the perspective of user portraits. For example, Wang et al. [
2] presented a novel learning model called the personal service ecosystem (PSE) to delineate user preferences and interests naturally. Virginia et al. [
3] explored the relationship between the user’s perceived quality, the club service dimensions, and the golf club performance. The results showed that the strategy to increase user satisfaction should be quite different depending on whether users were beginners or advanced golf players. Martínez-Cevallos et al. [
4] analyzed the segmentation of participants in a sports event according to their perceived quality, perceived value, satisfaction, and future intentions. Tiwari et al. [
5] leveraged the power of the categorical information stored in the Wikipedia database to assign relative weights to entities that a user followed on Twitter. Zhang et al. [
6] explored the application of user portrait technology in agriculture, and they constructed a situational recommendation system of agricultural science and technology resources based on user portraits. Sun and Chai [
7] classified the portrait of online learners into three dimensions, and they constructed a tag system of learner portraits based on the data fields of an online learning platform. You et al. [
8] excavated user characteristics through identified user behaviors and constructed user portraits based on behavior perception according to actual cases. Widiyaningtyas et al. [
9] proposed a new similarity algorithm—so-called “user profile correlation-based similarity”, which examined genre data and user profile data, namely, age, gender, occupation, and location. Ni et al. [
10] designed a new user portrait construction architecture based on knowledge database construction and fingerprint matching technology. Chen et al. [
11] modeled the public opinion reversal process, taking into consideration external intervention information and individual internal characteristics. Their simulation results showed that the intensity of external intervention information affected the direction and degree of public opinion reversal. Although the above literature works have promoted the development of user portrait theory, few scholars have applied this method to the research of enterprise network public opinion. Most scholars have only established an indicator system of user characteristics, while few scholars have quantified the indicators within it.
On the other hand, many scholars use random forests to study public opinion. For example, Yelkanat [
12] investigated the performance of the random forest machine learning algorithm in estimating near-future case numbers for 190 countries in the world, and it was mapped in comparison with actual confirmed cases’ results. Chen et al. [
13] focused on studying the polarization phenomenon and established a model of public opinion dissemination with the polarization process considering individual heterogeneity. Simsekler et al. [
14] used a tree-based machine learning algorithm as well as random forests to estimate accurate and stable associations. The results of our analysis showed that safety perception, management support, and supervisor/manager expectations were the leading drivers of patient safety grade. Chen et al. [
15] introduced the social preference theory and revealed the micro-interaction mechanism of public opinion polarization. Different social preferences held by individuals had different influences on the public opinion polarization effects. Xiao et al. [
16] held that the evolution of individual opinions was not only influenced by the interactions between neighboring individuals but was also updated naturally due to individual factors themselves in the absence of interactions. Li and Xiao [
17] combined social judgment theory with the multi-agent model and proposed a multidimensional opinion evolution model for studying the dynamics of opinion polarization. The results demonstrated that polarization was influenced by the average degree of the network, and the polarization process was affected by the parameters of the assimilation effect and contrast effect. Although the above studies have promoted the development of the random forest algorithm, few scholars have applied it to the detection and identification of enterprise network public opinion users, and few scholars have combined it with user portrait technology.
This paper takes enterprise network public opinion as the research background. The current academic research in this field mainly focuses on the macro and micro perspectives. For research on the macro level, Regester and Larkin [
18] hold that enterprise reputation is an important component of intangible assets, and they also put forward the 3T principle for enterprises to deal with a reputation crisis. Taylor and Perry [
19] proposed that enterprises should establish a crisis response mechanism combining traditional media and network media when dealing with crises. By analyzing specific cases, Li and Dong [
20] proposed the communication process model of enterprises’ online public opinion and believe that the attention of netizens plays a leading role in the development direction of events. At the micro level, Yu [
21] proposed the Leader Rank algorithm, which recognizes the emotional characteristics of users by commenting on them and infers their positive, negative, or neutral attitude towards the author of an article. Yin et al. [
22] examined how a perceived locus of the crisis was caused and used a real case study to perform a quantitative content analysis with a sample of 503 comments under online articles. Zhang and Zhang [
23] used a sentiment analysis to calculate the emotional strength of defect events and explored the effectiveness of the trust repair strategy adopted by enterprises at different evolution stages. Bella et al. [
24] selected the comment text of the official Twitter of an enterprise and used SVM (Support Vector Machines) to classify the text to construct an opinion leader style model. Liu et al. [
25] used natural language processing technology to study the word segmentation of text information on a network and applied it for risk detection of corporate public opinion. Aggarwal and Singh [
26] monitored user review data from different social network regions and optimized corporate advertising strategies. However, the described objects of the aforementioned research are products or services provided by enterprises, which lack the monitoring of users during negative public opinion events of enterprises.
3. Model Construction
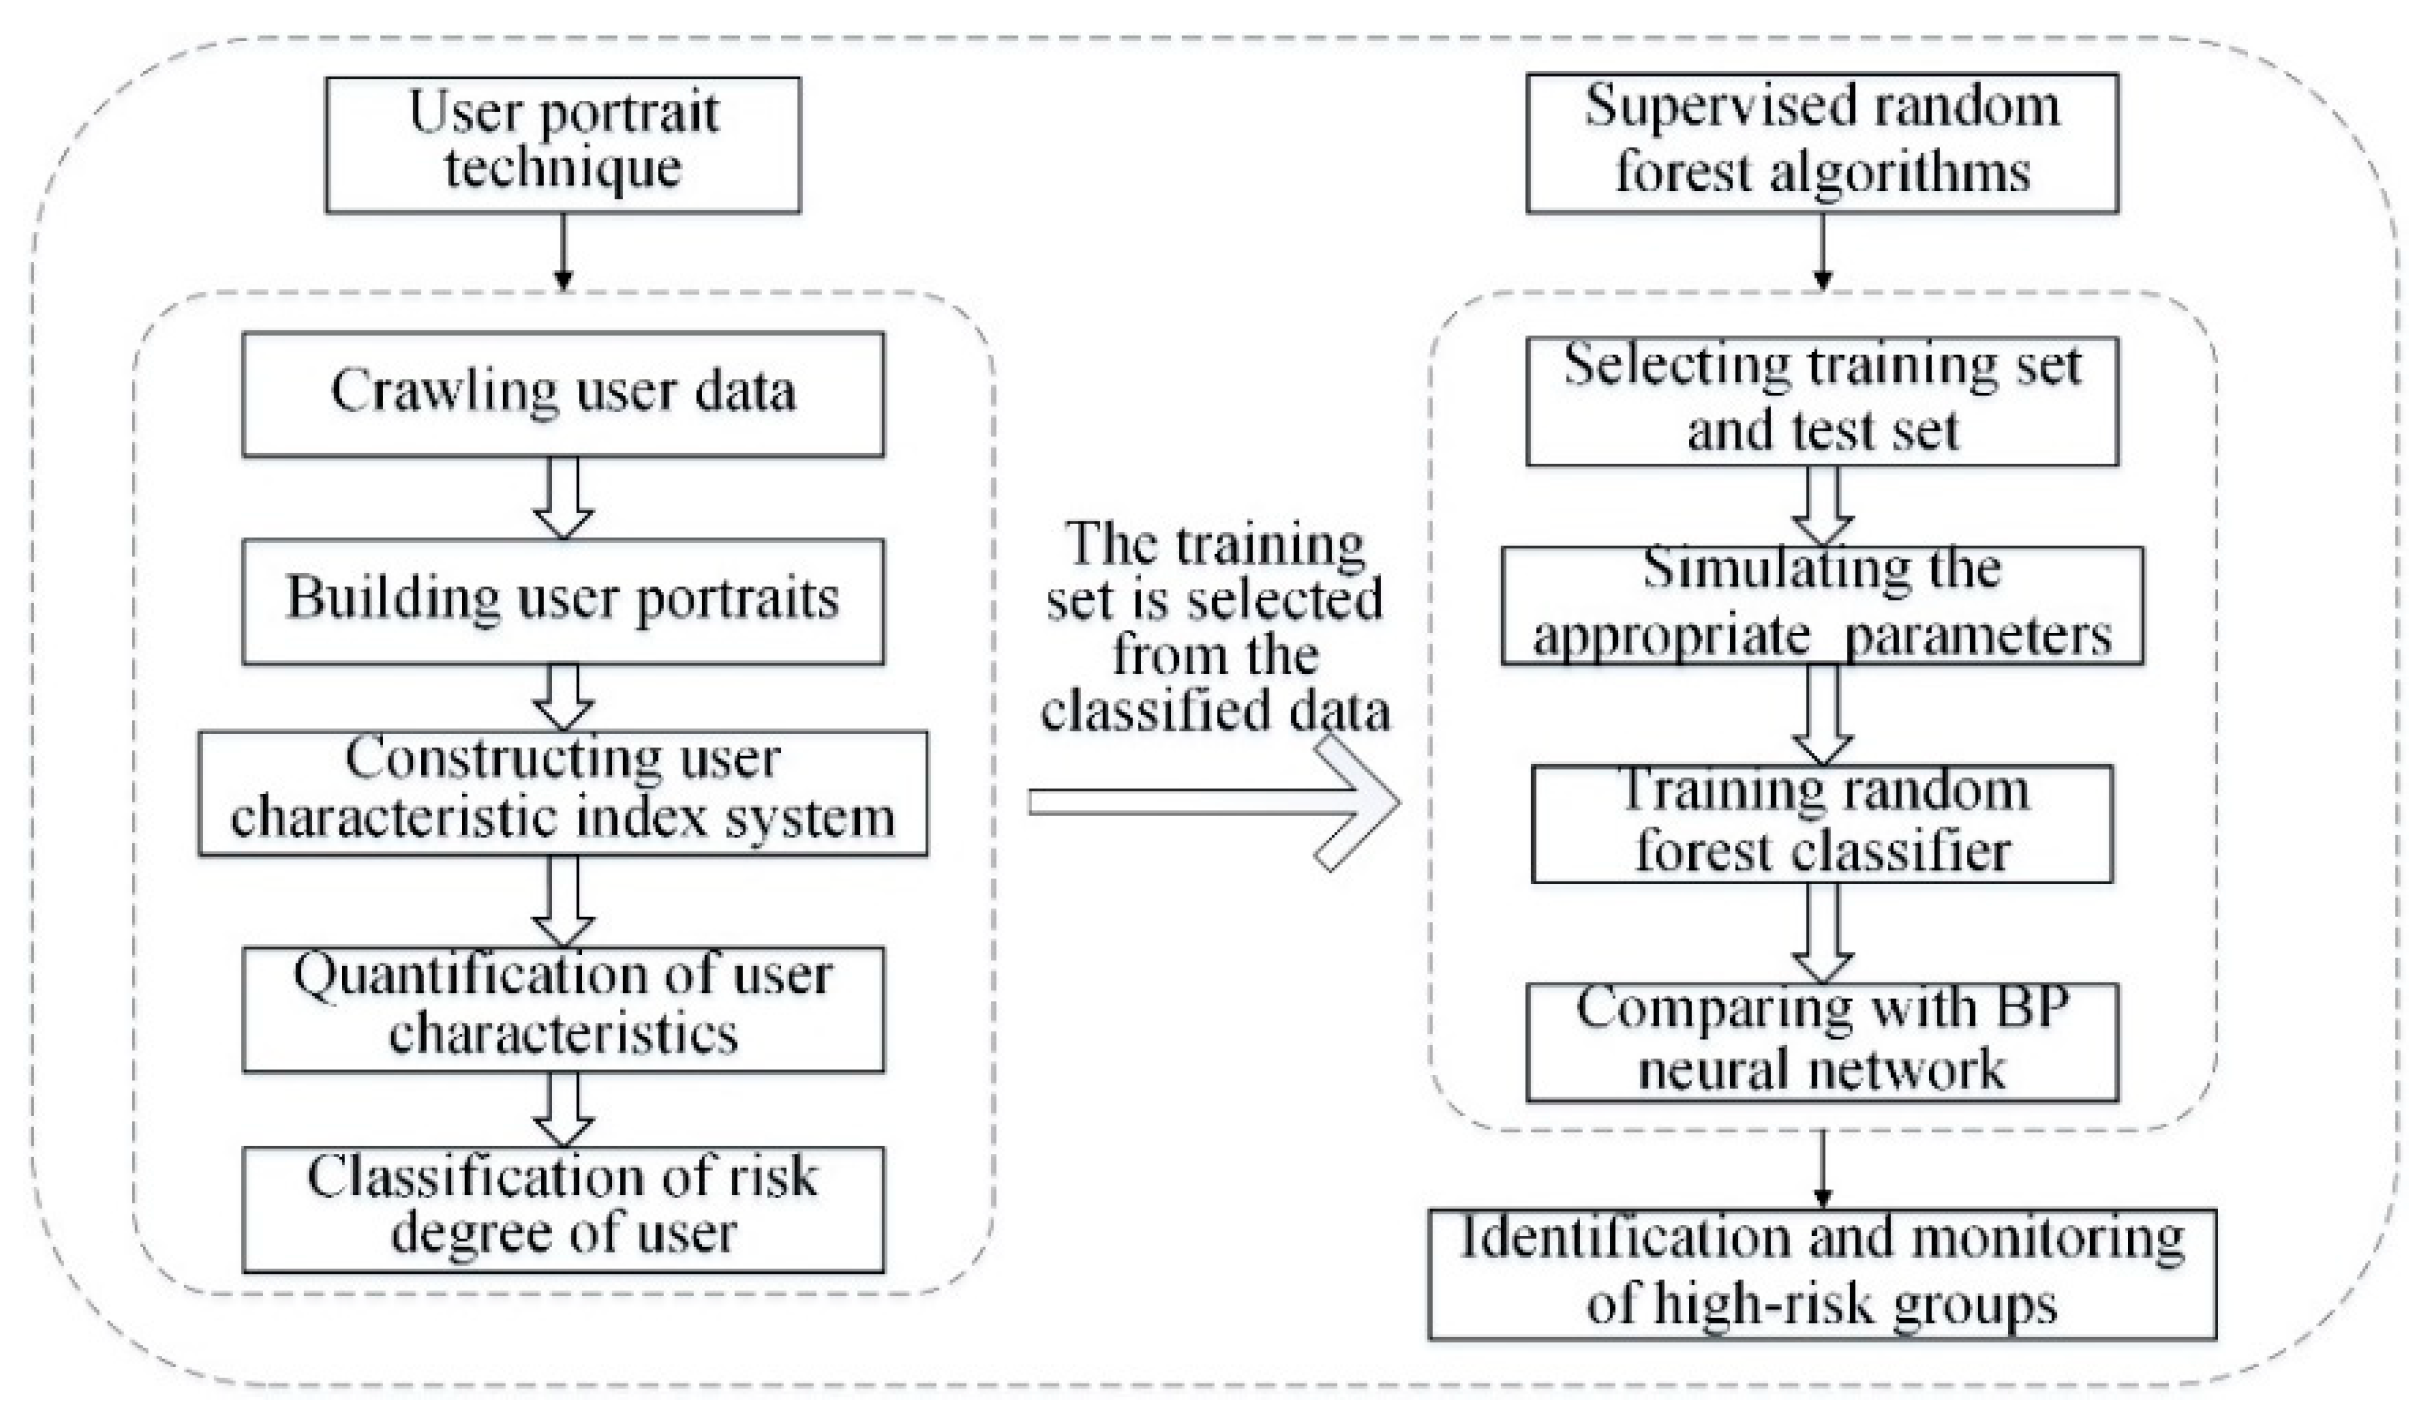
After the outbreak of negative public opinions of an enterprise due to poor user experiences, monitoring high-risk users involves monitoring and recognizing those users participating in negative public opinion discussions. Firstly, user data in the network are crawled and classified by user portrait technology. Then, supervised random forest algorithms are adopted to identify and monitor high-risk groups. The overall framework of the paper is shown in
Figure 1.
The variables and parameters involved in this paper are shown in
Table 1.
3.1. Crawling User Data
The product name is used as a keyword to search on various social network platforms, and public opinion topics related to the product experience are selected. Subsequently, the Python (3.8 32-bit) crawler is used to crawl user information under the relevant topic, which is mainly for three kinds of information: (1) user information, such as the number of followers, address, and other account information; (2) user experience, comments, and other text information; and (3) interactive information, such as the number of reposts/comments, etc. In order to facilitate the subsequent emotional segmentation, pre-processing of the comment text data is required. Firstly, the symbols, expressions, and punctuations in the comments are removed. Secondly, comments that are not relevant to the company, such as advertisements and comments with very few words, are also deleted.
3.2. Building the User Portraits
A user portrait refers to the characterization of users through direct or indirect data, which is widely used in enterprise precision marketing, crime prevention, financial risk prediction, and other fields. In addition, by studying users’ behaviors on the internet, user portraits can also be used for online public opinion governance [
27]. At present, the user portrait system construction methods are varied, and user portrait construction methods with statistical analysis or rules are based on the practice of business knowledge combined with the understanding of the business, scenes, and problems. A characteristic index based on scenes is put forward to construct a user portrait framework and deal with real problems. In this paper, this method is adopted to construct an enterprise network public opinion user portrait. Based on the theoretical knowledge of enterprise public opinion, the user characteristic labels are crawled, and the data are quantified as indicators affecting the risk degree to build a user characteristic index system of enterprise public opinion and take it as the training data of the random forest.
3.2.1. Constructing the User Characteristic Index System
After the outbreak of negative public opinions on an enterprise, the user can participate in discussions and make comments on Weibo. While constructing the portrait of users participating in the discussions of negative public opinion, the characteristics can be divided into dynamic and static categories. The former is the attributes of users when they participate in social activities, including the time they participate in discussions and the opinions they hold. The latter describes basic properties, including an individual’s ID, gender, site, number of followers, number of fans, number of Weibo posts shared, and other characteristics. Based on this, the specific user characteristic index system is shown in
Table 2.
3.2.2. Quantification of User Characteristics
In the index system constructed above, the static characteristics of users can be directly obtained according to the crawled Weibo user data. However, the dynamic characteristics of users change with the content posted by users, so it is necessary to quantify these characteristics.
For the quantification of emotional tendency, the Jieba segmentation tool [
28] is adopted, and word frequency is counted. SnowNLP is used to score the emotion so as to obtain the emotional value of each posted text comment as a user’s emotional tendency.
For the quantification of user influence, the influence of users in public opinion events is comprehensively judged according to the number of users’ comments by likes, the number of secondary comments, and the number of fans. The calculation is shown in the following Formula (1):
where
represents the relative influence of the
th Weibo user;
Ai represents the likes on a comment by user
, and
Amax represents the maximum number of likes by all the users participating in the public opinion event;
Bi represents the number of secondary comments of
, and
Bmax represents the highest number of secondary comments of all the users participating in the public opinion event;
Ci represents the number of fans of
, and
Cmax represents the highest number of fans of all the users participating in the public opinion event.
With regard to the quantification of user activation, the participation in public opinion events can be comprehensively judged according to the amount of users’ attention and the total number of posts on Weibo. The calculation is shown in the following Formula (2):
where
represents the relative activation of user
;
Di represents the number of followers of
, and
Dmax represents the highest number of followers of all users participating in the public opinion event;
Fi represents the total number of Weibo posts shared by
, while
Fmax represents the maximum total number of Weibo posts shared by all users participating in the public opinion event.
3.2.3. Classification of Risk Degree of User
In our classification, those who post negative comments on Weibo and can easily bring great losses to a corporate image are defined as high-risk groups. On this basis, the risk levels of users who post comments on the internet are divided into three categories: high-risk users, medium-risk users, and low-risk users. According to the above-quantified user portrait index system, the risk degree of each user is positively correlated with the influence and activity of the user and negatively correlated with the affective tendency value of the user. Therefore, the user influence and user activity are sorted in descending order, while the emotional tendency is sorted in ascending order. High-risk users are defined as those who rank in the top 10% for influence, activity, and emotional propensity, and their label is set as 2. After the high-risk users are excluded from the top 20% of the users in the three indicators, the remaining users are defined as moderate-risk users, and the label is set as 1. After excluding high-risk and moderate-risk users, the remaining users shall be low-risk users, and the label shall be set as 0. The specific judgment criteria are shown in
Table 3.
3.3. Supervised Random Forest Algorithms
After the outbreak of negative public opinion, monitoring and identifying high-risk users involves classifying those high-risk users participating in discussions of the product/experience, so as to identify the high-risk users with label 2. In recent years, the use of machine learning algorithms to classify all kinds of data has extended to a very wide range of applications, and there are various machine learning algorithms. Since the involved data belong to the supervised classification type, the random forest algorithm with strong generalization ability and fast training speed is adopted. The random forest algorithm was first proposed by Leo [
29] in 2001, which was a classifier with a decision tree as the basic unit. It is equivalent to consisting of multiple decision tree classifiers. Each decision tree produces a result, and the final classification result is determined by voting. As such, the principle of random forest is introduced based on decision trees, and the specific steps of the algorithm are described as well.
3.3.1. Decision Tree
A decision tree algorithm is a supervised learning algorithm, which is mainly used for regression and classification. There are three optimal feature selection methods in the decision tree—namely, information gain, information gain rate, and Gini coefficient. By calculating the Gini coefficient selection characteristics, the user set
S = {
s1, s2, s3, …sn} is obtained, meaning that there are
n different users participating in a public opinion discussion, and each user can be represented by
V = {
v1, v2, v3, …vM}. It is assumed that each user in set
S can be divided into
k subsets, and each subset represents a class. The Gini coefficient [
30] of the attribute
v in dataset
S is as follows:
In Formula (4), pi is the probability that any user belongs to a specific category. By calculating the information gain of each feature, the feature with the lowest Gini coefficient in V is obtained, which is taken as the best feature.
3.3.2. Steps of Random Forest Algorithm
The random forest algorithm involves the integration of multiple decision tree classifiers. The tree classifier is set as an independent identically distributed random vector . Given the dataset , the algorithm flow is as follows:
- (1)
Firstly, sampling with a replacement is adopted, and each sub-training set is extracted from n samples of the original training set by the replacement, namely ;
- (2)
Based on the decision tree, a binary tree corresponding to each sub-training set is formed. The process is as follows:
- (a)
In the decision tree for constructing each node, select features out of M as the candidate attribute characteristics for prediction or classification;
- (b)
Calculate the Gini coefficients of the selected m characteristics, and select the smallest attribute characteristic of the Gini coefficient as the optimal classification characteristic attribute;
- (c)
Classify the nodes according to the selected optimal attribute characteristics, and select the sub-characteristic attributes next to the optimal attribute characteristics from the remaining ones to ensure that each binary tree is a full binary tree.
- (3)
Repeat steps (1) and (2) until the generated tree can accurately classify the samples in the training set and combine all tree models in the operation process to form a random forest model;
- (4)
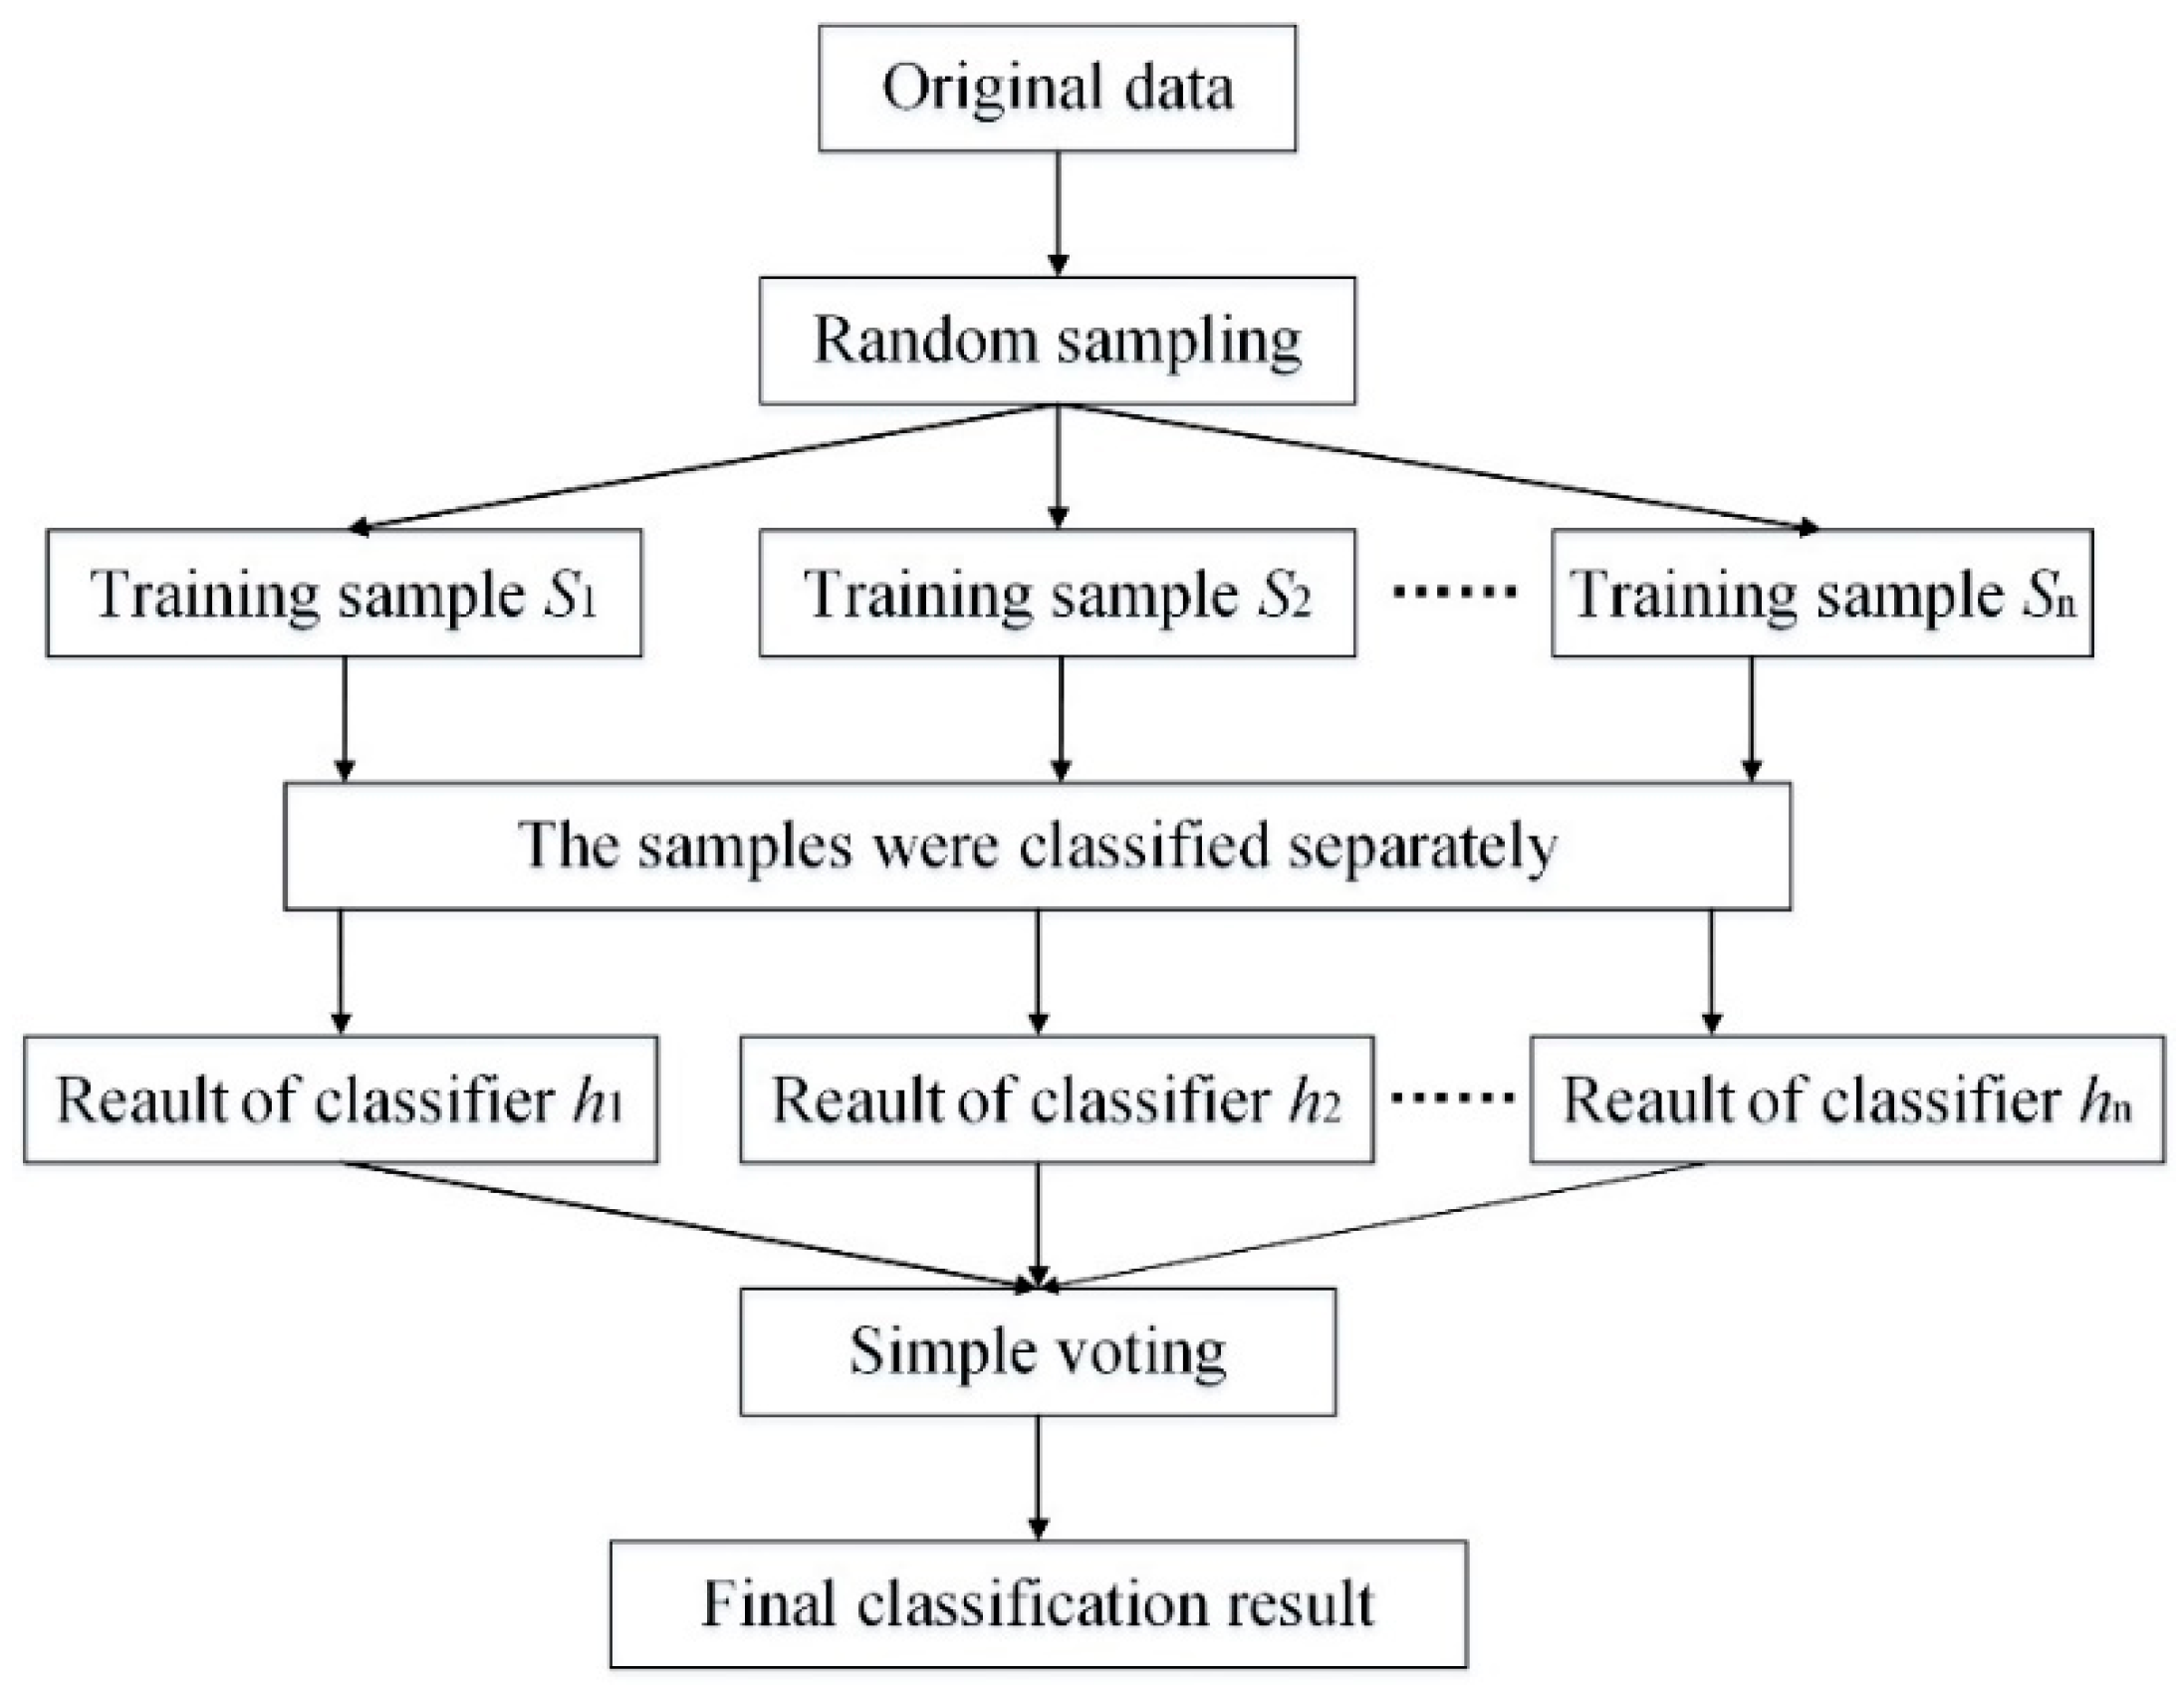
For any test sample, the final classification result of the sample is usually decided by simple voting. The specific formula is as follows:
where
is the indicator function, and
c is the sample category that receives the most votes.
The specific algorithm diagram is shown in
Figure 2.
3.4. Combination of the User Portrait and Random Forest Algorithm
Based on the theory of user portraits, first, the data of user characteristics are crawled, and the user characteristic index system is built up. Then, the quantitative characteristics after the indicators are considered as independent variables, and the user’s degree of risk is considered as the dependent variable. According to the characteristics of the target, the degrees of risk to the user classification are sorted out. Furthermore, data from the classification of the dataset are selected as a training set for the random forest algorithm through continuously generating a decision tree.
4. The Empirical Analysis
In this section, Hive Box (one of the largest express enterprises in China), a typical representative of the logistics industry, is selected as the research object to conduct an empirical analysis of the recent outbreak of a “Hive Box charges” public opinion event.
On 30 April 2020, Hive Box launched a membership system in which ordinary users could keep a package for free within 12 h, for CNY 0.5 for 12 h after overtime, and for CNY 3 for capping. After the implementation of this system, most users’ experiences of Hive Box were very poor, and they made negative comments on various social platforms. On 8 May, some communities in Hangzhou and Shanghai posted notices to stop using Hive Box, and the negative public opinion continued to spread online. As of 11 May, the number of discussions about Hive Box on Weibo had reached 3.5 million. In view of the negative public opinion of Hive Box caused by poor user experiences, identification and monitoring of the online public opinion of the aforementioned enterprise were applied to depict the user portrait characteristics of Hive Box enterprise and to identify high-risk groups, so as to take targeted measures to improve user experience.
4.1. Crawling User Data
“Hive Box” and “Hive Box charges” were chosen as the main key words, the related Weibo comments starting from “30 April 2020” were selected, and the Python (3.8 32-bit) software crawl was adopted to collect user data—mainly user information, comment information for experience, and interactive information. In total, 48,267 data pieces were processed by Python (3.8 32-bit); a piece of data refers to a single comment posted by a user on the network, and it can include many bytes of varying lengths. As such, about 44,775 valid pieces of data were obtained after removing useless punctuations and emojis.
4.2. Building the User Portrait
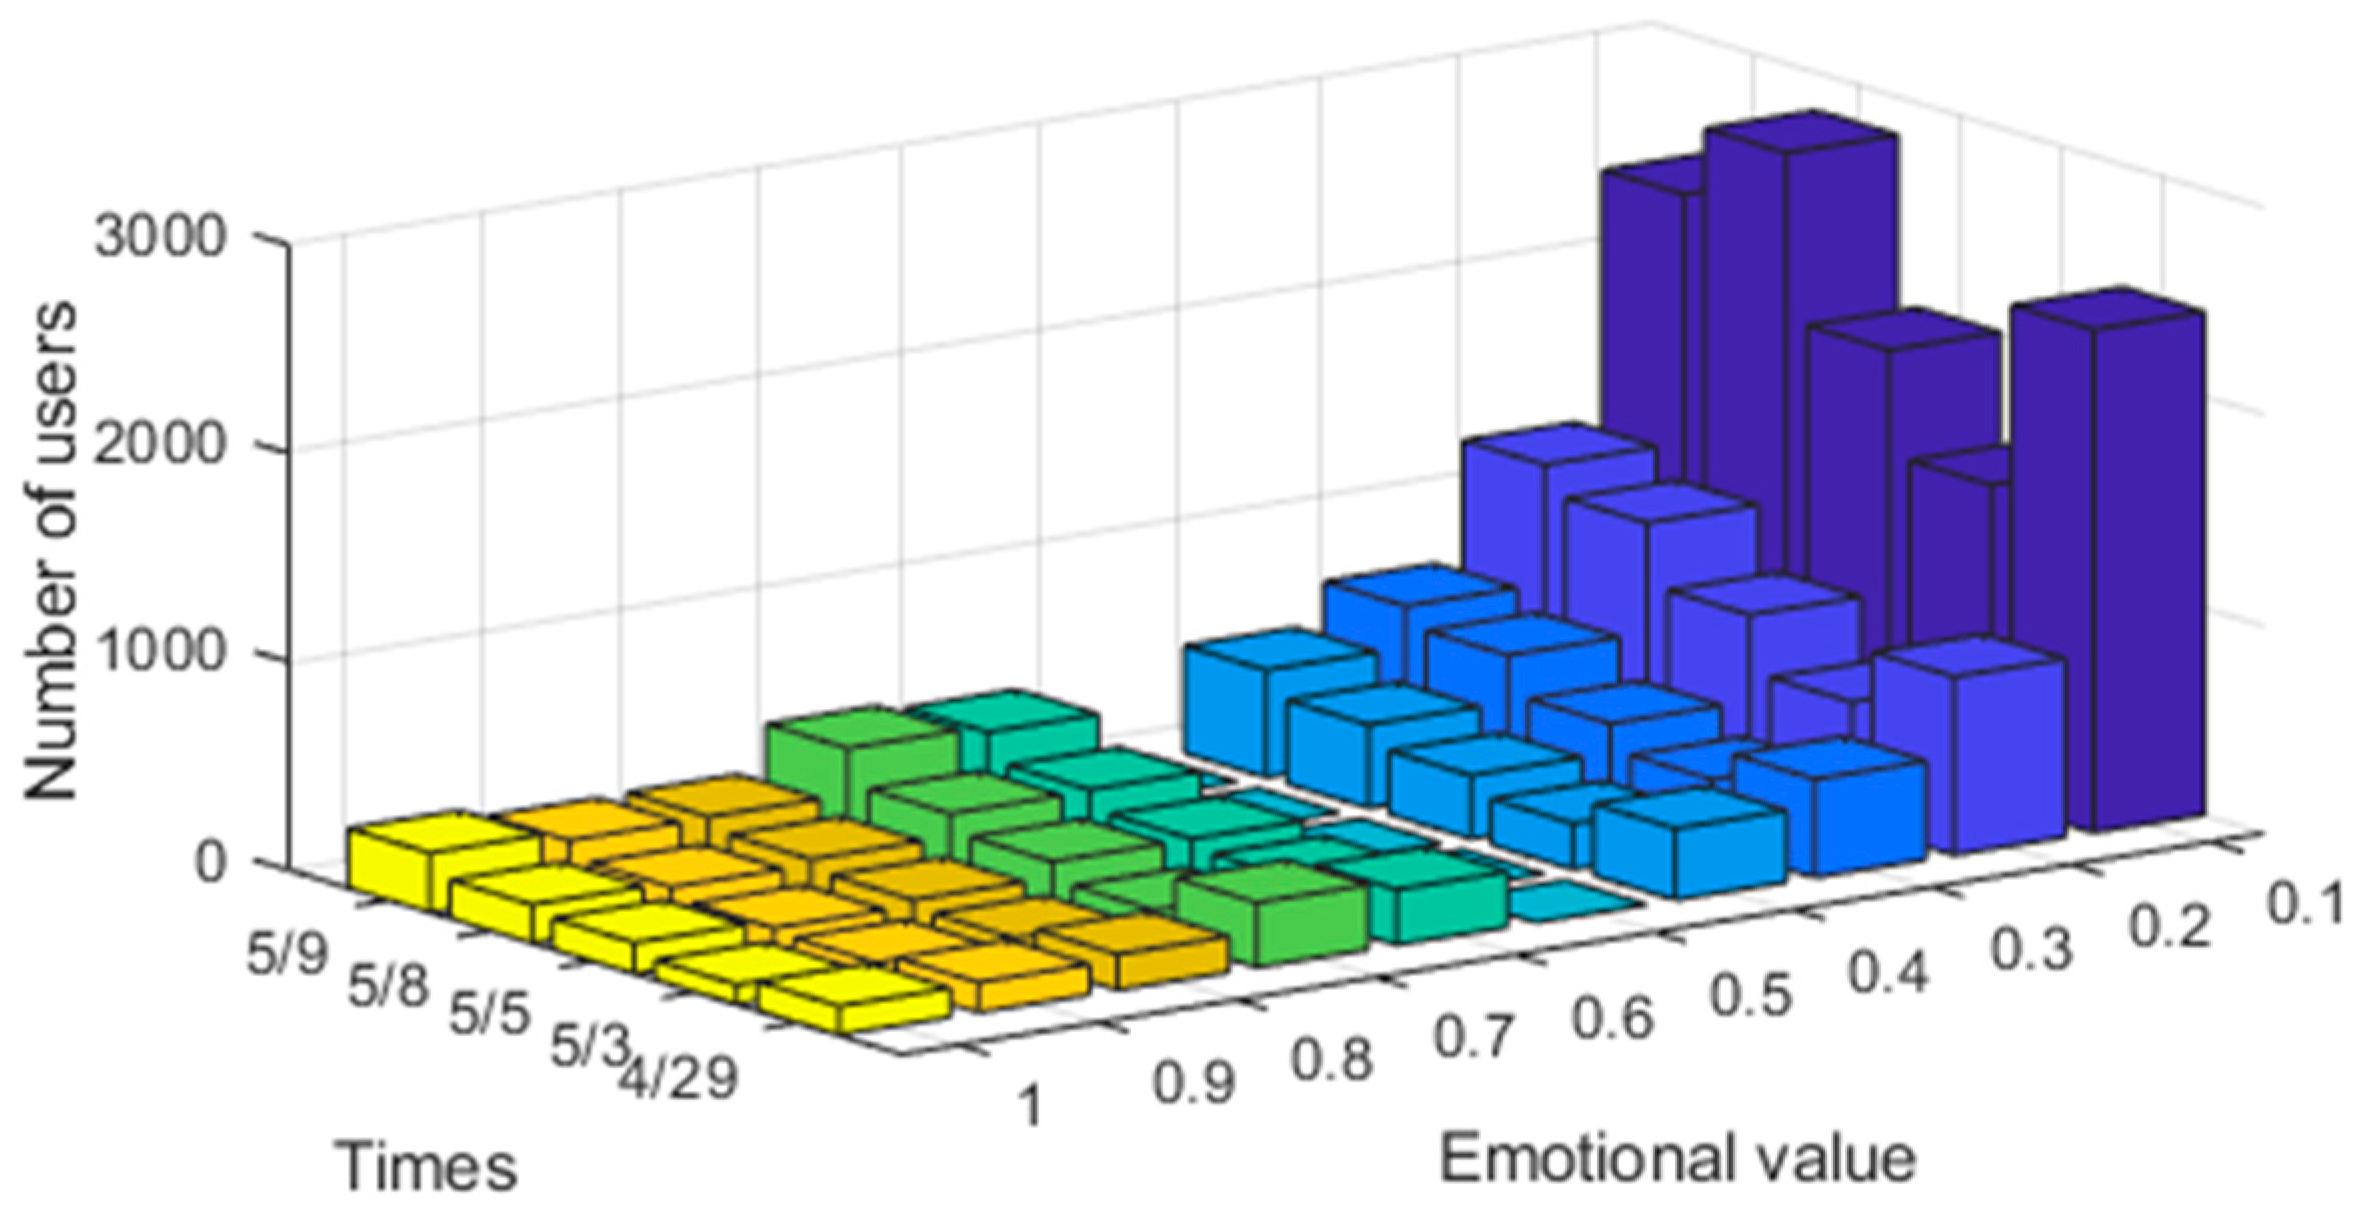
Firstly, the characteristics of the users were quantified according to the above-built model. User comment text was segmented using the Jieba tool and was scored through the natural language processing tool SnowNLP. The text emotional value
Q was quantified and mapped to [0,1] as the user’s emotional tendency. The specific distribution is shown in
Figure 3.
Figure 3 shows that in the initial stage of the “Hive Box charges”, most users’ emotional tendency was less than 0.1, a few users’ emotional value was 0.5, and a small number of users’ emotional value was more than 0.5. According to the calculation, 86.19% of users’ emotional value was less than 0.5, which shows that most users held a negative emotional tendency towards this event, while only a small number of users held a positive attitude, and almost no users held a neutral attitude. Subsequently, on 8 May, a number of communities in Hangzhou and Shanghai jointly boycotted Hive Box, and most of the negative emotions of users also reached a peak. It can be seen that this event had a great impact on the corporate image, and the user experience was very poor. In such a case, Hive Box enterprise would need to take immediate strategies to improve the user experience.
4.3. Classification of Risk Degree of User
With regard to the quantification of influence and activation, the influence
Y ∈ (0, 0.666709) and the activation
H ∈ (0, 0.83015) were calculated using the above Formulas (1) and (2), and then, the users participating in the public opinion discussion were classified according to the above classification criteria. The final results are shown in
Table 4.
Table 4 shows that most users were low-risk, and only a small number were high-risk, accounting for only 0.058% ratio, which indicates that although the majority of users held a negative opinion, most of them were ordinary users in the network with limited influence and were not significant enough to become high-risk users. Based on this, in order to prevent the continuous spread of negative public opinions, Hive Box enterprise could focus on monitoring the high-risk users and improving user experience.
4.4. Selecting Training Set and Test Data for Random Forest Algorithm
According to the classification of data, influence Y, activation H, and emotional value Q were deemed as attributes, and a training set was randomly selected from the data classified using the user portrait technique. A random forest classifier was trained using the random forest algorithm. From the data excluding the training samples, 1000 pieces of data were randomly selected as the test sample to identify the corresponding category of each sample, and the recognition accuracy of the algorithm was calculated. The training set and test set were disjoint.
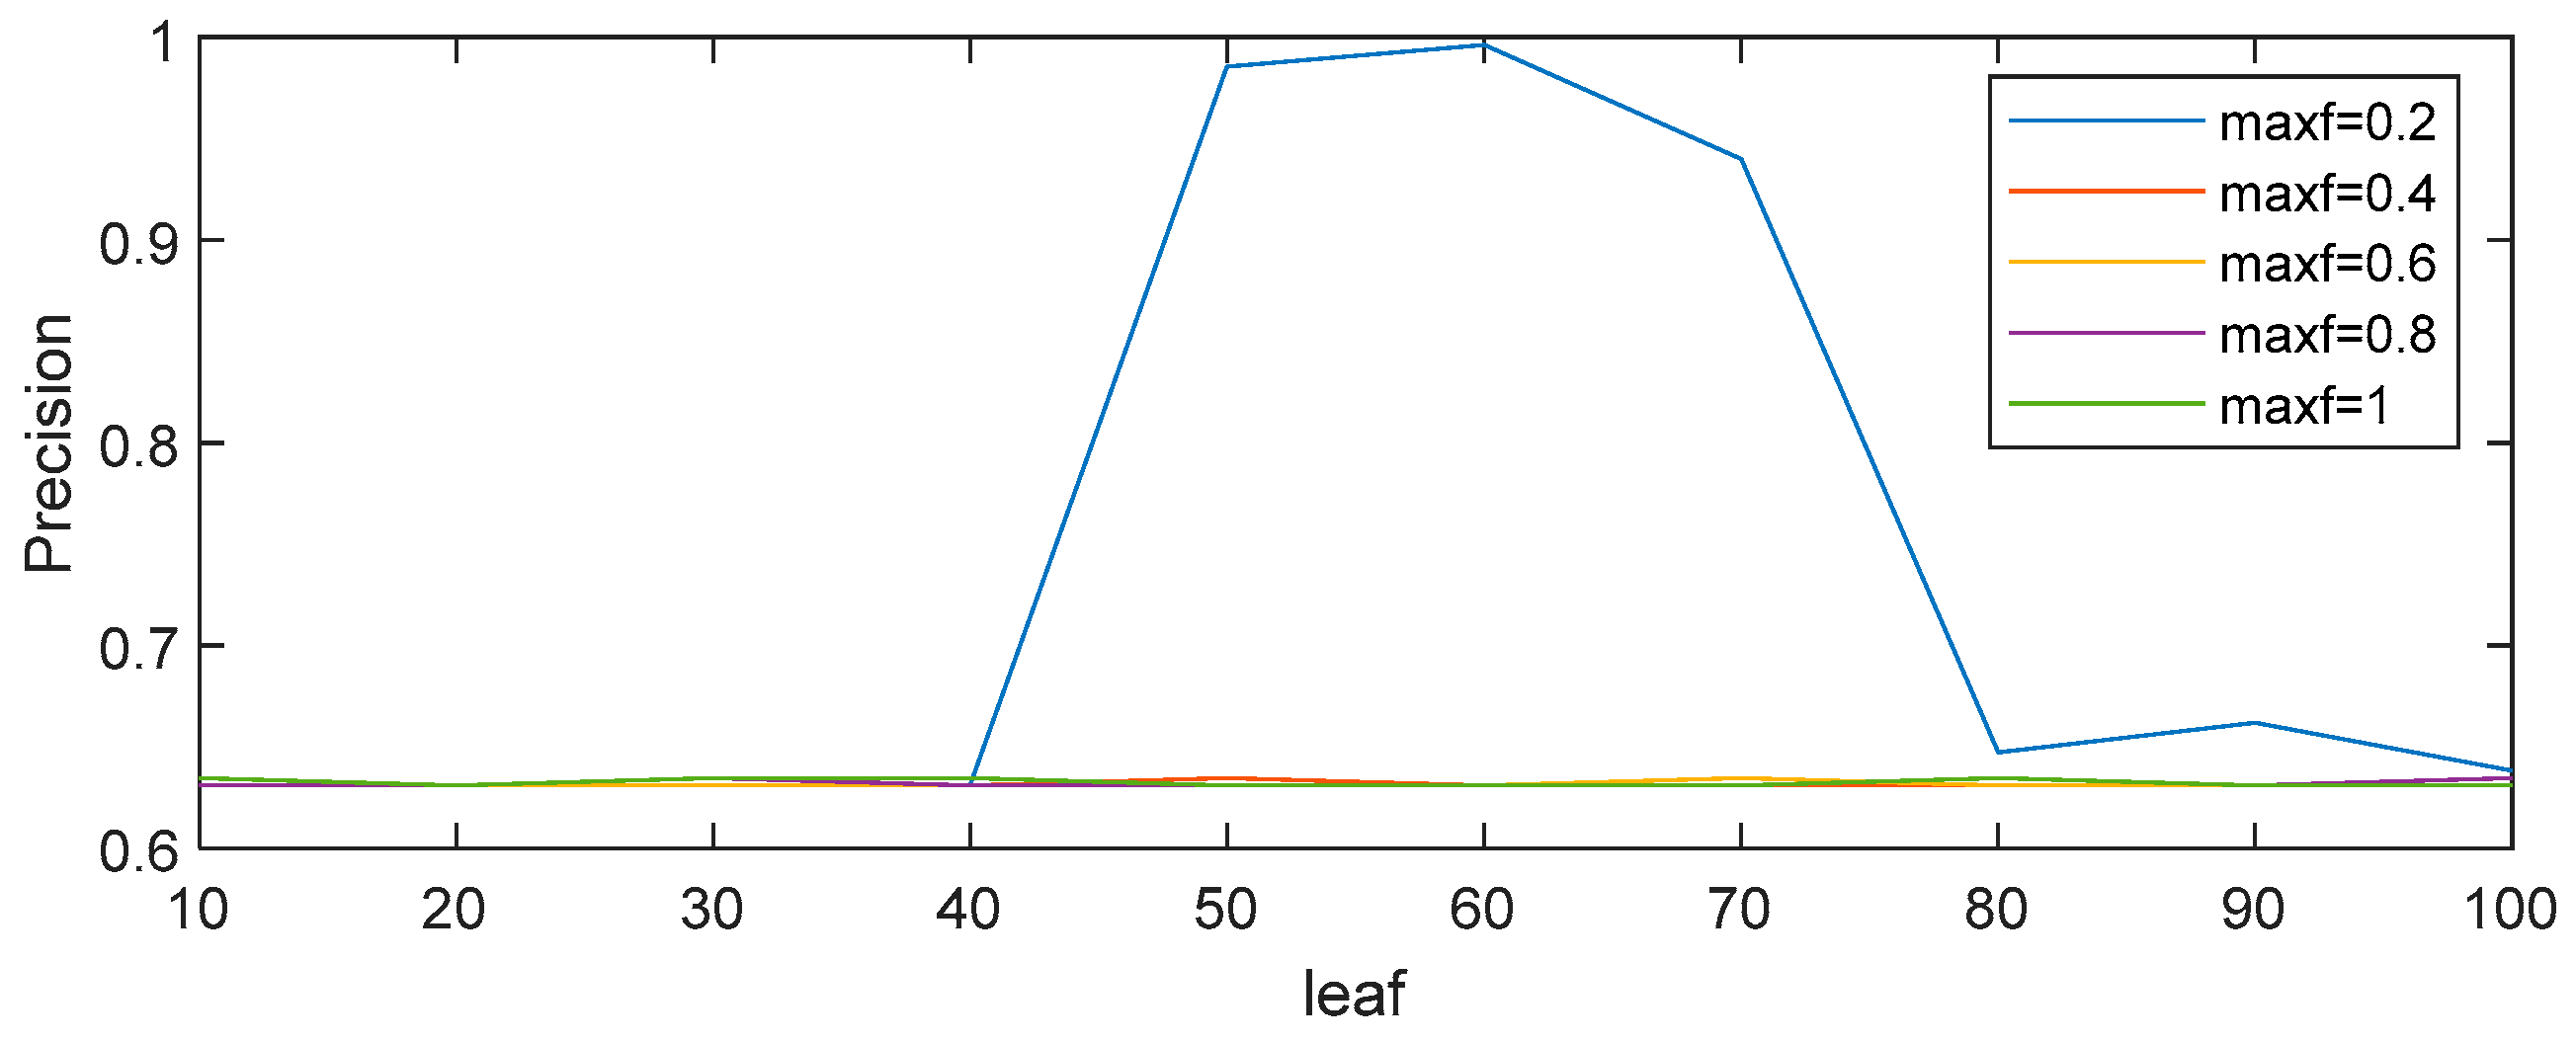
4.5. Simulating the Appropriate Parameters
As different parameters have a great influence on the random forest algorithm’s identification precision, different datasets generally use different values of parameters. Selecting appropriate parameters not only improves the identification precision of the algorithm but also speeds up the training. Therefore, four parameters in the random forest algorithm were simulated and analyzed: the number of decision trees (
nTree), the size of the training sample, the maximum number of features (
maxf), and the number of leaf nodes (
leaf). The suitable parameters for this case were determined by simulation analysis. The specific results are shown in
Figure 4 and
Figure 5.
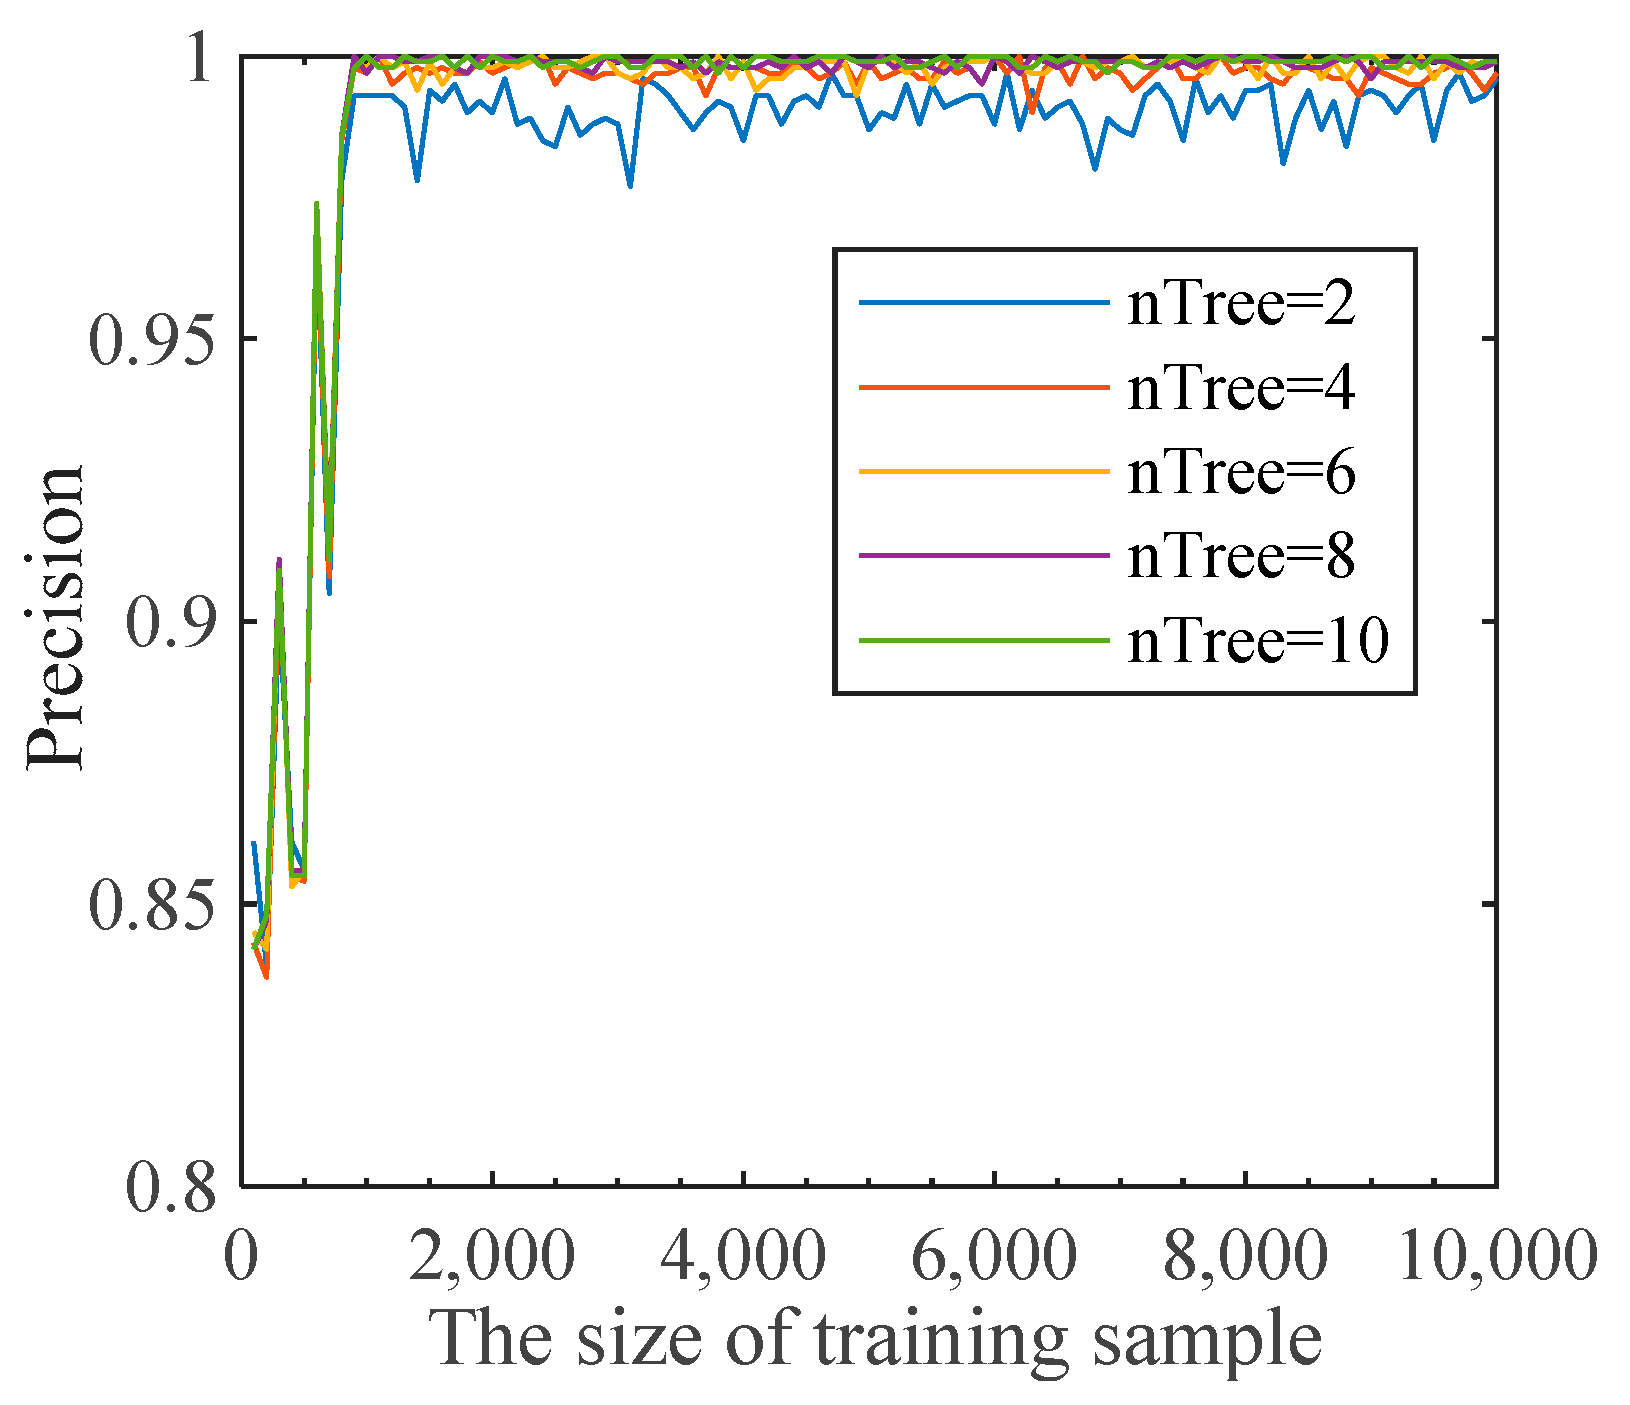
As can be seen from
Figure 4, when the training sample is small, the accuracy of recognition of the high-risk population fluctuates greatly. However, when the training sample is larger than 1000, the recognition accuracy fluctuates only slightly. Therefore, in reality, the high-risk population monitoring and identification model requires at least 1000 pieces of data. Since there are enough data crawled in this paper, 10,000 pieces of data were selected as the training sample. In addition, with the increase in the number of decision trees in the random forest, the recognition accuracy is further improved, but at the same time, the running speed needs to be taken into account. Therefore,
nTree = 10 was selected for training. As shown in
Figure 5, only when
maxf = 0.2 will the prediction accuracy change, and when
leaf =60, the identification accuracy will be the highest. Therefore, in this case, our simulation set the parameters
maxf = 0.2 and
leaf = 60. Based on the above simulation results, the parameter settings are shown in
Table 5 below.
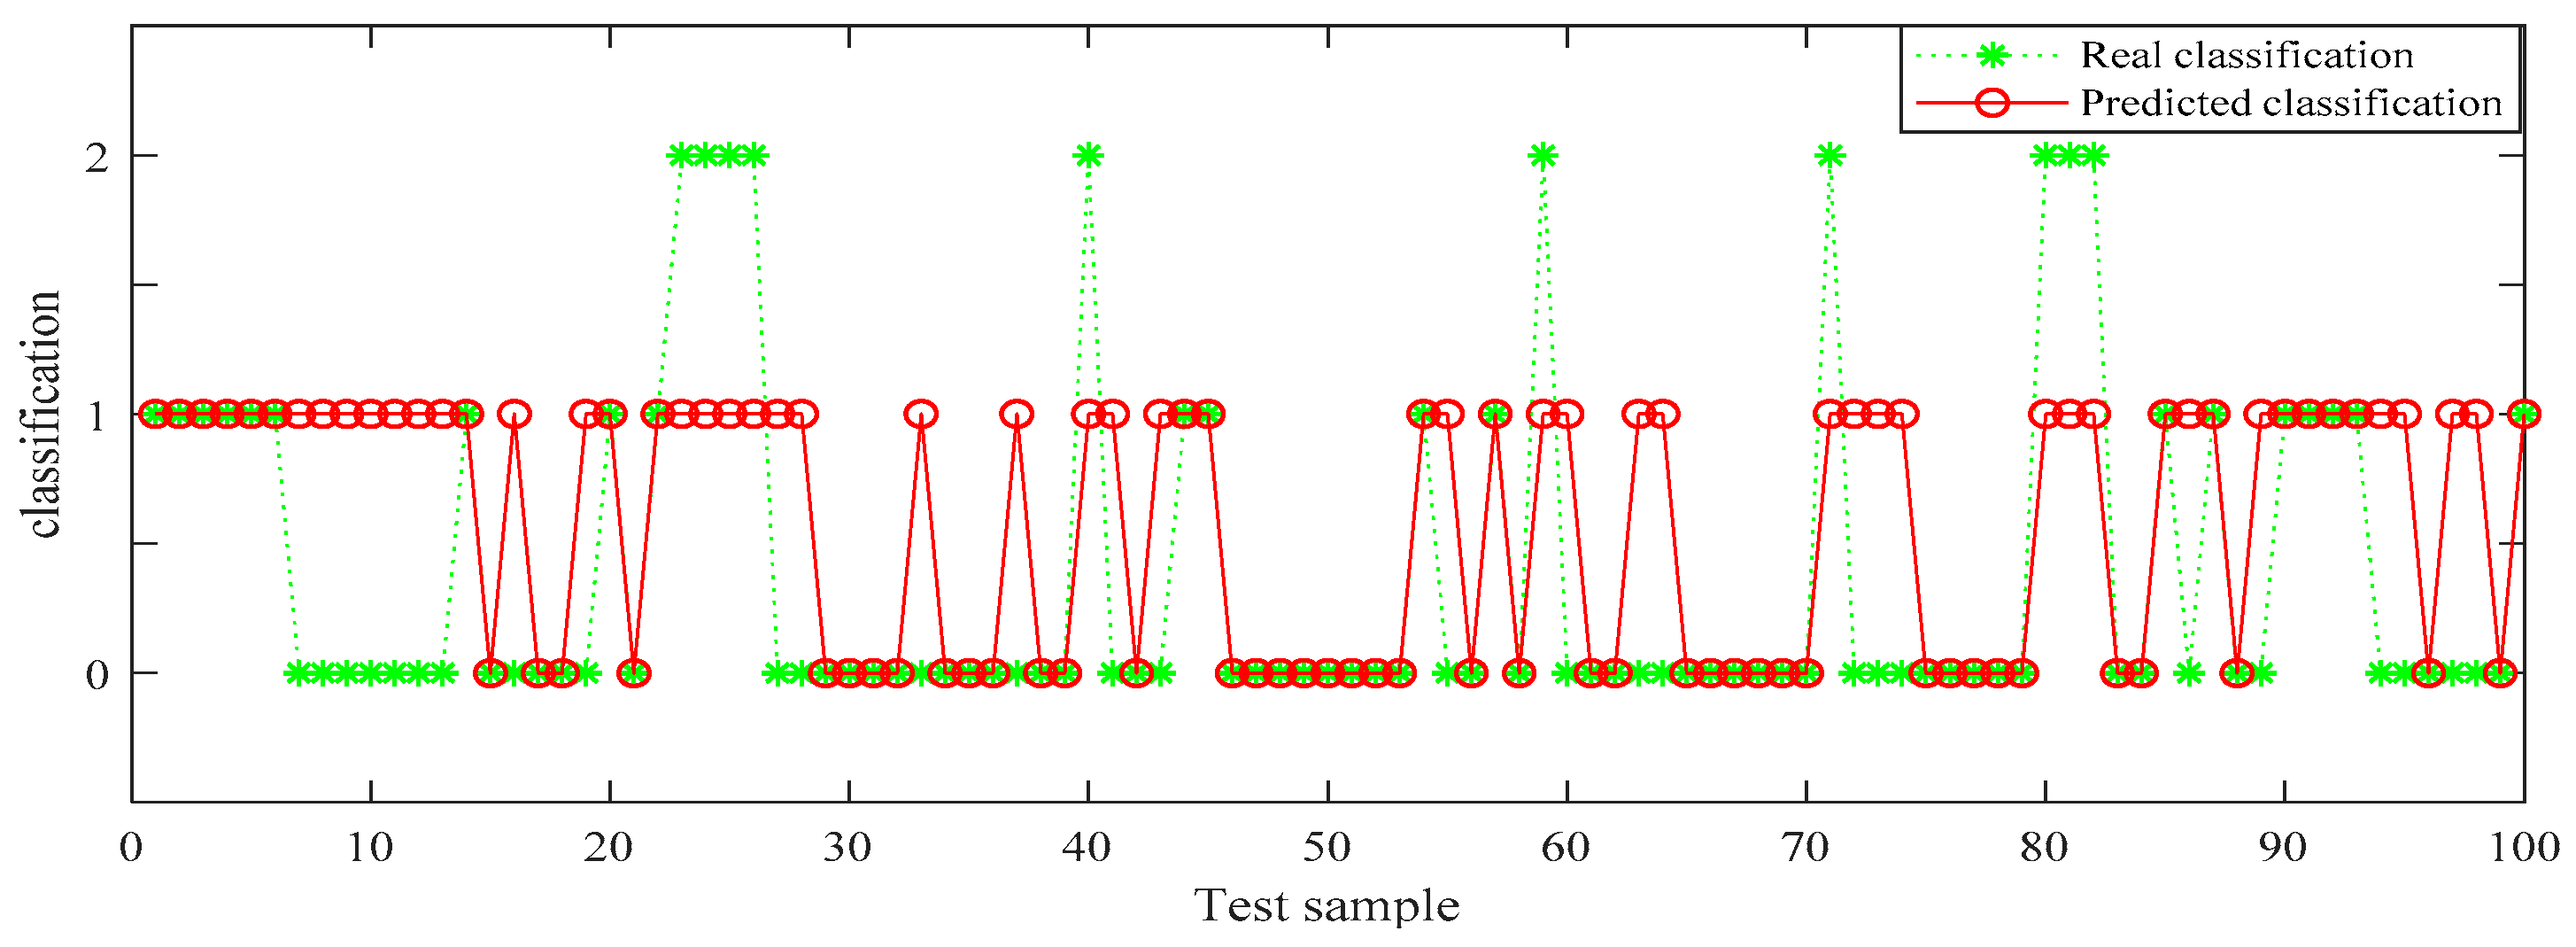
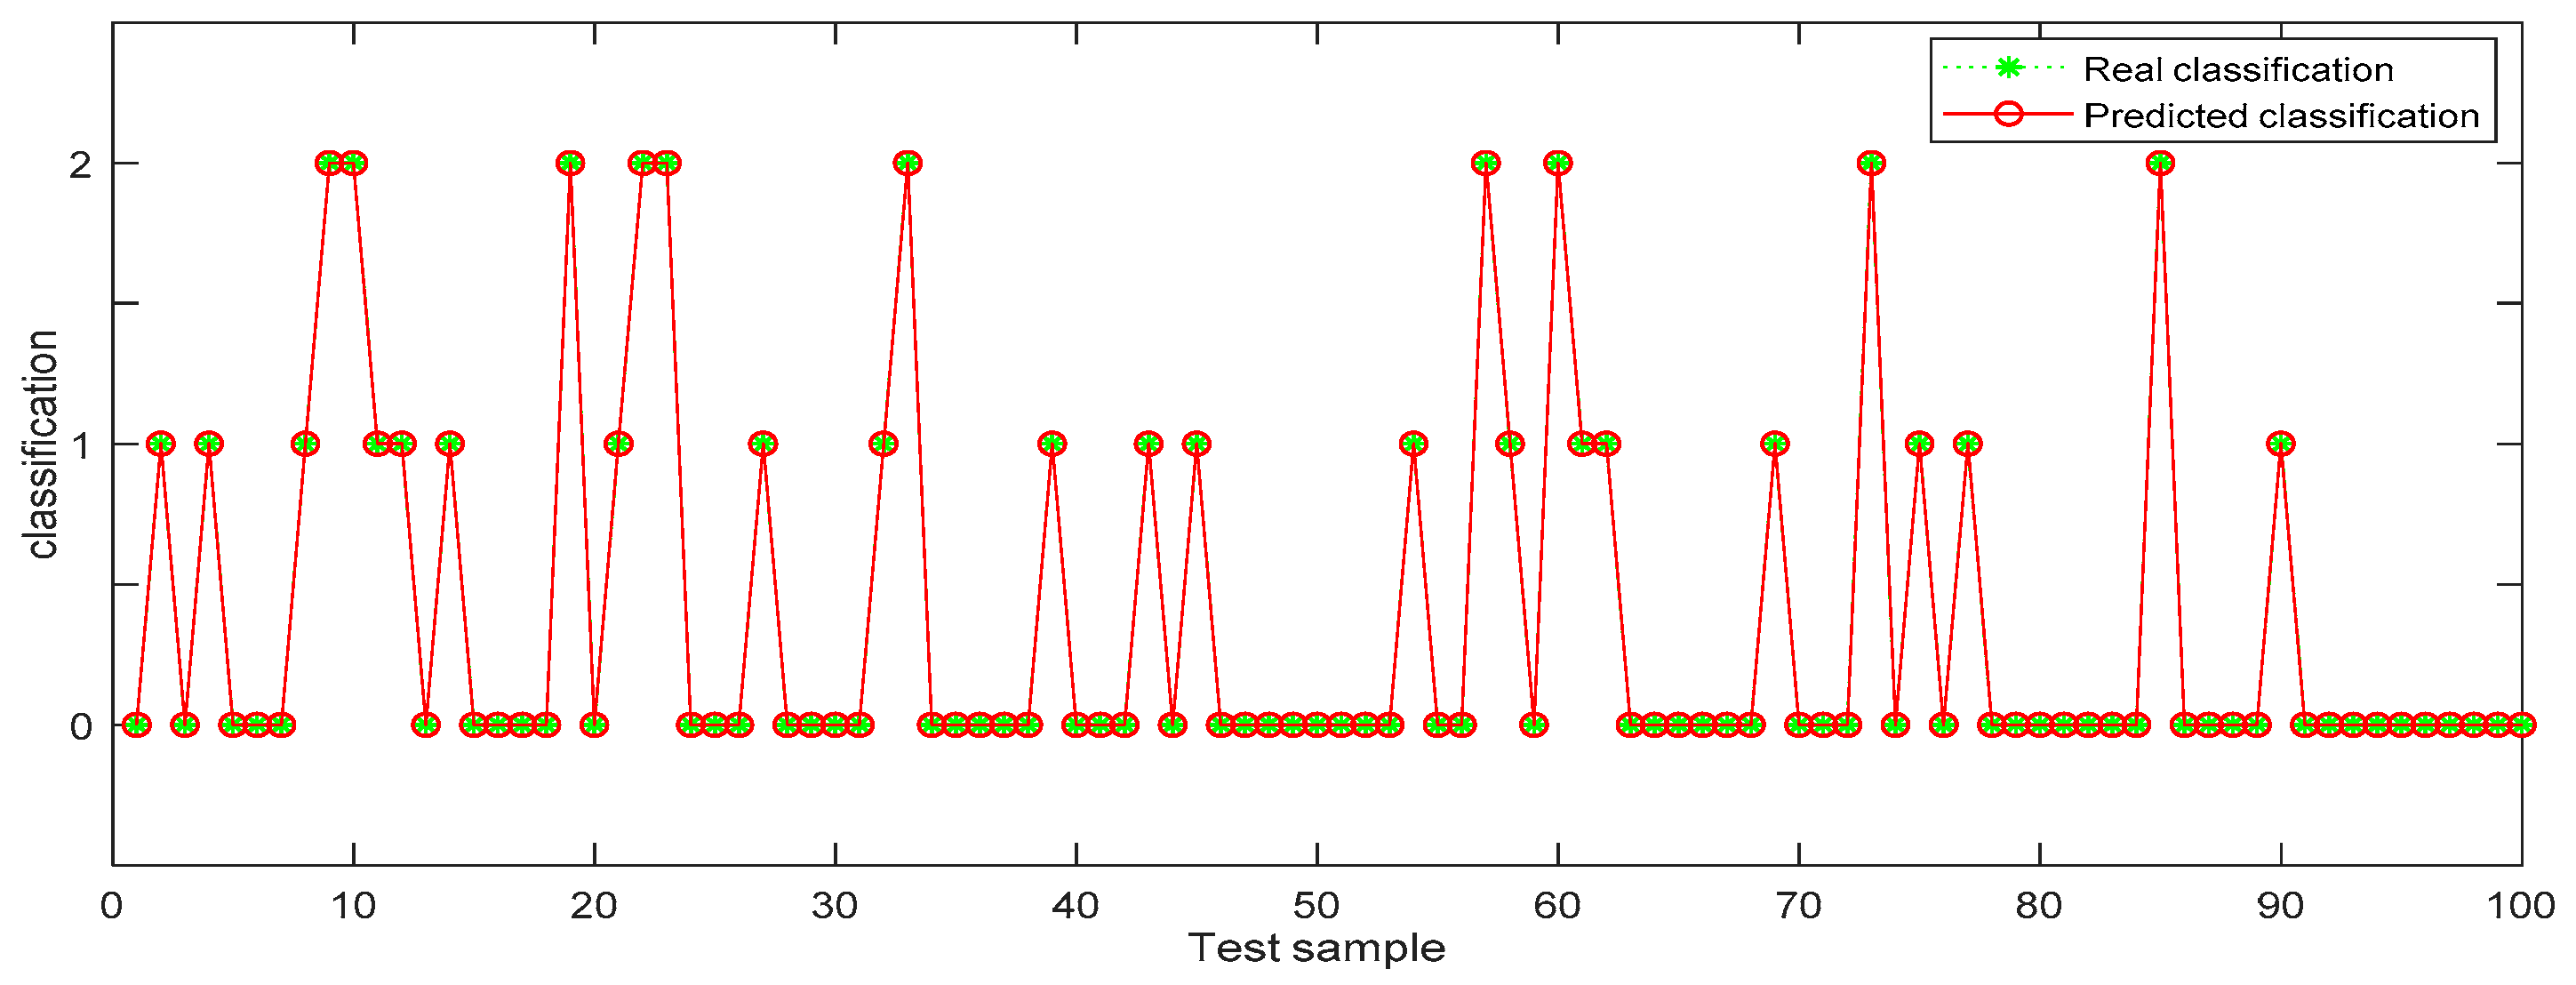
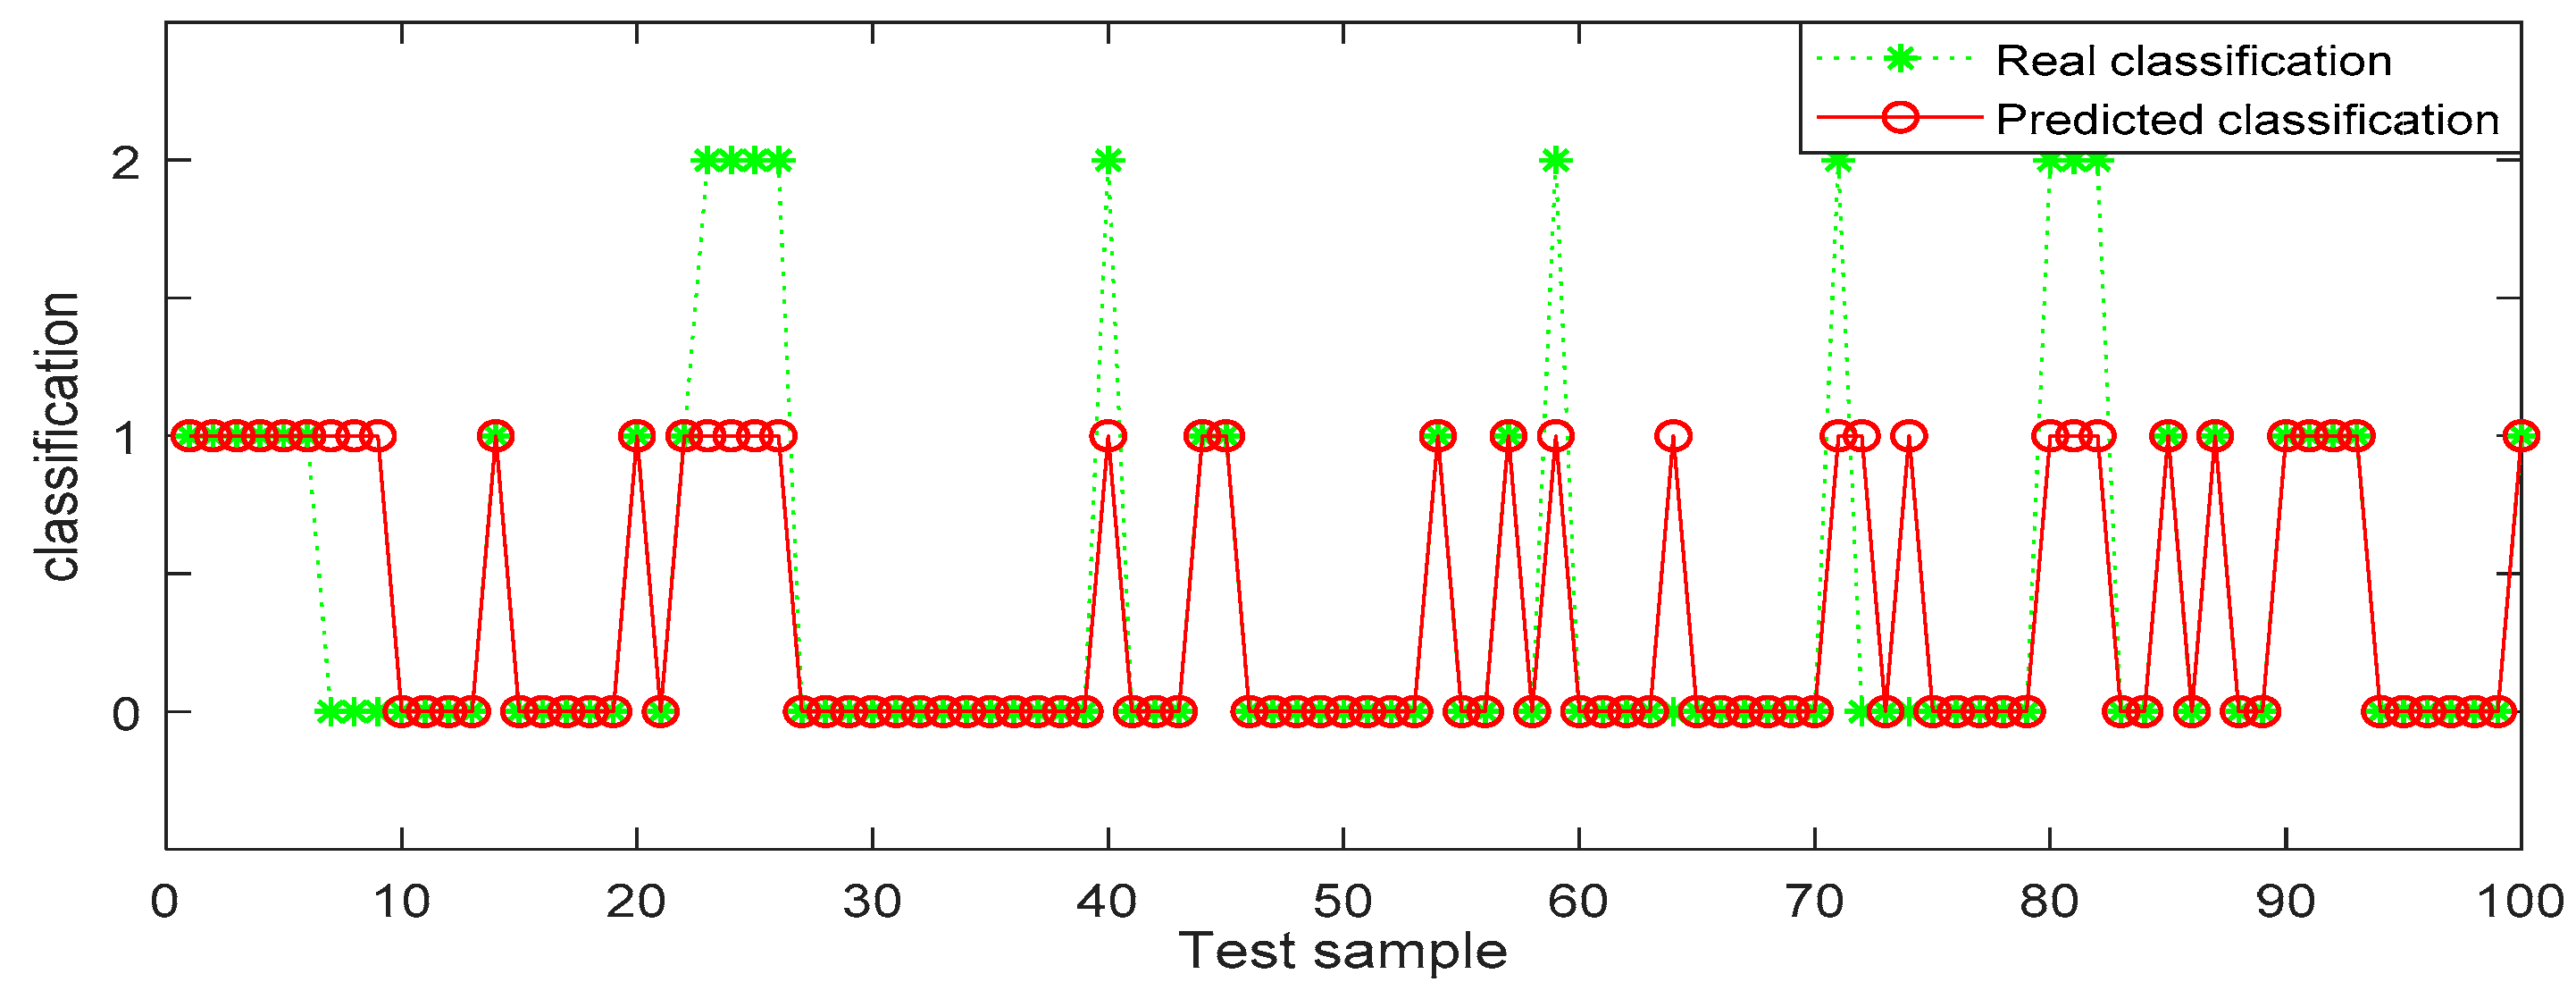
4.6. Training Random Forest Classifier and Comparing the Results with BP Neural Network
The trained classifier was used to identify the test samples. In order to improve the reliability of the results, 2000 pieces of data were randomly selected as the test set and divided into two groups. BP neural network and random forest were used to identify the samples, respectively, and the identification accuracy is shown in
Table 6.
In
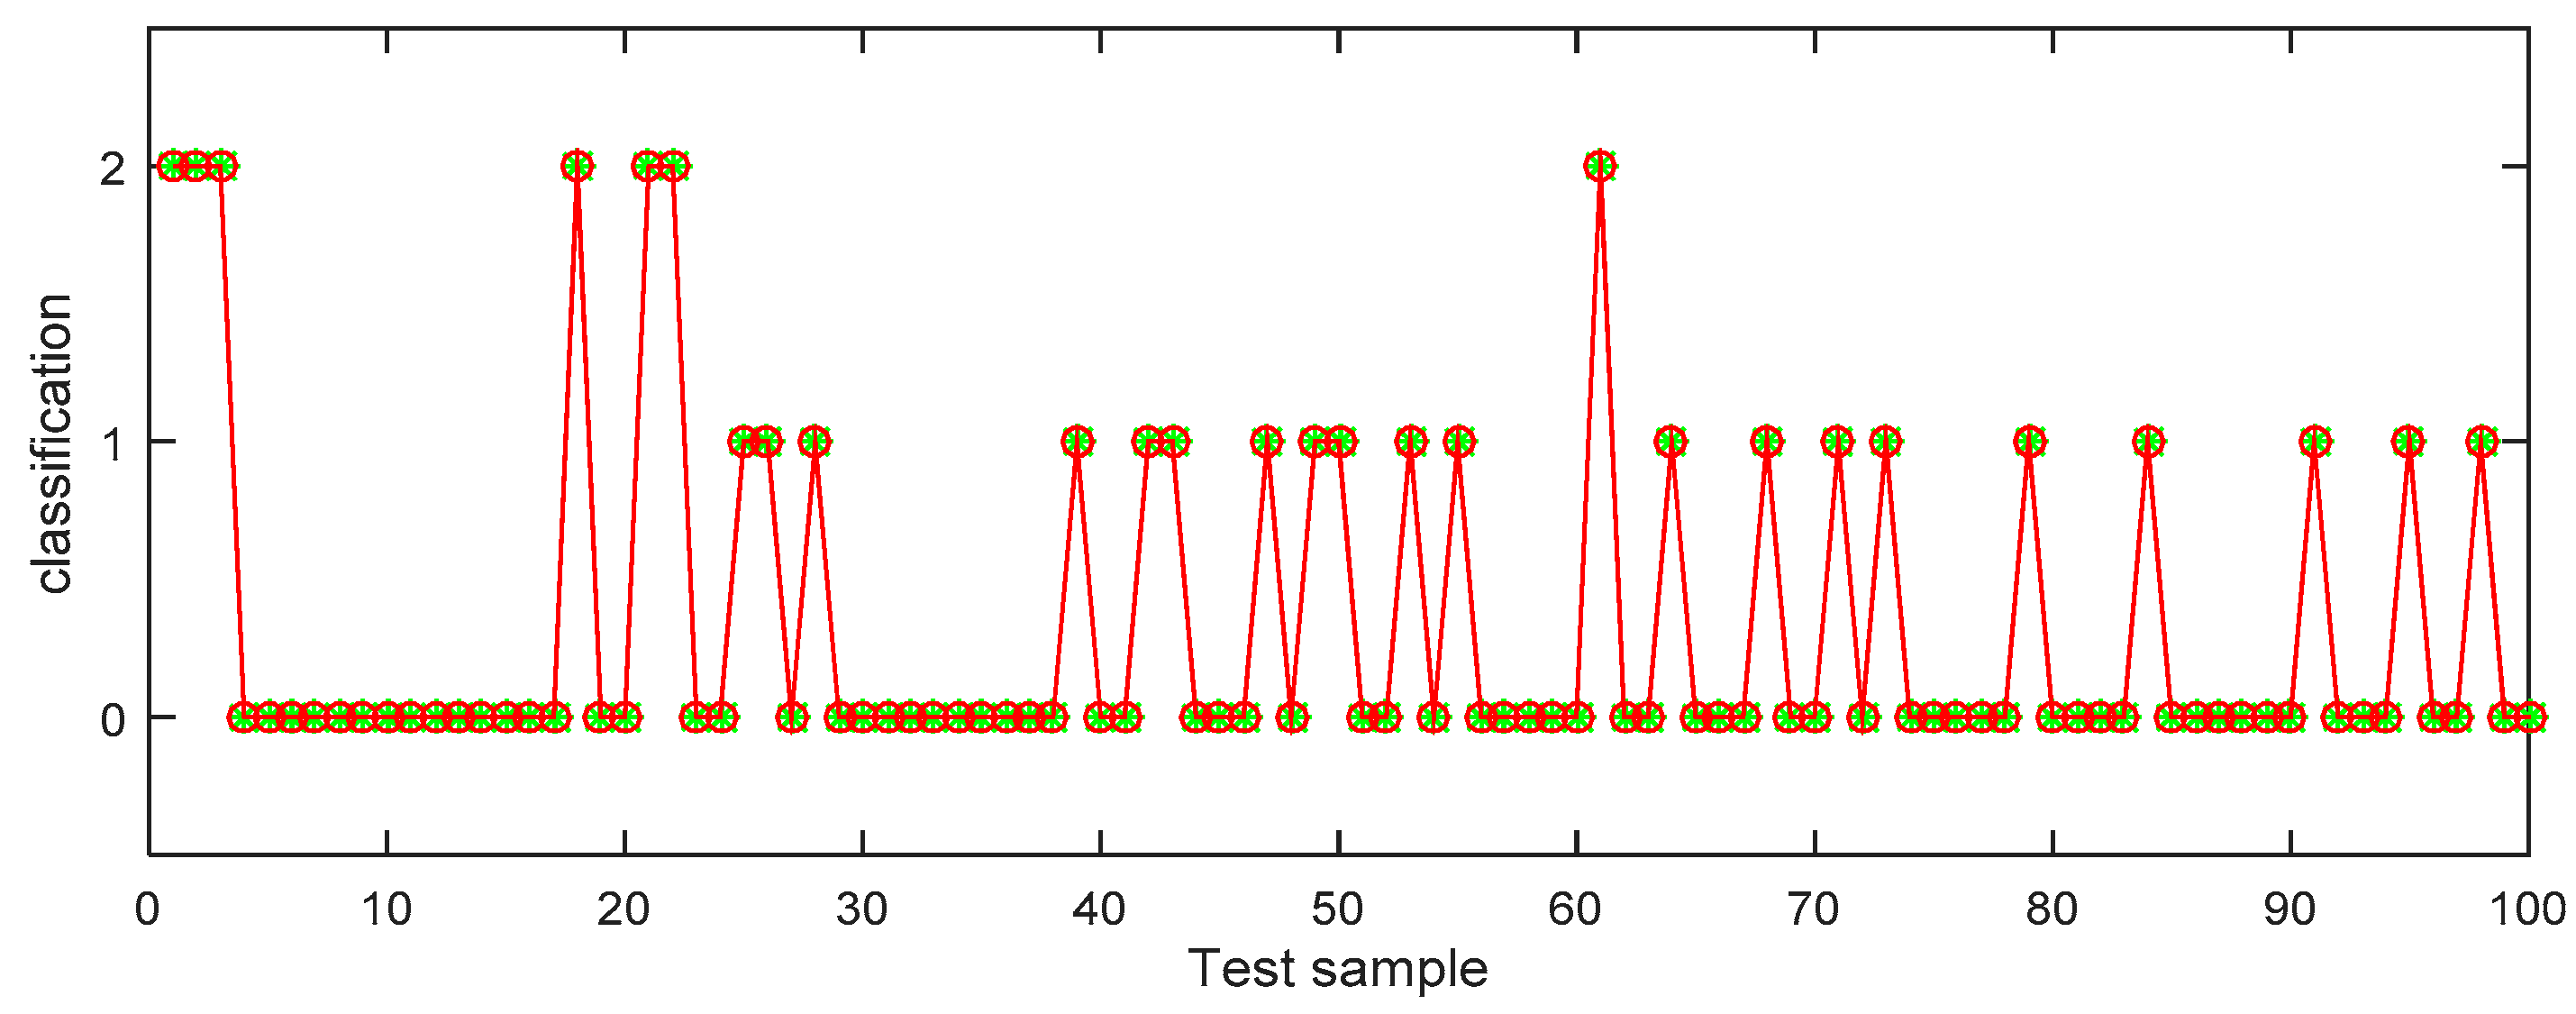
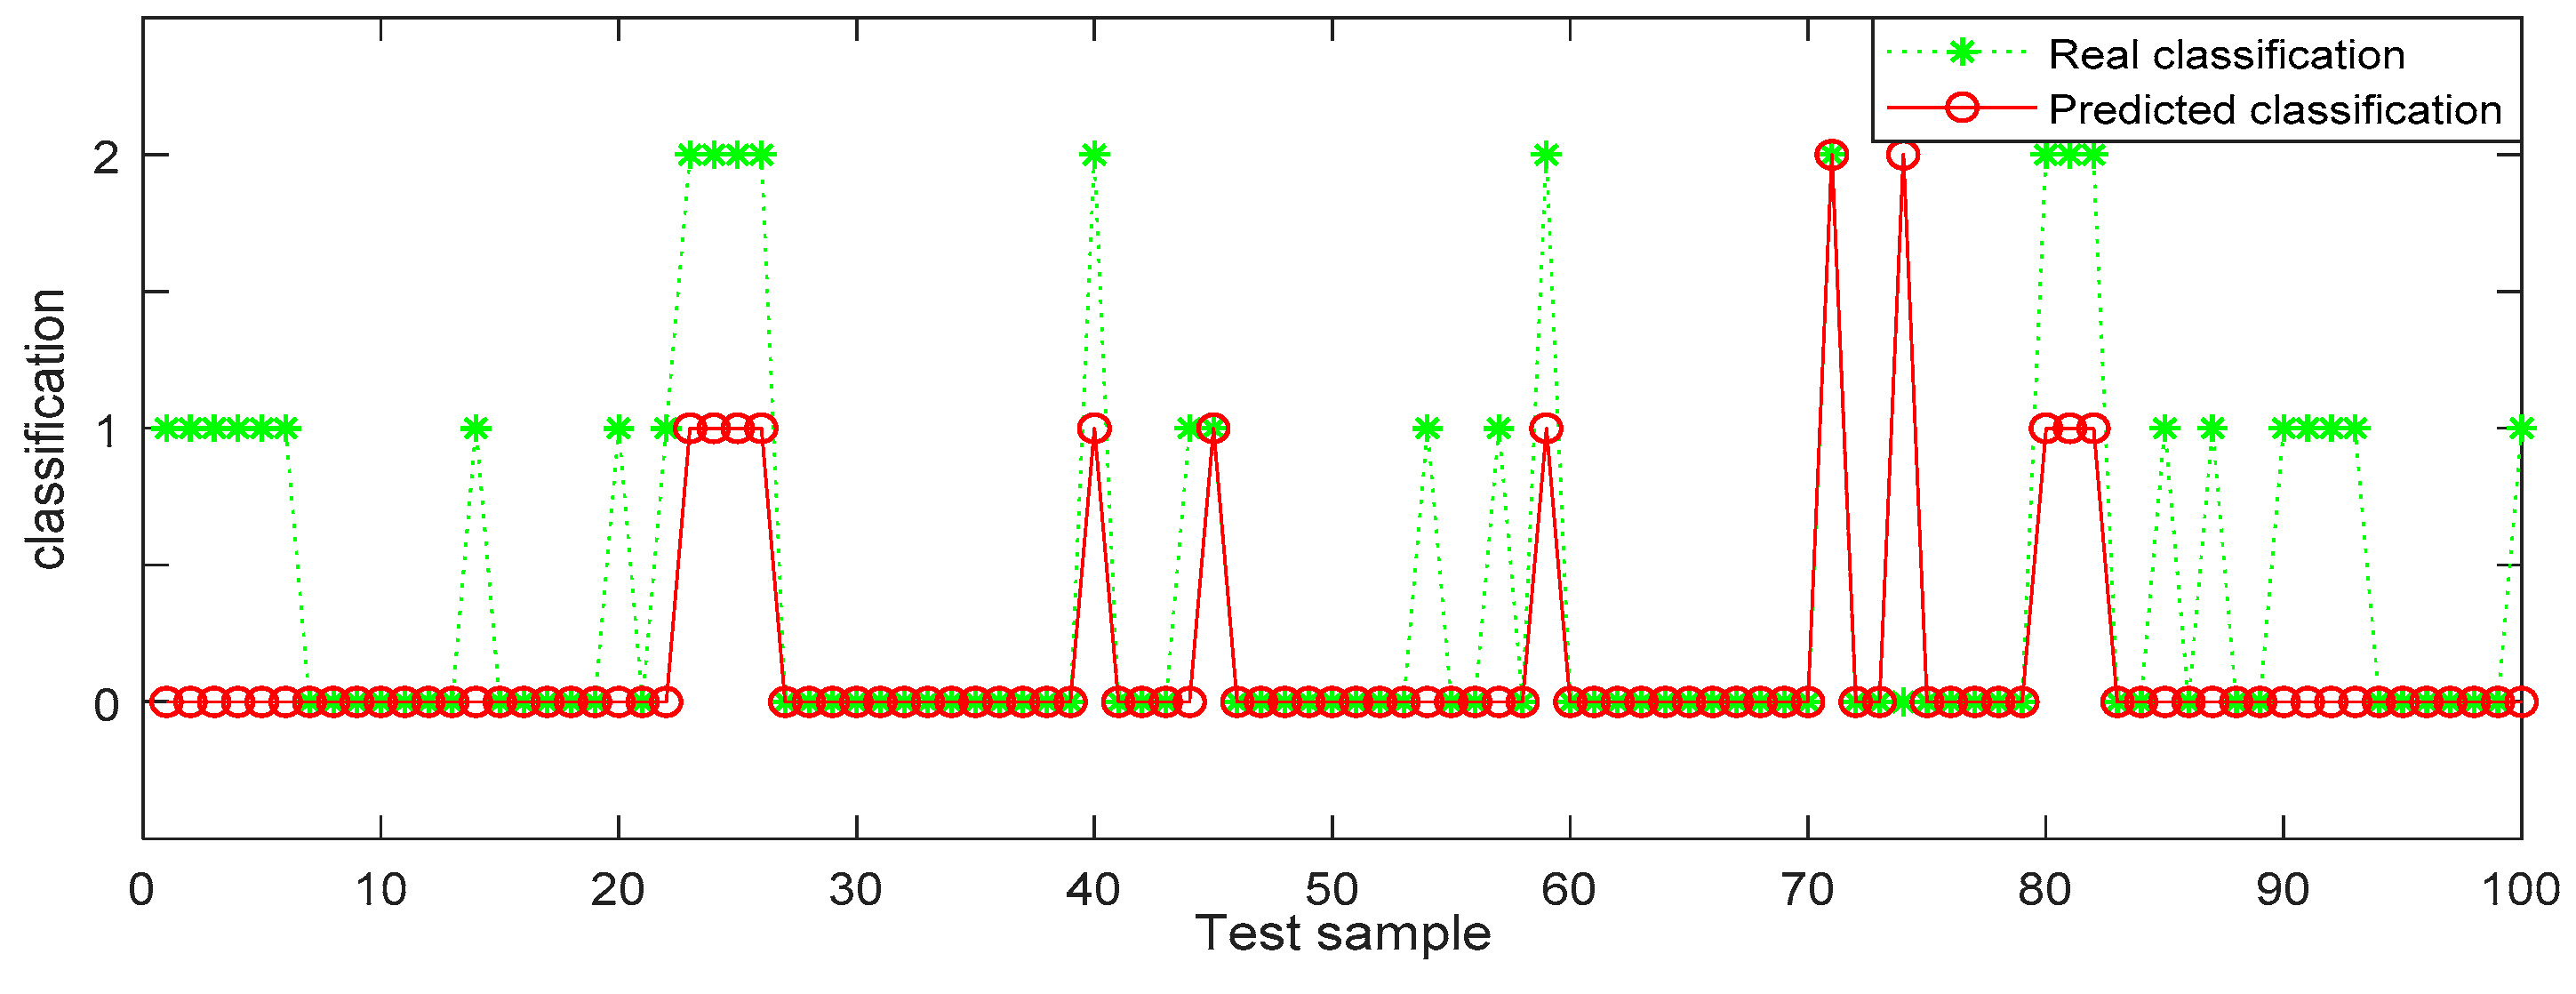
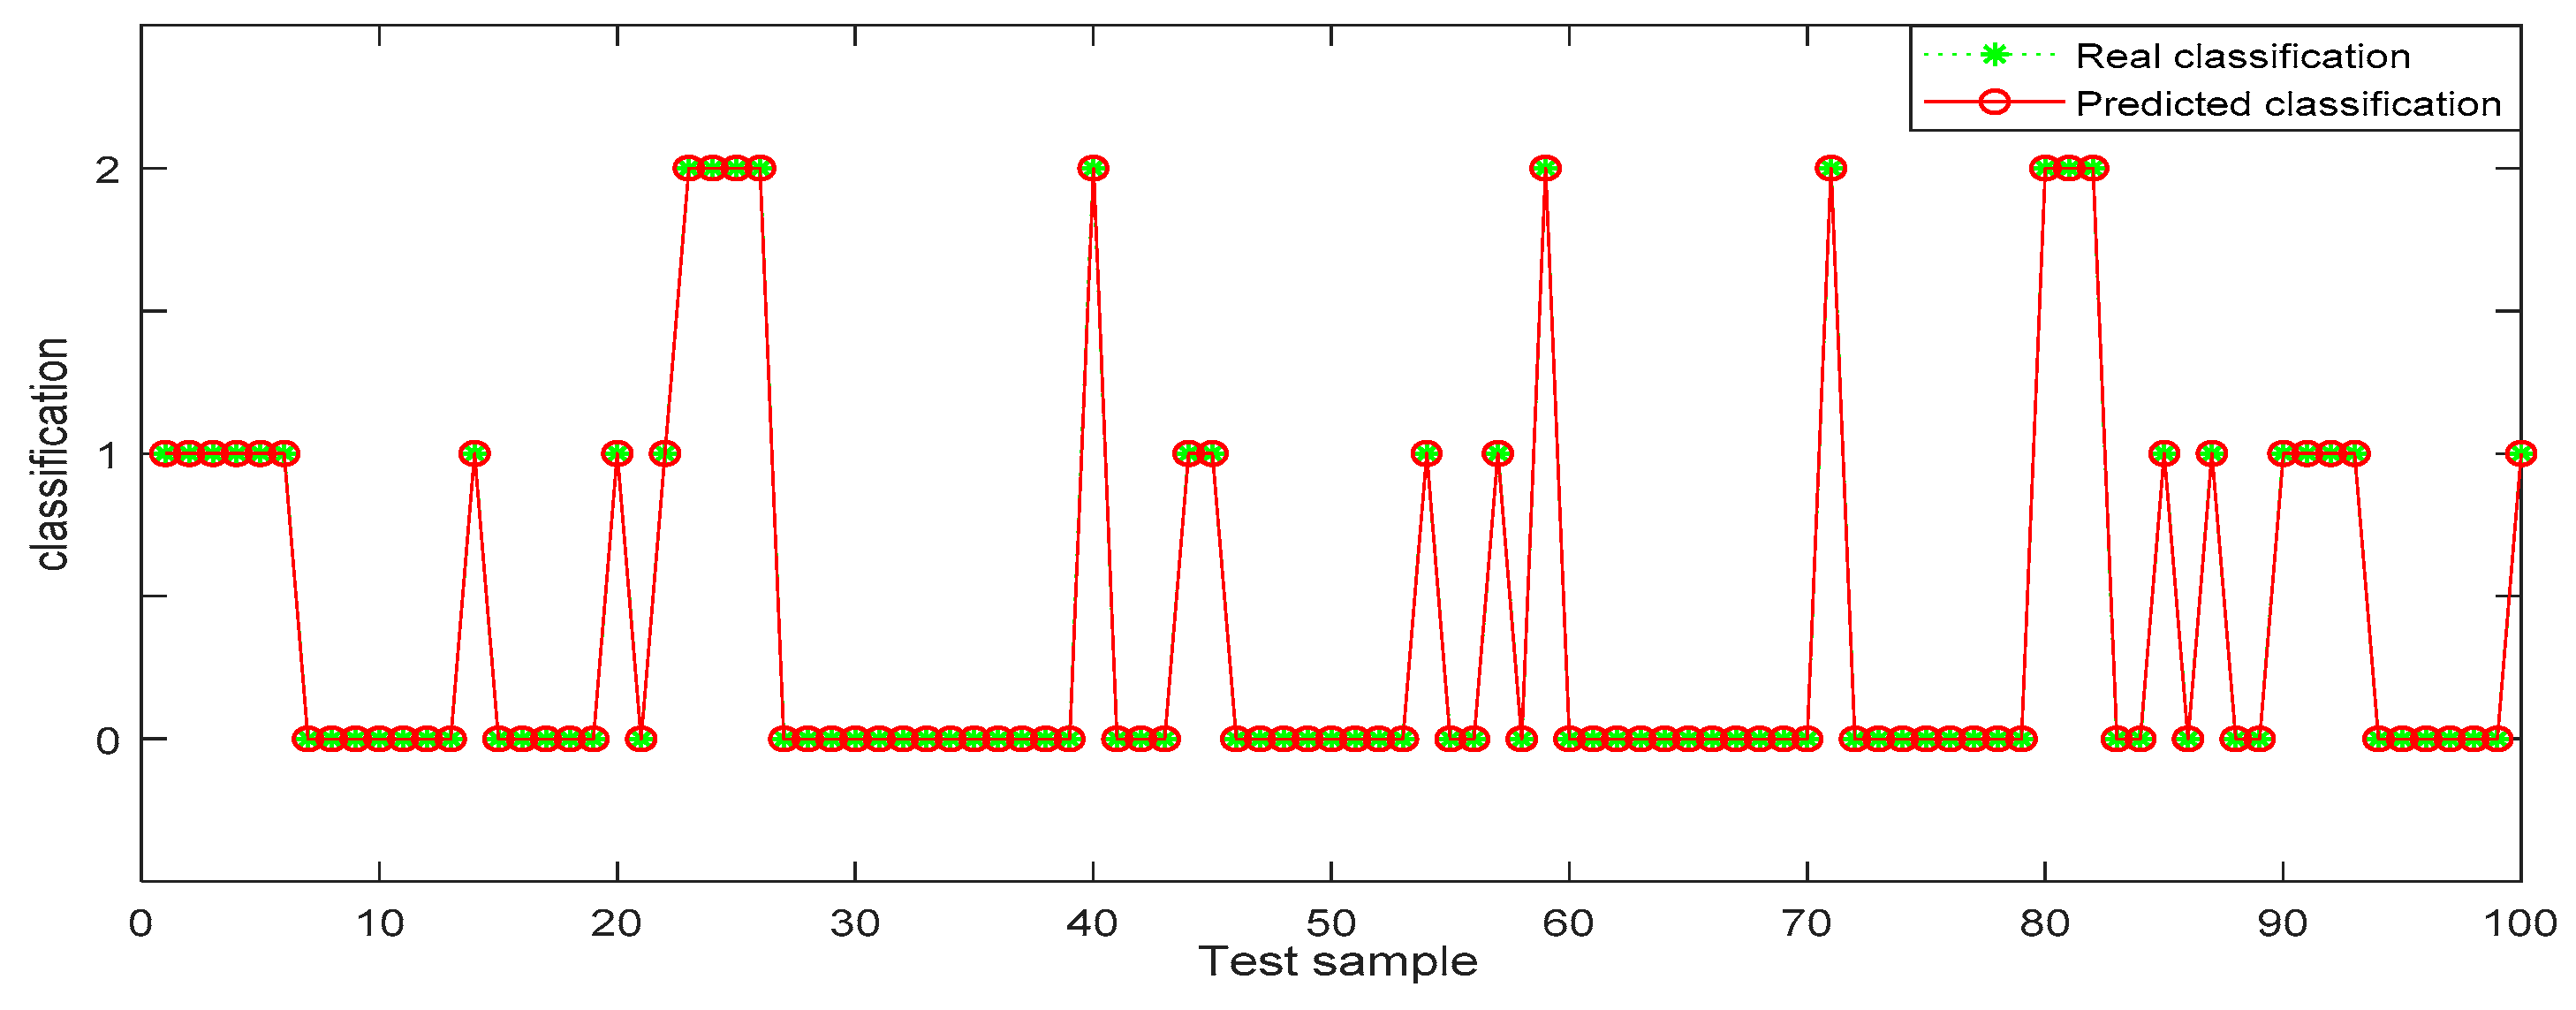
Table 6, the identification accuracy of random forest in the three datasets is much higher than that of BP neural network. The average identification accuracy of random forest is 98.49%, while the average accuracy of BP neural network is only 72.33%. Since 1000 pieces of data are too large an amount, in order to better visualize the identification results, 100 pieces of data were selected from each dataset for display. The results are shown in
Figure 6,
Figure 7,
Figure 8,
Figure 9,
Figure 10 and
Figure 11.
In the three datasets, most of the users who made comments are low-risk users, while only a small number of users are high-risk users, which is also consistent with the data characteristics in
Section 4.3 above. In the 100 test samples of
Figure 6,
Figure 7,
Figure 8,
Figure 9,
Figure 10 and
Figure 11, the category of users identified by random forest is consistent with the real category, but the recognition results from BP (back propagation) neural network are only partially accurate. This suggests that the random forest identification method has higher accuracy and feasibility, which can be used for identifying high-risk users in public opinion discussions of an enterprise network.
4.7. Discussion
User portrait technology and the random forest algorithm were used to monitor and identify the public opinion events related to “Hive Box charges”. The related discussions are as follows:
- (1)
When the sample size is big enough, the results of training indicate a dependence of precision on the training sample size. However, if the sample size is small, the result of training will be influenced by the size of the sample. This may be due to contingency. Therefore, we tested different sample sizes and demonstrated that the required sample size is at least above 1000 in the “Hive Box charges” public opinion event, and the identification accuracy will not be affected by the sample size;
- (2)
With regard to the “Hive Box charges” public opinion event, although 86.19% of the users participating in the discussion held negative emotions, most of them were low-risk users and only 0.058% were high-risk users. Therefore, monitoring the public opinion of high-risk groups could greatly save the costs of public opinion control of the enterprise;
- (3)
In the random forest algorithm, the final result is the average output result of each decision tree. Generally speaking, the larger the number of decision trees is, the stronger the robustness and the higher the accuracy of the random forest algorithm are. However, if the number of decision trees is too large, it is easy to increase the correlation between the trees and increase the running time of the algorithm. Therefore, determining the appropriate number of decision trees is helpful to improve accuracy and efficiency. Our simulation showed that in the “Hive Box charges” public opinion event, the appropriate number of decision trees is 10;
- (4)
Compared with the BP neural network algorithm, the random forest algorithm used in this paper has a higher identification accuracy and is better for identifying high-risk groups of enterprise public opinion.


 ,
, 


