
Evidence of Noisy Oscillations of cAMP under Nutritional Stress Condition in Budding Yeast
 , , and
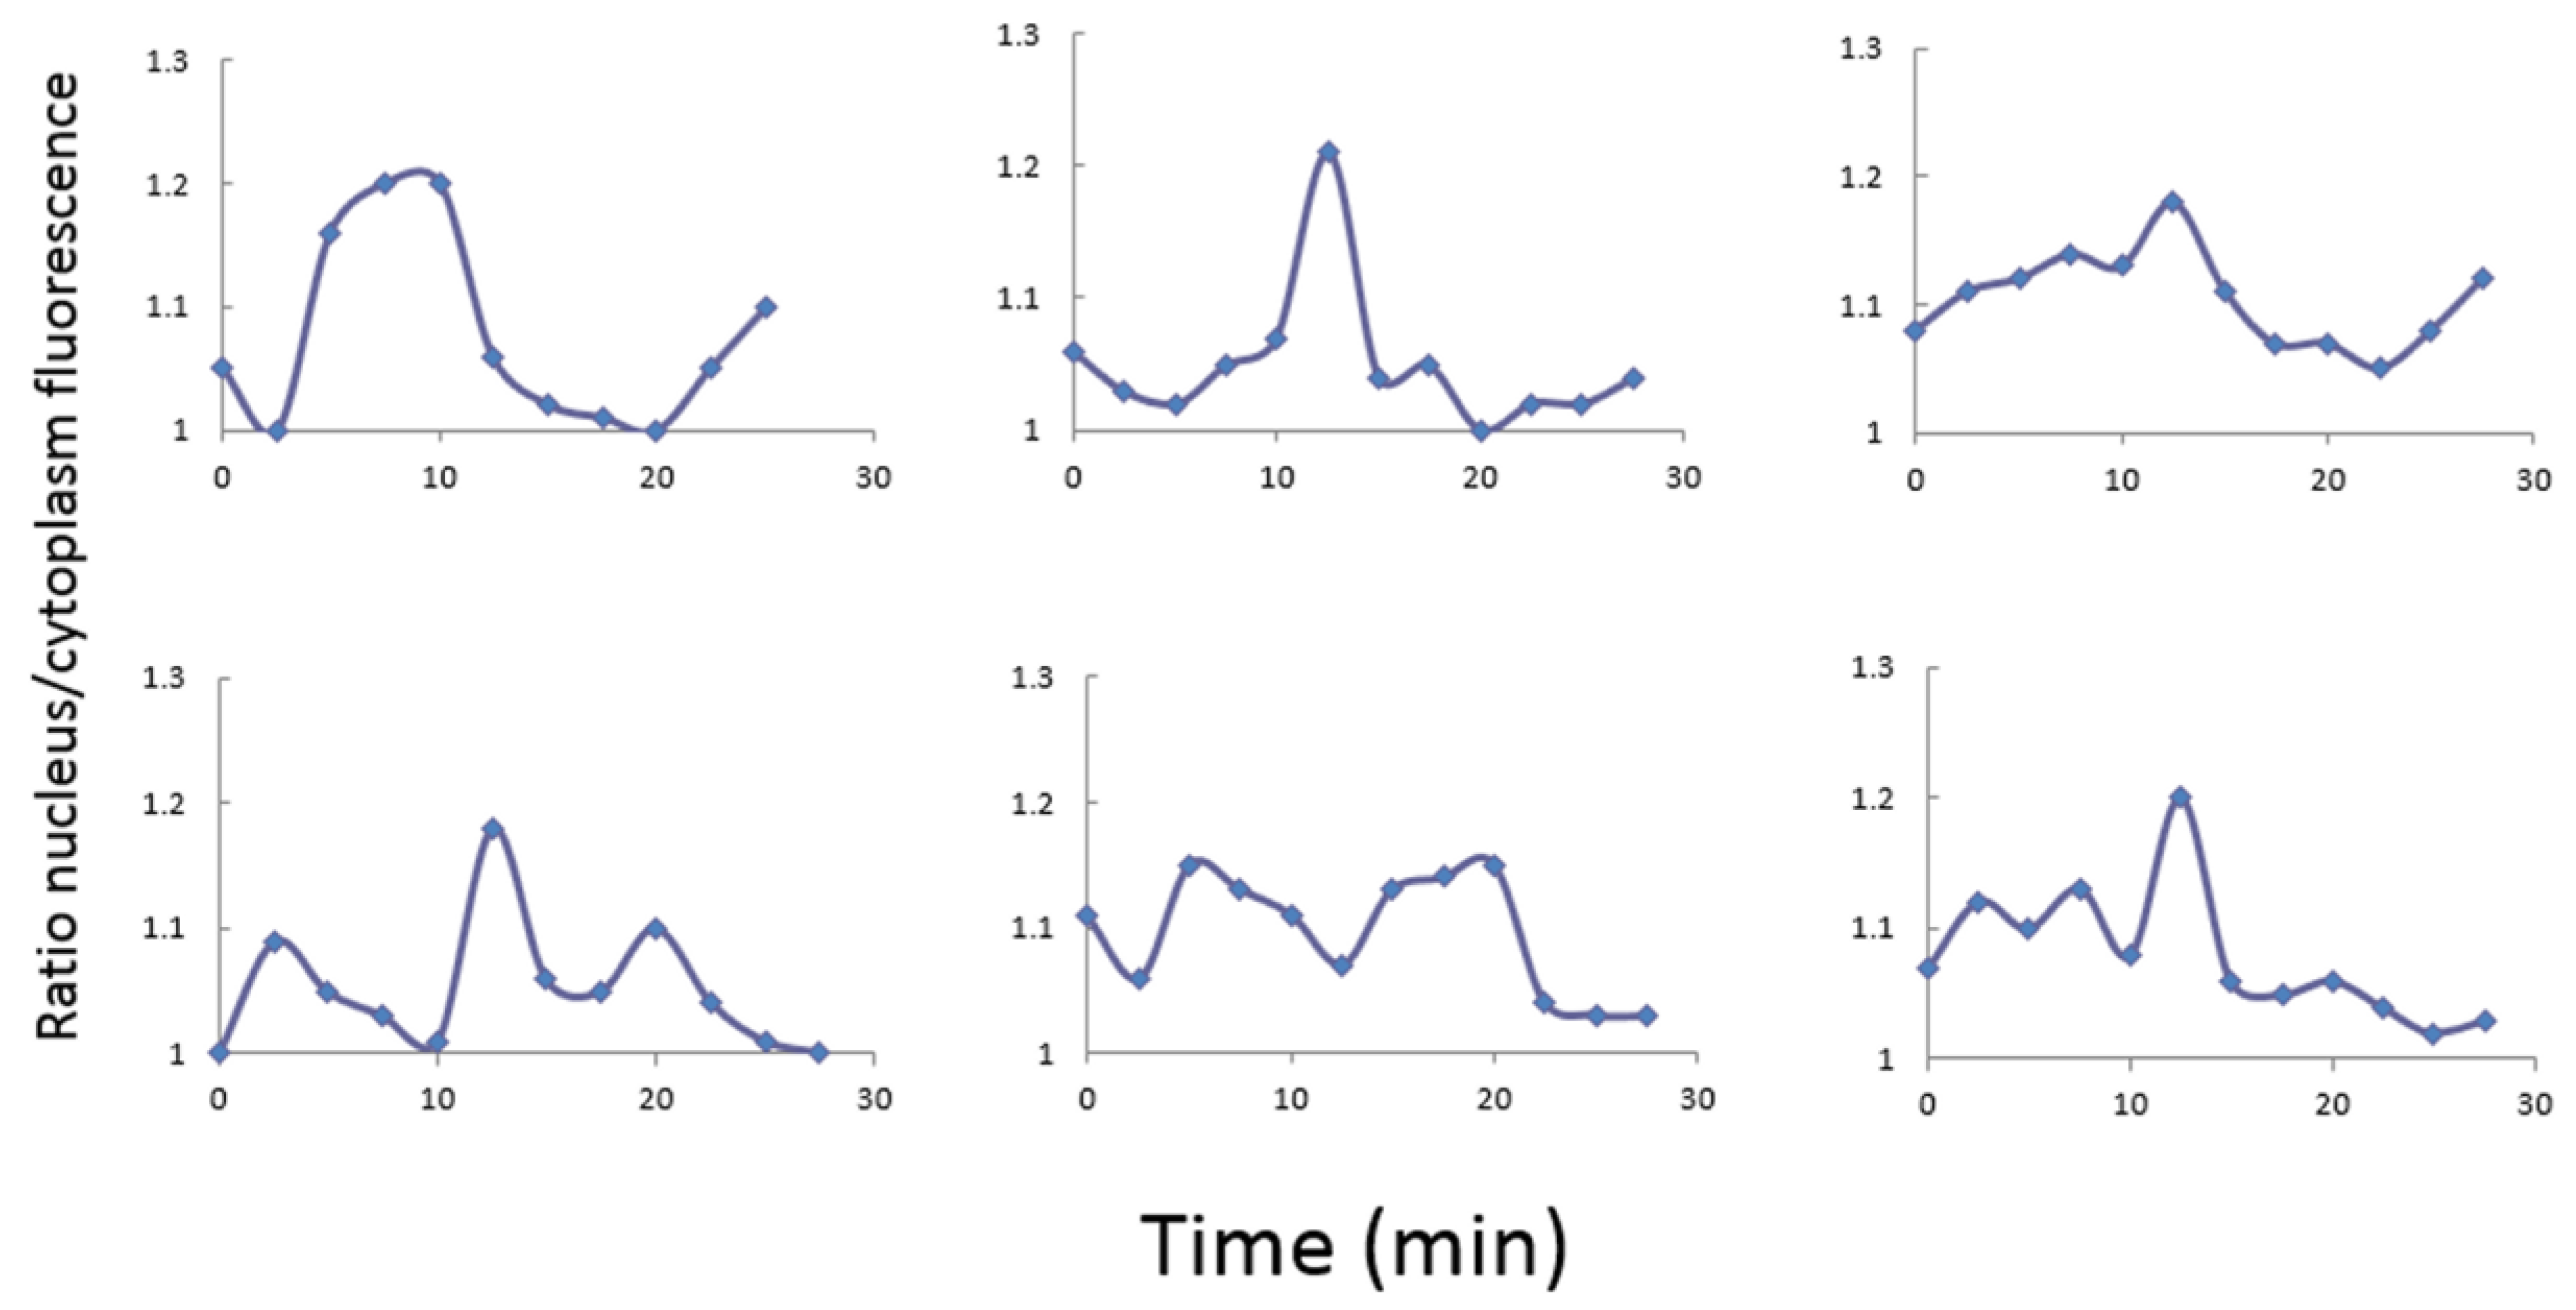
Abstract
:1. Introduction
2. Materials and Methods
2.1. Yeast Strains and Plasmid
2.2. Media and Growth Conditions
2.3. Fluorescence Microscopy and FRET Determination
2.4. Analysis of Periodicity
2.5. Abbreviations Used
3. Results and Discussion
3.1. Nutritional Stress Condition Induces Stochastic Periodic Nuclear Localization of Msn2 Protein
3.2. Nutritional Stress Induces Noisy Oscillation of cAMP in Single Yeast Cells
4. Conclusions
Supplementary Materials
Author Contributions
Funding
Data Availability Statement
Acknowledgments
Conflicts of Interest
References
- Thevelein, J.M.; de Winde, J.H. Novel sensing mechanisms and targets for the cAMP-protein kinase A pathway in the yeast Saccharomyces cerevisiae. Mol. Microbiol. 1999, 33, 904–918. [Google Scholar] [CrossRef] [PubMed]
- Reinders, A.; Burckert, N.; Boller, T.; Wiemken, A.; De Virgilio, C. Saccharomyces cerevisiae cAMP dependent protein kinase controls entry into stationary phase through the Rim15p protein kinase. Genes Dev. 1998, 12, 2943–2955. [Google Scholar] [CrossRef] [PubMed]
- Pedruzzi, I.; Dubouloz, F.; Cameroni, E.; Wanke, V.; Roosen, J.; Winderickx, J.; De Virgilio, C. TOR and PKA signaling pathways converge on the protein kinase Rim15 to control entry into G0. Mol. Cell 2003, 12, 1607–1613. [Google Scholar] [CrossRef] [PubMed]
- Wei, M.; Fabrizio, P.; Hu, J.; Ge, H.; Cheng, C.; Li, L.; Longo, V.D. Life span extension by calorie restriction depends on Rim15 and transcription factors downstream of Ras/PKA, Tor, and Sch9. PLoS Genet. 2008, 4, 139–149. [Google Scholar] [CrossRef]
- Lengeler, K.B.; Davidson, R.C.; D’souza, C.; Harashima, T.; Shen, W.C.; Wang, P.; Pan, X.; Waugh, M.; Heitman, J. Signal transduction cascades regulating fungal development and virulence. Microbiol. Mol. Biol. Rev. 2000, 64, 746–785. [Google Scholar] [CrossRef]
- Colombo, S.; Ma, P.; Cauwenberg, L.; Winderickx, J.; Crauwels, M.; Teunissen, A.; Nauwelaers, D.; de Winde, J.H.; Marie-Françoise Gorwa, M.; Colavizza, D.; et al. Involvement of distinct G-proteins, Gpa2 and Ras, in glucose- and intracellular acidification-induced cAMP signaling in the yeast Saccharomyces cerevisiae. EMBO J. 1998, 17, 3326–3341. [Google Scholar] [CrossRef] [PubMed]
- Nakafuku, M.; Obara, T.; Kaibuchi, K.; Miyajima, I.; Miyajima, A.; Itoh, H.; Nakamura, S.; Arai, K.; Matsumoto, K.; Kaziro, Y. Isolation of a second yeast Saccharomyces cerevisiae gene (GPA2) coding for guanine nucleotide-binding regulatory protein: Studies on its structure and possible functions. Proc. Natl. Acad. Sci. USA 1988, 85, 1374–1378. [Google Scholar] [CrossRef]
- Ma, P.; Wera, S.; Van Dijck, P.; Thevelein, J.M. The PDE1-encoded low-affinity phosphodiesterase in the yeast Saccharomyces cerevisiae has a specific function in controlling agonist-induced cAMP signaling. Mol. Biol. Cell 1999, 10, 91–104. [Google Scholar] [CrossRef] [PubMed]
- Colombo, S.; Ronchetti, D.; Thevelein, J.M.; Winderickx, J.; Martegani, E. Activation state of the Ras2 protein and glucose-induced signaling in Saccharomyces cerevisiae. J. Biol. Chem. 2004, 279, l46715–l46722. [Google Scholar] [CrossRef]
- Pescini, D.; Cazzaniga, P.; Besozzi, D.; Mauri, G.; Amigoni, L.; Colombo, S.; Martegani, E. Simulation of the Ras/cAMP/PKA pathway in budding yeast highlights the establishment of stable oscillatory states. Biotechnol. Adv. 2012, 30, 99–107. [Google Scholar] [CrossRef]
- Jian, D.; Aili, Z.; Xiaojia, B.; Huansheng, Z.; Yun, H. Feedback regulation of Ras2 guanine nucleotide exchange factor (Ras2-GEF) activity of Cdc25p by Cdc25p phosphorylation in the yeast Saccharomyces cerevisiae. FEBS Lett. 2010, 584, 4745–4750. [Google Scholar] [CrossRef]
- Bodenmiller, B.; Wanka, S.; Kraft, C.; Urban, J.; Campbell, D.; Pedrioli, P.G.; Gerrits, B.; Picotti, P.; Lam, H.; Vitek, O.; et al. Phosphoproteomic analysis reveals interconnected system-wide responses to perturbations of kinases and phosphatases in yeast. Sci. Signal. 2010, 3, rs4. [Google Scholar] [CrossRef]
- MacGilvray, M.E.; Shishkova, E.; Chasman, D.; Michael Place, M.; Gitter, A.; Coon, J.J.; Gasch, A.P. Network inference reveals novel connections in pathways regulating growth and defense in the yeast salt response. PLoS Comput. Biol. 2018, 13, e1006088. [Google Scholar] [CrossRef]
- Gonzales, K.; Kayıkçı, O.; Schaeffer, D.G.; Magwene, P.M. Modeling mutant phenotypes and oscillatory dynamics in the Saccharomyces cerevisiae cAMP-PKA pathway. BMC Syst. Biol. 2013, 7, 40. [Google Scholar] [CrossRef] [PubMed]
- Garmendia-Torres, C.; Goldbeter, A.; Jacquet, M. Nucleocytoplasmic oscillations of the yeast transcription factor Msn2: Evidence for periodic PKA activation. Curr. Biol. 2007, 17, 1044–1049. [Google Scholar] [CrossRef] [PubMed]
- Gonze, D.; Jacquet, M.; Goldbeter, A. Stochastic modelling of nucleocytoplasmic oscillations of the transcription factor Msn2 in yeast. J. R. Soc. Interface 2008, 5, S95–S109. [Google Scholar] [CrossRef] [PubMed]
- Medvedik, O.; Lamming, D.W.; Kim, K.D.; Sinclair, D.A. MSN2 and MSN4 link calorie restriction and TOR to sirtuin-mediated lifespan extension in Saccharomyces cerevisiae. PLoS Biol. 2007, 5, 2330–2341. [Google Scholar] [CrossRef]
- Nikolaev, V.O.; Bunemann, M.; Hein, L.; Annette Hannawacker, A.; Lohseet, M.J. Novel single chain cAMP sensors for receptor-induced signal propagation. J. Biol. Chem. 2004, 279, 37215–37218. [Google Scholar] [CrossRef]
- Colombo, S.; Broggi, S.; Collini, M.; D’Alfonso, L.; Chirico, G.; Martegani, E. Detection of cAMP and of PKA activity in Saccharomyces cerevisiae single cells using Fluorescence Resonance Energy Transfer (FRET) probes. Biochem. Biophys. Res. Commun. 2017, 487, 594–599. [Google Scholar] [CrossRef]
- Nikawa, J.; Cameron, S.; Toda, T.; Ferguson, K.W.; Wigler, M. Rigorous feedback control of cAMP levels in Saccharomyces cerevisiae. Genes Dev. 1987, 1, 931–937. [Google Scholar] [CrossRef]
- Eckmann, J.P.; Oliffson Kamphorst, S.; Ruelle, D. Recurrence plots of dynamical systems. Europhys. Lett. 1987, 4, 973–977. [Google Scholar] [CrossRef]
- Cazzaniga, P.; Pescini, D.; Besozzi, D.; Mauri, G.; Colombo, S.; Martegani, E. Modeling and stochastic simulation of the Ras/cAMP/PKA pathway in the yeast Saccharomyces cerevisiae evidences a key regulatory function for intracellular guanine nucleotides pools. J. Biotechnol. 2008, 133, 377–385. [Google Scholar] [CrossRef] [PubMed]
- Ponsioen, B.; Zhao, J.; Riedl, J.; Zwartkruis, F.; van der Krogt, G.; Zaccolo, M.; Moolenaar, W.H.; Bos, J.L.; Jalink, K. Detecting cAMP-induced Epac activation by fluorescence resonance energy transfer: Epac as a novel cAMP indicator. EMBO Rep. 2004, 5, 1176–1180. [Google Scholar] [CrossRef] [PubMed]


Disclaimer/Publisher’s Note: The statements, opinions and data contained in all publications are solely those of the individual author(s) and contributor(s) and not of MDPI and/or the editor(s). MDPI and/or the editor(s) disclaim responsibility for any injury to people or property resulting from any ideas, methods, instructions or products referred to in the content. |
© 2023 by the authors. Licensee MDPI, Basel, Switzerland. This article is an open access article distributed under the terms and conditions of the Creative Commons Attribution (CC BY) license (https://creativecommons.org/licenses/by/4.0/).
Share and Cite
Colombo, S.; Collini, M.; D’Alfonso, L.; Chirico, G.; Martegani, E. Evidence of Noisy Oscillations of cAMP under Nutritional Stress Condition in Budding Yeast. Symmetry 2023, 15, 1793. https://doi.org/10.3390/sym15091793
Colombo S, Collini M, D’Alfonso L, Chirico G, Martegani E. Evidence of Noisy Oscillations of cAMP under Nutritional Stress Condition in Budding Yeast. Symmetry. 2023; 15(9):1793. https://doi.org/10.3390/sym15091793
Chicago/Turabian StyleColombo, Sonia, Maddalena Collini, Laura D’Alfonso, Giuseppe Chirico, and Enzo Martegani. 2023. "Evidence of Noisy Oscillations of cAMP under Nutritional Stress Condition in Budding Yeast" Symmetry 15, no. 9: 1793. https://doi.org/10.3390/sym15091793