
Two-Sided Beneficial Value-Added Service Investment and Pricing Strategies in Asymmetric/Symmetric Investment Scenarios
Abstract
:1. Introduction
- In an asymmetric investment scenario, i.e., a platform invests in two-sided beneficial services and its competitor does not, how should the platform decide the value-added service level and the corresponding ad price? How are the value-added service level and ad price influenced by marginal investment costs, positive consumer effects and negative advertising effects?
- In a symmetric investment scenario, i.e., a media platform and its competitor both invest in two-sided beneficial value-added services, how should the platform decide the value-added service level and ad price? How do marginal investment costs, positive consumer effects and negative advertising effects impact the value-added service level and ad price of the platform?
- What are the differences in the value-added service level and ad price of a platform that has invested between the asymmetric investment scenario and symmetric investment scenario?
- This paper focuses on a category of value-added services that can directly benefit users on two sides of investment platforms, which directly improve the utilities of users on two sides of the platforms. Previous research on service investment strategies of platforms has investigated primarily the value-added services that can directly benefit users on one side of the platforms. Therefore, in their research, only users on one side can obtain the direct utility brought by the value-added service investments. However, such research has neglected the value-added services that can directly benefit users on two sides, which can directly improve the utilities of users on two sides. We bridge this gap by focusing on two-sided beneficial value-added services that directly benefit users on two sides of media platforms, i.e., consumers and advertisers.
- This paper develops duopoly game models to explore the value-added service investment strategies of platforms in asymmetric and symmetric investment scenarios. Unlike previous research that analyzes value-added service investment strategies of platforms by developing monopoly game models, we investigate such strategies by developing duopoly game models. In addition, we differentiate duopoly game models in asymmetric and symmetric investment scenarios.
- This paper investigates the impact of value-added service investments on media platform pricing. Unlike most research that examines the impact of mergers and entries, advertising regulations and privacy concerns on media platform pricing, we investigate the impact of value-added service investments on such pricing by comparing the differences in equilibrium prices of media platforms under asymmetric and symmetric investment scenarios.
- We analyze the impact of important parameters—marginal investment costs, positive consumer effects and negative advertising effects, on the equilibrium two-sided beneficial value-added service levels, ad prices and profits of media platforms. This provides management implications for media platforms when they determine the investments in two-sided beneficial value-added services and ad prices.
2. Literature Review
2.1. Service Investment Strategies of Platforms
2.2. Media Platform Pricing Strategies
3. Models
3.1. Consumers
3.2. Advertisers
3.3. Media Platforms
3.4. The Three-Stage Game
4. Equilibrium Analysis
4.1. Scenario A
4.2. Scenario S
5. Comparison of Equilibrium Outcomes
6. Numerical Simulation
6.1. Scenario A
- (1)
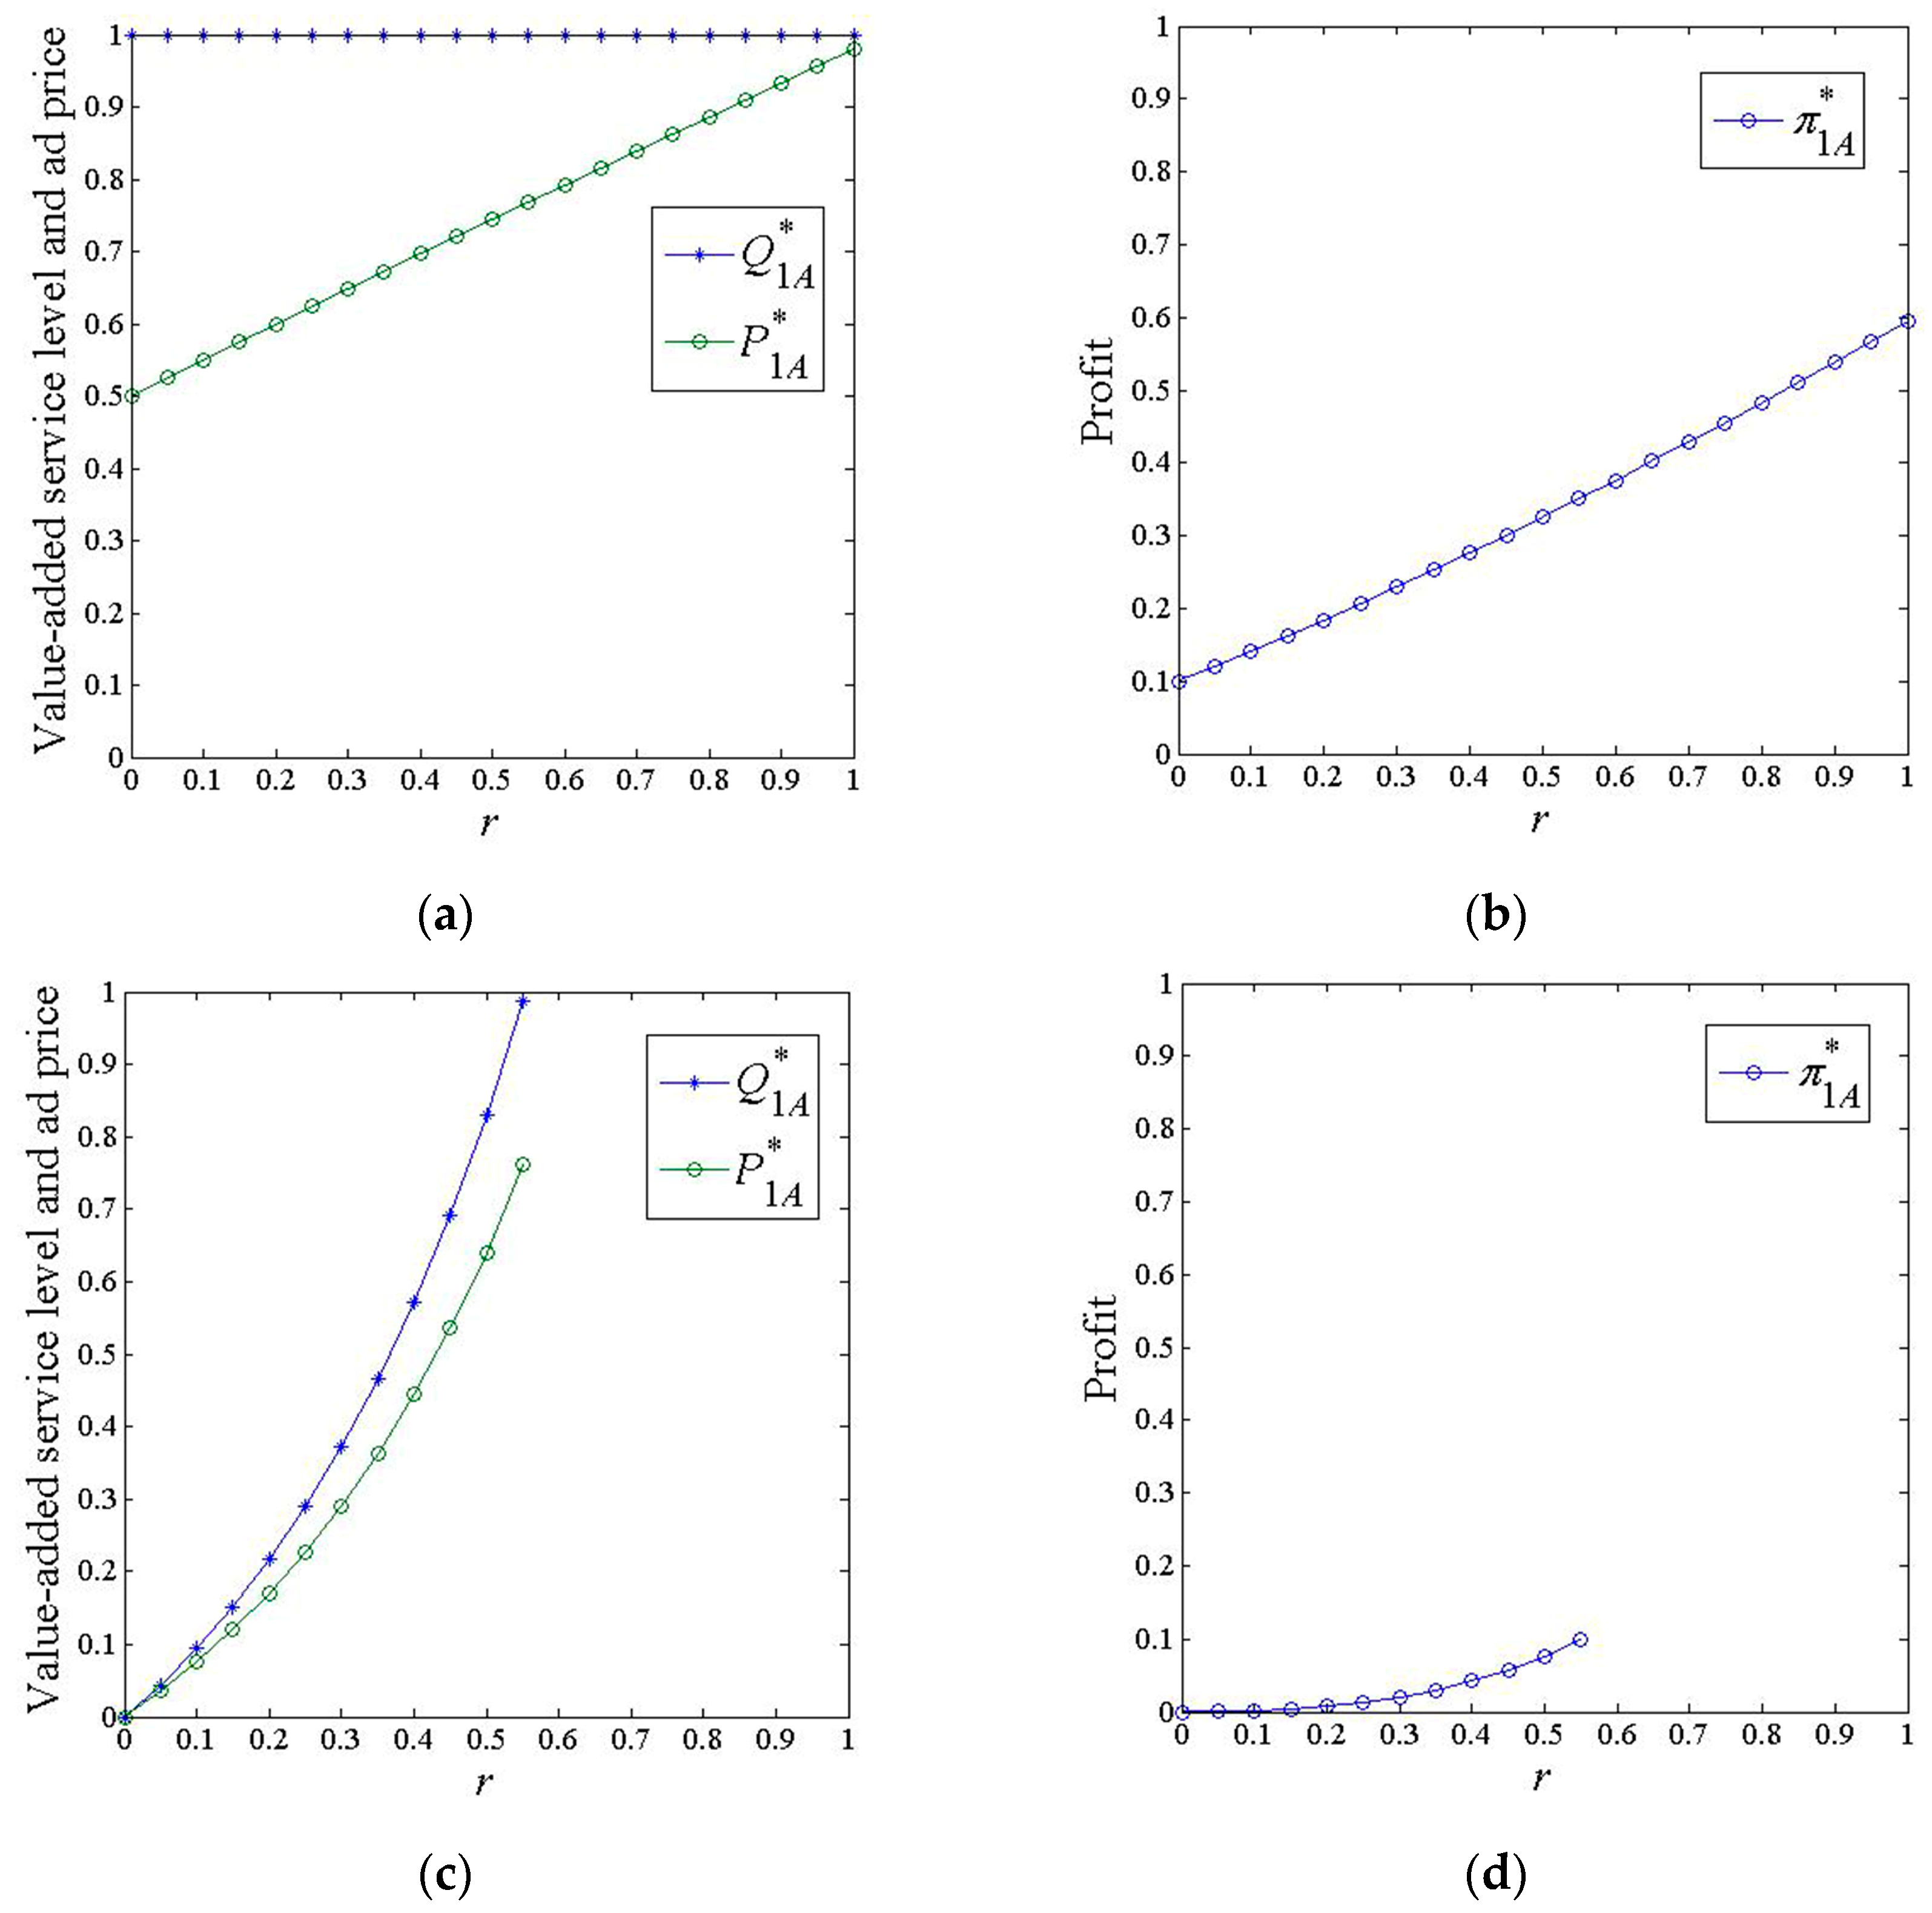
- Impacts of marginal investment costs
- (2)
- Impacts of positive consumer effects
- (3)
- Impacts of negative advertising effects
6.2. Scenario S
- (1)
- Impacts of marginal investment costs
- (2)
- Impacts of positive consumer effects
- (3)
- Impacts of negative advertising effects
7. Conclusions
Author Contributions
Funding
Data Availability Statement
Acknowledgments
Conflicts of Interest
Appendix A
- If ,
- If ,where .
- If ,
- If ,
- If ,
- If ,
- If ,
- If ,
- If ,
- If ,
- If ,
- If ,
References
- Amaldoss, W.; Du, J.; Shin, W. Media Platforms’ Content Provision Strategies and Sources of Profits. Mark. Sci. 2021, 40, 527–547. [Google Scholar] [CrossRef]
- Lin, Z. Commercialization of Creative Videos in China in the Digital Platform Age. Telev. New Media. 2021, 22, 878–895. [Google Scholar] [CrossRef]
- Xu, S.; Ling, L. Which Is the Optimal Commercial Mode for a Video Site: Paid, Free, Or Hybrid? Asia Pac. J. Oper. Res. 2020, 37, 2050022. [Google Scholar] [CrossRef]
- Song, X.; Xu, B.; Jiang, Y. Predicting Content Similarity Via Multimodal Modeling for Video-in-video Advertising. IEEE Trans. Circuits Syst. Video Technol. 2020, 31, 569–581. [Google Scholar] [CrossRef]
- Li, W.; Jiang, M.; Zhan, W. Why Advertise on Short Video Platforms? Optimizing Online Advertising Using Advertisement Quality. J. Theor. Appl. Electron. Commer. Res. 2022, 17, 1057–1074. [Google Scholar] [CrossRef]
- Chakraborty, S.; Basu, S.; Ray, S.; Sharma, M. Advertisement Revenue Management: Determining the Optimal Mix of Skippable and Non-skippable Ads for Online Video Sharing Platforms. Eur. J. Oper. Res. 2021, 292, 213–229. [Google Scholar] [CrossRef]
- Dou, G.; He, P.; Xu, X. One-side Value-added Service Investment and Pricing Strategies. Int. J. Prod. Res. 2016, 54, 3808–3821. [Google Scholar] [CrossRef]
- Dou, G.; Lin, X.; Xu, X. Value-added Service Investment Strategy of a Two-sided Platform with the Negative Intra-group Network Externality. Kybernetes 2018, 47, 937–956. [Google Scholar] [CrossRef]
- Xu, X.; Dou, G.; Yu, Y. Government Investment Strategy and Platform Pricing Decisions with the Cross-market Network Externality. Kybernetes 2020, 50, 711–736. [Google Scholar] [CrossRef]
- Zhu, X.; Yang, C.; Liu, K.; Zhang, R.; Jiang, Q. Cooperation and Decision Making in a Two-sided Market Motivated by the Externality of a Third-party Social Media Platform. Ann. Oper. Res. 2022, 316, 117–142. [Google Scholar] [CrossRef]
- Liu, W.; Yan, X.; Wei, W.; Xie, D. Pricing Decisions for Service Platform with Provider’s Threshold Participating Quantity, Value-added Service and Matching Ability. Transp. Res. Pt. E-Logist. Transp. Rev. 2019, 122, 410–432. [Google Scholar] [CrossRef]
- Sun, Q.; Li, T.; Ma, F.; Guo, X.; Wang, S. Dynamic Evolution of Safety Regulation of the Ridesharing Industry under Social Media Participation. Symmetry 2020, 12, 560. [Google Scholar] [CrossRef] [Green Version]
- Zhang, S.; He, P. Platform investment strategy on reducing transaction costs. Kybernetes 2017, 46, 893–911. [Google Scholar] [CrossRef]
- Anderson, S.P.; Foros, Ø.; Kind, H.J. Competition for Advertisers and for Viewers in Media Markets. Econ. J. 2018, 128, 34–54. [Google Scholar] [CrossRef] [Green Version]
- Anderson, S.P.; Foros, Ø.; Kind, H.J. The Importance of Consumer Multihoming (joint Purchases) for Market Performance: Mergers and Entry in Media Markets. J. Econ. Manage. Strategy 2019, 28, 125–137. [Google Scholar] [CrossRef] [Green Version]
- Kerkhof, A.; Münster, J. Quantity Restrictions on Advertising, Commercial Media Bias, and Welfare. J. Public Econ. 2015, 131, 124–141. [Google Scholar] [CrossRef] [Green Version]
- Henriques, D. Effects of Tv Airtime Regulation on Advertising Quality and Welfare. Inf. Econ. Policy 2021, 55, 100897. [Google Scholar] [CrossRef]
- Duan, Y.; Ge, Y.; Feng, Y. Pricing and Personal Data Collection Strategies of Online Platforms in the Face of Privacy Concerns. Electron. Commer. Res. 2020, 20, 1–21. [Google Scholar] [CrossRef]
- Gong, Q.; Pan, S.; Yang, H. Targeted Advertising on Competing Platforms. B E J. Theor. Econ. 2019, 19, 20170126. [Google Scholar] [CrossRef]
- Wang, W.; Guo, Q. Subscription Strategy Choices of Network Video Platforms in the Presence of Social Influence. Electron. Commer. Res. 2021, 35, 1–28. [Google Scholar] [CrossRef]
- Belleflamme, P.; Peitz, M.; Toulemonde, E. The Tension between Market Shares and Profit Under Platform Competition. Int. J. Ind. Organ. 2022, 81, 102807. [Google Scholar] [CrossRef]
- Jiang, S.; Li, Y.; Wang, S.; Zhao, L. Blockchain Competition: The Tradeoff Between Platform Stability and Efficiency. Eur. J. Oper. Res. 2022, 296, 1084–1097. [Google Scholar] [CrossRef]
- Wu, C.; Chiu, Y. Pricing and Content Development for Online Media Platforms Regarding Consumer Homing Choices. Eur. J. Oper. Res. 2023, 305, 312–328. [Google Scholar] [CrossRef]
- Shekhar, S. Platform pricing choice: Exclusive deals or uniform prices. Rev. Netw. Econ. 2021, 20, 159–186. [Google Scholar] [CrossRef]
- Lin, X.; Huang, X.; Liu, S.; Li, Y.; Luo, H.; Yu, S. Competitive Price-quality Strategy of Platforms under User Privacy Concerns. J. Theor. Appl. Electron. Commer. Res. 2022, 17, 571–589. [Google Scholar] [CrossRef]
- Wan, X.; Chen, J.; Chen, B. Exploring Service Positioning in Platform-based Markets. Int. J. Prod. Econ. 2020, 220, 107455. [Google Scholar] [CrossRef]
- Lin, X.; Hou, R.; Zhou, Y. Platform Competition for Advertisers and Viewers in Media Markets with Endogenous Content and Advertising. J. Syst. Sci. Syst. Eng. 2020, 29, 36–54. [Google Scholar] [CrossRef]
- Cheng, X.; Mu, L.; Sun, Y.; Bian, Y. Optimal pricing decisions for the online video platform under customer choice. Asia Pac. J. Oper. Res. 2018, 35, 1850002. [Google Scholar] [CrossRef]
- Carroni, E. Poaching in media: Harm to subscribers? J. Econ. Manage. Strategy 2018, 27, 221–236. [Google Scholar] [CrossRef]
- Anderson, S.P.; Peitz, M. Media See-saws: Winners and Losers in Platform Markets. J. Econ. Theory 2020, 186, 104990. [Google Scholar] [CrossRef]
- Bakos, Y.; Halaburda, H. Platform Competition with Multihoming on Both Sides: Subsidize or Not? Manage. Sci. 2020, 66, 5599–5607. [Google Scholar] [CrossRef]
- Zennyo, Y. Freemium competition among ad-sponsored platforms. Inf. Econ. Policy 2020, 50, 100848. [Google Scholar] [CrossRef]
- Liu, H.; Qiao, H.; Wang, S.; Li, Y. Platform competition in peer-to-peer lending considering risk control ability. Eur. J. Oper. Res. 2019, 274, 280–290. [Google Scholar] [CrossRef]
- Choi, J.P.; Zennyo, Y. Platform market competition with endogenous side decisions. J. Econ. Manage. Strategy 2019, 28, 73–88. [Google Scholar] [CrossRef] [Green Version]
- Li, Z.; Nan, G.; Li, M. Advertising or Freemium: The Impacts of Social Effects and Service Quality on Competing Platforms. IEEE Trans. Eng. Manage. 2018, 67, 220–233. [Google Scholar] [CrossRef]
- Dietl, H.; Lang, M.; Lin, P. Advertising Pricing Models in Media Markets: Lump-sum Versus Per-consumer Charges. Inf. Econ. Policy 2013, 25, 257–271. [Google Scholar] [CrossRef] [Green Version]
- Duan, Y.; Liu, P.; Feng, Y. Pricing Strategies of Two-sided Platforms Considering Privacy Concerns. J. Retail. Consum. Serv. 2022, 64, 102781. [Google Scholar] [CrossRef]
- Chi, X.; Fan, Z.; Wang, X. Pricing Mode Selection for the Online Short Video Platform. Soft Comput. 2021, 25, 5105–5120. [Google Scholar] [CrossRef]
- Song, Z.; He, S.; An, B. Decision and coordination in a dual-channel three-layered green supply chain. Symmetry 2018, 10, 549. [Google Scholar] [CrossRef] [Green Version]
- Saha, S.; Nielsen, I. Strategic Integration Decision under Supply Chain Competition in the Presence of Online Channel. Symmetry 2021, 13, 58. [Google Scholar] [CrossRef]
- GnanaSekar, M.M.N.; Kandaiyan, I. Analysis of an M/G/1 Retrial Queue with Delayed Repair and Feedback under Working Vacation policy with Impatient Customers. Symmetry 2022, 14, 2024. [Google Scholar] [CrossRef]


| Notations | Descriptions |
|---|---|
| index for platforms, . represents platform 1, and represents platform 2. | |
| index for scenarios, . represents scenario A, and represents scenario S. | |
| the location of platform . | |
| the basic utility that consumers can obtain from the content provided by platform . | |
| the value-added service level of platform in scenario . | |
| the ad price of platform in scenario . | |
| the profit function of platform in scenario . | |
| the total utility that a consumer derives from platform in scenario . | |
| the total utility that an advertiser obtains from platform in scenario . | |
| the consumer demand of platform in scenario . | |
| the advertiser demand of platform in scenario . | |
| the state variable representing whether platform invests in value-added services in scenario . means that platform does not invest in value-added services in scenario , and means that platform invests in value-added services in scenario . | |
| the location of consumers. | |
| the unit transport cost. | |
| the cost of designing and producing an ad. | |
| the negative cross-network effect that each advertiser has on a consumer, . It measures the disutility that a consumer suffers from each advertiser, hereafter “the negative advertising effect”. | |
| the positive cross-network effect that each consumer brings to an advertiser, . It measures the benefit that an advertiser receives from each consumer, hereafter “the positive consumer effect”. | |
| the marginal investment cost that the platform invests in value-added services, hereafter “the marginal investment cost”. |
| Cross-Network Effects | Marginal Investment Costs | Impacts of Marginal Investment Costs |
|---|---|---|
| , , , , | ||
| , , , , | ||
| , , , , | ||
| , , , , . | ||
| , , , , . |
Disclaimer/Publisher’s Note: The statements, opinions and data contained in all publications are solely those of the individual author(s) and contributor(s) and not of MDPI and/or the editor(s). MDPI and/or the editor(s) disclaim responsibility for any injury to people or property resulting from any ideas, methods, instructions or products referred to in the content. |
© 2023 by the authors. Licensee MDPI, Basel, Switzerland. This article is an open access article distributed under the terms and conditions of the Creative Commons Attribution (CC BY) license (https://creativecommons.org/licenses/by/4.0/).
Share and Cite
An, F.; Liu, G. Two-Sided Beneficial Value-Added Service Investment and Pricing Strategies in Asymmetric/Symmetric Investment Scenarios. Symmetry 2023, 15, 1246. https://doi.org/10.3390/sym15061246
An F, Liu G. Two-Sided Beneficial Value-Added Service Investment and Pricing Strategies in Asymmetric/Symmetric Investment Scenarios. Symmetry. 2023; 15(6):1246. https://doi.org/10.3390/sym15061246
Chicago/Turabian StyleAn, Fengyue, and Gang Liu. 2023. "Two-Sided Beneficial Value-Added Service Investment and Pricing Strategies in Asymmetric/Symmetric Investment Scenarios" Symmetry 15, no. 6: 1246. https://doi.org/10.3390/sym15061246