

Generalization Investigation for Artificial Intelligence-Based Positioning in IIoT
Abstract
:1. Introduction
- Horizontal positioning error < 3 m for 80% of devices in indoor deployment scenarios;
- Vertical positioning error < 3 m for 80% of devices in indoor deployment scenarios;
- Horizontal positioning error < 10 m for 80% of devices in outdoor deployments scenarios;
- Vertical positioning error < 3 m for 80% of devices in outdoor deployment scenarios.
- Horizontal position accuracy (<0.2 m) for 90% of devices
- Vertical position accuracy (<1 m) for 90% of devices
2. Related Works
- Identify typical factors affecting the generalization performance and then evaluate the exact impact;
- Verify the feasibility of existing generalization solutions to reduce the side effect of variation of the typical factors;
- For the cases where existing generalization solutions do not help much, we further propose directions to improve the performance.
3. System Model
3.1. Scenario
3.2. Modeling the LOS/NLOS Probability Based on Clutter Parameter
3.3. Modeling of Network Synchronization Error
3.4. Modeling of Receiving Timing Error
4. Evaluation Set Up
4.1. AI-Based Positioning Methods
4.2. Data Set Generation

| Parameters | Value | |
|---|---|---|
| Carrier frequency, GHz | 3.5 GHz | |
| Bandwidth, MHz | 100 MHz | |
| Subcarrier spacing, kHz | 30 kHz for 100 MHz | |
| Channel model | InF-DH | |
| Layout | Hall size | 120 × 60 m |
| Room height | 10 m | |
| Number of floors | 1 | |
| Total gNB TX power, dBm | 24 dBm | |
| gNB antenna configuration | (M, N, P, Mg, Ng) = (4, 4, 2, 1, 1), dH = dV = 0.5 λ | |
| gNB antenna radiation pattern | Single sector | |
| gNB antenna height | 8 m | |
| Penetration loss | 0 dB | |
| UE antenna configuration | Mg = 1, Ng = 1, P = 2, dH = 0.5 λ, (M, N, P, Mg, Ng) = (1, 2, 2, 1, 1) | |
| UE horizontal drop procedure | Uniformly distributed over the convex hull of the horizontal BS deployment. | |
| UE antenna height | 1.5 m | |
| UE mobility | 3 km/h | |
| Min gNB-UE distance (2D), m | 0 m | |
| UE antenna radiation pattern | Omni, 0 dBi | |
| Clutter parameters: {density r, height hc, size dcluster} | High clutter density: {40%, 2 m, 2 m} {60%, 6 m, 2 m} | |
4.3. AI Model Construction and Model Training
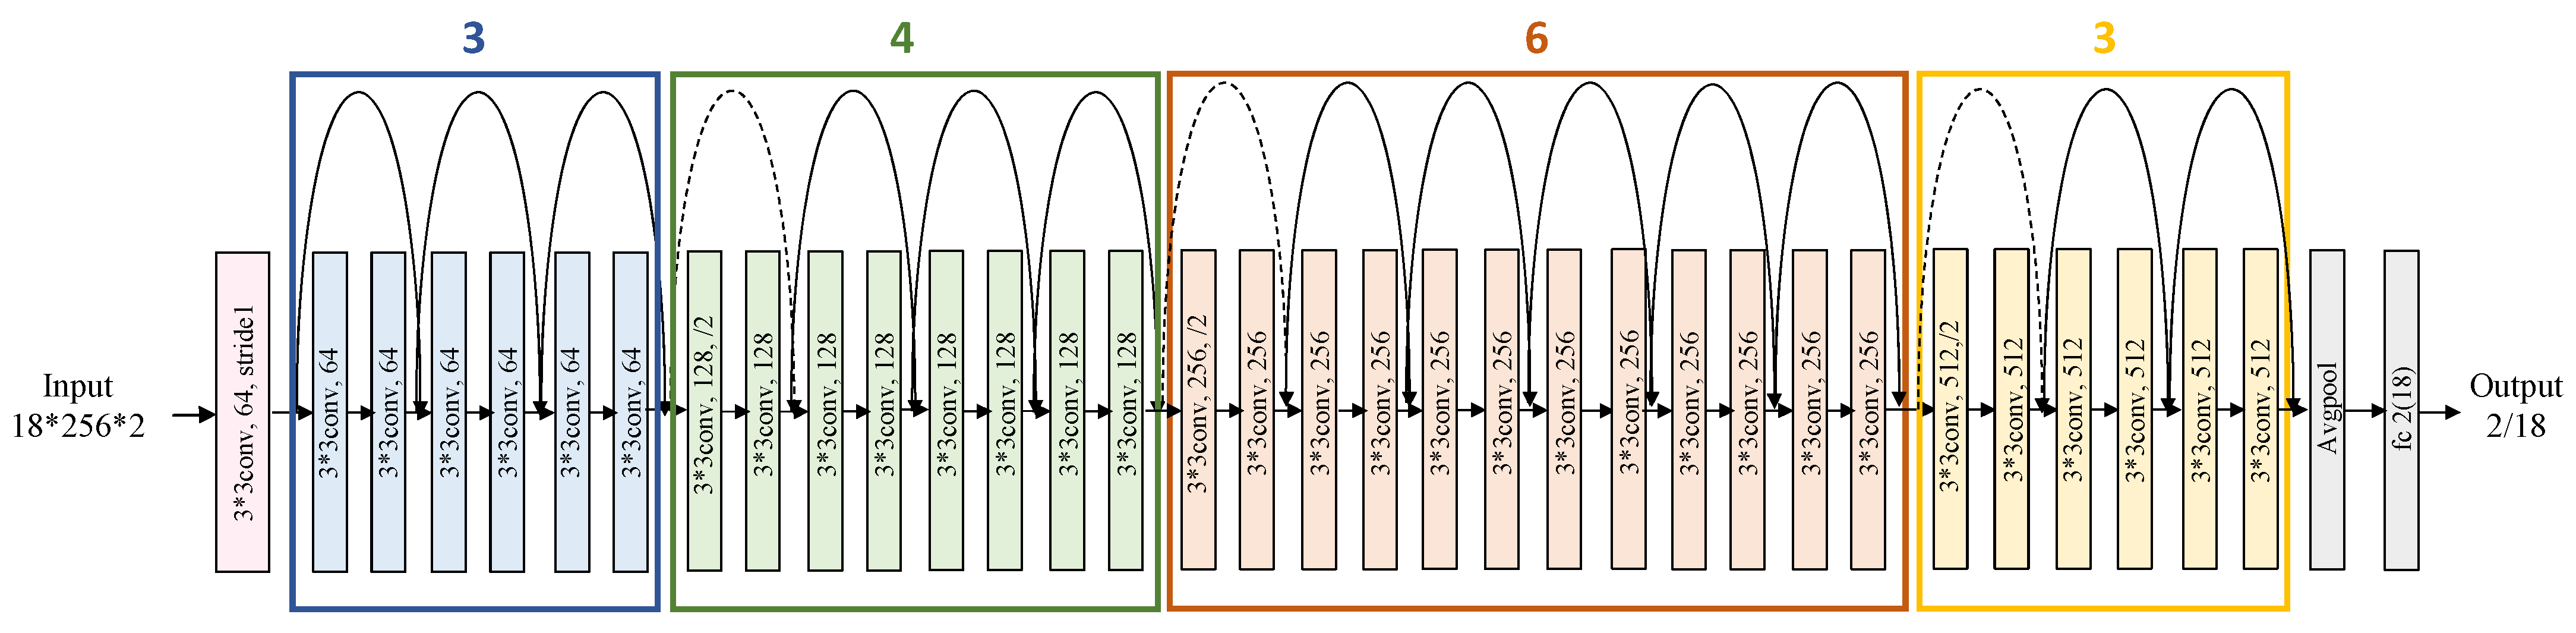
- In module conv1, we modify the convolutional layer to have a kernel size of 3 instead of 7 and a stride of 1 instead of 2. This is because the dimension of channel features of positioning data is 18 × 256 rather than 224 × 224 in [31] as input in the original model, so the size of the convolution kernel needs to be reduced. We set the stride to 1, and do not carry out downsampling in the first two layers so that the dimensions of the original input can be preserved. Additionally, the subsequent layers perform downsampling like the original model, which is conducive to extracting 18-dimensional BS information;
- In module conv2_x, we remove the max-pooling operation, and we set the convolutional layers to have a stride of 1 instead of 2.
4.4. Training Manners to Be Evaluated
- Manner 1: AI model trained by data samples with identical configurations. It is expected that the generalization of this manner is not good when the testing data set is generated based on different configurations from that of the training data set.
- Manner 2: The second one is the AI model is trained by data with mixed samples. The samples in the training data set are generated by different parameters, e.g., by different clutter parameters or by different timing error assumptions. The core idea of this manner is to optimize the data set construction to guarantee generalization performance.
- Manner 3: The third one is that the AI model is initially trained by data set with identical configuration and then fine-tuned by a small number of samples with the same configuration as that in the test data set. This manner has a similar spirit of transfer learning.
5. Performance Evaluation and Discussion
5.1. Scenario 0: Identical Configuration between Training Data Set and Test Data Set
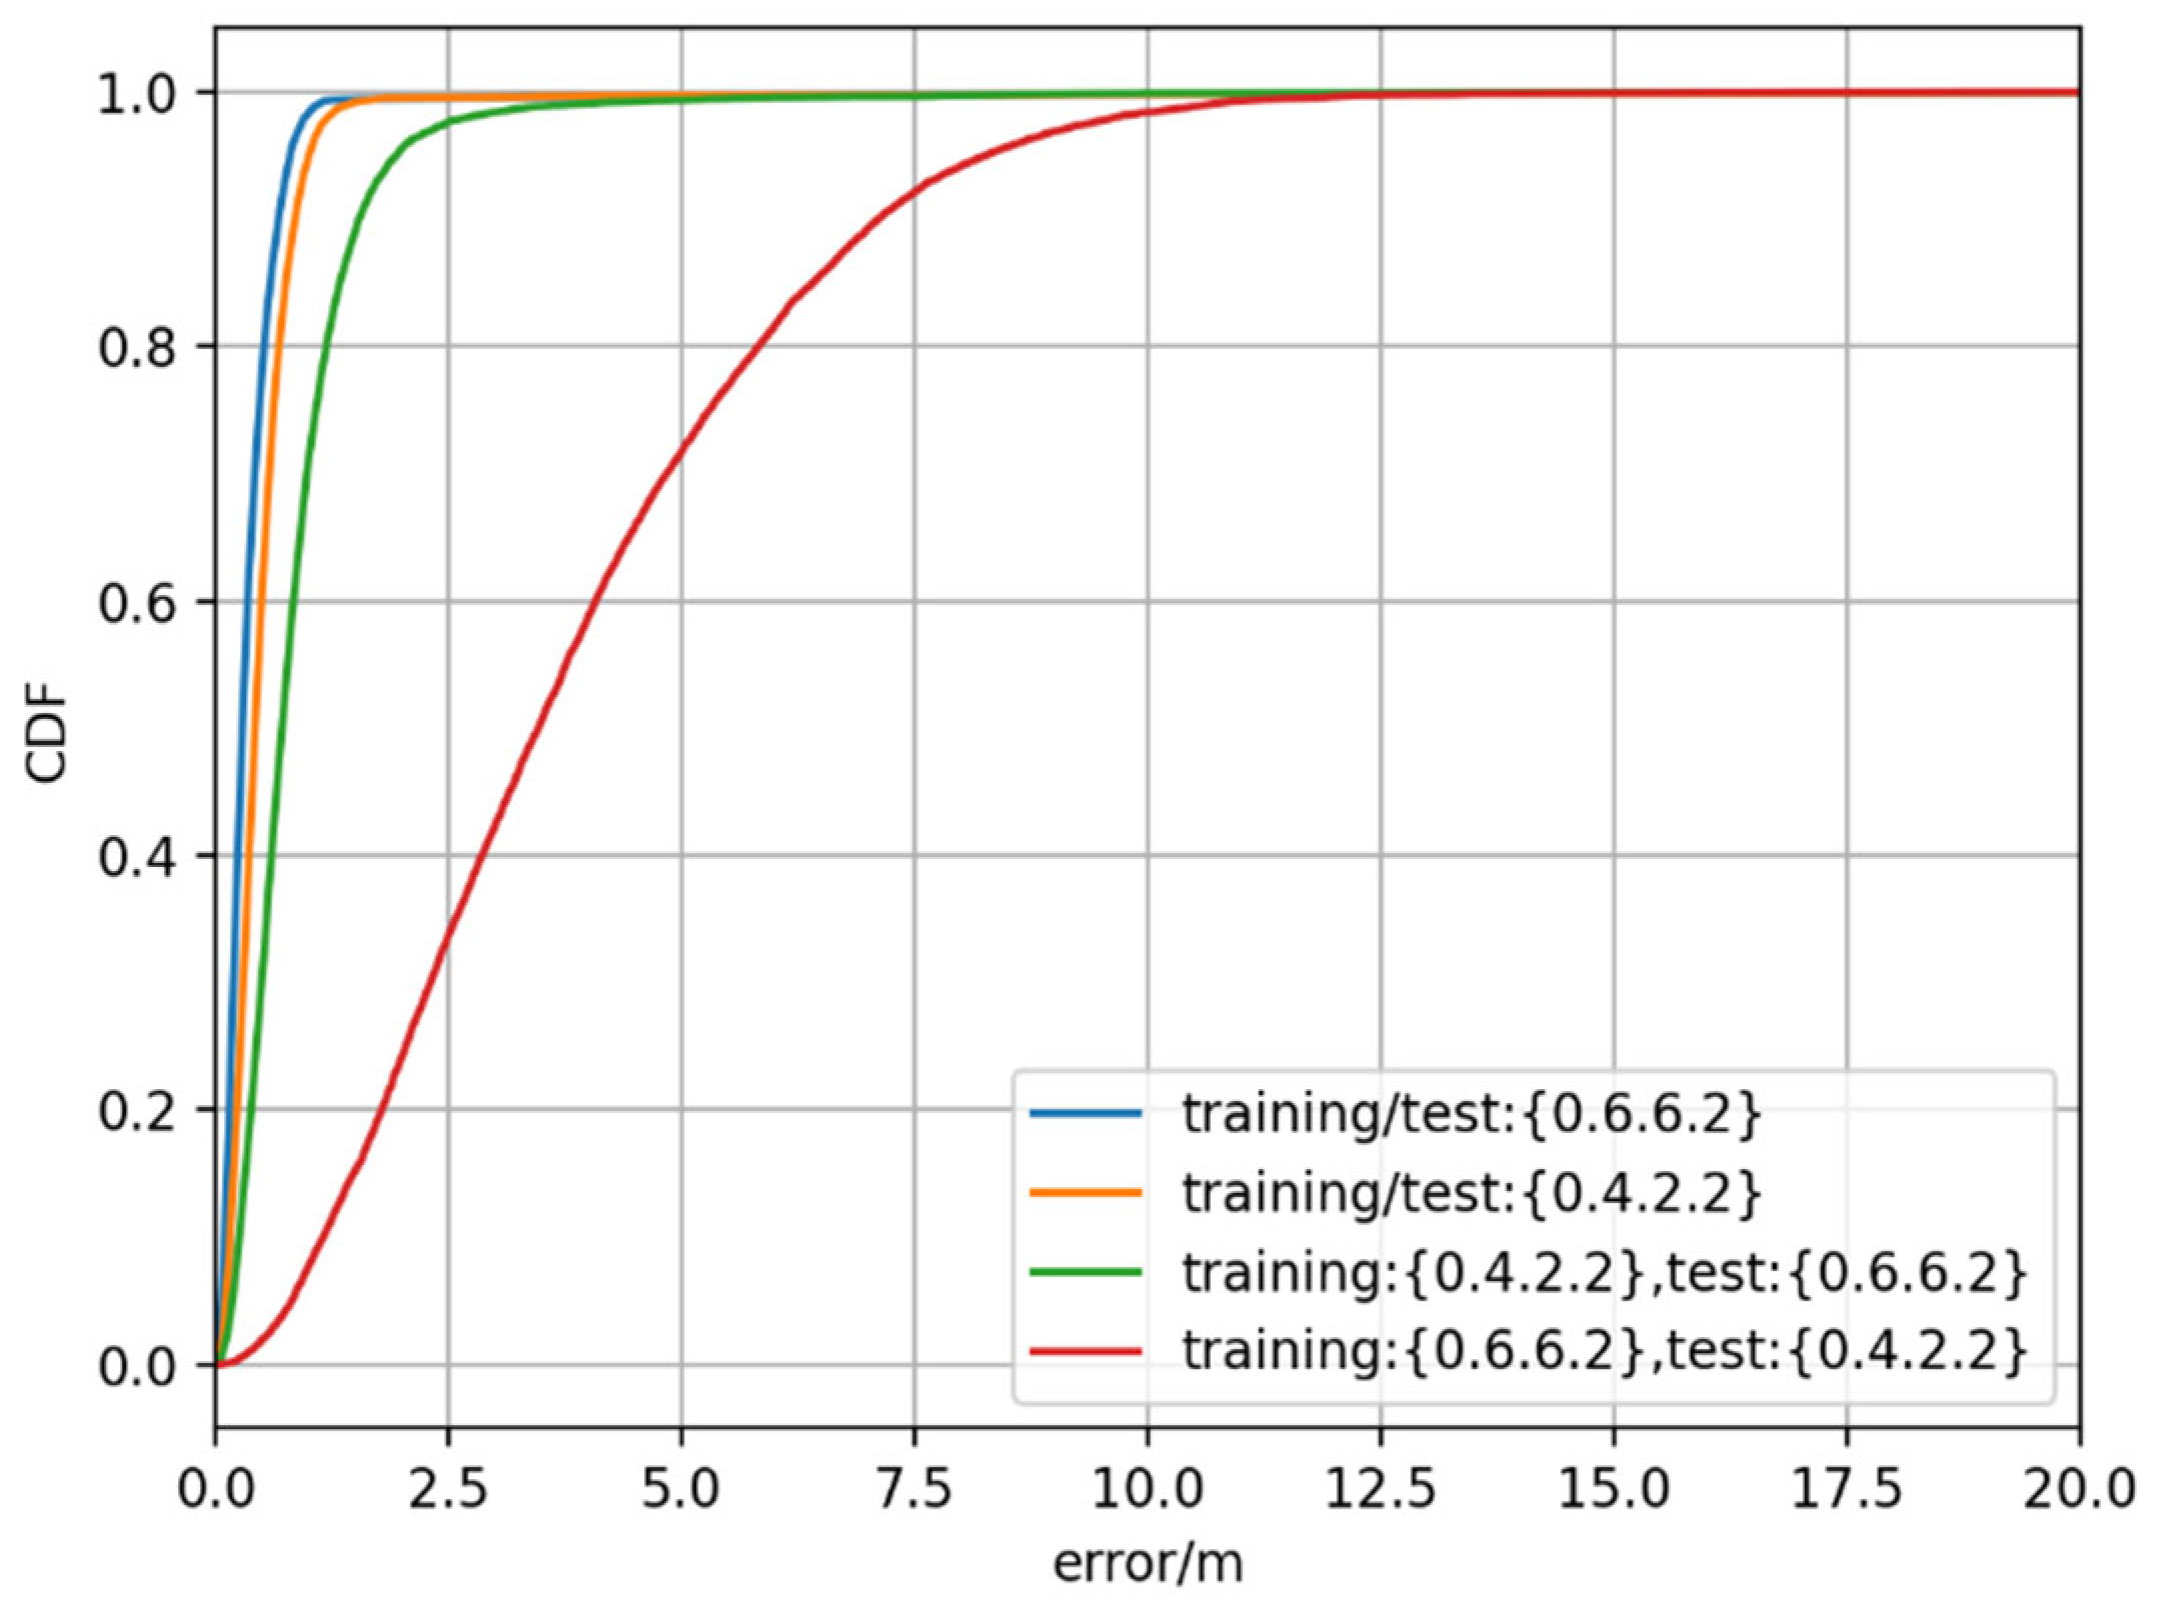
5.2. Scenario 1: Impact of the Clutter Parameter
- Training manner 1: Different clutter parameters for training and test
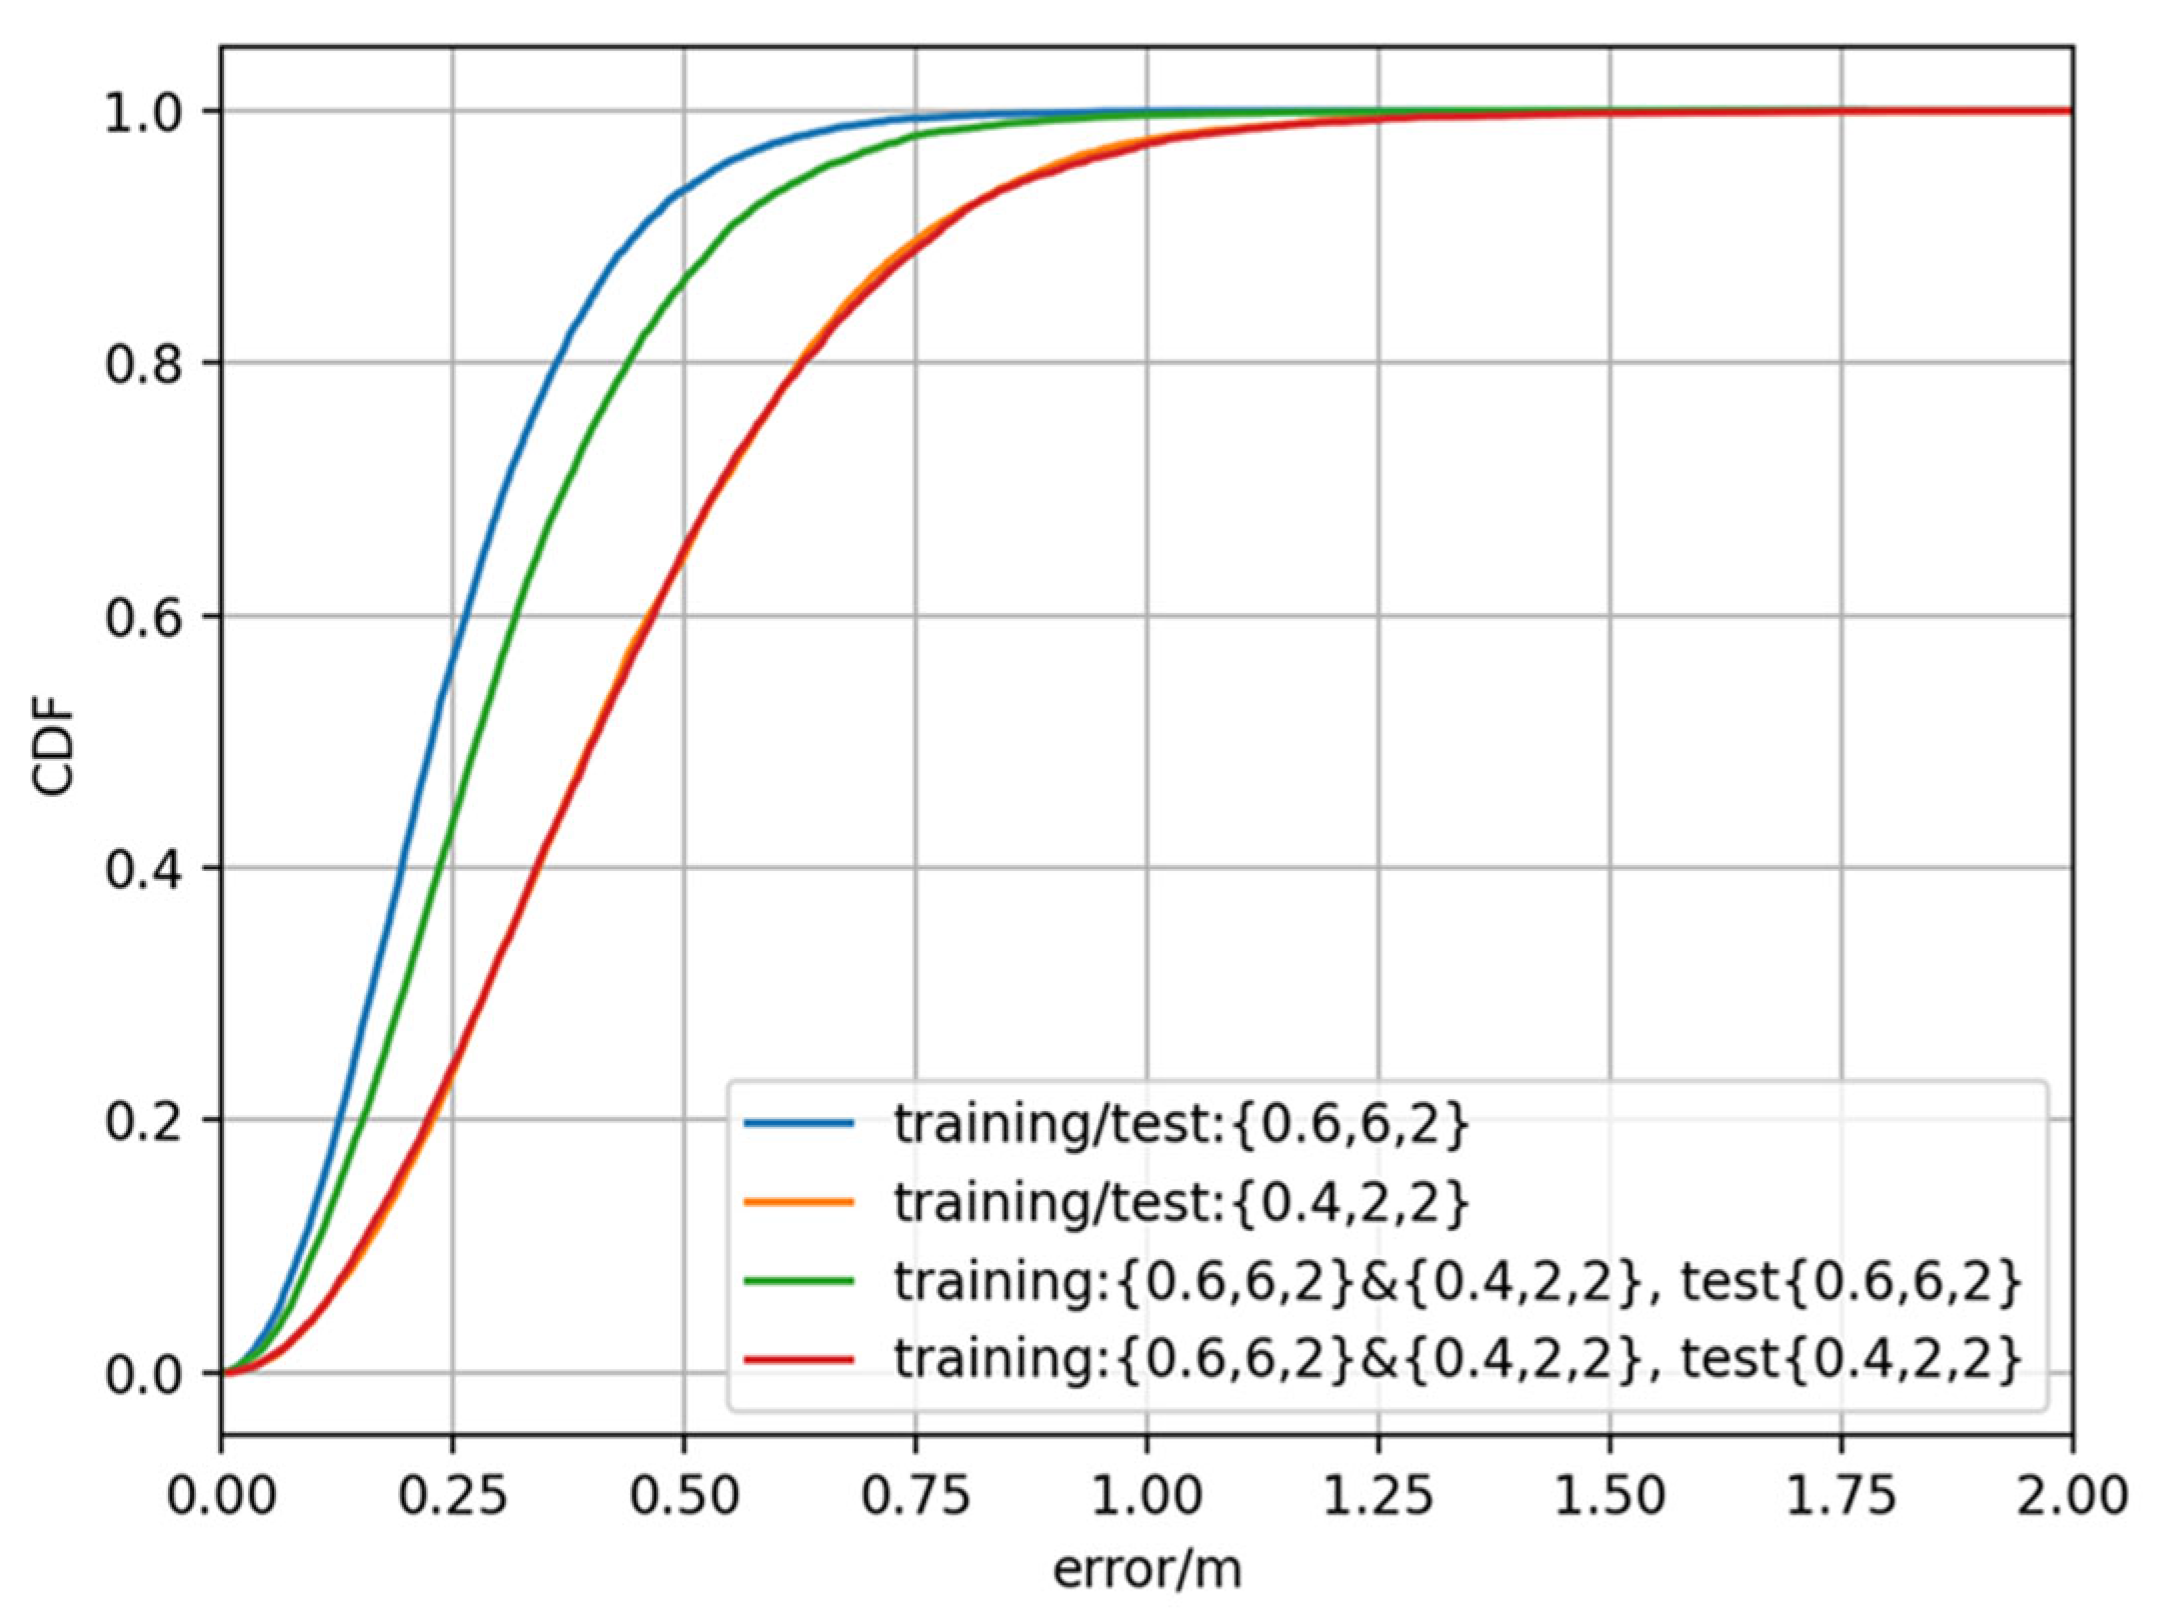
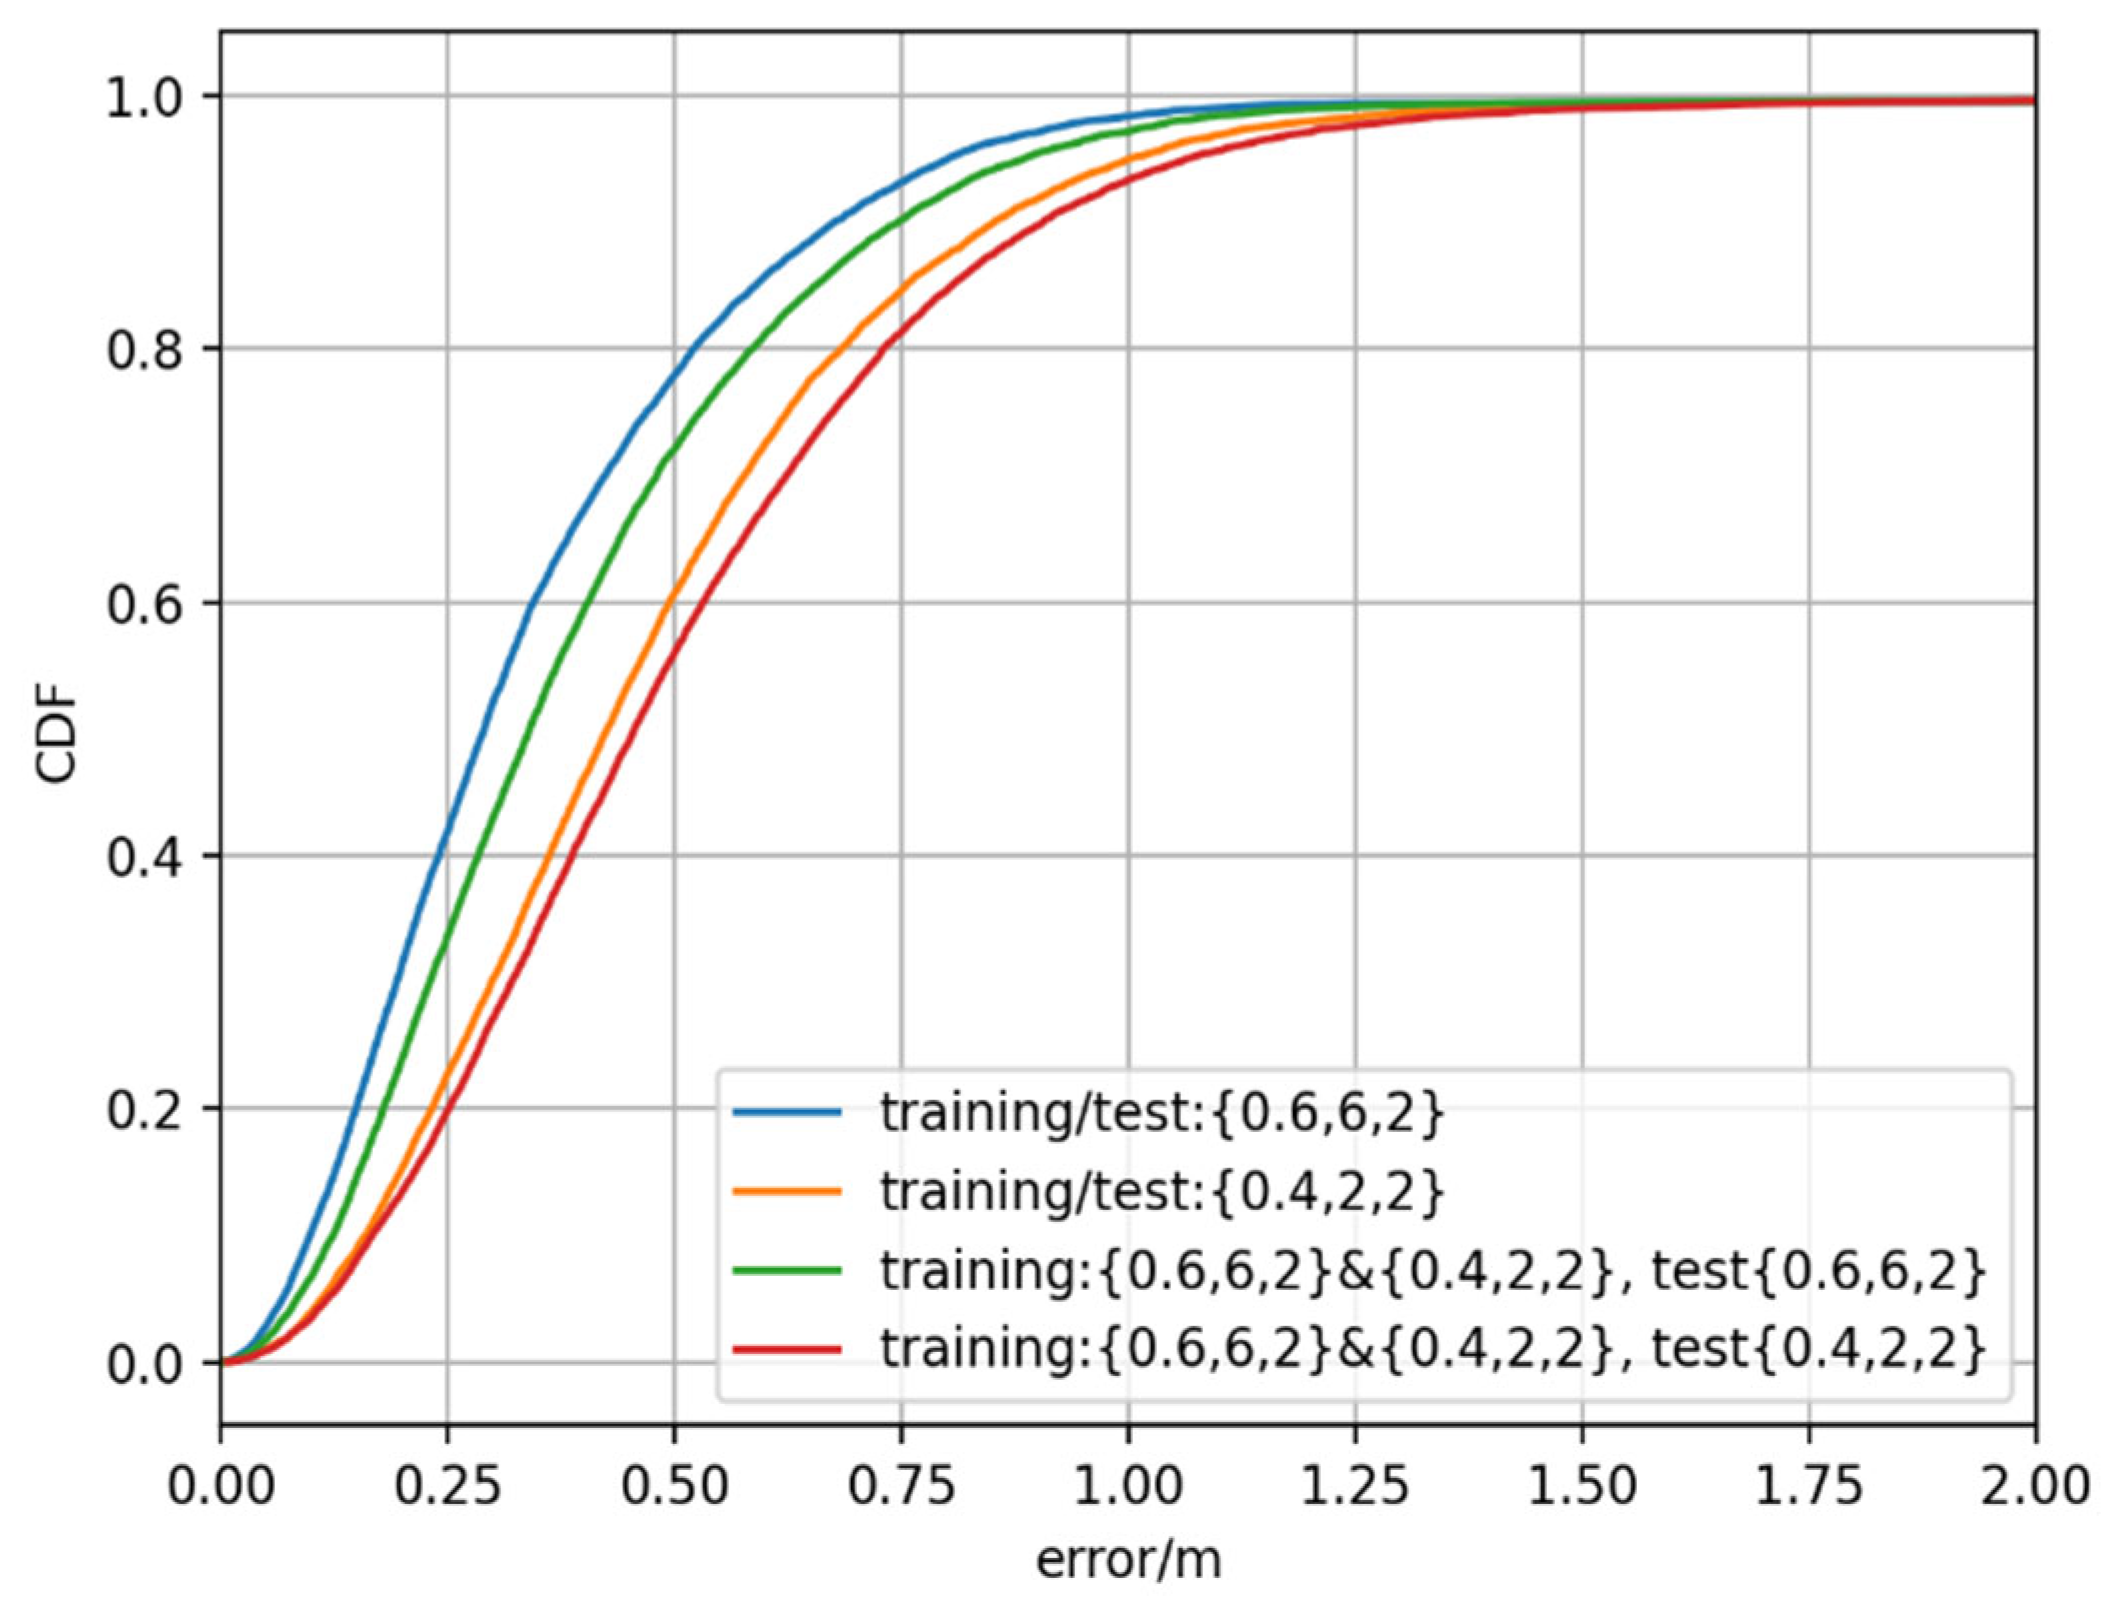
- Training manner 2: Mixed clutter parameter setting for training
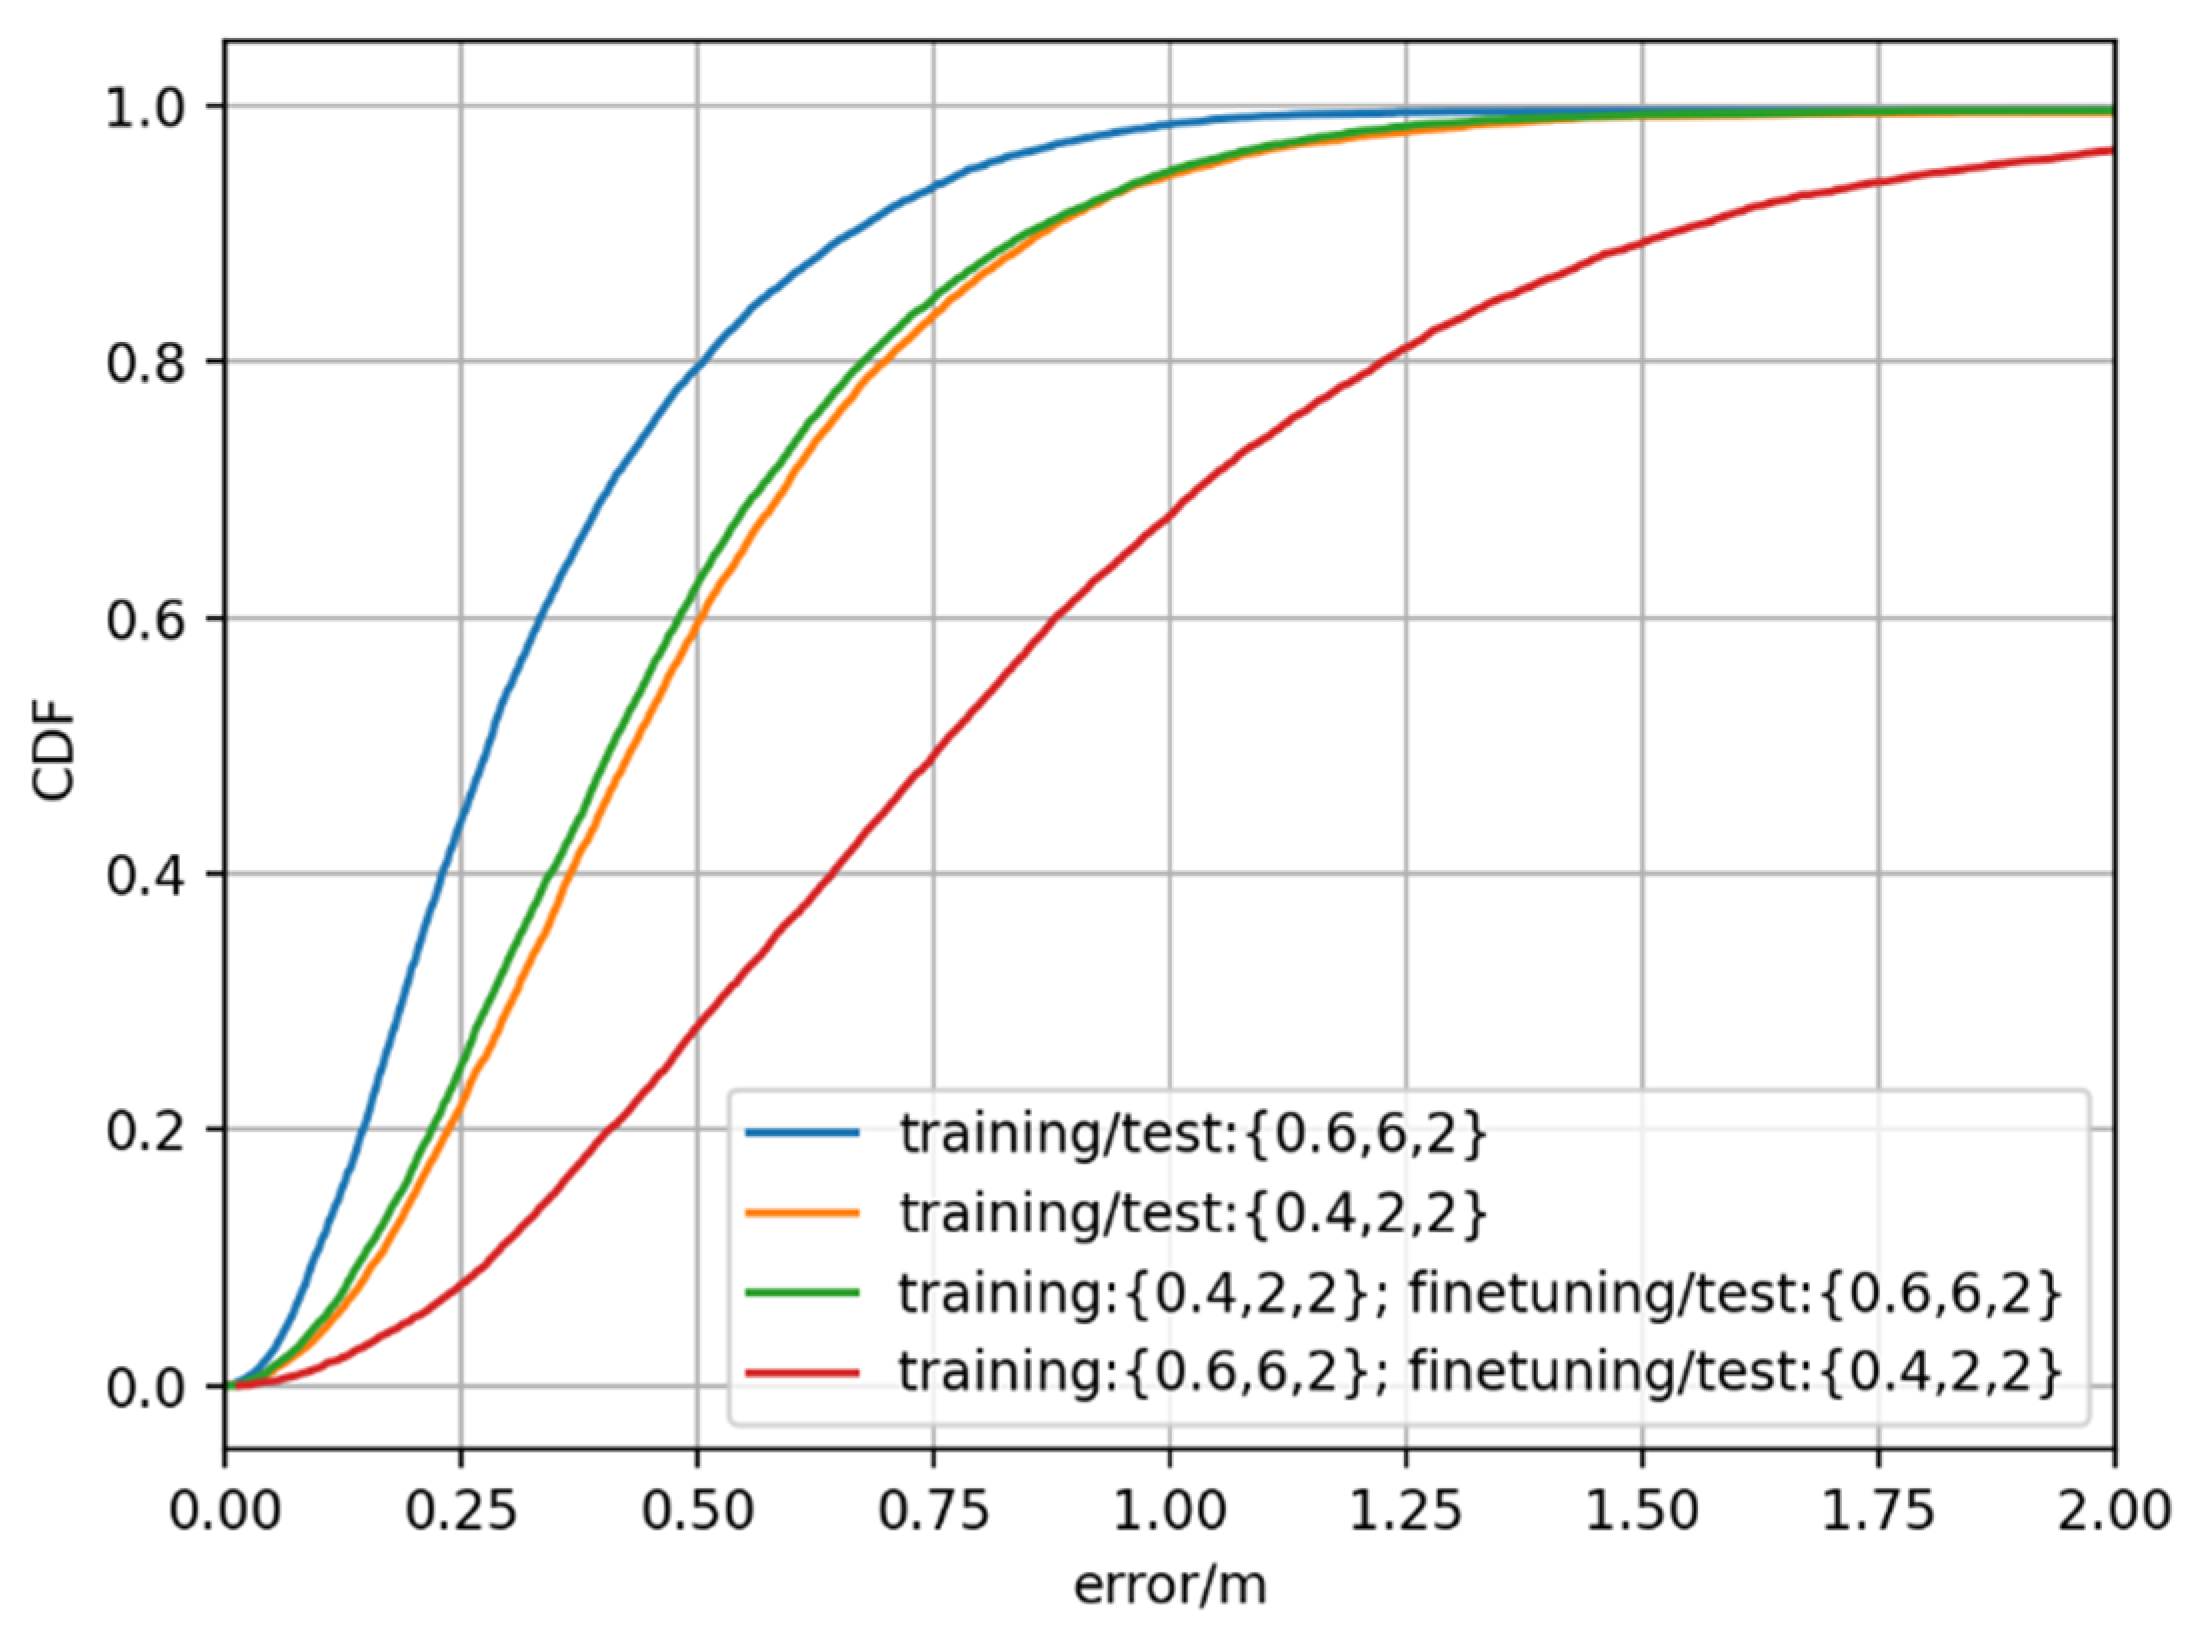
- Training manner 3: Fine-tuning
5.3. Scenario 2: Impact of Non-Ideal Network Synchronization
- Training manner 1: Training data set with ideal network synchronization and test data set with network synchronization error
- Training manner 2: Mixed network synchronization error setting for training
- Training manner 3: Fine-tuning
5.4. Scenario 3: Non-Ideal Receiving Timing
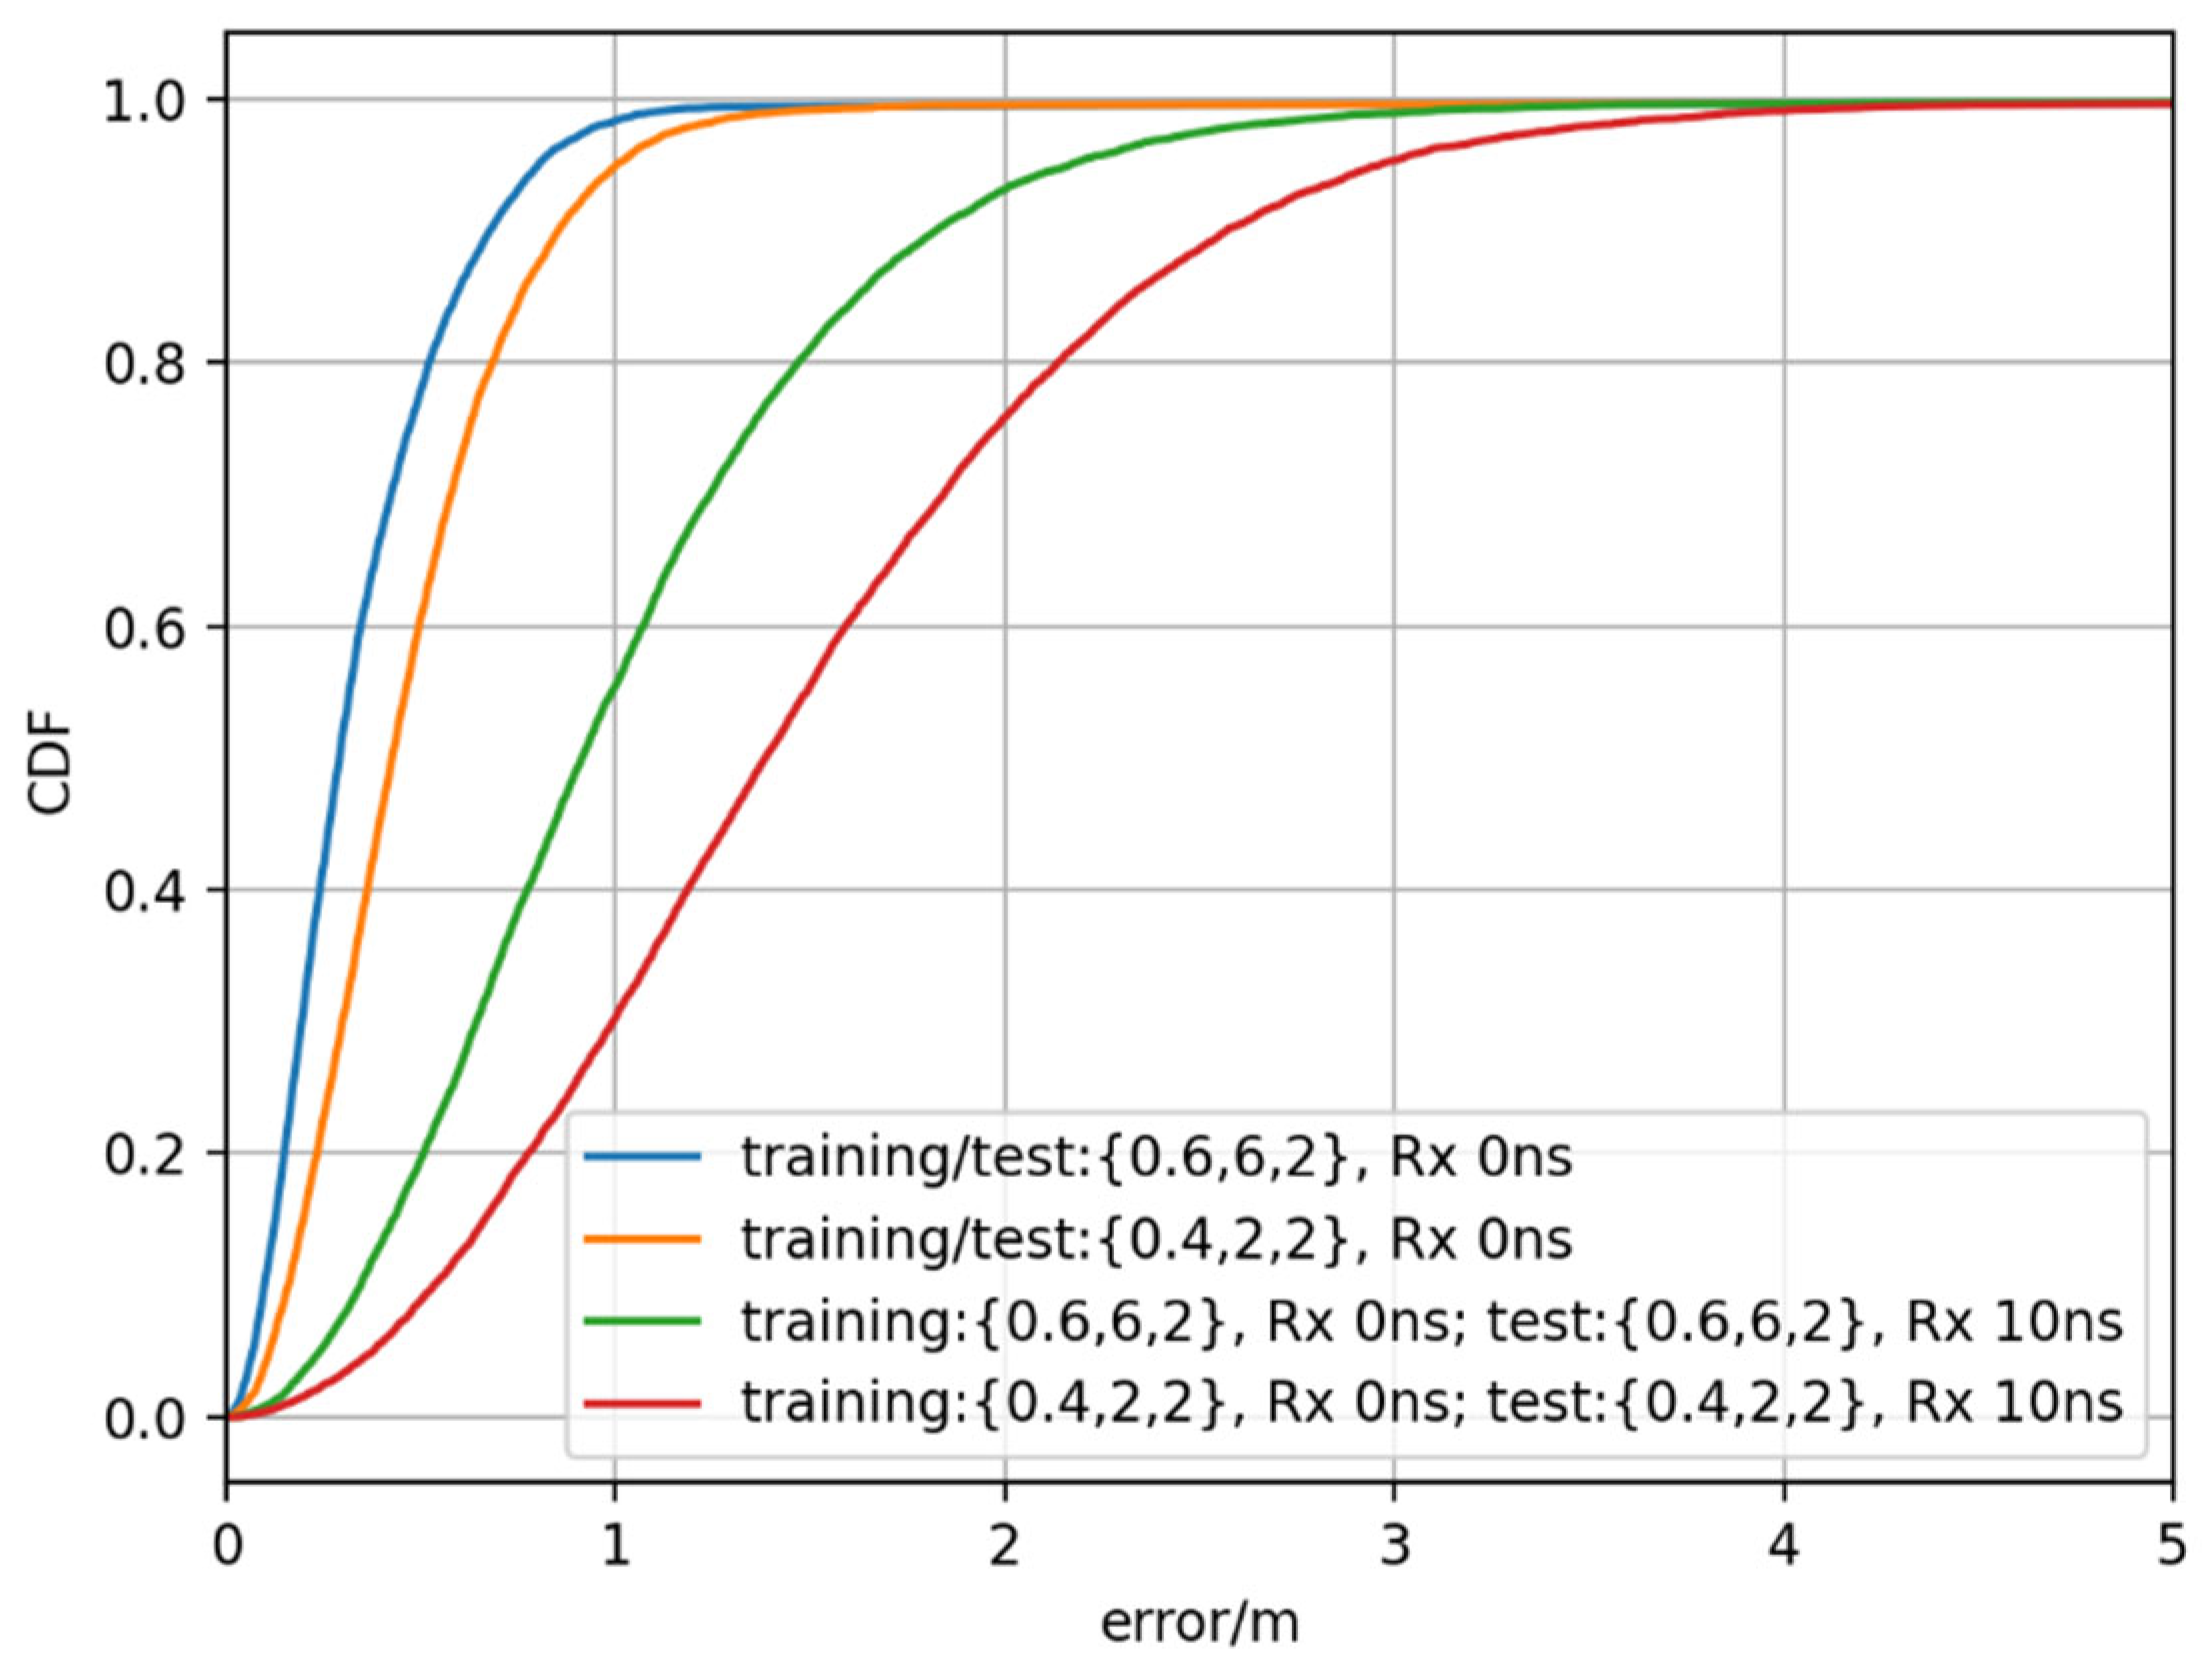
- Training manner 1: Training data set with ideal receiving timing and test data set with Receiving timing error
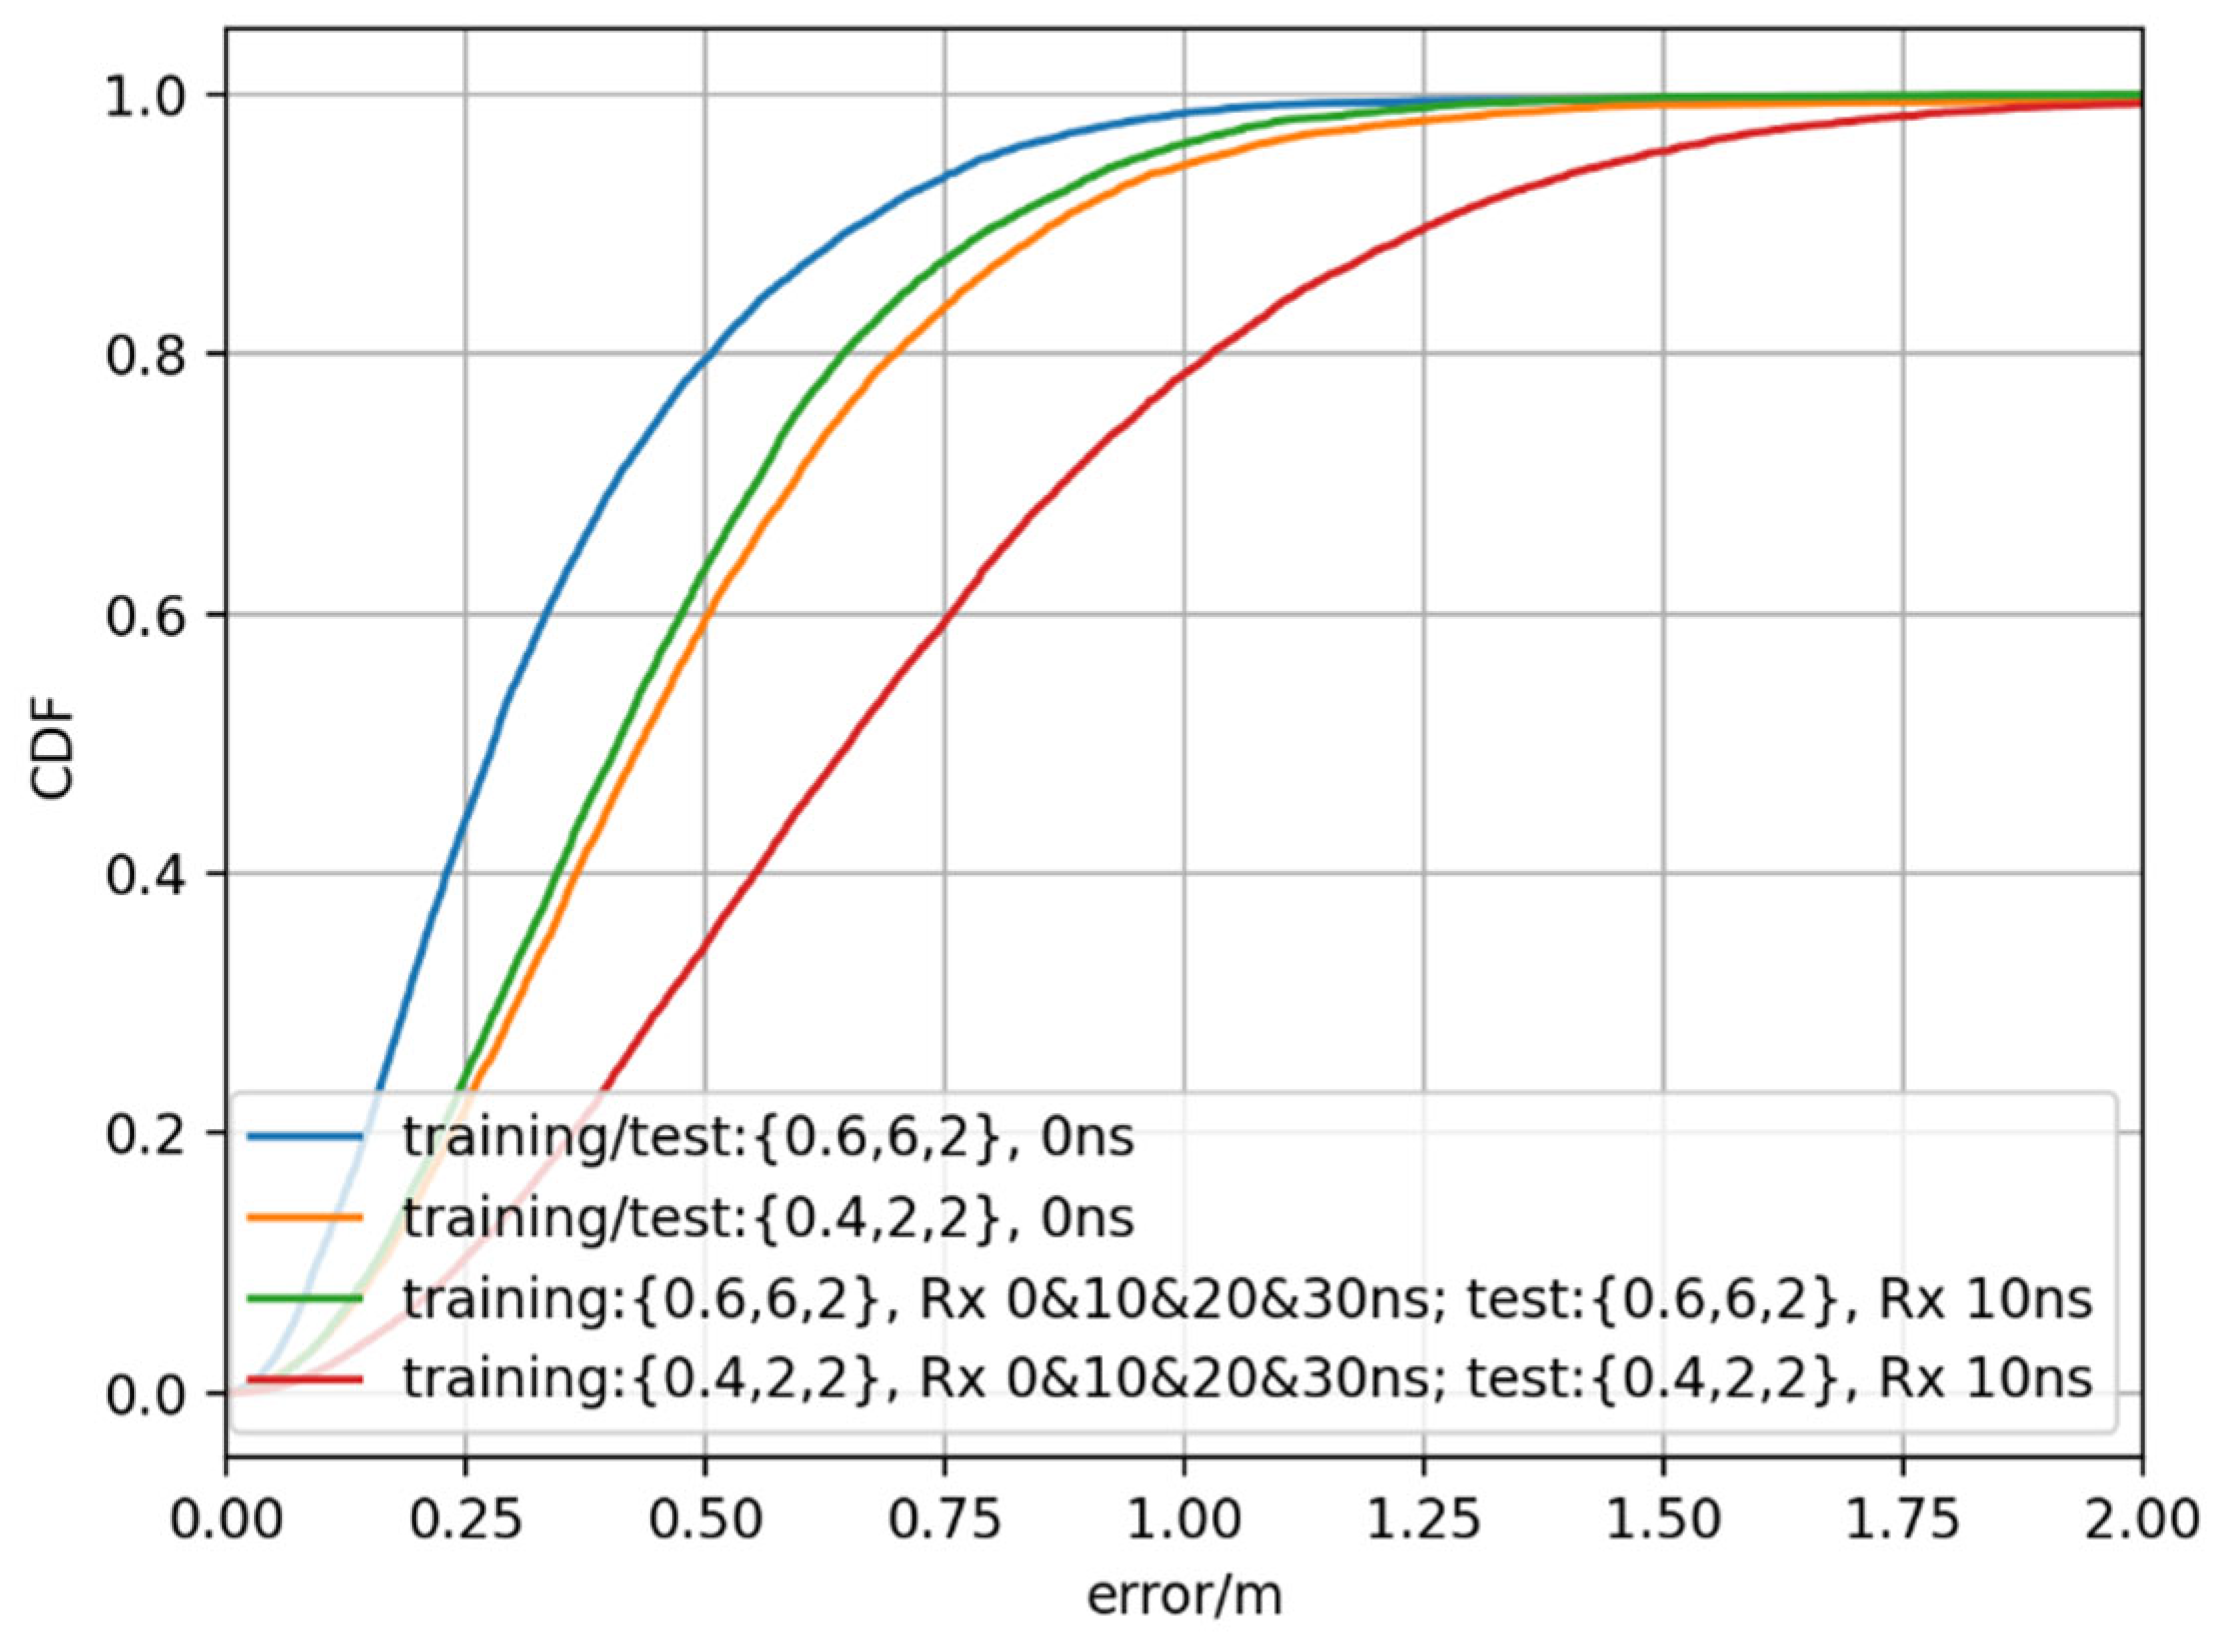
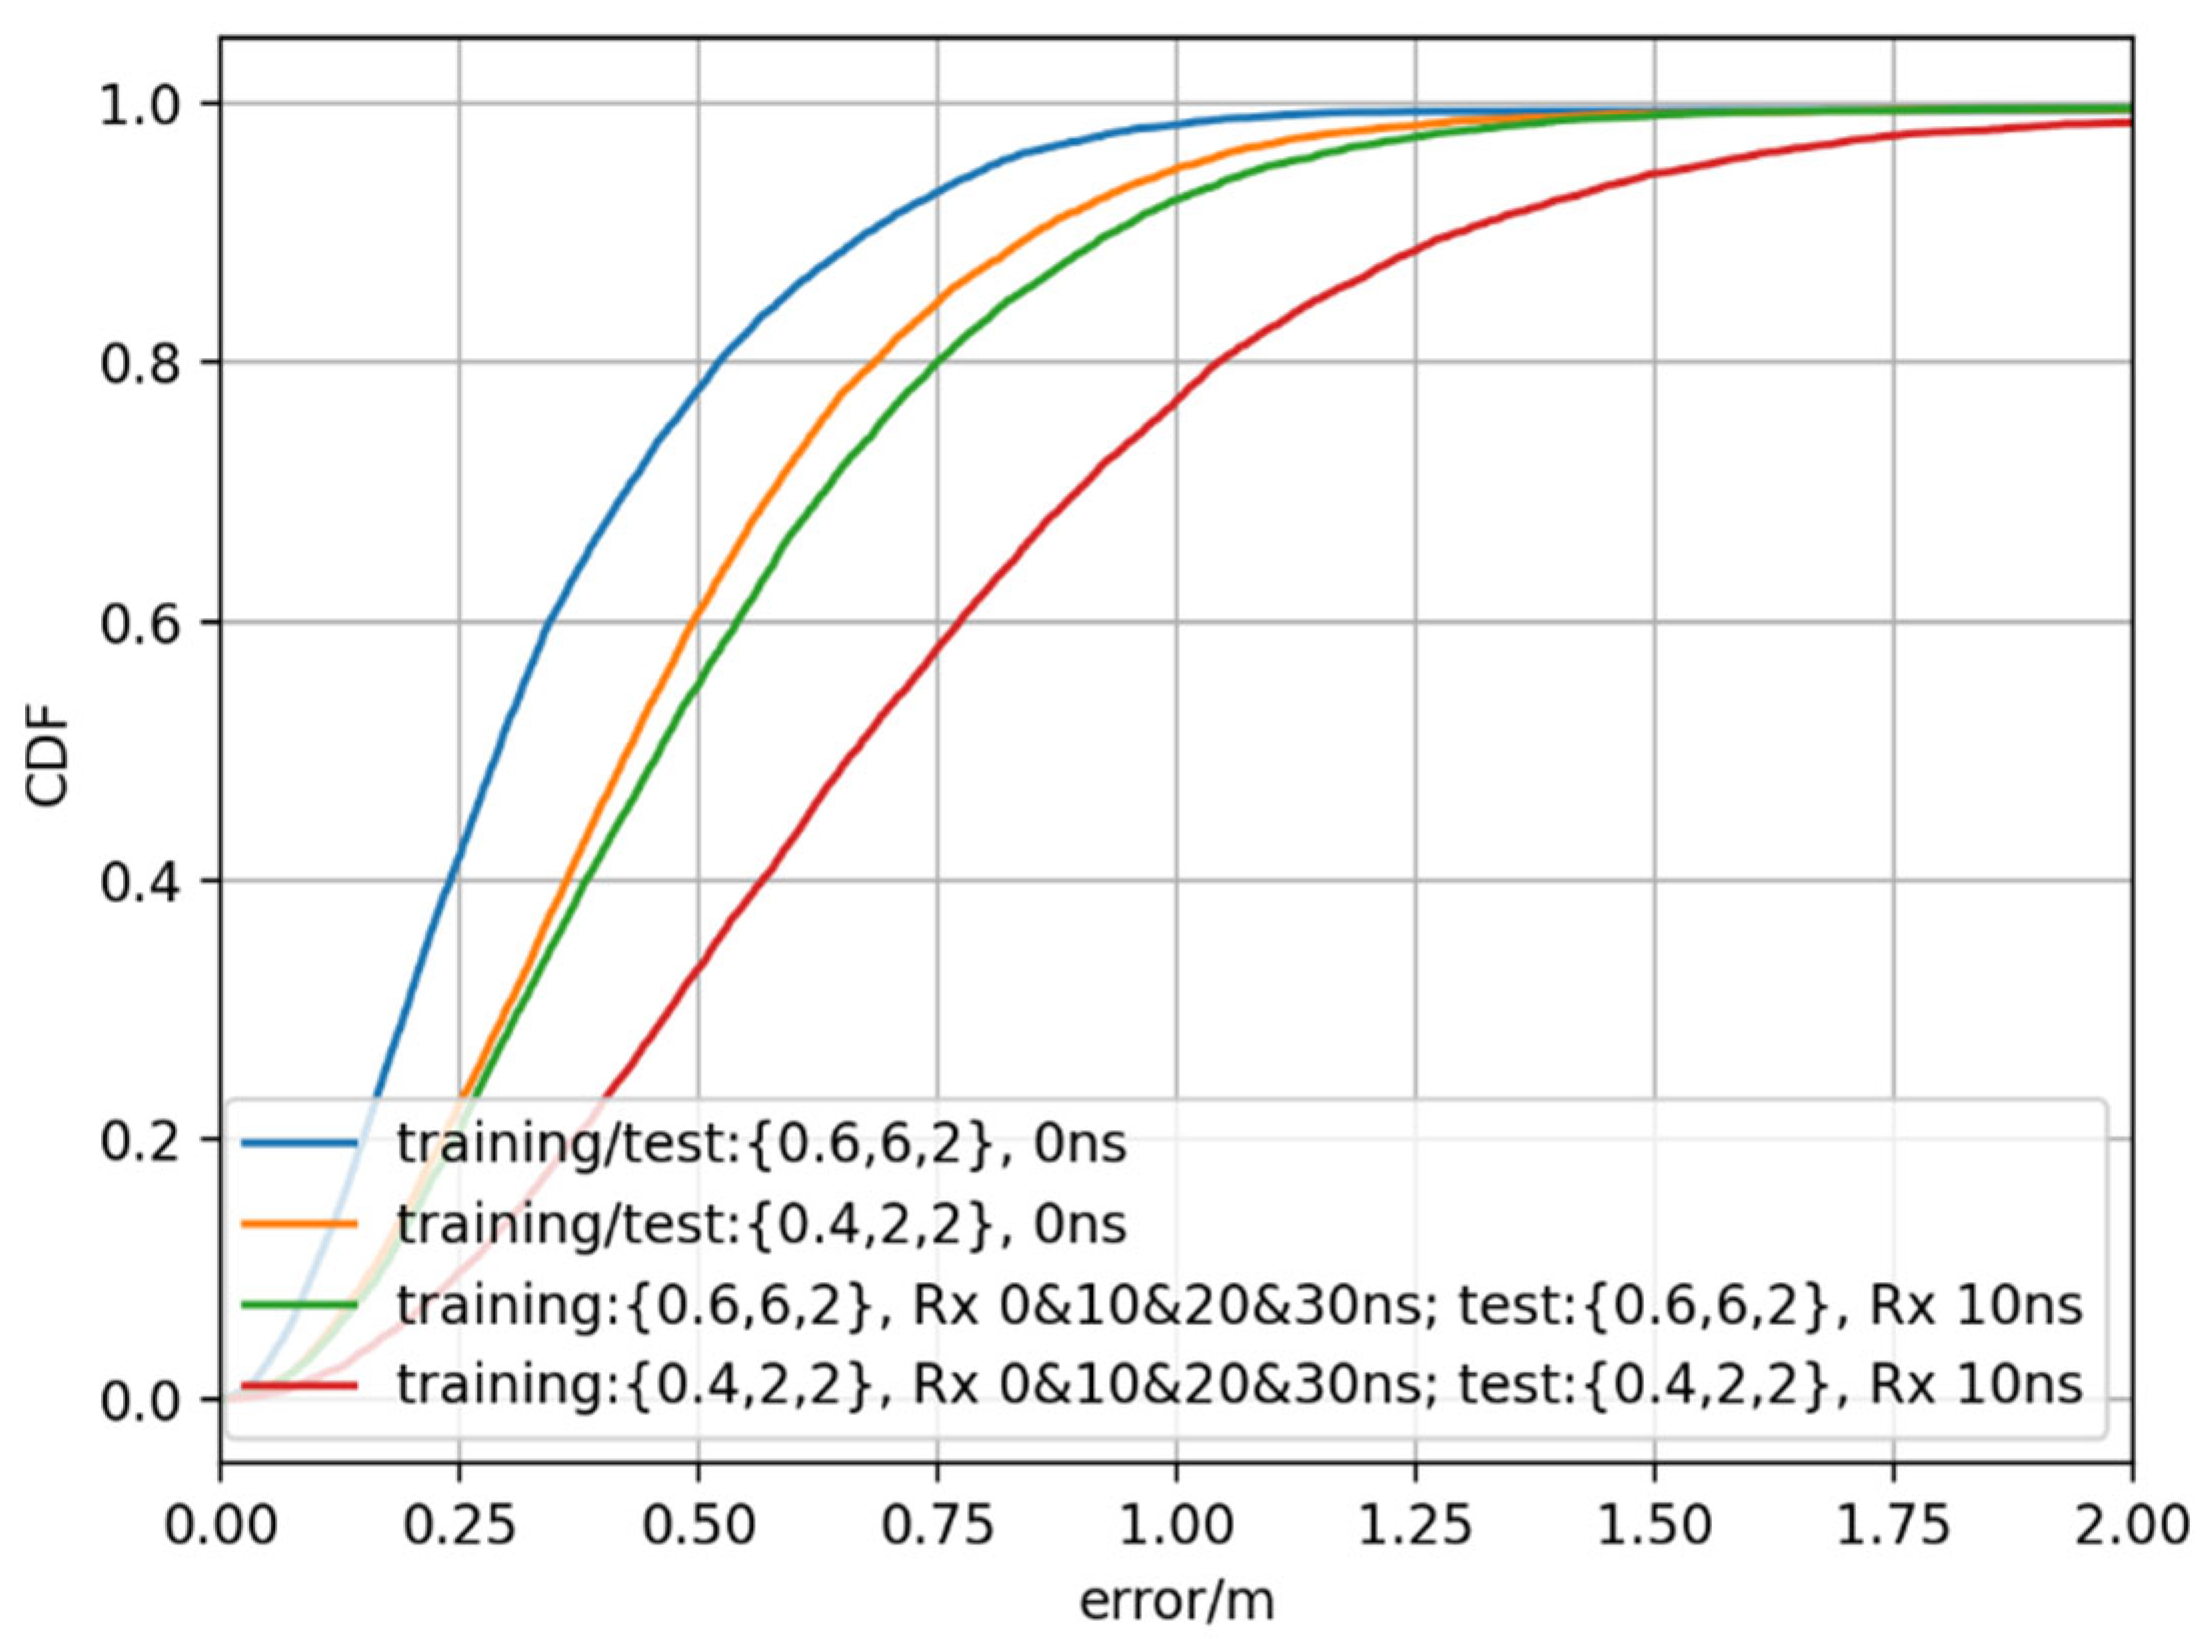
- Training manner 2: Mixed receiving timing error setting for training
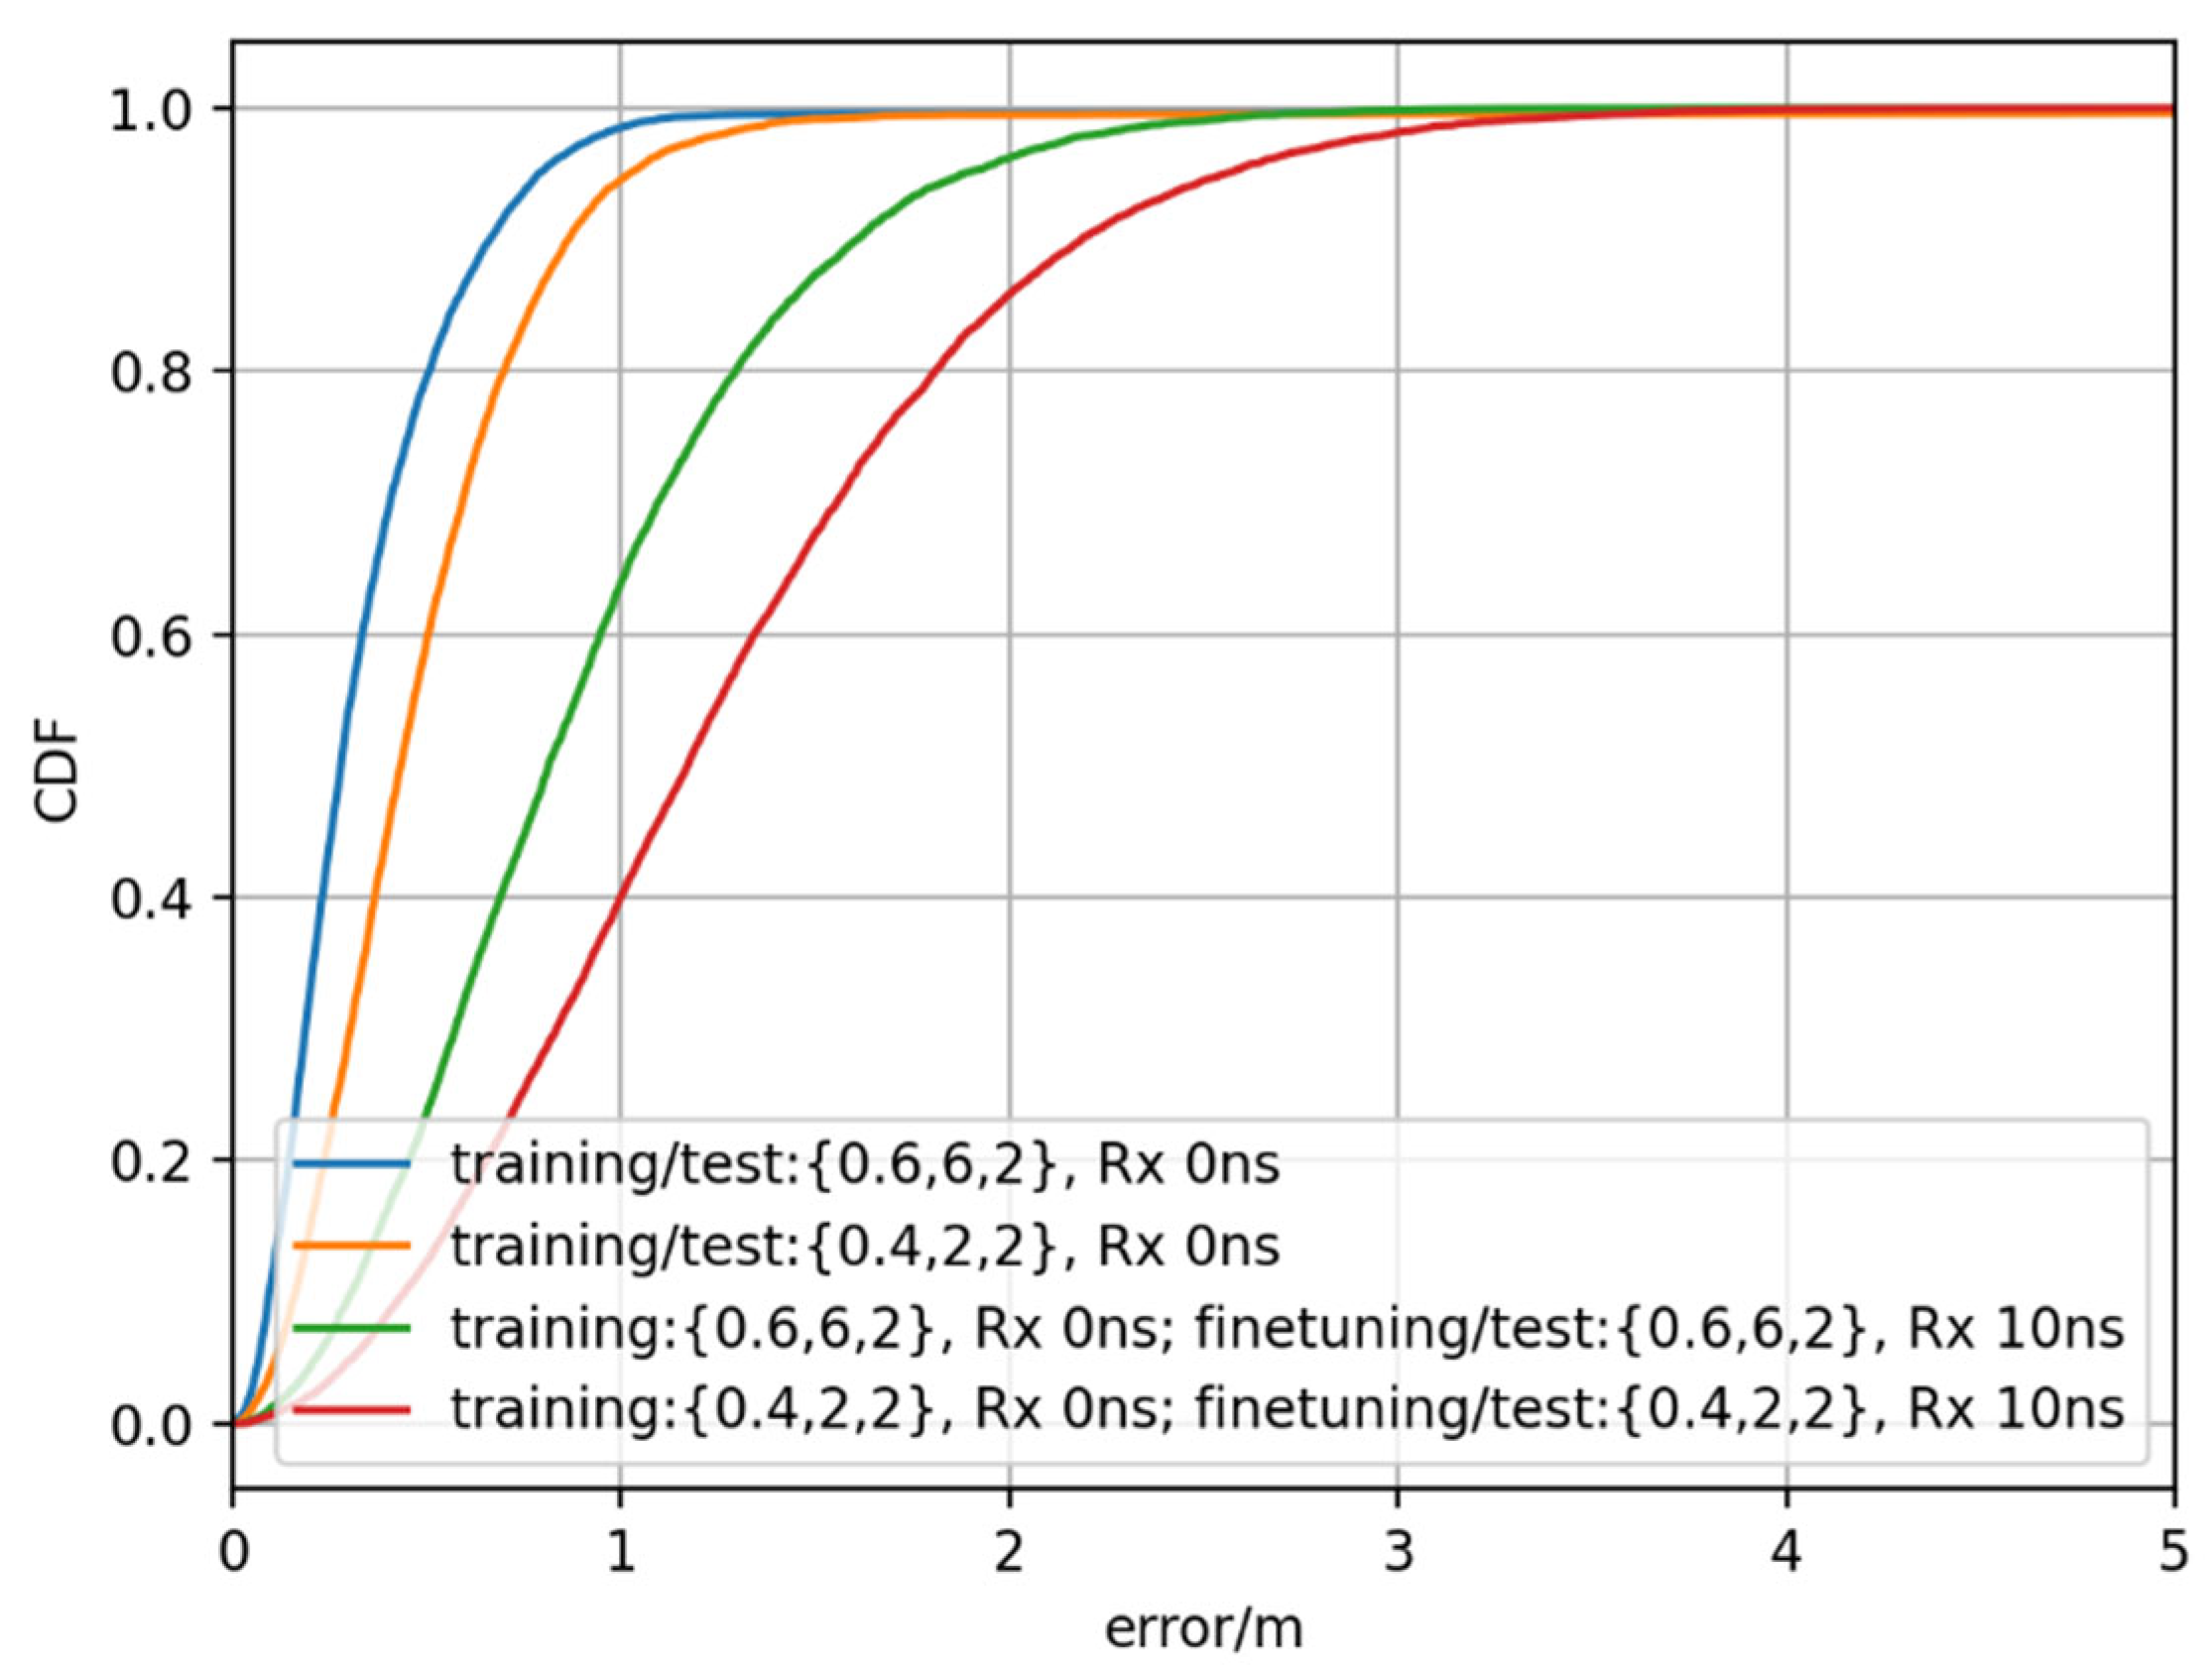
- Training Manner 3: Fine-Tuning
5.5. Discussion and Summary
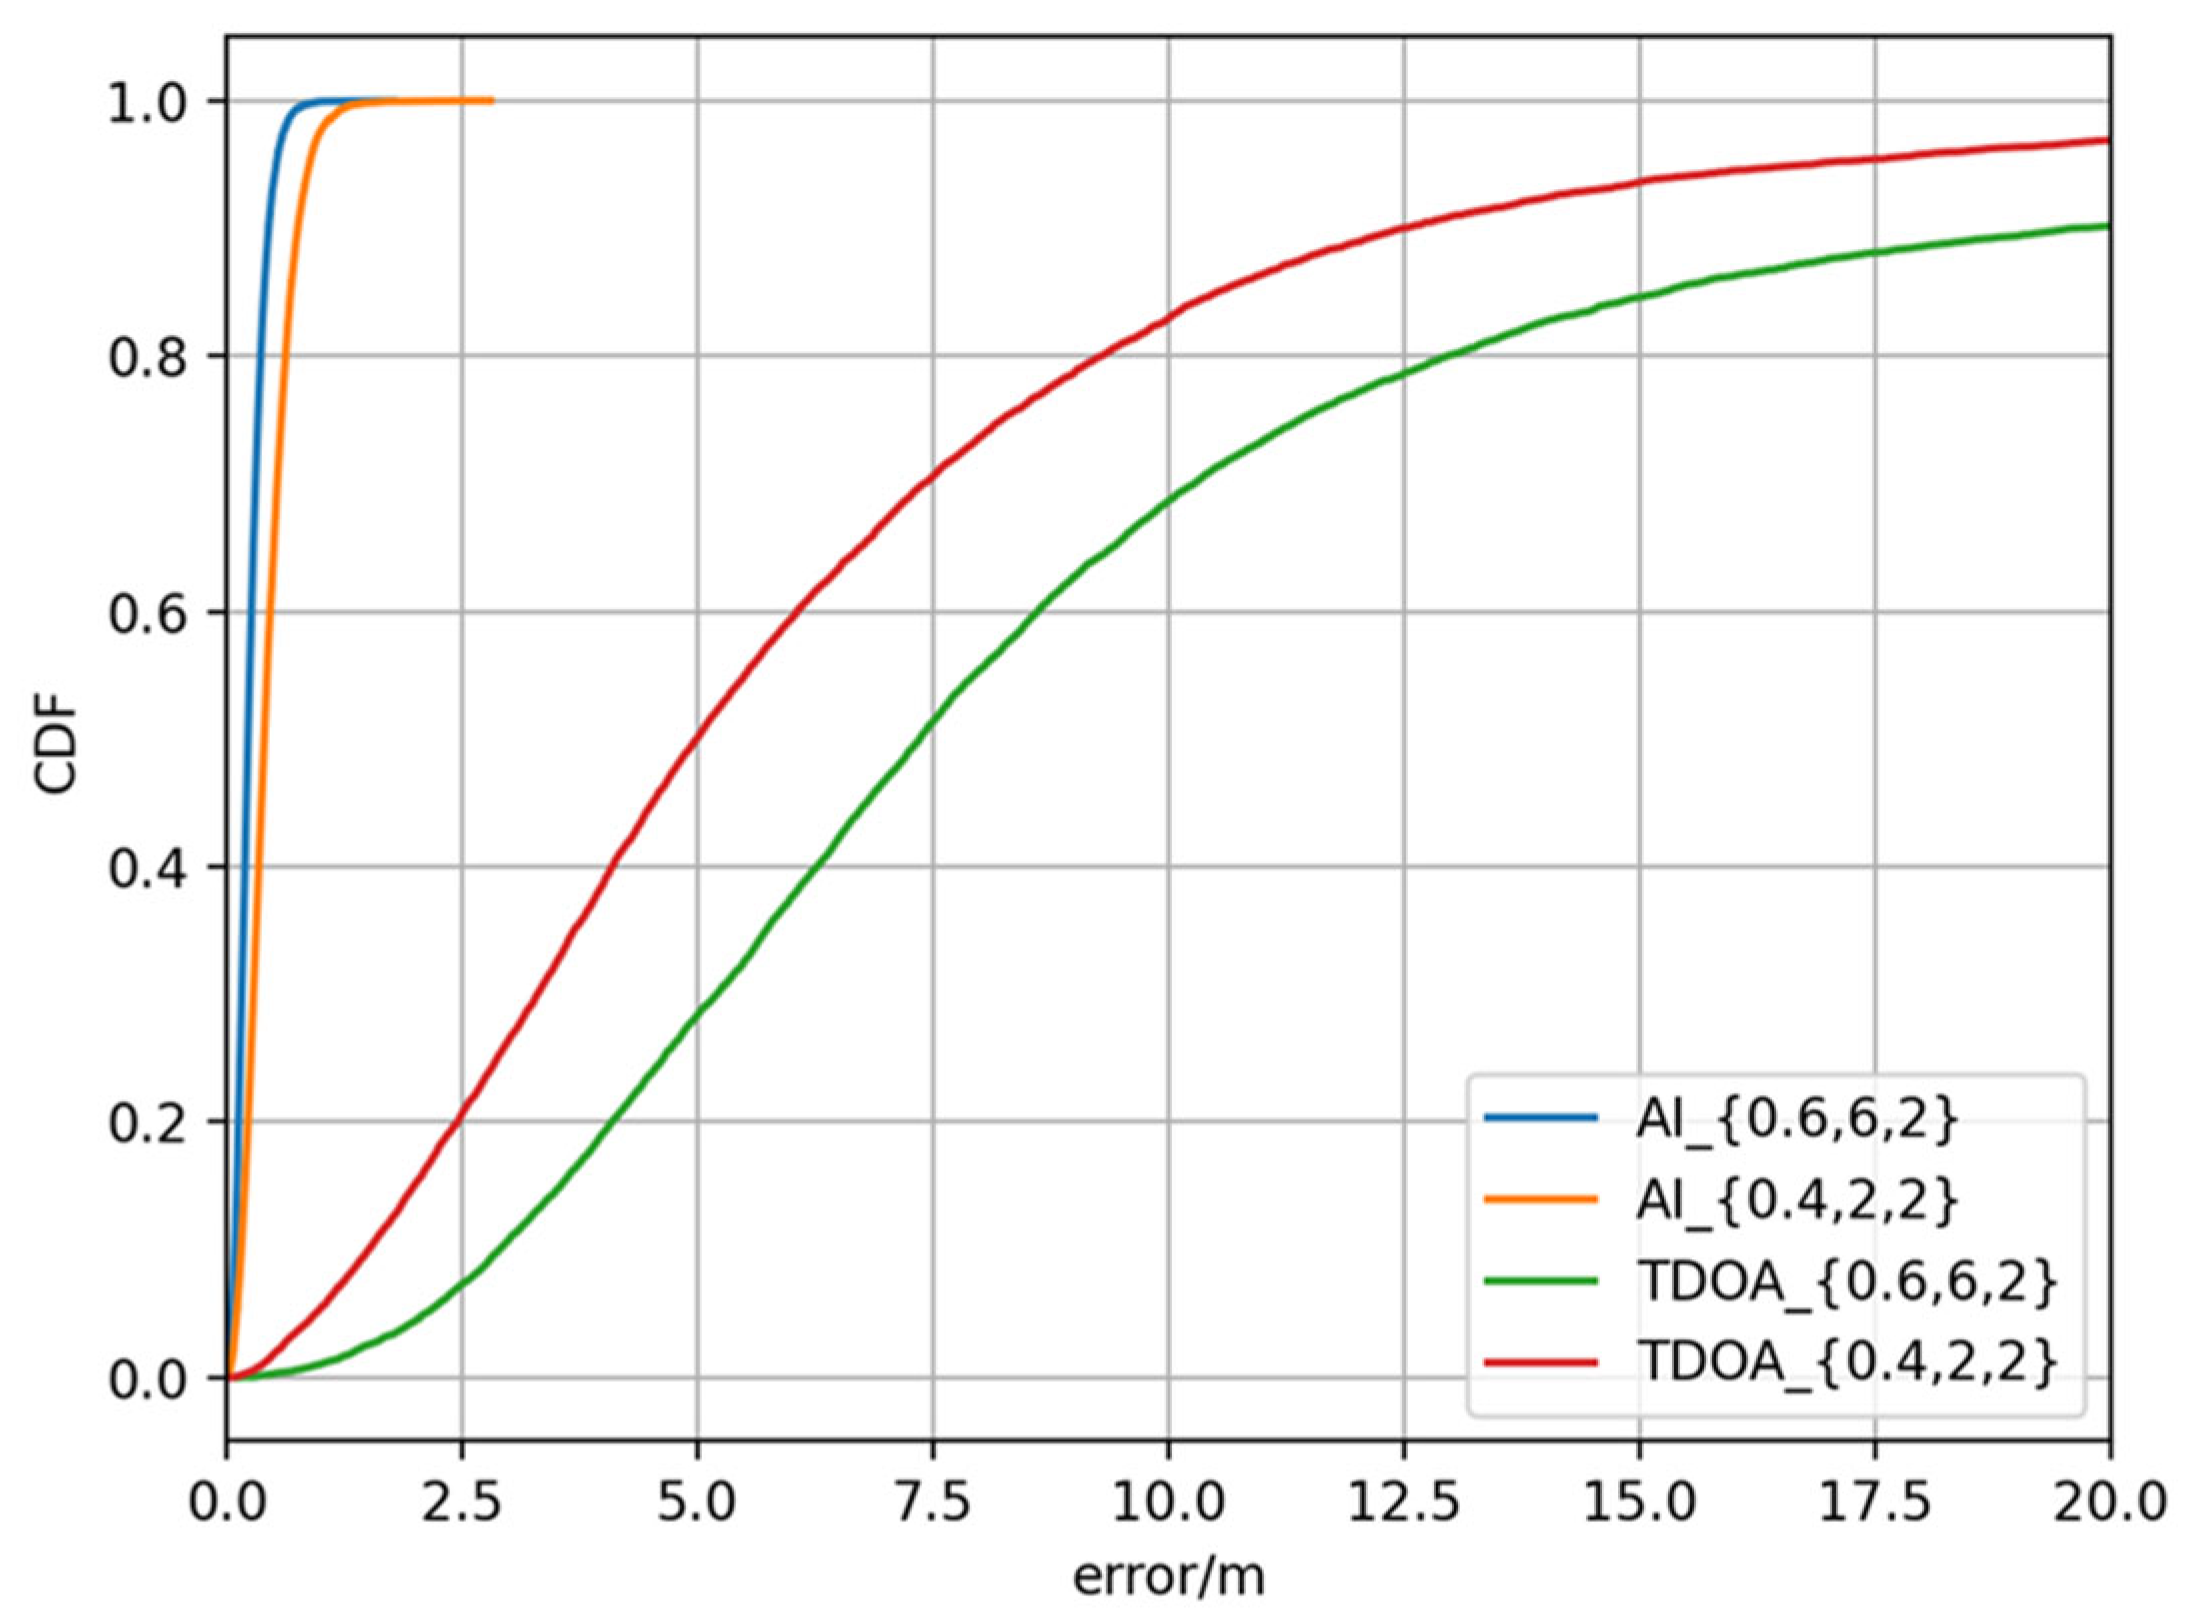
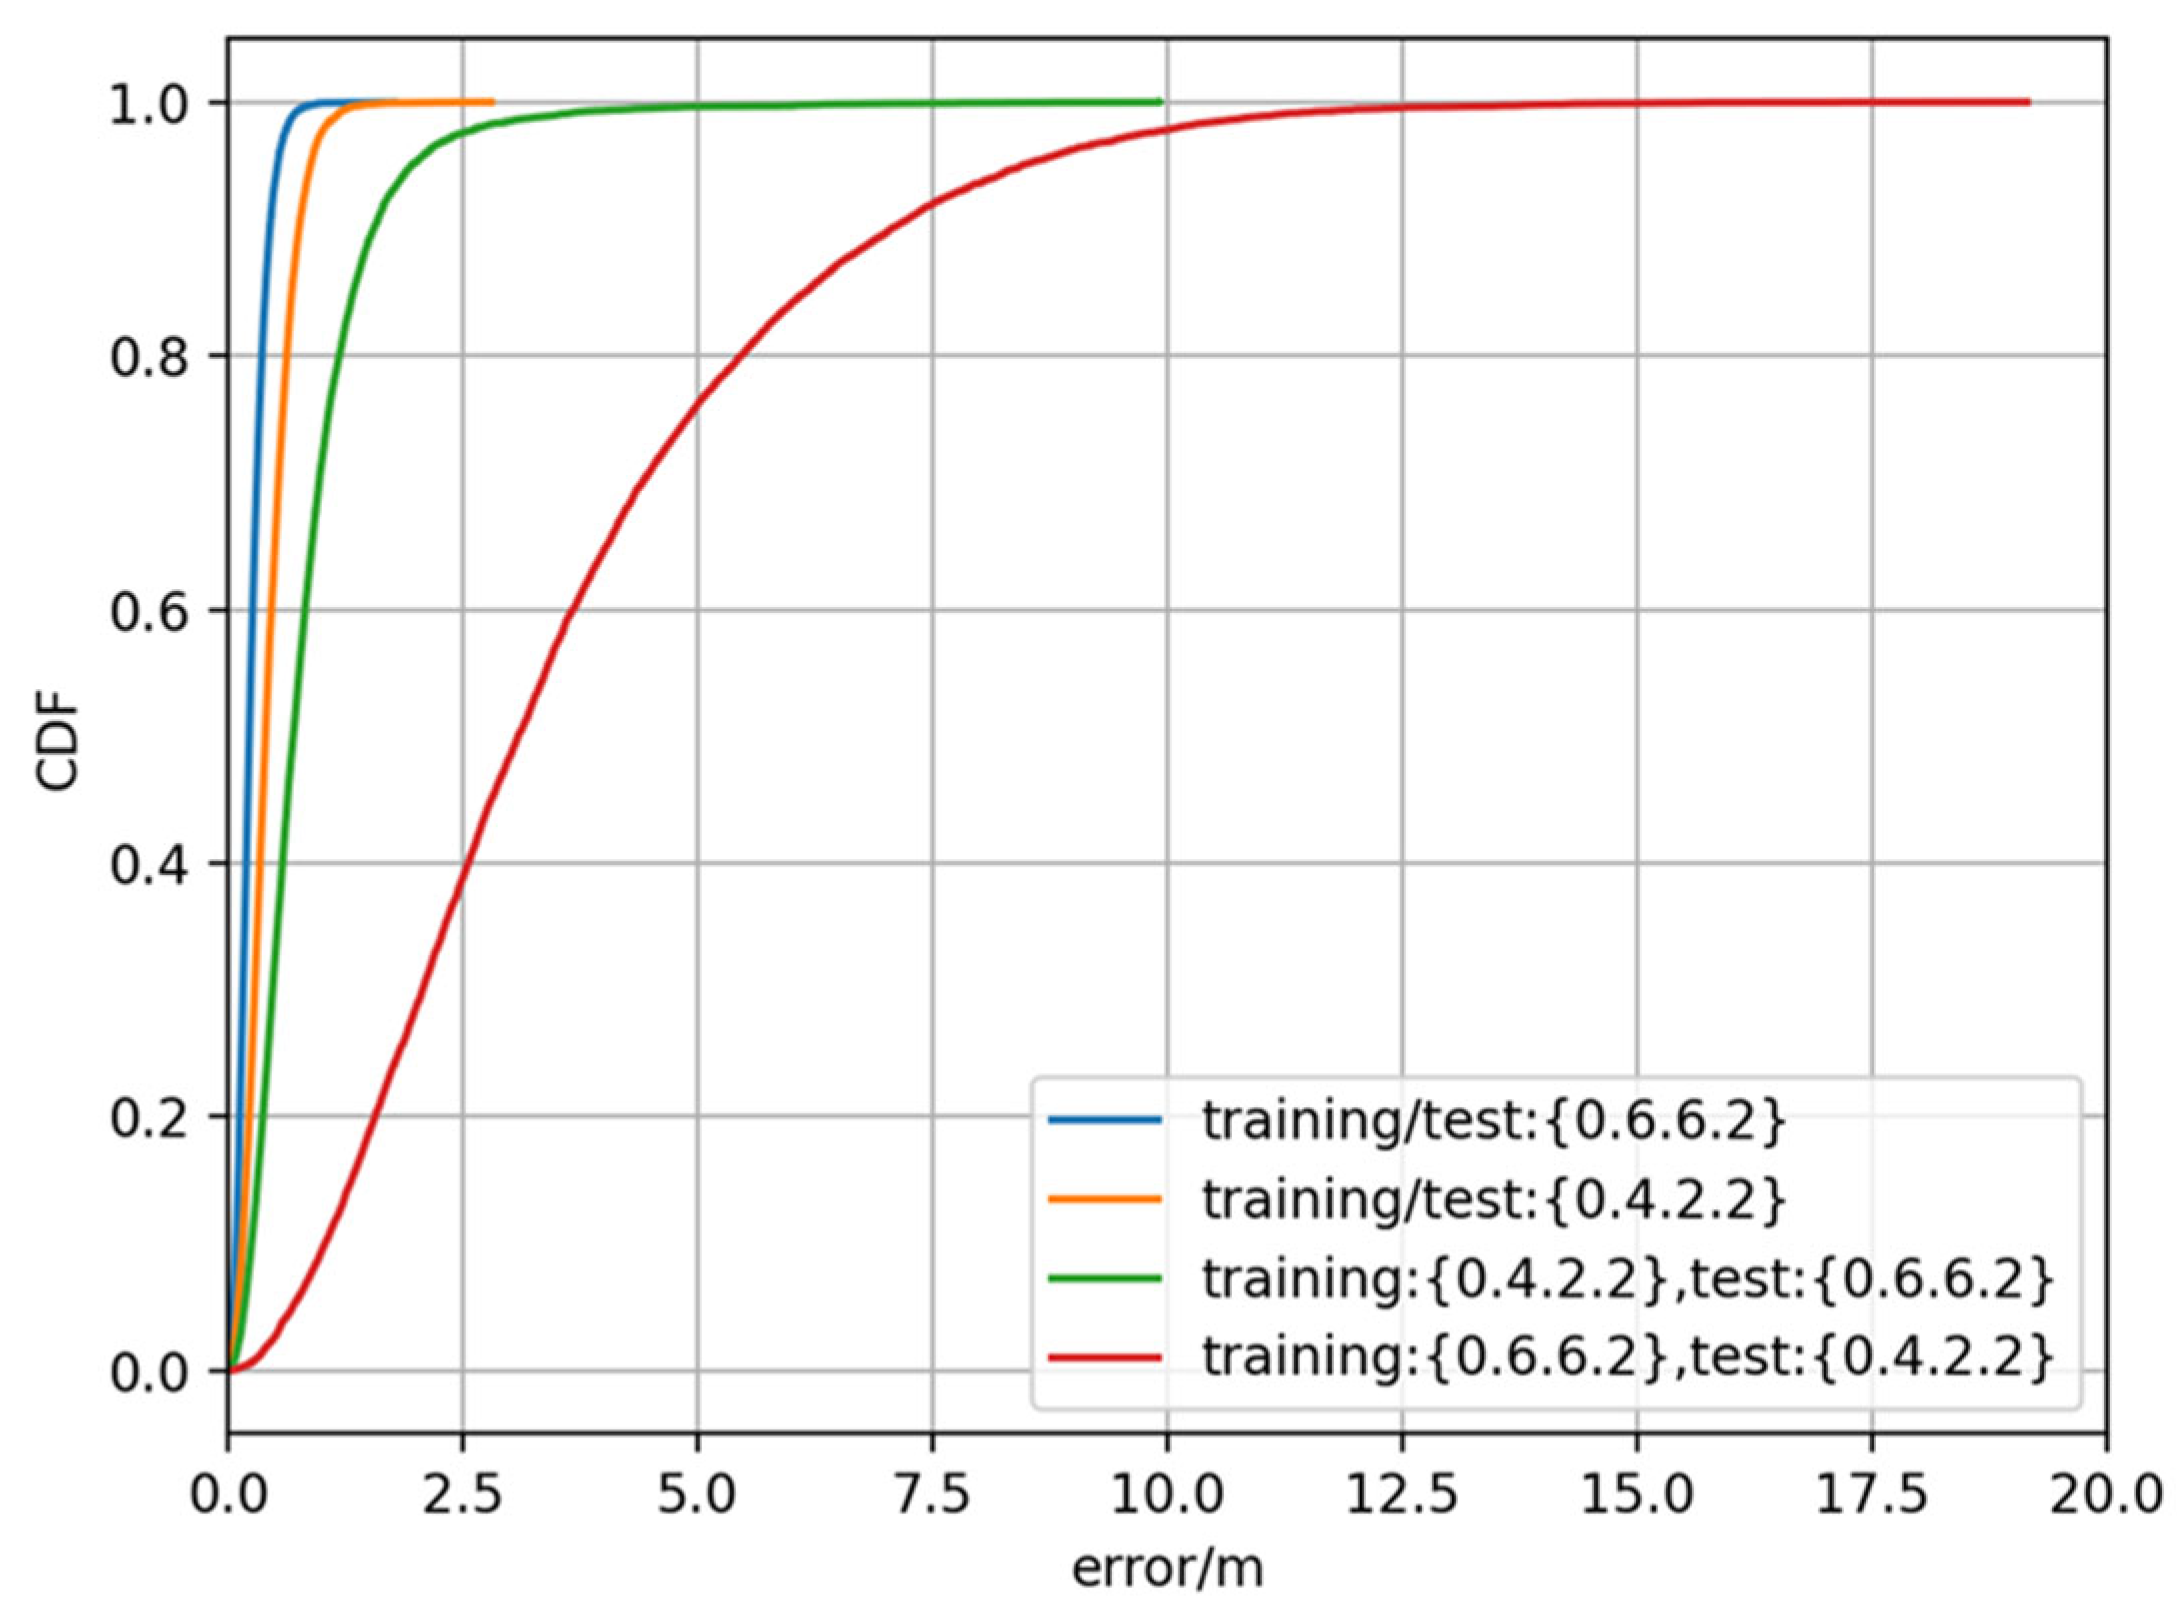
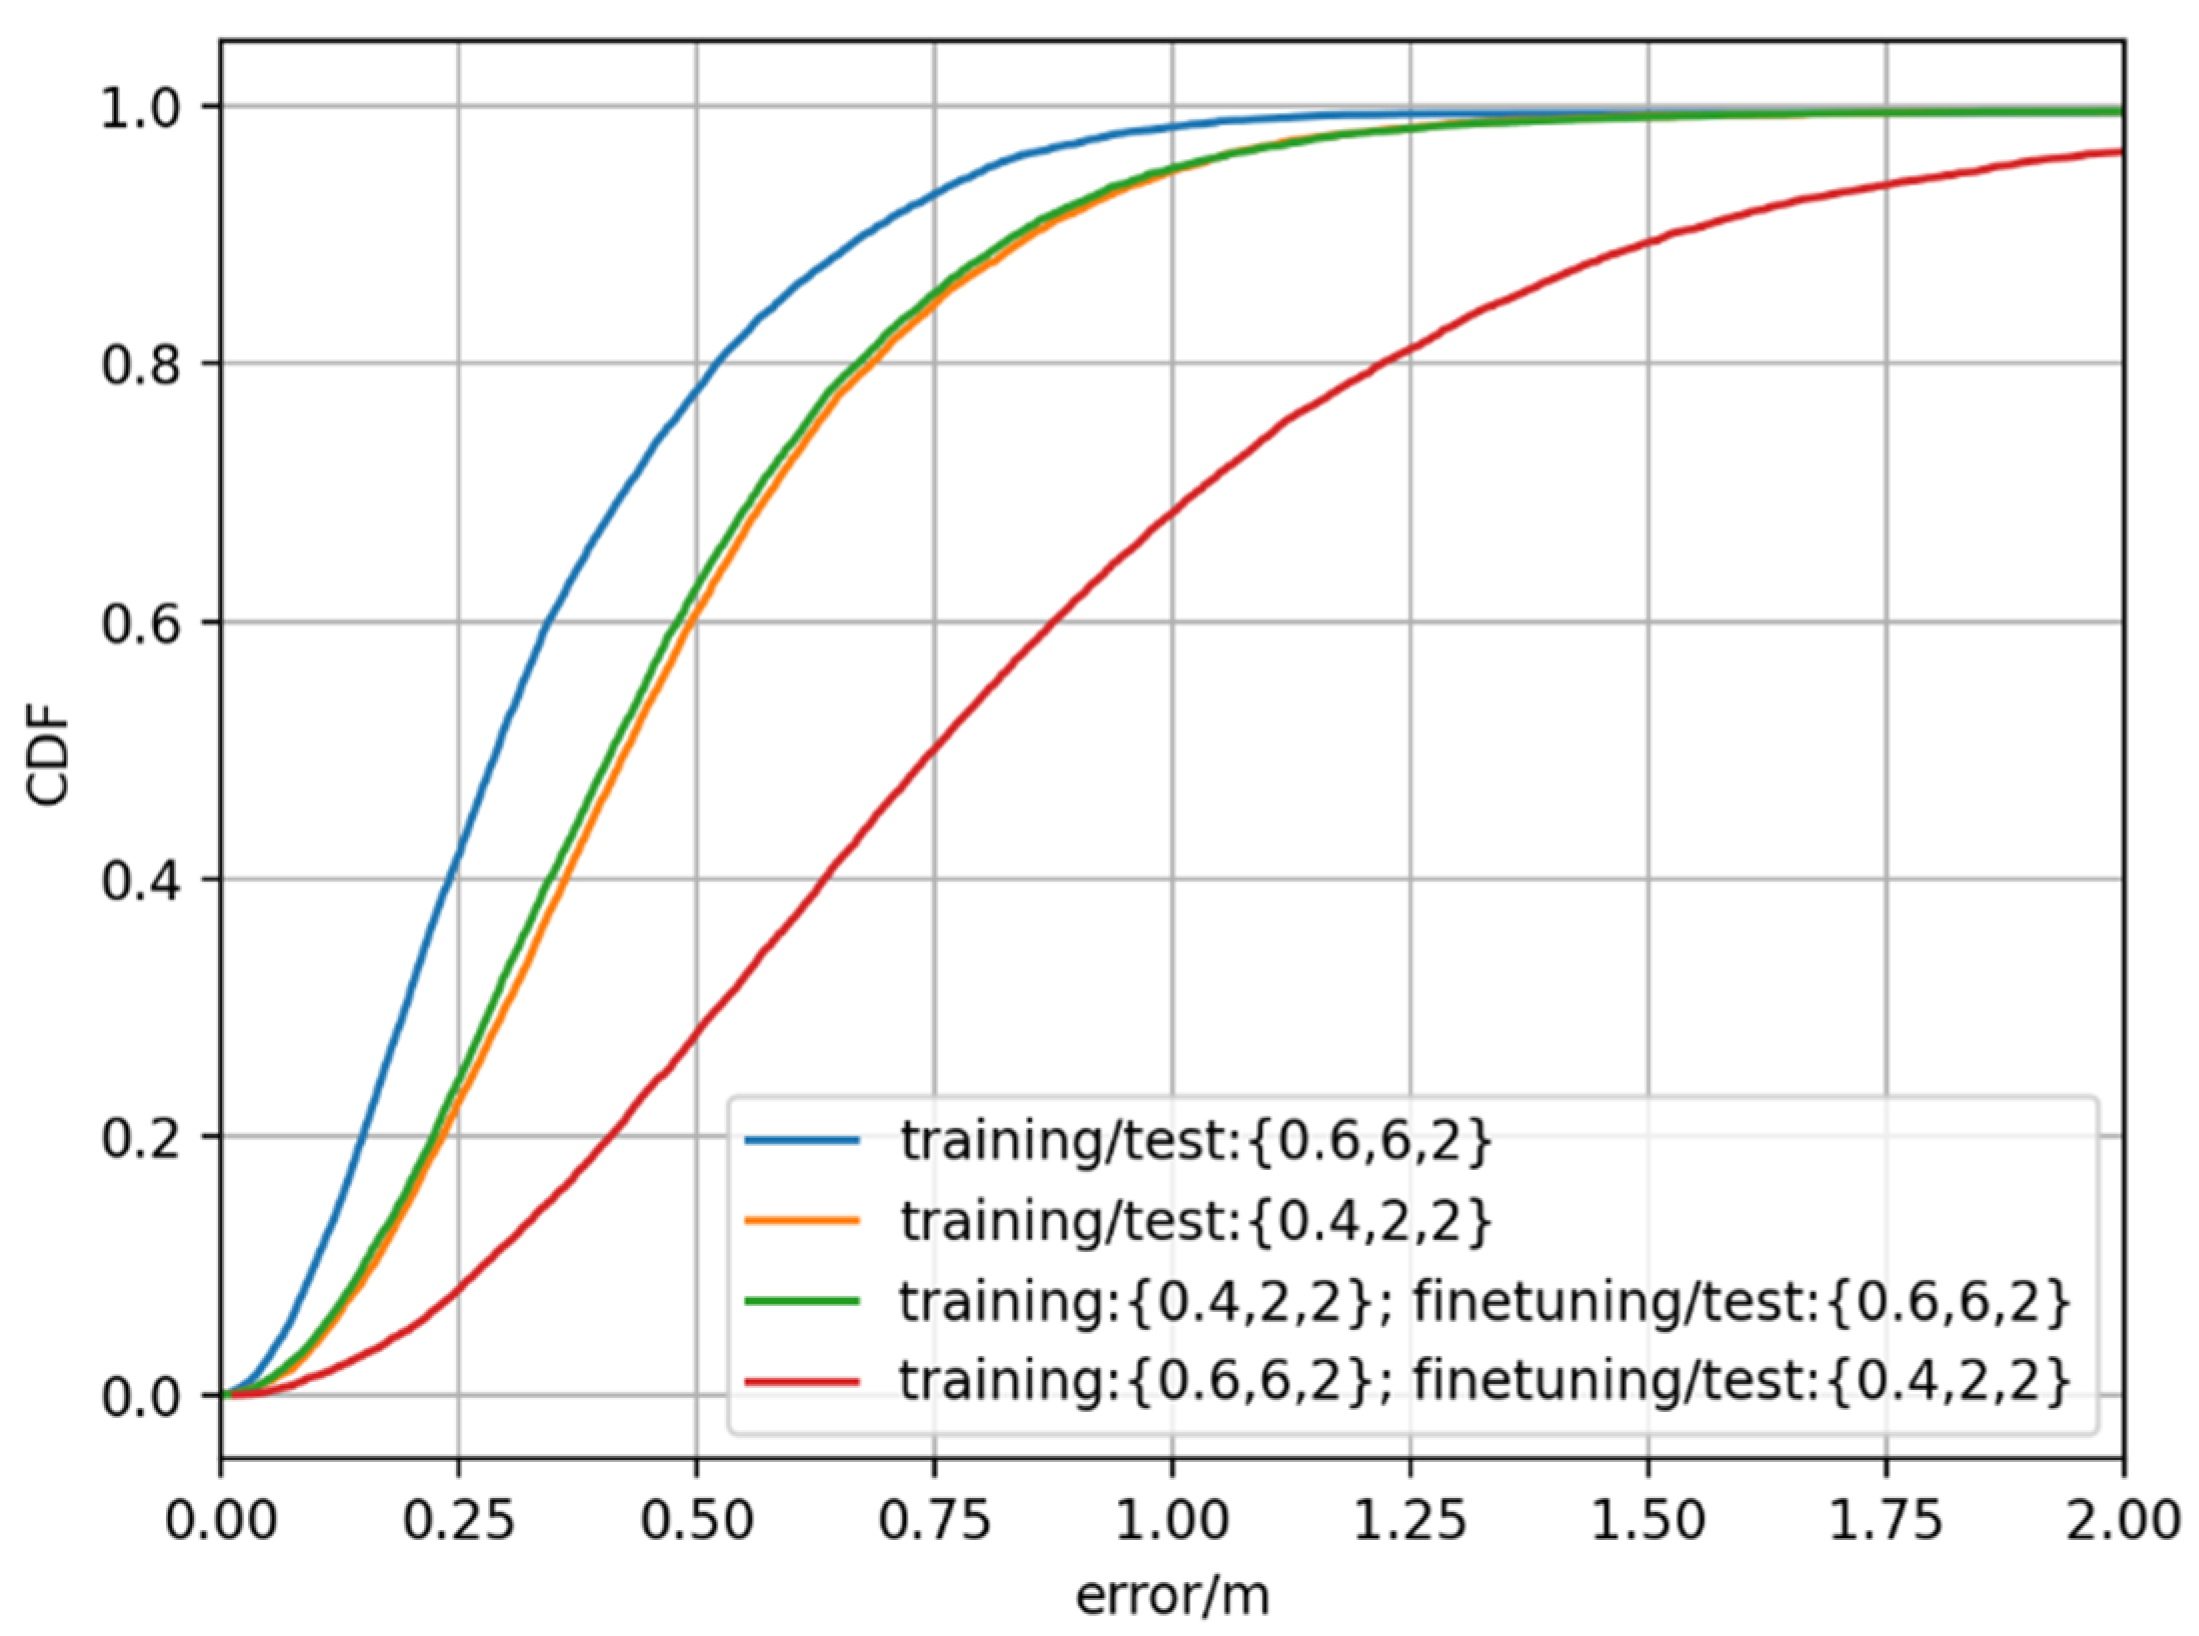
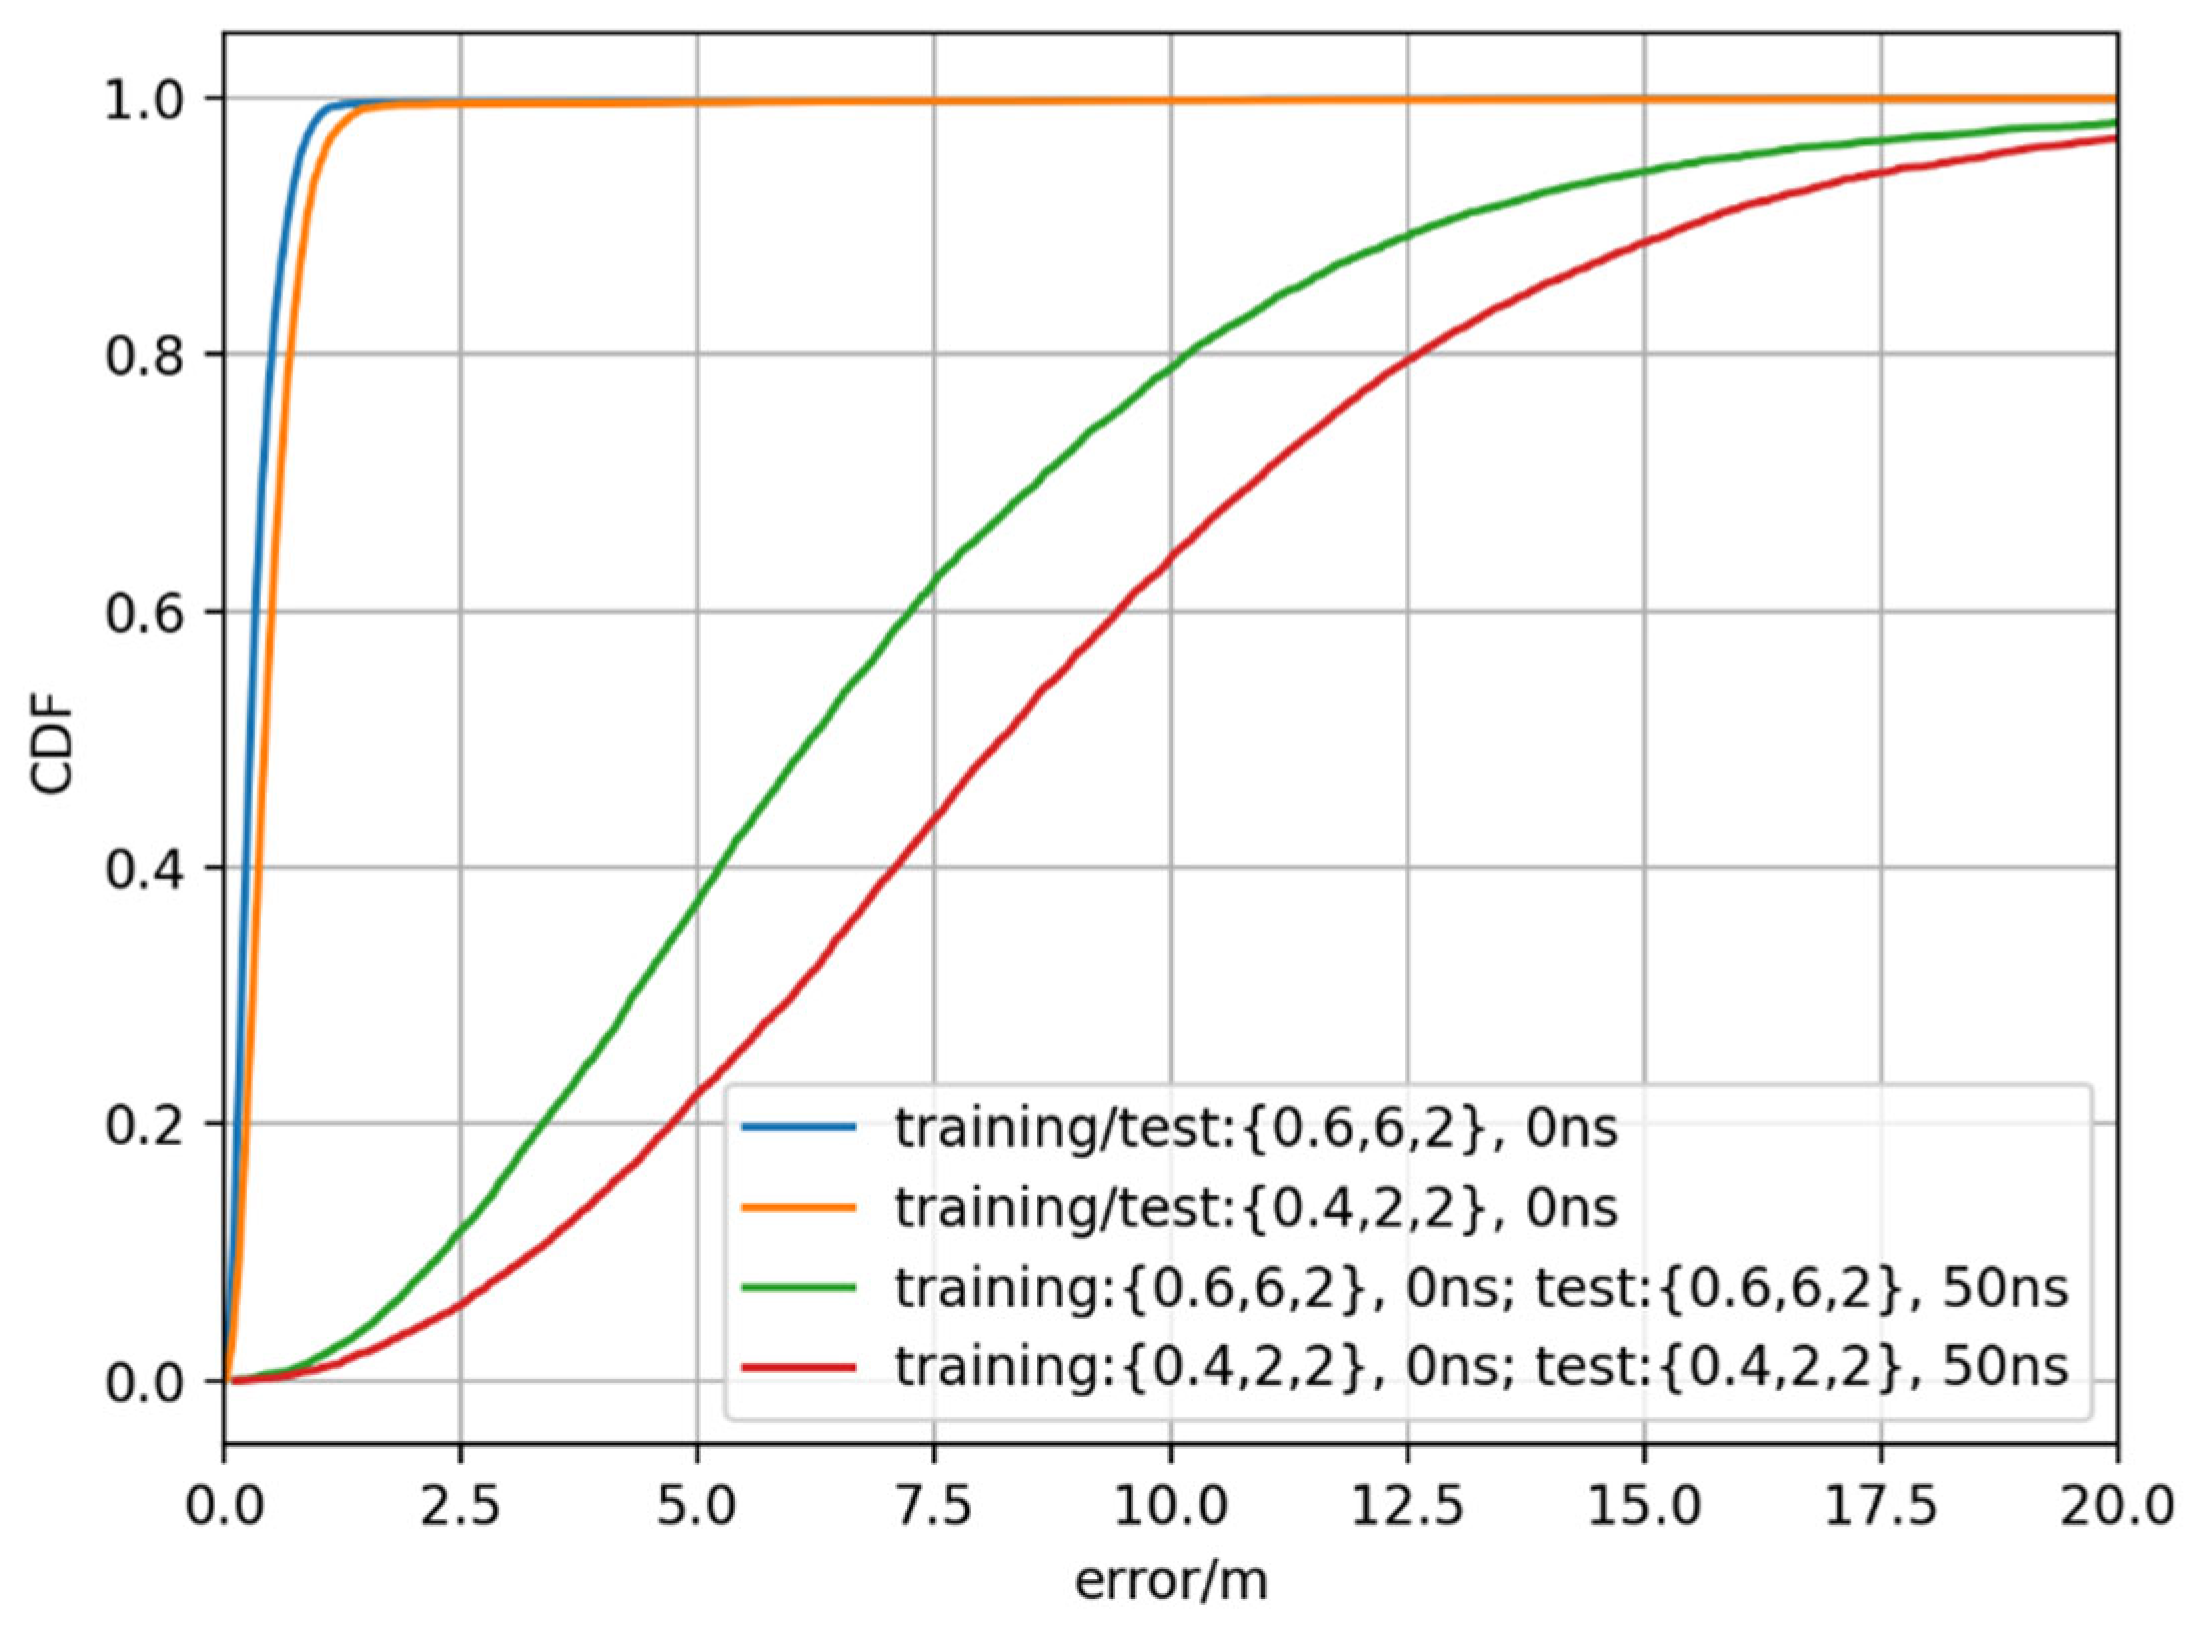
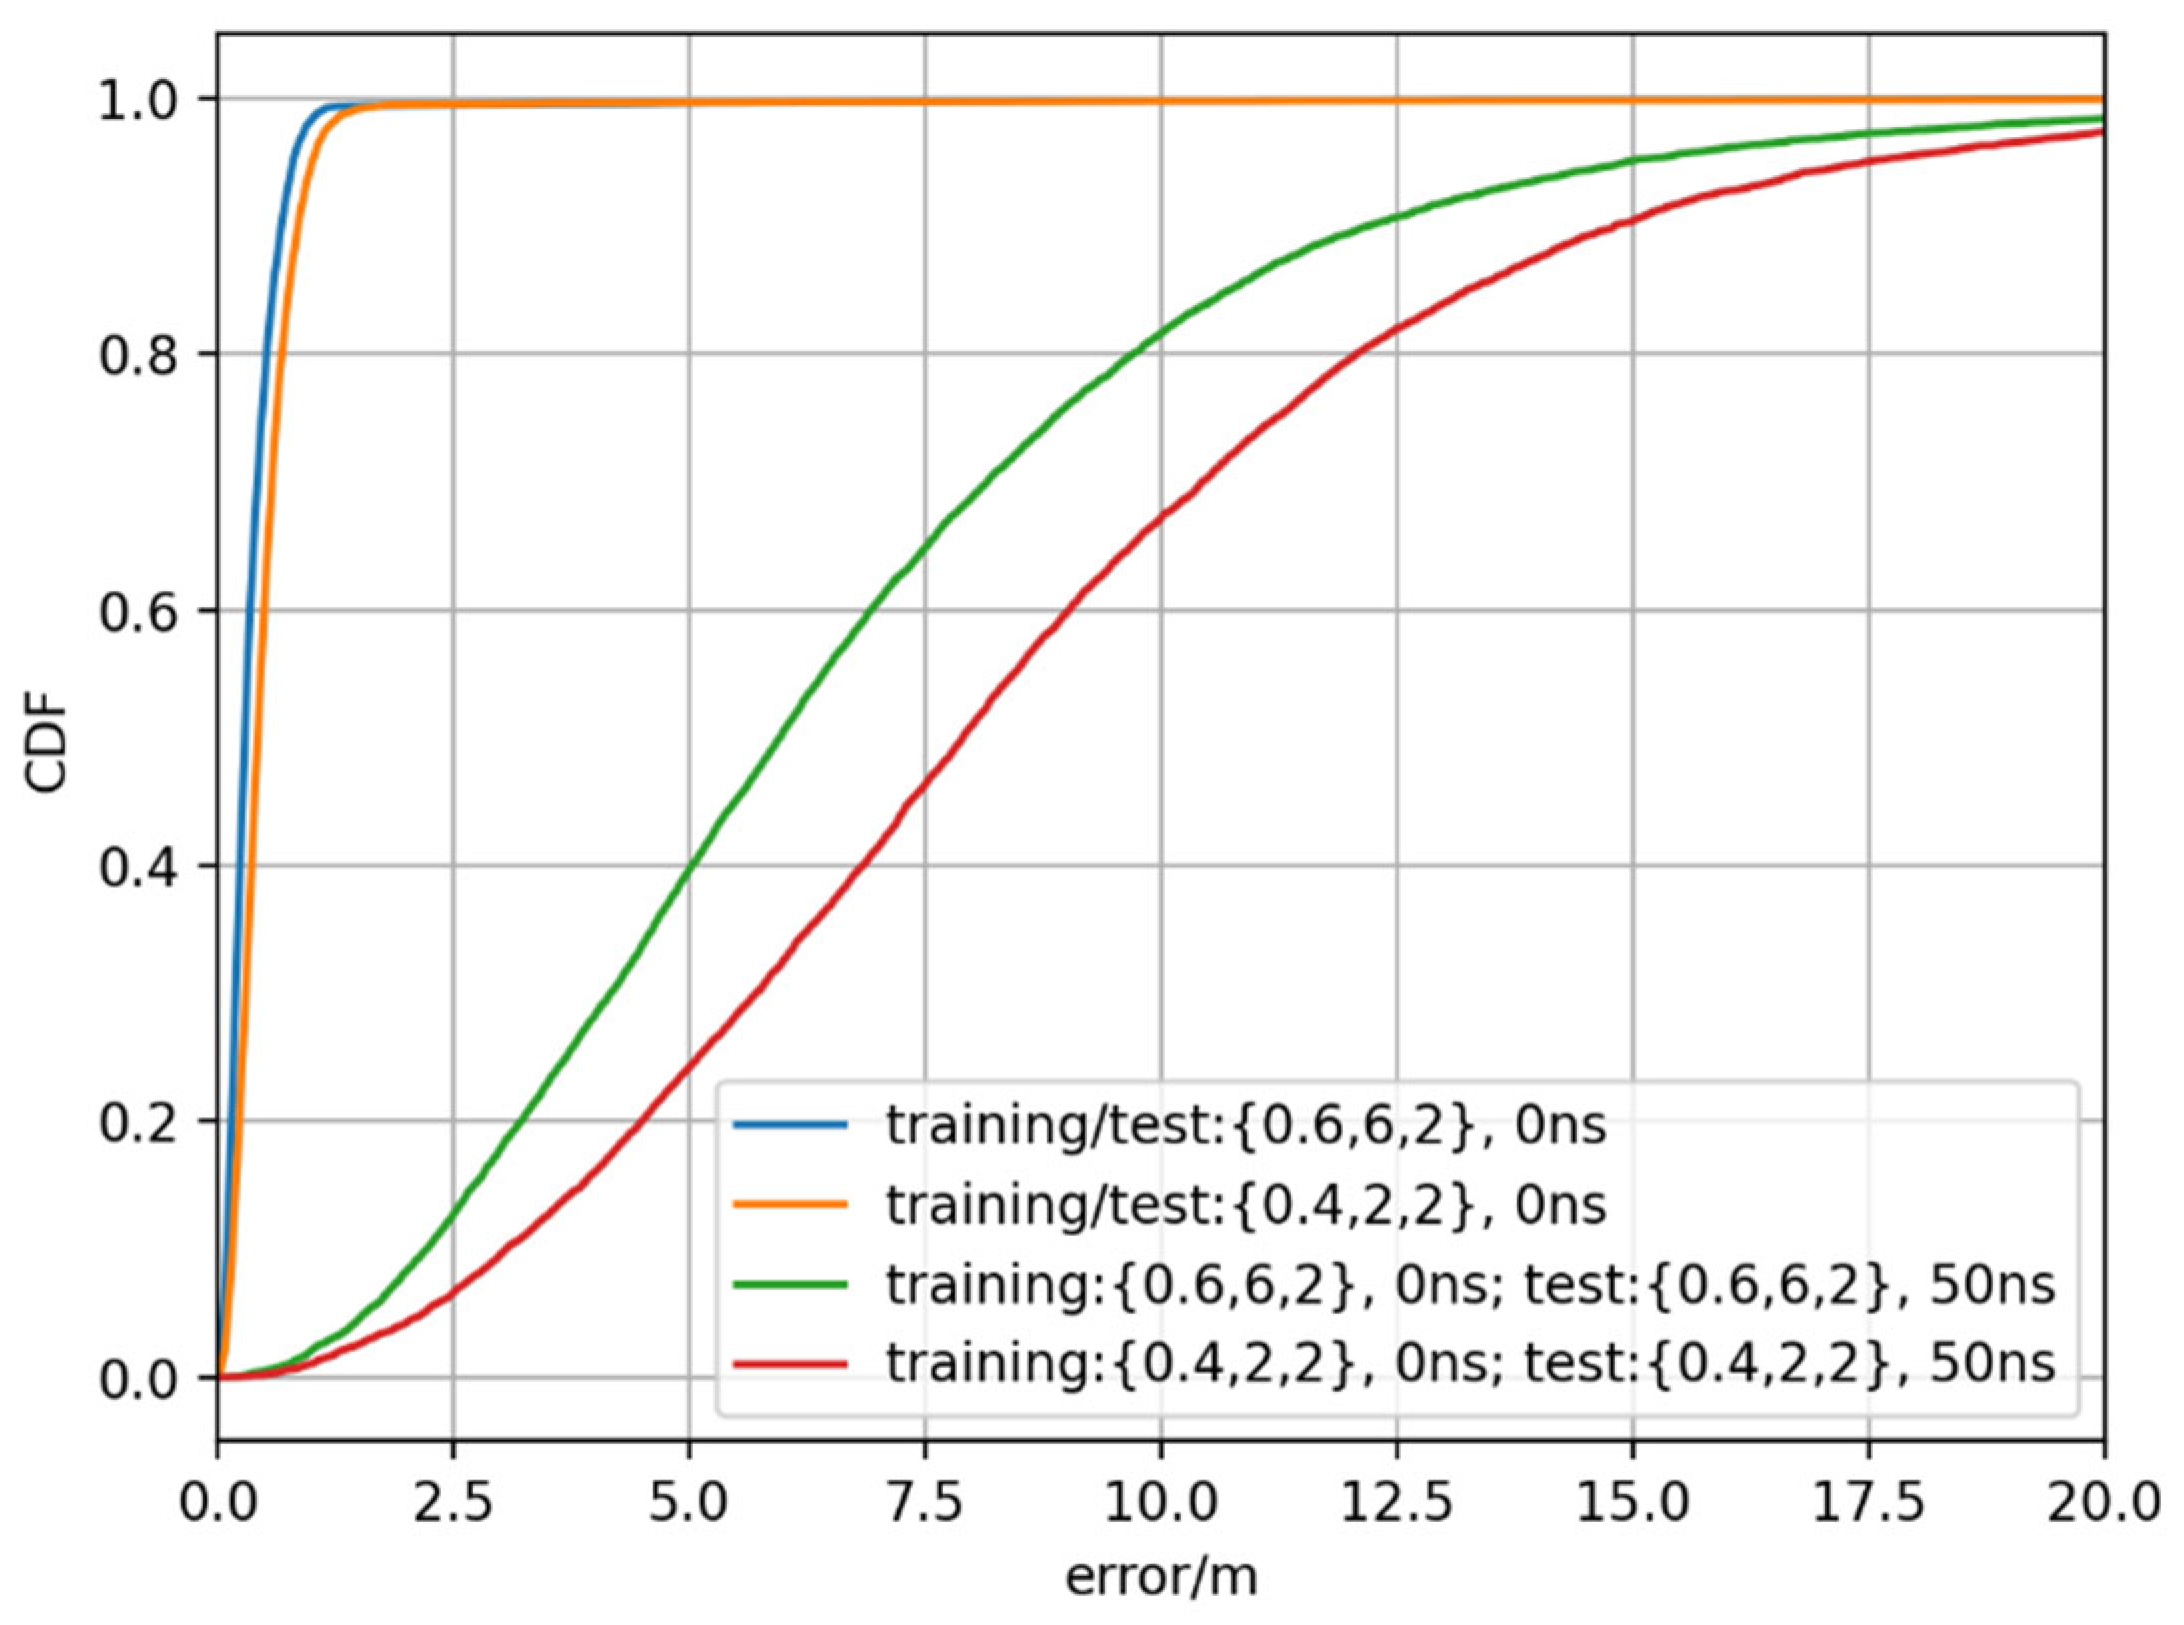
- In the IIoT scenario, the AI-based positioning methods are sensitive to the change in clutter parameters, network synchronization errors, and receiving timing errors. Table 2 and Table 3 summarize the positioning accuracy at 90% CDF considering different generalization factors for direct AI-based positioning and AI-based ToA prediction, respectively. Generally, once there is a change in these typical parameters, the positioning performance would degrade greatly and the trend in the direct AI-based positioning and AI-based ToA prediction is similar. Comparing the impact of these three factors, it is observed that the impact of receiving timing errors is the smallest due to the small range of timing errors. The impact of the network synchronization error is the most significant. There are two reasons, one reason is that the error range of the network synchronization is usually large. Another reason is all BSs may experience such errors. As for the impact of clutter parameters, more performance degradation is observed when the AI model is trained with clutter parameters of {60%, 6 m, 2 m} and tested by data set with clutter parameters of {40%, 2 m, 2 m}. The possible reason is the different LOS/NLOS conditions between the scenario with a clutter of {60%, 6 m, 2 m} and the scenario with a clutter parameter of {40%, 2 m, 2 m}. The scenario with clutter parameter of {60%, 6 m, 2 m} is full of NLOS-based propagation while lack of LOS-based propagation and the scenarios with clutter parameter of {40%, 2 m, 2 m} contain more LOS-based propagation. In this case, the trained AI model by data set with a clutter parameter of {60%, 6 m, 2 m} may not be able to extract the feature of LOS-based propagation fully. Then, inferior performance will be experienced when handling the LOS-based propagation in the scenario with a clutter parameter {40%, 2 m, 2 m}.
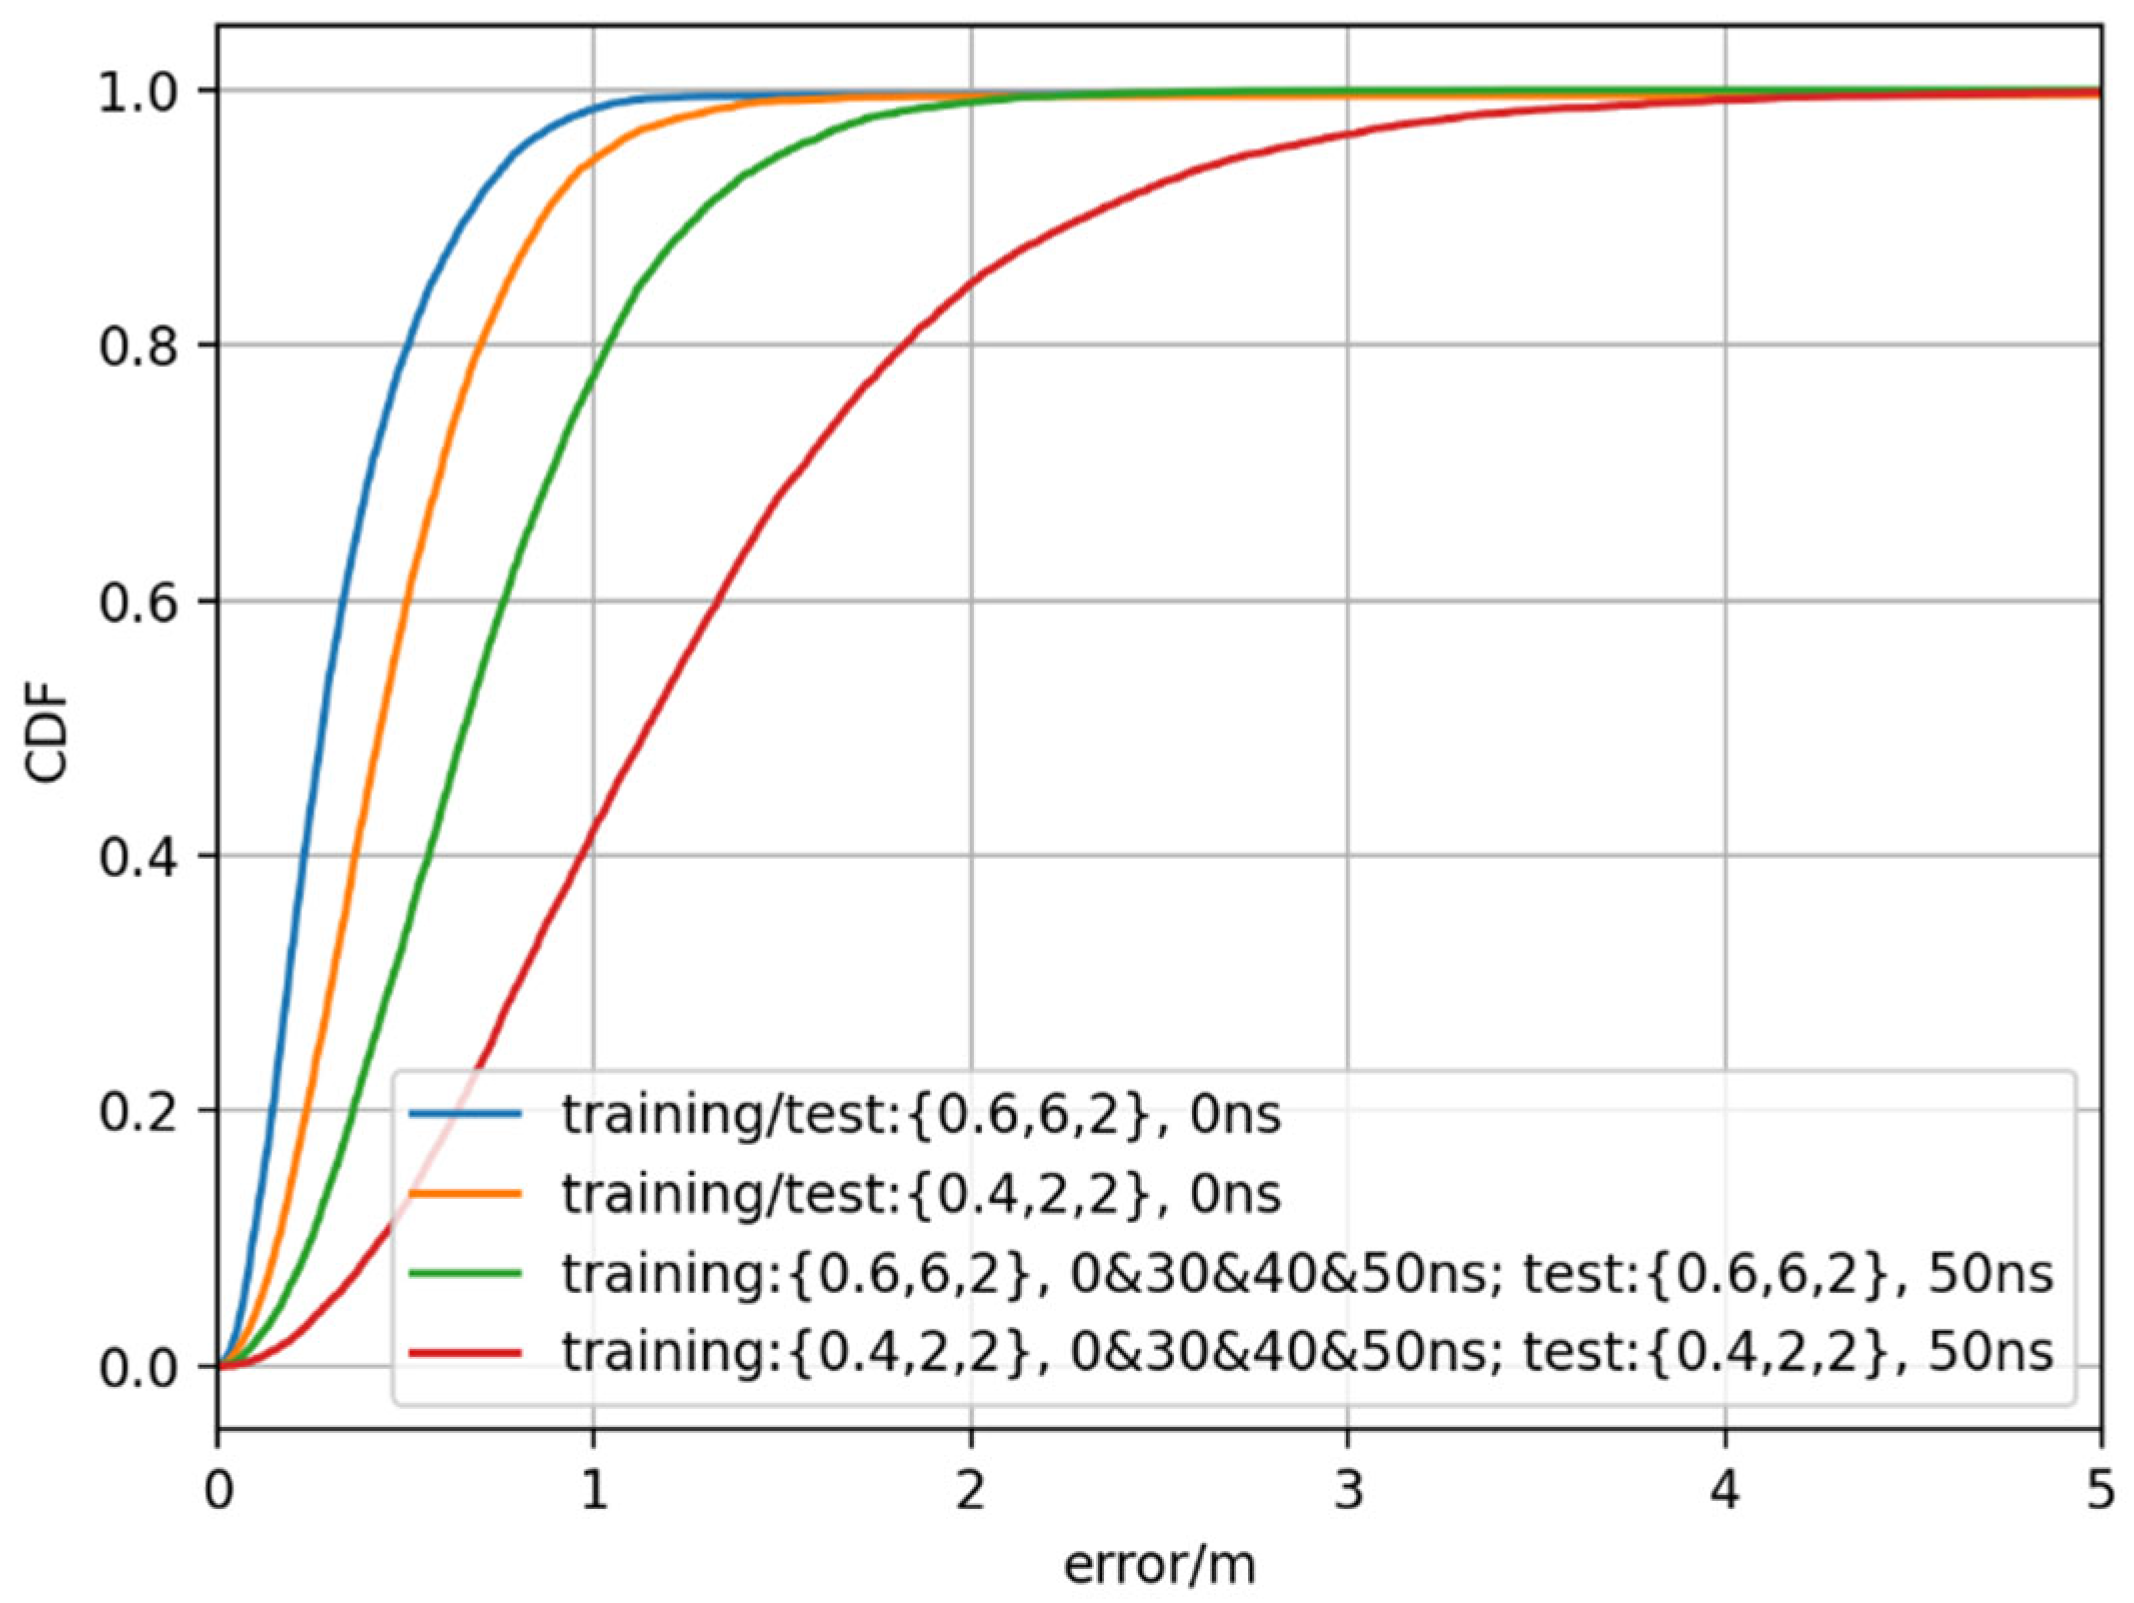
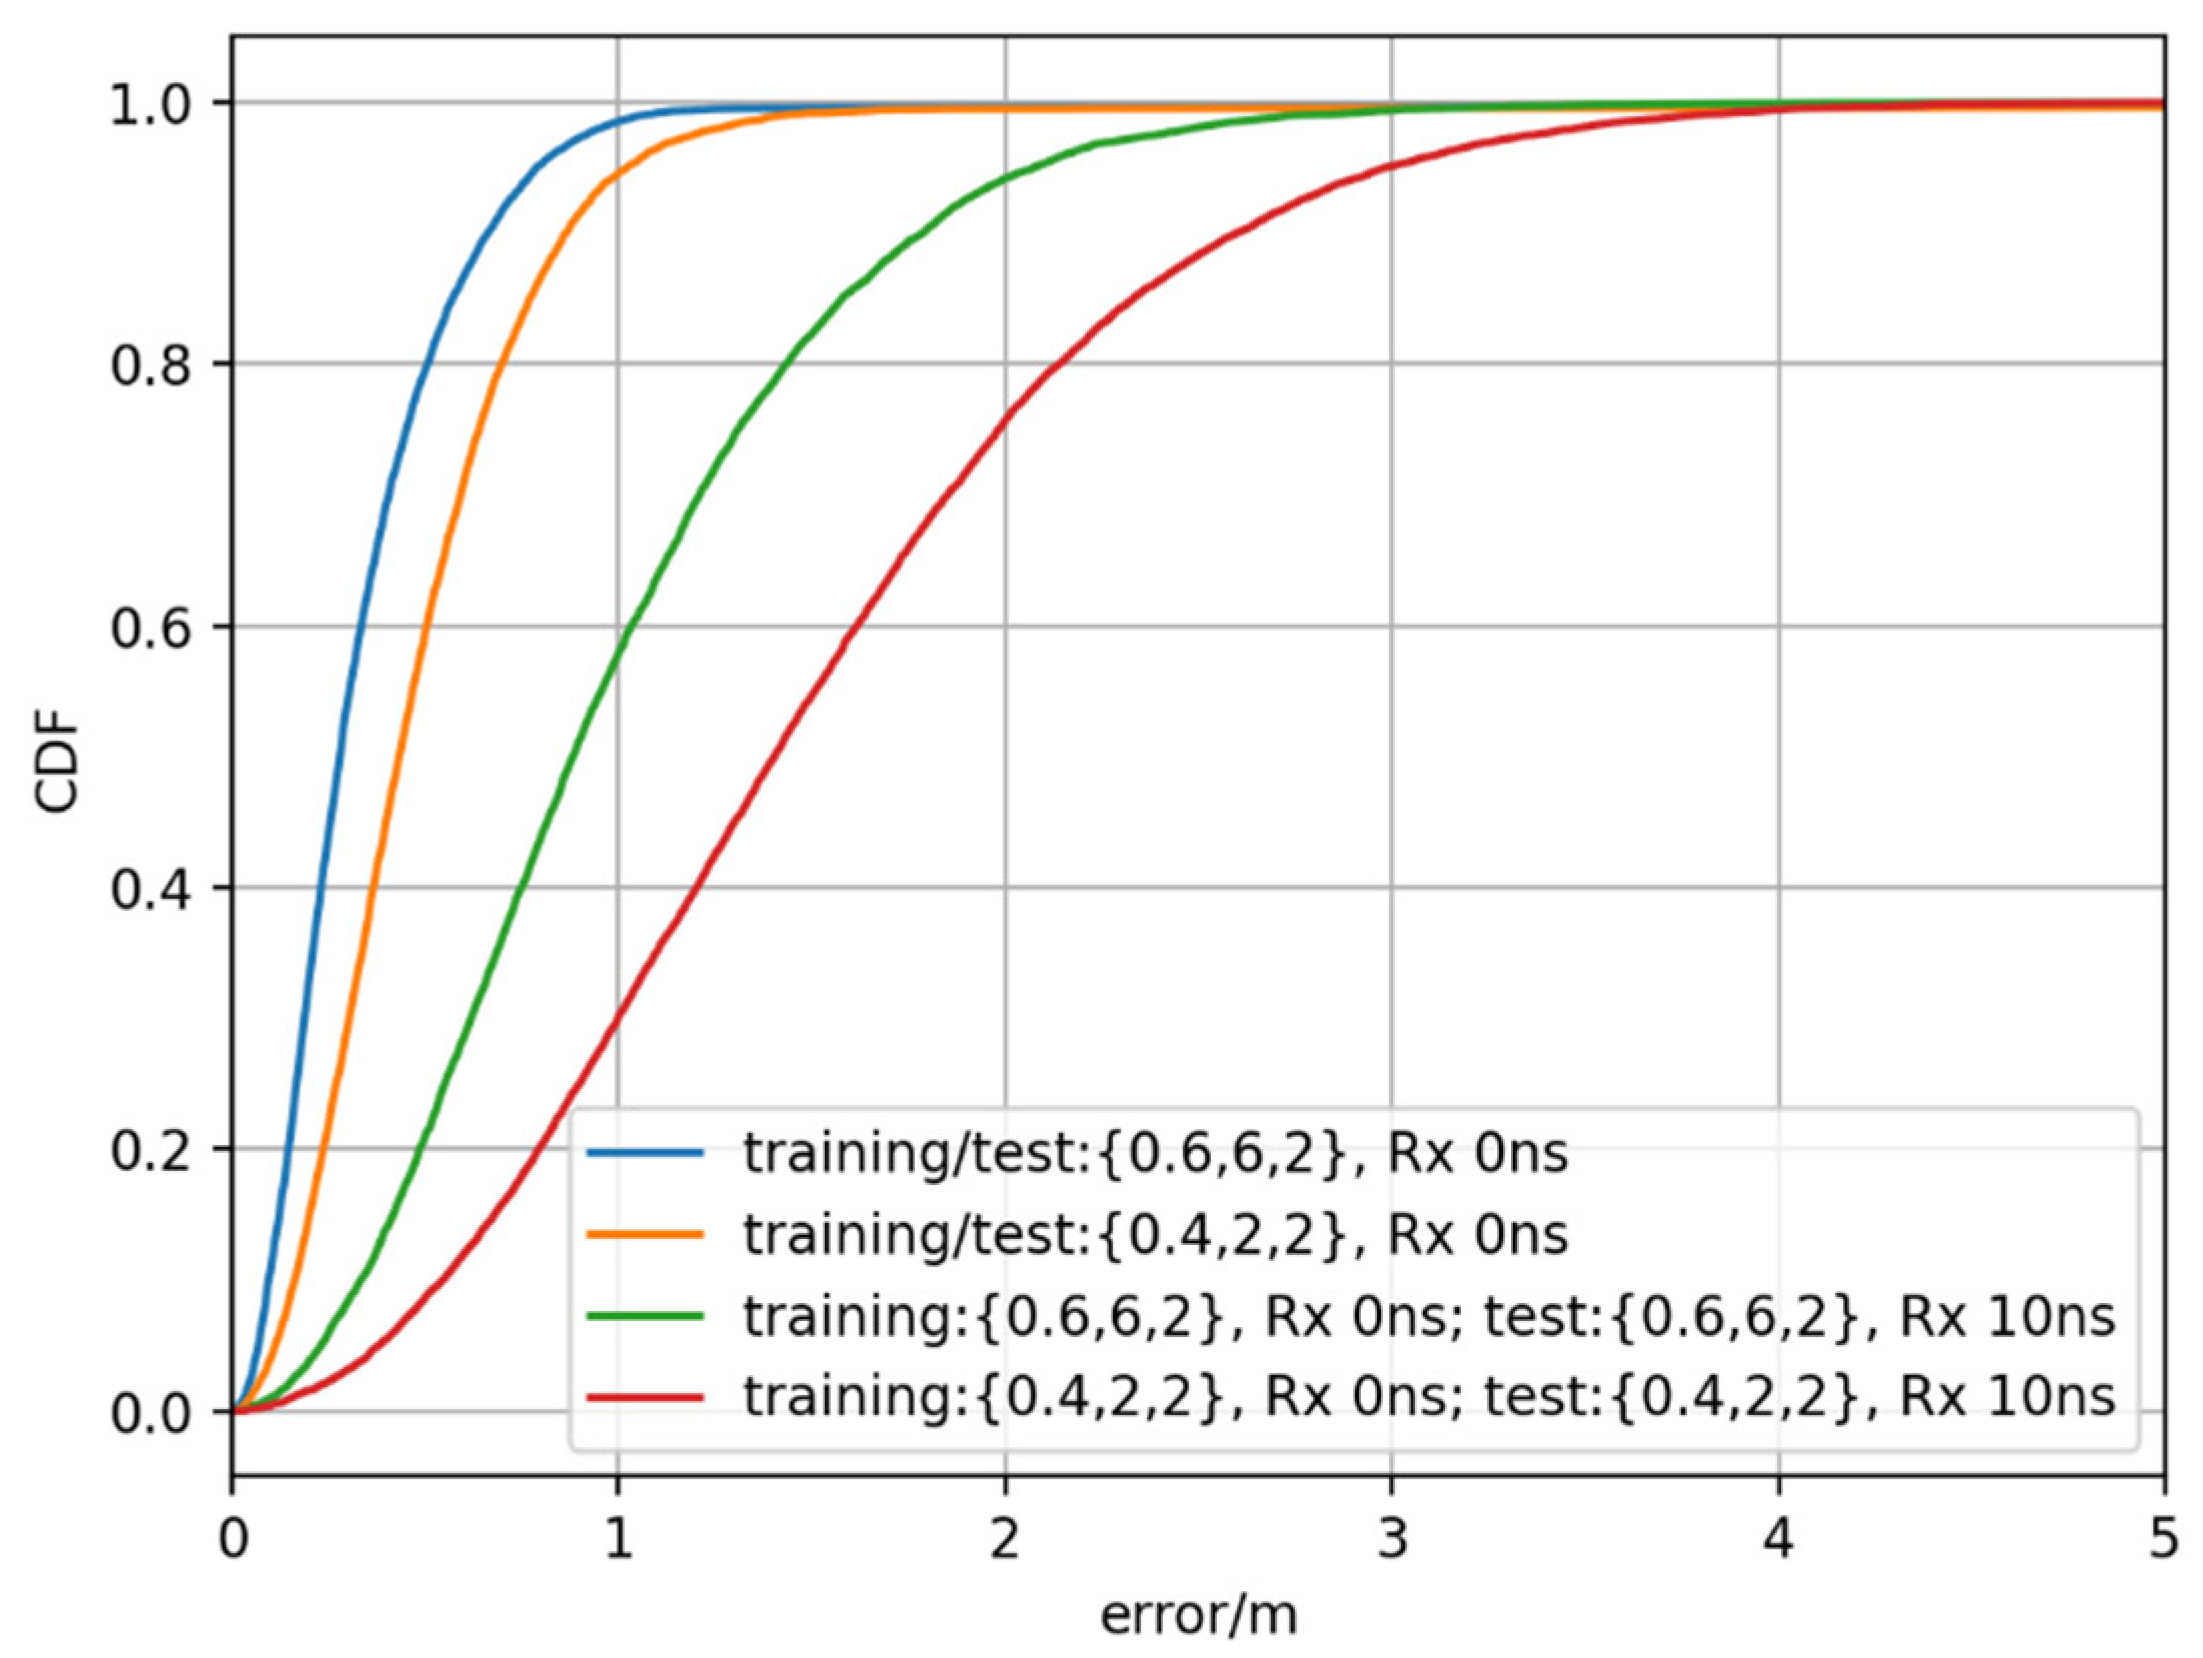
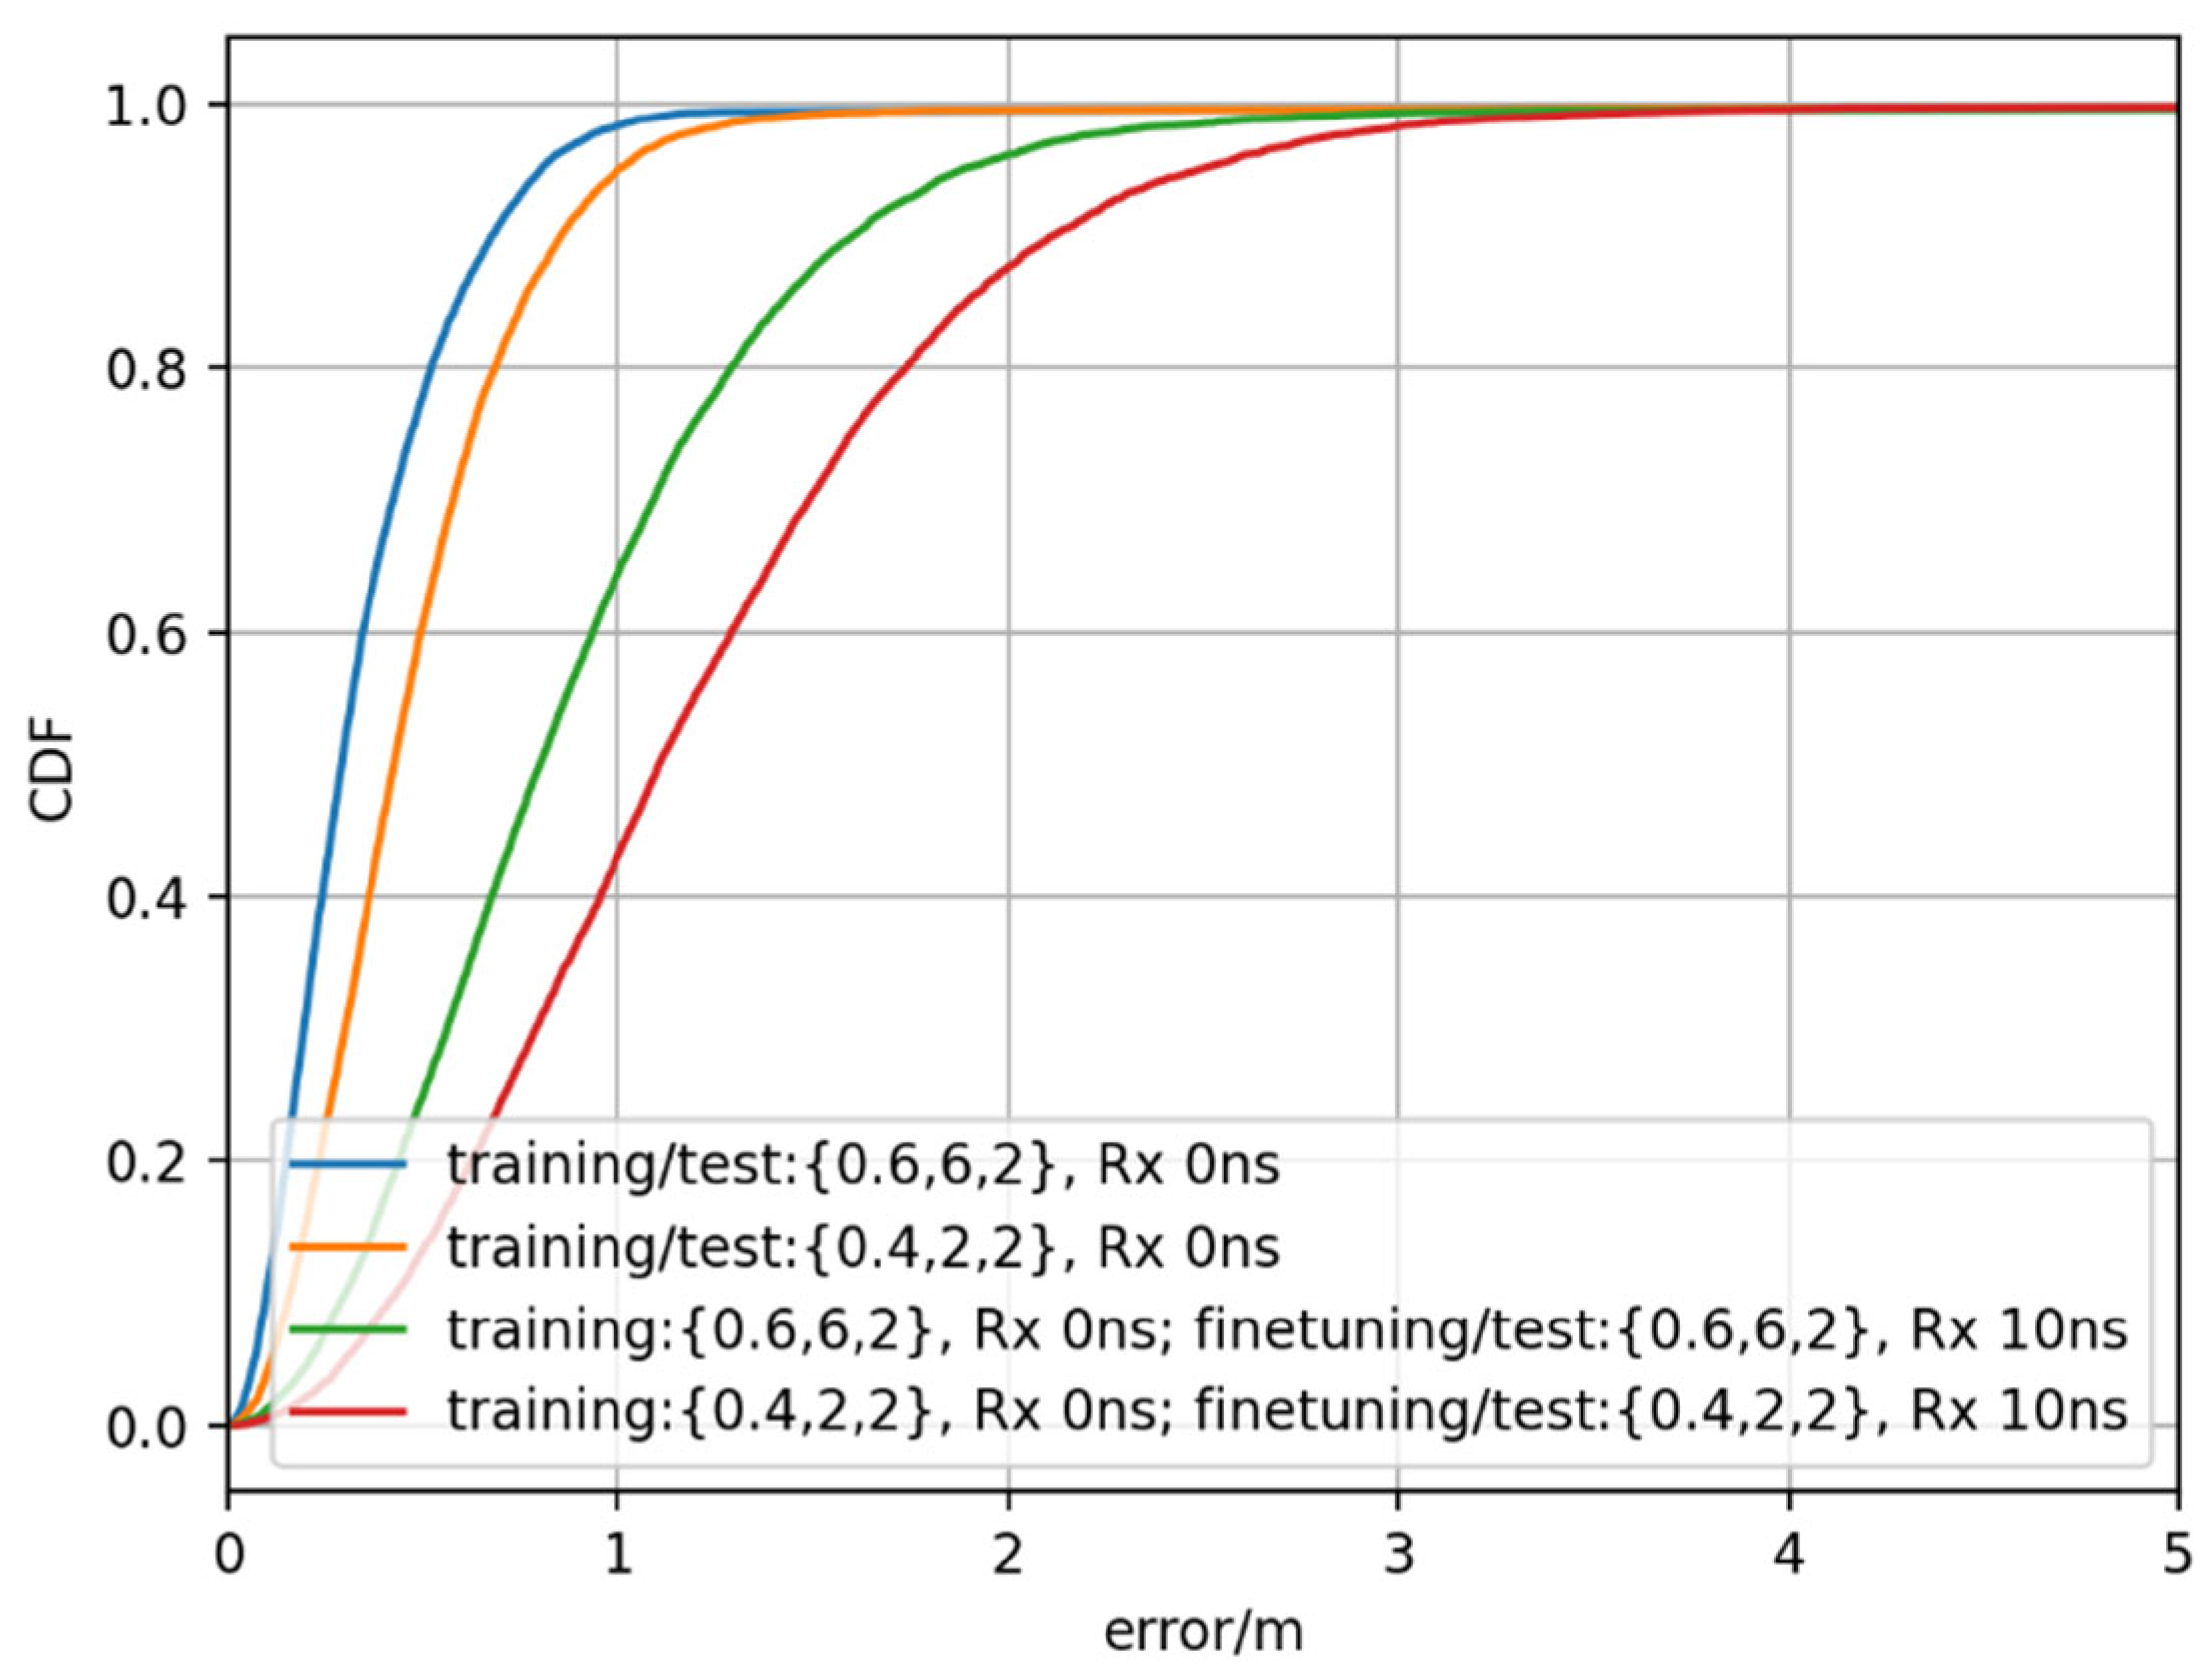
- To guarantee the generalization performance from the perspective of clutter parameter and receiving timing error, both optimizing the data set construction and using fine-tuning can be considered. Table 4 and Table 5 summarize the positioning accuracy at 90% CDF for direct AI-based positioning and AI-based ToA prediction when mixed data sets and fine-tuning are used. For the impact of different clutter parameters, both optimizing the data set and fine-tuning could improve the performance greatly. Using mixed data set could provide less than 1 m positioning accuracy at 90% CDF. For the impact of receiving timing error, using mixed data set for training could improve the positioning accuracy, while it seems that fine-tuning does not help much. The possible reason is that fewer samples with receiving timing errors are used for training in the fine-tuning method. For the impact of network synchronization error, it is observed that using the mixed data set and fine-tuning could improve the positioning performance slightly but, on the hand, using these two methods still cannot meet the positioning accuracy of less than 1 m. In addition, when comparing these two generalization improvement solutions, it is observed that optimizing data set construction could achieve slightly better performance due to more samples from the target scenario.
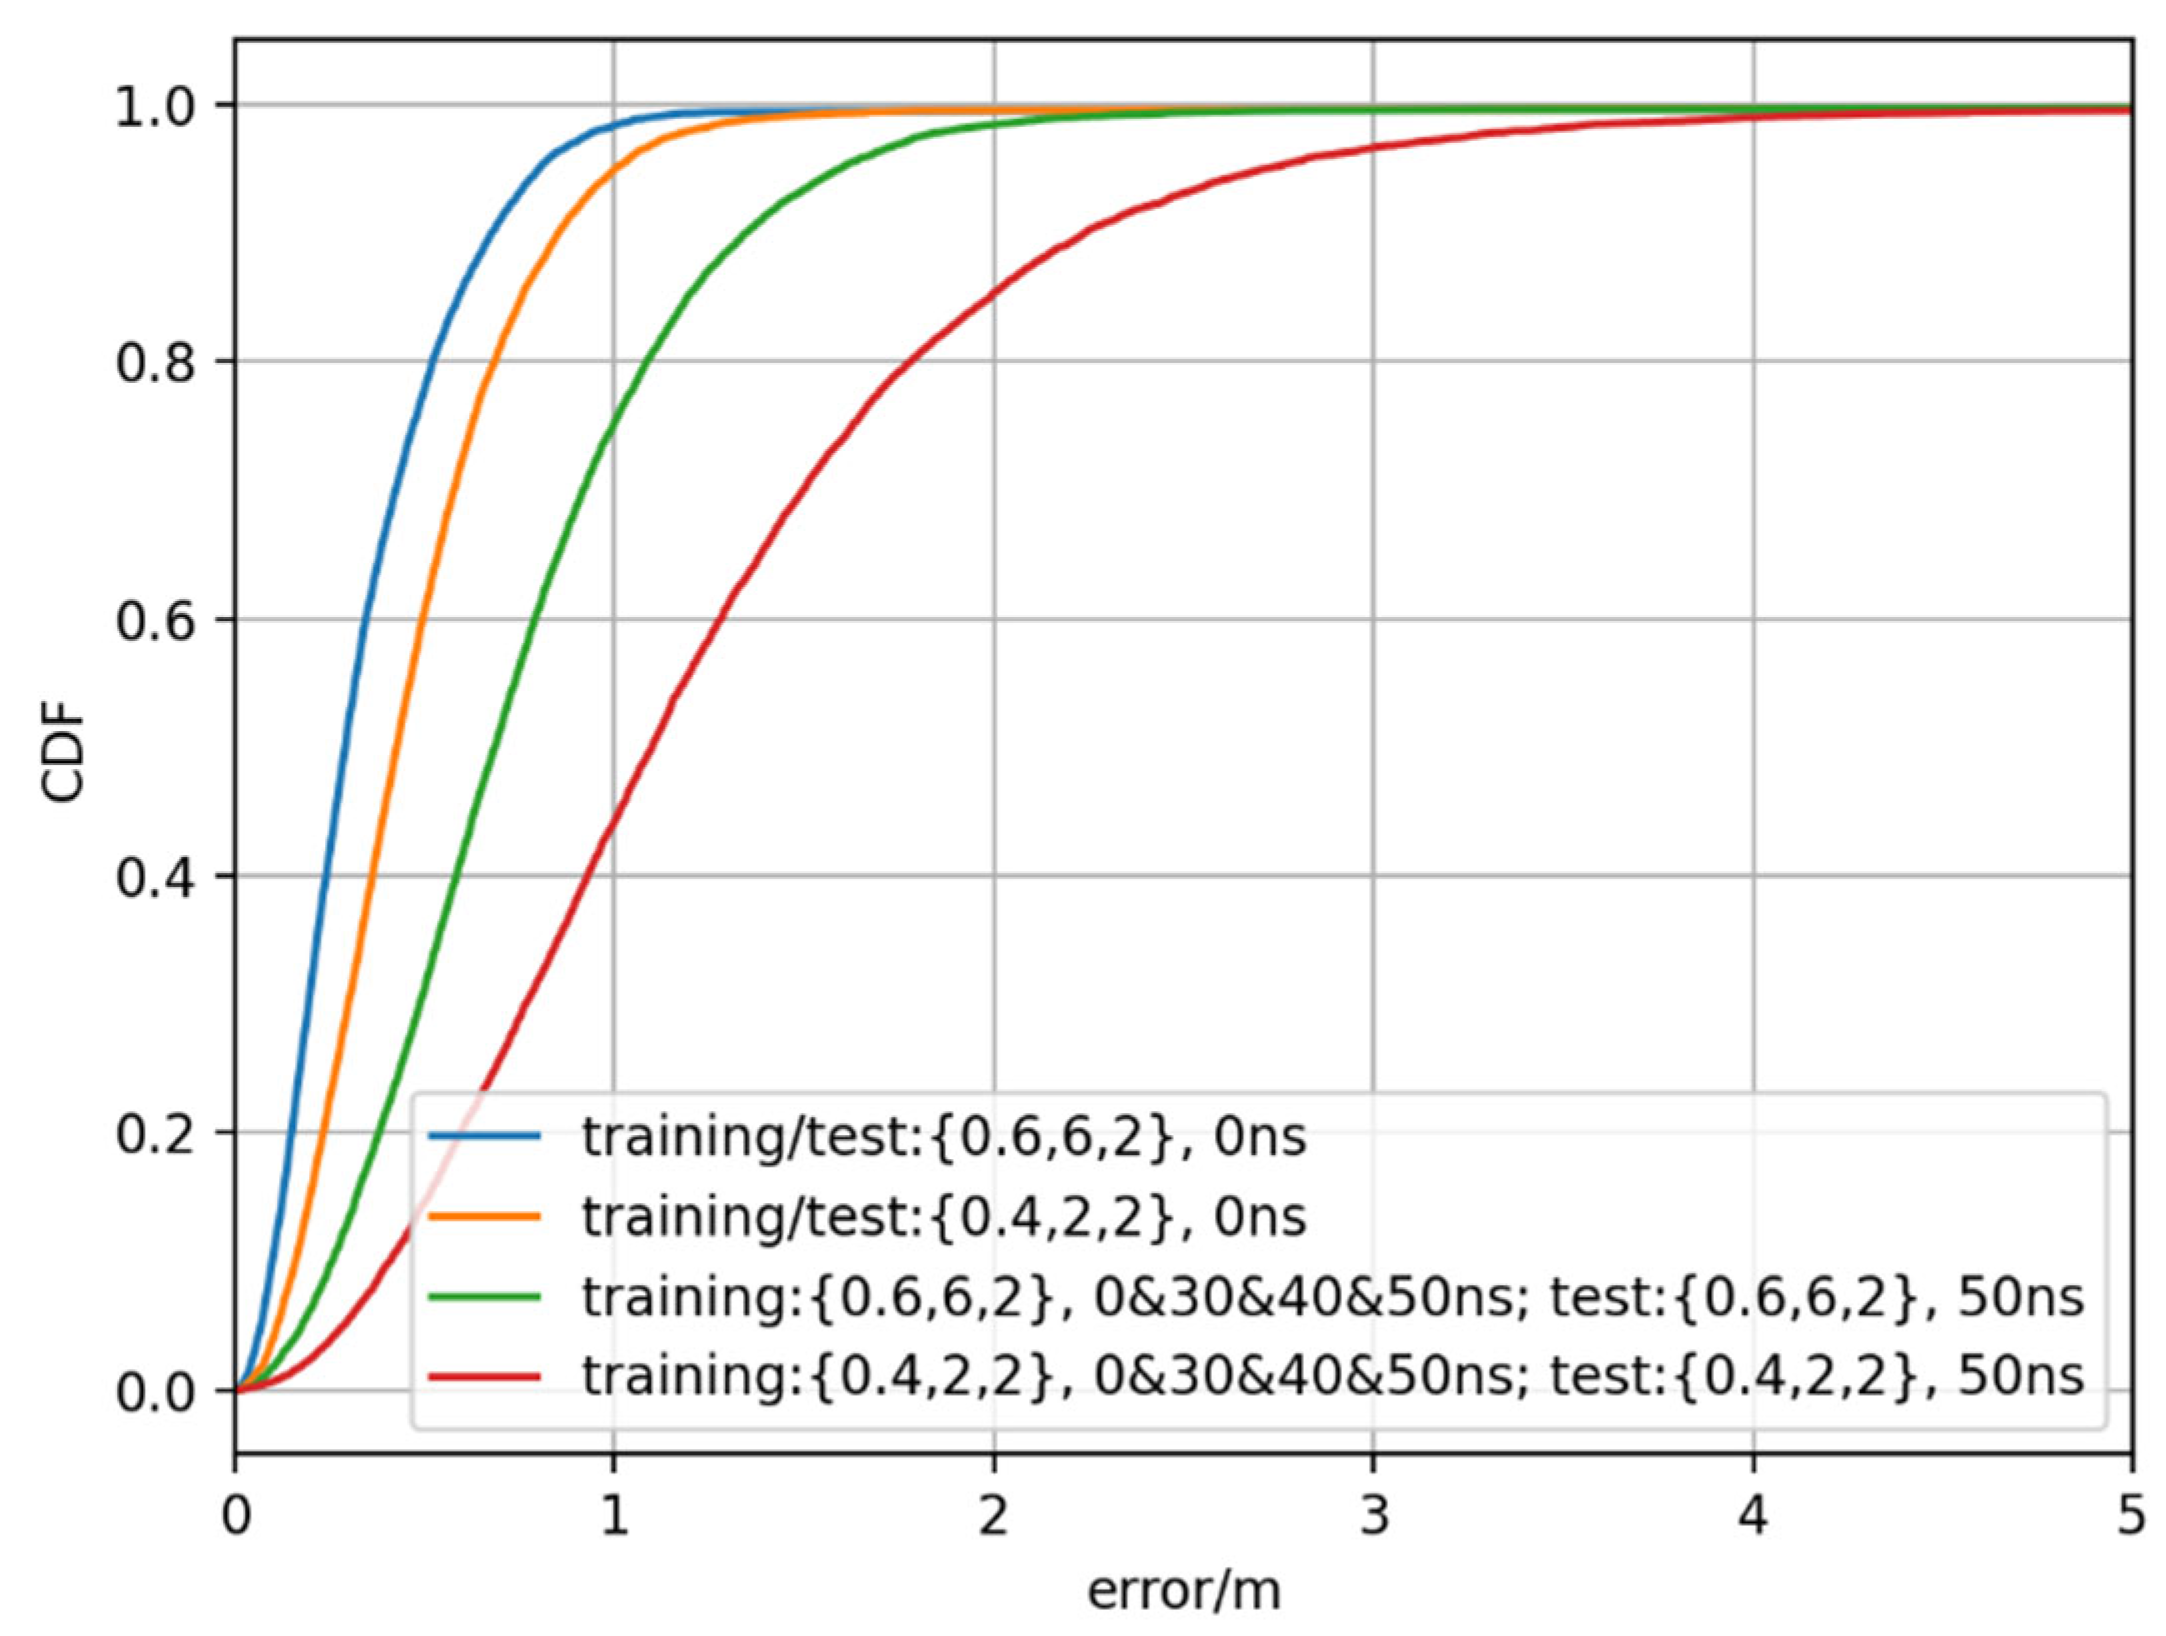
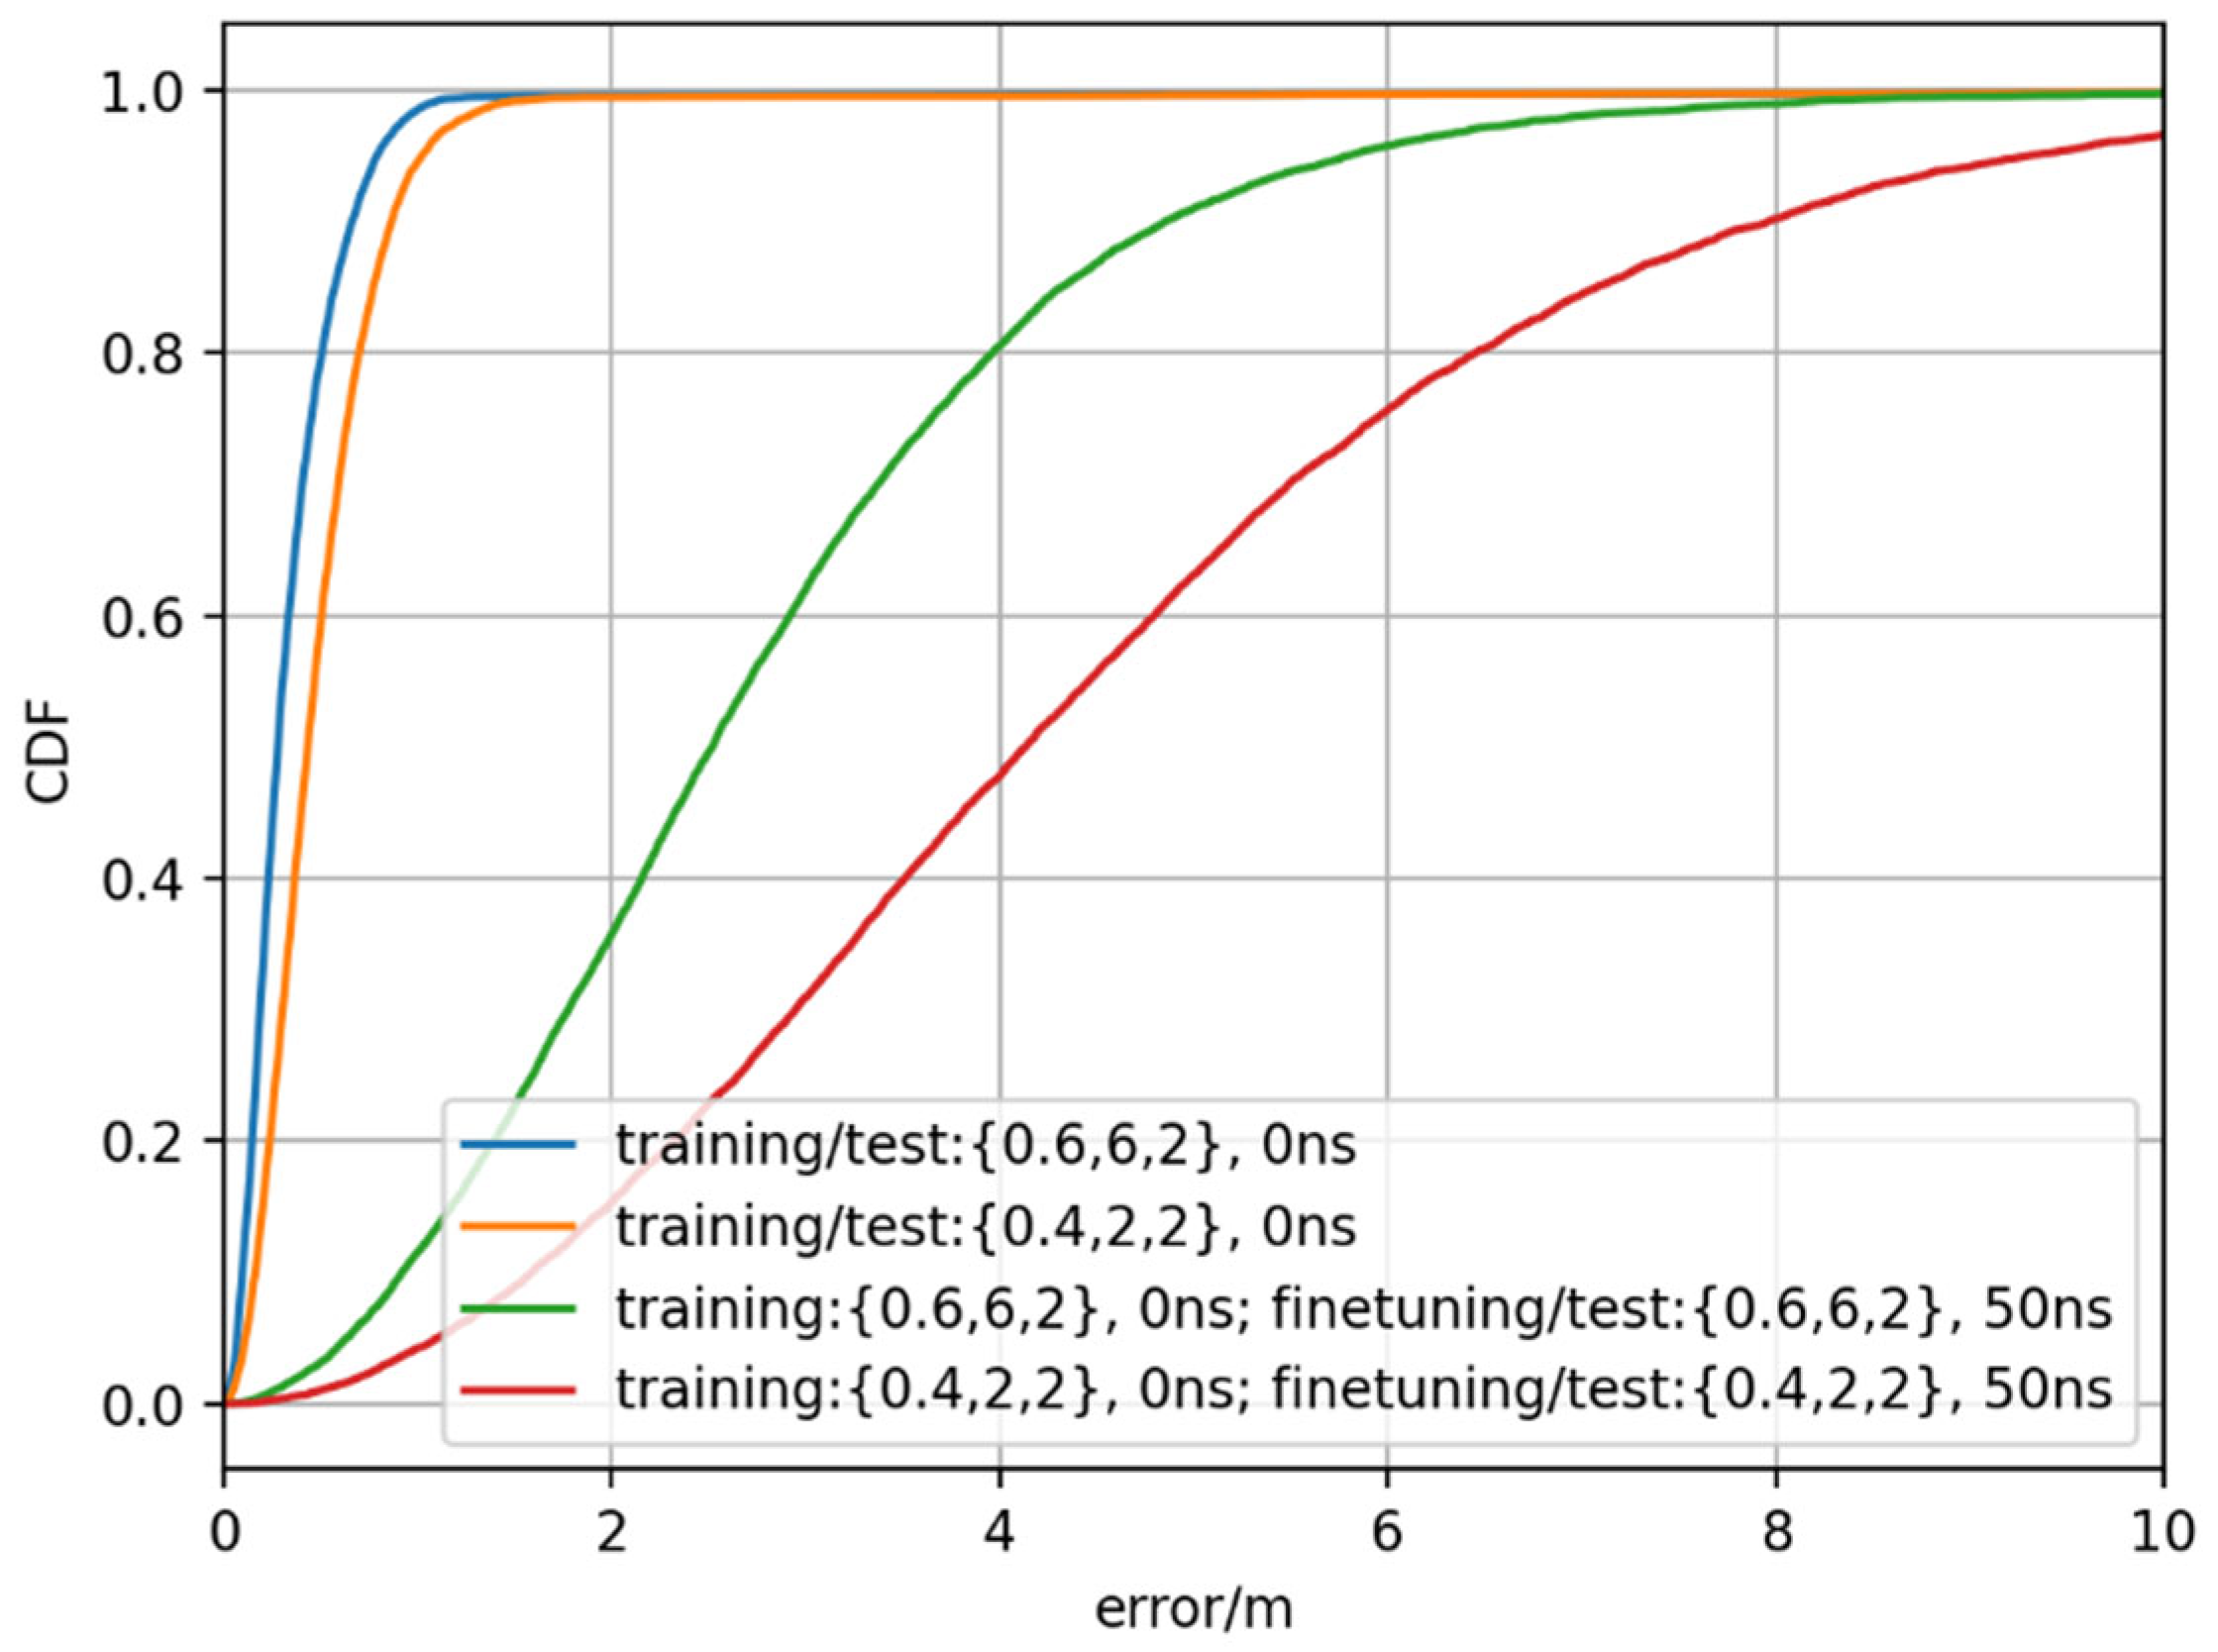
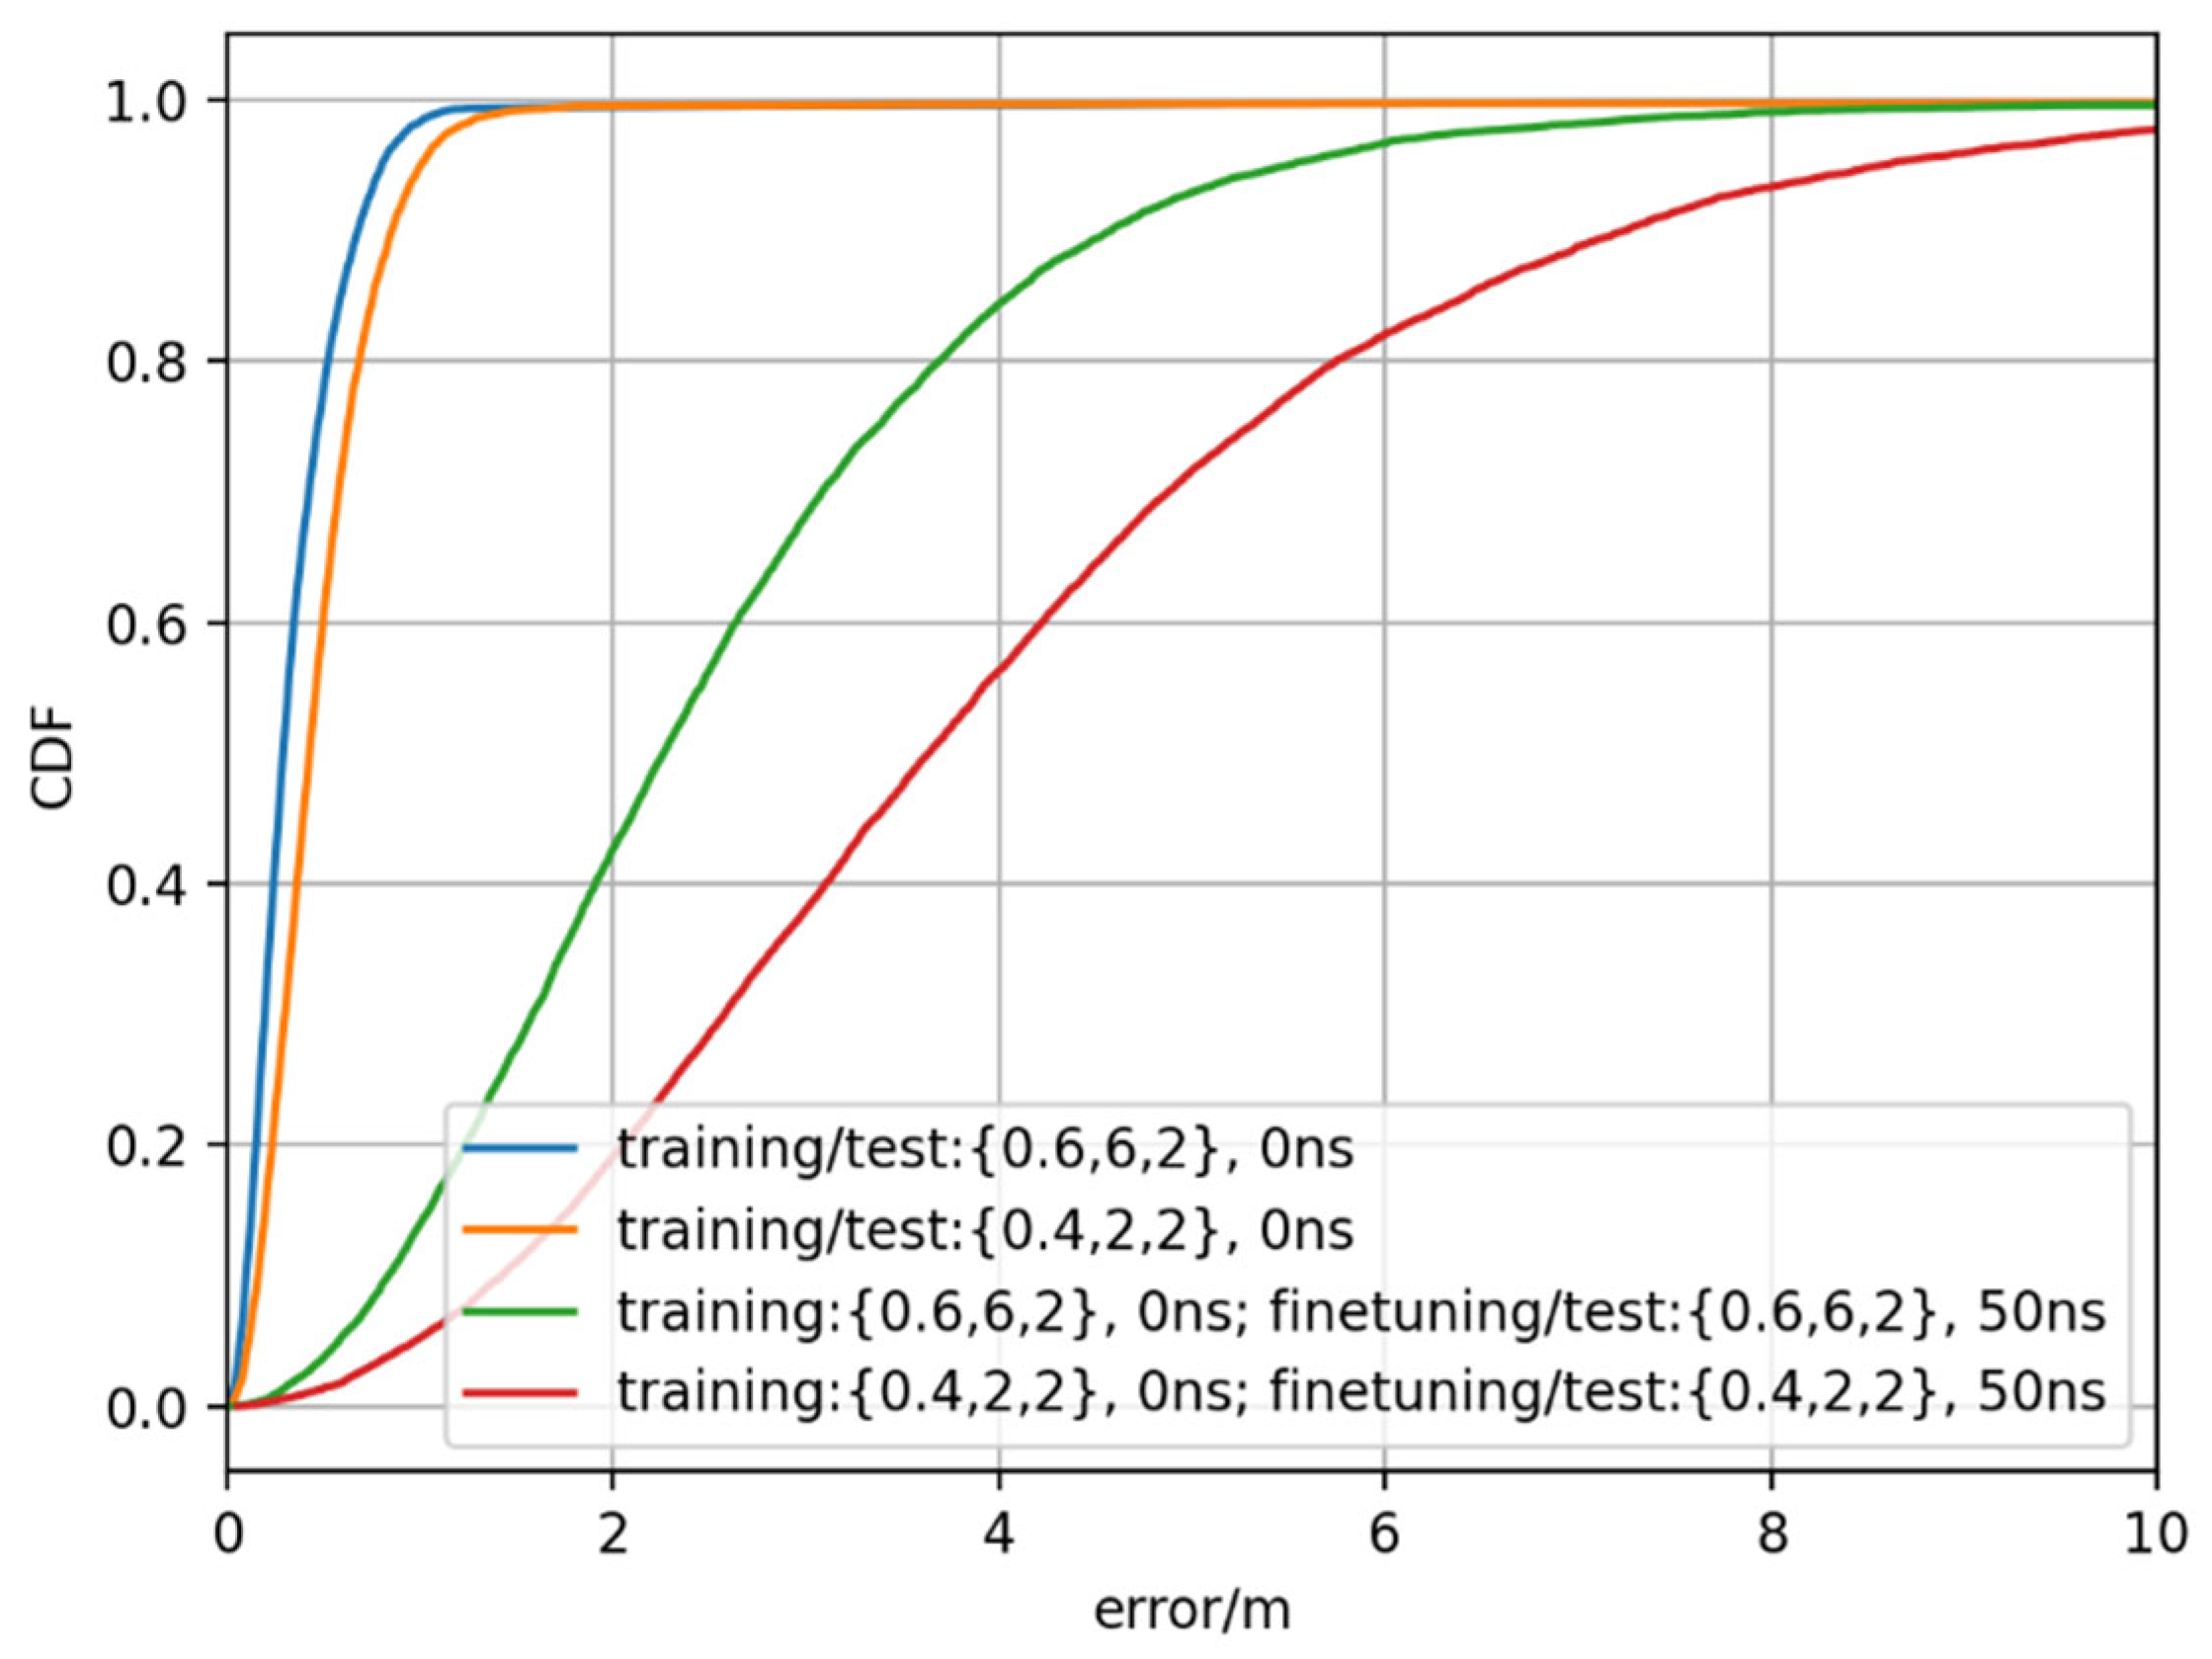
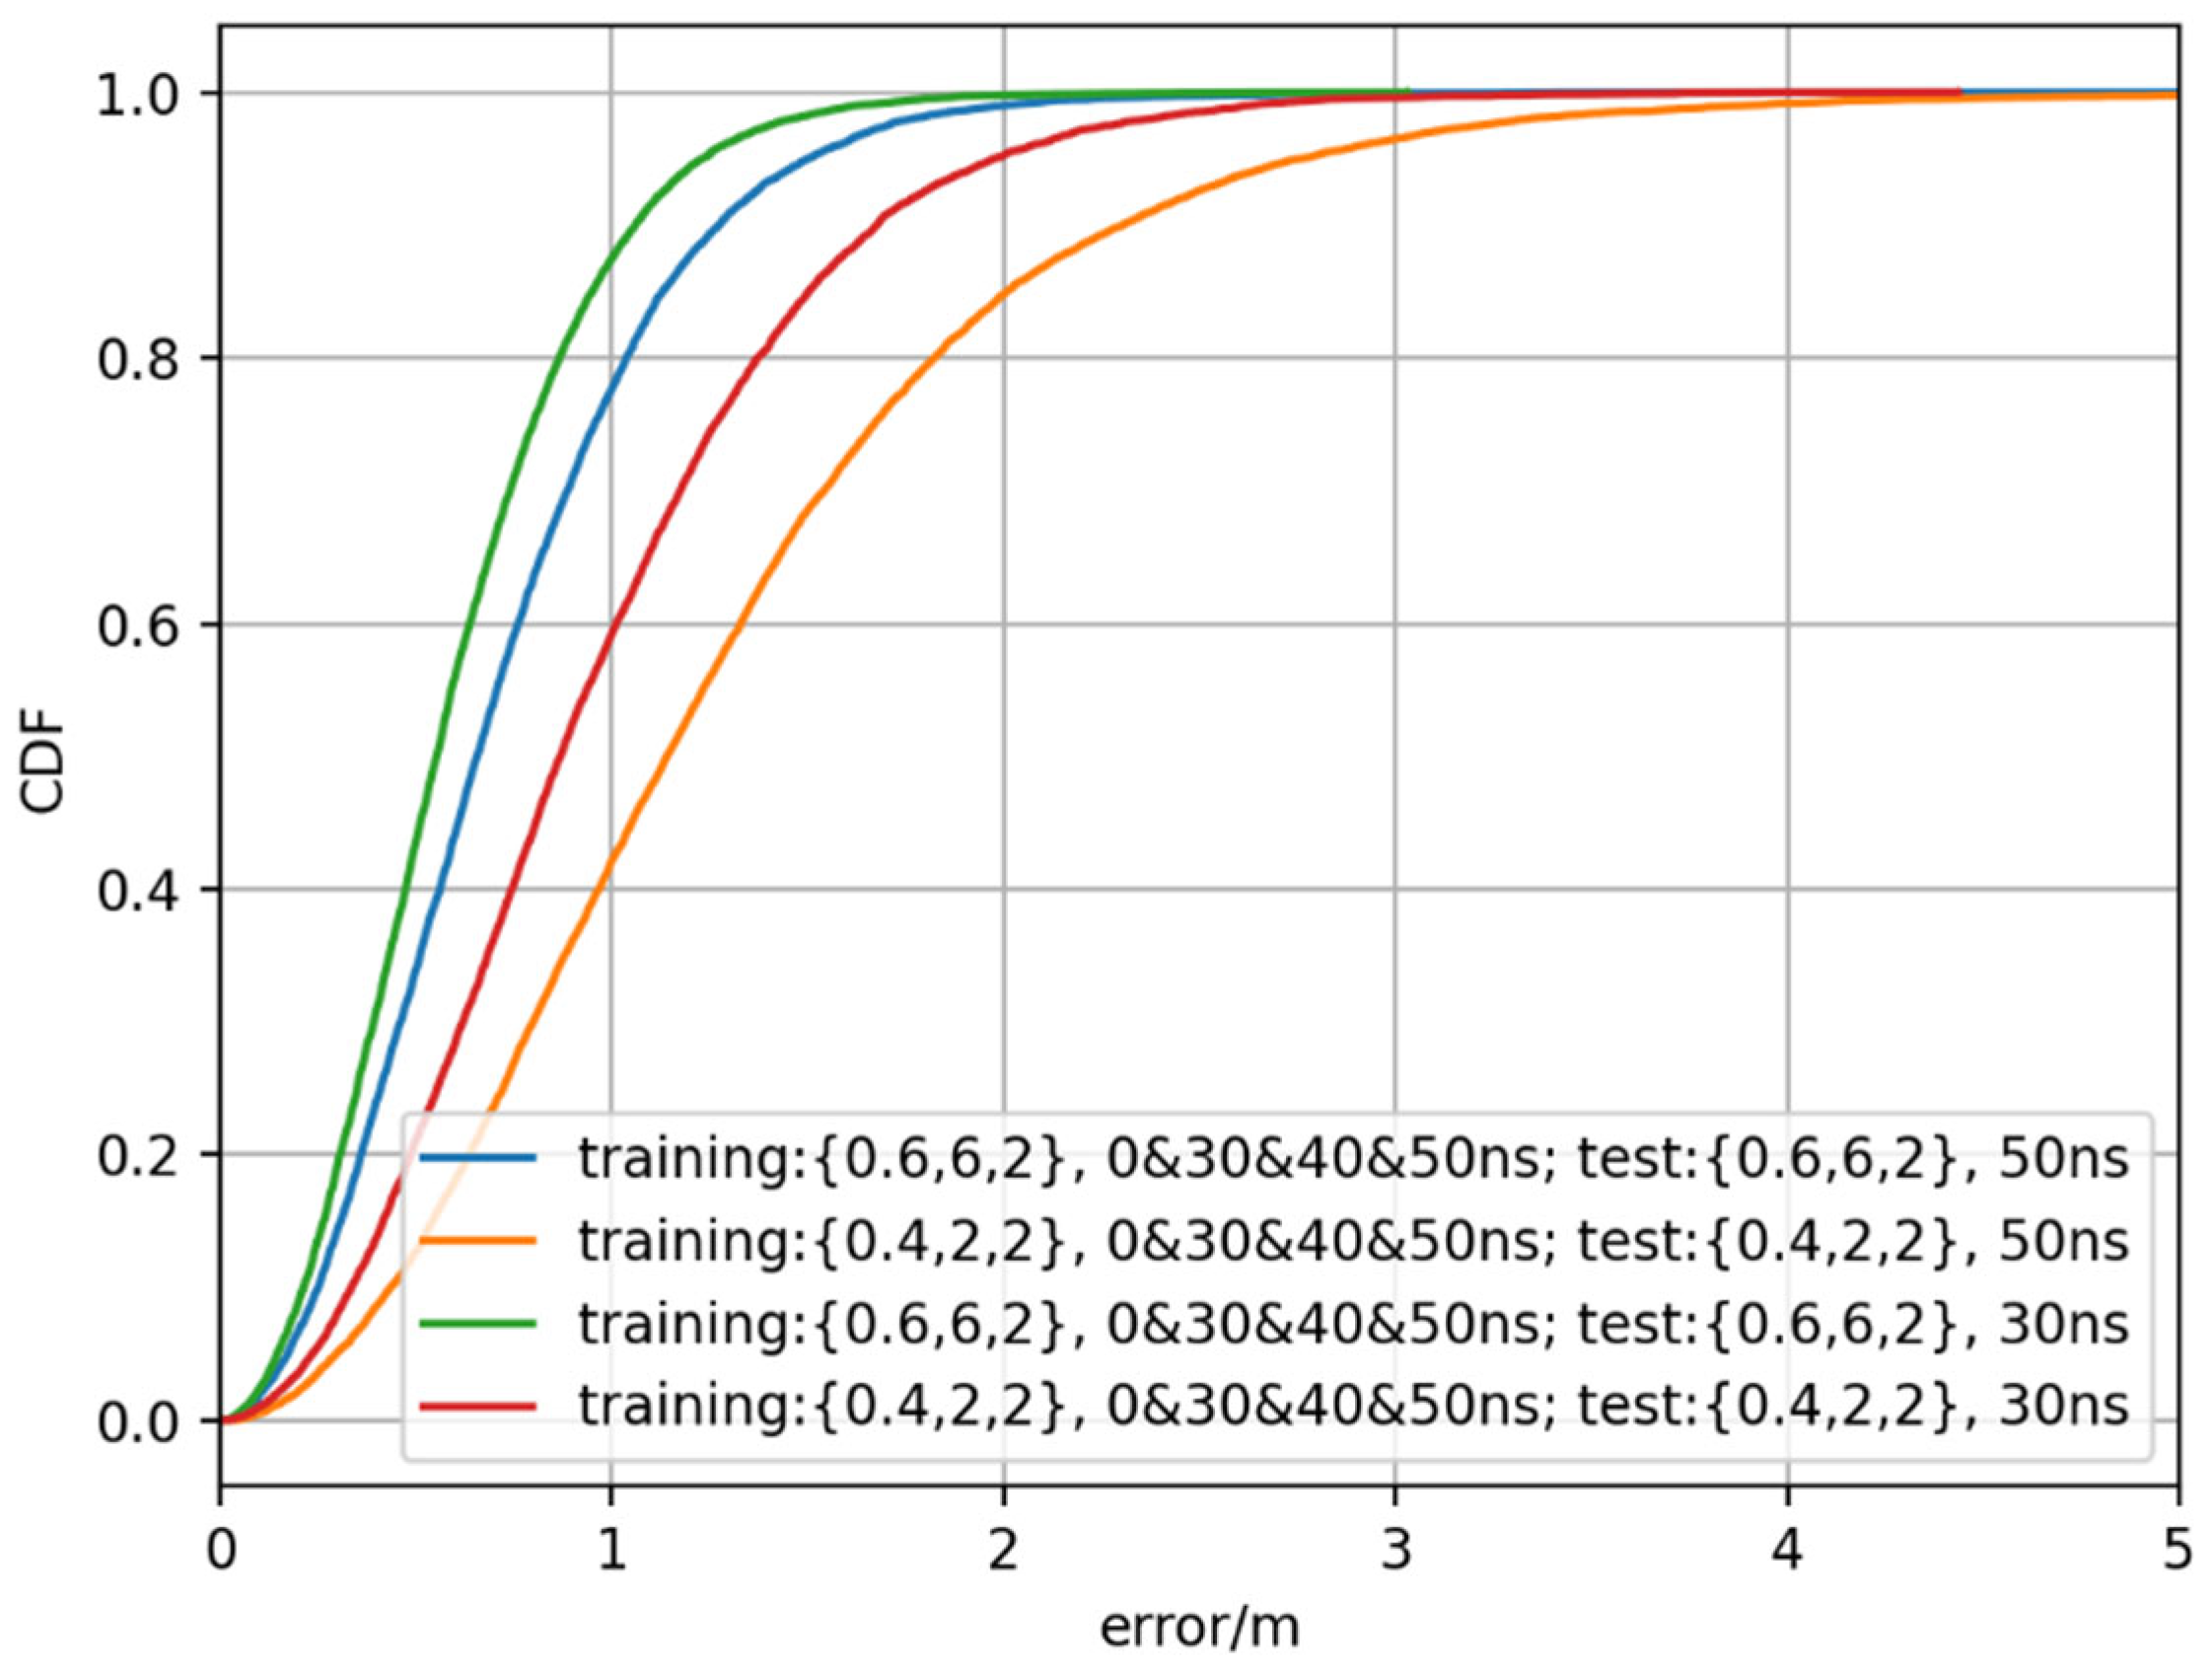
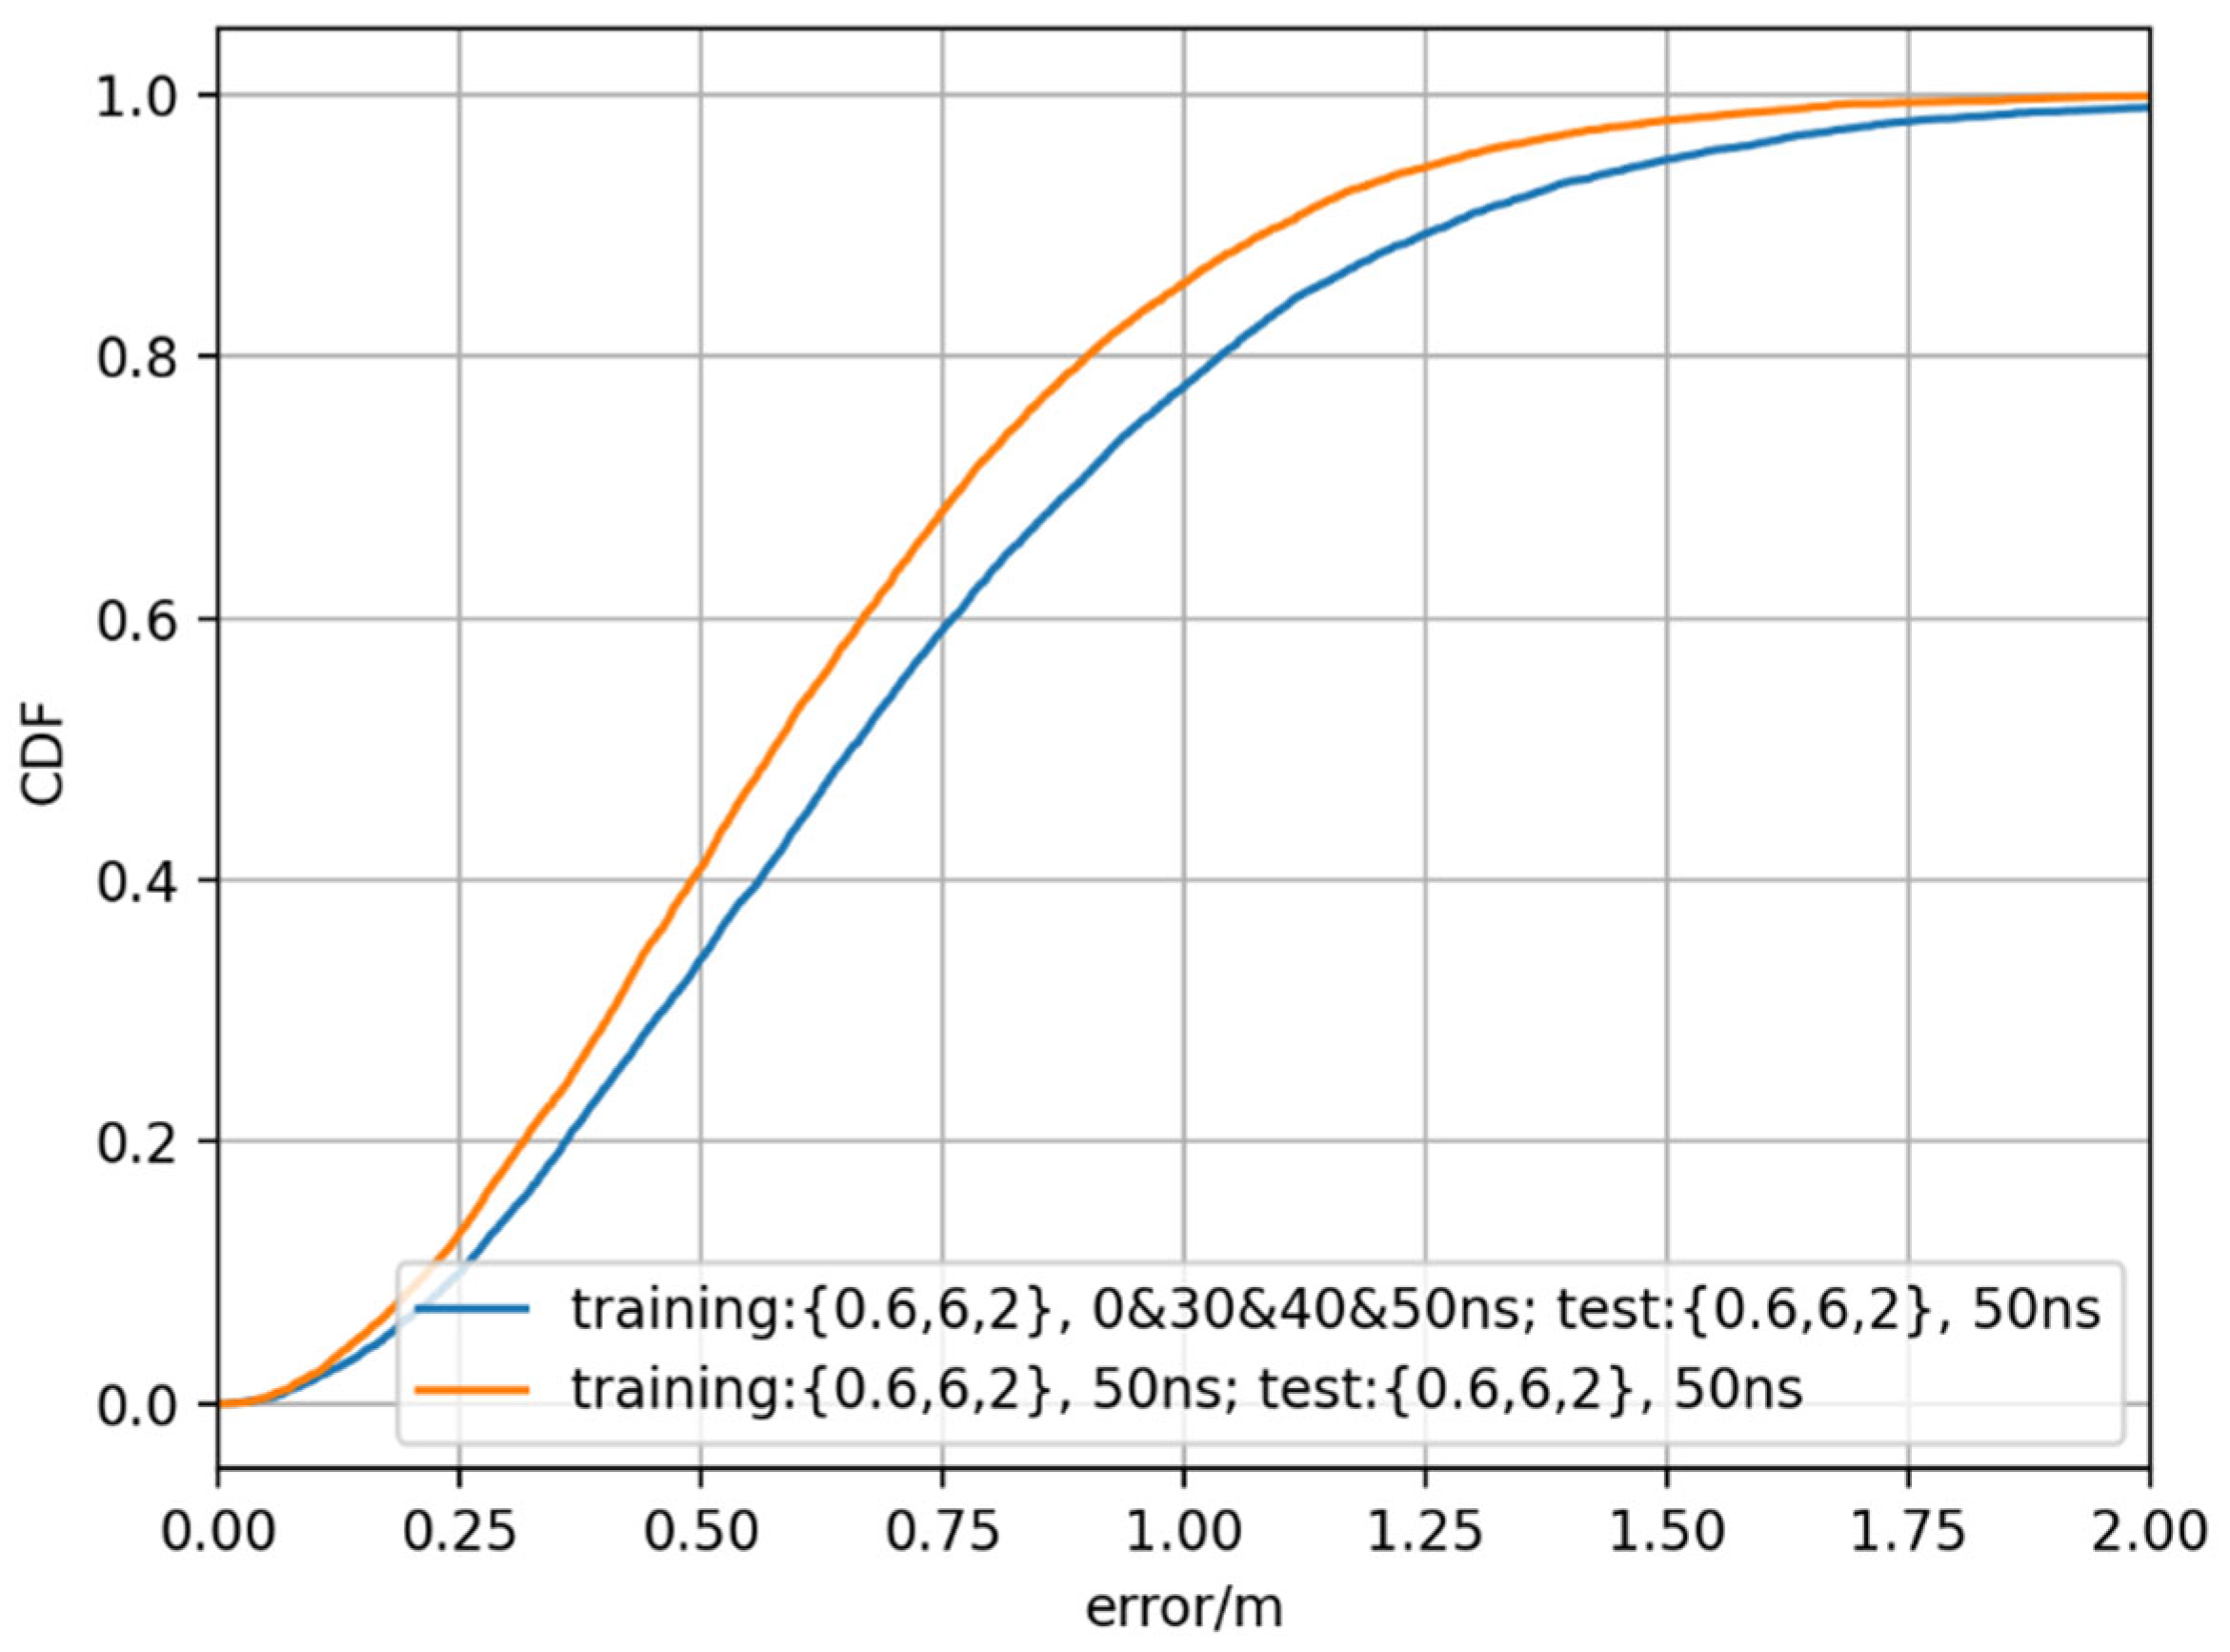
- For network synchronization error, using mixed data sets and fine-tuning does not help much in improving the generalization capability. Other solutions can be considered. According to our test, when the network synchronization error is small, the positioning error would be small. For example, when the AI model is trained with the data set with mixed network synchronization error setting and tested with data set of 30 ns standard deviation, then the positioning error @90% for clutter parameter {40%, 2 m, 2 m} is reduced from around 3 m to less than 2 m, as shown in Figure 28. Thus, in the realistic work, solutions to reduce the network synchronization error could help to guarantee the performance. In addition, another approach is to use dedicated models for dedicated network synchronization error settings. For example, as shown in Figure 29, in the network with a synchronization error of 50 ns standard deviation, when the AI model is also trained with data set with synchronization error of 50 ns standard deviation, then better performance is also achieved. In this approach, the network should monitor the distribution of the network synchronization error, and once the distribution changes, then a model switch is needed. The details of the model switch could be one part of our future work.
6. Conclusions
Author Contributions
Funding
Institutional Review Board Statement
Informed Consent Statement
Data Availability Statement
Conflicts of Interest
References
- Laoudias, C.; Moreira, A.; Kim, S.; Lee, S.; Wirola, L.; Fischione, C. A survey of enabling technologies for network localization, tracking, and navigation. IEEE Commun. Surv. Tutor. 2018, 20, 3607–3644. [Google Scholar] [CrossRef]
- TS 37.355; LTE Positioning Protocol (LPP). 3GPP Radio Access Network Working Group: Sophia Antipolis, France, 2022.
- TR 38.855; Study on NR Positioning Support. 3GPP Radio Access Network Working Group: Sophia Antipolis, France, 2019.
- TR 38.857; Study on NR Positioning Enhancements. 3GPP Radio Access Network Working Group: Sophia Antipolis, France, 2021.
- Niitsoo, A.; Edelh, T.; Eberlein, E.; Hadaschik, N.; Mutschler, C. A deep learning approach to position estimation from channel impulse responses. Sensors 2019, 19, 1064. [Google Scholar] [CrossRef] [PubMed]
- Niitsoo, A.; Edelhäußer, T.; Mutschler, C. Convolutional Neural Networks for Position Estimation in TDoA-Based Locating Systems. In Proceedings of the 9th International Conference on Indoor Positioning and Indoor Navigation, Nantes, France, 24–27 September 2018; pp. 1–8. [Google Scholar]
- Martinez Sala, A.; Quir’os, R.; L’opez, E. Using neural networks and Active RFID for indoor location services. In Proceedings of the European Workshop Smart Objects: Systems, Technologies and Applications, Ciudad, Spain, 15–16 June 2010; pp. 1–9. [Google Scholar]
- Singh, P.; Agrawal, S. TDOA Based Node Localization in WSN using Neural Networks. In Proceedings of the International Conference on Communication Systems and Network Technologies, Gwalior, India, 6–8 April 2013; pp. 400–404. [Google Scholar]
- Chen, C.S. Artificial Neural Network for Location Estimation in Wireless Communication Systems. Sensors 2012, 12, 2798–2817. [Google Scholar] [CrossRef] [PubMed]
- Luo, J.; Gao, H. Deep Belief Networks for Fingerprinting Indoor Localization Using Ultrawideband Technology. Int. J. Distrib. Sens. Netw. 2016, 2016, 18. [Google Scholar] [CrossRef]
- Le, D.V.; Meratnia, N.; Havinga, P.J.M. Unsupervised Deep Feature Learning to Reduce the Collection of Fingerprints for Indoor Localization Using Deep Belief Networks. In Proceedings of the 9th International Conference on Indoor Positioning and Indoor Navigation, Nantes, France, 24–27 September 2018; pp. 1–7. [Google Scholar]
- Félix, G.; Siller, M.; Álvarez, E.N. A Fingerprinting Indoor Localization Algorithm based Deep Learning. In Proceedings of the 8th International Conference on Ubiquitous and Future Networks, Vienna, Austria, 5–8 July 2016; pp. 1006–1011. [Google Scholar]
- Kim, K.S.; Lee, S.; Huang, K. A Scalable Deep Neural Network Architecture for Multi-Building and Multi-Floor Indoor Localization based on Wi-Fi Fingerprinting. Big Data Anal. 2018, 4, 1–17. [Google Scholar] [CrossRef]
- Savic, V.; Larsson, E.G. Fingerprinting-Based Positioning in Distributed Massive MIMO Systems. In Proceedings of the 82nd IEEE Conference on Vehicular Technology, Boston, MA, USA, 6–9 September 2015; pp. 1–5. [Google Scholar]
- Kuo, R.; Tseng, W.; Tien, F.; Liao, W. Application of an Artificial Immune System-based Fuzzy Neural Network to a RFID-based Positioning System. J. Comput. Ind. Eng. 2012, 63, 943–956. [Google Scholar] [CrossRef]
- Vaghefi, S.Y.M.; Vaghefi, R.M. A Novel Multilayer Network Model for TOA-Based Localization in Wireless Sensor Networks. In Proceedings of the International Joint Conference on Neural Networks, San Jose, CA, USA, 31 July–5 August 2011; pp. 3079–3084. [Google Scholar]
- Lewandowski, A.; Köster, V.; Wietfeld, C.; Michaelis, S. Support Vector Machines for Non-Linear Radio Fingerprint Recognition in Real-Life Industrial Environments. In Proceedings of the International Conference on Technical Meeting, San Diego, CA, USA, 24–26 January 2011; pp. 628–634. [Google Scholar]
- Akram, B.A.; Akbar, A.H.; Shafiq, O. HybLoc: Hybrid IndoorWi-Fi Localization Using Soft Clustering-Based Random Decision Forest Ensembles. IEEE Access 2018, 6, 38251–38272. [Google Scholar] [CrossRef]
- Mascharka, D.; Manley, E. LIPS: Learning Based Indoor Positioning System using mobile phone-based sensors. In Proceedings of the 13th IEEE Annual Consumer Communications and Networking Conference, Las Vegas, NV, USA, 9–12 January 2016; pp. 968–971. [Google Scholar]
- Iqbal, Z.; Luo, D.; Henry, P.; Kazemifar, S.; Rozario, T.; Yan, Y.; Westover, K.; Lu, W.; Nguyen, D.; Long, T.; et al. Accurate Real Time Localization Tracking in a Clinical Environment using Bluetooth Low Energy and Deep Learning. PLoS ONE 2017, 13, e0205392. [Google Scholar] [CrossRef] [PubMed]
- Ibrahim, M.; Torki, M.; ElNainay, M. CNN based Indoor Localization using RSS Time-Series. In Proceedings of the 2018 IEEE Symposium on Computers and Communications, Natal, Brazil, 25–28 June 2018; pp. 1044–1049. [Google Scholar]
- Sahar, A.; Han, D. An LSTM-based Indoor Positioning Method Using Wi-Fi Signals. In Proceedings of the 2nd International Conference on Vision, Image and Signal Processing, Las Vegas, NV, USA, 27–29 August 2018; pp. 43:1–43:5. [Google Scholar]
- Feigl, T.; Nowak, T.; Philippsen, M.; Edelhäußer, T.; Mutschler, C. Recurrent Neural Networks on Drifting Time-of-Flight Measurements. In Proceedings of the 9th International Conference on Indoor Positioning and Indoor Navigation, Nantes, France, 24–27 September 2018; pp. 206–212. [Google Scholar]
- Mohammadi, M.; Al-Fuqaha, A.; Guizani, M.; Oh, J.S. Semisupervised Deep Reinforcement Learning in Support of IoT and Smart City Services. IEEE Internet Things J. 2018, 5, 624–635. [Google Scholar] [CrossRef]
- What Is Generalization in Machine Learning? Available online: https://deepai.space/what-is-generalization-in-machine-learning (accessed on 15 March 2023).
- de Sousa, M.N.; Thomä, R.S. Enhancement of localization systems in nlos urban scenario with multipath ray tracing fingerprints and machine learning. Sensors 2018, 18, 4073. [Google Scholar] [CrossRef] [PubMed]
- Arnold, M.; Dorner, S.; Cammerer, S.; Brink, S.T. On deep learning-based massive mimo indoor user localization. In Proceedings of the (SPAWC 2022) 2022 IEEE International Workshop on Signal Processing Advances in Wireless Communications, Oulu, Finland, 4–6 July 2022; pp. 1–5. [Google Scholar]
- De Bast, S.; Guevara, A.P.; Pollin, S. Csi-based positioning in massive mimo systems using convolutional neural networks. In Proceedings of the Vehicular Technology Conference, Virtual, 18 November–16 December 2020; IEEE: New York, NY, USA, 2020; pp. 1–5. [Google Scholar]
- Stahlke, M.; Feigl, T.; Castañeda García, M.H.C.; Stirling-Gallacher, R.A.; Seitz, J.; Mutschler, C. Transfer Learning to adapt 5G AI-based Fingerprint Localization across Environments. In Proceedings of the 2022 IEEE 95th Vehicular Technology Conference, Helsinki, Finland, 19–22 June 2022. [Google Scholar]
- TR 38.901; Study on Channel Model for Frequencies from 0.5 to 100 GHz. 3GPP Radio Access Network Working Group: Sophia Antipolis, France, 2021.
- He, K.; Zhang, X.; Ren, S.; Sun, J. Deep Residual Learning for Image Recognition. In Proceedings of the 2016 IEEE Conference on Computer Vision and Pattern Recognition (CVPR), Las Vegas, NV, USA, 27–30 June 2016; pp. 770–778. [Google Scholar]


| Clutter Parameter | Positioning Error @90% CDF (m) | |
|---|---|---|
| Impact from different clutter parameters from training | Training: {0.6,6,2} Test: {0.4,2,2} | 7.0914 |
| Training {0.4,2,2} Test{0.6,6,2} | 1.5328 | |
| Impact from network synchronization error | Training/Test: {0.6,6,2} | 12.4486 |
| Training/Test: {0.4,2,2} | 14.5779 | |
| Impact from receiving error | Training/Test: {0.6,6,2} | 1.7885 |
| Training/Test: {0.4,2,2} | 2.5998 |
| Clutter parameter | Positioning Error @90% CDF (m) | |
|---|---|---|
| Impact from different clutter parameters from training | Training: {0.6,6,2} Test: {0.4,2,2} | 7.1173 |
| Training {0.4,2,2} Test{0.6,6,2} | 1.5413 | |
| Impact from network synchronization error | Training/Test: {0.6,6,2} | 12.7748 |
| Training/Test: {0.4,2,2} | 15.4699 | |
| Impact from receiving timing error | Training/Test: {0.6,6,2} | 1.3461 |
| Training/Test: {0.4,2,2} | 2.2409 |
| Simulation Cases | Positioning Error @90% CDF (m) | ||
|---|---|---|---|
| Clutter Parameter of Test Data Set | Mixed Parameter | Fine-Tuning | |
| Different clutter parameters | {0.6,6,2} | 0.5419 | 1.4315 |
| {0.4,2,2} | 0.7684 | 0.7185 | |
| Network synchronization error | {0.6,6,2} | 1.2736 | 4.7145 |
| {0.4,2,2} | 2.3022 | 8.0254 | |
| Receiving timing error | {0.6,6,2} | 0.8074 | 1.6094 |
| {0.4,2,2} | 1.2604 | 2.1858 | |
| Simulation Cases | Positioning Error @90% CDF(m) | ||
|---|---|---|---|
| Clutter Parameter of Test Data Set | Mixed Parameter | Fine-Tuning | |
| Different clutter parameters | {0.6,6,2} | 0.6867 | 1.5325 |
| {0.4,2,2} | 0.7974 | 0.8494 | |
| Network synchronization error | {0.6,6,2} | 1.3461 | 4.4925 |
| {0.4,2,2} | 2.2409 | 7.506 | |
| Receiving timing error | {0.6,6,2} | 0.9341 | 1.6034 |
| {0.4,2,2} | 1.2952 | 2.1152 | |
Disclaimer/Publisher’s Note: The statements, opinions and data contained in all publications are solely those of the individual author(s) and contributor(s) and not of MDPI and/or the editor(s). MDPI and/or the editor(s) disclaim responsibility for any injury to people or property resulting from any ideas, methods, instructions or products referred to in the content. |
© 2023 by the authors. Licensee MDPI, Basel, Switzerland. This article is an open access article distributed under the terms and conditions of the Creative Commons Attribution (CC BY) license (https://creativecommons.org/licenses/by/4.0/).
Share and Cite
Mu, Q.; Wu, M.; Zhou, H. Generalization Investigation for Artificial Intelligence-Based Positioning in IIoT. Symmetry 2023, 15, 992. https://doi.org/10.3390/sym15050992
Mu Q, Wu M, Zhou H. Generalization Investigation for Artificial Intelligence-Based Positioning in IIoT. Symmetry. 2023; 15(5):992. https://doi.org/10.3390/sym15050992
Chicago/Turabian StyleMu, Qin, Muqing Wu, and Huixuan Zhou. 2023. "Generalization Investigation for Artificial Intelligence-Based Positioning in IIoT" Symmetry 15, no. 5: 992. https://doi.org/10.3390/sym15050992