Article

Strength Properties and Damage Evolution Mechanism of Single-Flawed Brazilian Discs: An Experimental Study and Particle Flow Simulation

1
School of Mechanics and Civil Engineering, China University of Mining and Technology (Beijing), Beijing 100083, China
2
State Key Laboratory of Coal Resources and Safe Mining, China University of Mining and Technology (Beijing), Beijing 100083, China
*
Authors to whom correspondence should be addressed.
Symmetry 2023, 15(4), 895; https://doi.org/10.3390/sym15040895
Submission received: 27 March 2023 / Revised: 4 April 2023 / Accepted: 8 April 2023 / Published: 10 April 2023
(This article belongs to the Topic Advances in Computational Materials Sciences)

Abstract

:
Understanding the tensile strength properties and damage evolution mechanism in fissured rock is very important to fundamental research and engineering design. The effects of flaw dip angle on the tensile strength, macroscopic crack propagation and failure mode of symmetrical Brazilian discs of rock-like materials were investigated. A parallel bonding model was proposed to examine the damage of pre-flawed discs under splitting the load. The microscopic parameters of particles and bonds in the model that can characterize rock-like materials’ mechanical and deformation properties were obtained by calibrating against the laboratory test results. The crack development, energy evolution and damage characteristics of Brazil discs containing a single pre-existing flaw were studied at the microscopic scale. The results show that the flaw significantly weakens the strength of the Brazilian disc, and both the peak load and the initial cracking load decrease with increasing flaw angle. The failure modes of the rock-like specimens are mainly divided into three types: wing crack penetration damage mode, tensile-shear penetration damage mode and radial penetration failure mode. Except for the flaw dip angle 0°, the wing cracks generally sprouted at the tip of the pre-flaw, and the wing cracks at both tips of the pre-flaw are centrosymmetric. Crack coalescence was concentrated in the post-peak stage. Based on the particle flow code (PFC) energy partitions, the damage variables characterized by dissipation energy were proposed. The disc specimen’s pre-peak damage variables and peak damage variables decreased with increasing flaw angle, and the damage was concentrated in the post-peak phase.

1. Introduction

The rock mass often contains a large number of pre-existing flaws. Compared with intact rocks, the pre-existing flaws weaken the mechanical properties of the rocks and affect the cracking behavior of the rocks [1]. The influence of flaws with different occurrence on rock mechanical behavior is different. The current research methods for fractured rocks are mainly focused on: laboratory tests and numerical simulations, in which the specimens for laboratory tests can be divided into fractured rock specimens and fractured rock-like specimens according to the materials. The effect of flaw dip angle on specimens’ mechanical and deformation properties has been the focus of previous studies. The effects of flaw dip angle on single-flaw rock specimens’ strength and crack extension under uniaxial compression conditions have been explored [2,3]. The crack sprouting and penetration patterns during the loading of double-fractured rock samples were studied based on photographic monitoring, acoustic emission, and Digital Image Correlation (DIC) [4,5]. Based on the study of unfilled fractured rock, the effect of filler material on the mechanical properties of fractured rock began to be studied. The conclusion was that the higher the strength of the filler, the higher the crack initiation stress of the specimen obtained [6].
To produce fissures more conveniently, many scholars have used cement mortar, gypsum, and other cementitious materials to make rock-like specimens to replace the actual rock specimens. The effects of flaw dip angle and size on the strength and damage mode of the specimens under uniaxial compression have been studied [7,8,9,10]. Rock specimens’ crack initiation and propagation mechanism under uniaxial compression have been investigated [11]. Fissured specimens’ strength and deformation characteristics in the filled state have been explored [12,13,14,15].
Recently, the discrete element method has achieved great success in the numerical analysis of rock mechanics. Many scholars have developed different discrete element numerical models based on the discrete element theory [16,17,18,19]. To simplify and visualize crack generation, several scholars have modeled rock materials using a bonded particle model (BPM) incorporating a particle flow code (PFC) to investigate the effects of pre-existing flaws on stress-strain curves as well as strength and deformation parameters, discussed the initiation, propagation, and coalescence mechanism of new cracks [20,21,22].
Most of the rocks are brittle, and there are few studies on being in tensile conditions because the direct tensile test is challenging to operate. Furthermore, only some materials, such as Alkali-resistant glass fiber reinforced concrete (AR-GFRC), are feasible for direct tensile test [23]. Therefore, most of the failure of rock is dominated by tensile failure. In contrast, the failure of fissured rock is caused by the development of cracks near flaws and the emergence of macroscopic fracture by internal crack penetration. Many scholars have investigated the changes in tensile strength, stress intensity factors, deformation characteristics, acoustic emission energy, failure mode, crack initiation and propagation evolution of specimens under the influence of flaw shape, pores, laminar angle, laminar contact interfaces, mineral composition, rock bridge obliquity, flaw filling or not factors by Brazilian tests and numerical simulations [24,25,26,27]. The aforementioned tests analyzed Brazilian discs’ tensile strength and failure mode under the influence of different factors. Still, the crack propagation mechanism and energy evolution law of Brazilian discs with unfilled flaws were less involved. In this paper, based on previous studies, laboratory tests and PFC simulations were conducted to investigate the strength and crack evolution law of unfilled fissured Brazilian discs with different flaw angles under compression conditions.

2. Materials and Methods

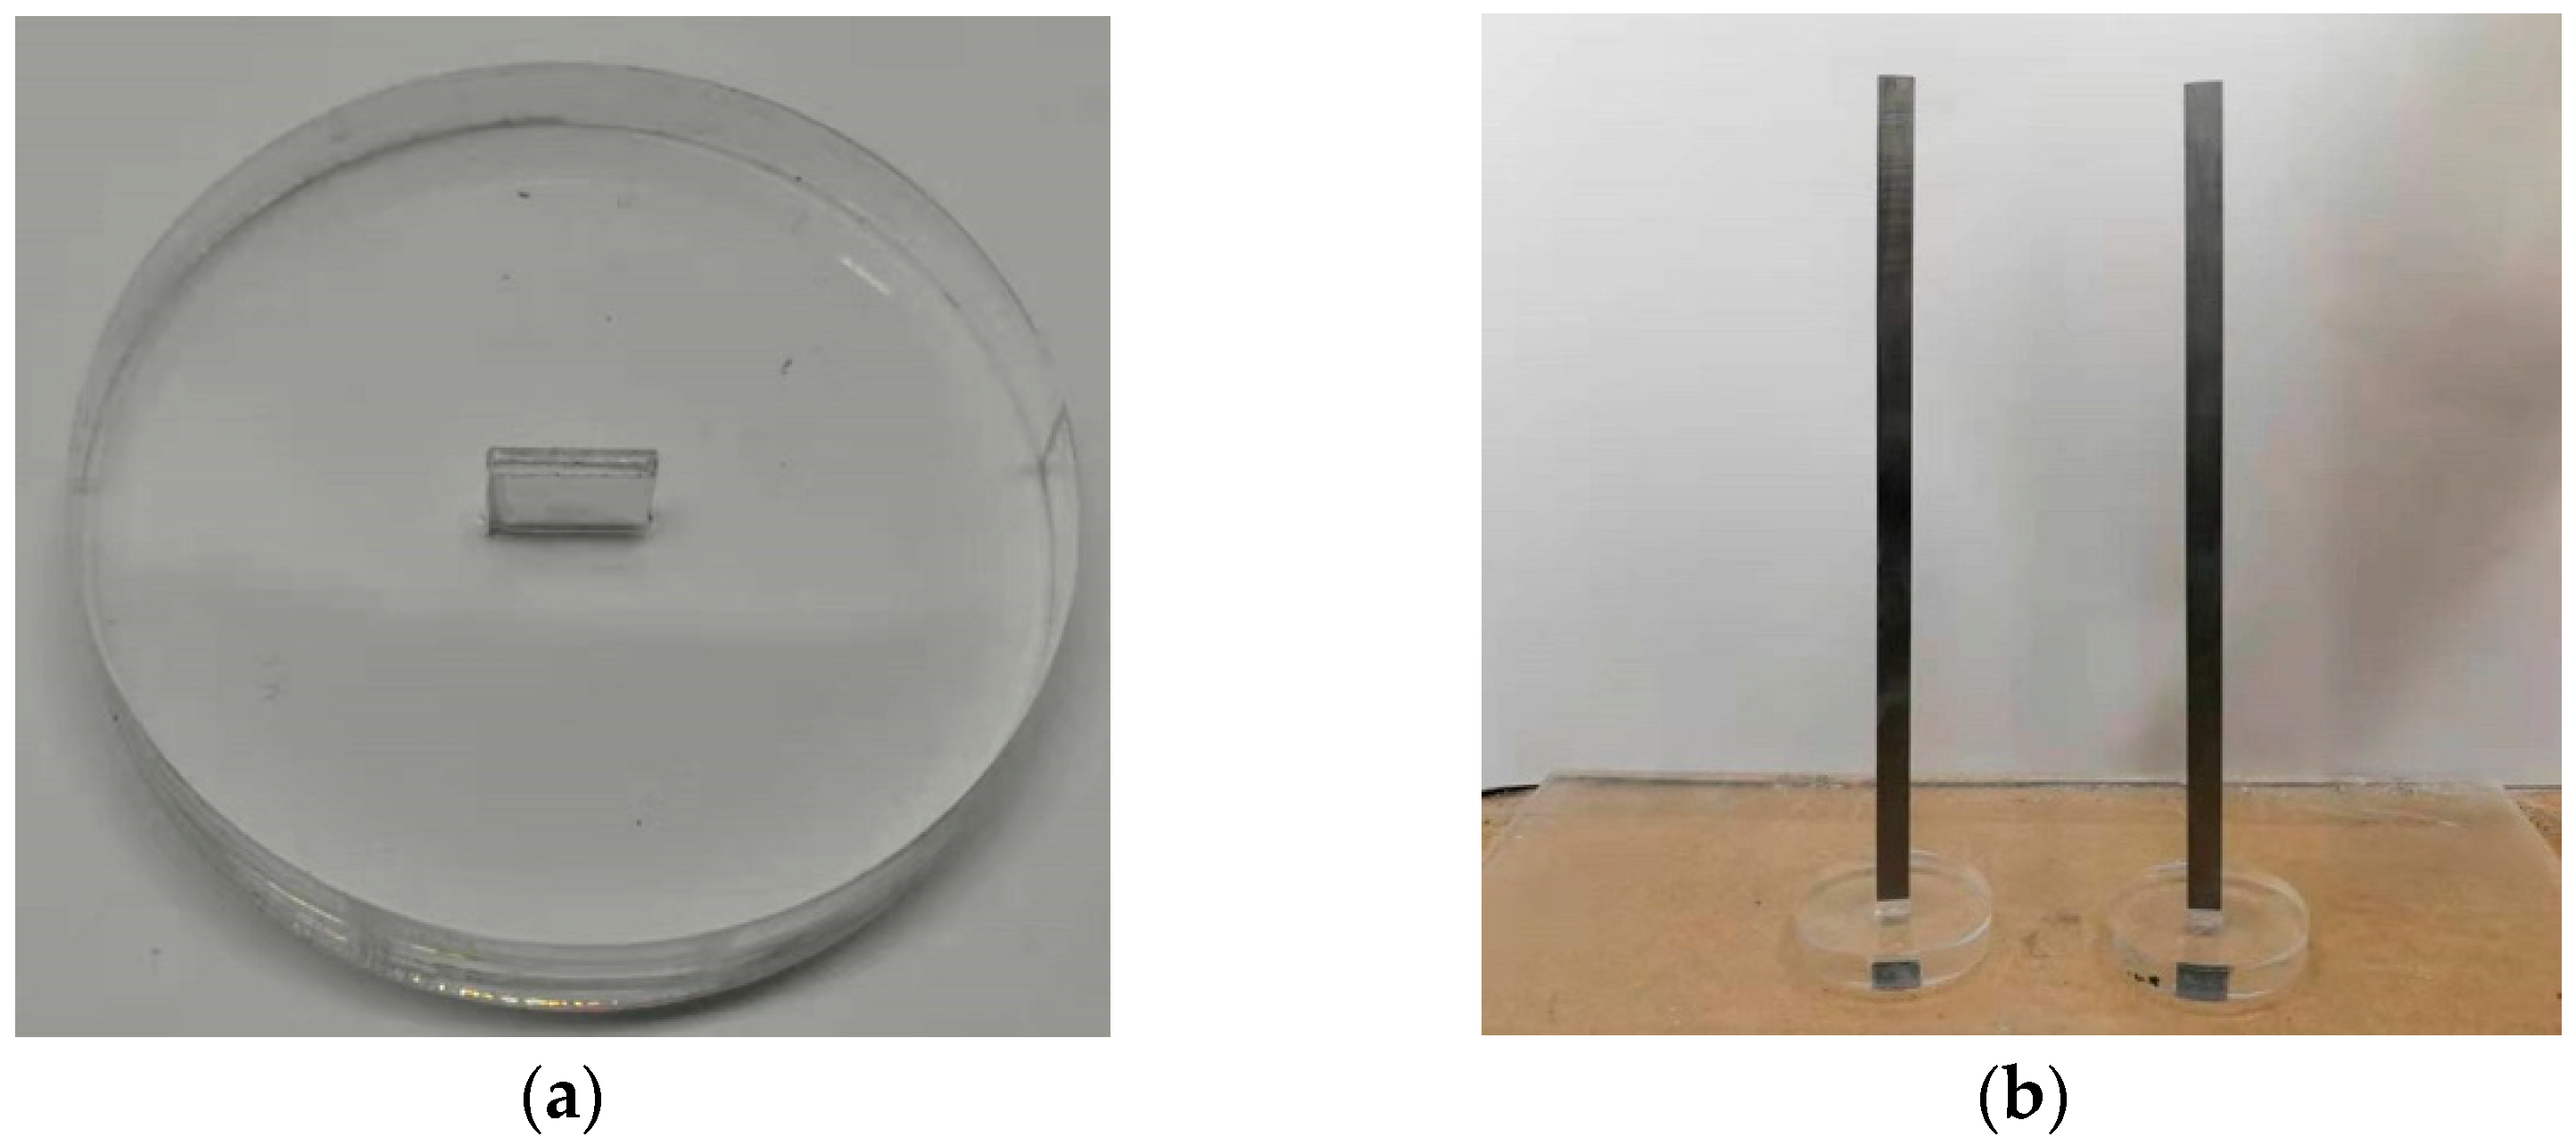
2.1. Sample Preparation

At present, similar materials are widely used in the research of rock mechanics. Most of the rock-like materials are made of cement and sand aggregate. Therefore, cement mortar is selected as a similar material in this test. The materials of cement mortar are mainly 42.5 R ordinary silicate cement, standard sand, and pure water. Considering the elastic modulus, tensile strength and compressive strength of rock-like materials, the improved material ratio (mass ratio) is 42.5 R ordinary silicate cement: standard sand: water is 1:0.8:0.3. To verify that the strength parameters and deformation parameters of rock-like materials and actual rocks are approximately equal, standard specimens for uniaxial compression test and Brazilian test are prepared. All standard rock specimens and Brazilian discs are homogeneous and symmetrical to ensure the accuracy of test results.

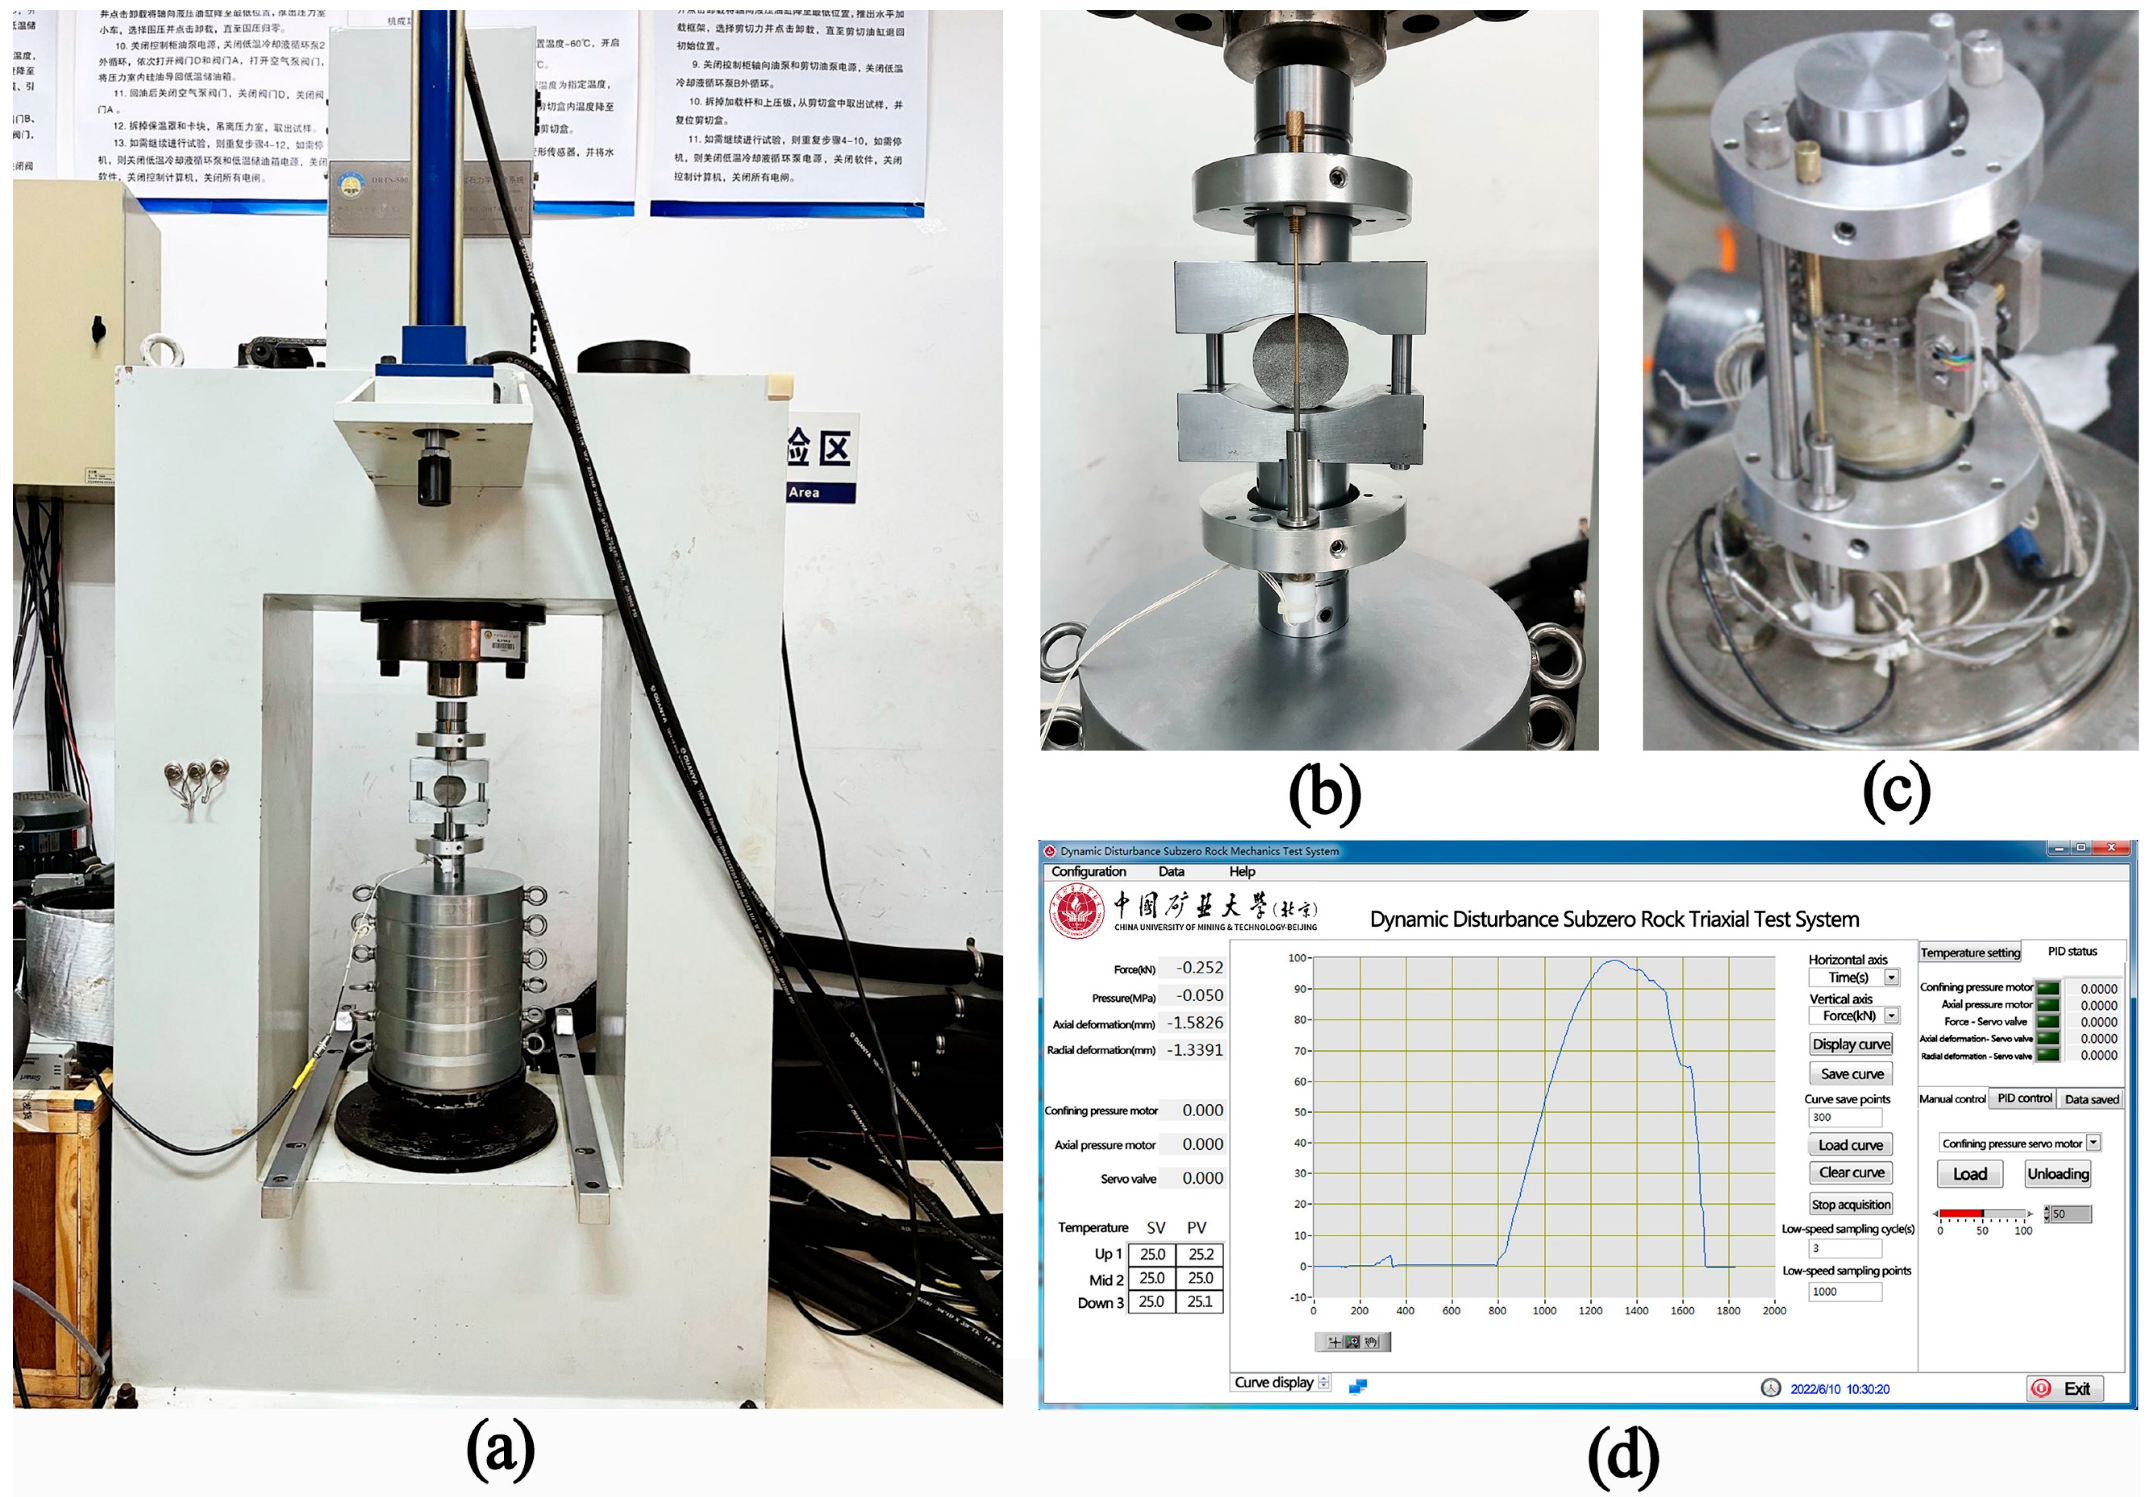
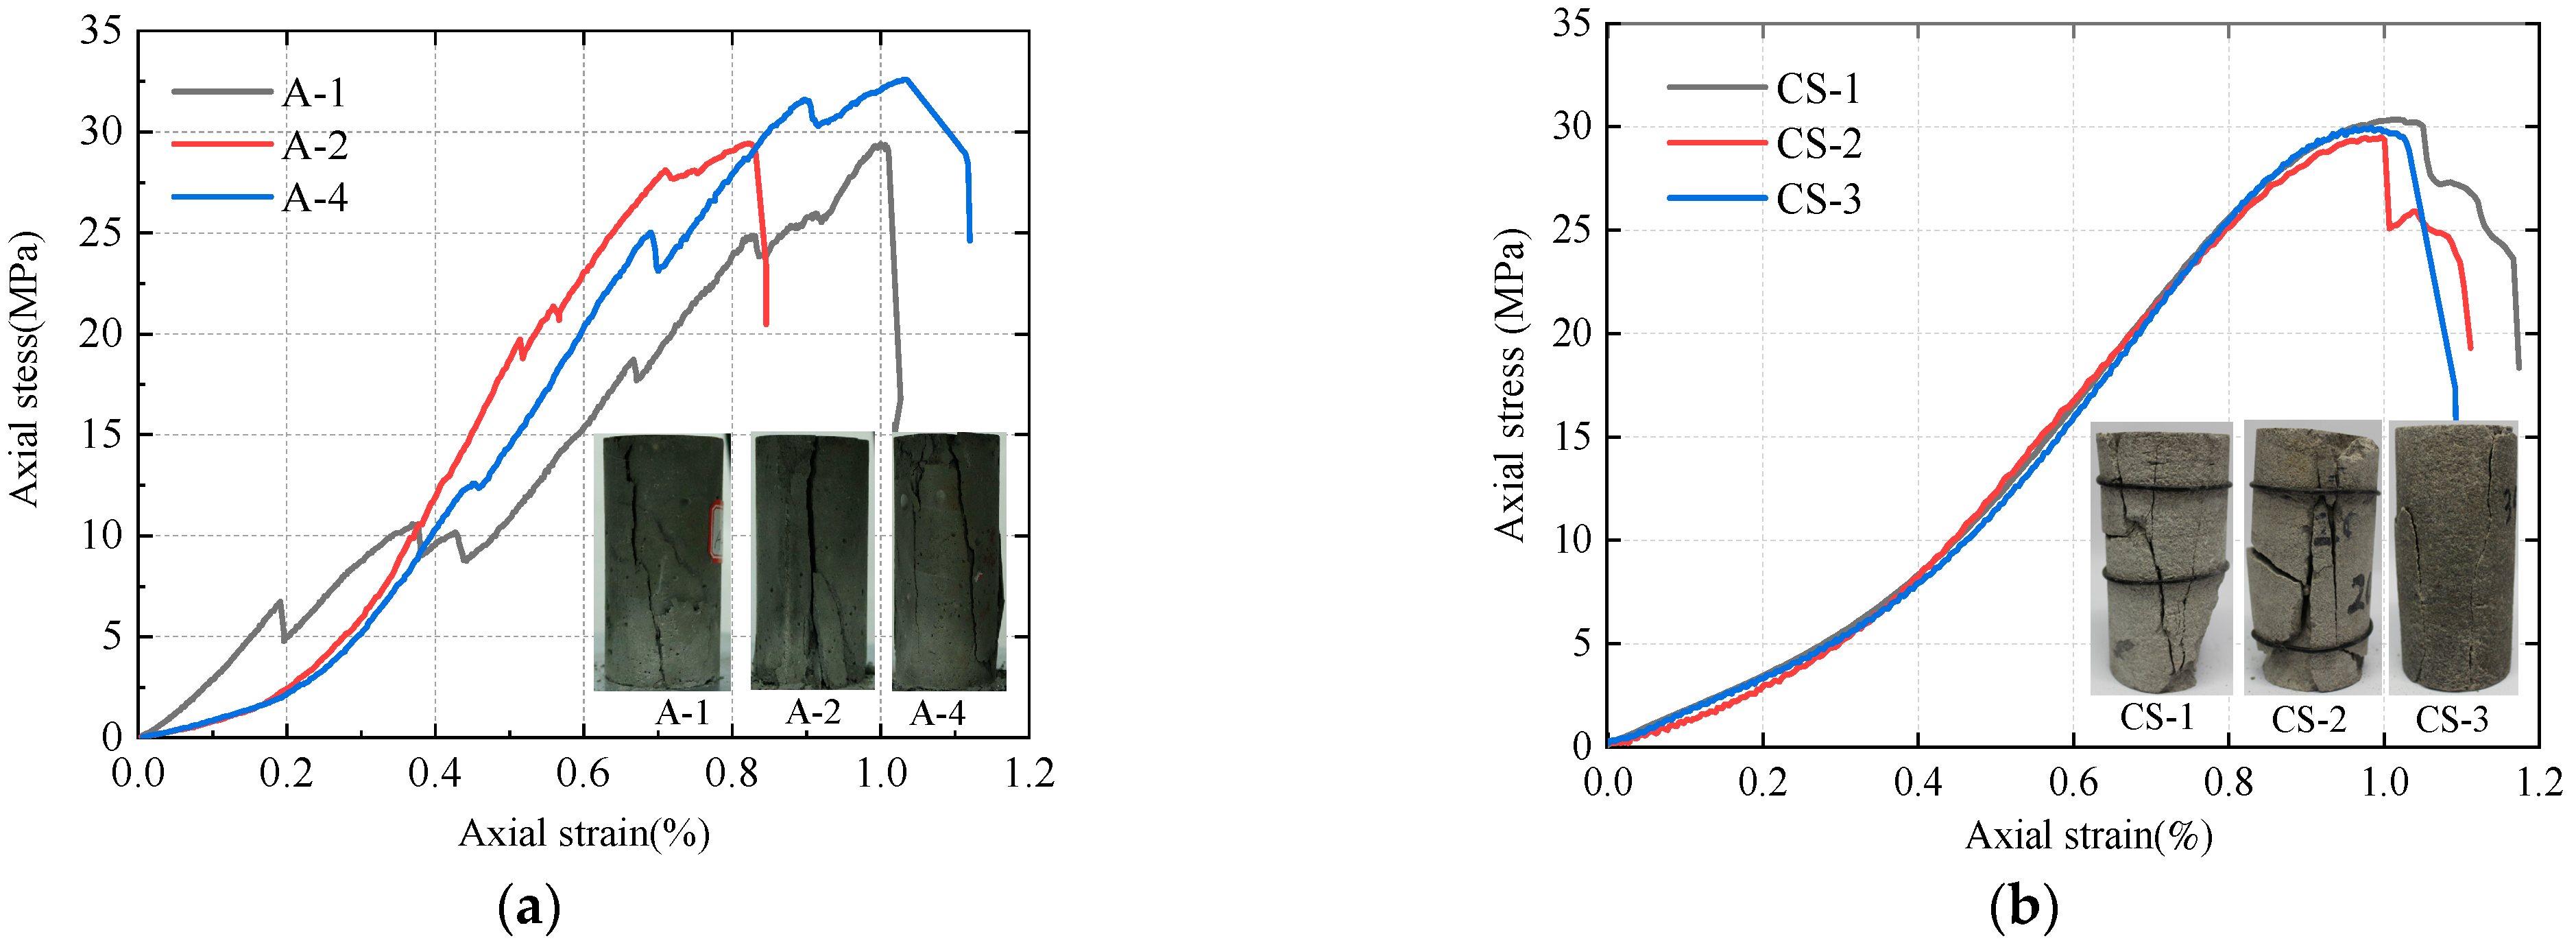
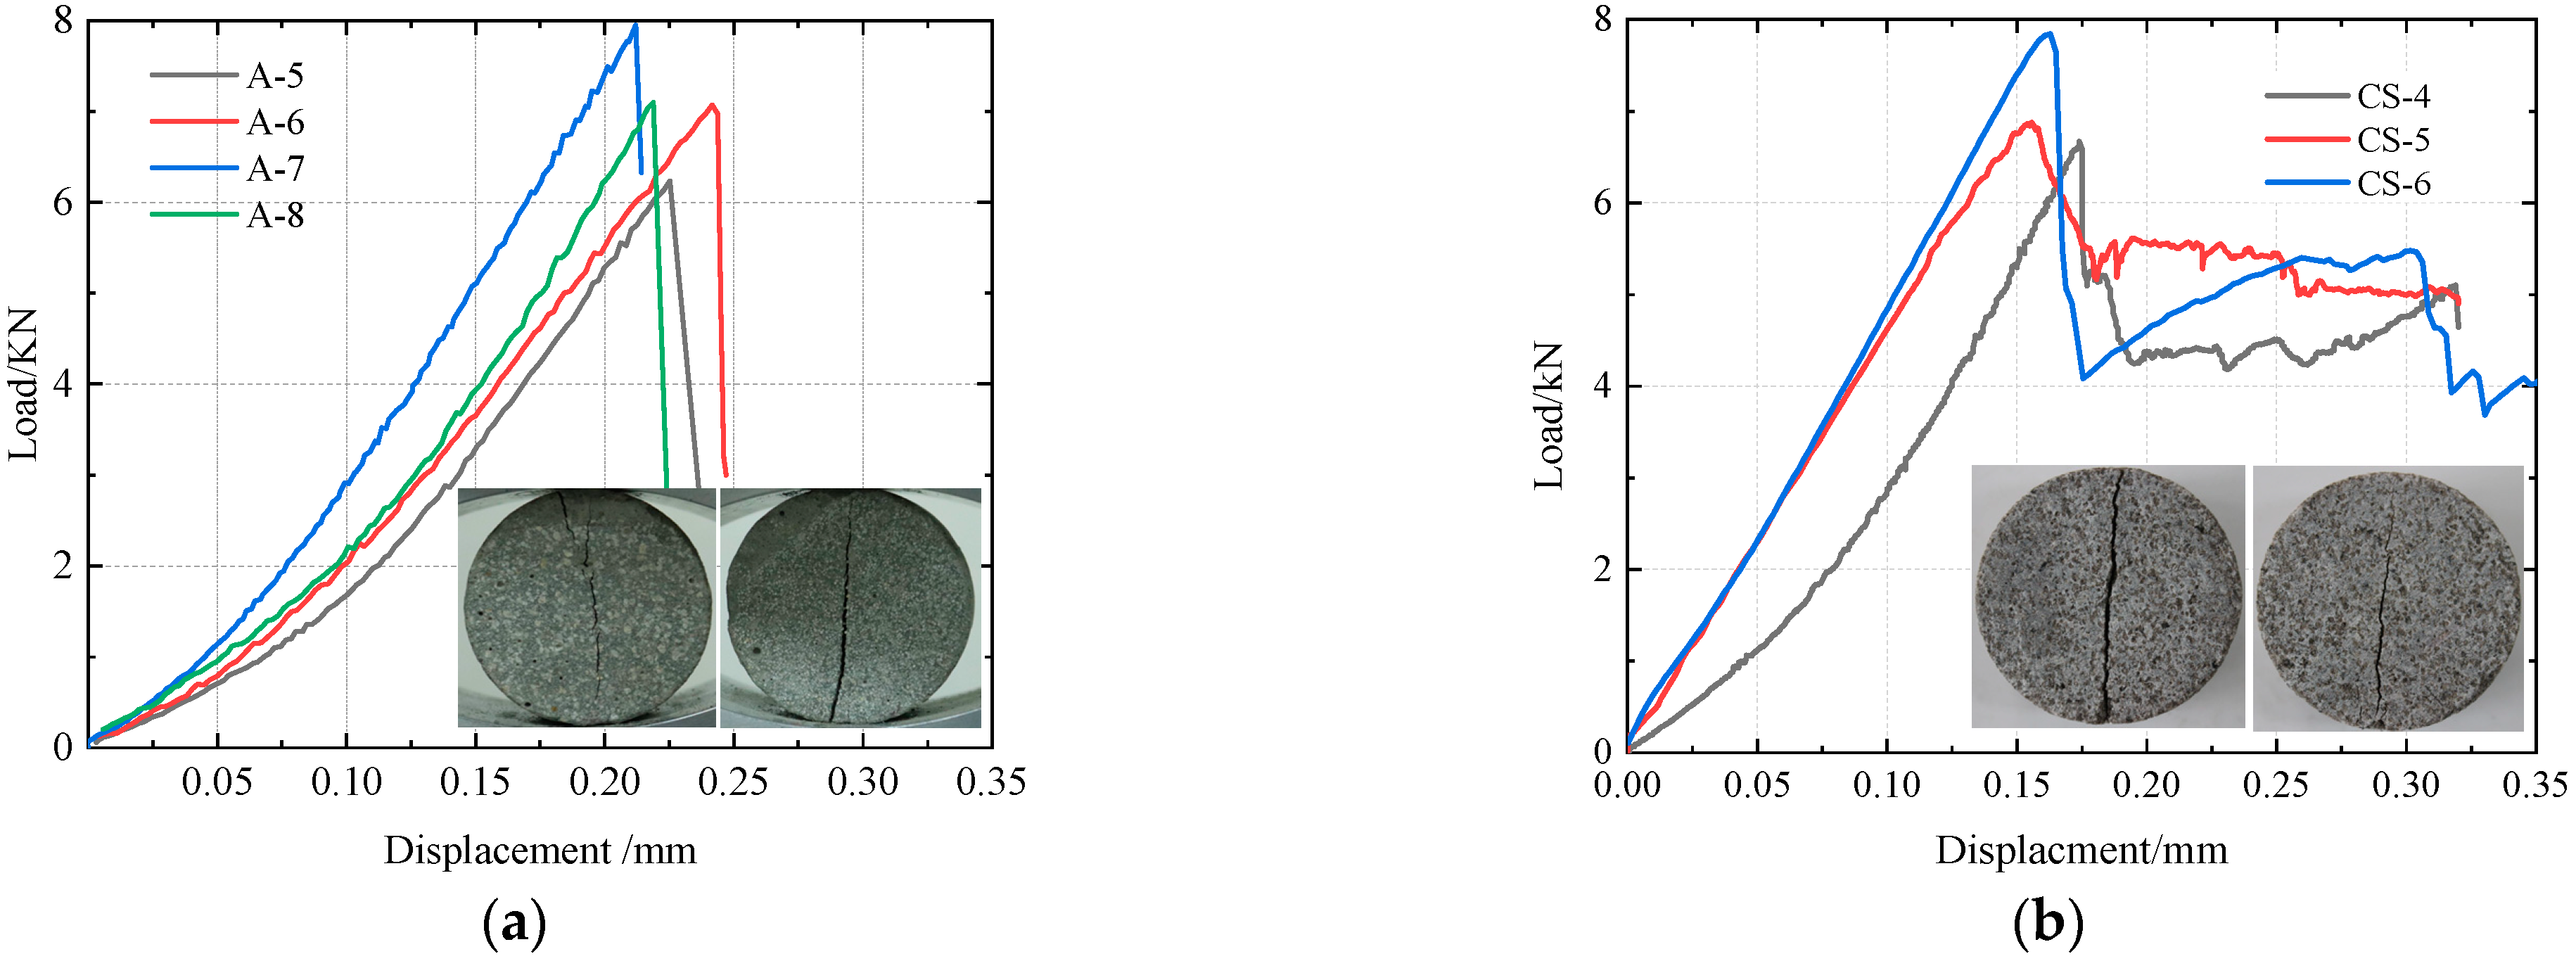
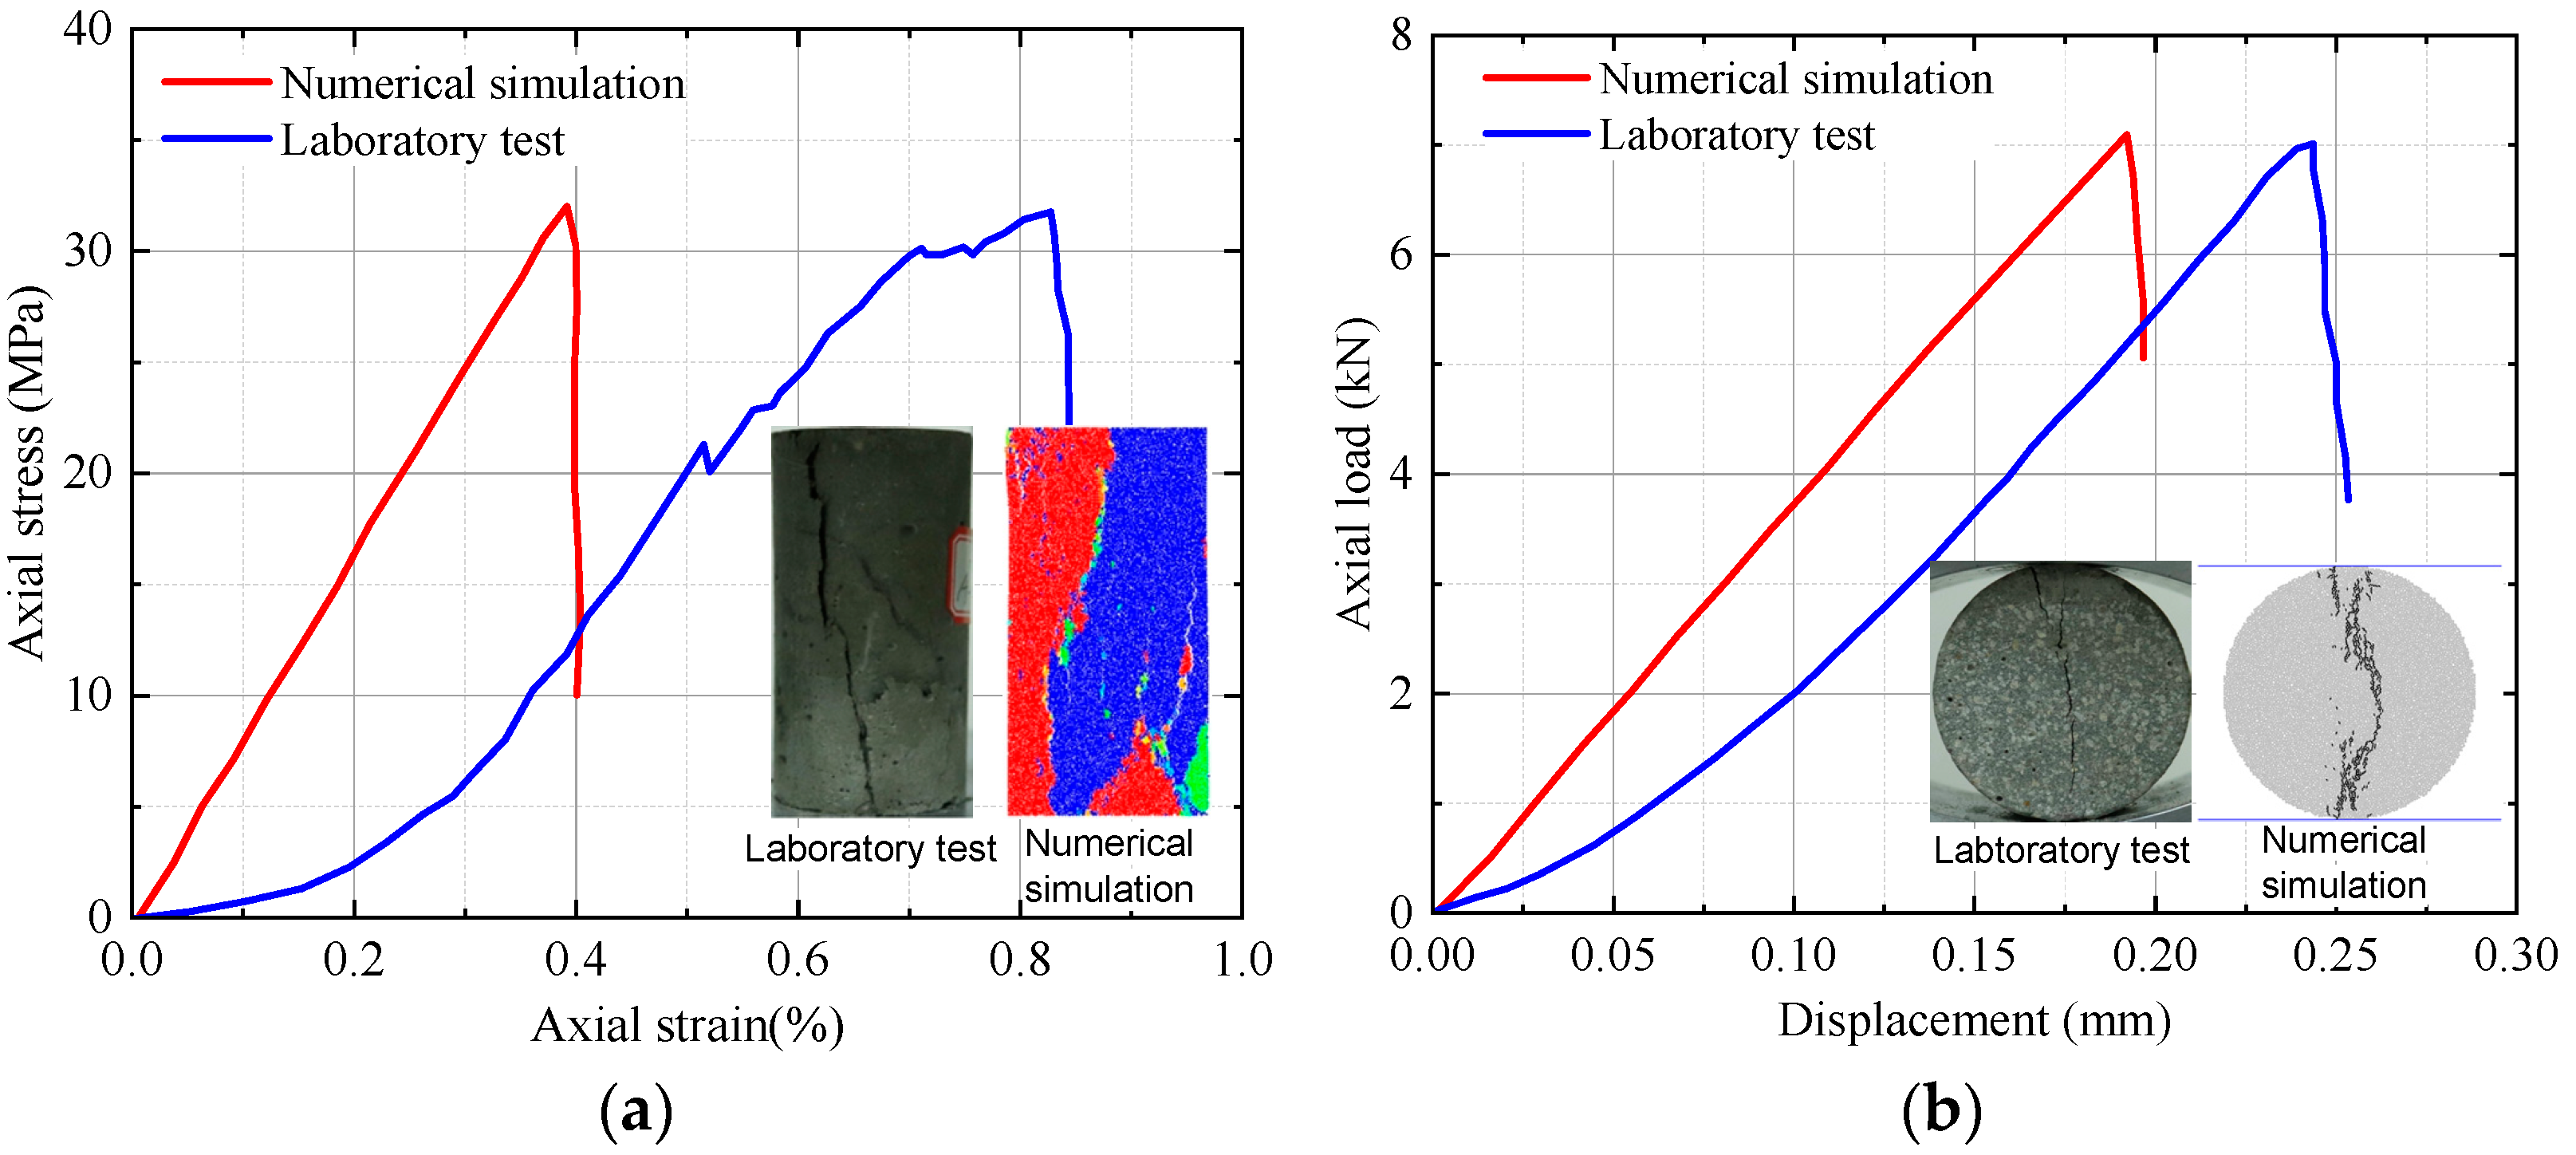
2.2. Verification of Rock-Like Materials

As shown in Figure 1, the equipment is a rock mechanics test system [28]. Therefore, the system can perform conventional uniaxial and Brazilian tests. The axial deformation is measured by two MHR500 LVDTs, with a measurement range of 0~12 mm and a resolution of 0.0001 mm. The axial load is measured by a ZLF-D loading sensor, with a load range of 0~500 kN and a force-measuring resolution of 10 N.
The uniaxial compression and Brazilian tests were carried out on rock-like and actual rock specimens, respectively. Typical test curves are shown in Figure 2 and Figure 3.
As shown in Figure 2 and Figure 3, the stress-strain curves and load-displacement curves of the rock-like specimens are approximately the same as that of the sandstone specimens. The mechanical parameters are listed in Table 1 and Table 2. The density, peak load, peak deformation, elastic modulus, and Poisson’s ratio of the two materials are also close. Therefore, according to the failure modes of rock-like specimens and sandstone specimens, it is found that rock-like material can better simulate the deformation and brittle failure characteristics of sandstone.

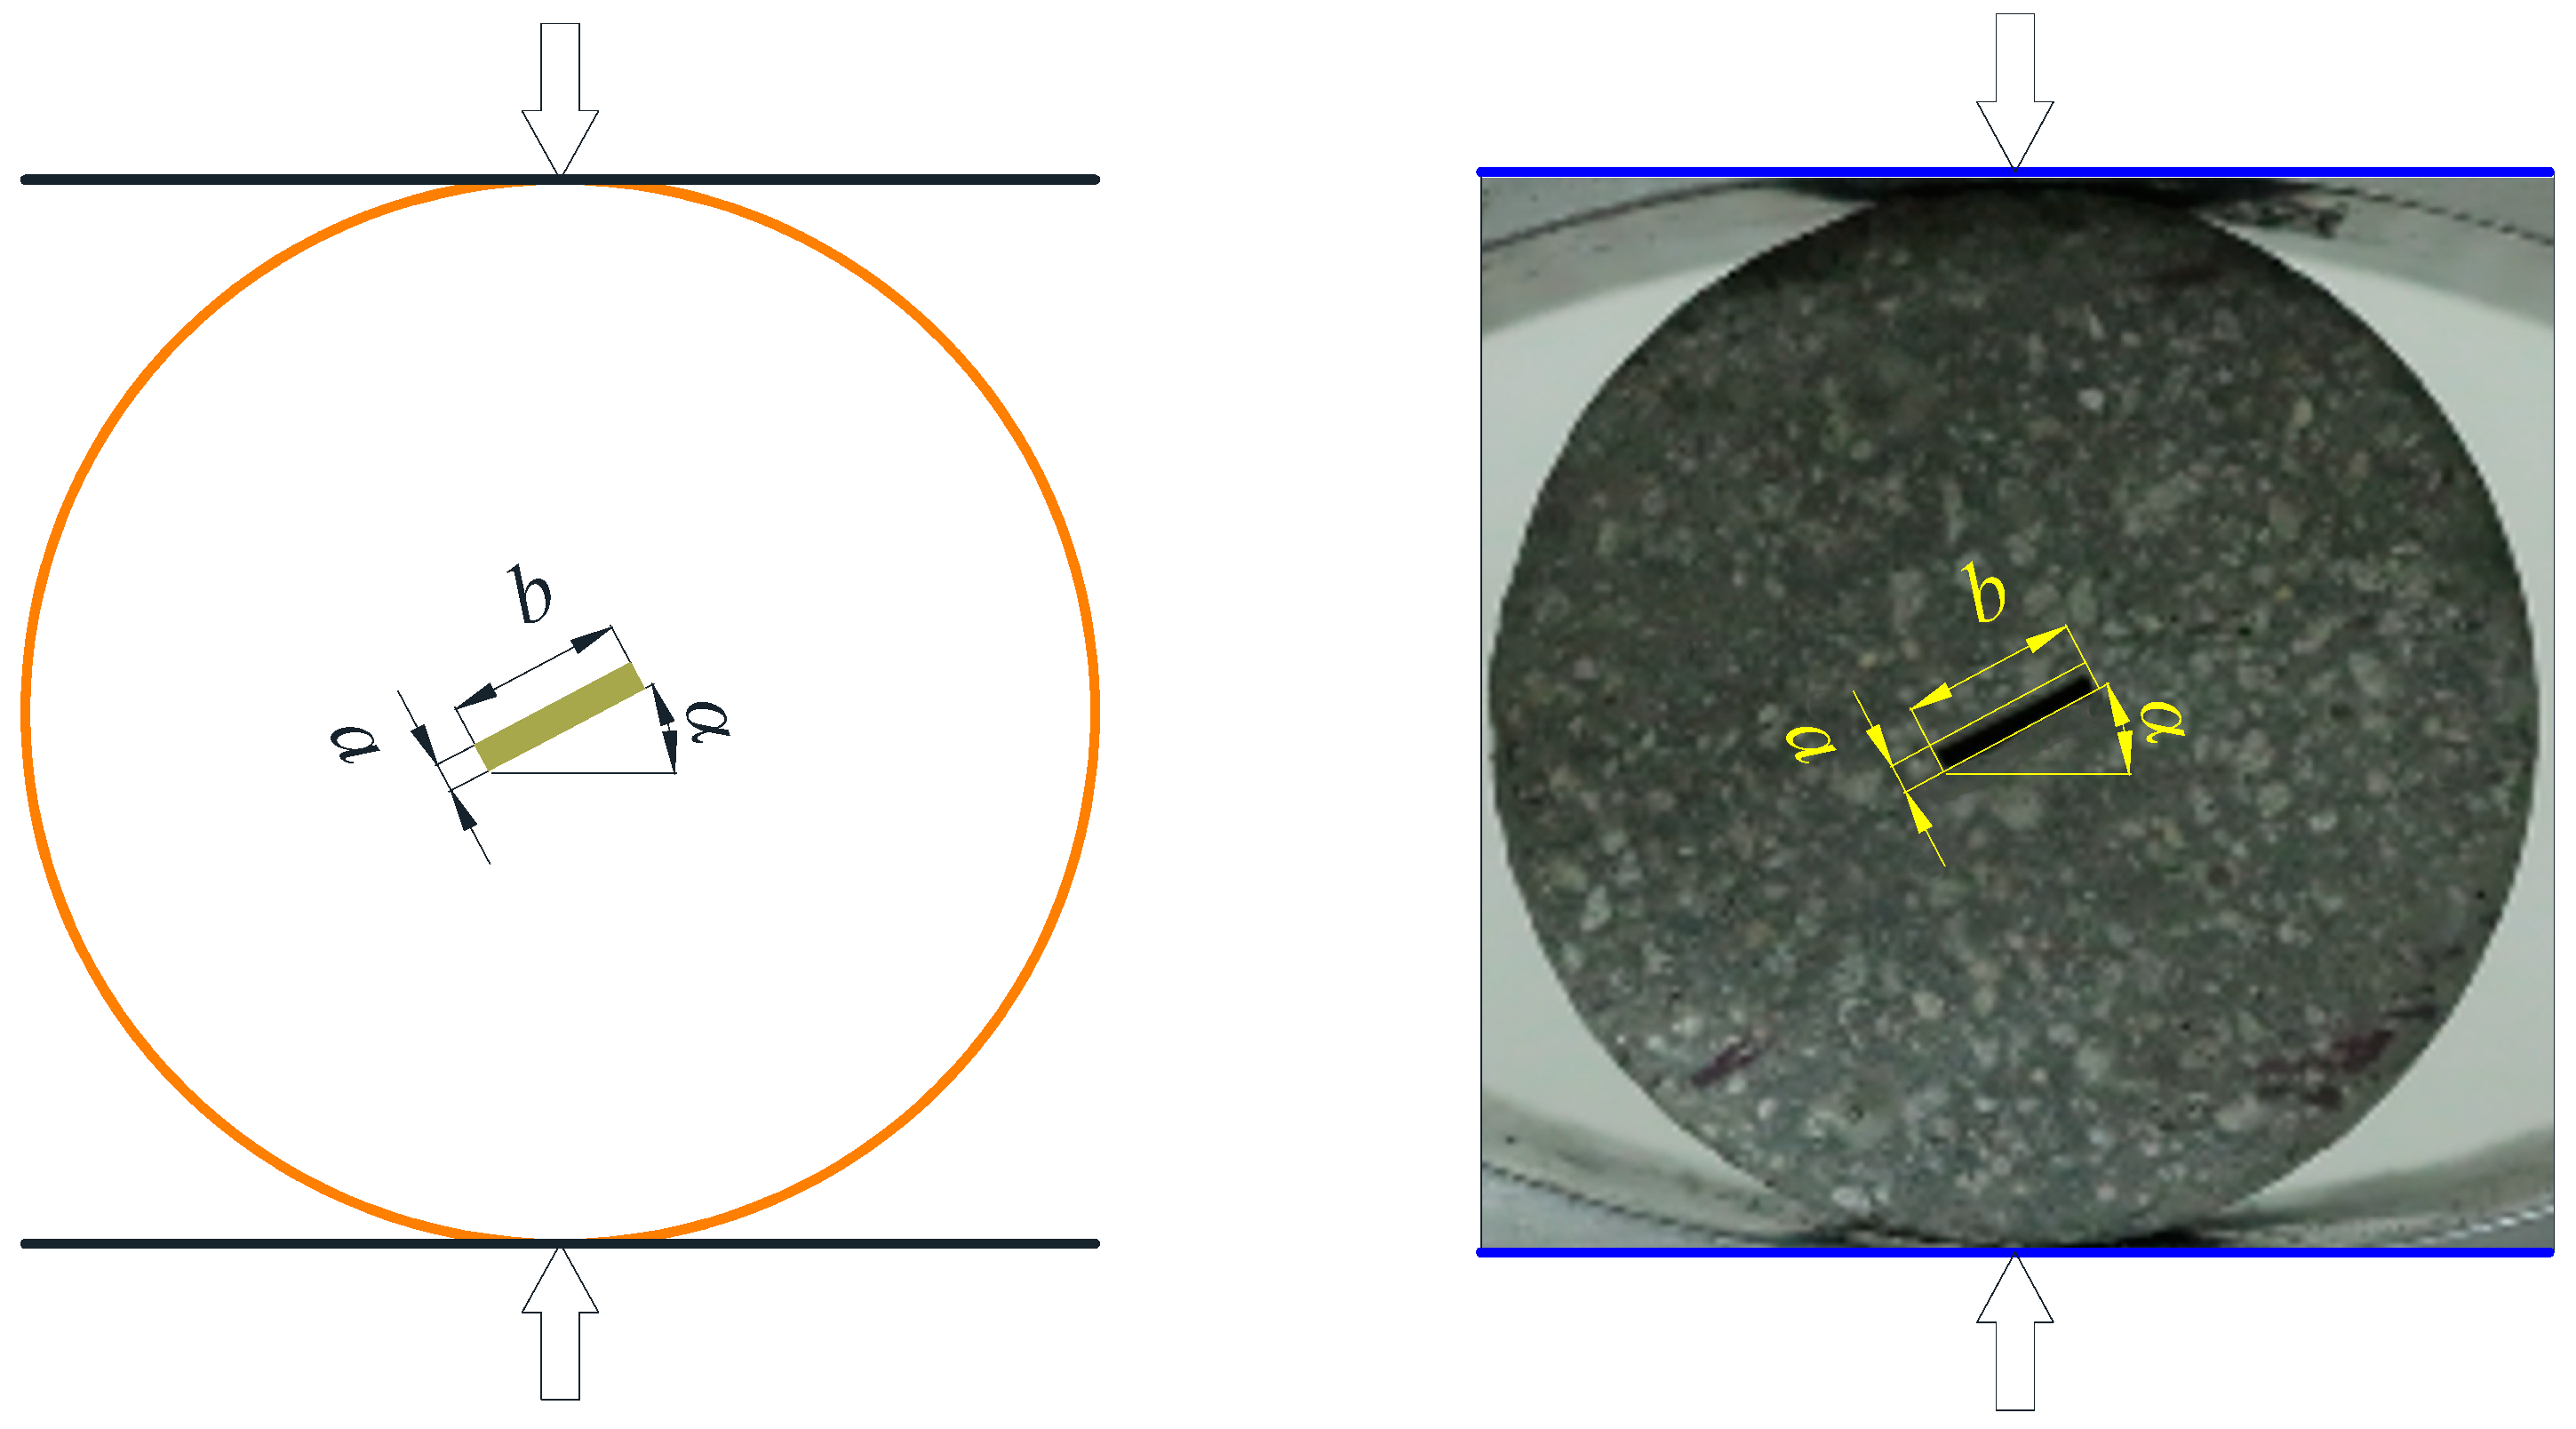
2.3. Experiment Scheme

The mold for making Brazilian discs is composed of standard cylindrical mold and flaw mold, wherein the flaw mold is composed of a resin base and steel sheet, as shown in Figure 4. The flaw mold is placed in the cylindrical mold to form the flaw. Therefore, the Brazilian discs can be obtained by cutting and grinding the prepared standard cylinder specimens with a single flaw. However, it should be noted that the steel sheet used to form the flaw needs to be extracted after the initial setting of the cement mortar.
As shown in Figure 5, the diameter and thickness of the disc specimens are 50 mm and 25 mm. The flaw shape in this test is linear, where a is the flaw width, b is the flaw length, α is the angle between the flaw and the horizontal line during loading (flaw dip angle). The values are as follows: a = 25 mm, b = 50 mm, the flaw angles α are 0°, 15°, 30°, 45°, 60°, 75°, and 90°. Five specimens were made for each test, and three specimens were preferably selected for Brazilian tests at each flaw angle. The flaw is located at the center of the Brazilian disc, and all made Brazilian discs with a single flaw are identical and symmetrical. The different flaw angles are controlled by adjusting the angle between the loading direction and the symmetry axis.

3. Analysis of Macroscopic Mechanical Behavior of Cracked Disc Specimen

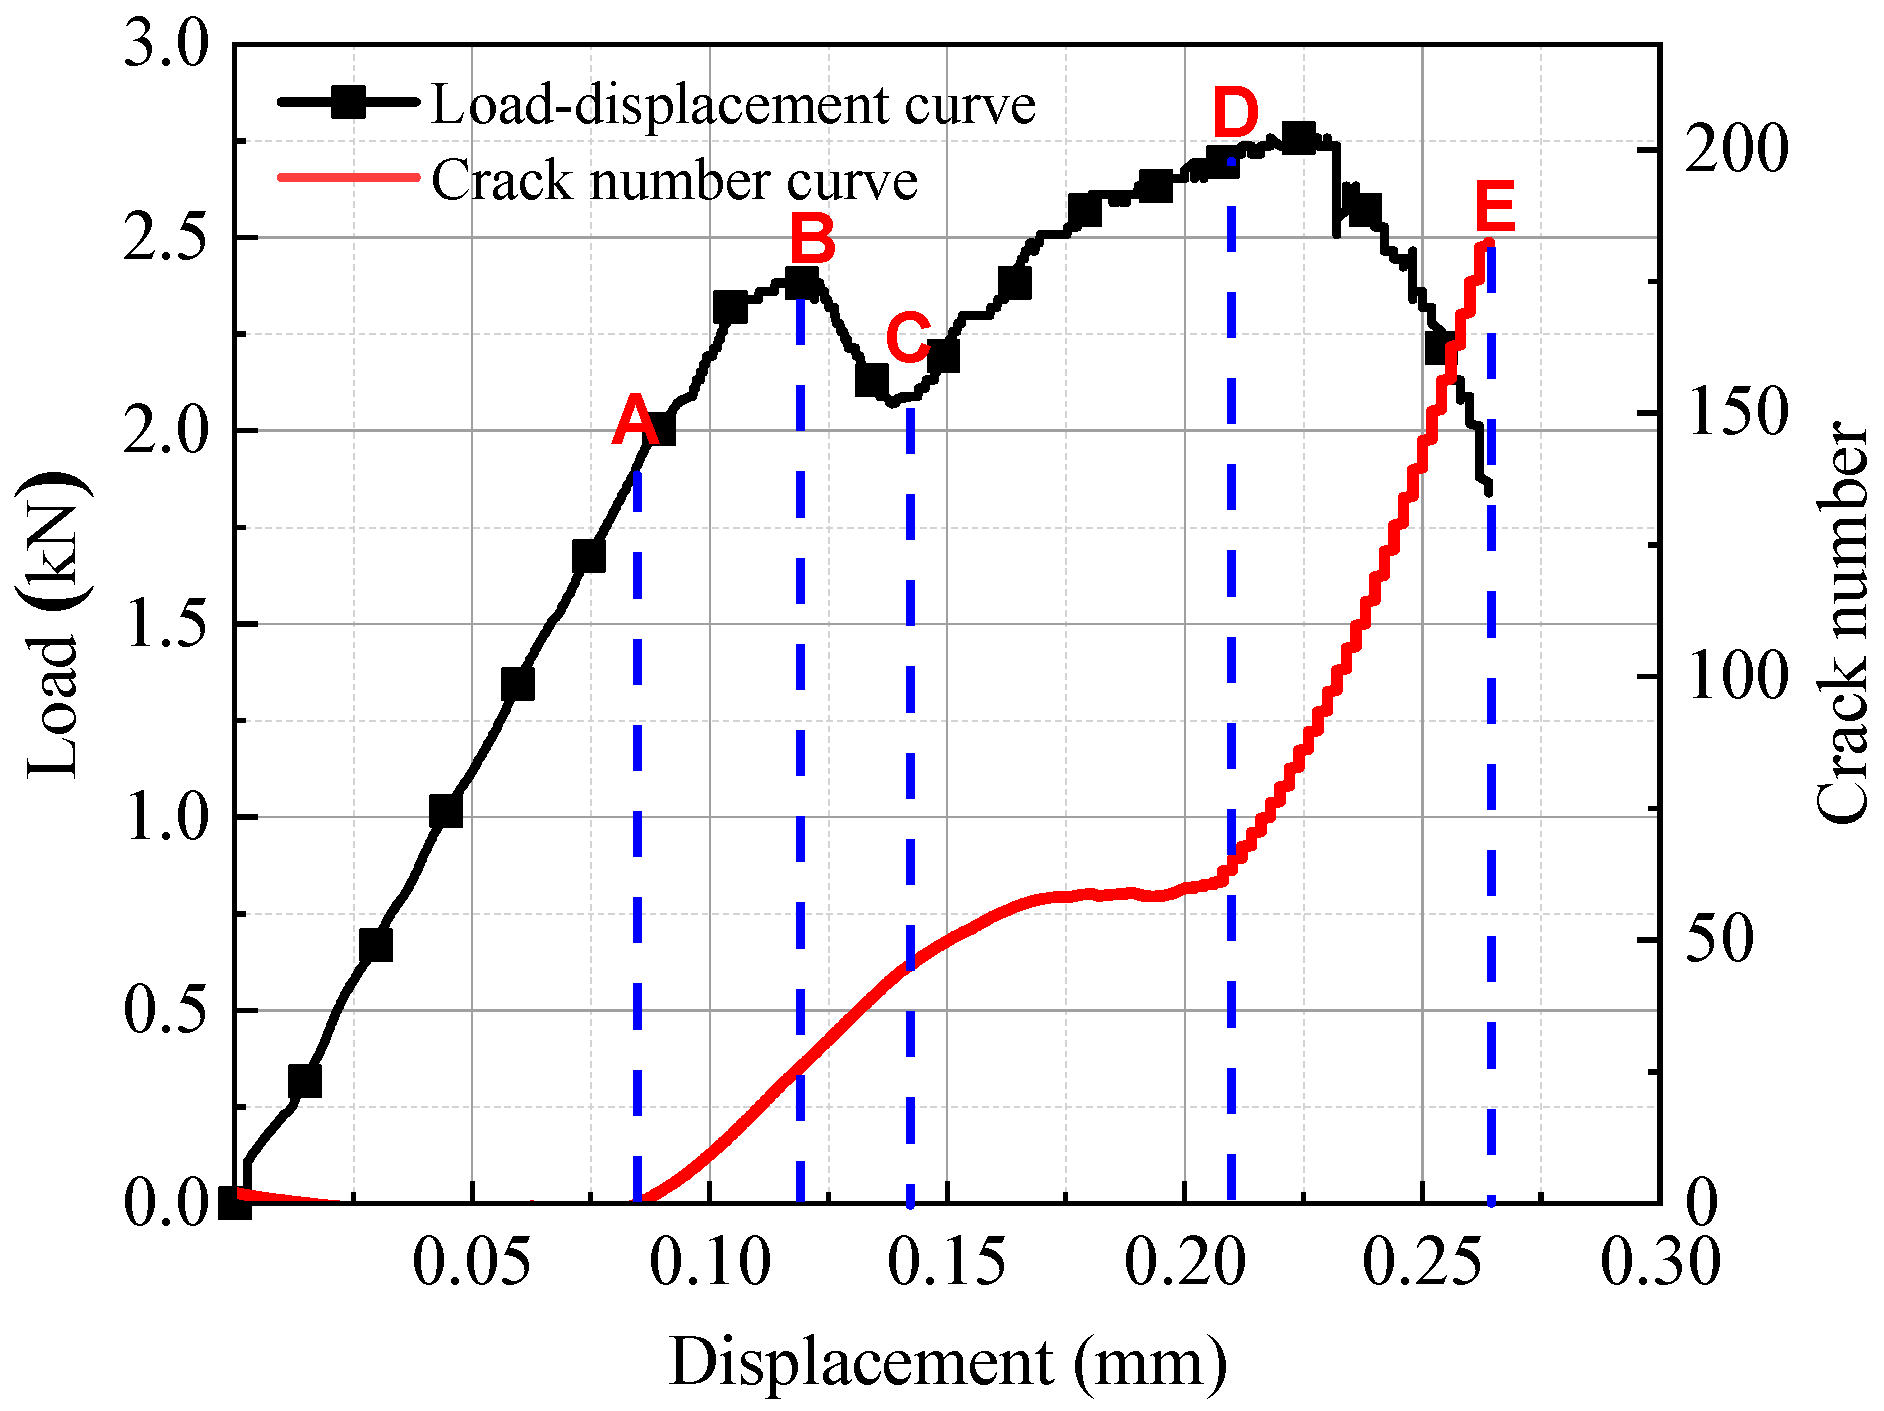
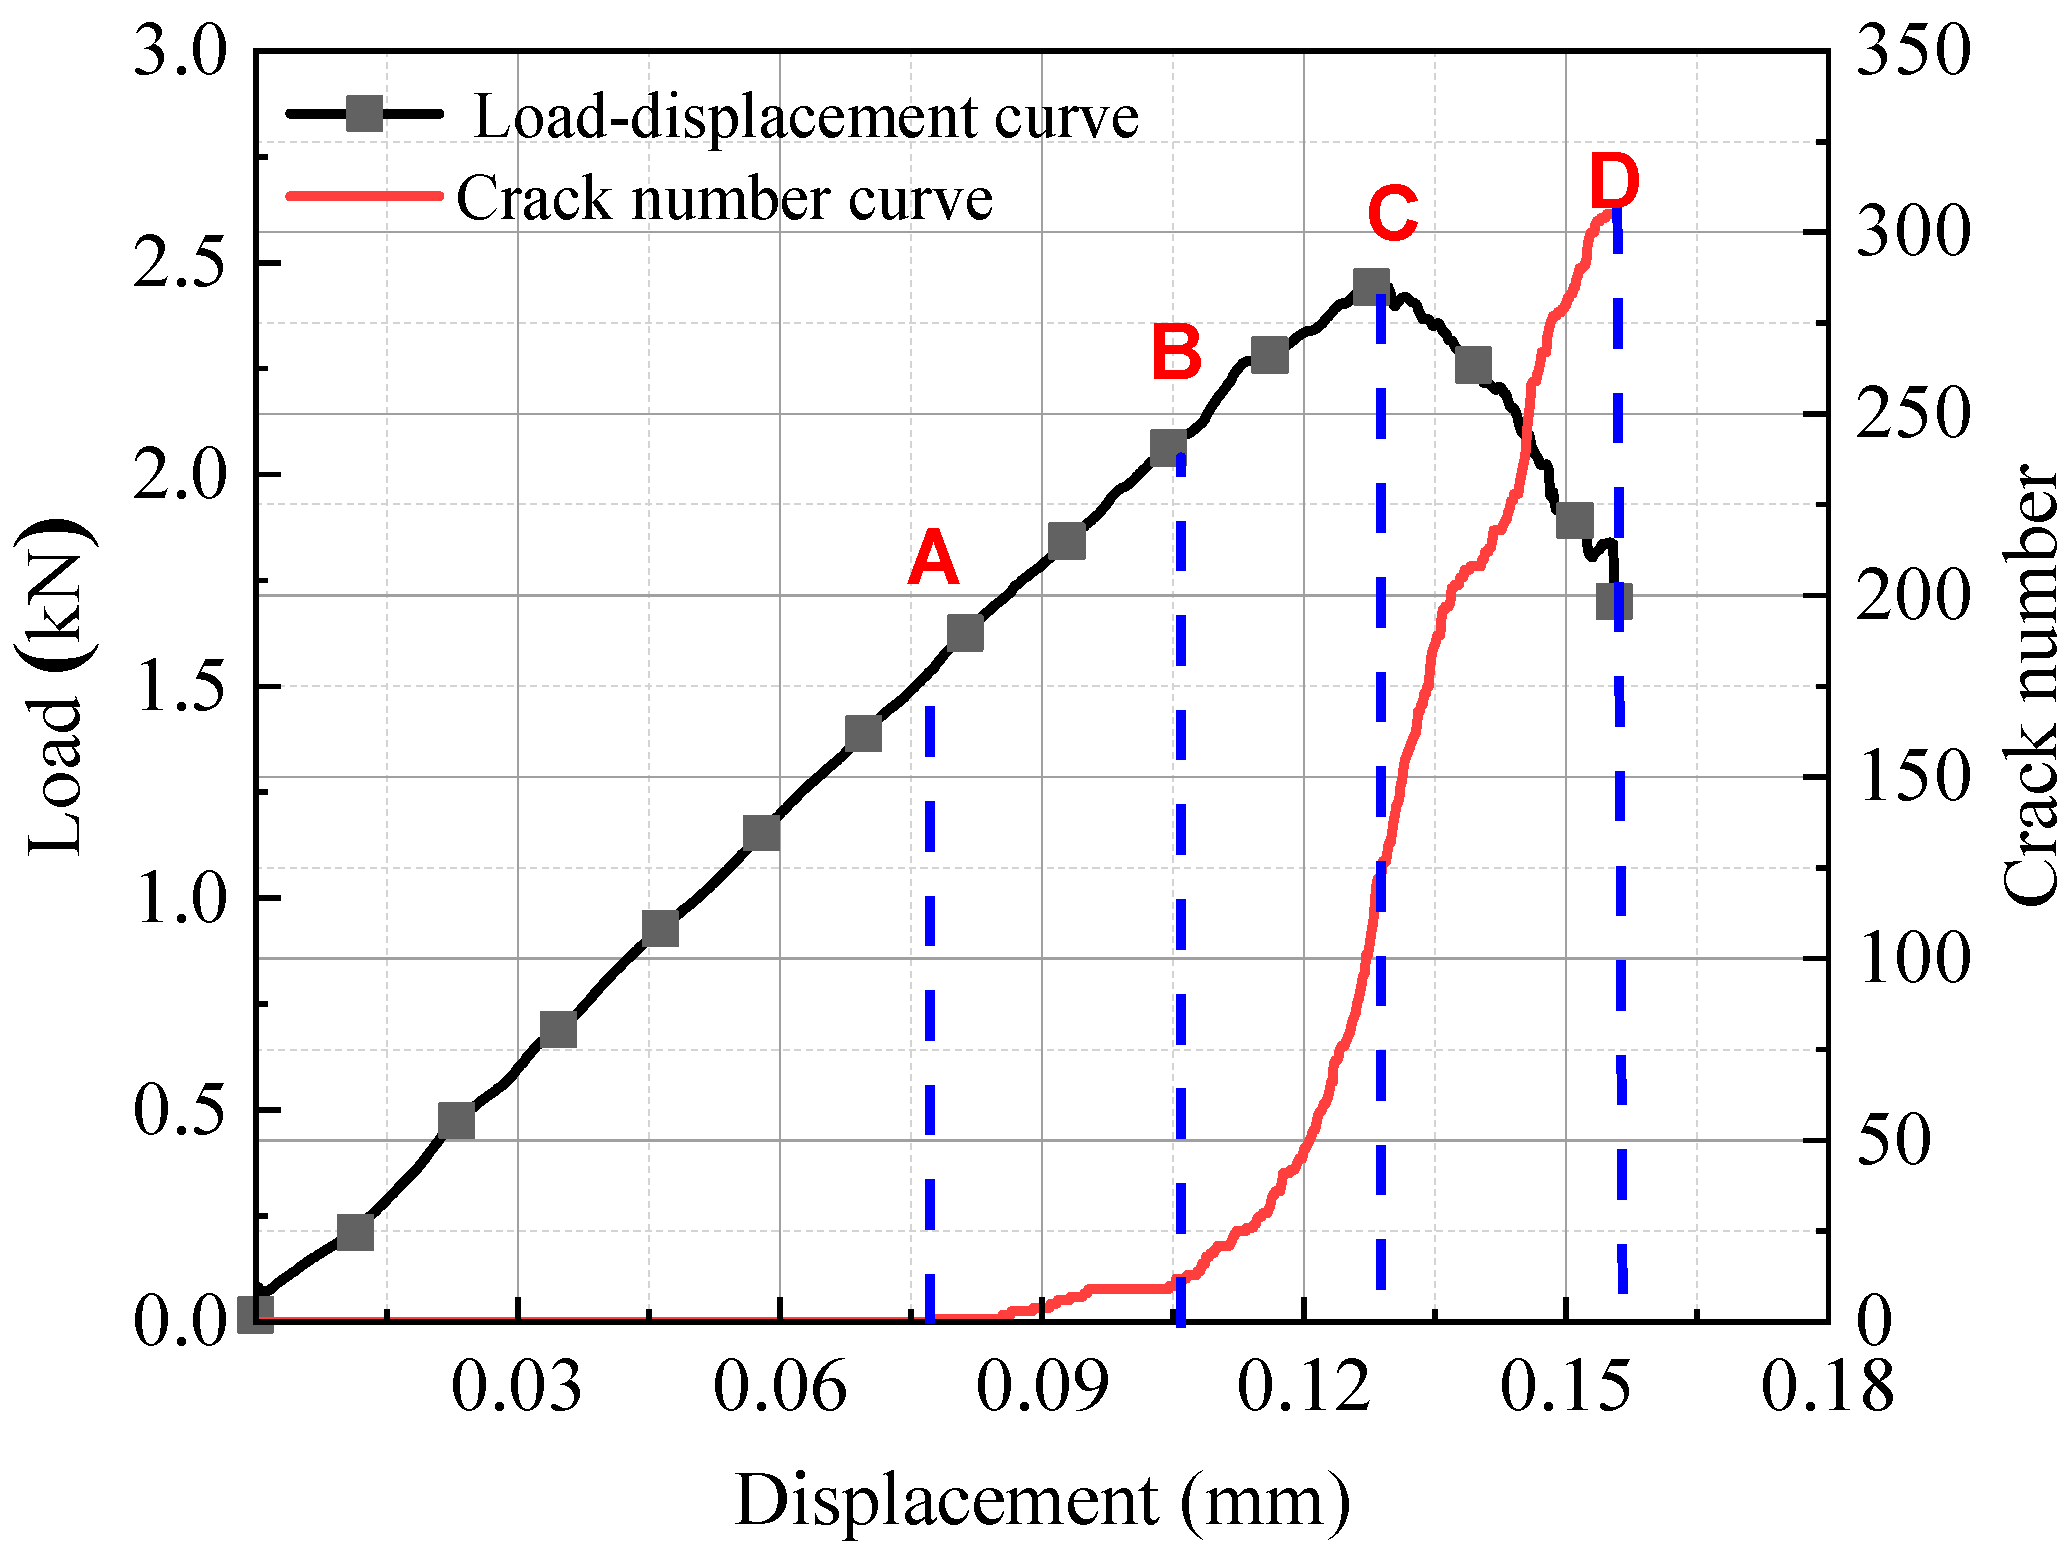
3.1. Load Deformation Curve

The load-displacement curves of the intact disc specimens and the fissured disc specimens are shown in Figure 6 (δ represents the displacement). Compared with the intact specimen, the peak strength and slope of the load-displacement curves of the fissured disc specimens have a larger decrease, and the fissures significantly weaken the stiffness and strength of the specimens.
Figure 6 shows that the load-displacement curves of single flawed specimens with different flaw angles are different. They can be divided into instantaneous destabilization type (Type I) and gradual destabilization type (Type II). For the instantaneous destabilization type, when the specimens are loaded to the peak, the curve drops instantaneously and causes brittle failure to the specimens soon. For the gradual destabilization type, the load-displacement curves fall early due to the initiation and development of cracks and rise again as the loading continues. The failure happens when the peak load is reached. The peak displacement of Type I curves is smaller than the peak displacement of Type II curves and smaller than the peak displacement of intact specimens. When the flaw angle is 30°~60°, the tensile stiffness of the disc specimens is weakened greatly by the flaw.

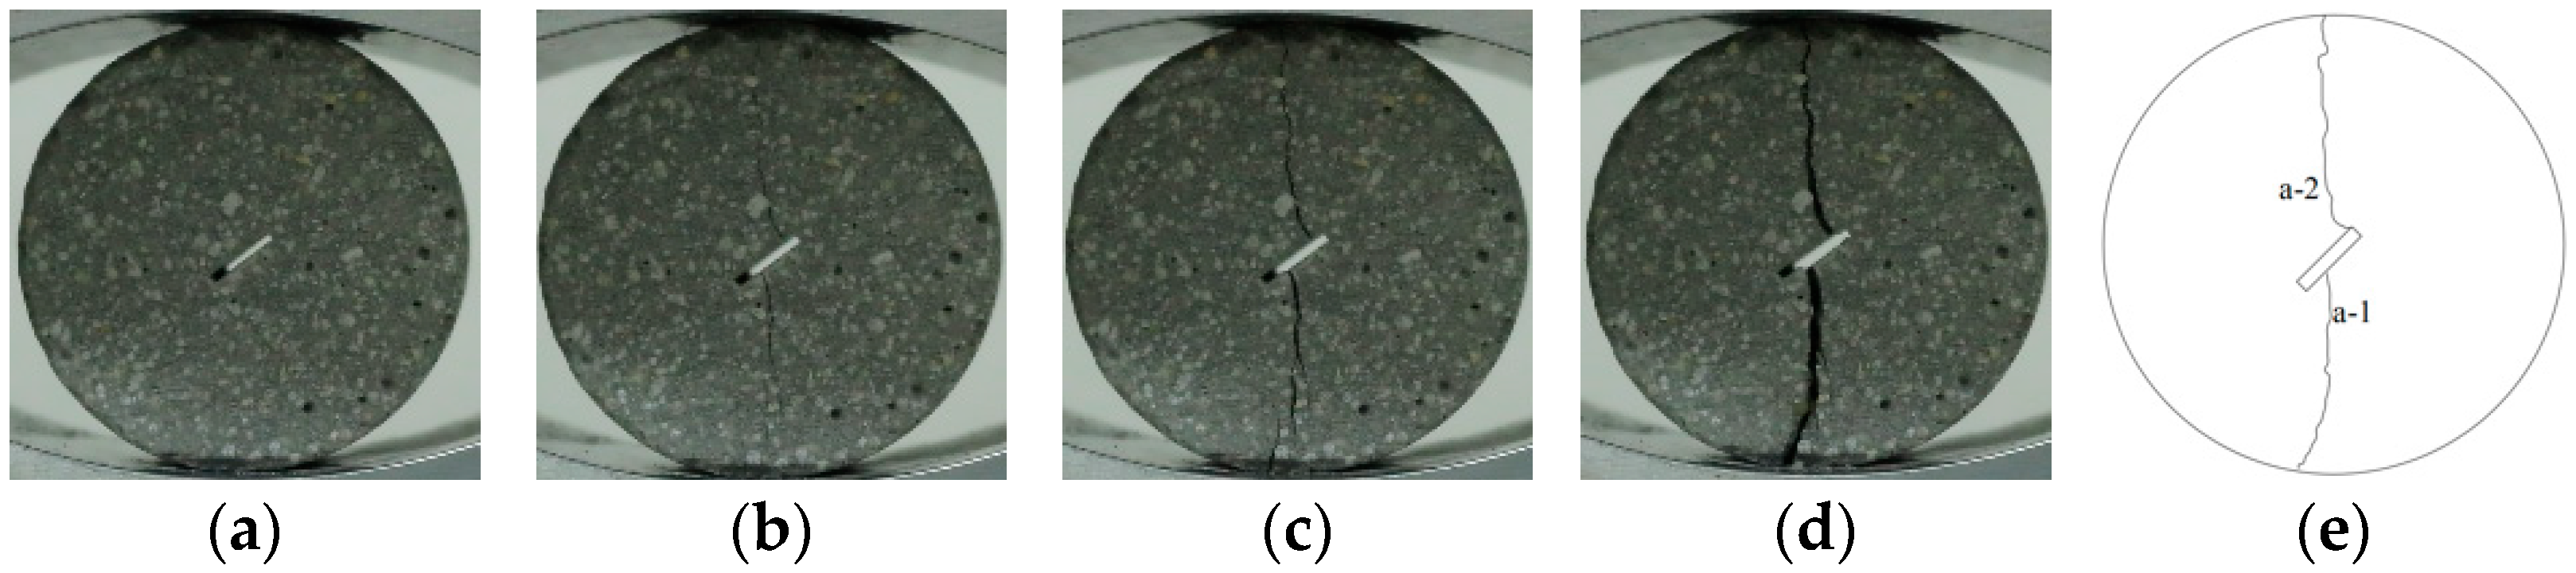
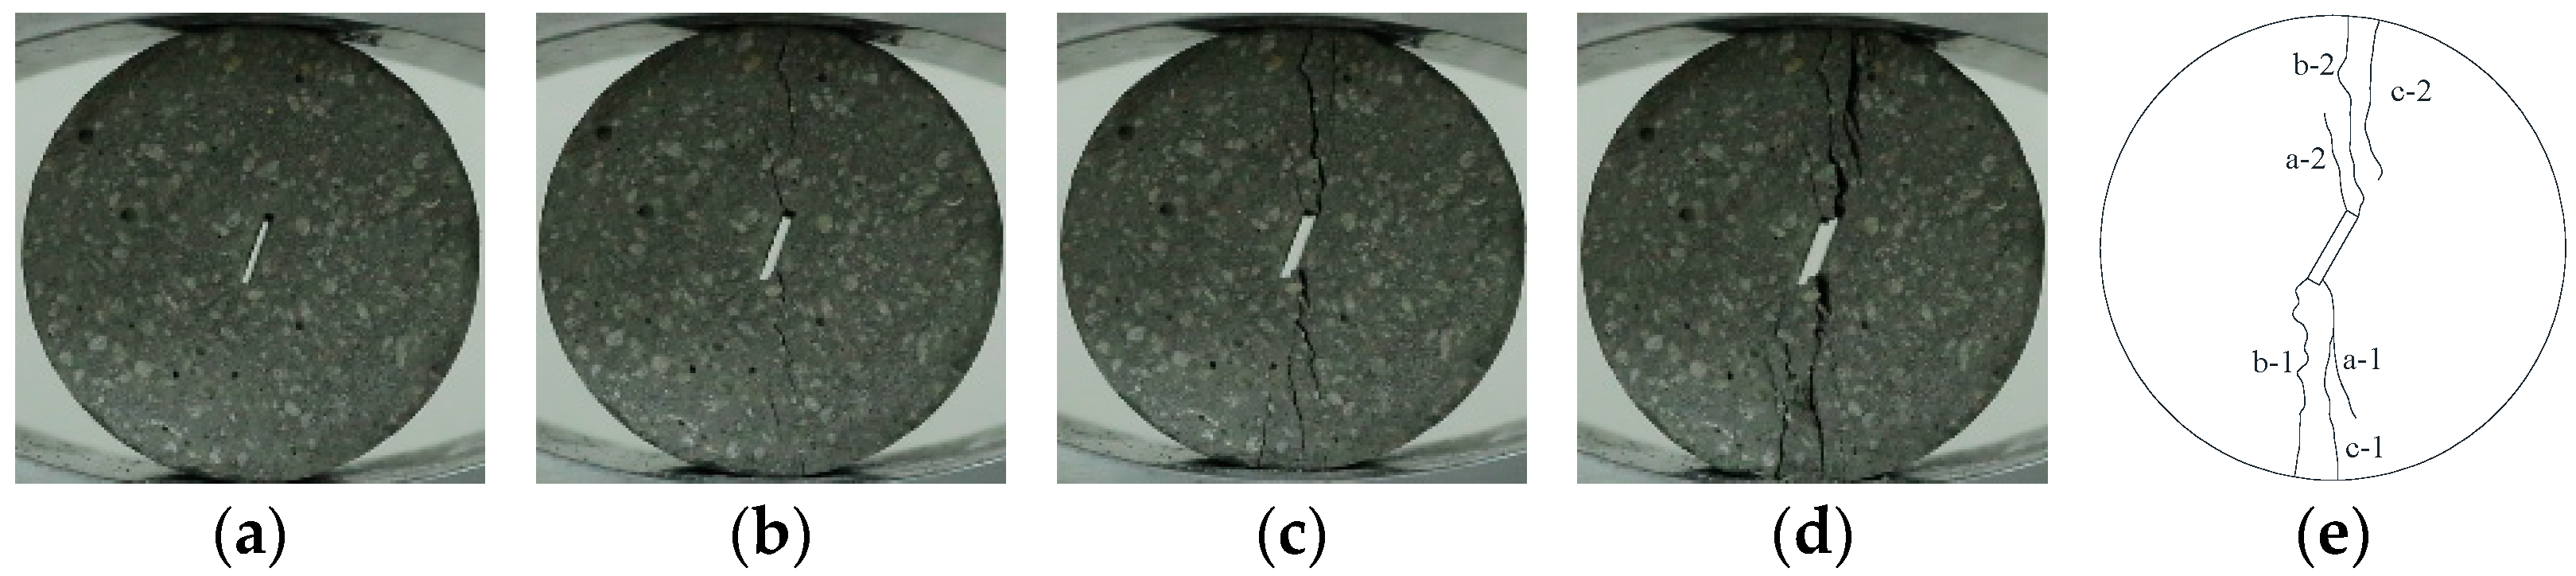
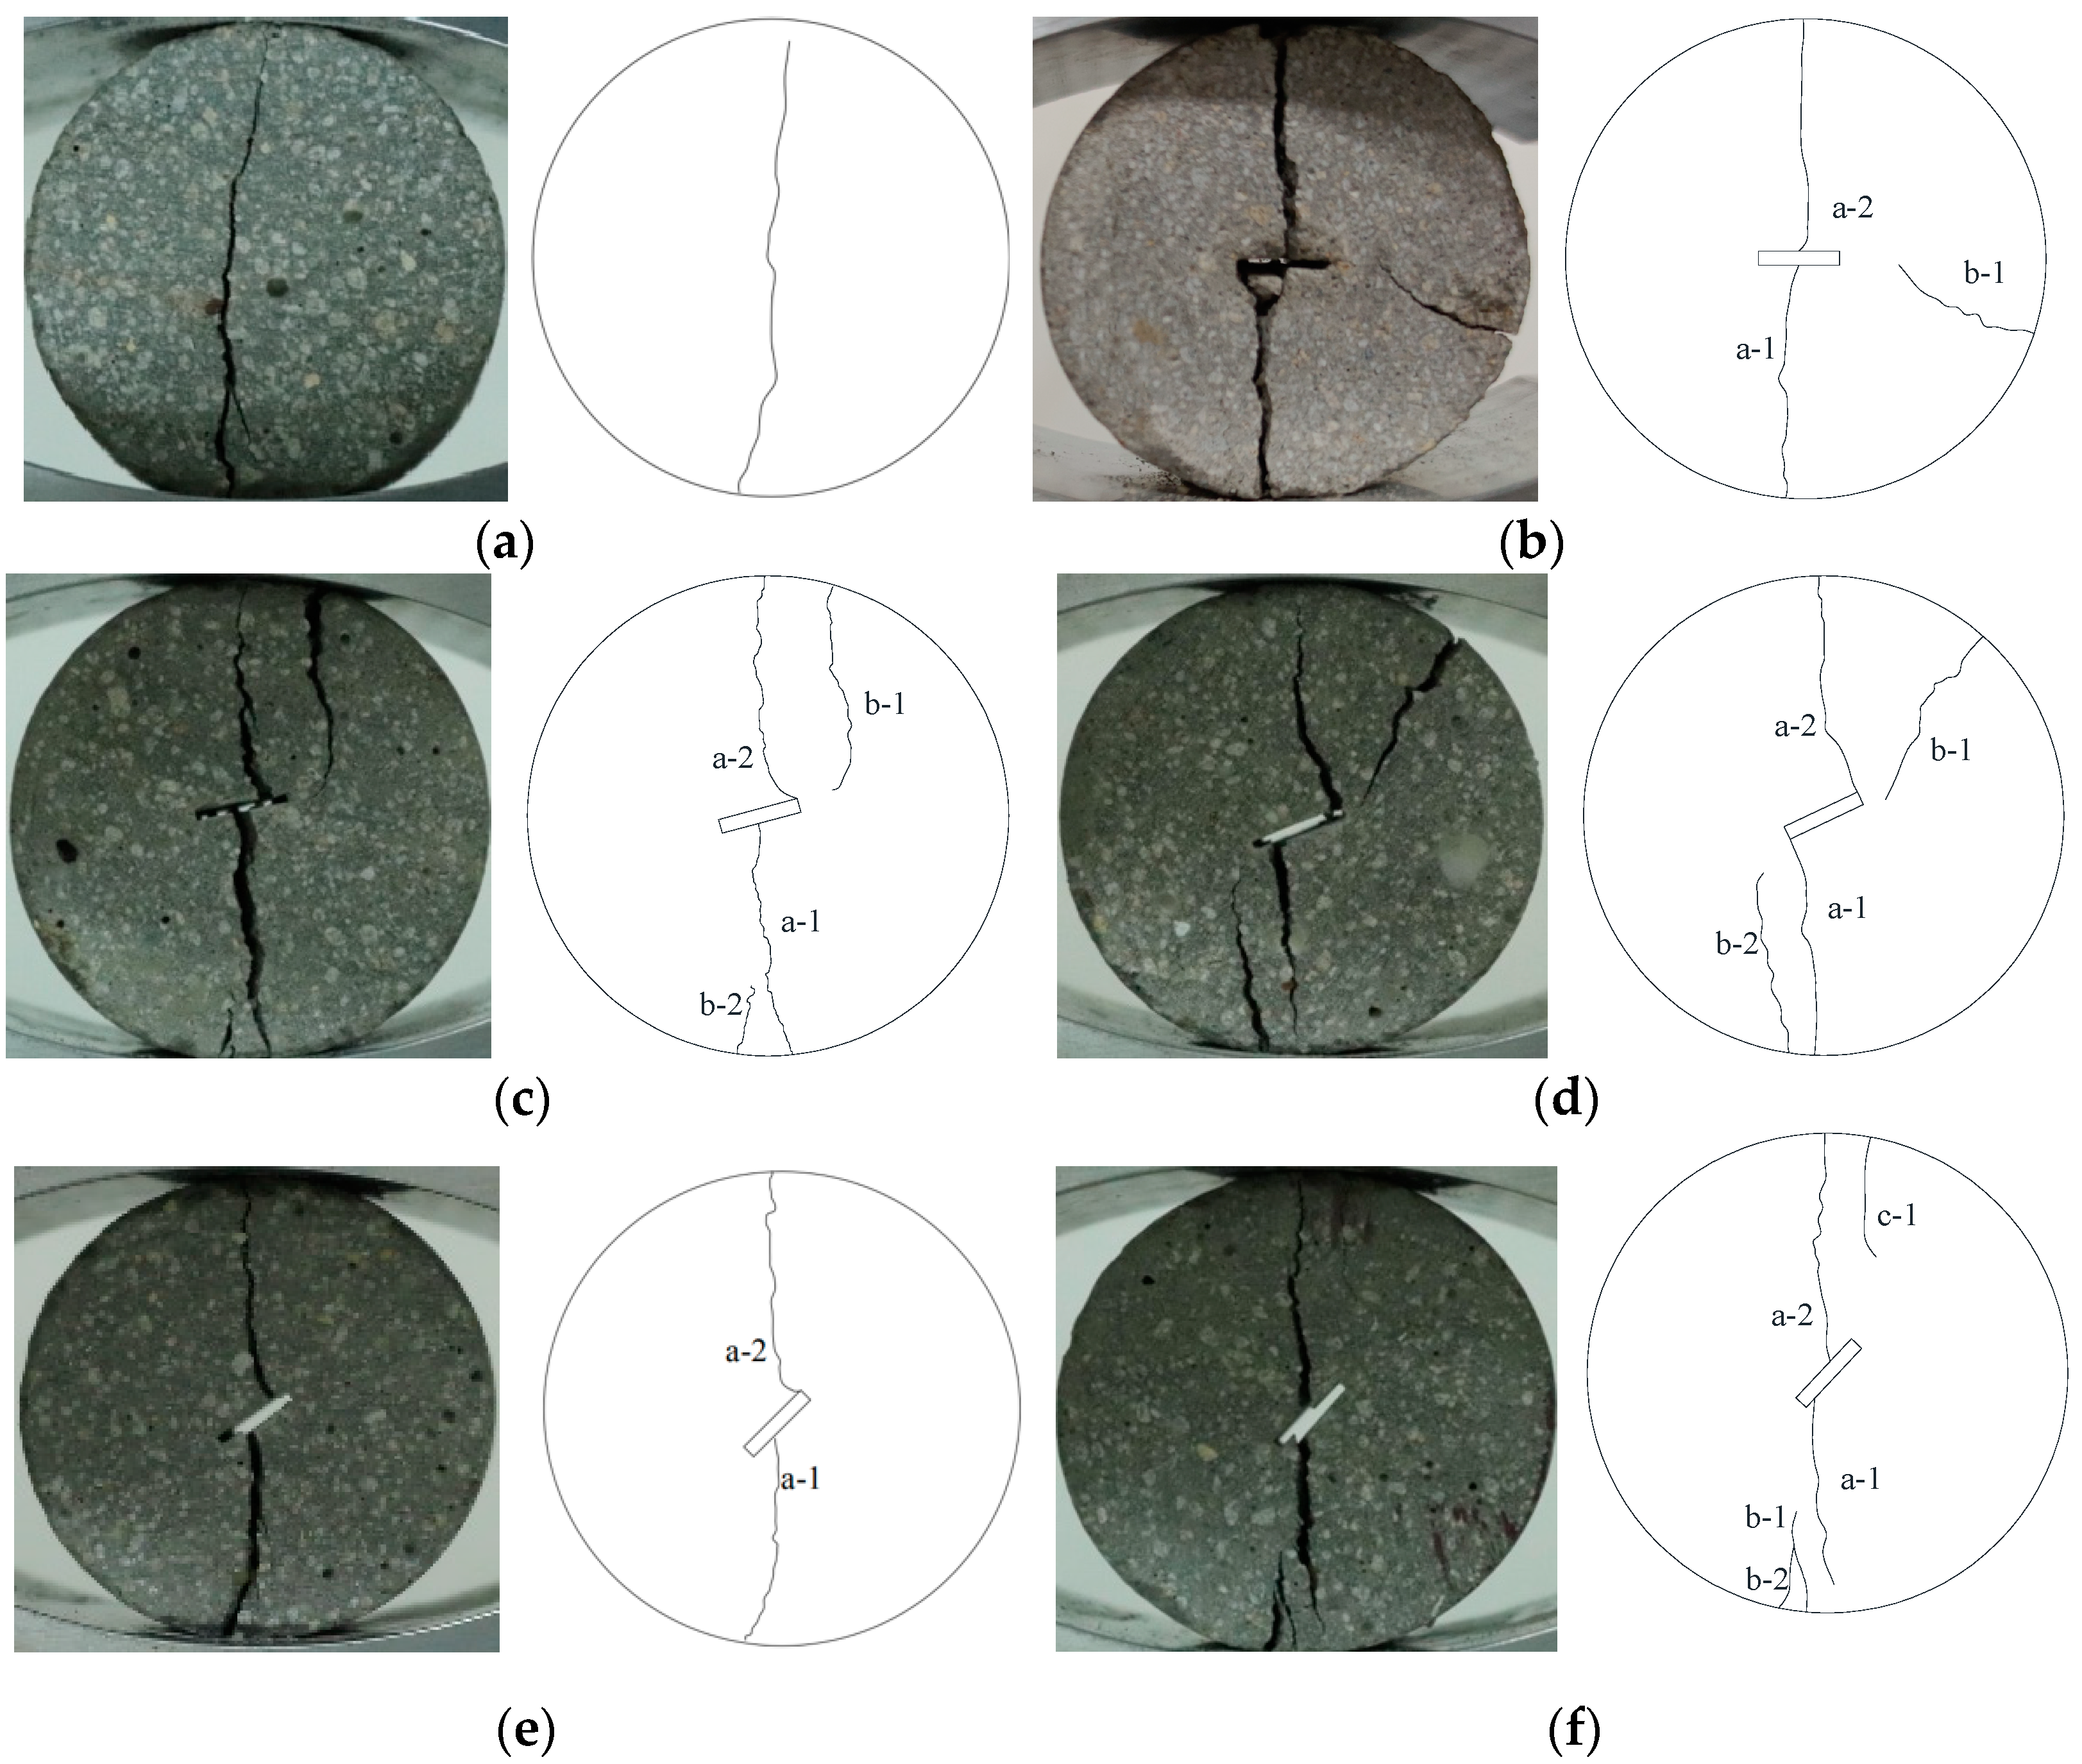
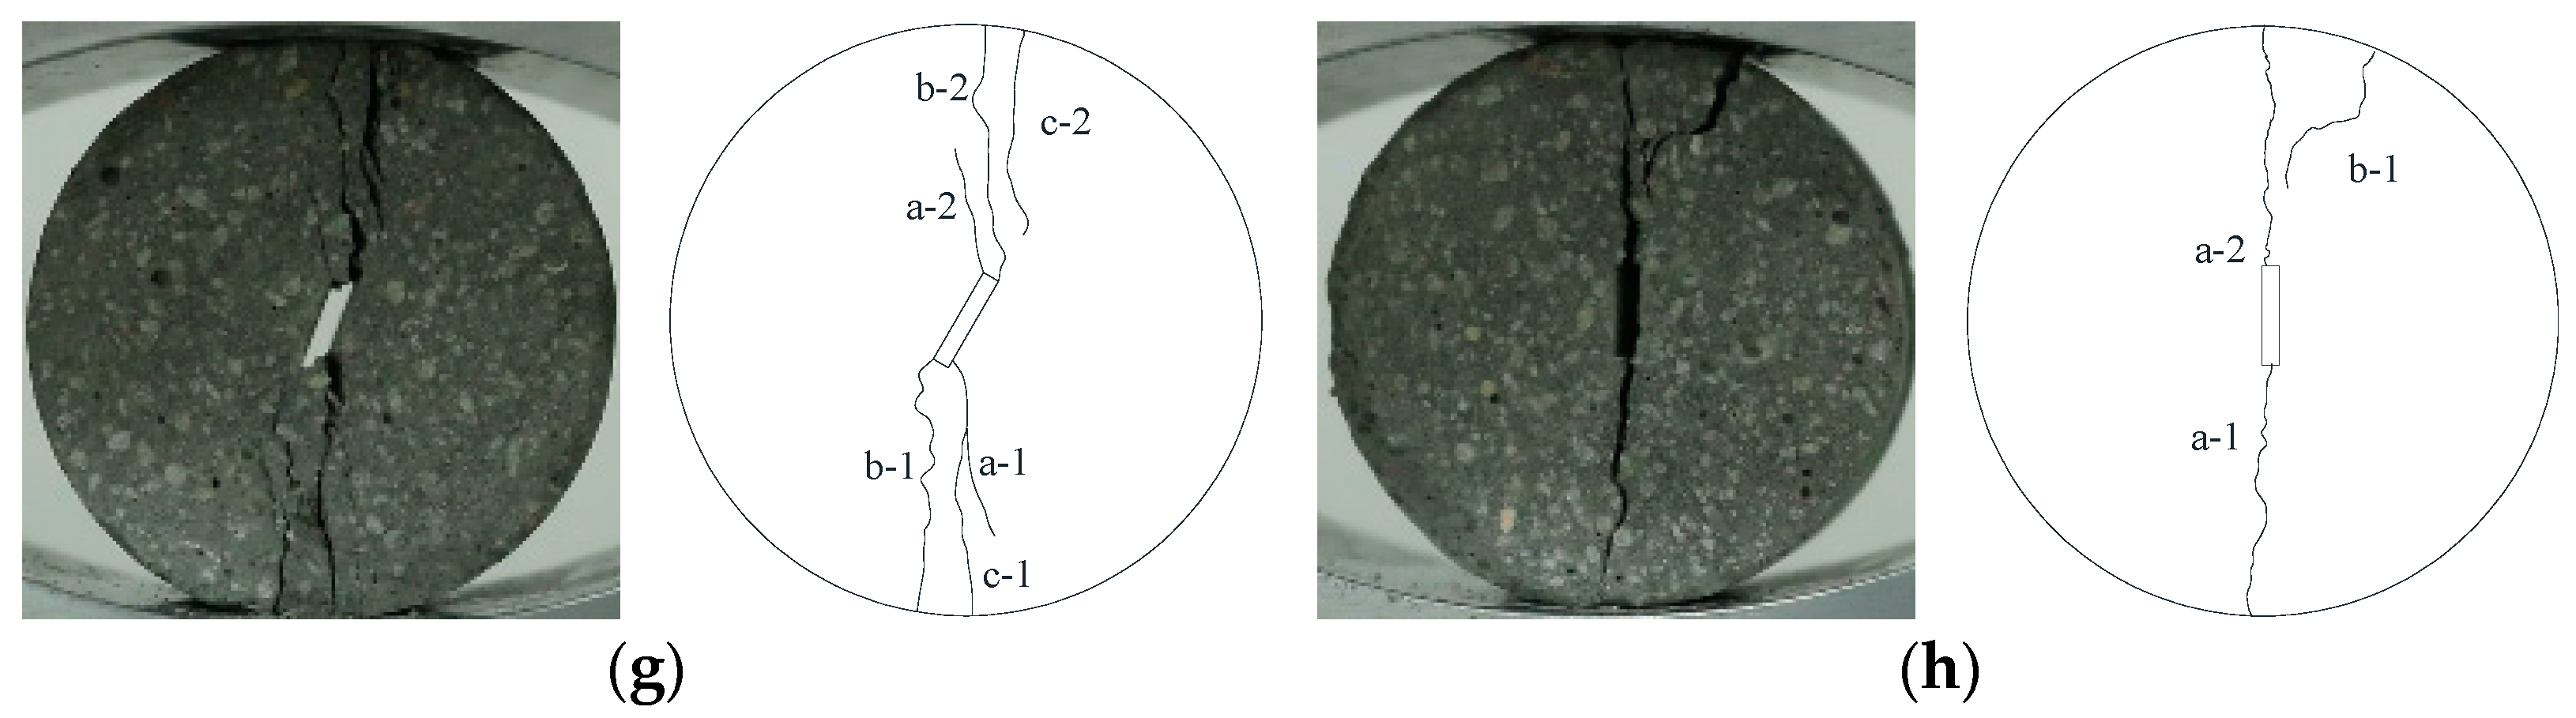
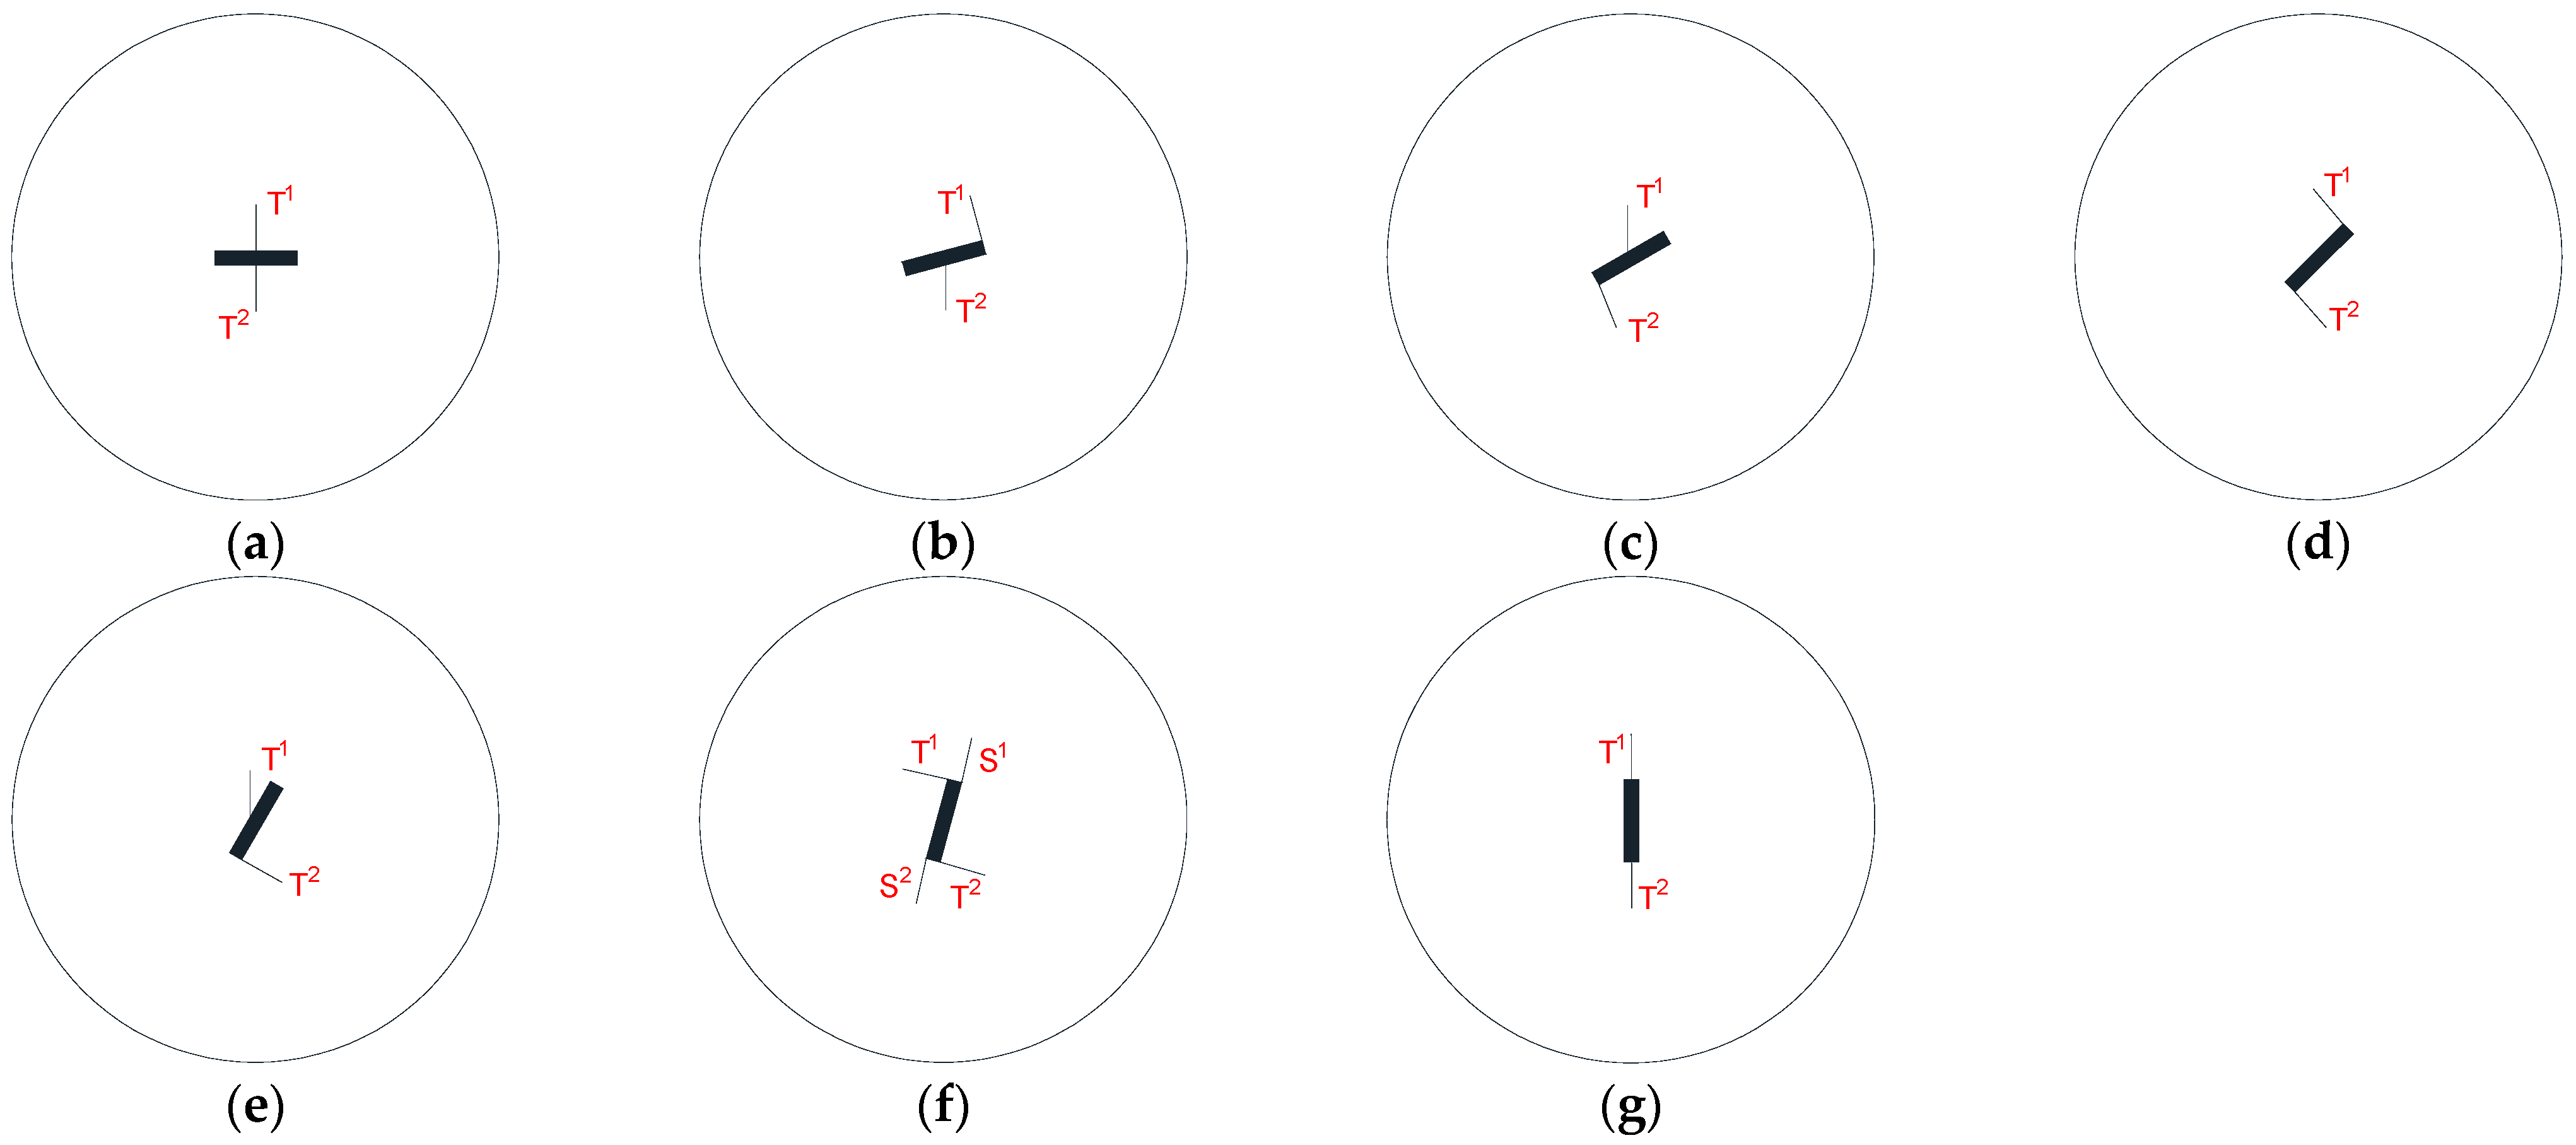
3.2. Crack Propagation and Failure Mode

Cracks generated by the vicinity of the pre-existing flaw are divided into two types: wing cracks and secondary cracks, where secondary cracks are divided into coplanar secondary cracks and anti-wing cracks. In this test, the damage process of the specimen was recorded by high-speed photographic equipment. For the Type I and Type II presented by the load-displacement curves, two typical single flawed disc specimens were selected to analyse the progressive damage process after loading.
When the flaw angle is 45°, the crack propagation of the single flawed disc specimen is shown in Figure 7. The crack propagation can be divided into four phases: microcrack initiation, crack growth, penetration, and failure. According to the load-displacement curve, when the specimen is loaded to the first peak (F = 2 kN), crack a−1 originated from the pre-flaw and grew downward. The other wing crack a−2 germinated from the upper of the pre-flaw and developed upward. As the load continues, cracks a−1 and a−2 expand rapidly. Finally, when the load reaches the second peak (F = 2.42 kN), cracks a−1 and a−2 coalesce, and the macro fracture appears. There is no far-field crack during the whole loading process.
According to the load-displacement curve for the disc specimen with a 75° flaw dip angle, as shown in Figure 8, when the load reached the initial cracking load (F = 1.5 kN), the wing cracks a−1, and a−2 originated from the tip of the pre-flaw. The initiation and growth of secondary cracks b−1 and b−2 occurred after the formation of the wing crack and were accompanied by a large number of microcracks. When the load reached the peak value (F = 2.2 kN), the secondary cracks b−1 and b−2 extended to the vicinity of the flaw tip. The far-field cracks c−1 and c−2 also initiated from the boundary and penetrated the main cracks, and the brittle failure occurred in the specimen.
Figure 9 shows typical failure modes of intact and single flawed Brazilian disc specimens. The cracks of the specimens are classified according to the fracture mode, mainly composed of tensile cracks and tension-shear mixed cracks, as shown in Table 3.
Since there are many far-field cracks in the specimens, and the far-field cracks are not the main factor of the specimen failure, only the cracks originating and developing at the pre-flaw are counted here. The single flawed Brazilian disc failure modes are classified according to the type and location of cracks, as shown in Figure 10 (T represents tensile cracks, and S represents shear cracks).
The dip angle of the flaw affects the failure mode of the disc specimens. According to Figure 10, the failure modes of the Brazilian disc specimens with a single flaw can be divided into three types: (1) Wing cracks penetration mode (α = 15°, 30°, 45°, 60° and 90°), the failure mode showed two forms. The first form was that two wing cracks with tensile characteristics appeared from the tip of the pre-flaw (α = 45° and 90°), and wing cracks eventually penetrated the whole specimen. The second form consists of a wing crack that originates from the tip of the flaw and a tensile crack with the direction of expansion opposite to the direction of the wing crack originating from the middle of the flaw (α = 15°, 30° and 60°). This form is similar to the previous one, but the cracks originate in the middle of the flaw due to internal defects. (2) Tensile-shear penetration mode (α = 75°), consisting of two tensile and shear cracks. Therefore, the failure of the specimen was caused by the propagation and penetration of the shear cracks and the tensile wing cracks. (3) Radial penetration failure mode (α = 0°), this failure mode is similar to the intact disc specimen, which generated penetrating tensile cracks in the middle of the specimen. However, in the radial penetration failure mode, the cracks originated from the pre-flaw. In contrast, for the intact disc specimen, the cracks were randomly generated in the middle of the specimen.

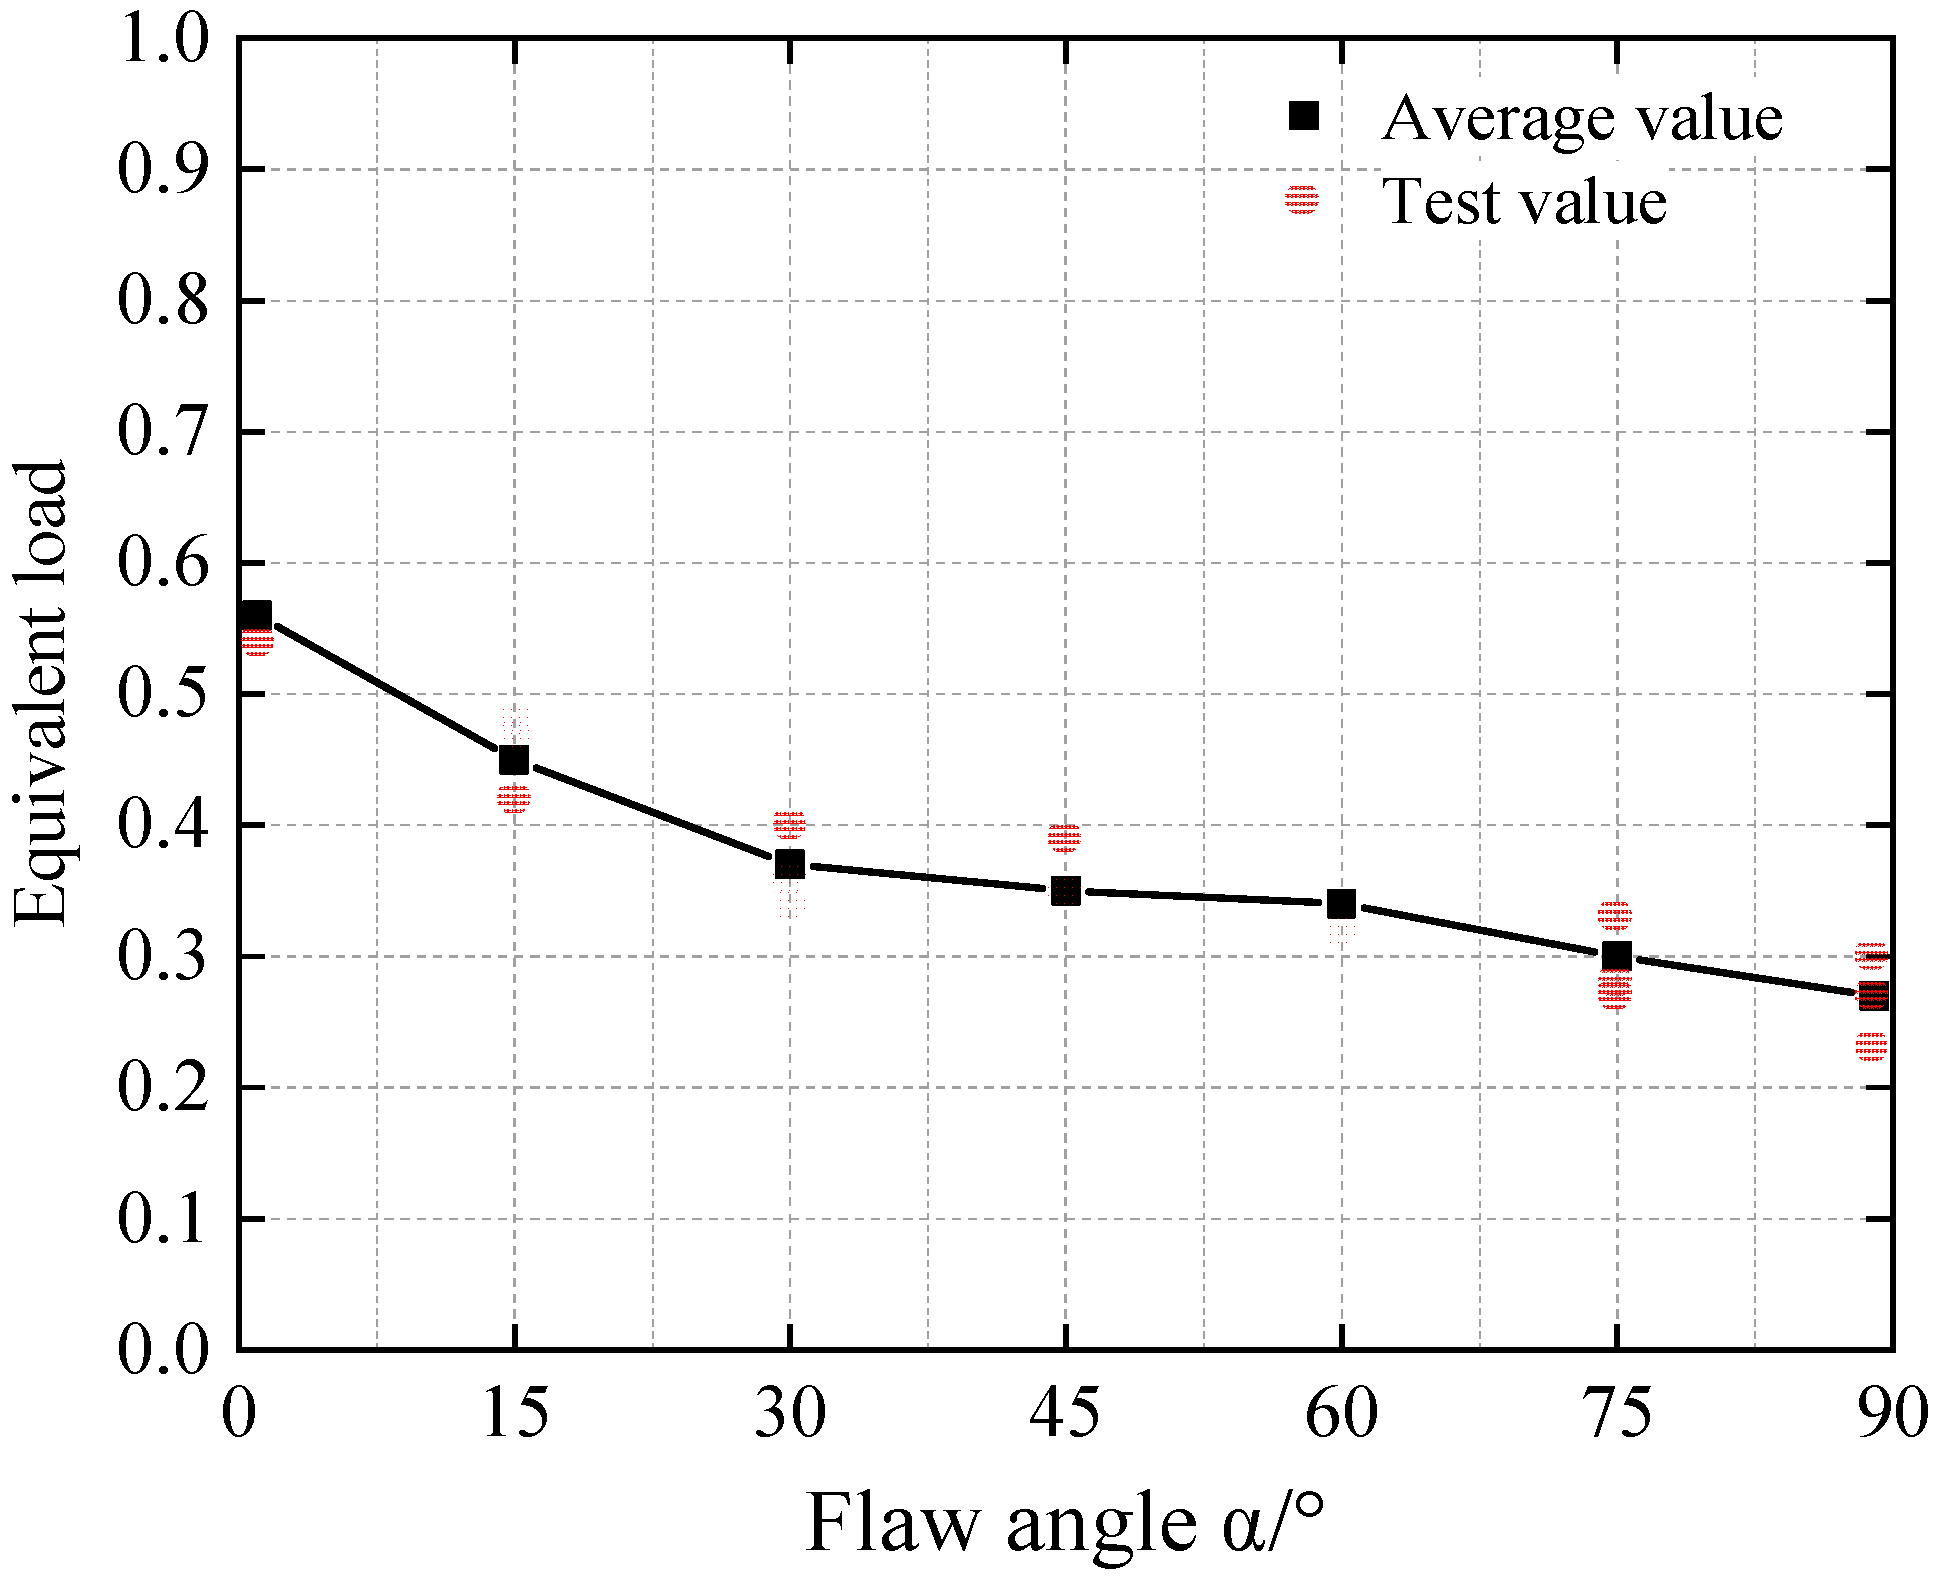
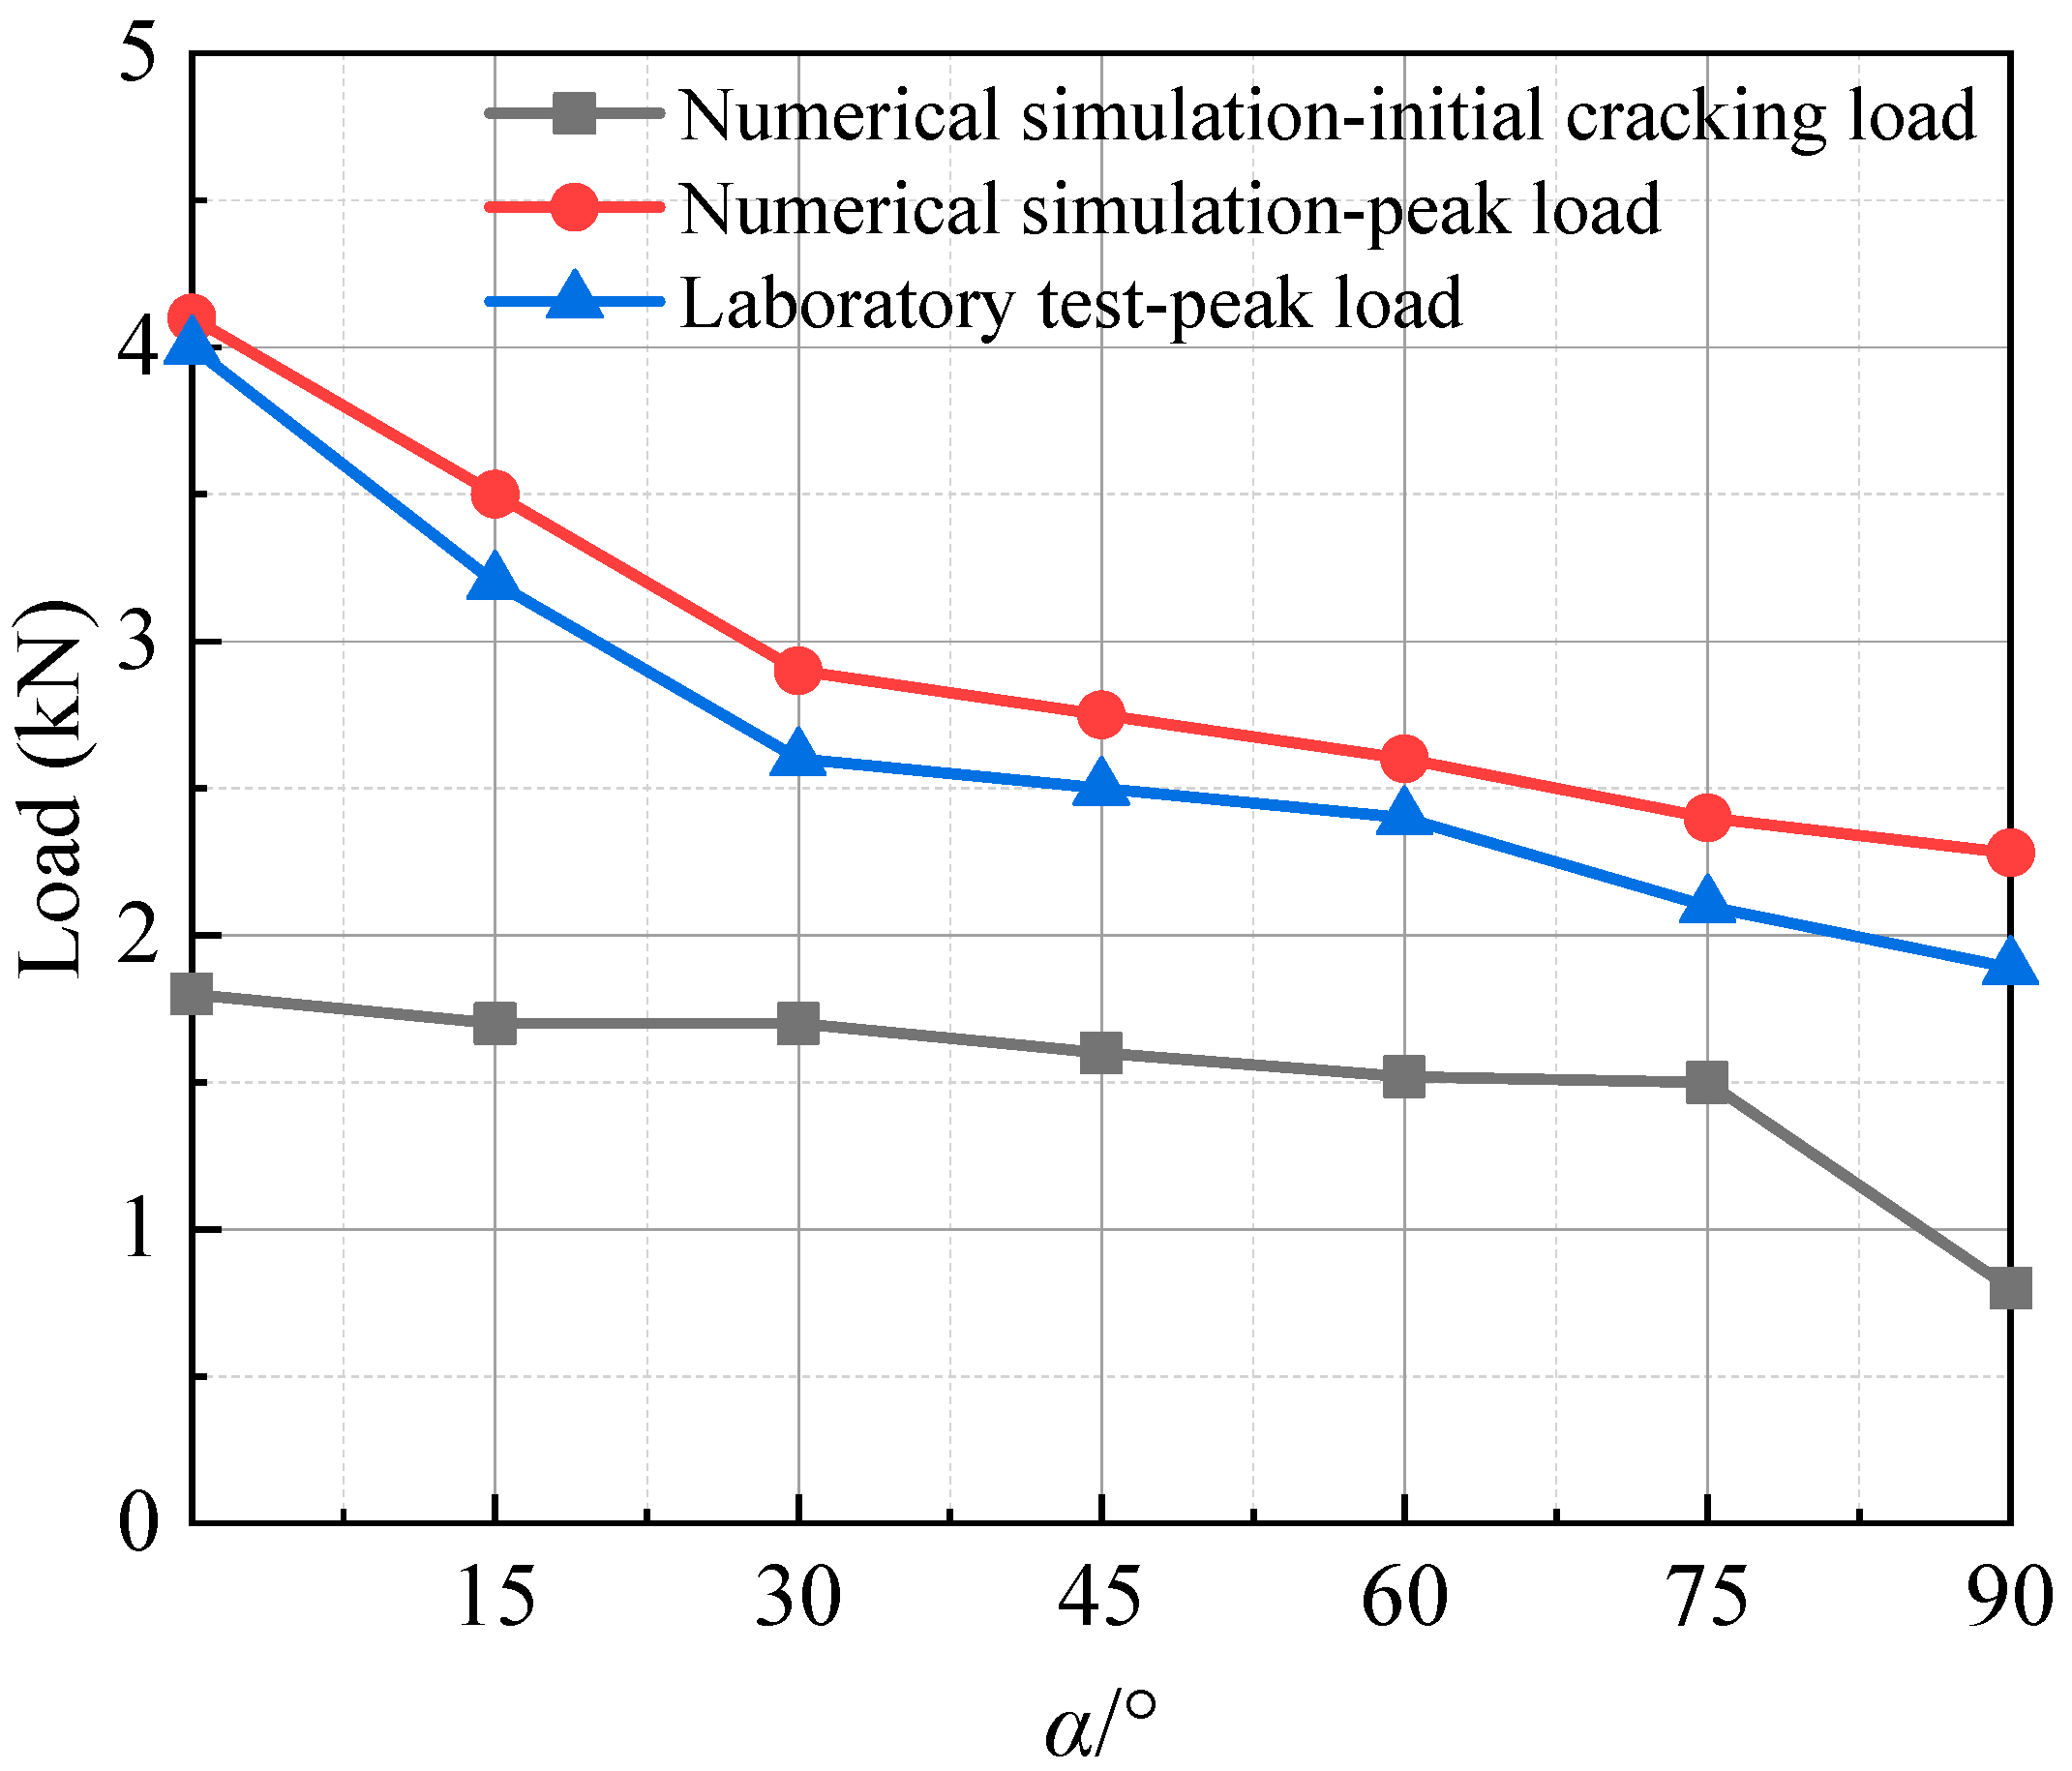
3.3. Analysis of Peak Load Characteristics

To investigate the influence of the flaw angle, the equivalent load coefficient method is used to measure the strength of the disc specimen. Here, the equivalent load is defined in Equation (1) as below:
β = F α / F N
where β denotes the equivalent load, F α is the peak load of a disc specimen with different flaw angles, F N is the peak load of intact disc specimen, in this test takes F N = 7.1   kN . Figure 11 shows the relationship curve between equivalent load and flaw dip angle. It can be found that the equivalent load is much less than 1, which shows that the flaw has an obvious weakening effect on the strength of the disc specimens. The strength of the disc specimen is closely related to the flaw angle, and the strength of the specimen tends to decrease with increasing flaw angle.

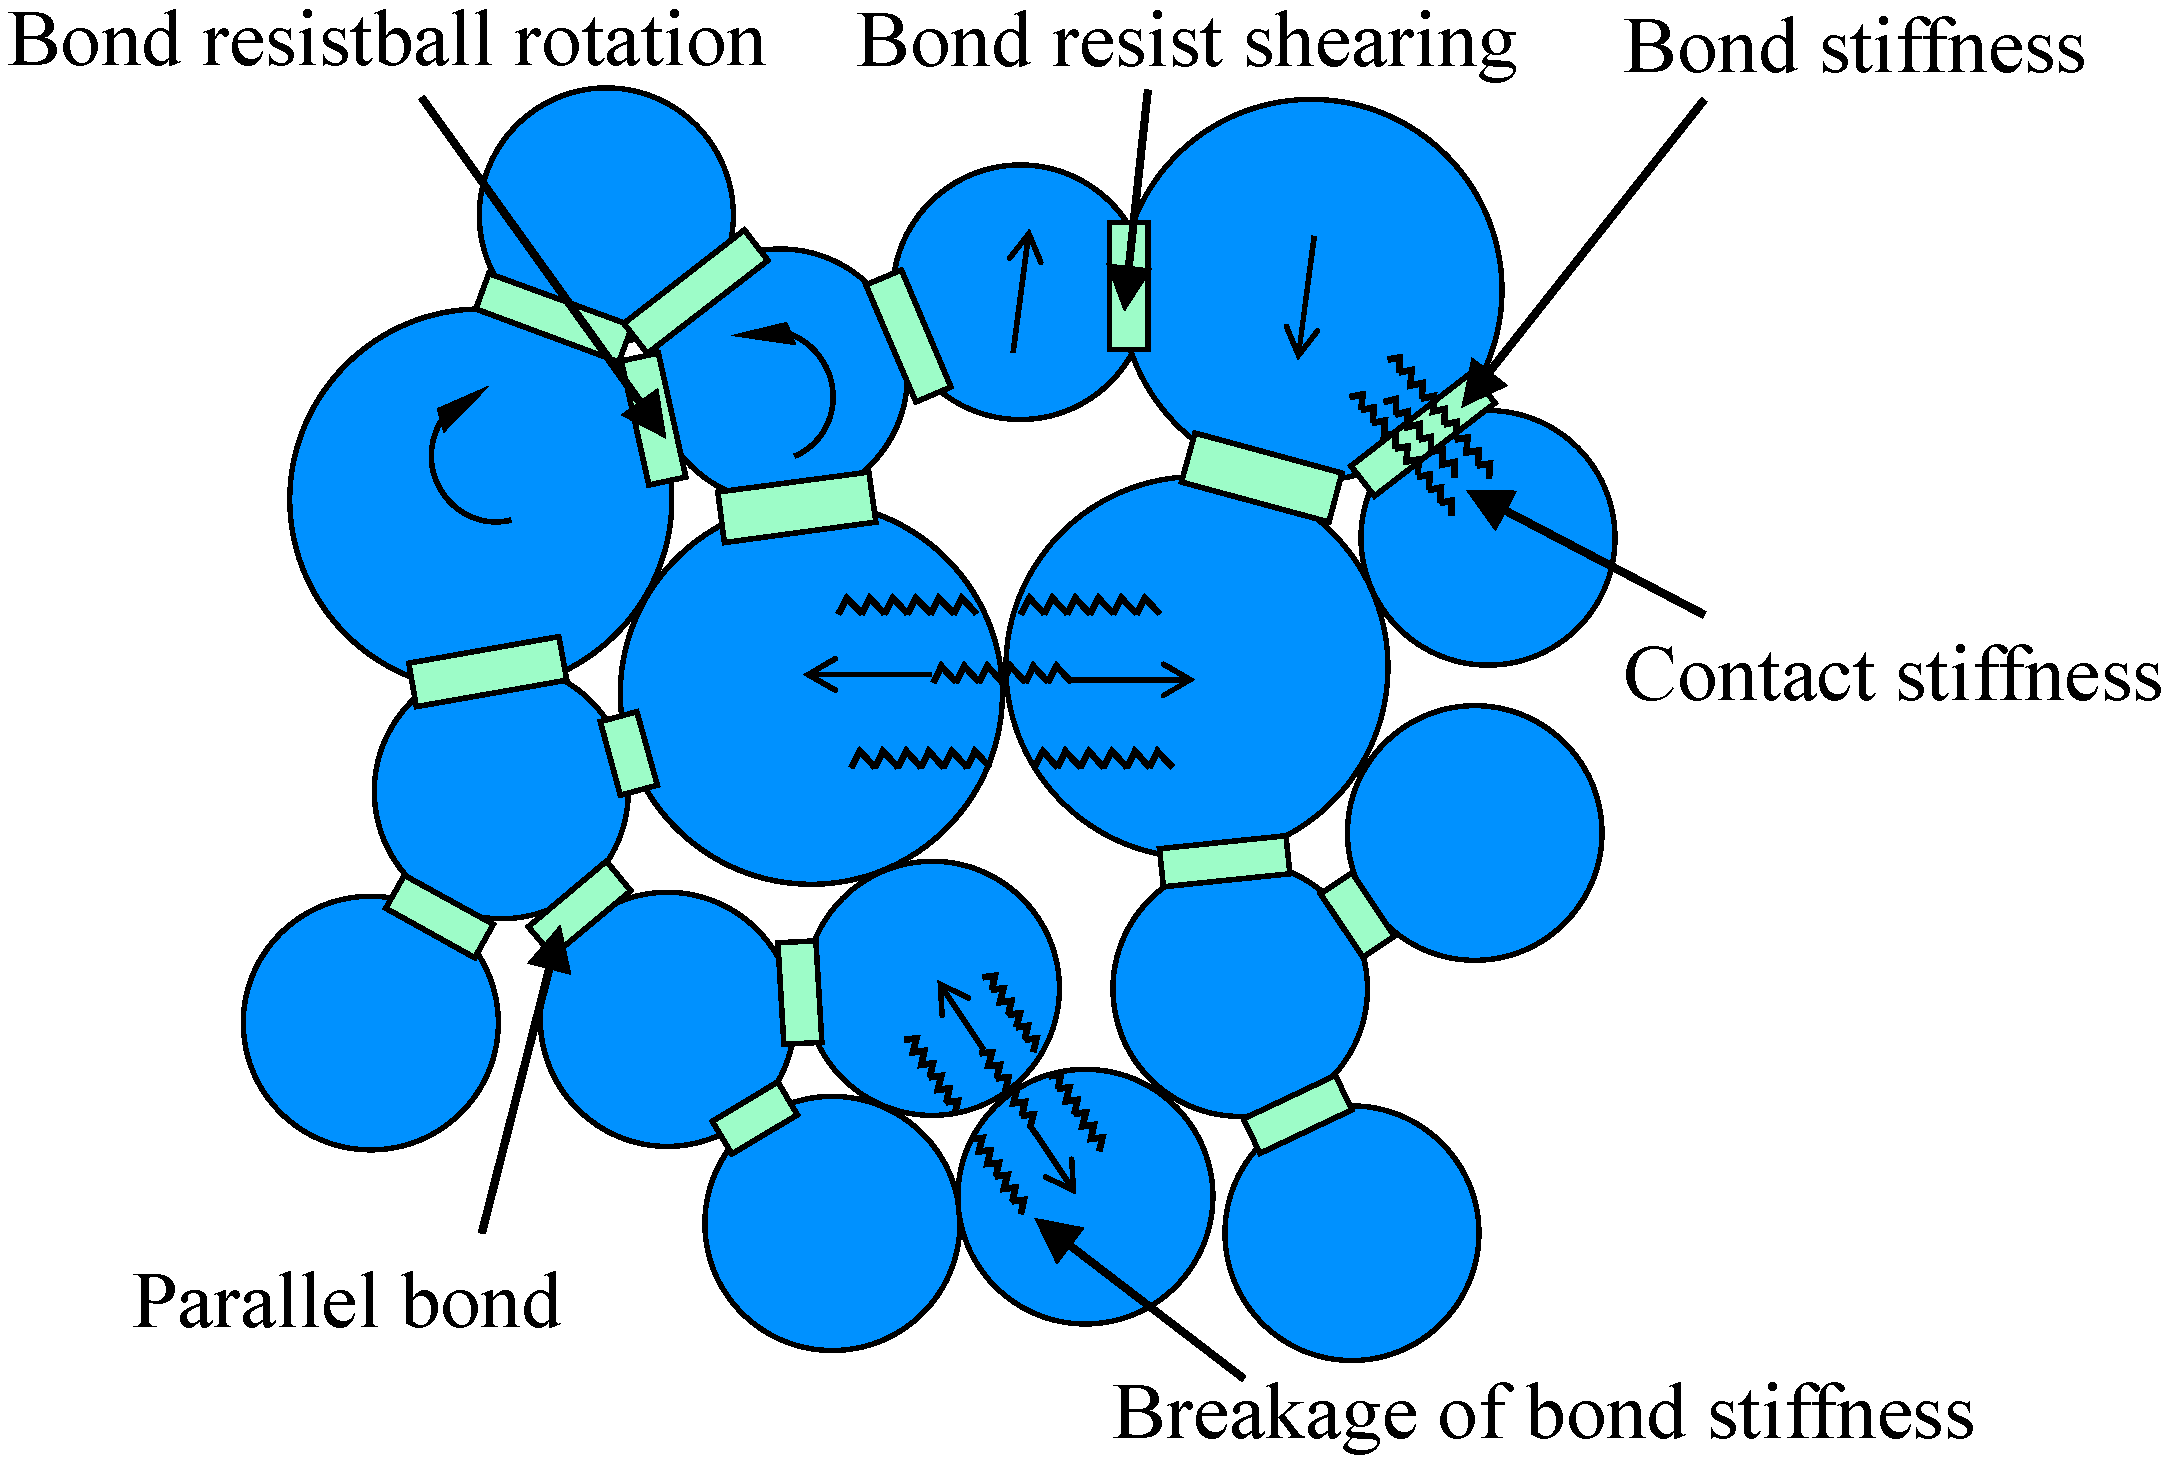
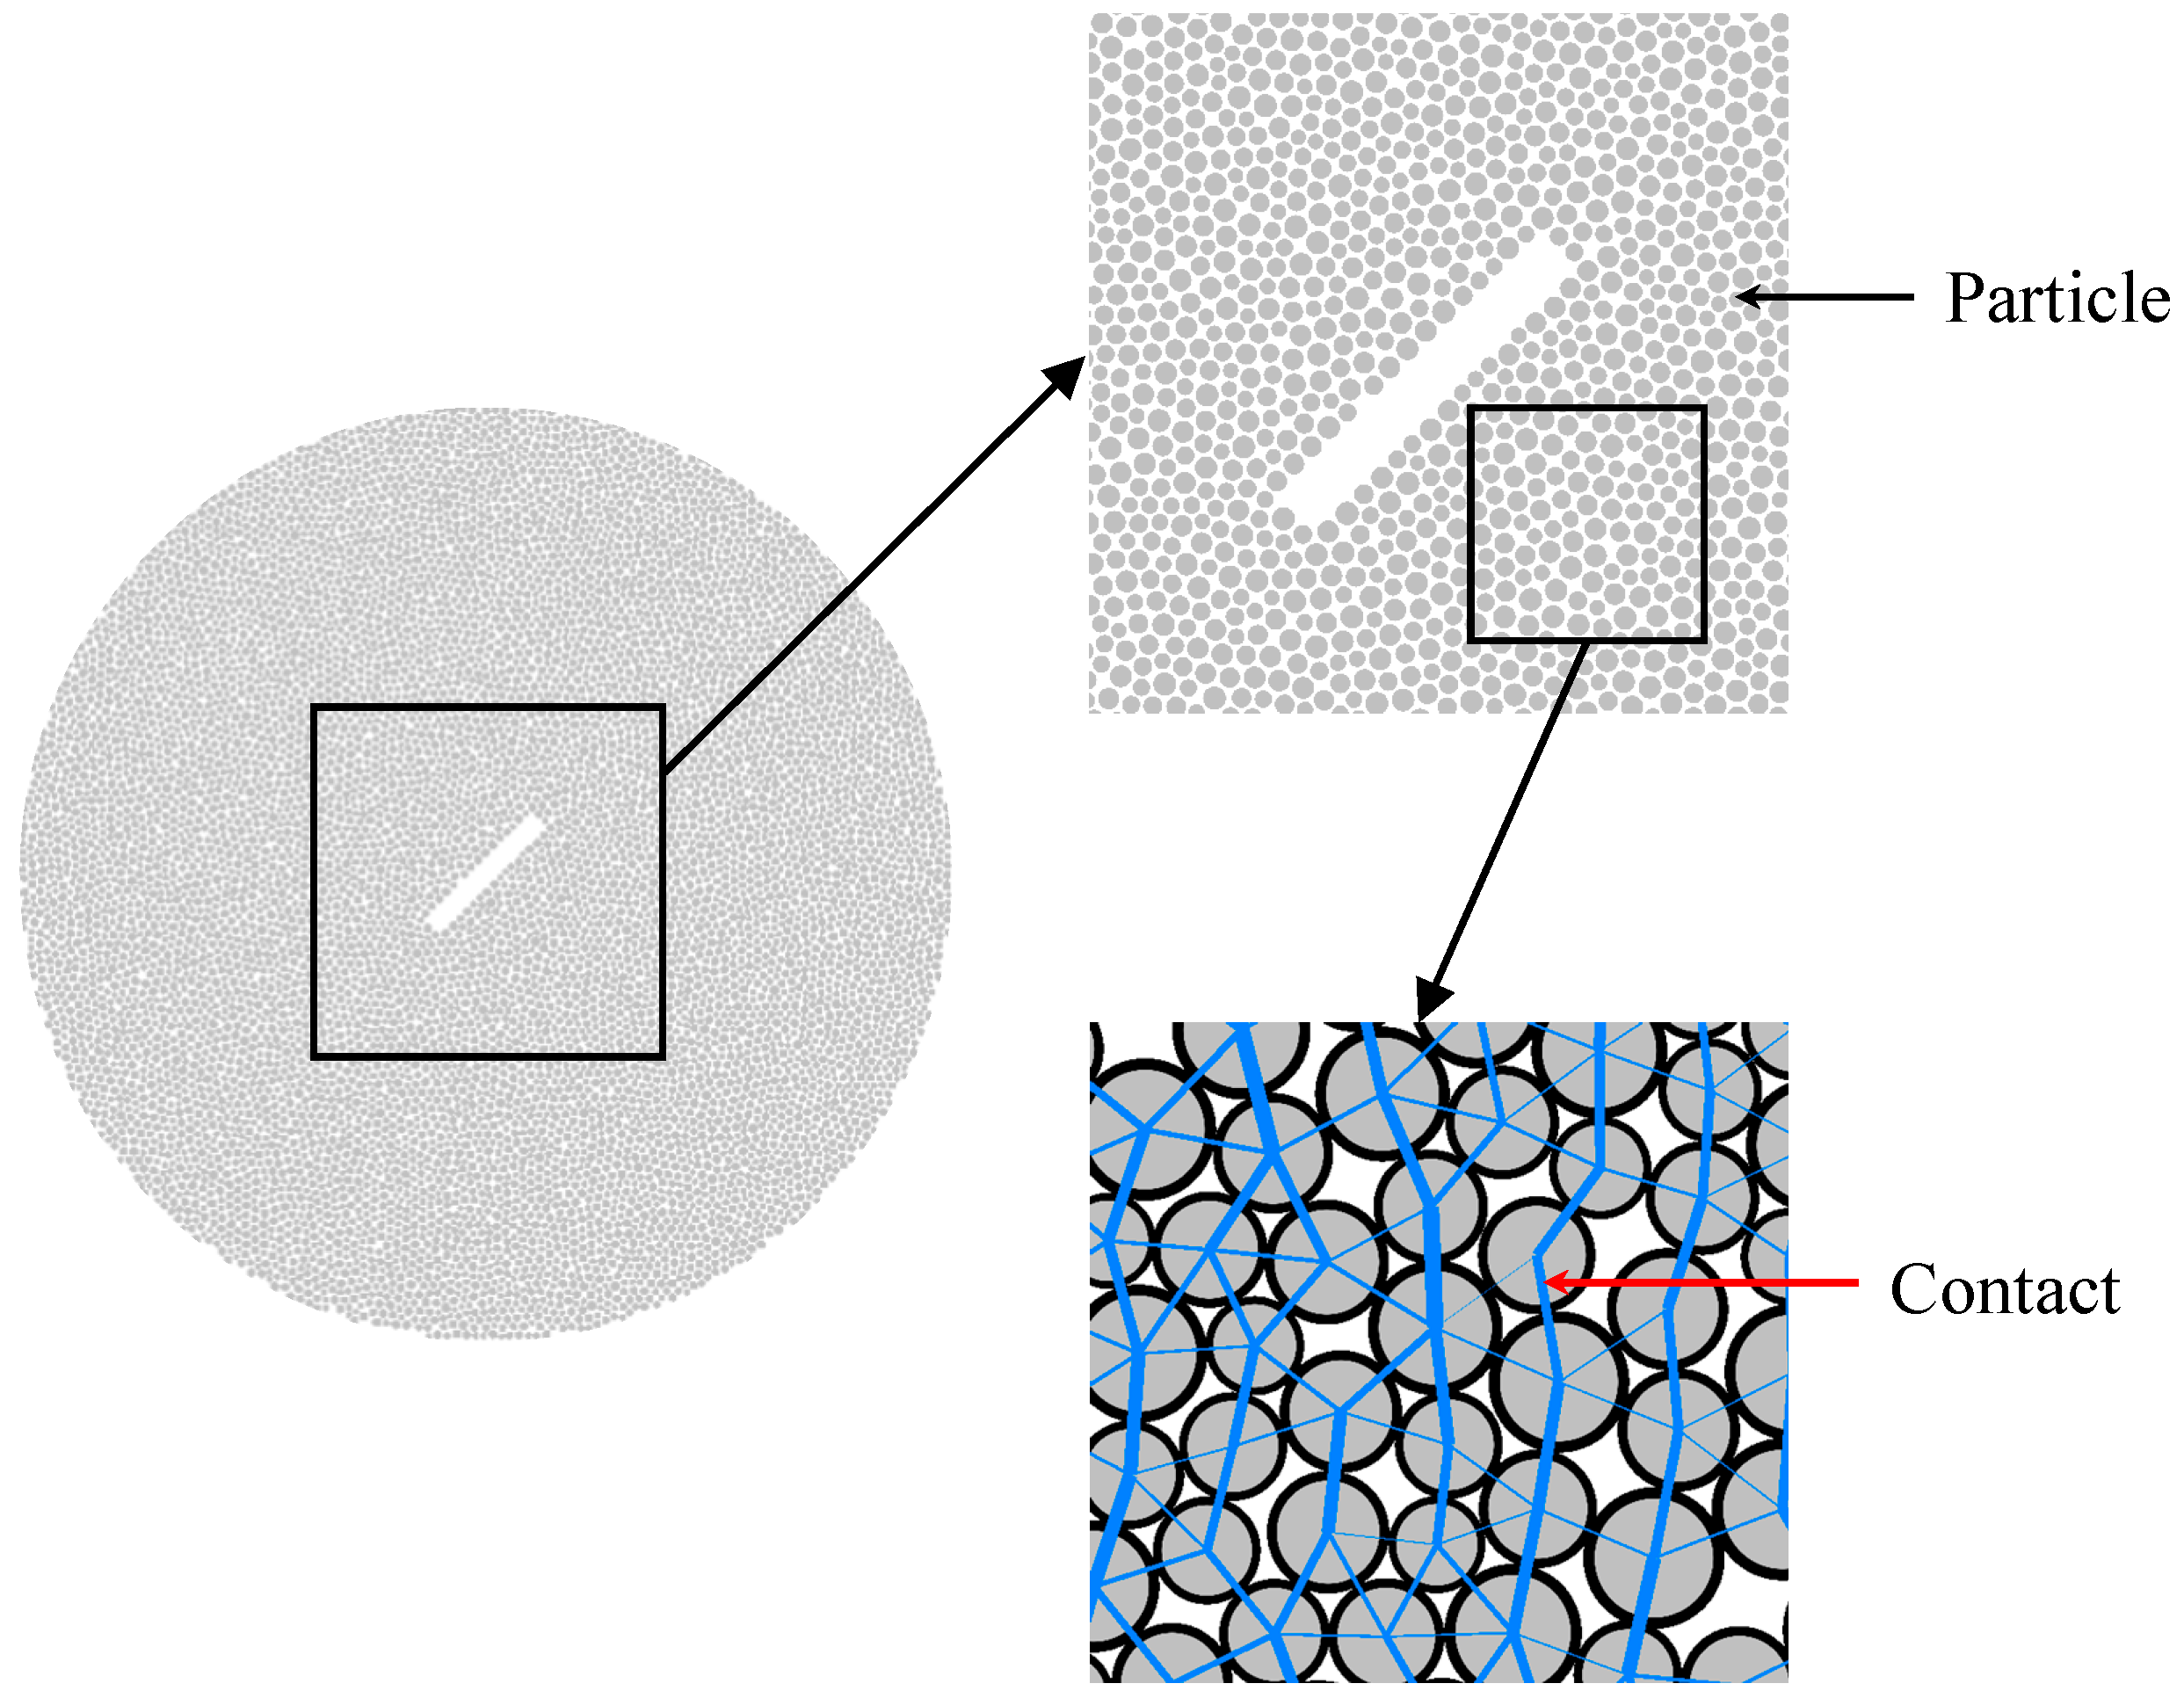
4. Numerical Simulation

PFC2D is a particle flow code developed based on the discrete element method [29], which was used to create a model of the same size as the previous physical models. The particles in PFC can not only move in normal and tangential directions but also relatively rotate. When the “contact” between particles is activated, the “contact” can resist the torque generated by particles rotating or shearing. As shown in Figure 12, the parallel bond model (PB model) stiffness consists of bond stiffness and contact stiffness. When the bond fails, the PB model fails regardless of whether the particles are in contact. Due to the advantage of the PB model in describing the damage and failure characteristics of rock, this study generated two different “contact” (ball-ball and ball-wall facet) and assigned corresponding parameters to simulate the uniaxial compression test and Brazilian splitting test of rock-like materials. During the simulation process, the contact force Fc and moment Mc of the “contact” were updated based on the force-displacement law of the linear parallel bonding model.
F c = F l + F d + F ¯
M c = M ¯
where, F l is a linear force, F d is a cushioning force, F ¯ is a parallel bond force, and M ¯ is a parallel bond moment. When the contact force Fc and moment Mc calculated according to Equations (2) and (3) is greater than the critical value, it is determined that the parallel bond breaks and the elastic interaction provided between the two particle surfaces disappear, indicating that the “contact” is broken.
During the numerical simulation using PFC2D, the macroscopic mechanical properties of the physical model were achieved by microscopic parameters. By adjusting the microscopic parameters between the particles, the macroscopic mechanical response of the particle combination was consistent with the real rock material. Based on previous research results [31], this study uses the “trial and error method” to calibrate the micro parameters such as bonding elastic modulus, line contact modulus, bonding ratio, and bonding strength. The particle size used is to select the smallest particle diameter as much as possible while ensuring computational speed. The microscopic parameters of the numerical model are shown in Table 4.
Numerical simulation was carried out for the aforementioned uniaxial compression test and Brazilian test. The simulation results were close to the laboratory test results, which verified the correctness of the microscopic parameters, as shown in Figure 13. Moreover, the uniaxial compression failure mode of rock specimens obtained by numerical simulation was similar to the laboratory test, which was all splitting failure. The failure mode of the Brazilian disc obtained by numerical simulation also agrees well with the laboratory test results.
In this simulation, the PFC particle flow code was used to obtain a simulation specimen of the same size as the standard disc specimen (Figure 14). The pre-flaw was realized by deleting particles in a specific area on the simulation specimen with dip angles of α = 0°, 15°, 30°, 45°, 60°, 75°, and 90°, respectively. The failure mechanism and damage evolution of the specimens were investigated by simulating the Brazilian test on single-flawed disc specimens.

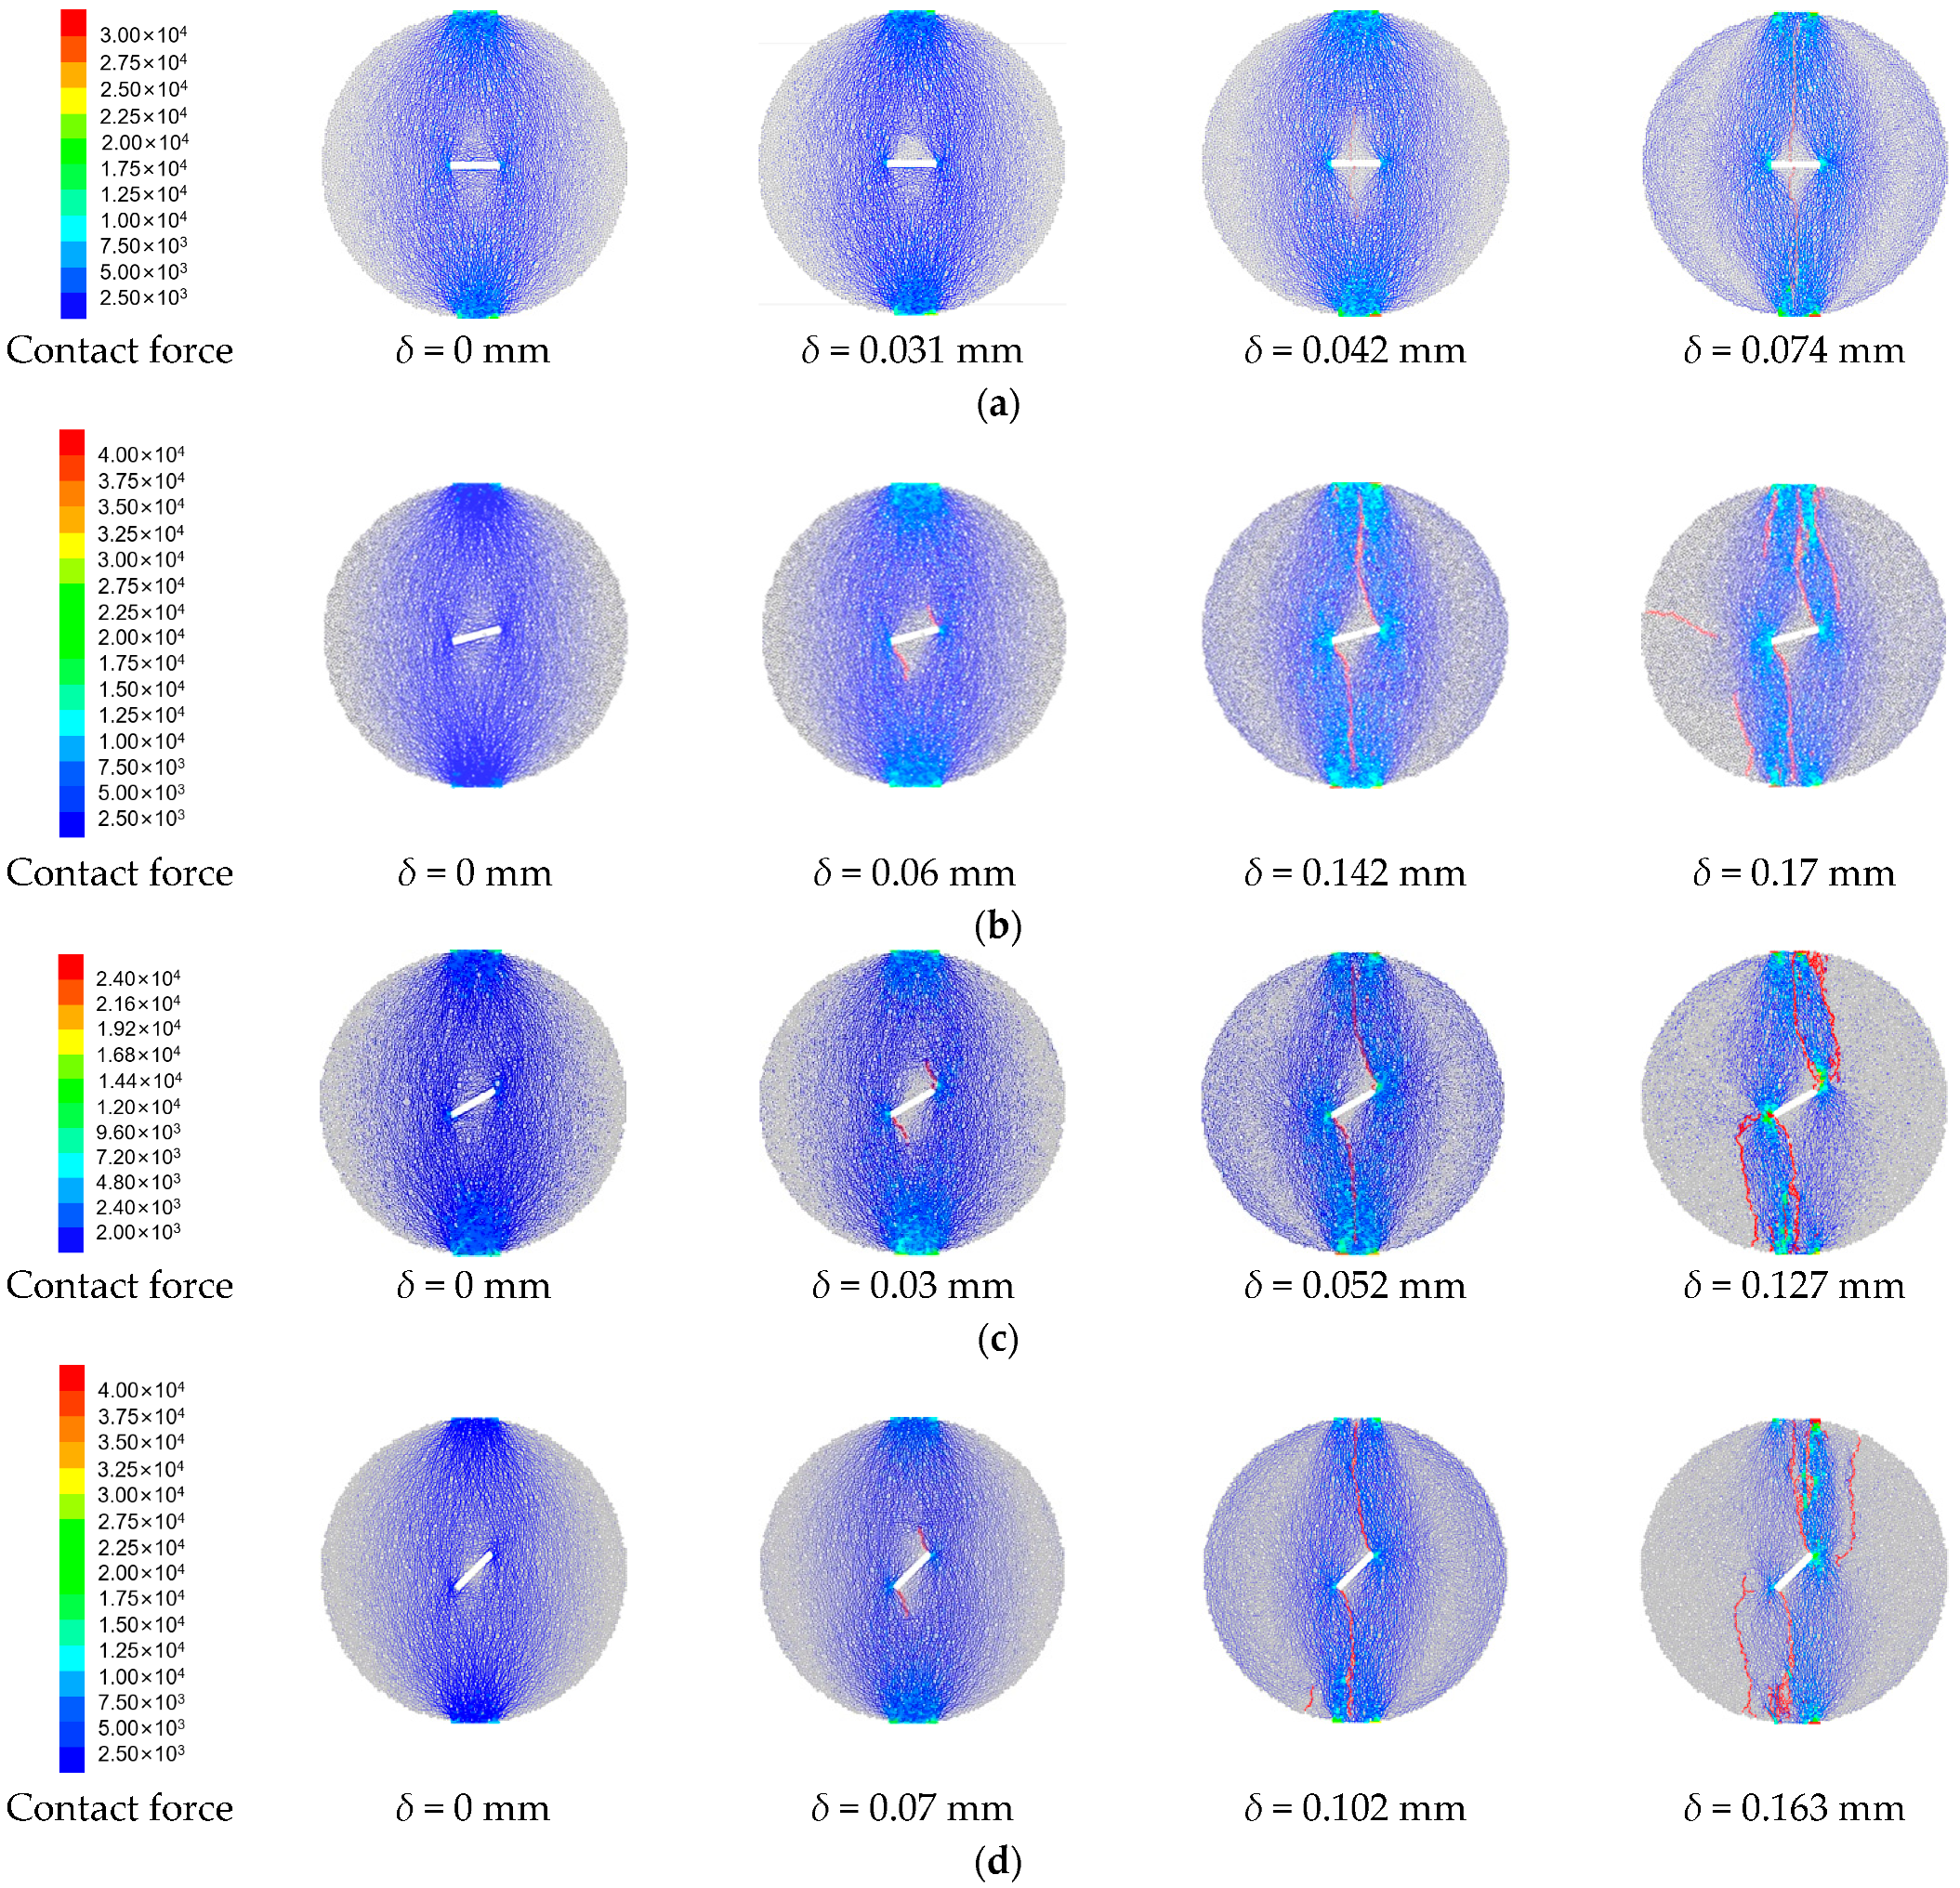
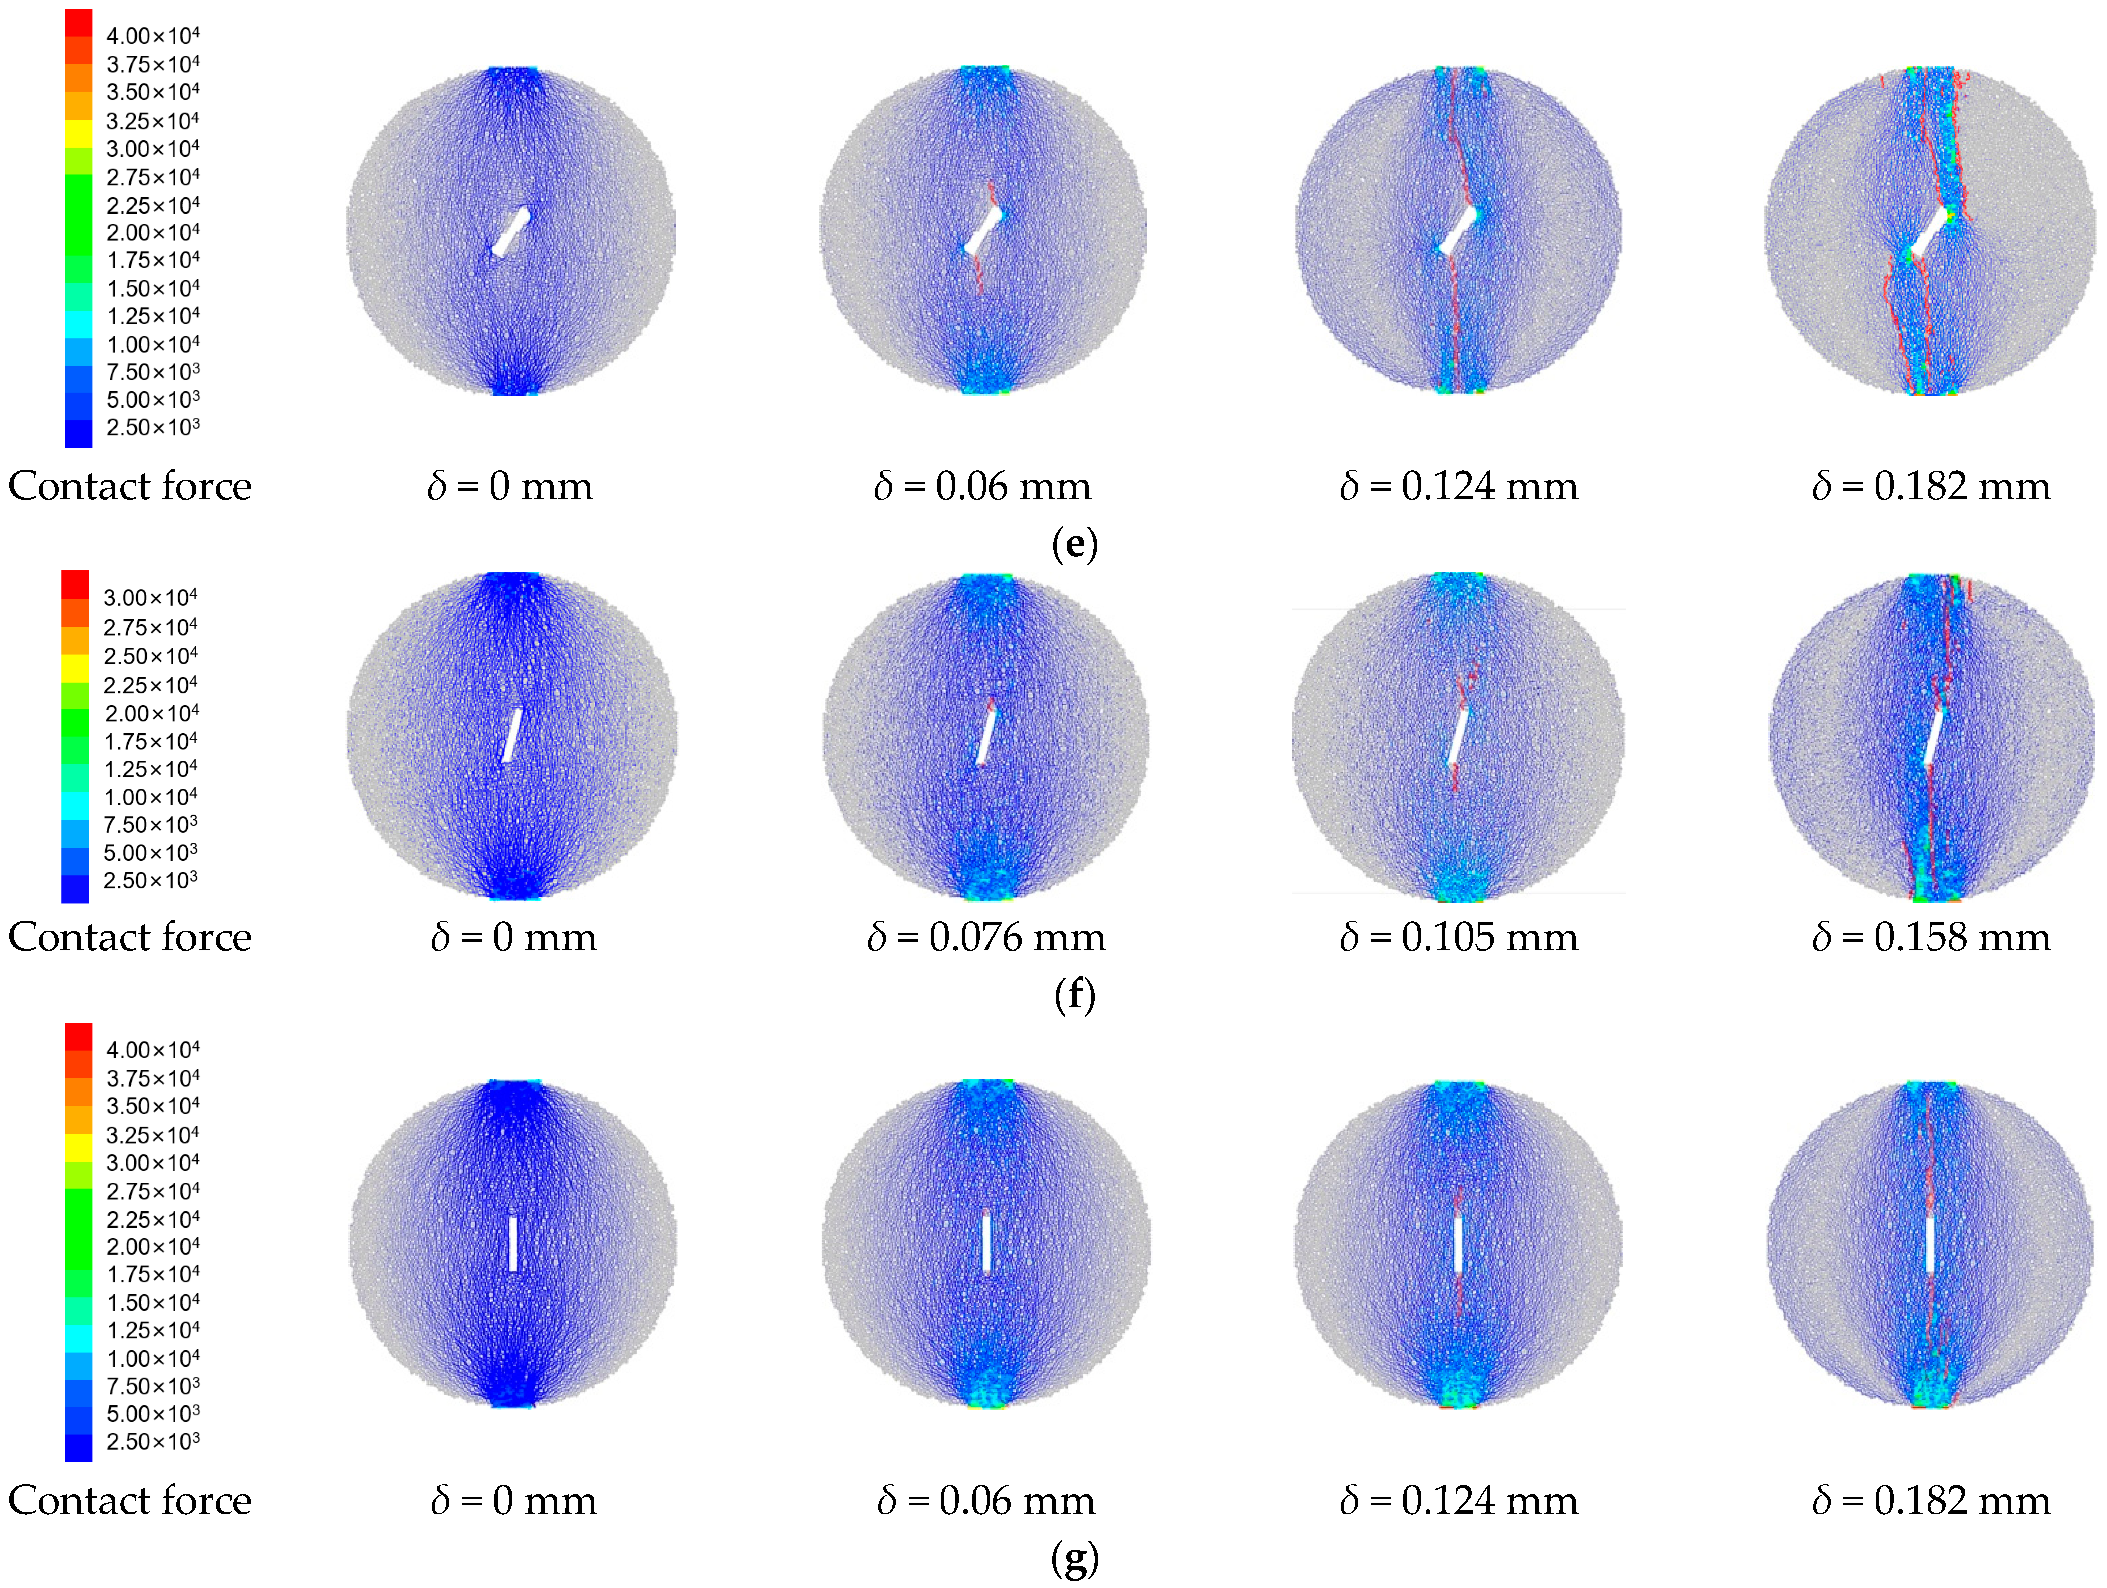
4.1. Meso Damage Evolution Analysis

The evolution of surface cracks in the specimen during loading can be monitored in the laboratory with photographic equipment, but the damage inside the specimen cannot be directly observed. In contrast, the damage behavior inside the model specimen can be monitored by numerical simulation. Figure 15 shows the microcracks inside the specimens with different flaw angles through initiation, development, coalescence, and penetration.
The crack expansion process of the single flawed disc model specimen is similar to the laboratory test results, except for the model specimen with a flaw dip angle of 0°, all the internal cracks of the model specimen are firstly sprouted at the pre-flaw tip with wing cracks. After the wing cracks penetrate, far-field cracks that extend toward the flaw also sprout from the model boundary. The far-field cracks of the model specimens with a flaw dip angle of 45° and 60° eventually connected with the flaw and had four interpenetrated cracks at macroscopic failure. In contrast, the other single-flawed model specimens had only two interpenetrated cracks. In short, the failure of the model specimens was first caused by the propagation and penetration of wing cracks sprouting from the tip of the flaw. The failure stage was accompanied by the initiation of far-field cracks and tended to extend to the center of the disc specimen.
For crack evolution analysis, model specimens with flaw dip angles of 45° and 75° were used as examples. Figure 15d shows the evolution distribution of microcracks and force chains in the model specimen with a flaw dip angle of 45°. The evolution curve of the number of cracks in the model specimen during loading is shown in Figure 16. It can be found that the load-displacement curves obtained from the simulation are consistent with the results of the laboratory test, both of which have two load peaks and belong to progressive failure. When the load reached the crack initiation load (marked as point A), a contact force concentration appeared at the tip of the flaw, and a small number of wing cracks began to sprout. With the expansion of the wing crack, the contact force concentration at the tip of the flaw was increasing, and the contact force was continuously approaching the loading line. When the load increased to the first peak value (marked as point B), the wing cracks extended to the upper and lower boundaries of the disc. From point B to point C, the load decreased slightly, and the growth of micro cracks within the disc specimen came to a standstill, with only a small number of far-field cracks sprouting locally at the specimen boundary, which was caused by the rise in contact force within the boundary region. When the load rose to point D, the number of cracks started to rise rapidly, and the rate of rise was much greater than the A–C section. The cracks sprouted at the model boundary increased and quickly expanded to the flaw, and the failure of the disc specimen appeared when the far-field cracks expanded to the vicinity of the pre-flaw (marked as point E).
Figure 15f shows the evolution distribution of microcracks and force chains in the model specimen with a flaw dip angle of 75°. According to the crack number evolution curve (see Figure 17), the whole damage evolution process of the model specimen can still be divided into four stages. First, when the load was less than the initial cracking load (1.5 kN), there was no microcrack development inside the disc specimen. When the load was increased to the initial cracking load (marked as point A), microcracks germinated along the flaw and gradually extended to the loading end. Finally, when the load reached the peak value (marked as point C), the wing crack sprouted at the tip of the flaw has extended to the disc boundary, the number of microcracks increased rapidly, and a large number of far-field cracks began to sprout at the disc boundary (marked as point D). The ultimate failure of the disc specimen was caused by the propagation of the wing crack.

4.2. Crack Initiation Load and Peak Strength

Figure 18 shows the variation law of peak load, and the initial cracking load with the flaw angle of the disc specimen was summarized. The peak load of a single flawed disc specimen decreases with increasing flaw angle. The simulation results were close to the laboratory test results, and the failure of the disc specimen was caused by the co-propagation of the wing crack and the far-field crack. As the flaw angle increases, the crack expansion path shortens, and the peak load decreases gradually. With the increase of the flaw angle, the angle between the flaw and the loading direction decreases, the hindrance to the development and expansion of the wing crack is weakened, and the initial cracking load decreases slowly. The initial cracking load has a significant drop at α = 90°, which means that the main stress characteristics of the crack changed at this time, and the crack was highly susceptible to expansion. According to the above analysis, the initiation and propagation of new cracks were mainly controlled by tensile stress at the flaw dip angle α = 0°, 15°, 30°, 45°, 60° and 90°. The initiation and propagation of new cracks were controlled by both shear stress and tensile stress at the flaw dip angle α = 75°. Since the constitutive model and boundary conditions of the sample in the laboratory test cannot be completely consistent with those of the sample in the simulation, it is allowed that there are some differences between the simulation results and the laboratory test results on the premise that the laws are the same. It should be noted that since the constitutive model and boundary conditions of the specimen in laboratory tests cannot be completely consistent with those of the specimen in simulation, it is allowed to have certain differences between the simulation results and the laboratory test results.

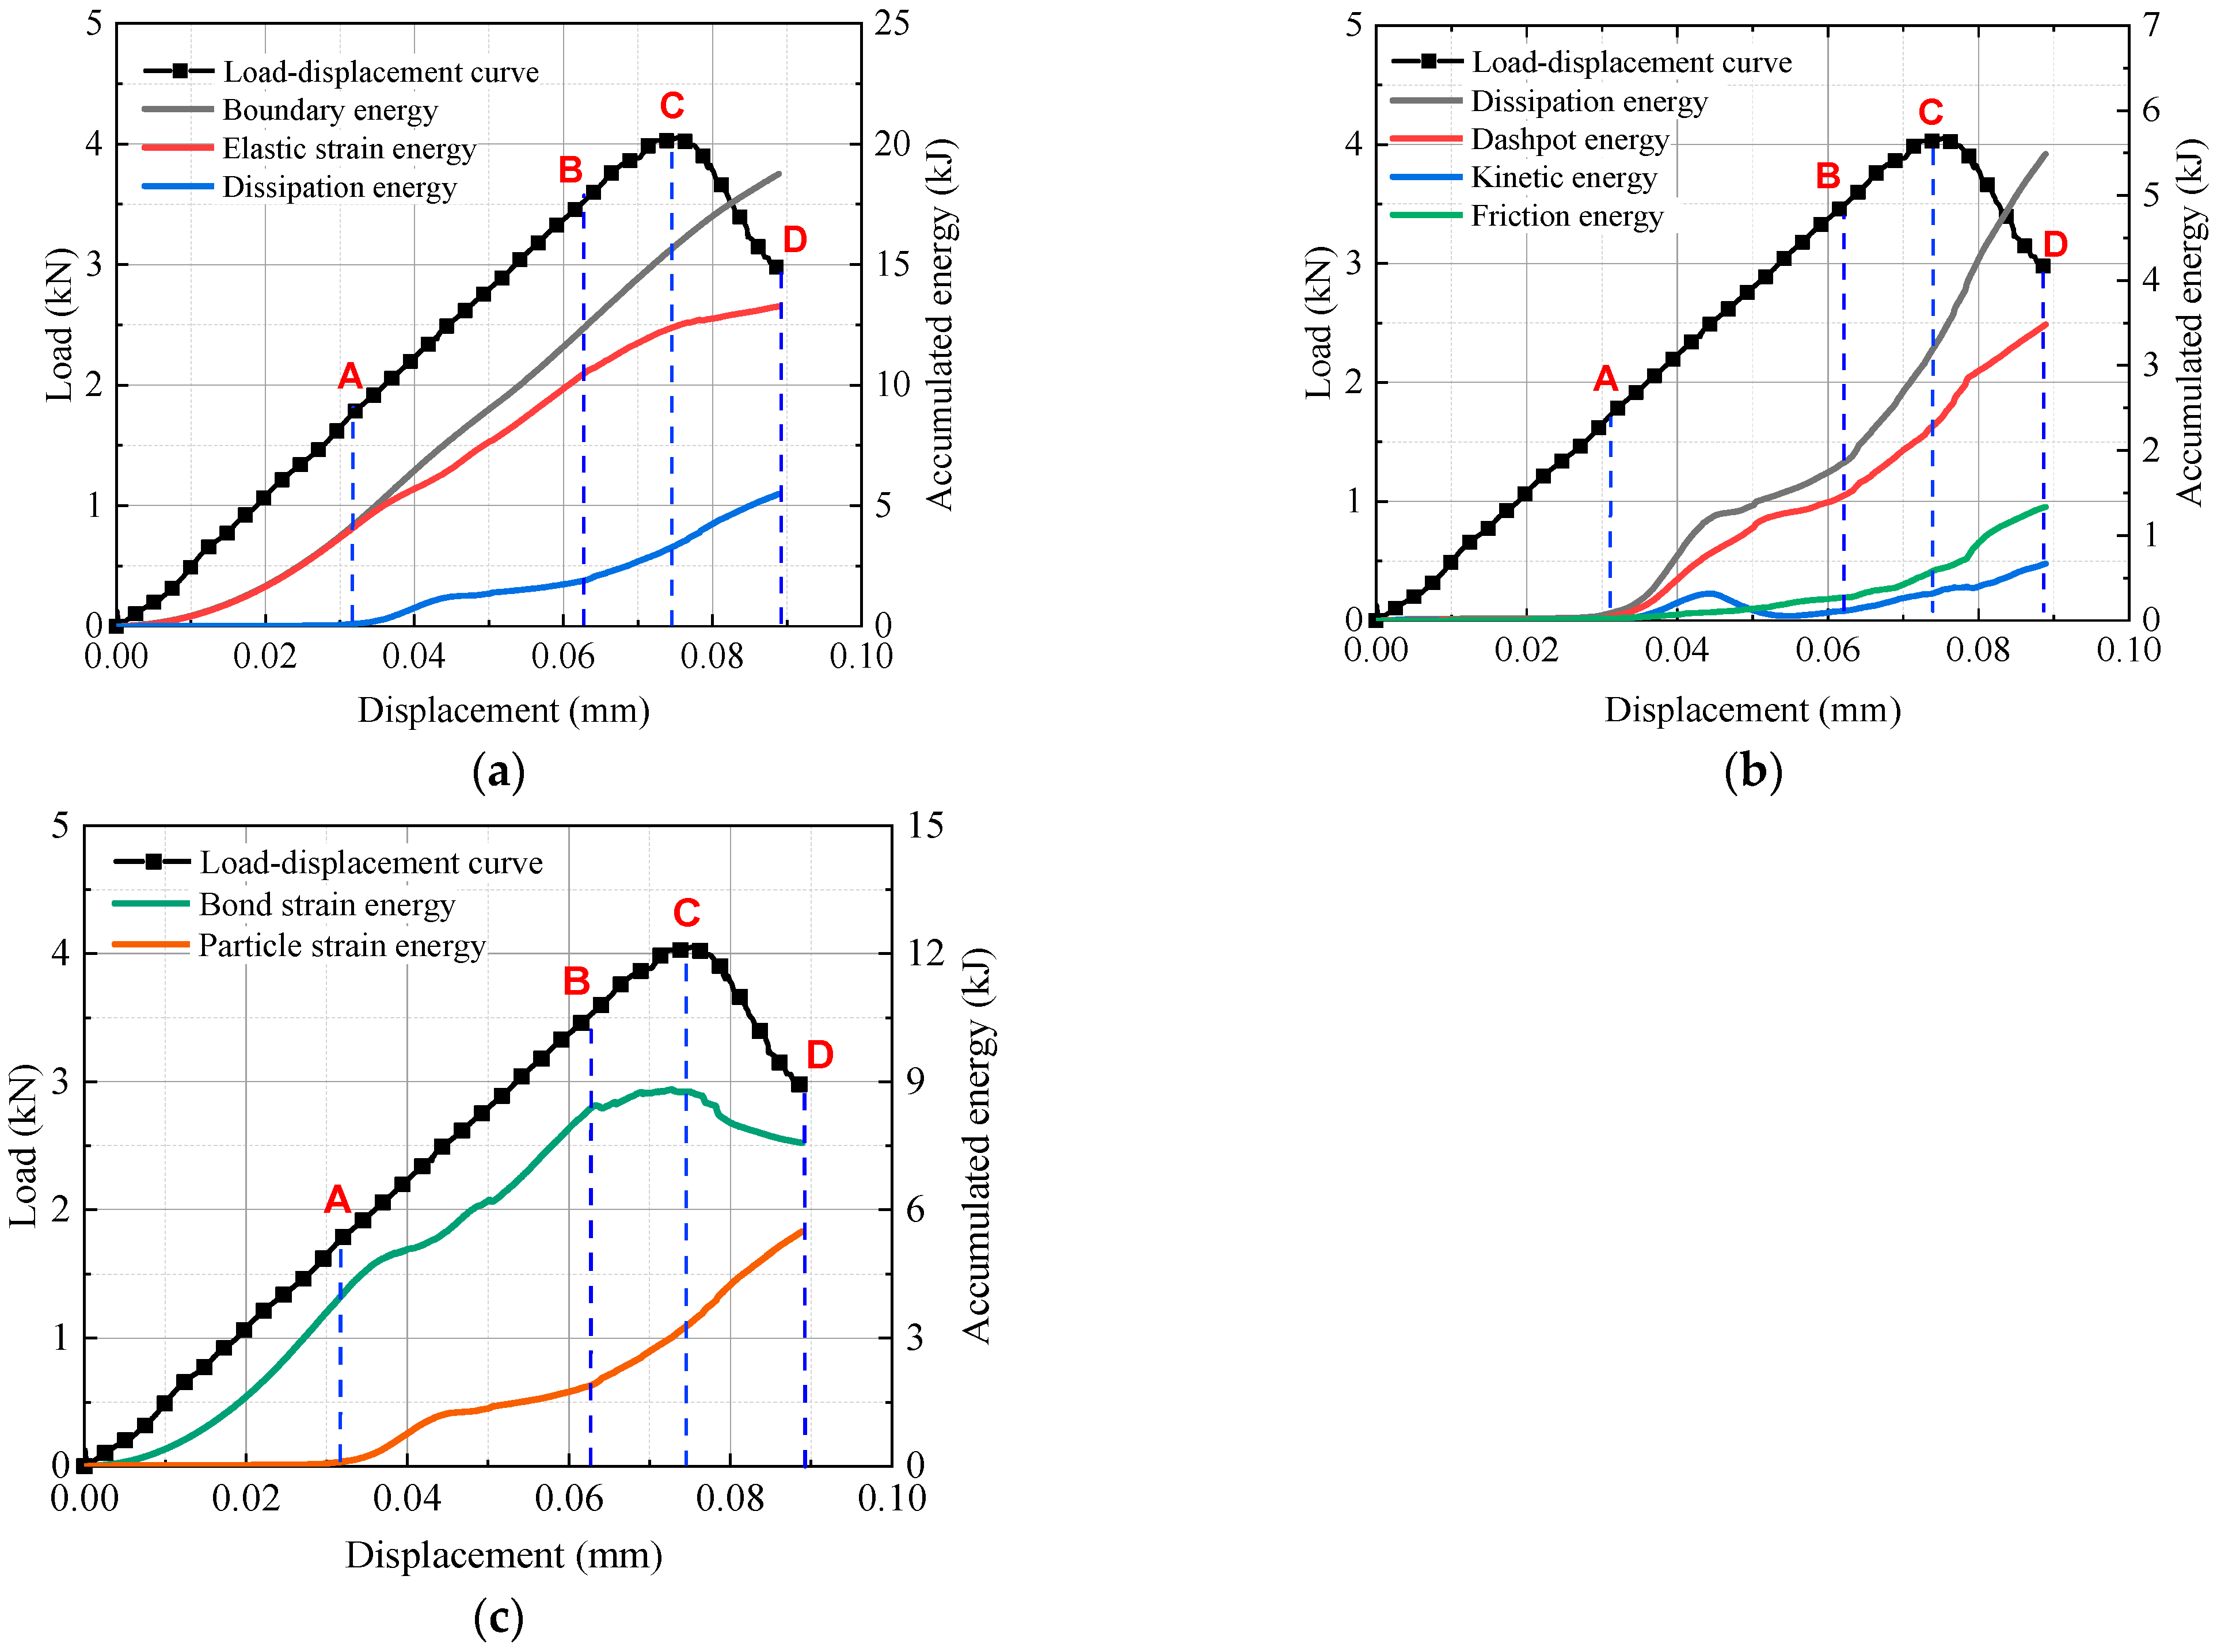
4.3. Energy Analysis

4.3.1. Energy Calculation

The failure of rocks can be considered a transformation process from stable to unstable due to energy transfer. By studying the energy transformation law in the rock failure process, the deformation law of rocks can be explained from the energy perspective. Under Brazilian splitting conditions, the rock specimen received total energy from the external load, converted into dissipation and strain energy. The energy state of the specimen could be described with the first law of thermodynamics, as shown in Equation (4) [32]. The former is irrecoverable energy released directly from the specimen to the external environment through internal damage and crack propagation. The latter is the recoverable energy, which is the energy stored by the specimen in the form of strain energy. The internal damage of the rock is caused by the increasing internal dissipation energy.
E = E e + E d
where E is the total energy absorbed by the external load, which is the work done by the boundary load, also known as the boundary energy. E d is the dissipation of energy. E e is the elastic strain energy.
The PFC2D particle flow code implements the recording of the energy changes of the model specimen during the simulation. The energies monitored are boundary energy, viscous strain energy, friction energy, elastic strain energy, kinetic energy and material cracking and crushing energy. The dissipation energy E d composition of the model is complex and affected by various factors, which can be obtained from the difference between the total strain energy E and the elastic strain energy E e . The elastic strain energy E e is composed of particle strain energy E k and bond strain energy E ¯ k , which is calculated as follows [33]:
E e = E k + E ¯ k
E k = 1 2 F n l 2 k n + F s l 2 k s
E ¯ k = 1 2 F ¯ n 2 k ¯ n A ¯ + F ¯ n 2 k ¯ s A ¯ + M ¯ t 2 k ¯ s J ¯ + M ¯ b 2 k ¯ n I ¯
where F n l and F s l are the linear normal and shear force, F ¯ n and F ¯ s are the parallel-bond normal and shear force, k n and k s are particle normal and shear stiffness, k ¯ n and k ¯ s are parallel-bond normal and shear stiffness, M ¯ t is the twisting moment, M ¯ b is the bending moment, A ¯ is the bond cross-sectional area, J ¯ is the polar moment of inertia of the parallel bond cross section, and I ¯ is the moment of inertia of the parallel bond cross-section.

4.3.2. Energy Evolution Process

Figure 19 shows various energy evolution curves of model specimen with 0° flaw dip angle during loading. The energy evolution process can be divided into four stages: linear deformation stage (OA), dissipation energy steady growth stage (AB), dissipation energy rapid growth stage (BC) and post peak stage (CD). In the first stage, there was no dissipation energy inside the model, and the boundary energy was completely converted to strain energy and stored in the contact. When the model load was increased to the initial cracking load, a small amount of the boundary energy was converted to dissipation energy. Most of it remained in the form of elastic strain energy. The contact fracture inside the model generated a small amount of bonding failure energy. The elastic strain energy gradually showed two forms: particle strain energy and bond strain energy.
With many cracks sprouting inside the model, the dissipation energy kept increasing, the number of free particles increased, and the frictional and kinetic energies also kept increasing. However, the particle cementation damage was still the main energy dissipation path. The percentage of particle strain energy further increased, and the growth of bond strain energy slowed, which shows that the growth rate of elastic strain energy decreased. When the load reached the peak value, crack coalescence appeared in the model, the bond strain energy inside the model started to decrease, and the free particles increased, which shows that the growth rate of particle strain energy, friction energy and kinetic energy increased rapidly. In the last stage, rock failure occurred when the elastic strain energy reached the energy storage limitation. The energy evolution shows that the elastic strain energy stored in the rock is released rapidly, and the dissipation energy increases rapidly.

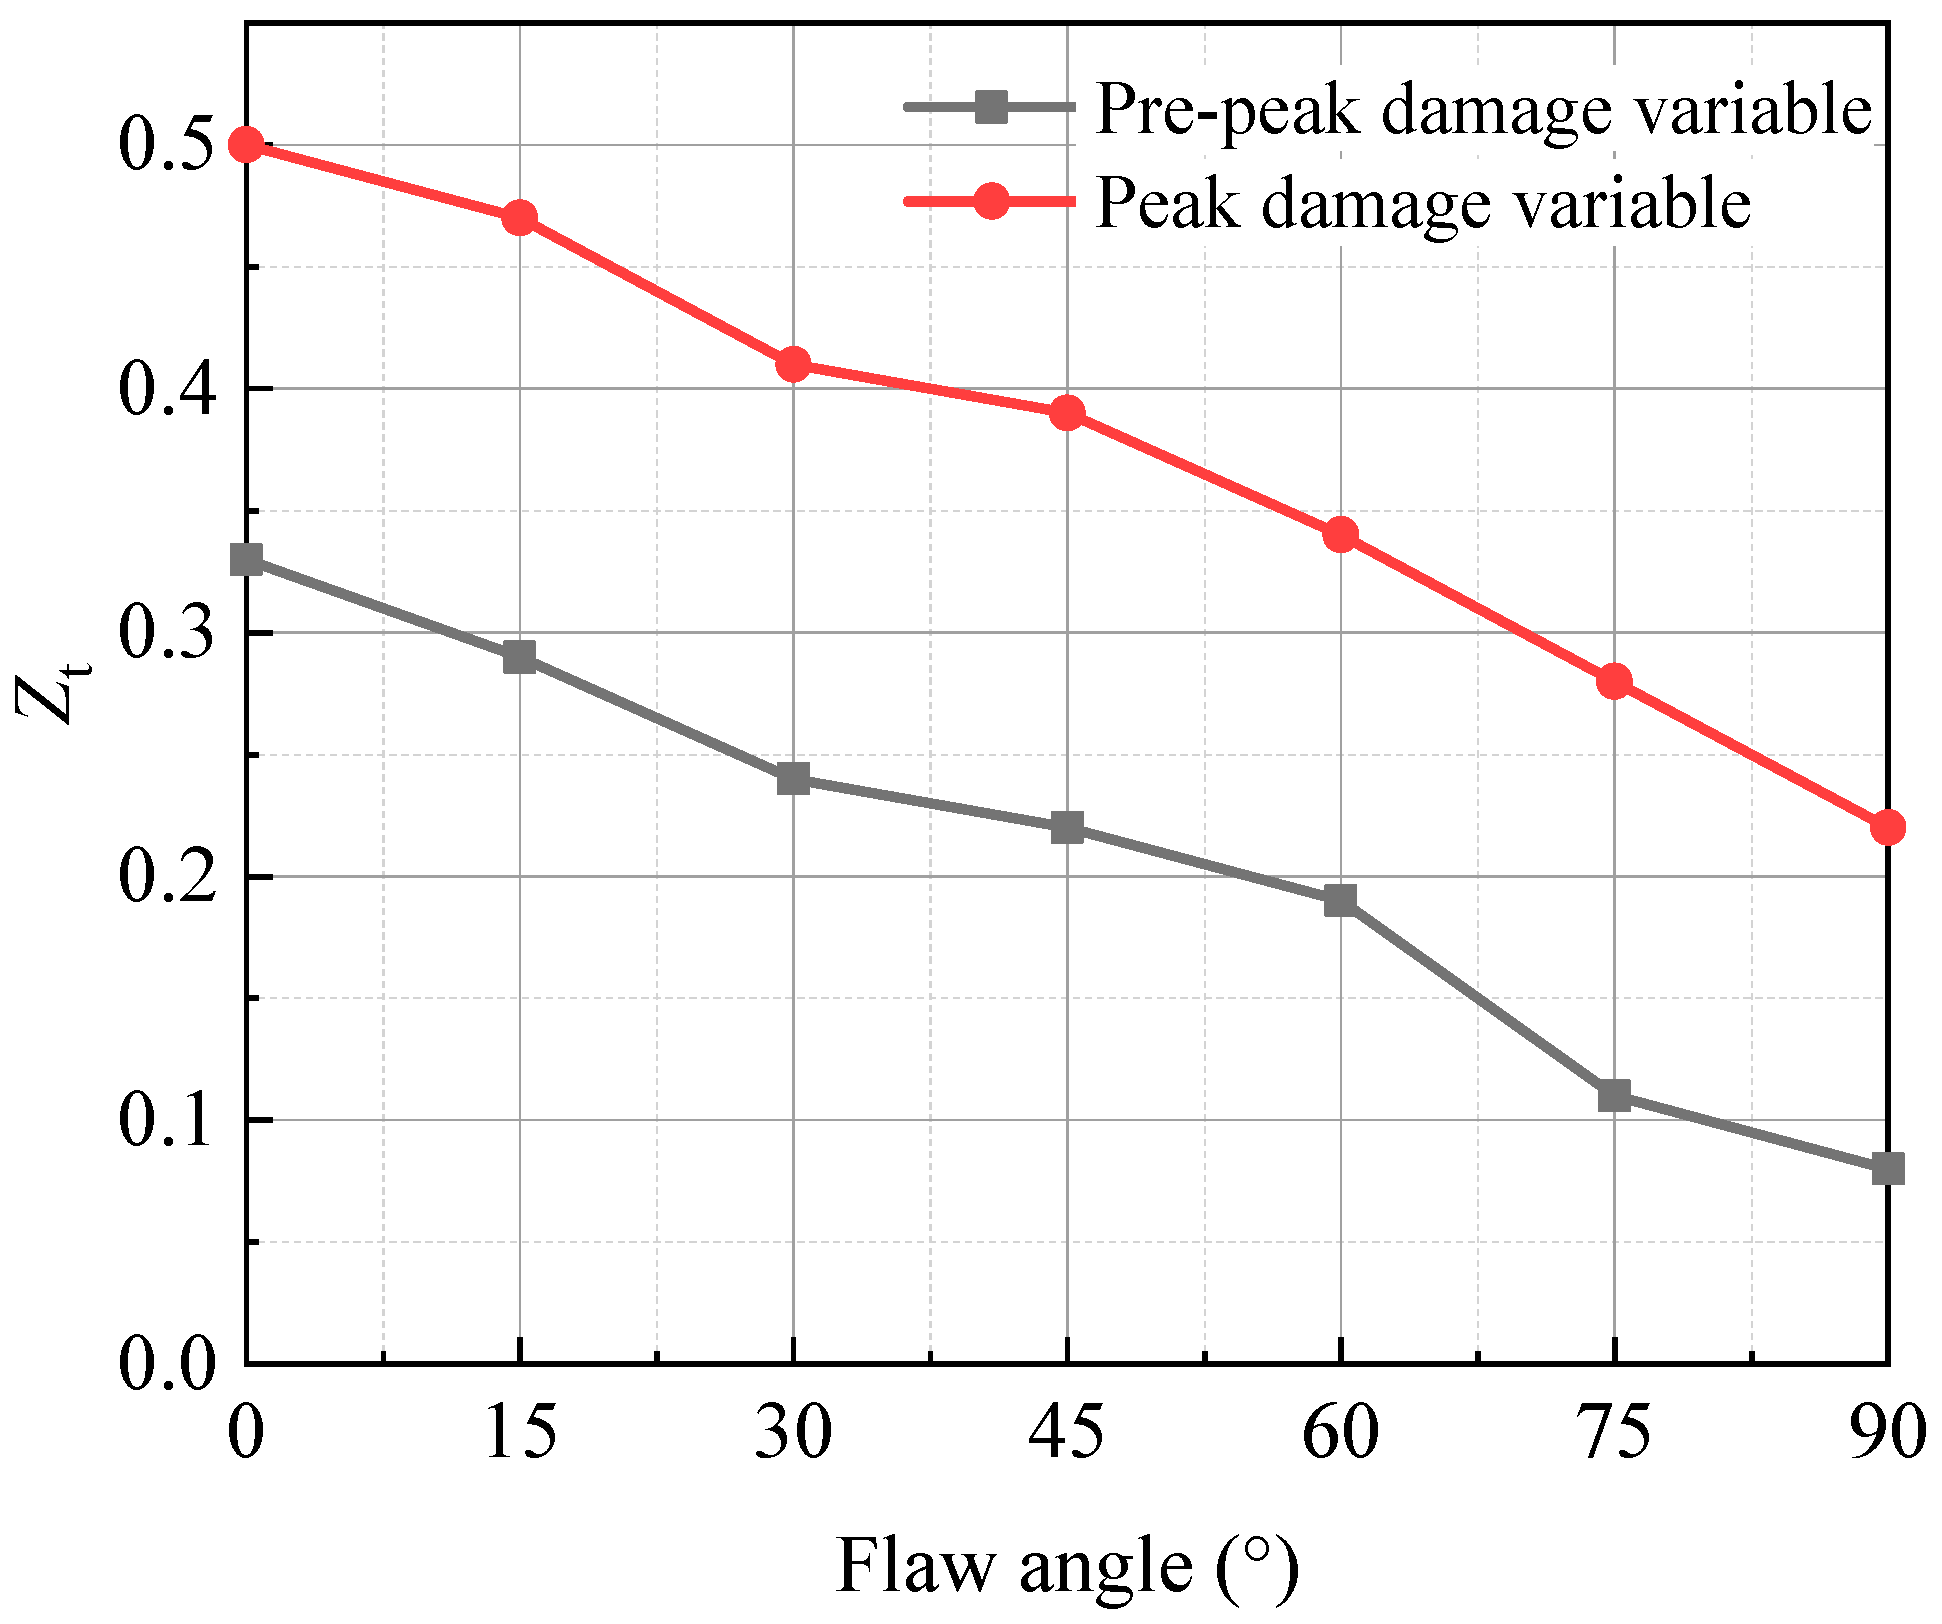
4.3.3. Damage Evolution Analysis

In this paper, the damage was defined in the view of energy, and the damage variable with dissipation energy as the characteristic parameter was proposed:
Z t = E d t E d
where Z t 0 ,   1 , the larger the value of Z t indicates more dissipation energy within the model and more serious damage. E d is the dissipation energy. E d t is the dissipation energy at the specified moment.
The damage variables, crack number, strain energy, and dissipation energy corresponding to the pre-peak, peak, and post-peak loads in the load-displacement curves of the single flawed model are given in Table 5. The pre-peak data points corresponding to 80% of the peak load were selected for the pre-peak load, and the post-peak data points corresponding to 80% of the peak load for the post-peak load. While two peak loads exist for the progressive failure curve, the peak load used in this paper was the maximum peak load. It can be found that when the model loading level was at the pre-peak, the damage variable was small, and the number of cracks sprouting inside the model was less. After the transition from the pre-peak load to the post-peak load, the damage inside the model intensified, cracks increased sharply, the boundary energy was mainly converted into dissipation energy, and the proportion of strain energy decreased. The energy change of the single flawed disc model with different dip angles was similar to the crack propagation law. The crack sprouting was accompanied by increased dissipation energy, and the crack initiation and the increase of dissipation energy were mainly concentrated in the post-peak stage.
Figure 20 shows the relationship curves of the pre-peak damage coefficient and peak damage coefficient with the flaw dip angle. It can be seen that with the increase of the flaw angle, the pre-peak damage variable and the peak damage variable keep decreasing. This indicated that the larger the flaw angle was, the more damage to the model specimen was concentrated in the post-peak stage. A large number of microcracks were merged and penetrated. Macro cracks were rapidly formed at the post-peak. The model specimens were characterized by brittle failure.

5. Conclusions

This paper tested the mechanical properties and crack propagation mechanism under Brazilian splitting conditions for rock-like material and particle flow models with different flaw angles. As a result, the following conclusions were obtained.
(1)
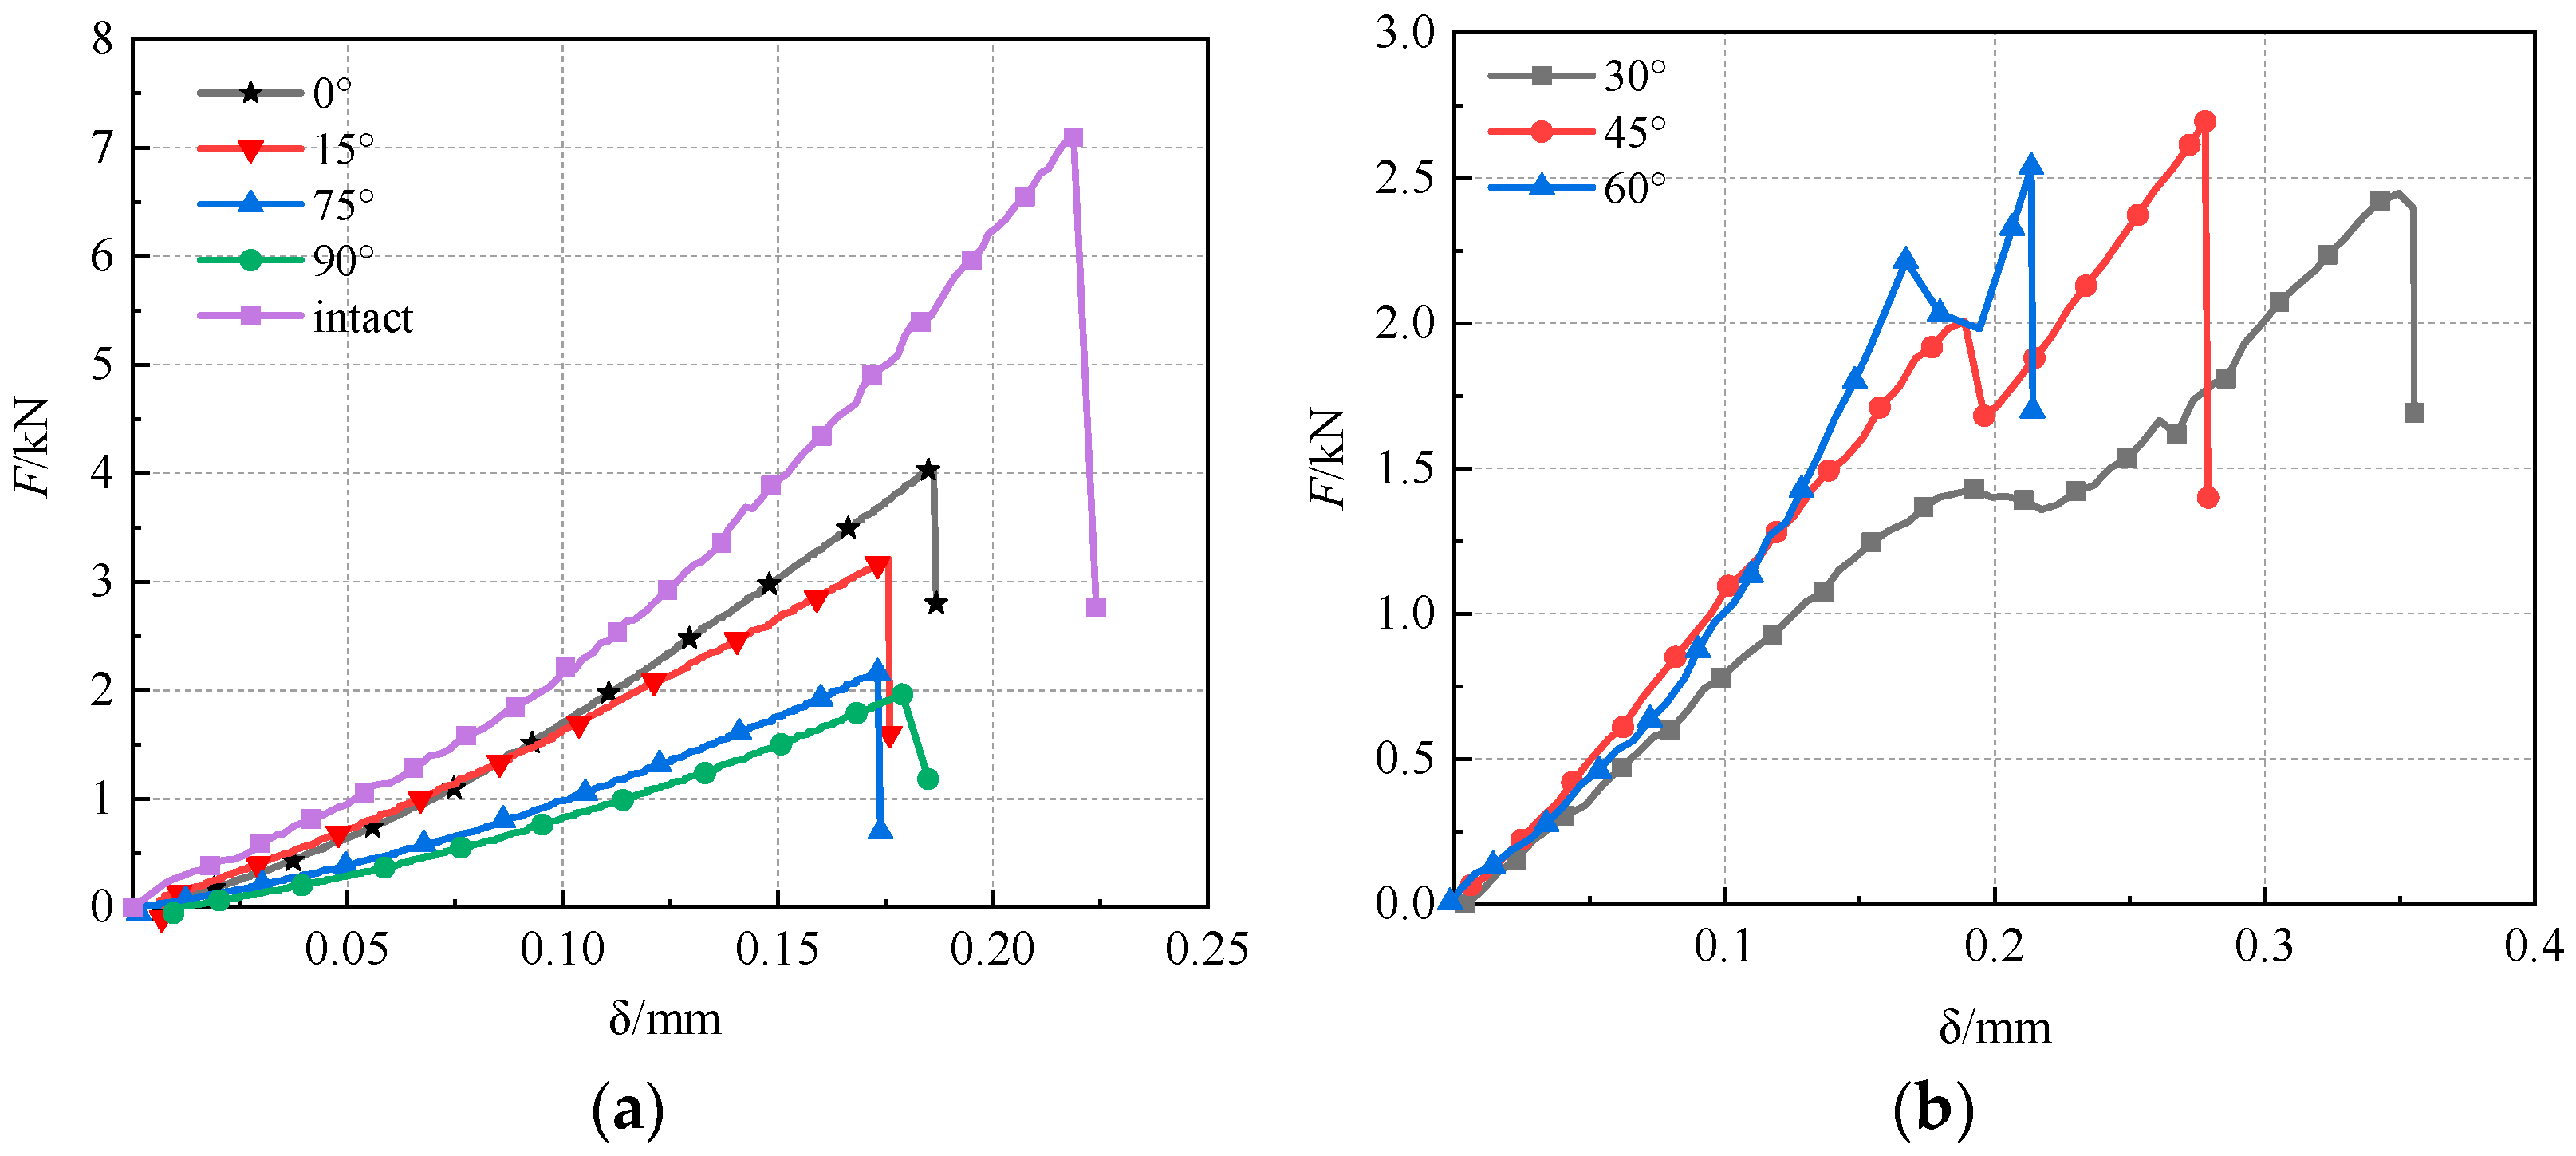
The load-displacement curves of Brazilian disc specimens containing fractured rocks are divided into two types. When the fracture dip angle is 30°, 45° and 60°, it shows the gradual destabilization type, and the rest of the pre-flawed specimens and intact specimens show the instantaneous destabilization type. Furthermore, the damage modes of disc specimens are divided into: Wing cracks penetration damage mode, tensile-shear penetration damage mode and radial penetration failure mode.
(2)
The numerical simulation results are close to the laboratory results, and the cracks in the model originated from the crack tip first (except α = 0°). The crack initiation was less at the prepeak stage, and the failure stage was accompanied by the formation of far-field cracks. The strength of the pre-flawed disc specimen was lower than the intact specimen. With the increase of flaw angle, the initial cracking load and peak load gradually decreased.
(3)
The damage variable with dissipation energy as its characteristic was proposed. The pre-peak damage variable and the peak damage variable of the disc specimen decreased with increasing flaw angle, and the damage was concentrated at the post-peak stage. Finally, the specimens showed sudden brittle fracture failure.

Author Contributions

Conceptualization, Y.B. and H.D.; Data curation, Y.W. (Yujing Wang) and Y.W. (Yuqin Wang); Formal analysis, Y.B., H.D. and P.S.; Funding acquisition, Y.B.; Investigation, Y.B., H.D., P.S. and T.M.; Methodology, Y.B., H.D. and P.S.; Resources, Y.B., H.D., P.S., T.M., Y.W. (Yujing Wang) and Y.W. (Yuqin Wang); Software, H.D. and P.S.; Supervision, Y.B.; Validation, P.S., T.M. and Y.W. (Yujing Wang); Visualization, Y.B., H.D., P.S., T.M., Y.W. (Yujing Wang) and Y.W. (Yuqin Wang); Writing—original draft preparation, Y.B.; Writing—review and editing, H.D. and P.S. All authors have read and agreed to the published version of the manuscript.

Funding

This research was funded by the Fundamental Research Funds for the Central Universities, grant No. 2022XJLJ01; by the National Natural Science Foundation of China, grant Nos. 41572270 and 52274148; by the China University of Mining and Technology (Beijing) Undergraduate Innovation Training Program, grant Nos. 202206003 and 202306040.

Data Availability Statement

Not applicable.

Conflicts of Interest

The authors declare no conflict of interest.

References

  1. Bieniawski, Z.T.; Hawkes, I. Suggested methods for determining tensile strength of rock materials. Int. J. Rock Mech. Min. Sci. Geomech. Abstr. 1978, 15, 99–103. [Google Scholar] [CrossRef]
  2. Fujii, Y.; Ishijima, Y. Consideration of fracture growth from an inclined slit and inclined initial fracture at the surface of rock and mortar in compression. Int. J. Rock Mech. Min. Sci. 2004, 41, 1035–1041. [Google Scholar] [CrossRef]
  3. Yang, S.Q.; Jing, H.W.; Xu, T. Mechanical behavior and failure analysis of brittle sandstone specimens containing combined flaws under uniaxial compression. J. Cent. South Univ. 2014, 21, 2059–2073. [Google Scholar] [CrossRef]
  4. Yang, S.Q.; Tian, W.L.; Huang, Y.H.; Ranjith, P.G.; Ju, Y. An experimental and numerical study on cracking behavior of brittle sandstone containing two non-coplanar fissures under uniaxial compression. Rock Mech. Rock Eng. 2016, 49, 1497–1515. [Google Scholar] [CrossRef]
  5. Huang, Y.H.; Yang, S.Q.; Ranjith, P.G.; Zhao, J. Strength failure behavior and crack evolution mechanism of granite containing pre-existing non-coplanar holes: Experimental study and particle flow modeling. Comput. Geotech. 2017, 88, 182–198. [Google Scholar] [CrossRef]
  6. Miao, S.; Pan, P.Z.; Wu, Z.; Li, S.; Zhao, S. Fracture analysis of sandstone with a single filled flaw under uniaxial compression. Eng. Fract. Mech. 2018, 204, 319–343. [Google Scholar] [CrossRef]
  7. Wong, L.N.Y.; Einstein, H.H. Systematic evaluation of cracking behavior in specimens containing single flaws under uniaxial compression. Int. J. Rock Mech. Min. Sci. 2009, 46, 239–249. [Google Scholar] [CrossRef]
  8. Wasantha, P.L.P.; Ranjith, P.G.; Viete, D.R.; Luo, L. Influence of the geometry of partially-spanning joints on the uniaxial compressive strength of rock. Int. J. Rock Mech. Min. Sci. 2012, 50, 140–146. [Google Scholar] [CrossRef]
  9. Huang, S.; Liu, Y.; Guo, Y.; Zhang, Z.; Cai, Y. Strength and failure characteristics of rock-like material containing single crack under freeze-thaw and uniaxial compression. Cold Reg. Sci. Technol. 2019, 162, 1–10. [Google Scholar] [CrossRef]
  10. Zhao, C.; Niu, J.L.; Zhang, Q.Z.; Yu, S.B. Numerical simulations on cracking behavior of rock-like specimens with single flaws under conditions of uniaxial and biaxial compressions. J. Mater. Civ. Eng. 2019, 31, 04019305. [Google Scholar] [CrossRef]
  11. Haeri, H.; Shahriar, K.; Marji, M.F.; Moarefvand, P. On the strength and crack propagation process of the pre-cracked rock-like specimens under uniaxial compression. Strength Mater. 2014, 46, 140–152. [Google Scholar] [CrossRef]
  12. Zhuang, X.; Chun, J.; Zhu, H. A comparative study on unfilled and filled crack propagation for rock-like brittle material. Theor. Appl. Fract. Mech. 2014, 72, 110–120. [Google Scholar] [CrossRef]
  13. Zhao, Z.; Zhou, D. Mechanical properties and failure modes of rock samples with grout-infilled flaws: A particle mechanics modeling. J. Nat. Gas. Sci. Eng. 2016, 34, 702–715. [Google Scholar] [CrossRef]
  14. Shan, R.; Bai, Y.; Dou, H.; Han, T.; Yan, F. Experimental study on the mechanical properties and damage evolution of red sandstone containing a single ice-filled flaw under triaxial compression. Arab. J. Geosci. 2020, 13, 630. [Google Scholar] [CrossRef]
  15. Wang, C.; Li, Y.; Dai, F.; Wu, G.; Yin, F.; Li, K.; Wang, K. Experimental investigation on mechanical properties and failure mechanism of rock-like specimens containing an arc-shaped ice-filled flaw under uniaxial compression. Theoret. Appl. Fract. Mech. 2022, 119, 103368. [Google Scholar] [CrossRef]
  16. Donzé, F.V.; Richefeu, V.; Magnier, S.A. Advances in discrete element method applied to soil, rock and concrete mechanics. Electron. J. Geotech. Eng. 2009, 8, 1–44. [Google Scholar]
  17. Lee, H.; Jeon, S. An experimental and numerical study of fracture coalescence in pre-cracked specimens under uniaxial compression. Int. J. Solids Struct. 2011, 48, 979–999. [Google Scholar] [CrossRef]
  18. Zhang, X.P.; Wong, L.N.Y. Crack initiation, propagation and coalescence in rock-like material containing two flaws: A numerical study based on bonded-particle model approach. Rock Mech. Rock Eng. 2013, 46, 1001–1021. [Google Scholar] [CrossRef]
  19. Zhang, X.P.; Wong, L.N.Y. Cracking processes in rock-like material containing a single flaw under uniaxial compression: A numerical study based on parallel bonded-particle model approach. Rock Mech. Rock Eng. 2012, 45, 711–737. [Google Scholar] [CrossRef]
  20. Yang, S.Q.; Tian, W.L.; Huang, Y.H. Failure mechanical behavior of pre-holed granite specimens after elevated temperature treatment by particle flow code. Geothermics 2018, 72, 124–137. [Google Scholar] [CrossRef]
  21. Zhang, Y.; Shao, Z.; Wei, W.; Qiao, R. PFC simulation of crack evolution and energy conversion during basalt failure process. J. Geophys. Eng. 2019, 16, 639–651. [Google Scholar] [CrossRef]
  22. Huang, Y.H.; Yang, S.Q.; Tian, W.L.; Wu, S.Y. Experimental and DEM study on failure behavior and stress distribution of flawed sandstone specimens under uniaxial compression. Theoret. Appl. Fract. Mech. 2022, 118, 103266. [Google Scholar] [CrossRef]
  23. Shi, X.; Zhang, C.; Zhou, X. The Statistical Damage Constitutive Model of the Mechanical Properties of Alkali-Resistant Glass Fiber Reinforced Concrete. Symmetry 2020, 12, 1139. [Google Scholar] [CrossRef]
  24. Liu, S.; Wang, H.; Xu, W.; Qu, X.; Xie, W.C. Numerical Brazilian split test of pre-cracked granite with randomly distributed micro-components. Eng. Comput. 2020, 37, 2641–2657. [Google Scholar] [CrossRef]
  25. Qiu, J.; Luo, L.; Li, X.; Li, D.; Chen, Y.; Luo, Y. Numerical investigation on the tensile fracturing behavior of rock-shotcrete interface based on discrete element method. Int. J. Min. Sci. Technol. 2020, 30, 293–301. [Google Scholar] [CrossRef]
  26. Zhou, J.; Zeng, Y.; Guo, Y.; Chang, X.; Liu, L.; Wang, L.; Hou, Z.; Yang, C. Effect of natural filling fracture on the cracking process of shale Brazilian disc containing a central straight notched flaw. J. Petrol. Sci. Eng. 2021, 196, 107993. [Google Scholar] [CrossRef]
  27. Liu, J.; Li, Y.; Qiao, L. Analytical Solutions of Stress Intensity Factors for a Centrally Cracked Brazilian Disc Considering Tangential Friction Effects. Rock Mech. Rock Eng. 2022, 55, 2459–2470. [Google Scholar] [CrossRef]
  28. Bai, Y.; Shan, R.L.; Wu, Y.X.; Sun, P.F. Development and application of a new triaxial testing system for subzero rocks. Geotech. Test. J. 2021, 44, 1327–1349. [Google Scholar] [CrossRef]
  29. Cundall, P.A.; Strack, O.D.L. A discrete numerical model for granular assemblies. Geotechnique 1979, 29, 47–65. [Google Scholar] [CrossRef]
  30. Cho, N.A.; Martin, C.D.; Sego, D.C. A clumped particle model for rock. Int. J. Rock Mech. Min. Sci. 2007, 44, 997–1010. [Google Scholar] [CrossRef]
  31. Gutiérrez-Ch, J.G.; Senent, S.; Melentijevic, S.; Jimenez, R. Distinct element method simulations of rock-concrete interfaces under different boundary conditions. Eng. Geol. 2018, 240, 123–139. [Google Scholar] [CrossRef]
  32. Yang, Y.S.; Cheng, W.; Zhang, Z.R.; Tian, H.Y.; Li, K.Y.; Huang, C.P. Energy evolution law of marble failure process under different confining pressures based on particle discrete element method. Front. Mater. 2021, 8, 665955. [Google Scholar] [CrossRef]
  33. Itasca Consulting Group Inc. Users’ Manual for Particle Flow Code in 2 Dimensions (PFC2D), Version 5.0; Itasca Consulting Group Inc.: Minneapolis, MN, USA, 2015. [Google Scholar]
Figure 1. Test equipment, (a) loading system, (b) Brazilian splitting test, (c) uniaxial compression test, (d) software interface.
Symmetry 15 00895 g001
Figure 2. Stress-strain curves of (a) rock-like material specimens and (b) sandstone specimens.
Symmetry 15 00895 g002
Figure 3. Brazilian splitting load-displacement curves of (a) rock-like material specimens and (b) sandstone specimens.
Symmetry 15 00895 g003
Figure 4. Prefabricated crack mould, (a) resin base, (b) steel sheet.
Symmetry 15 00895 g004
Figure 5. Schematic diagrams of size and flaw of disc specimen.
Symmetry 15 00895 g005
Figure 6. Load-displacement curves of disc specimens under Brazilian test, (a) type I, (b) type II.
Symmetry 15 00895 g006
Figure 7. Experimental result of Brazilian disk with single flaws (α = 45°), (a) before loading, (b) crack initiation, (c) crack propagation, (d) progressive failure, (e) crack sketch.
Symmetry 15 00895 g007
Figure 8. Experimental result of Brazilian disk with a single flaw (α = 75°), (a) before loading, (b) crack initiation, (c) crack propagation, (d) progressive failure, (e) crack sketch.
Symmetry 15 00895 g008
Figure 9. The ultimate failure mode of the intact specimen and pre-flawed specimens, (a) intact specimen, (b) α = 0°, (c) 15°, (d) 30°, (e) 45°, (f) 60°, (g) 75° and (h) 90°.
Symmetry 15 00895 g009aSymmetry 15 00895 g009b
Figure 10. Crack propagation type in Brazilian disc with a single flaw, (a) α = 0°, (b) 15°, (c) 30°, (d) 45°, (e) 60°, (f) 75° and (g) 90°.
Symmetry 15 00895 g010
Figure 11. Equivalent load curve.
Symmetry 15 00895 g011
Figure 12. Parallel bond model [30].
Symmetry 15 00895 g012
Figure 13. Comparison of test and simulation results, (a) uniaxial compression test, (b) Brazilian Split test.
Symmetry 15 00895 g013
Figure 14. Typical numerical model specimen.
Symmetry 15 00895 g014
Figure 15. The evolution laws of contact force and crack, (a) α = 0°, (b) 15°, (c) 30°, (d) 45°, (e) 60°, (f) 75° and (g) 90°.
Symmetry 15 00895 g015aSymmetry 15 00895 g015b
Figure 16. Evolution curve of crack number (α = 45°).
Symmetry 15 00895 g016
Figure 17. Evolution curve of crack number (α = 75°).
Symmetry 15 00895 g017
Figure 18. Relationship between peak load and flaw dip angle.
Symmetry 15 00895 g018
Figure 19. Energy evolution curve of single-flawed model, (a) main energy evolution, (b) dissipation energy evolution, (c) elastic strain energy evolution.
Symmetry 15 00895 g019
Figure 20. Damage variable evolution curves.
Symmetry 15 00895 g020
Table 1. Mechanical parameters of rock-like and sandstone specimens.
Material TypeSpecimen NumberSpecimen Diameter
(mm)
Specimen Height
(mm)
Density (g·cm−3)Peak Load (kN)Uniaxial Compressive Strength (MPa)Elastic Modulus (GPa)Poisson’s Ratio
Rock-like materialA−150.0199.712.2861.8031.502.800.22
A−249.9999.892.3157.5229.303.170.23
A−450.0299.922.2957.6129.263.120.24
SandstoneCS−149.8199.962.4359.5730.352.630.23
CS−250.95100.082.4657.8529.482.700.21
CS−350.5100.112.5758.7729.952.650.24
Table 2. Peak loads of disc specimens.
Material TypeSpecimen NumberSpecimen Diameter
(mm)
Specimen Thickness
(mm)
Density
(g·cm−3)
Peak Load (kN)Peak Deformation (mm)
Rock-like materialA−550.0325.212.366.2800.225
A−649.9525.342.347.0650.241
A−750.0125.182.317.6530.213
A−850.0424.962.327.0650.218
SandstoneCS−449.9624.952.516.6680.174
CS−549.9824.892.536.8740.155
CS−650.0425.672.547.8410.163
Table 3. Classification of the cracks contained in the ultimate failure mode for intact specimens and pre-flawed specimens.
Flaw Angle α (°)Tensile CrackTension Shear Mixed Crack
0a−1, a−2b−1
15a−1, a−2, b−1, b−2/
30a−1, a−2, b−2b−1
45a−1, a−2/
60a−1, a−2, b−1/
75a−1, a−2, c−1, c−2b−1, b−2
90a−1, a−2b−1
Table 4. The microscopic parameters used in the numerical model.
Particle ParametersSymbolValueParallel Bond ParametersSymbolValue
Minimum radius(mm)Rmin0.2Young’s modulus of the parallel bond (GPa)pb_Ec15
Ratio of radiusRrat2.5Ratio of normal to shear stiffness of the parallel bondpb_kn/pb_ks1.2
Young’s modulus of the particle(GPa)Ec15Parallel-bond normal strength (MPa)pb_sn18.9
Particle friction coefficientμ0.5Parallel-bond shear strength (MPa)pb_ss32
Table 5. Energy, crack number and damage variable of the single flawed disc model.
VariableData PointFlaw Angle α (°)
0153045607590
Crack numberPre-peak16070200541702522
Peak200150310100250100165
Post-peak26025046048330270300
Elastic strain energy (kJ)Pre-peak11304249.13615.816
Peak13.53743.749.837.216.917.2
Post-peak14394549.837.917.518.1
Dissipation energy (kJ)Pre-peak23.25.33.14.91.51.3
Peak35.29.15.58.84.13.4
Post-peak61122142614.815.4
ZtPre-peak0.330.290.240.220.190.110.08
Peak0.50.470.410.390.340.280.22
Post-peak1111111
Disclaimer/Publisher’s Note: The statements, opinions and data contained in all publications are solely those of the individual author(s) and contributor(s) and not of MDPI and/or the editor(s). MDPI and/or the editor(s) disclaim responsibility for any injury to people or property resulting from any ideas, methods, instructions or products referred to in the content.

