Article

SMCEWS: Binary Robust Multicentre Features

College of Mechatronics and Control Engineering, Shenzhen University, Shenzhen 518060, China
*
Authors to whom correspondence should be addressed.
Symmetry 2023, 15(4), 809; https://doi.org/10.3390/sym15040809
Submission received: 19 January 2023 / Revised: 18 March 2023 / Accepted: 22 March 2023 / Published: 27 March 2023
(This article belongs to the Section Computer)

Abstract

:
The Oriented FAST and Rotated BRIEF (ORB) algorithms have been improved, and a new method for calculating descriptors based on symmetrical multicentric weighted binary encoding is proposed, which enhances the robustness of feature points. This method employs a string of binary descriptors to encode the features and uses the multiple descriptor centre strategy to sample descriptors at the feature point and on the symmetrical circumference around it. Furthermore, a weighted summation is introduced in the descriptor calculation process to address the noise in the image during the sampling process. Specifically, the pixel values around the sampled point and the sampled point itself are combined using a certain weight to produce the final pixel value of the sampled point. The reliability of the descriptor is enhanced by introducing the pixel information around the sample point while solving the noise problem. Our method makes full use of the pixel information in the various parts of the descriptor sampling region to improve the distinguishability of the descriptors. We compare it with the ORB algorithm and experimentally show that the feature extraction method achieves better matching results with almost constant computation time.

1. Introduction

Feature points are widely used in many vision fields, such as recognition, stitching, three-dimensional reconstruction [1,2,3], localisation, and tracking. They are a research hotspot for many scholars around the world.
Conventional vision-based simultaneous localisation and mapping techniques [4,5,6] acquire data streams through image sensors to perform positional inference of mobile devices. In addition to the ability of image sensors to obtain various types of information such as texture, colour, etc., their cost is cheaper than radar. VSLAM has received much attention in multiple fields by this advantage and has become an academic research hotspot [7]. VSLAM is mainly divided into VSLAM based on the feature point method [8,9,10], VSLAM based on the direct method [11,12,13], and VSLAM based on deep learning [14,15,16]. VSLAM, based on the feature point method, extracts features from the input image, uses feature points as the identity information of each frame, and then uses them to match between images to obtain relevant positional information and construct maps. Among them, developing feature points is crucial to advancing VSLAM based on the feature point method.
In 1999, Lowe et al. [17]. proposed the Scale Invariant Feature Transform (SIFT) image feature extraction method, a milestone in developing feature extraction algorithms. The excellent performance of its descriptors has been widely used in various computer vision fields and has greatly stimulated the development of feature points. For example, SURF [18] uses Haar wavelets to approximate the gradient operation in SIFT to boost the speed. DAISY [19] is used for further speedups on SIFT’s chunking strategy. Ref. [20] found that the use of support vector machines to select features improves model accuracy. Moreover, the SFM based on SIFT features achieves an accurate mapping function offline. In addition, BRIEF [21] uses random points of neighbourhood images to binary encode grayscale comparisons, allowing a new stage of development in constructing descriptors for feature points. Compared with HOG descriptors, binary descriptors are fast to match and have low memory consumption, which has high scientific value. The mainstream binary descriptors nowadays also include ORB [22], BRISK [23], FREAK [24], etc. The feature points using binary descriptors have faster computational power and can better meet the real-time performance of SLAM.
In 2015, ORB-SLAM [25] proposed a monocular SLAM method based on ORB feature points. ORB feature points use FAST [26] to extract corner points and BRIEF to compute descriptors of feature points. ORB feature extraction algorithm uses binary descriptors of feature points with faster computational power, which can better meet the real-time performance of SLAM. Afterward, an improved version of ORB-SLAM2 [27] supporting monocular binocular and RGB-D cameras was proposed based on ORB-SLAM again in 2017, and ORB-SLAM3 [28] supporting multiple camera models, IMU sensors, and multiple map management systems were proposed based on ORB-SLAM2 again in 2019. ORB descriptors are the most common descriptor extraction method in the VSLAM field at present.
In this paper, we studied a more stable and interpretative descriptor for image matching in VSLAM based on the reliable open-source corner point finding schemes available today, starting from descriptor construction. The rest of this paper is organised as follows: Section 2 describes the binary encoding, the sampling distribution pattern of descriptors, the way descriptors are encoded, and the way sampled points are weighted by their gray values. In Section 3, we first investigate the sampling distribution of descriptors, the description centroid, the encoding method, and the sampling neighbourhood separately through cross-sectional experiments and then compare the recall rate and the number of correct matching points between ORB and our proposed algorithm through longitudinal experiments. Finally, in Section 4, we present our conclusions.

2. Method

2.1. Binary Encoding

A binary descriptor’s kernel encodes information about the neighbourhood grey pixel values of key points, summarising their characteristics into a string of binary codes. Our descriptors are encoded similarly to the previous BRIEF descriptors and BRISK descriptors. We took a block of images S × S (S = 61) centred on the key point, compared the magnitudes of the grey values of the two corresponding pixel points within the image block, and encoded them with either 0 or 1 as follows:
τ ( p : x , y ) : = { 1 : p ( x ) < p ( y ) 0 : p ( x ) p ( y )
where τ ( p : x , y ) is the binary encoding of the pairs of points represented by pixel points x and y within the image block, and p ( x ) is the grey scale value of pixel point x on the image. Taking into account the speed of descriptor computation and matching accuracy, we selected n ( n = 256 ) pairs of pixel points in the image block and repeated the comparison of Equation (1) to form a string of length n binary vectors f n ( p ) :
f n ( p ) : = 1 i n 2 i 1 τ ( p : x i , y i )

2.2. Patterns of Sampling Distribution of Descriptors

In this paper, we used a fixed sampling point model, and the first step required the study of the sampling distribution and description centroid. The sampling distribution refers to the number of sampling points used in the image block with feature points as the domain. The description centres are divided into 16, and the encoding method of each description centre is the HOG histogram statistics [17].
We first investigated the sampling distribution. Since the descriptor was applied to the corner key points, there was a particular pattern in the pixel values of the neighbourhood image block with the corner key points as the centre. As shown in Figure 1, when the sharp corner is used as the centre of the pixel block, a pixel value comparison between the centre point and the point on the red line around the circle shows that the centre point is larger than the value on the red line, and the descriptor code is 0. A comparison with the point on the green line around the circle gives the descriptor code 1, and the red and green lines are continuous at this time, indicating that there are consecutive 0 s and 1 s.
The same obtuse angle key point has a similar pattern. The green line around its circumference is longer than the acute angle, and this point is more valuable as a feature point than other points. Whether you use the Harri [29] or the FAST to find this point, you are, in a sense, using the critical information that this point carries that other points do not. The centre point has a constant value, and the description of the centre point (compared with other neighbouring pixels) cannot be discarded. However, neither BRISK nor ORB makes good use of the value of centroids. Additionally, the process of using greedy search to reduce the correlation also breaks the grayscale distribution pattern in the corner point image block.
Two sampling distribution models were designed in this project to explore the value of centroids. One is the idea of plain symmetric uniform distribution, and the other is the idea of symmetric circular distribution borrowed from FAST-12 corner points and BRISK descriptors, as shown in Figure 2.
In the symmetrical uniformly distributed sampling model, an extreme strategy is applied to shift the description centre of gravity to the centre entirely. The centre point is compared pixel-wise with the remaining 256 points (a total of 256 point pairs are reached), and the 256 results obtained from the comparison are coded and stitched together.
In the symmetrical sampling mode of circular distribution, to calculate the binary vector f n ( p ) , we need to sample the pixels on the image block. The sampling strategy for the circular distribution takes the feature point as the centre of the circle and samples points on the circumference of the circle with different radii, and the following equation determines the coordinates of the sampling point ( a , b ):
( x a ) 2 + ( y b ) 2 = R , R = 2.9 f , 4.9 f , 7.4 f , 10.8 f
α = ( n u m × 2 π N u m s i ) , n u m ( 0 , N u m s i ) , i [ 1 , 4 ]
P x = R × cos α , P y = R × sin α
where Equation (3) is the equation of the circumference of the sampling point; R is the radius of the rim, f = 1.39 ; α is the angle of the sampling point on the circumference; n u m refers to the n u m th sampling point of each circumference; N u m s i is the number of sampling points of the i th circumference, N u m s 10, 14, 16, 20. The circumference distribution pattern is shown in Figure 3.
After obtaining the sampling distribution pattern, the next step is determining the location of the description focus and the encoding method. The single description centre of gravity ultimately puts the information description of corner points on one point, and its robustness is not high enough. Therefore, multiple description centres of gravity are one of the keys to constructing the descriptors in this paper. First, the corner point as the centre is needed as the description centre of gravity. In addition, we selected six description centres of gravity evenly on the third circumference from inside to outside to describe the information of neighbouring image blocks other than the centre point, as shown in Figure 4.

2.3. Coding of Descriptors

After confirming the location of the description centroids, the description centroids need to be encoded. We used two encoding methods for comparison to investigate how to construct the descriptors.
The first is a parity coding algorithm in the original neighbourhood without increasing the sampling points.
(1)
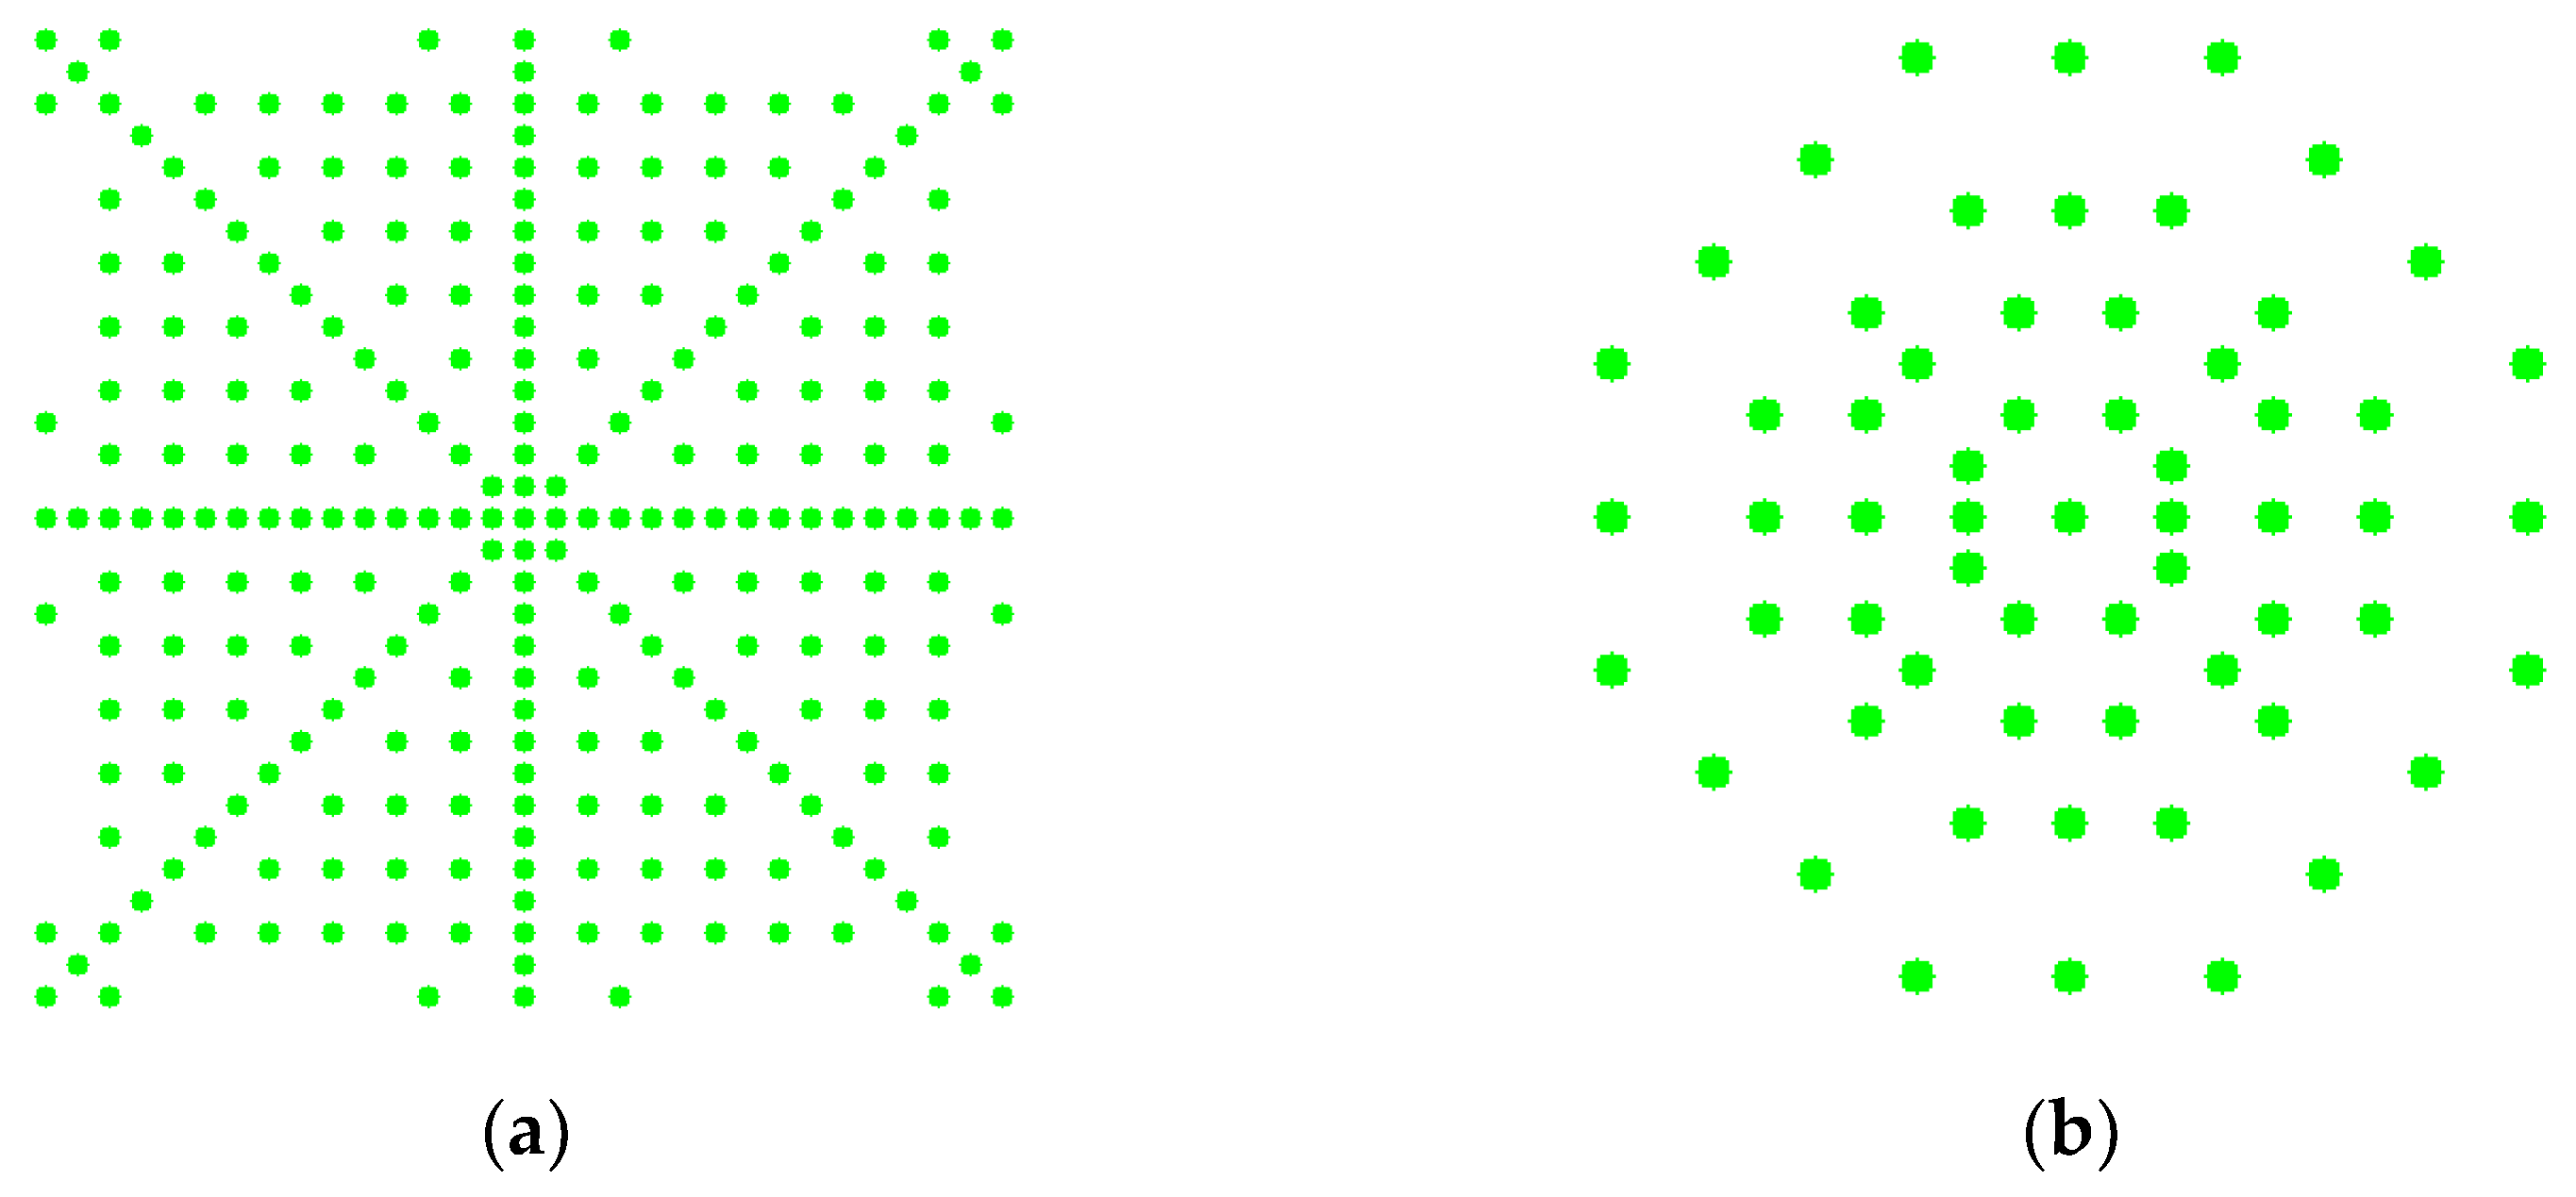
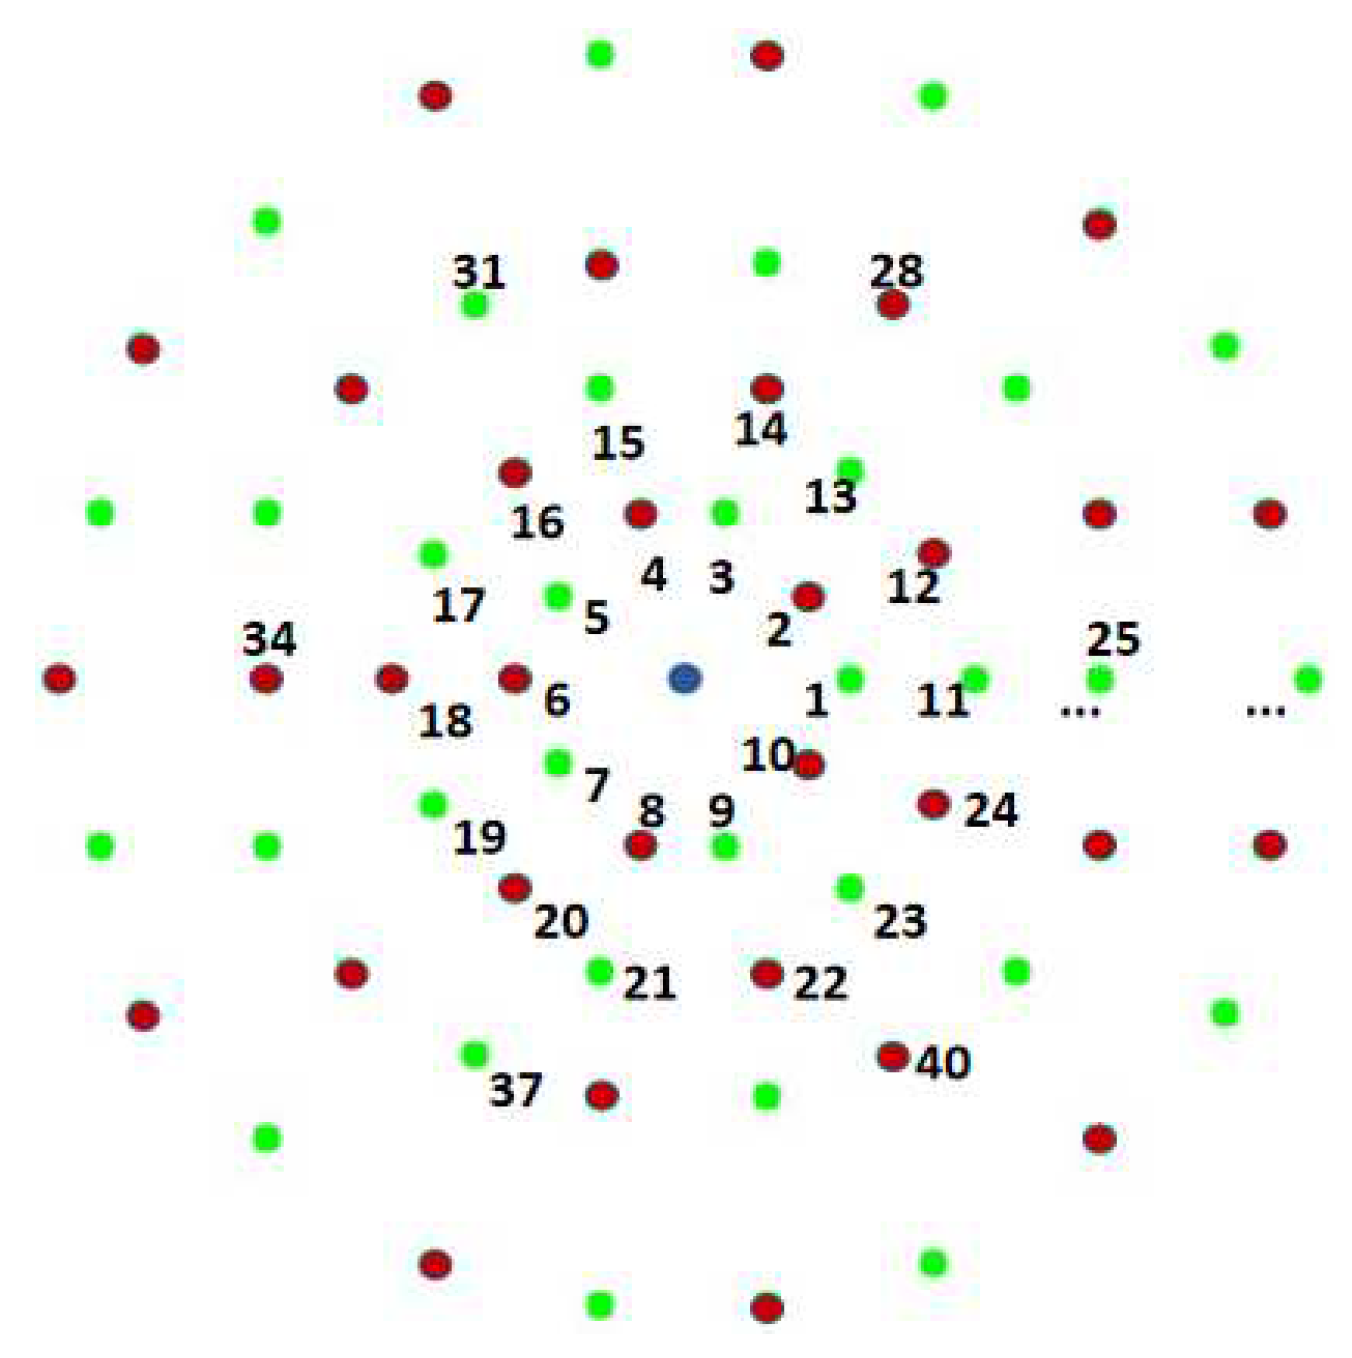
First, all the points except the centre point are given a serial number and divided into odd and even points, as shown in Figure 5.
(2)
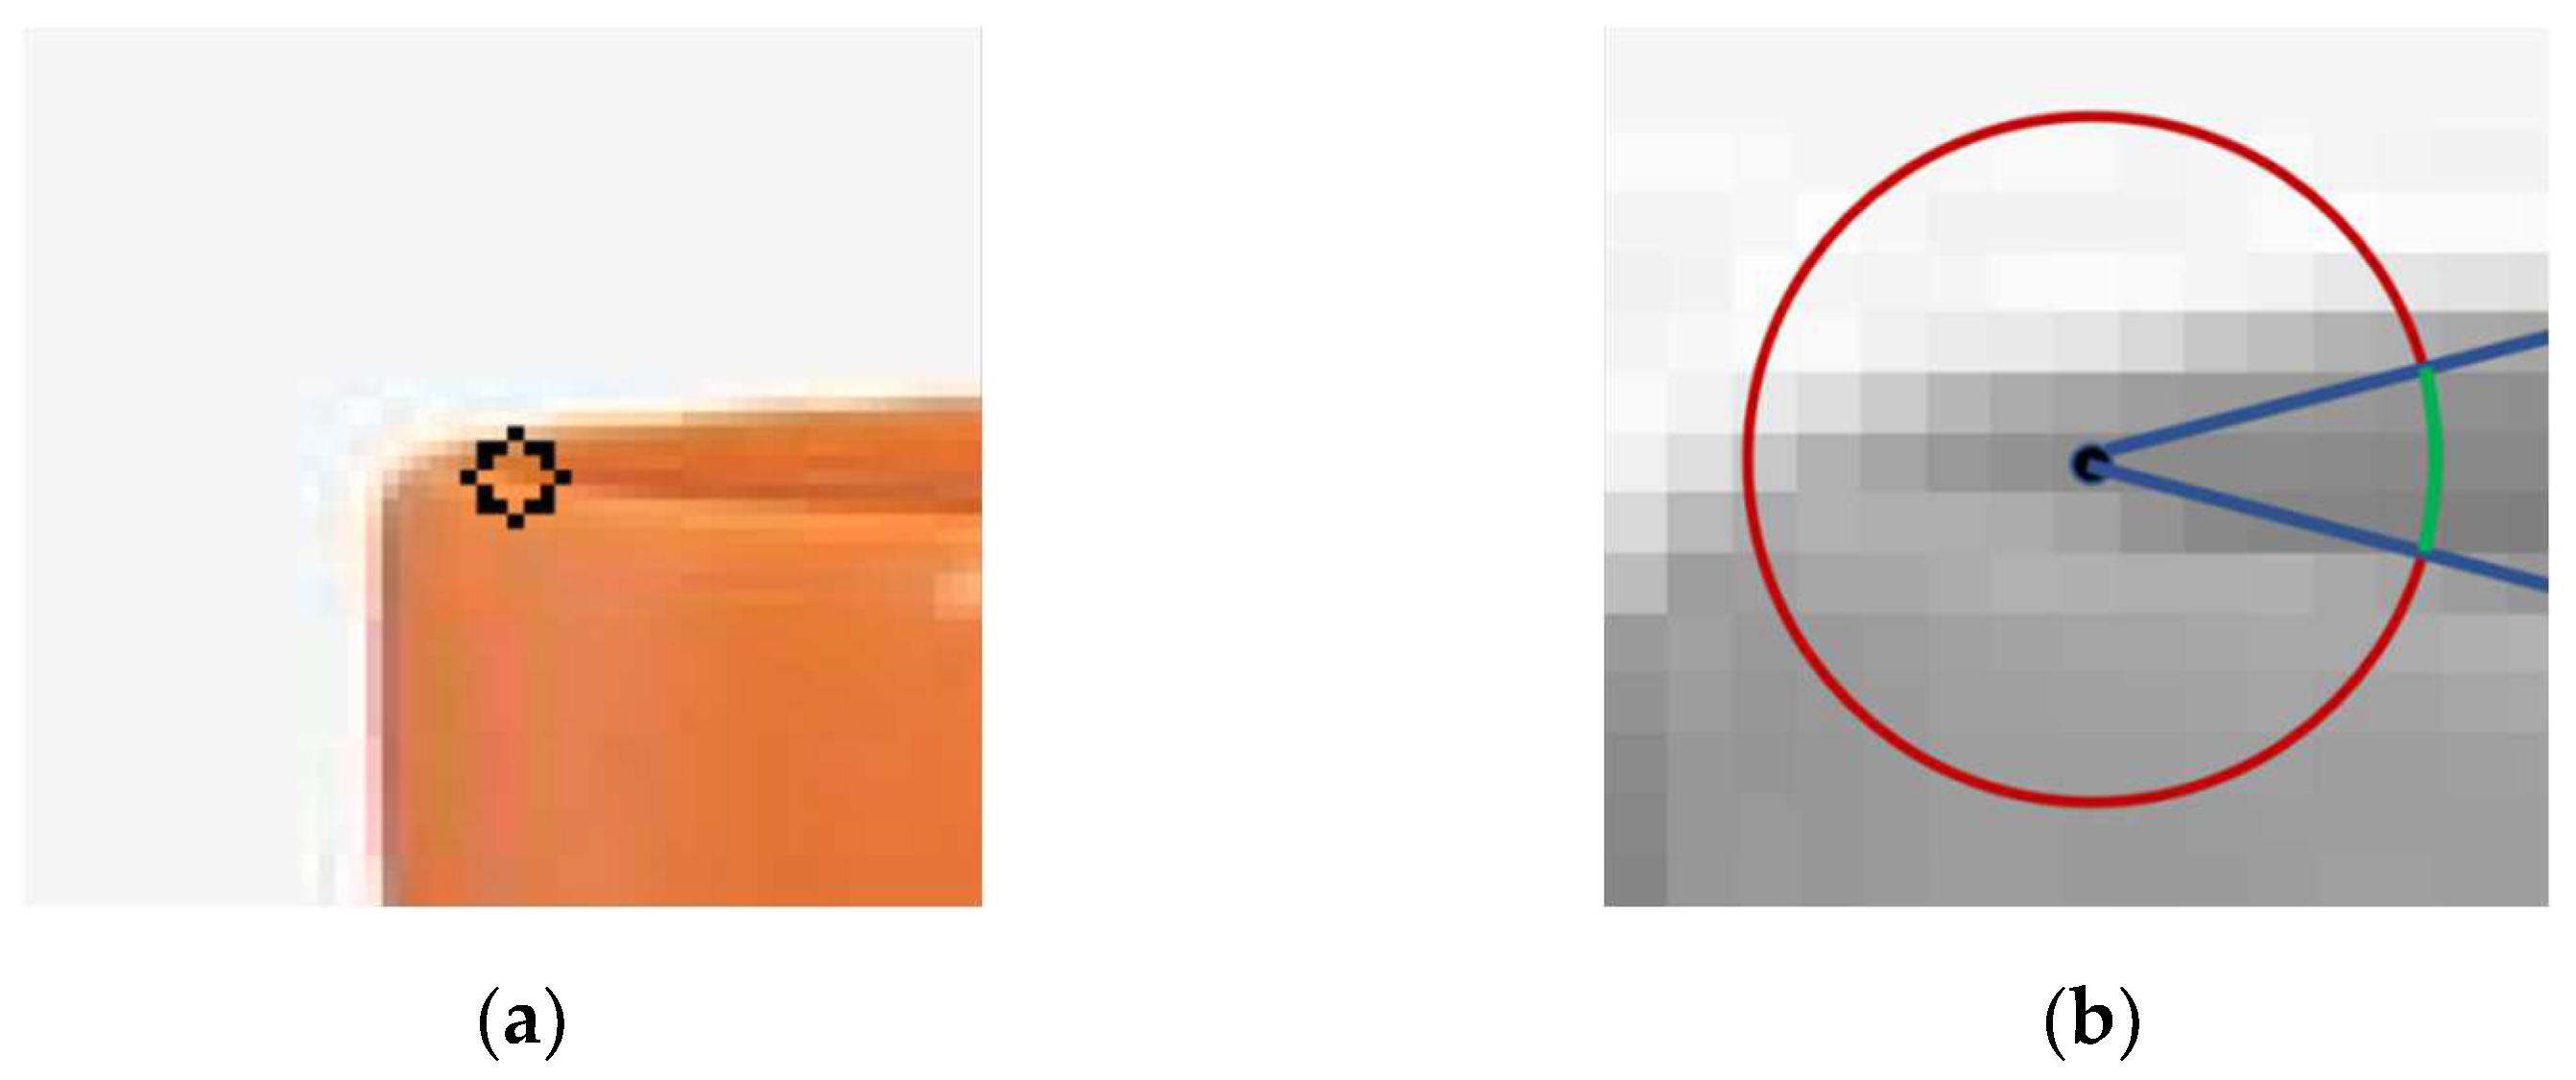
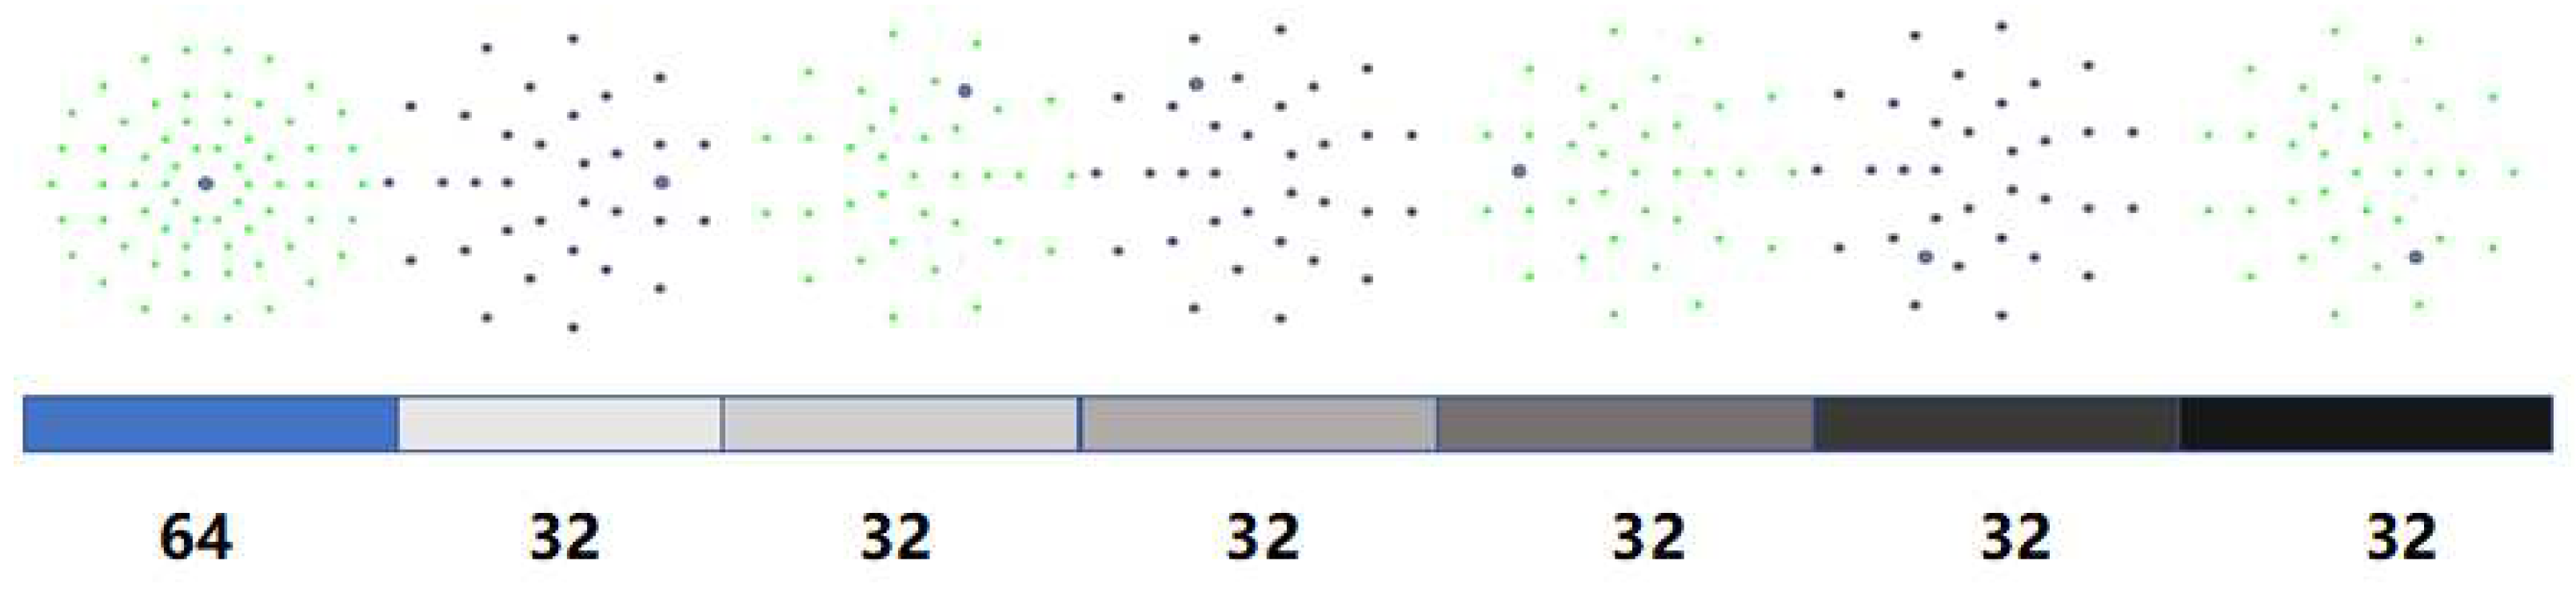
Firstly, the grey pixel value is compared using the centre point (blue point) with the points with serial numbers from 1 to 64, in order from smallest to largest, as shown in Equation (1) (where x is the coordinate of the centre point and y is the coordinate of the other points). A 64-dimensional binary string is obtained.
(3)
The third circle, in turn, has been decided to describe the centre: 25, 28, 31, 34, 37, 40.
(4)
When the taken description centroid is odd, the grayscale pixel values are compared with all even numbered serial number points 2, 4,……, 64, in order from smallest to largest. When the description centroid is even, the pixel grayscale value is compared with all odd-numbered points 1, 3,……, and 63, from smallest to largest.
(5)
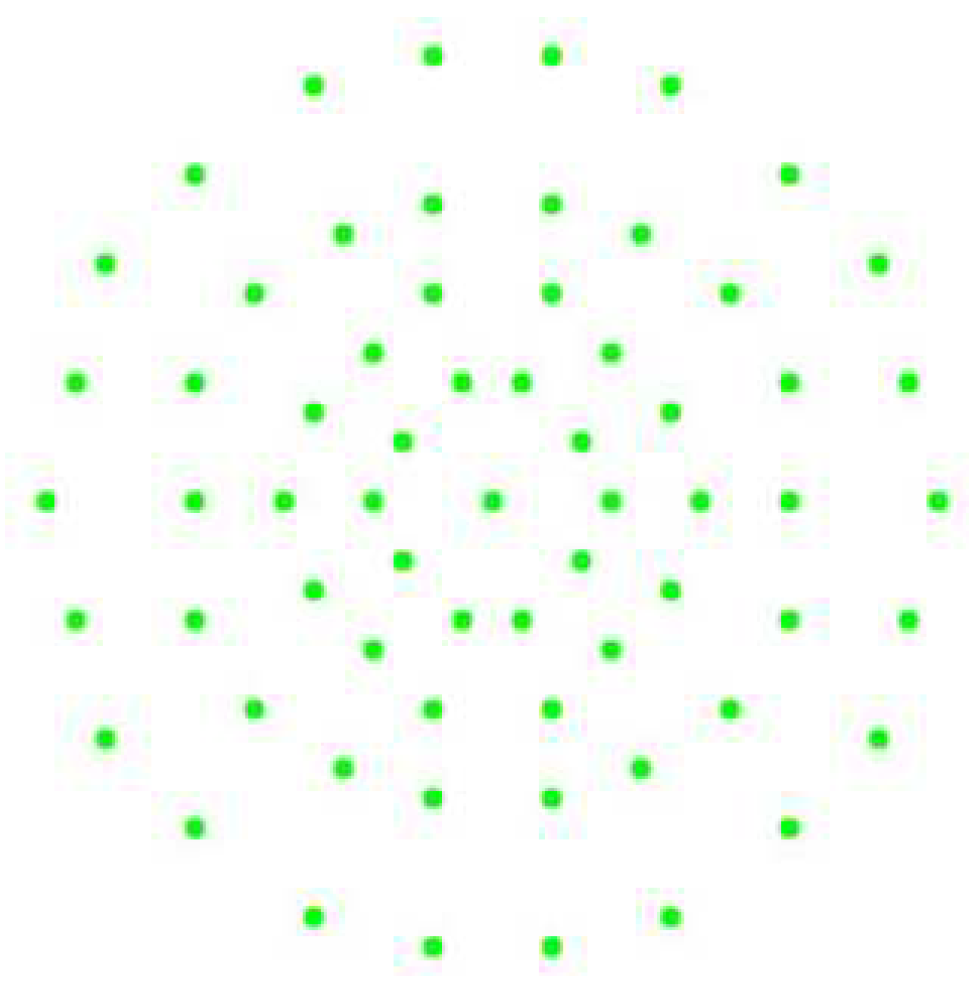
The 6 description centroids yield a total of 6 × 32-dimensional binary strings. The 64-dimensional binary string is spliced with the 64-dimensional binary string obtained from the previous main descriptor centre. A 256-dimensional binary descriptor is accepted, as shown in Figure 6.
The advantages of parity coding are minor memory consumption and fast sampling.
The second method is symmetric multicentre circumferential encoding, which adds one circumferential distribution sample for each description centroid. The purpose is to obtain more sampling points while extending the domain. Our specific operation is divided into four main steps as follows:
(1)
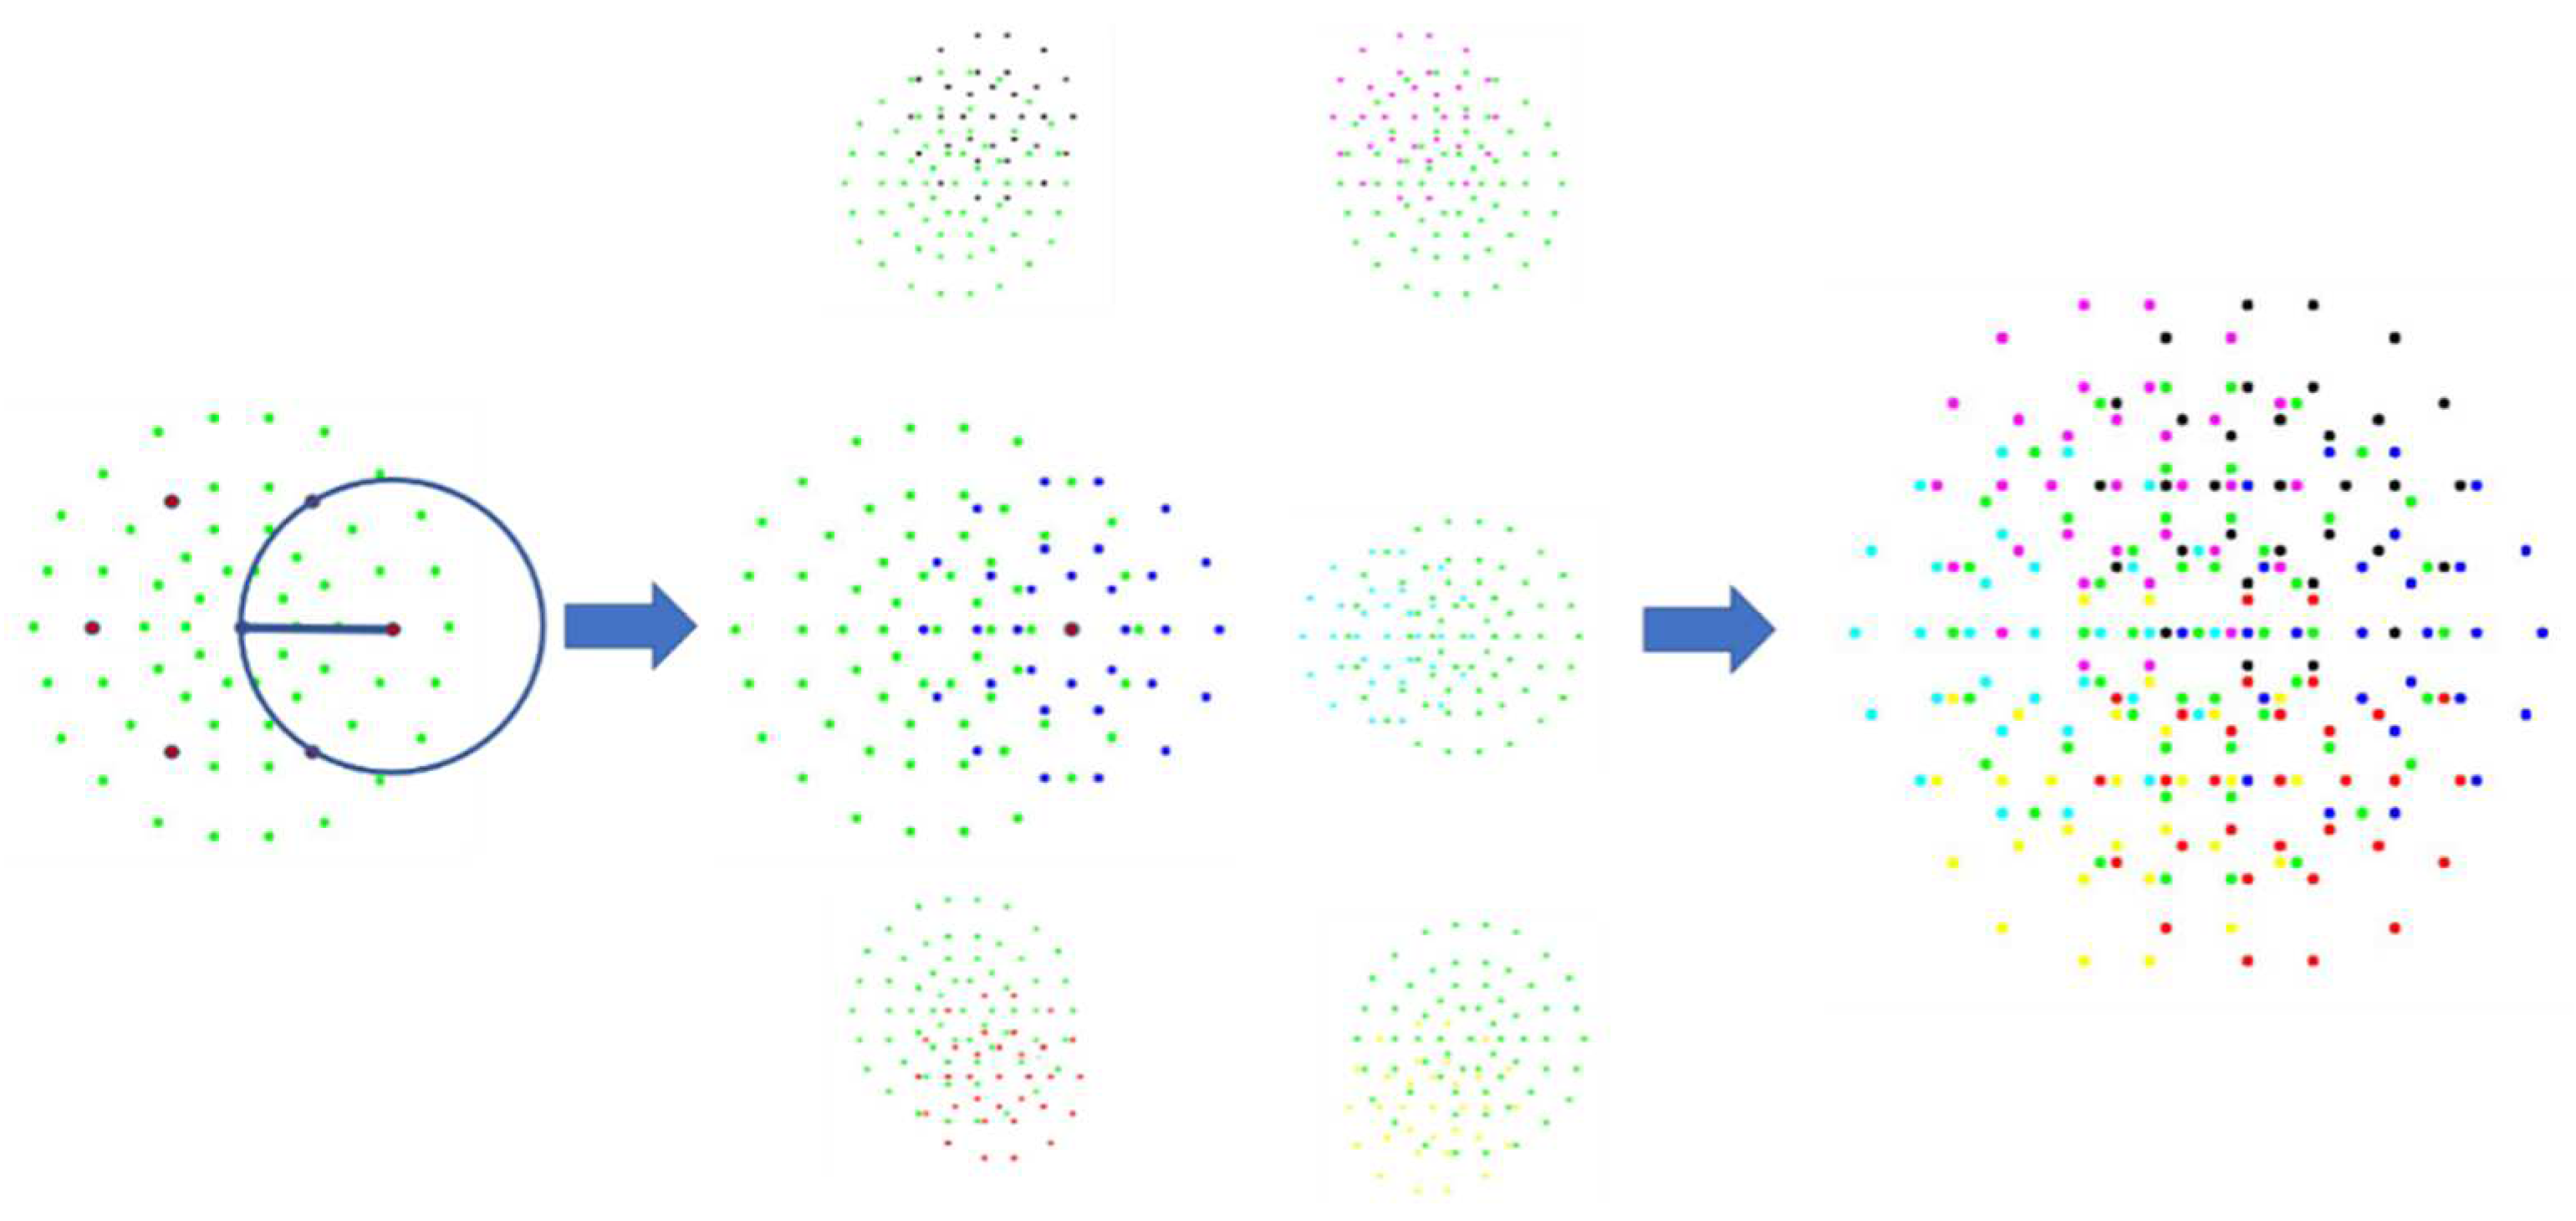
A 64-dimensional binary string is obtained by first comparing the pixel grayscale values with other sampled pixels using the centroids in descending order.
(2)
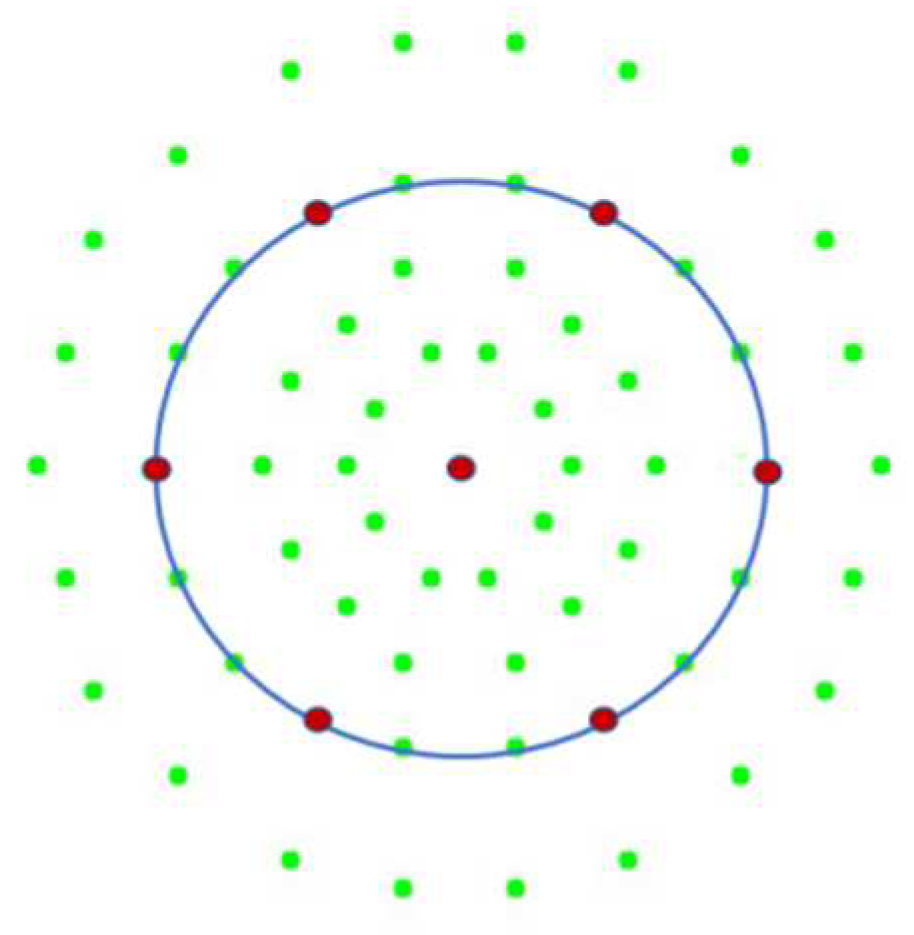
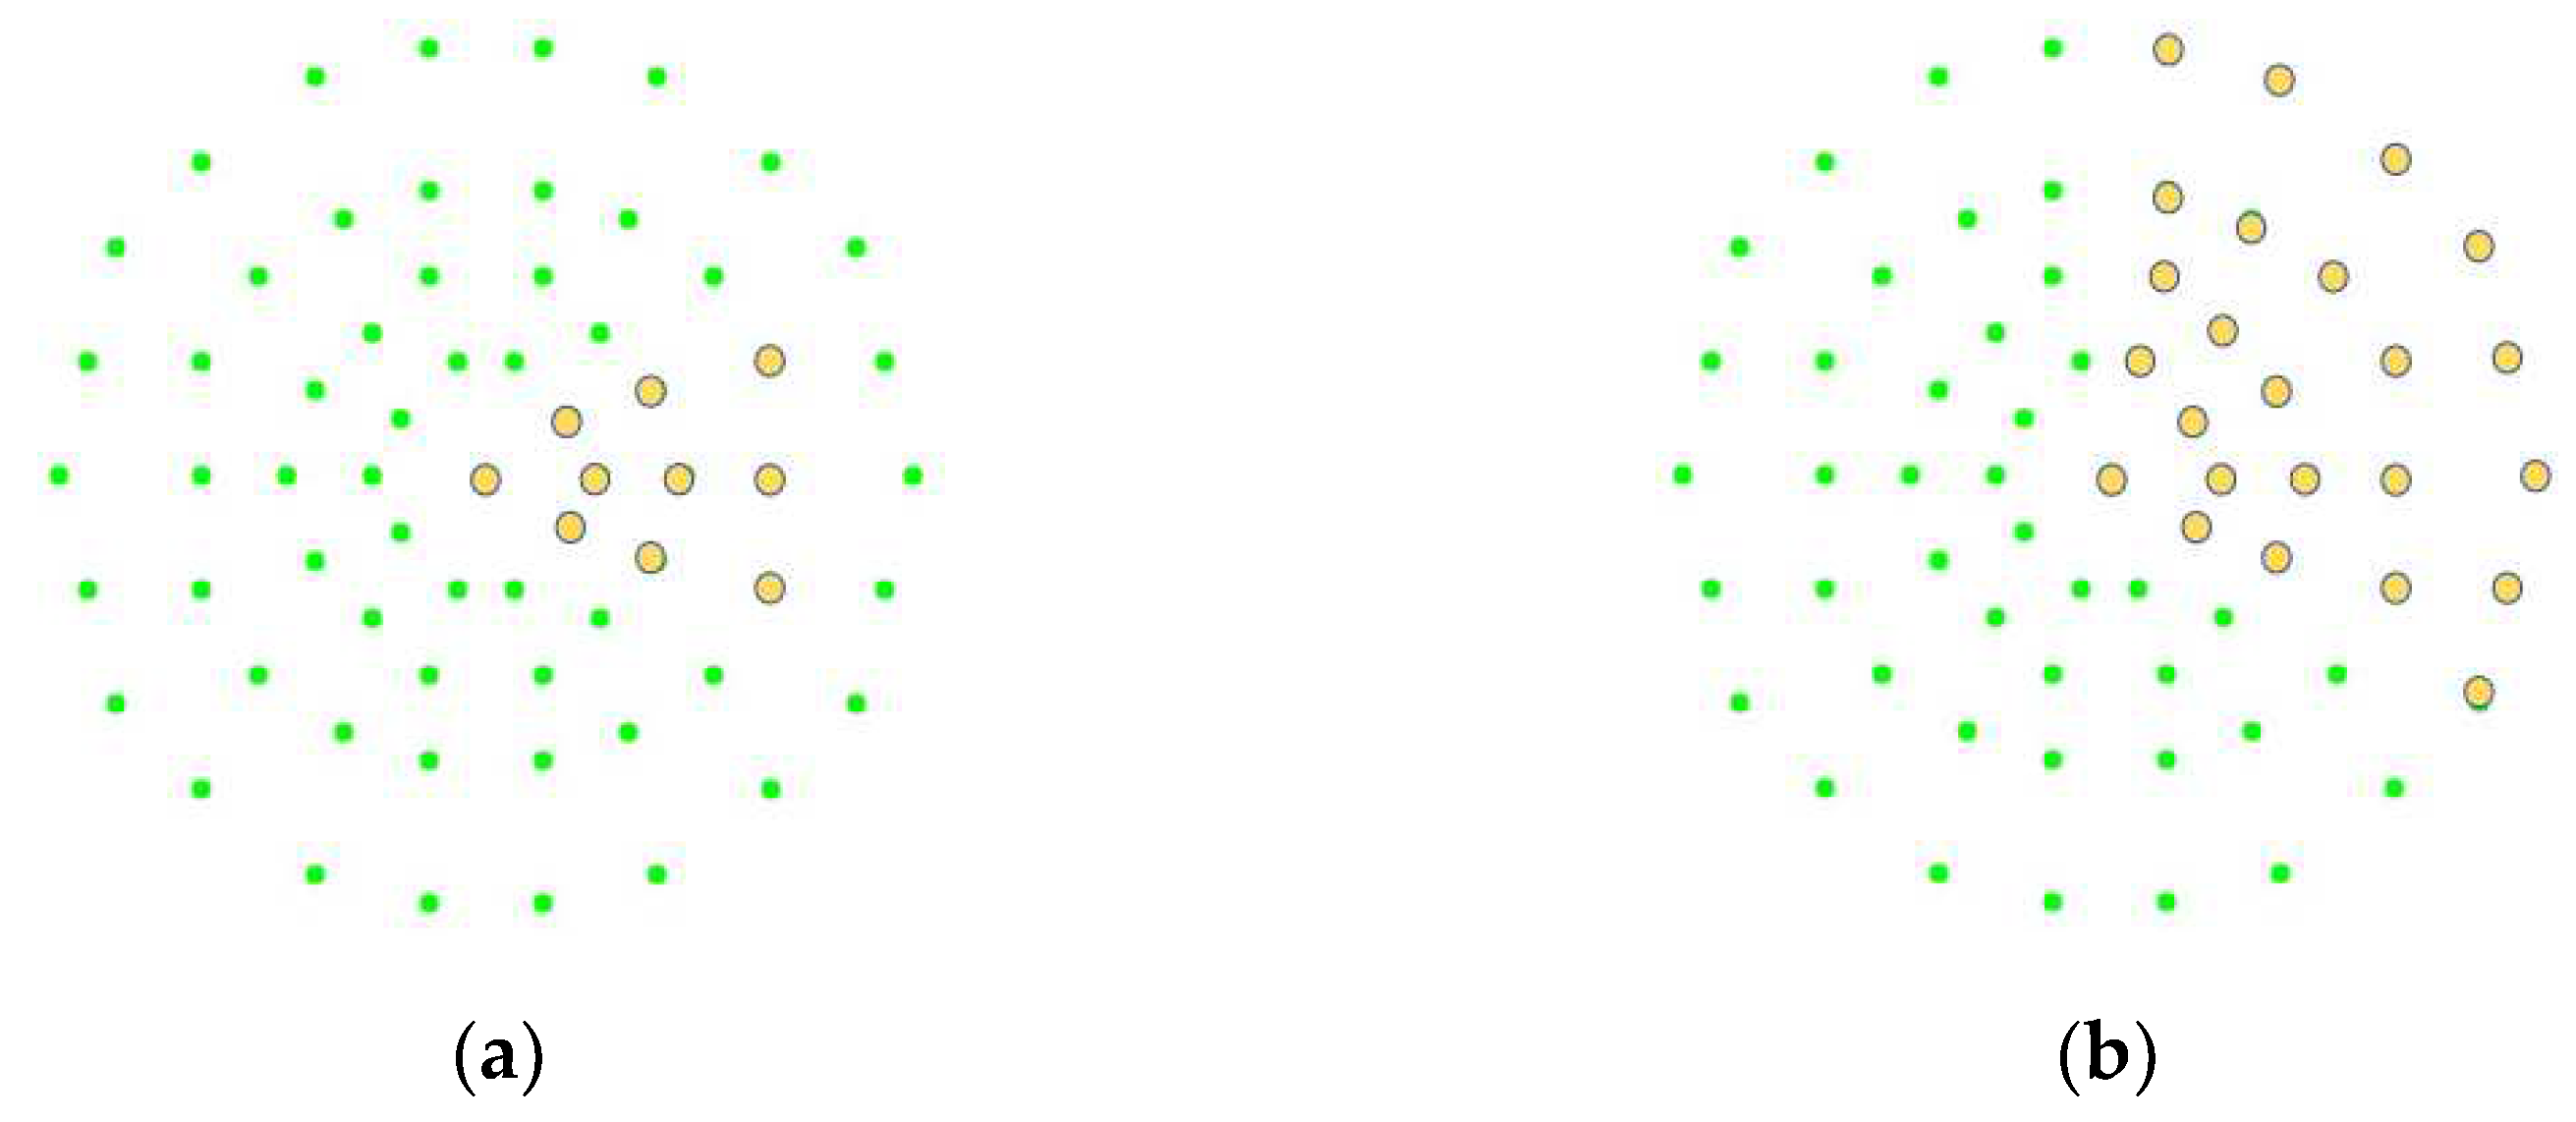
Then, six symmetric description centroids are taken in turn, and a circle is drawn with a radius from the centroid to the centre as the image block for each description centre.
(3)
Each symmetric circumferential sampling is performed in each image block, as shown in Figure 7.
(4)
The grayscale values of 32-pixel points obtained from each description center and symmetrical circumferential sampling are compared to obtain a total of the 6 × 32-dimensional binary string. Then the 64-dimensional binary string obtained from the previous main descriptor centre is concatenated to obtain a 256-dimensional binary descriptor.
Both symmetrical multicentre circumferential coding and parity coding initially depicted the shape of the corner while comparing the symmetrical circumferential distribution of the centroid points in the main description. At the same time, the appropriate neighbourhood can better describe its shape and express the correlation of the gray neighbourhood values, as shown in Figure 8, where the yellow dots are coded one, and the green dots are coded 0.
Symmetrical multicentre circumference coding is more in line with the chunked description strategy of SIFT than parity coding, where each image block has its sampling information. However, the binary coding method is still faster and has less storage than the HOG histogram statistical coding of SIFT. In addition, adding more sampling points and expanding the neighbourhood adds more information to the binary description. Its robustness and differentiation are improved with a little negative impact on speed and storage.

2.4. Weighted Grayscale Values of Sampling Points

To prevent some of the sampling points from being prominent noises or producing blending effects when fixed sampling, further processing of the sampling points is required. This paper uses a weighted summation scheme to obtain the grayscale values of the sampled points after processing. The weighted summation of the sampled points not only solves the noise problem but also adds more neighbourhood information and increases the descriptors’ reliability in comparing grayscale values. We adopted two different weighted summation strategies as follows:
p 1 ( x 1 , x 2 ) = ( A × I ( x 1 , x 2 ) + B × ( I ( x 1 1 , x 2 1 ) + I ( x 1 1 , x 2 ) + I ( x 1 1 , x 2 + 1 ) + I ( x 1 , x 2 1 ) + I ( x 1 , x 2 + 1 ) + I ( x 1 + 1 , x 2 1 ) + I ( x 1 + 1 , x 2 ) + I ( x 1 + 1 , x 2 + 1 ) ) ) / ( A + 8 B )
p 2 ( x 1 , x 2 ) = ( A × I ( x 1 , x 2 ) + B × ( I ( x 1 + 1 , x 2 1 ) + I ( x 1 + 1 , x 2 ) + I ( x 1 , x 2 1 ) ) ) / ( A + 3 B )
where p 1 and p 2 are the grayscale values obtained from the two weighted summation formulas; ( x 1 , x 2 ) are the coordinates of the sampled points; I is the grayscale value; and A , B are the assigned weights. The simultaneous use of two weighting summation formulas avoids employing one of the pixels multiple times in the sampling weighting of the neighbourhood. When the sampling point is the description centre point or the radius from the sampling point to its corresponding description centre is greater than 8 pixels, Equation (6) is used to calculate the grey value of the sampling point. Otherwise, Equation (7) is used to calculate the grayscale value of the sampling point.

3. Experimental Results

In this section, we compared the feature extraction and matching effects of several different descriptor sampling methods we propose. We also compare the best sampling method with the ORB feature extraction method. Our experiments in this section use the KAZE [30] dataset to evaluate the quality and localisation accuracy of feature detection and description matching. The dataset has a total of eight groups, of which four groups are taken, each with six images. The focus of each dataset is different, including perspective transformation, scale transformation, luminance transformation, rotation transformation, etc. During the experiment, three batches of two images were randomly and unduplicated extracted from a specific dataset (six images). These two images were extracted with an unlimited number of features and a limited number of 1000 points, and the features were matched. The number of correct matching points for the unrestricted number and the recall rate for the restricted number were recorded. Finally, the experimental results of the three batches of images were averaged. The experiment of limiting the number of points was performed because the number of feature points is often limited in the process of SLAM to improve real-time performance. The matching between features is generally based on the Euclidean distance to calculate the association distance, and then the decision is made by the association distance. The mainstream determination methods, mainly:
(1)
Set two Euclidean distance thresholds to determine whether two feature points match correctly. It is characterised by fast speed and low accuracy.
(2)
The Brute Force (BF) algorithm first performs the violent matching to obtain the matching points for the optimal solution for each feature point. Then the homography matrix is calculated by the RANSAC algorithm. Finally, the points on the correct match are obtained by reprojecting the homography matrix, characterised by slow speed and high accuracy.
Since the experiments in this section do not need to consider real-time performance but only to verify the performance of the descriptors, we used method 2.

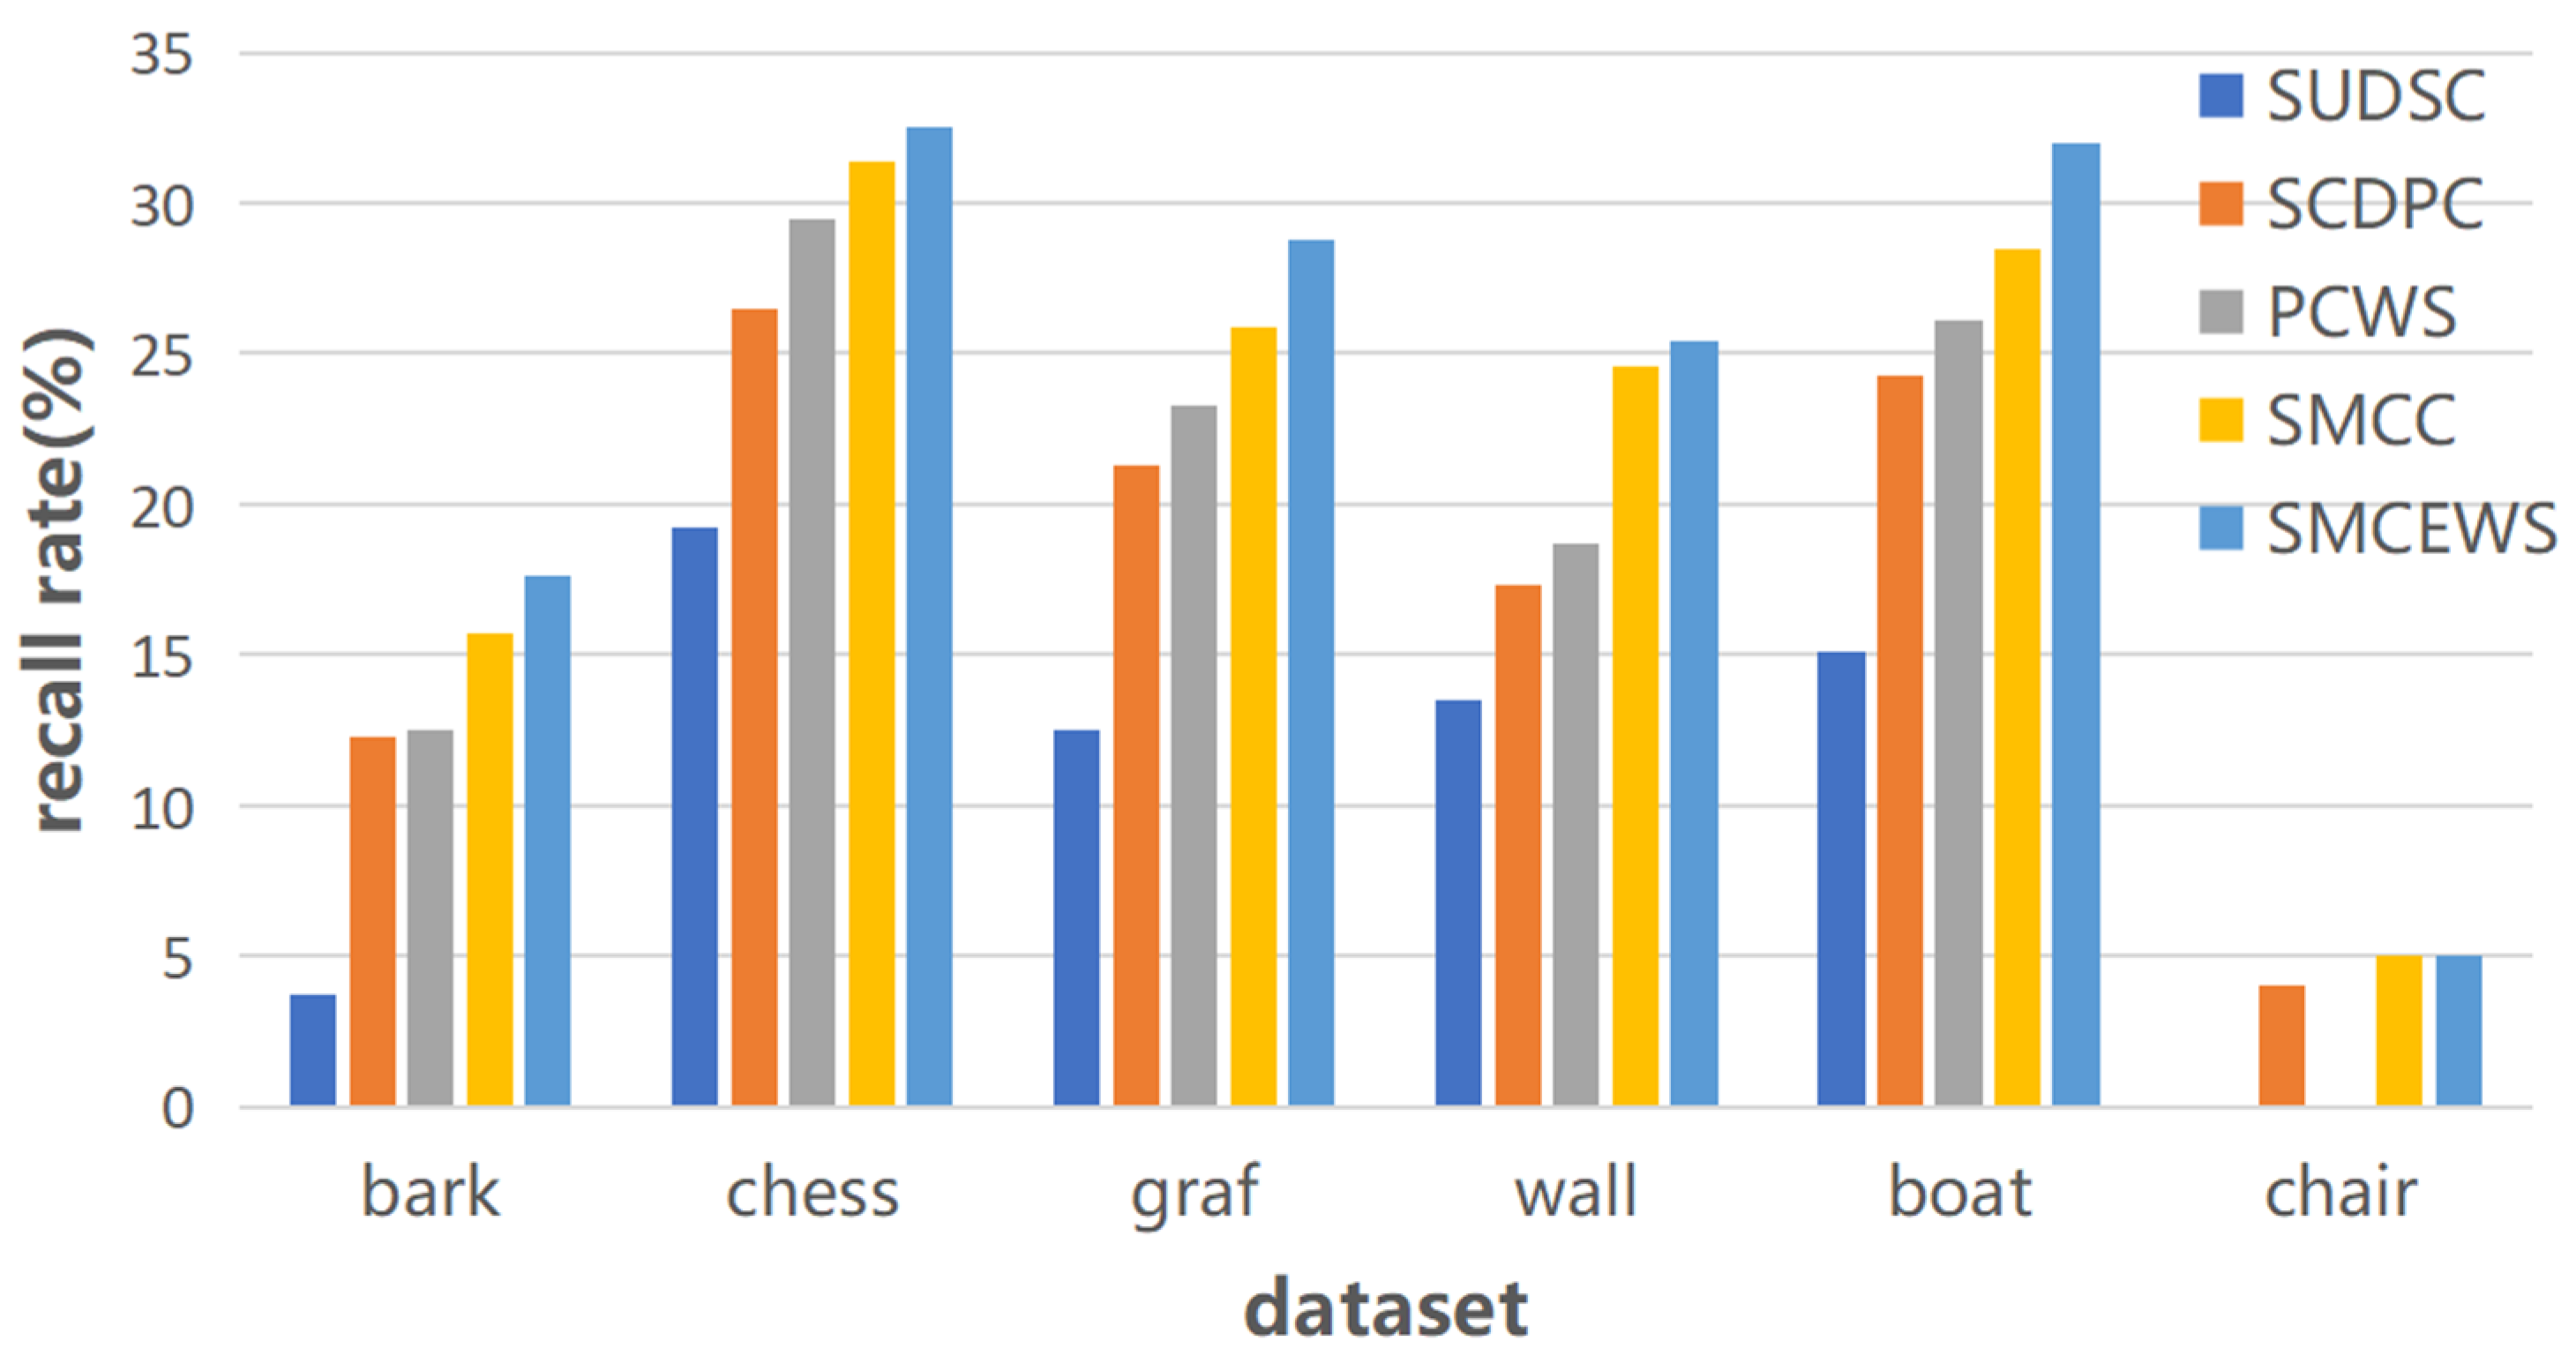
3.1. Comparison between Description Subsampling Methods

A cross-sectional experimental comparison was first performed to study the descriptor construction process. The experiments contain a total of five different descriptor encoding schemes: symmetrical uniformly distributed and single centroid (SUDSC), symmetrical circular distribution and parity coding (SCDPC), parity coding and weighted summation (PCWS), symmetrical multicentre circumferential coding (SMCC), and symmetrical multicentre circumference encoding with weighted summation (SMCEWS); the number of correct matching points is recorded without limiting the number, as well as the recall rate with restrict the number.
Table 1 shows the experimental results of several different descriptor coding methods, and we visualised the effects of various descriptor coding methods through histograms in Figure 9 and Figure 10. The scheme based on symmetrical multicentre coding with weighted summation has an average increase of 5500, 2516, 1950, and 648 in the number of correct points without limiting the number of feature points, and an average increase of 12.9%, 5.9%, 5.2%, 1.7% in the thousand-point recall rate, respectively, compared with the SUDSC, SCDPC, PCWS, and SMCC. The above experimental results verify the effectiveness of the symmetrical circular distribution strategy, the symmetric multi-description centre strategy, the symmetric multicentre encoding algorithm, and the weighted summation algorithm. The scheme SMCEWS performed the best in all experiments.

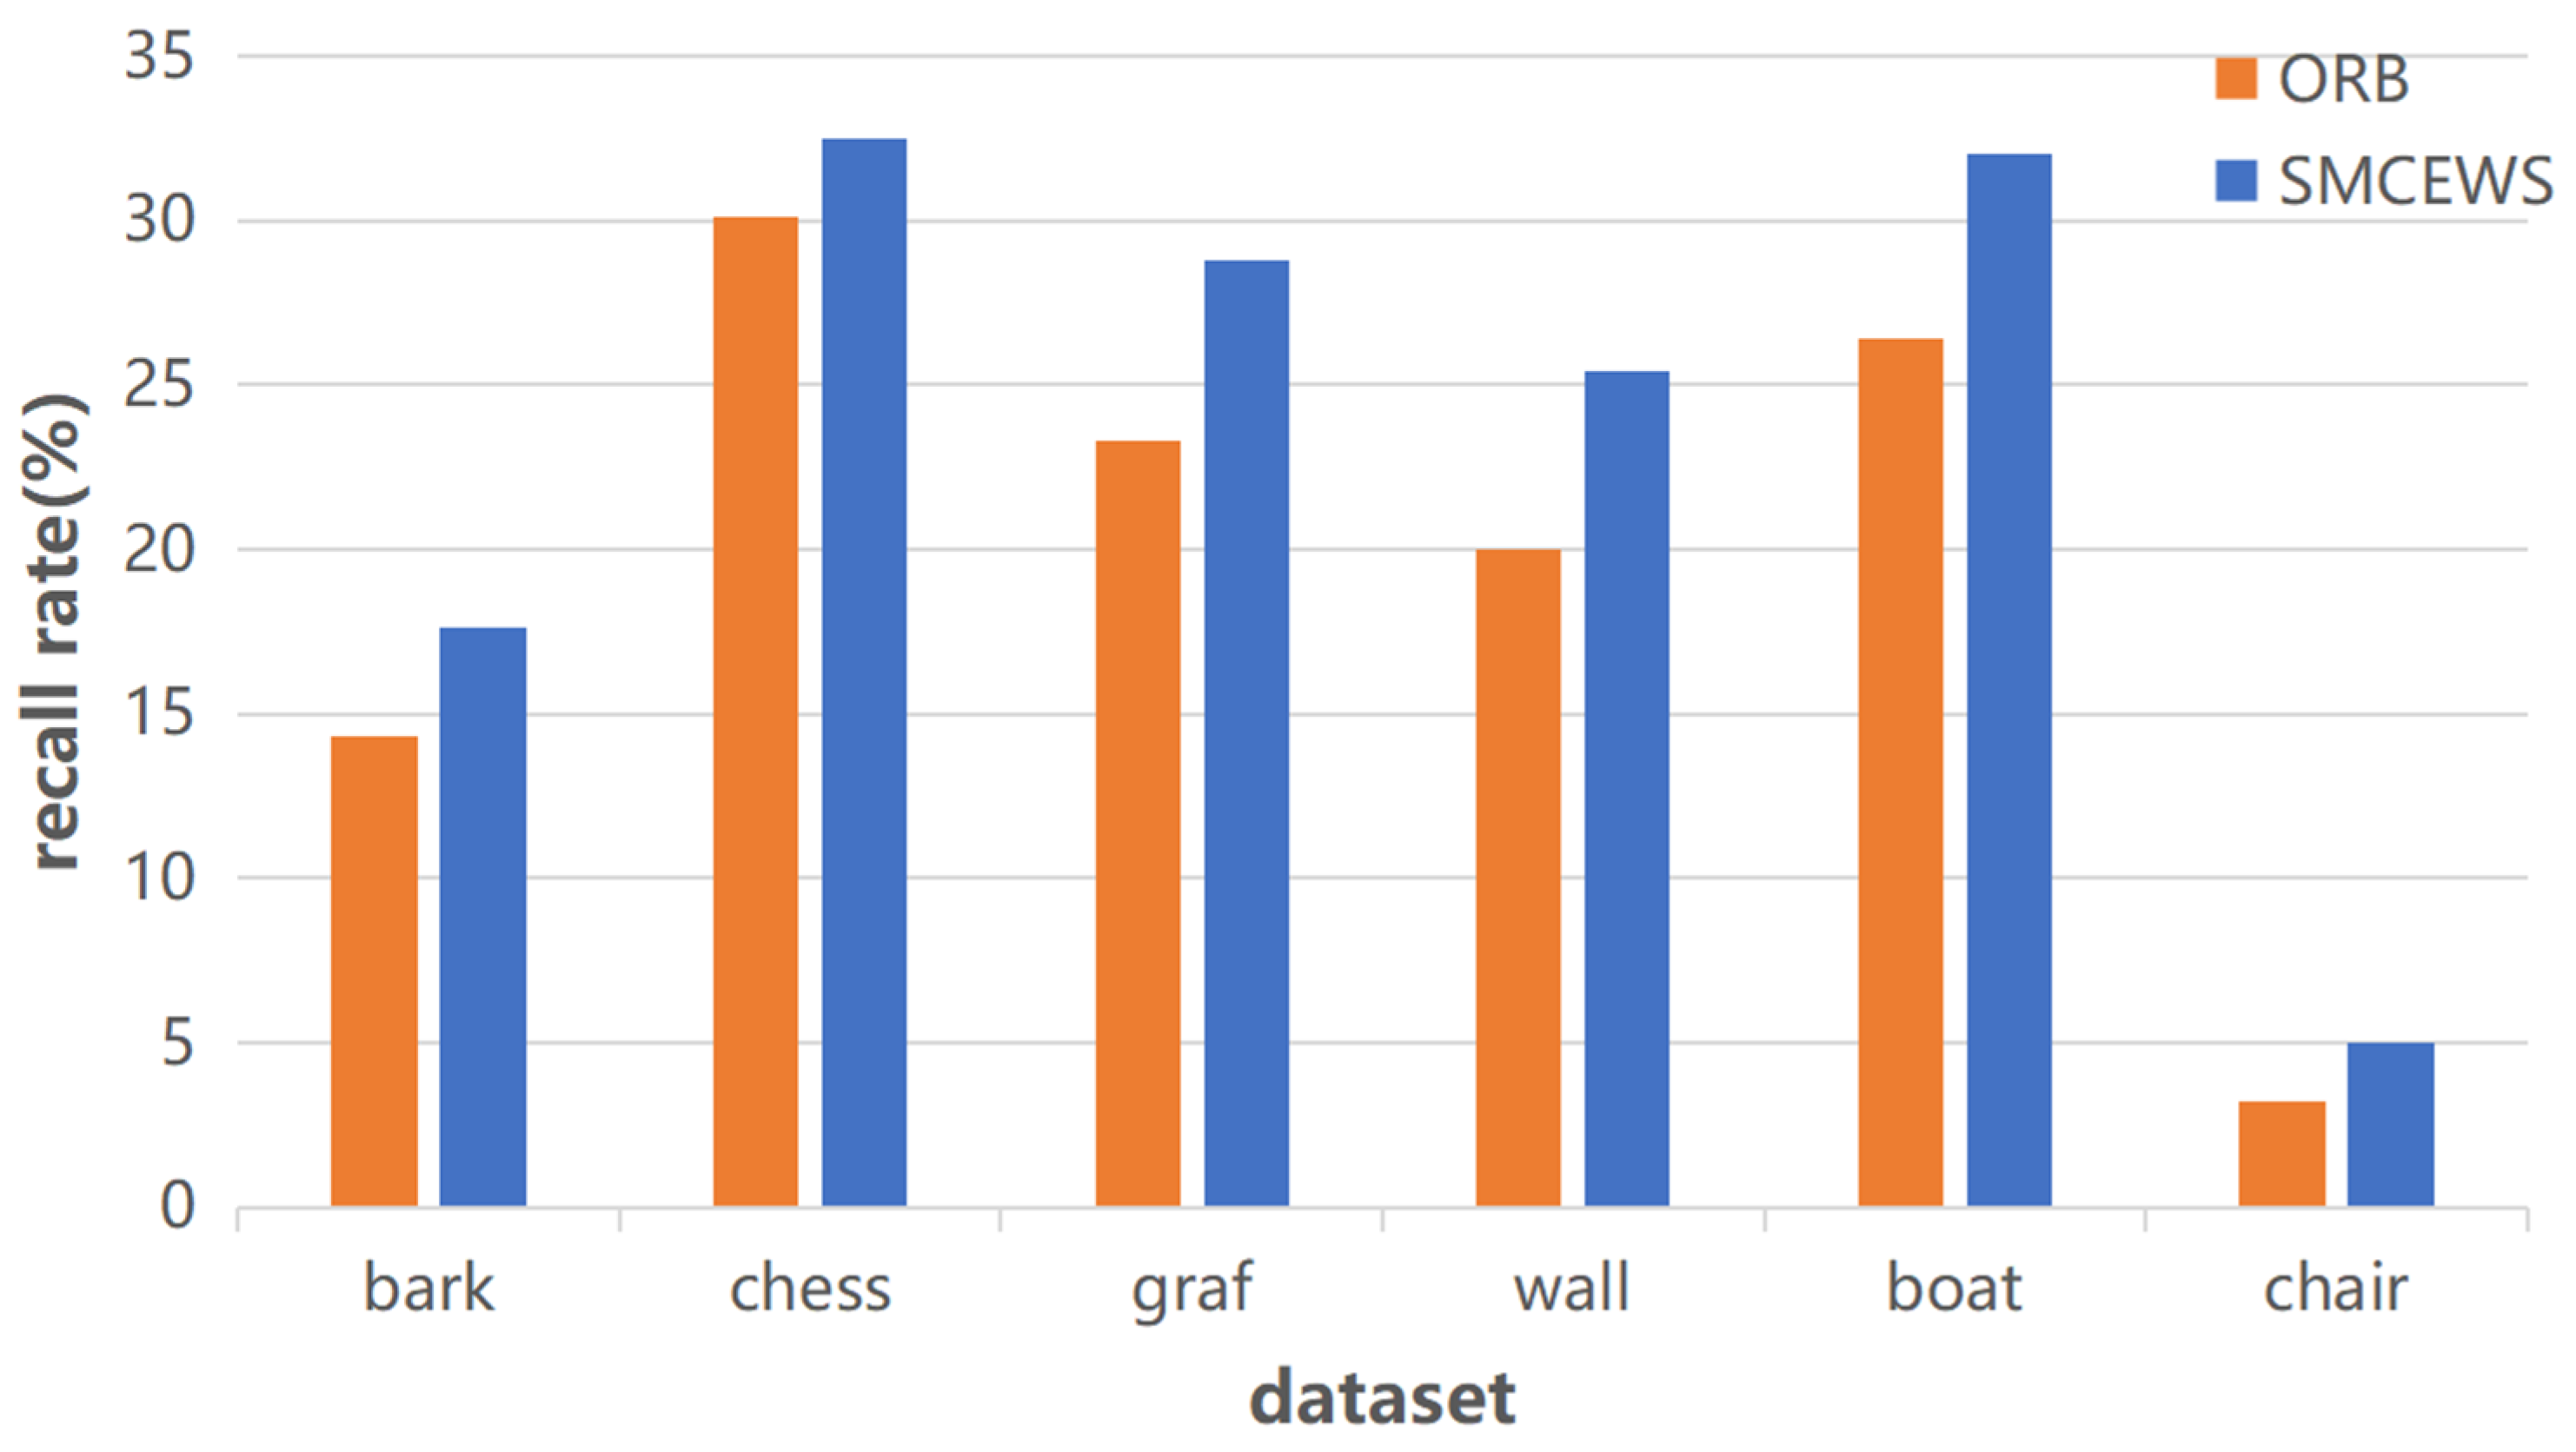
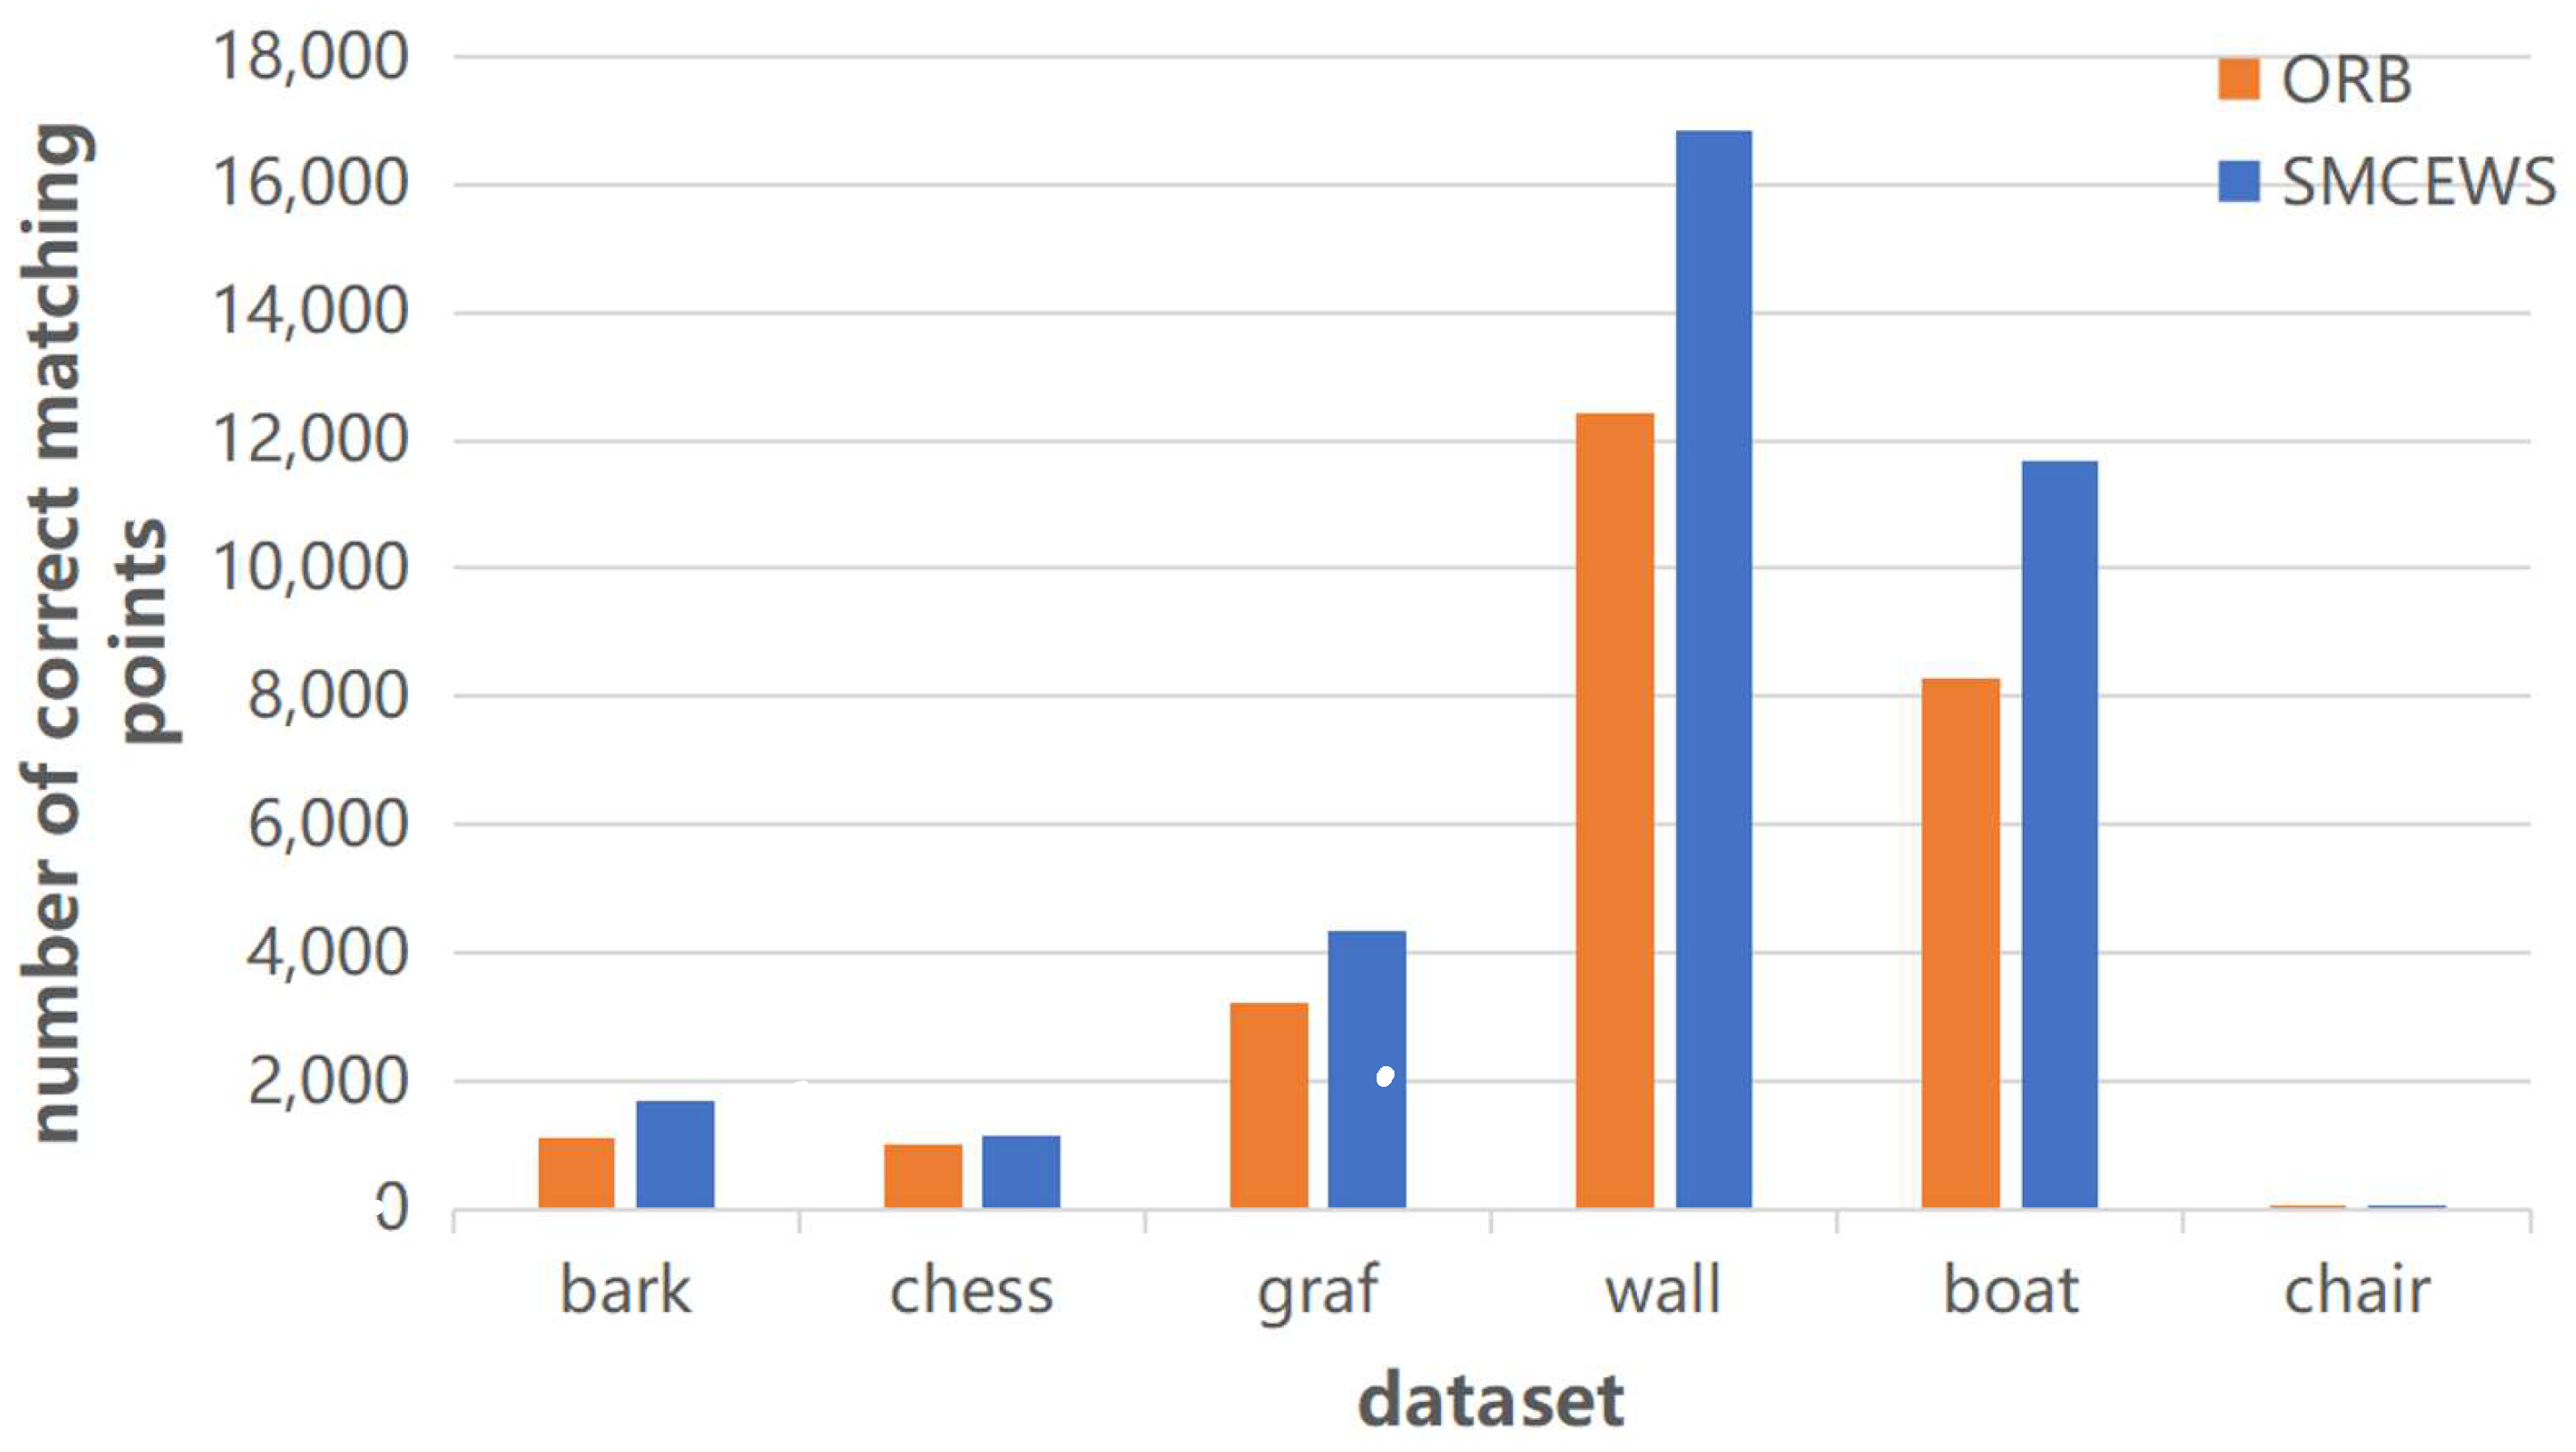
3.2. Comparison with ORB Algorithm

The cross-sectional comparison experiments in the previous section show that the symmetrical multicentre encoding and weighted summation-based descriptors perform the best. Therefore, Table 2 next compared the ORB descriptor with the SMCEWS descriptor in the same key point scheme longitudinally.
As shown in Figure 11 and Figure 12, the scheme based on symmetrical multicentre coding and weighted summation has an average increase of 1613 in the number of correct points of unlimited feature points and an average absolute improvement of 4.0% in the thousand-point recall rate compared with the ORB feature points. The analysis of the above experimental results verifies the reliability and validity of the descriptor construction based on correlation. It illustrates the existence of the distribution pattern of grayscale in the image block with the key corner points as the neighbourhood.

4. Conclusions and Future Work

In this paper, based on the research and analysis of mainstream feature points, based on the main idea of “gray information with key points as the neighborhood is correlated”, we propose a descriptor based on symmetric symmetrical multicentre encoding and weighted summation. The sampling distribution, description centroid, encoding method, and sampling neighbourhood of descriptors are carefully studied, and the information of binary descriptors is enriched by weighted summation of sampling points. This method fully uses the pixel information of the image blocks in the neighbourhood of feature points. Furthermore, the best descriptor construction method is determined by comparing different descriptors through cross-sectional and longitudinal experiments. The final experimental results show that our descriptor construction strategy achieves better matching results than the ORB algorithm.
In the future, we will validate our proposed algorithm on more public datasets and apply it to the VSLAM system to verify the effectiveness of our algorithm. In addition, the design of the descriptors can be correlated with the distribution of sampling points in higher dimensions, and the weighted summation of sampling points can be tried using Gaussian weighting to make further improvements to our method.

Author Contributions

Conceptualisation, Y.X.; methodology, M.C.; software, W.Z.; validation, W.Z. and Y.X.; formal analysis, M.C.; investigation, L.H. and R.Y.; resources, Y.W.; data curation, M.C.; writing—original draft preparation, Y.X. and M.C.; writing—review and editing, L.H. and R.Y.; visualisation, Y.X. All authors have read and agreed to the published version of the manuscript.

Funding

This research was funded by the National Natural Science Foundation of China, grant number 61403259; and the Key Project of Department of Education of Guangdong Province, grant number 2020ZDZX1052; and the Science and Technology Research and Development Foundation of Shenzhen, grant number 20200813140339001, JCYJ20210324120209027.

Institutional Review Board Statement

Not applicable.

Informed Consent Statement

Not applicable.

Data Availability Statement

Not applicable.

Conflicts of Interest

The authors declare no conflict of interest.

References

  1. Newcombe, R.A.; Izadi, S.; Hilliges, O.; Molyneaux, D.; Kim, D.; Davison, A.J.; Kohi, P.; Shotton, J.; Hodges, S.; Fitzgibbon, A. Kinectfusion: Real-time dense surface mapping and tracking. In Proceedings of the 2011 10th IEEE International Symposium on Mixed and Augmented Reality, Basel, Switzerland, 26–29 October 2011; pp. 127–136. [Google Scholar]
  2. Wu, H.; Xu, R.; Xu, K.; Zhao, J.; Zhang, Y.; Wang, A.; Iwahori, Y. 3D Texture Reconstruction of Abdominal Cavity Based on Monocular Vision SLAM for Minimally Invasive Surgery. Symmetry 2022, 14, 185. [Google Scholar] [CrossRef]
  3. Whelan, T.; Kaess, M.; Johannsson, H.; Fallon, M.; Leonard, J.J.; McDonald, J. Real-time large-scale dense RGB-D SLAM with volumetric fusion. Int. J. Robot. Res. 2015, 34, 598–626. [Google Scholar] [CrossRef] [Green Version]
  4. Zhang, D.; Zhu, J.; Wang, F.; Hu, X.; Ye, X. GMS-RANSAC: A Fast Algorithm for Removing Mismatches Based on ORB-SLAM2. Symmetry 2022, 14, 849. [Google Scholar]
  5. Newcombe, R.A.; Lovegrove, S.J.; Davison, A.J. DTAM: Dense tracking and mapping in real-time. In Proceedings of the 2011 International Conference on Computer Vision, Barcelona, Spain, 6–13 November 2011; pp. 2320–2327. [Google Scholar]
  6. Engel, J.; Schöps, T.; Cremers, D. LSD-SLAM: Large-scale direct monocular SLAM. In Computer Vision—ECCV 2014; Springer: Cham, Switzerland, 2014; pp. 834–849. [Google Scholar]
  7. Fuentes-Pacheco, J.; Ruiz-Ascencio, J.; Rendón-Mancha, J.M. Visual Simultaneous Localization and Mapping: A Survey. Artif. Intell. Rev. 2015, 43, 55–81. [Google Scholar] [CrossRef]
  8. Ethan, E.; Drummond, T. Scalable monocular SLAM. In Proceedings of the 2006 IEEE Computer Society Conference on Computer Vision and Pattern Recognition (CVPR’06), New York, NY, USA, 17–22 June 2006; IEEE: Piscataway, NJ, USA, 2006; pp. 469–476. [Google Scholar]
  9. Klein, G.; Murray, D. Parallel Tracking and Mapping for Small AR Workspaces. In Proceedings of the 2007 6th IEEE and ACM International Symposium on Mixed and Augmented Reality, Nara, Japan, 13–16 November 2007; IEEE: Piscataway, NJ, USA, 2008; pp. 225–234. [Google Scholar]
  10. Labbé, M.; Michaud, F. RTAB-Map as an open-source lidar and visual simultaneous localization and mapping library for large-scale and long-term online operation. J. Field Robot. 2019, 36, 416–446. [Google Scholar] [CrossRef]
  11. Forster, C.; Zhang, Z.; Gassner, M.; Werlberger, M.; Scaramuzza, D. SVO: Semidirect Visual Odometry for Monocular and Multicamera Systems. IEEE Trans. Robot. 2017, 33, 249–265. [Google Scholar] [CrossRef] [Green Version]
  12. Engel, J.; Koltun, V.; Cremers, D. Direct sparse odometry. IEEE Trans. Pattern Anal. Mach. Intell. 2017, 40, 611–625. [Google Scholar] [CrossRef] [PubMed]
  13. Qin, T.; Li, P.; Shen, S. VINS-MONO: A robust and versatile monocular visual-inertial state estimator. IEEE Trans. Robot. 2018, 34, 1004–1020. [Google Scholar] [CrossRef] [Green Version]
  14. Loo, S.Y.; Amiri, A.J.; Mashohor, S.; Tang, S.H.; Zhang, H. CNN-SVO: Improving the Mapping in Semi-Direct Visual Odometry Using Single-Image Depth Prediction. In Proceedings of the 2019 International Conference on Robotics and Automation (ICRA), Montreal, QC, Canada, 20–24 May 2019; pp. 5218–5223. [Google Scholar] [CrossRef] [Green Version]
  15. Tang, J.; Folkesson, J.; Jensfelt, P. Geometric Correspondence Network for Camera Motion Estimation. IEEE Robot. Autom. Lett. 2018, 3, 1010–1017. [Google Scholar] [CrossRef]
  16. Zhan, H.; Weerasekera, C.S.; Bian, J.W.; Reid, I. Visual Odometry Revisited: What Should Be Learnt? In Proceedings of the 2020 IEEE International Conference on Robotics and Automation (ICRA), Paris, France, 31 May–31 August 2020; pp. 4203–4210. [Google Scholar] [CrossRef]
  17. Lowe, D.G. Distinctive Image Features from Scale-Invariant Keypoints. Int. J. Comput. Vis. 2004, 60, 91–110. [Google Scholar] [CrossRef]
  18. Herbert, B.; Tuytelaars, T.; Van Gool, L. Surf: Speeded up robust features. In Computer Vision—ECCV 2006; Springer: Berlin/Heidelberg, Germany, 2006; pp. 404–417. [Google Scholar]
  19. Tola, E.; Lepetit, V.; Fua, P. DAISY: An efficient dense descriptor applied to wide-baseline stereo. IEEE Trans. Pattern Anal. Mach. Intell. 2019, 32, 815–830. [Google Scholar] [CrossRef] [PubMed] [Green Version]
  20. Bakshi, G.; Shukla, R.; Yadav, V.; Dahiya, A.; Anand, R.; Sindhwani, N.; Singh, H. An optimized approach for feature extraction in multi-relational statistical learning. J. Sci. Ind. Res. 2021, 80, 537–542. [Google Scholar]
  21. Calonder, M.; Lepetit, V.; Strecha, C.; Fua, P. BRIEF: Binary Robust Independent Elementary Features. In Computer Vision—ECCV 2010; Springer: Berlin/Heidelberg, Germany, 2010; pp. 778–792. [Google Scholar]
  22. Rublee, E.; Rabaud, V.; Konolige, K.; Bradski, G. ORB: An efficient alternative to SIFT or SURF. In Proceedings of the 2011 International Conference on Computer Vision, Barcelona, Spain, 6–13 November 2011; pp. 2564–2571. [Google Scholar]
  23. Leutenegger, S.; Chli, M.; Siegwart, R.Y. BRISK: Binary Robust invariant scalable keypoints. In Proceedings of the 2011 International Conference on Computer Vision, Barcelona, Spain, 6–13 November 2011; pp. 2548–2555. [Google Scholar]
  24. Alahi, A.; Ortiz, R.; Vandergheynst, P. FREAK: Fast Retina Keypoint. In Proceedings of the IEEE Conference on Computer Vision & Pattern Recognition, Providence, RI, USA, 16–21 June 2012; pp. 510–517. [Google Scholar]
  25. Raul, M.-A.; Montiel, J.M.M.; Tardos, J.D. ORB-SLAM: A versatile and accurate monocular SLAM system. IEEE Trans. Robot. 2015, 31, 1147–1163. [Google Scholar]
  26. Rosten, E.; Porter, R.; Drummond, T. Faster and better: A machine learning approach to corner detection. IEEE Trans. Pattern. Anal. Mach. Intell. 2008, 32, 105–119. [Google Scholar] [CrossRef] [PubMed] [Green Version]
  27. Mur-Artal, R.; Tardós, J.D. ORB-SLAM2: An Open-Source SLAM System for Monocular, Stereo and RGB-D Cameras. IEEE Trans. Robot. 2017, 33, 1255–1262. [Google Scholar] [CrossRef] [Green Version]
  28. Campos, C.; Elvira, R.; Rodríguez, J.J.G.; Montiel, J.M.M.; Tardós, J.D. ORB-SLAM3: An Accurate Open-Source Library for Visual, Visual-Inertial and Multi-Map SLAM. IEEE Trans. Robot. 2021, 37, 1874–1890. [Google Scholar] [CrossRef]
  29. Chris, H.; Stephens, M. A combined corner and edge detector. Alvey Vis. Conf. 1988, 15, 10–5244. [Google Scholar]
  30. Alcantarilla, P.F.; Bartoli, A.; Davison, A.J. KAZE Features. In Proceedings of the European Conference on Computer Vision (ECCV), Fiorenze, Italy, 23–27 October 2012. [Google Scholar]
Figure 1. The value of the central corner points: (a) feature sampling points; (b) local enlargement of feature sampling points.
Symmetry 15 00809 g001
Figure 2. Sampling distribution pattern: (a) symmetrical uniform distribution; (b) symmetrical circumferential distribution.
Symmetry 15 00809 g002
Figure 3. Sampling distribution model based on the symmetric circumference.
Symmetry 15 00809 g003
Figure 4. Seven descriptions of the central point.
Symmetry 15 00809 g004
Figure 5. The coding serial number of the sampling point.
Symmetry 15 00809 g005
Figure 6. Parity coding diagram.
Symmetry 15 00809 g006
Figure 7. Symmetrical multicentre circumferential coding schematic.
Symmetry 15 00809 g007
Figure 8. Practical implications of symmetrical multicentre circumferential coding: (a) small and sharp angle; (b) large and obtuse angle.
Symmetry 15 00809 g008
Figure 9. Histogram of thousand-point recall rate of descriptors in cross-sectional experiments.
Symmetry 15 00809 g009
Figure 10. Histogram of the number of correct matching points without point limit for descriptors in cross-sectional experiments.
Symmetry 15 00809 g010
Figure 11. Histogram of thousand-point recall rate of descriptors in longitudinal experiments.
Symmetry 15 00809 g011
Figure 12. Histogram of the number of correct matching points without point limit for descriptors in longitudinal experiments.
Symmetry 15 00809 g012
Table 1. Cross-sectional experimental comparison results of descriptor construction.
SolutionsNumber BarkChessGrafWallBoatChair
SUDSC\355570957399459\
10000.0370.1920.1250.1350.151\
SCDPC\99494224249500674640
10000.1230.2650.2130.1730.2430.040
PCWS\108110023077111667714\
10000.1250.2950.2330.1870.261\
SMCC\137411123927148631052750
10000.1570.3140.2590.2460.2850.050
SMCEWS\169411454330168401168250
10000.1760.3250.2880.2540.3200.050
Table 2. Comparative results of descriptors in longitudinal experiments.
SolutionsNumber BarkChessGrafWallBoatChair
ORB\11161021320312410827632
10000.1430.3010.2330.2000.2640.032
SMCEWS\169411454330168401168250
10000.1760.3250.2880.2540.3200.050
Disclaimer/Publisher’s Note: The statements, opinions and data contained in all publications are solely those of the individual author(s) and contributor(s) and not of MDPI and/or the editor(s). MDPI and/or the editor(s) disclaim responsibility for any injury to people or property resulting from any ideas, methods, instructions or products referred to in the content.

