
Facial Asymmetry of Italian Children: A Cross-Sectional Analysis of Three-Dimensional Stereophotogrammetric Reference Values
 , , ,
, , , 
Abstract
:1. Introduction
2. Materials and Methods
2.1. Sample
2.2. Image Acquisition
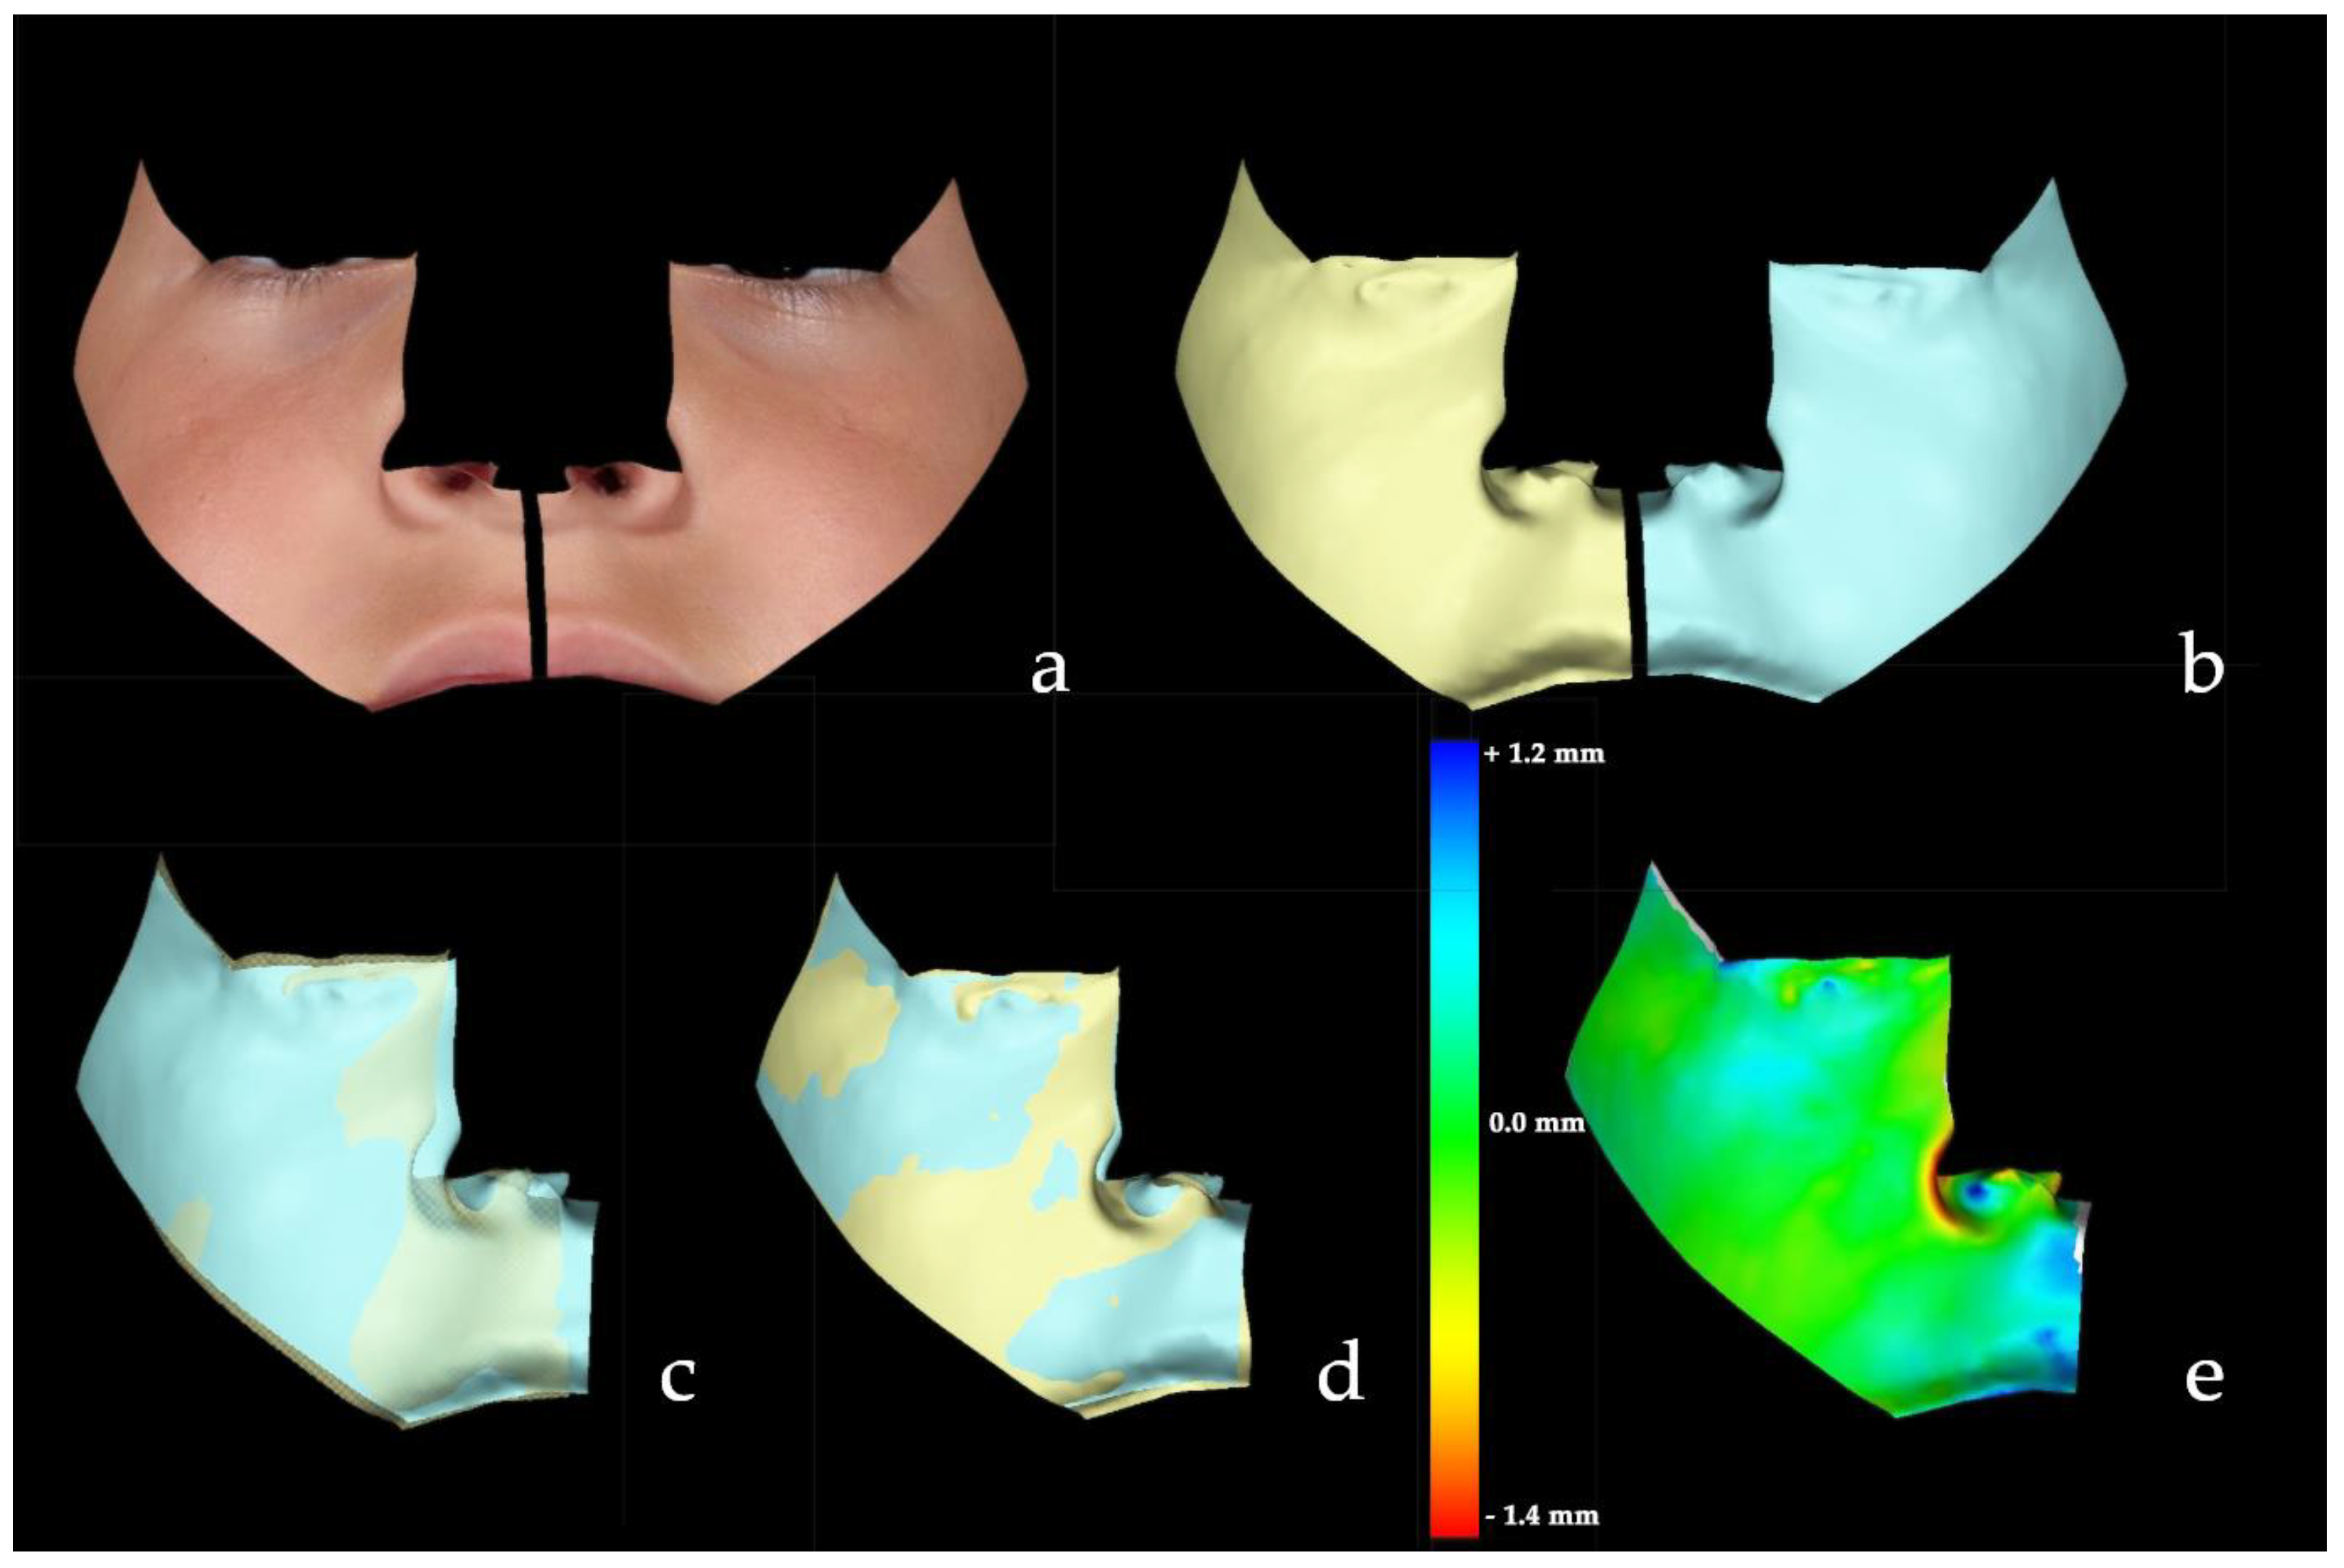
2.3. Asymmetry Quantification
2.4. Statistical Analysis
3. Results
4. Discussion
5. Conclusions
Author Contributions
Funding
Institutional Review Board Statement
Informed Consent Statement
Data Availability Statement
Conflicts of Interest
References
- Combs, D. Stedman’s Medical Dictionary. J. Fam. Pract. 1996, 42, 87–89. [Google Scholar]
- Primozic, J.; Perinetti, G.; Zhurov, A.; Richmond, S.; Ovsenik, M. Assessment of Facial Asymmetry in Growing Subjects with a Three-Dimensional Laser Scanning System. Orthod. Craniofac. Res. 2012, 15, 237–244. [Google Scholar] [CrossRef]
- Ferrario, V.F.; Sforza, C.; Ciusa, V.; Dellavia, C.; Tartaglia, G.M. The Effect of Sex and Age on Facial Asymmetry in Healthy Subjects: A Cross-Sectional Study from Adolescence to Mid-Adulthood. J. Oral Maxillofac. Surg. 2001, 59, 382–388. [Google Scholar] [CrossRef] [PubMed]
- Taylor, H.O.; Morrison, C.S.; Linden, O.; Phillips, B.; Chang, J.; Byrne, M.E.; Sullivan, S.R.; Forrest, C.R. Quantitative Facial Asymmetry: Using Three-Dimensional Photogrammetry to Measure Baseline Facial Surface Symmetry. J. Craniofac. Surg. 2014, 25, 124–128. [Google Scholar] [CrossRef] [PubMed]
- Rossi, M.; Ribeiro, E.; Smith, R. Craniofacial Asymmetry in Development: An Anatomical Study. Angle Orthod. 2003, 73, 381–385. [Google Scholar] [CrossRef] [PubMed]
- Djordjevic, J.; Toma, A.M.; Zhurov, A.I.; Richmond, S. Three-Dimensional Quantification of Facial Symmetry in Adolescents Using Laser Surface Scanning. Eur. J. Orthod. 2014, 36, 125–132. [Google Scholar] [CrossRef] [PubMed]
- Berlin, N.F.; Berssenbrügge, P.; Runte, C.; Wermker, K.; Jung, S.; Kleinheinz, J.; Dirksen, D. Quantification of Facial Asymmetry by 2D Analysis—A Comparison of Recent Approaches. J. Craniomaxillofac. Surg. 2014, 42, 265–271. [Google Scholar] [CrossRef]
- Thiesen, G.; Gribel, B.F.; Freitas, M.P.M. Facial Asymmetry: A Current Review. Dent. Press J. Orthod. 2015, 20, 110–125. [Google Scholar] [CrossRef] [PubMed]
- Blasi, A.; Nucera, R.; Ronsivalle, V.; Candida, E.; Grippaudo, C. Asymmetry Index for the Photogrammetric Assessment of Facial Asymmetry. Am. J. Orthod. Dentofacial. Orthop. 2022, 162, 394–402. [Google Scholar] [CrossRef]
- Djordjevic, J.; Pirttiniemi, P.; Harila, V.; Heikkinen, T.; Toma, A.M.; Zhurov, A.I.; Richmond, S. Three-Dimensional Longitudinal Assessment of Facial Symmetry in Adolescents. Eur. J. Orthod. 2013, 35, 143–151. [Google Scholar] [CrossRef] [Green Version]
- Stauber, I.; Vairaktaris, E.; Holst, A.; Schuster, M.; Hirschfelder, U.; Neukam, F.W.; Nkenke, E. Three-Dimensional Analysis of Facial Symmetry in Cleft Lip and Palate Patients Using Optical Surface Data. J. Orofac. Orthop. 2008, 69, 268–282. [Google Scholar] [CrossRef]
- Yu, Z.; Mu, X.; Feng, S.; Han, J.; Chang, T. Flip-Registration Procedure of Three-Dimensional Laser Surface Scanning Images on Quantitative Evaluation of Facial Asymmetries. J. Craniofac. Surg. 2009, 20, 157–160. [Google Scholar] [CrossRef]
- Naros, A.; Wolf, J.A.; Krimmel, M.; Kluba, S. Three-Dimensional Quantification of Facial Asymmetry in Children with Positional Cranial Deformity. Plast. Reconstr. Surg. 2021, 148, 1321–1331. [Google Scholar] [CrossRef]
- Codari, M.; Pucciarelli, V.; Stangoni, F.; Zago, M.; Tarabbia, F.; Biglioli, F.; Sforza, C. Facial Thirds–Based Evaluation of Facial Asymmetry Using Stereophotogrammetric Devices: Application to Facial Palsy Subjects. J. Craniomaxillofac. Surg. 2017, 45, 76–81. [Google Scholar] [CrossRef] [Green Version]
- Al-Rudainy, D.; Ju, X.; Mehendale, F.; Ayoub, A. Assessment of Facial Asymmetry before and after the Surgical Repair of Cleft Lip in Unilateral Cleft Lip and Palate Cases. Int. J. Oral Maxillofac. Surg. 2018, 47, 411–419. [Google Scholar] [CrossRef] [PubMed] [Green Version]
- Alqattan, M.; Djordjevic, J.; Zhurov, A.I.; Richmond, S. Comparison between Landmark and Surface-Based Three-Dimensional Analyses of Facial Asymmetry in Adults. Eur. J. Orthod. 2015, 37, 1–12. [Google Scholar] [CrossRef] [PubMed] [Green Version]
- Baserga, C.; Cappella, A.; Gibelli, D.M.; Sacco, R.; Dolci, C.; Cullati, F.; Giannì, A.B.; Sforza, C. Efficacy of Autologous Fat Grafting in Restoring Facial Symmetry in Linear Morphea-Associated Lesions. Symmetry 2020, 12, 2098. [Google Scholar] [CrossRef]
- Gibelli, D.; Tarabbia, F.; Restelli, S.; Allevi, F.; Dolci, C.; Dell’Aversana Orabona, G.; Cappella, A.; Codari, M.; Sforza, C.; Biglioli, F. Three-Dimensional Assessment of Restored Smiling Mobility after Reanimation of Unilateral Facial Palsy by Triple Innervation Technique. Int. J. Oral Maxillofac. Surg. 2020, 49, 536–542. [Google Scholar] [CrossRef] [PubMed]
- Baik, H.-S.; Kim, S.-Y. Facial Soft-Tissue Changes in Skeletal Class III Orthognathic Surgery Patients Analyzed with 3-Dimensional Laser Scanning. Am. J. Orthod. Dentofacial. Orthop. 2010, 138, 167–178. [Google Scholar] [CrossRef]
- Ozsoy, U. Comparison of Different Calculation Methods Used to Analyze Facial Soft Tissue Asymmetry: Global and Partial 3-Dimensional Quantitative Evaluation of Healthy Subjects. J. Oral Maxillofac. Surg. 2016, 74, 1847.e1–1847.e9. [Google Scholar] [CrossRef]
- Cassi, D.; Battistoni, G.; Magnifico, M.; Di Blasio, C.; Pedrazzi, G.; Di Blasio, A. Three-Dimensional Evaluation of Facial Asymmetry in Patients with Hemifacial Microsomia Using Stereophotogrammetry. J. Cranio-Maxillofac. Surg. 2019, 47, 179–184. [Google Scholar] [CrossRef] [PubMed]
- AlQahtani, S.J.; Hector, M.P.; Liversidge, H.M. Brief Communication: The London Atlas of Human Tooth Development and Eruption. Am. J. Phys. Anthropol. 2010, 142, 481–490. [Google Scholar] [CrossRef] [PubMed]
- World Medical Association Declaration of Helsinki: Ethical Principles for Medical Research Involving Human Subjects. JAMA 2013, 310, 2191. [CrossRef] [Green Version]
- Gibelli, D.; Cappella, A.; Dolci, C.; Sforza, C. 3D Surface Acquisition Systems and Their Applications to Facial Anatomy: Let’s Make a Point. Ital. J. Anat. Embryol. 2019, 124, 422–431. [Google Scholar] [CrossRef]
- Gibelli, D.; Pucciarelli, V.; Cappella, A.; Dolci, C.; Sforza, C. Are Portable Stereophotogrammetric Devices Reliable in Facial Imaging? A Validation Study of VECTRA H1 Device. J. Oral Maxillofac. Surg. 2018, 76, 1772–1784. [Google Scholar] [CrossRef] [Green Version]
- Dolci, C.; Rigamonti, A.E.; Cappella, A.; Gibelli, D.M.; Grugni, G.; Caroli, D.; Sforza, C.; Sartorio, A. Robustness of Distinctive Facial Features in Prader-Willi Syndrome: A Stereophotogrammetric Analysis and Association with Clinical and Biochemical Markers in Adult Individuals. Biology 2022, 11, 1148. [Google Scholar] [CrossRef]
- Ferrario, V.F.; Sforza, C.; Poggio, C.E.; Cova, M.; Tartaglia, G. Preliminary Evaluation of an Electromagnetic Three-Dimensional Digitizer in Facial Anthropometry. Cleft Palate Craniofac. J. 1998, 35, 9–15. [Google Scholar] [CrossRef]
- De Menezes, M.; Rosati, R.; Ferrario, V.F.; Sforza, C. Accuracy and Reproducibility of a 3-Dimensional Stereophotogrammetric Imaging System. J. Oral Maxillofac. Surg. 2010, 68, 2129–2135. [Google Scholar] [CrossRef]
- Sforza, C.; Elamin, F.; Rosati, R.; Lucchini, M.A.; Tommasi, D.G.; Ferrario, V.F. Three-Dimensional Assessment of Nose and Lip Morphology in North Sudanese Subjects with Down Syndrome. Angle Orthod. 2011, 81, 107–114. [Google Scholar] [CrossRef] [Green Version]
- Rousseeuw, P.J.; Croux, C. Alternatives to the Median Absolute Deviation. J. Am. Stat. Assoc. 1993, 88, 1273–1283. [Google Scholar] [CrossRef]
- Ben-Shachar, M.; Lüdecke, D.; Makowski, D. Effectsize: Estimation of Effect Size Indices and Standardized Parameters. JOSS 2020, 5, 2815. [Google Scholar] [CrossRef]
- Mercan, E.; Oestreich, M.; Fisher, D.M.; Allori, A.C.; Beals, S.P.; Samson, T.D.; Sitzman, T.J.; Matic, D.B.; Siebold, B.S.; Tse, R.W. Objective Assessment of the Unilateral Cleft Lip Nasal Deformity Using Three-Dimensional Stereophotogrammetry: Severity and Outcome. Plast. Reconstr. Surg. 2018, 141, 547e–558e. [Google Scholar] [CrossRef] [PubMed]
- Linden, O.E.; Taylor, H.O.; Vasudavan, S.; Byrne, M.E.; Deutsch, C.K.; Mulliken, J.B.; Sullivan, S.R. Three-Dimensional Analysis of Nasal Symmetry Following Primary Correction of Unilateral Cleft Lip Nasal Deformity. Cleft Palate Craniofac. J. 2017, 54, 715–719. [Google Scholar] [CrossRef] [PubMed]
- Rolfe, S.; Lee, S.-I.; Shapiro, L. Associations Between Genetic Data and Quantitative Assessment of Normal Facial Asymmetry. Front. Genet. 2018, 9, 659. [Google Scholar] [CrossRef] [PubMed] [Green Version]
- Kornreich, D.; Mitchell, A.A.; Webb, B.D.; Cristian, I.; Jabs, E.W. Quantitative Assessment of Facial Asymmetry Using Three-Dimensional Surface Imaging in Adults: Validating the Precision and Repeatability of a Global Approach. Cleft Palate Craniofac. J. 2016, 53, 126–131. [Google Scholar] [CrossRef]
- Öwall, L.; Darvann, T.A.; Larsen, P.; Hove, H.D.; Hermann, N.V.; Bøgeskov, L.; Kreiborg, S. Facial Asymmetry in Children with Unicoronal Synostosis Who Have Undergone Craniofacial Reconstruction in Infancy. Cleft Palate Craniofac. J. 2016, 53, 385–393. [Google Scholar] [CrossRef]
- Verhoeven, T.; Xi, T.; Schreurs, R.; Bergé, S.; Maal, T. Quantification of Facial Asymmetry: A Comparative Study of Landmark-Based and Surface-Based Registrations. J. Craniomaxillofac. Surg. 2016, 44, 1131–1136. [Google Scholar] [CrossRef]
- Claes, P.; Walters, M.; Vandermeulen, D.; Clement, J.G. Spatially-Dense 3D Facial Asymmetry Assessment in Both Typical and Disordered Growth. J. Anat. 2011, 219, 444–455. [Google Scholar] [CrossRef] [Green Version]
- Zhu, Y.; Zhao, Y.; Wang, Y. A Review of Three-Dimensional Facial Asymmetry Analysis Methods. Symmetry 2022, 14, 1414. [Google Scholar] [CrossRef]
- Sajid, M.; Shafique, T.; Riaz, I.; Imran, M.; Jabbar Aziz Baig, M.; Baig, S.; Manzoor, S. Facial Asymmetry-Based Anthropometric Differences between Gender and Ethnicity. Symmetry 2018, 10, 232. [Google Scholar] [CrossRef] [Green Version]
- Skomina, Z.; Verdenik, M.; Hren, N.I. Effect of Aging and Body Characteristics on Facial Sexual Dimorphism in the Caucasian Population. PLoS ONE 2020, 15, e0231983. [Google Scholar] [CrossRef] [PubMed]
- Özener, B.; Fink, B. Facial Symmetry in Young Girls and Boys from a Slum and a Control Area of Ankara, Turkey. Evol. Hum. Behav. 2010, 31, 436–441. [Google Scholar] [CrossRef]
- Ferrario, V.F.; Sforza, C.; Poggio, C.E.; Tartaglia, G. Distance From Symmetry: A Three-Dimensional Evaluation of Facial Asymmetry. J. Oral Maxillofac. Surg. 1994, 52, 1126–1132. [Google Scholar] [CrossRef]
- Linden, O.E.; He, J.K.; Morrison, C.S.; Sullivan, S.R.; Taylor, H.O.B. The Relationship between Age and Facial Asymmetry. Plast. Reconstr. Surg. 2018, 142, 1145–1152. [Google Scholar] [CrossRef]
- Graham, J.; Özener, B. Fluctuating Asymmetry of Human Populations: A Review. Symmetry 2016, 8, 154. [Google Scholar] [CrossRef] [Green Version]
- Fink, B.; Manning, J.T.; Neave, N.; Grammer, K. Second to Fourth Digit Ratio and Facial Asymmetry. Evol. Hum. Behav. 2004, 25, 125–132. [Google Scholar] [CrossRef]
- Ertuğrul, B. Sexually Dimorphic Human Body Fat Distribution and Second-to-Fourth Digit Ratio. Euras. J. Anthropol. 2012, 3, 32–54. [Google Scholar]
- Thornhill, R.; Møller, A.P. Developmental Stability, Disease and Medicine. Biol. Rev. 2007, 72, 497–548. [Google Scholar] [CrossRef]
- Salciccia, S.; Giudice, F.D.; Eisenberg, M.L.; Mastroianni, C.M.; Berardinis, E.D.; Ricciuti, G.P.; Viscuso, P.; Zingaropoli, A.; Pasculli, P.; Ciardi, M.R.; et al. Testosterone Target Therapy: Focus on Immune Response, Controversies and Clinical Implications in Patients with COVID-19 Infection. Ther. Adv. Endocrinol. Metab. 2021, 12, 1–8. [Google Scholar] [CrossRef]
- Gubbels Bupp, M.R.; Jorgensen, T.N. Androgen-Induced Immunosuppression. Front. Immunol. 2018, 9, 794. [Google Scholar] [CrossRef] [Green Version]
- Viau, V.; Meaney, M. The Inhibitory Effect of Testosterone on Hypothalamic-Pituitary-Adrenal Responses to Stress Is Mediated by the Medial Preoptic Area. J. Neurosci. 1996, 16, 1866–1876. [Google Scholar] [CrossRef] [PubMed] [Green Version]
- Viau, V. Functional Cross-Talk Between the Hypothalamic-Pituitary-Gonadal and -Adrenal Axes: Testosterone and Corticosterone Interact on HPA Function. J. Neuroendocrinol. 2002, 14, 506–513. [Google Scholar] [CrossRef] [PubMed] [Green Version]
- Viau, V.; Bingham, B.; Davis, J.; Lee, P.; Wong, M. Gender and Puberty Interact on the Stress-Induced Activation of Parvocellular Neurosecretory Neurons and Corticotropin-Releasing Hormone Messenger Ribonucleic Acid Expression in the Rat. Endocrinology 2005, 146, 137–146. [Google Scholar] [CrossRef] [PubMed]
- Manning, J.T.; Fink, B.; Neave, N.; Szwed, A. The Second to Fourth Digit Ratio and Asymmetry. Ann. Hum. Biol. 2006, 33, 480–492. [Google Scholar] [CrossRef] [PubMed]
- Dongen, S.V. A Critical Re-Evaluation of the Association between 2D:4D Ratios and Fluctuating Asymmetry in Humans. Ann. Hum. Biol. 2009, 36, 186–198. [Google Scholar] [CrossRef]
- Benderlioglu, Z. Fluctuating Asymmetry and Steroid Hormones: A Review. Symmetry 2010, 2, 541–553. [Google Scholar] [CrossRef] [Green Version]
- Wirawan, C.S.; Bank, J.R.; Ehrlich, D.E.; Marazita, M.L.; Weinberg, S.M.; Miller, S.F. Facial Asymmetry Increases as a Function of Age. FASEB J. 2020, 34, 1. [Google Scholar] [CrossRef]
- Shah, S.M.; Joshi, M.R. An Assessment of Asymmetry in the Normal Craniofacial Complex. Angle Orthod. 1978, 48, 141–148. [Google Scholar] [CrossRef]
- Farkas, L.G.; Cheung, G. Facial Asymmetry in Healthy North American Caucasian: An Anthropological Study. Angle Orthod. 1981, 51, 70–77. [Google Scholar] [CrossRef]
- Shaner, D.J.; Peterson, A.E.; Beattie, O.B.; Bamforth, J.S. Assessment of Soft Tissue Facial Asymmetry in Medically Normal and Syndrome-Affected Individuals by Analysis of Landmarks and Measurements. Am. J. Med. Genet. 2000, 93, 143–154. [Google Scholar] [CrossRef]
- Severt, T.R.; Proffit, W.R. The Prevalence of Facial Asymmetry in the Dentofacial Deformities Population at the University of North Carolina. Int. J. Adult. Orthodont. Orthognath. Surg. 1997, 12, 171–176. [Google Scholar]
- Haraguchi, S.; Takada, K.; Yasuda, Y. Facial Asymmetry in Subjects with Skeletal Class III Deformity. Angle Orthod. 2002, 72, 28–35. [Google Scholar] [CrossRef] [PubMed]
- Primozic, J.; Perinetti, G.; Richmond, S.; Ovsenik, M. Three-Dimensional Evaluation of Facial Asymmetry in Association with Unilateral Functional Crossbite in the Primary, Early, and Late Mixed Dentition Phases. Angle Orthod. 2013, 83, 253–258. [Google Scholar] [CrossRef] [PubMed]
- Barcellos, D.C.; de Paiva Gonçalves, S.E.; da Silva, M.A.; Batista, G.R.; Pleffken, P.R.; Pucci, C.R.; Borges, A.B.; Rocha Gomes Torres, C. Prevalence of Chewing Side Preference in the Deciduous, Mixed and Permanent Dentitions. J. Contemp. Dent. Pr. 2011, 12, 339–342. [Google Scholar] [CrossRef] [PubMed]
- Heikkinen, E.V.; Vuollo, V.; Harila, V.; Sidlauskas, A.; Heikkinen, T. Facial Asymmetry and Chewing Sides in Twins. Acta Odontol. Scand. 2022, 80, 197–202. [Google Scholar] [CrossRef] [PubMed]
- Diernberger, S.; Bernhardt, O.; Schwahn, C.; Kordass, B. Self-Reported Chewing Side Preference and Its Associations with Occlusal, Temporomandibular and Prosthodontic Factors: Results from the Population-Based Study of Health in Pomerania (SHIP-0). J. Oral Rehabil. 2008, 35, 613–620. [Google Scholar] [CrossRef]
- Tomonari, H.; Kwon, S.; Kuninori, T.; Miyawaki, S. Differences between the Chewing and Non-Chewing Sides of the Mandibular First Molars and Condyles in the Closing Phase during Chewing in Normal Subjects. Arch. Oral Biol. 2017, 81, 198–205. [Google Scholar] [CrossRef]
- Ercan, I.; Ozdemir, S.T.; Etoz, A.; Sigirli, D.; Tubbs, R.S.; Loukas, M.; Guney, I. Facial Asymmetry in Young Healthy Subjects Evaluated by Statistical Shape Analysis. J. Anat. 2008, 213, 663–669. [Google Scholar] [CrossRef]
- Baratta, V.M.; Linden, O.E.; Byrne, M.E.; Sullivan, S.R.; Taylor, H.O. A Quantitative Analysis of Facial Asymmetry in Torticollis Using 3-Dimensional Photogrammetry. Cleft Palate Craniofac. J. 2022, 59, 40–46. [Google Scholar] [CrossRef]
- Ovsenik, M.; Perinetti, G.; Zhurov, A.; Richmond, S.; Primozic, J. Three-Dimensional Assessment of Facial Asymmetry among Pre-Pubertal Class III Subjects: A Controlled Study. Eur. J. Orthod. 2014, 36, 431–435. [Google Scholar] [CrossRef] [Green Version]
- Kim, E.-J.; Palomo, J.M.; Kim, S.-S.; Lim, H.-J.; Lee, K.-M.; Hwang, H.-S. Maxillofacial Characteristics Affecting Chin Deviation between Mandibular Retrusion and Prognathism Patients. Angle Orthod. 2011, 81, 988–993. [Google Scholar] [CrossRef] [PubMed]
- Maeda, M.; Katsumata, A.; Ariji, Y.; Muramatsu, A.; Yoshida, K.; Goto, S.; Kurita, K.; Ariji, E. 3D-CT Evaluation of Facial Asymmetry in Patients with Maxillofacial Deformities. Oral Surg. Oral Med. Oral Pathol. Oral Radiol. Endod. 2006, 102, 382–390. [Google Scholar] [CrossRef] [PubMed]


| Males | Females | Total | |
|---|---|---|---|
| 4–8 (years) | 35 | 25 | 60 |
| 9–12 (years) | 39 | 36 | 75 |
| Total | 74 | 61 | 135 |
| Surface | Landmarks |
|---|---|
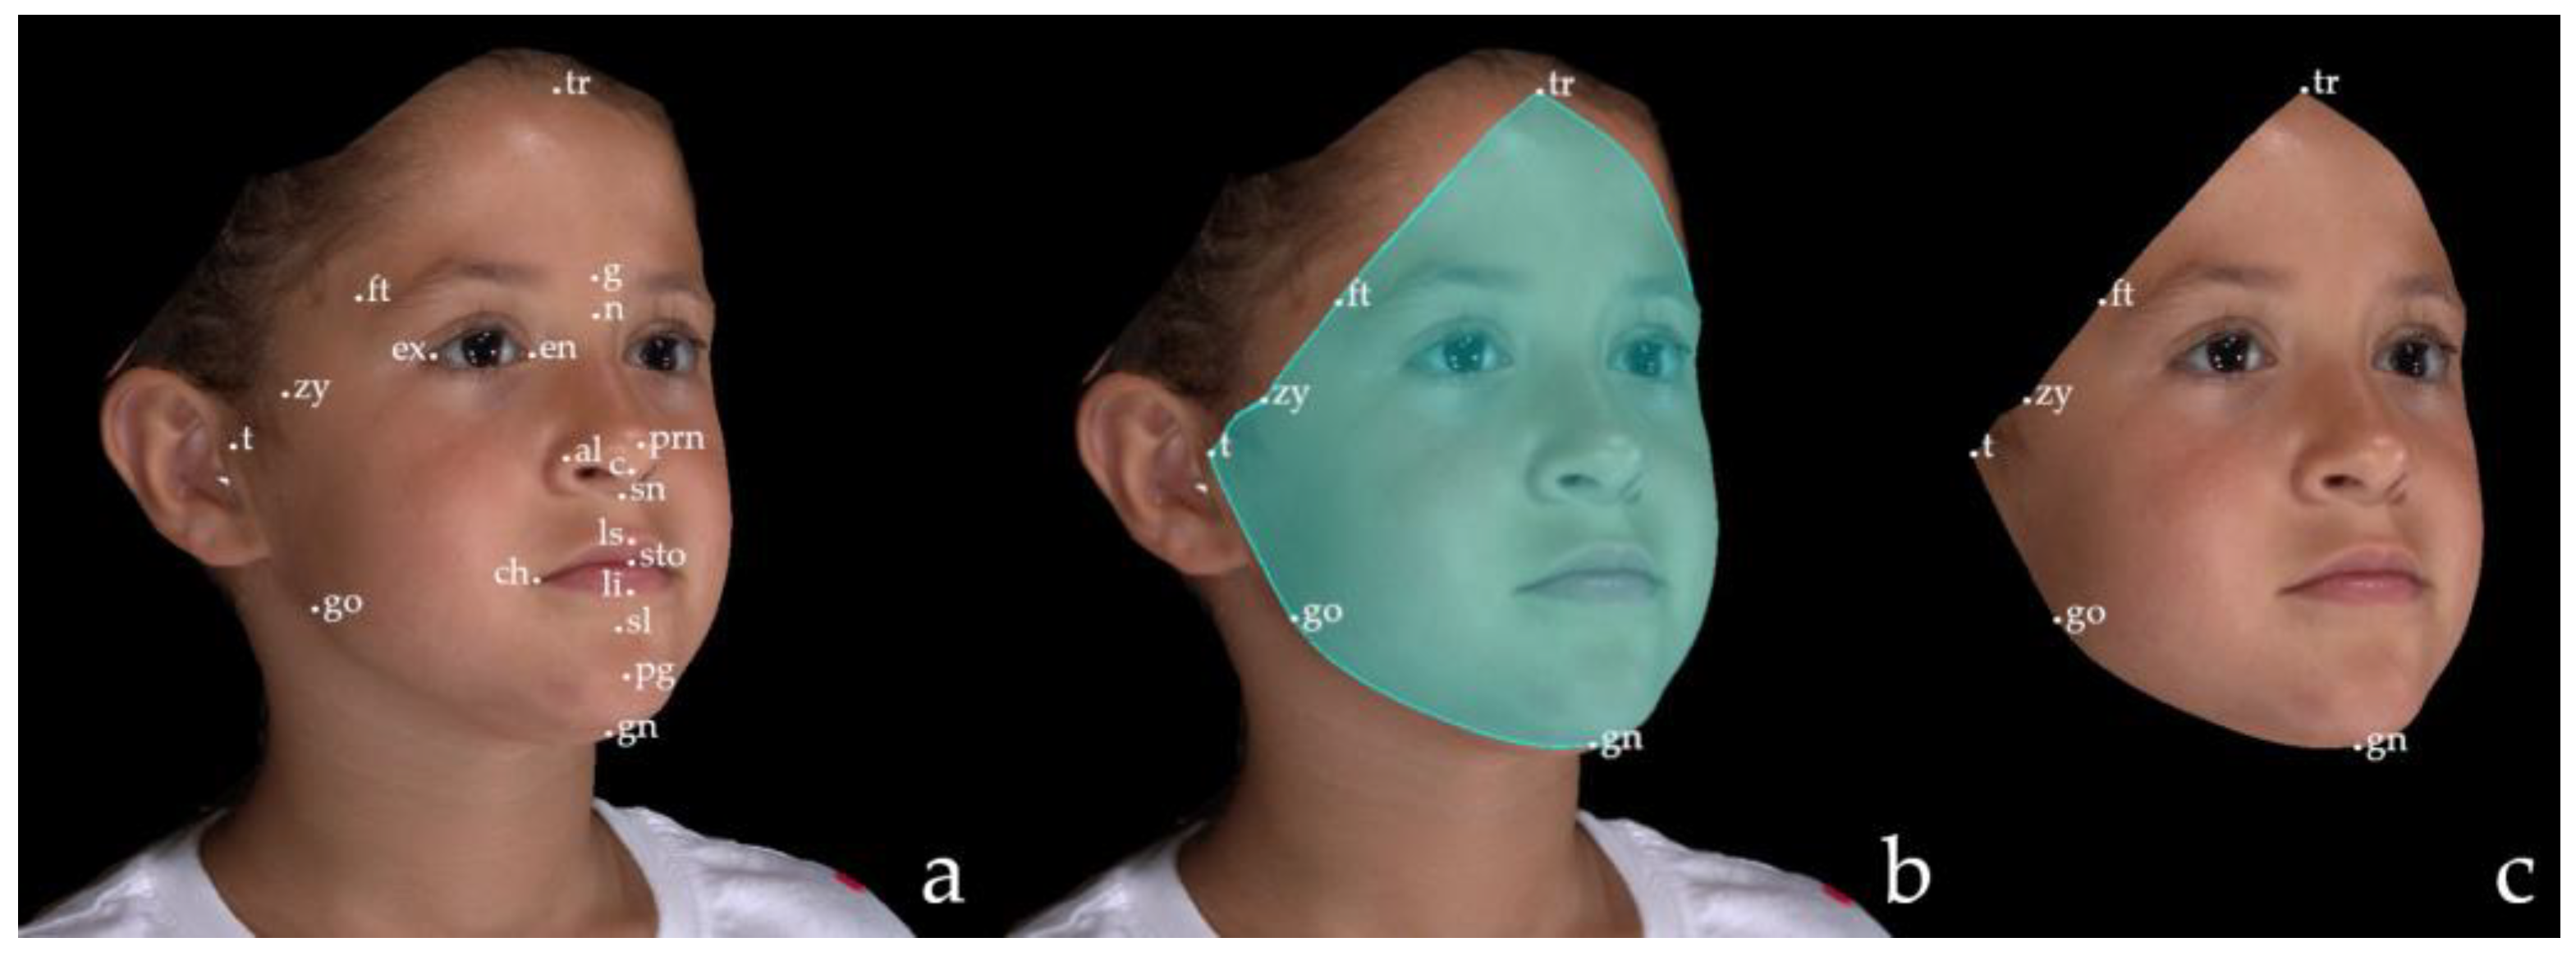
| Facial area of interest (FAI) | trichion (tr); frontotemporale (ft); zygion (zy); tragion (t); gonion (go); gnathion (gn) |
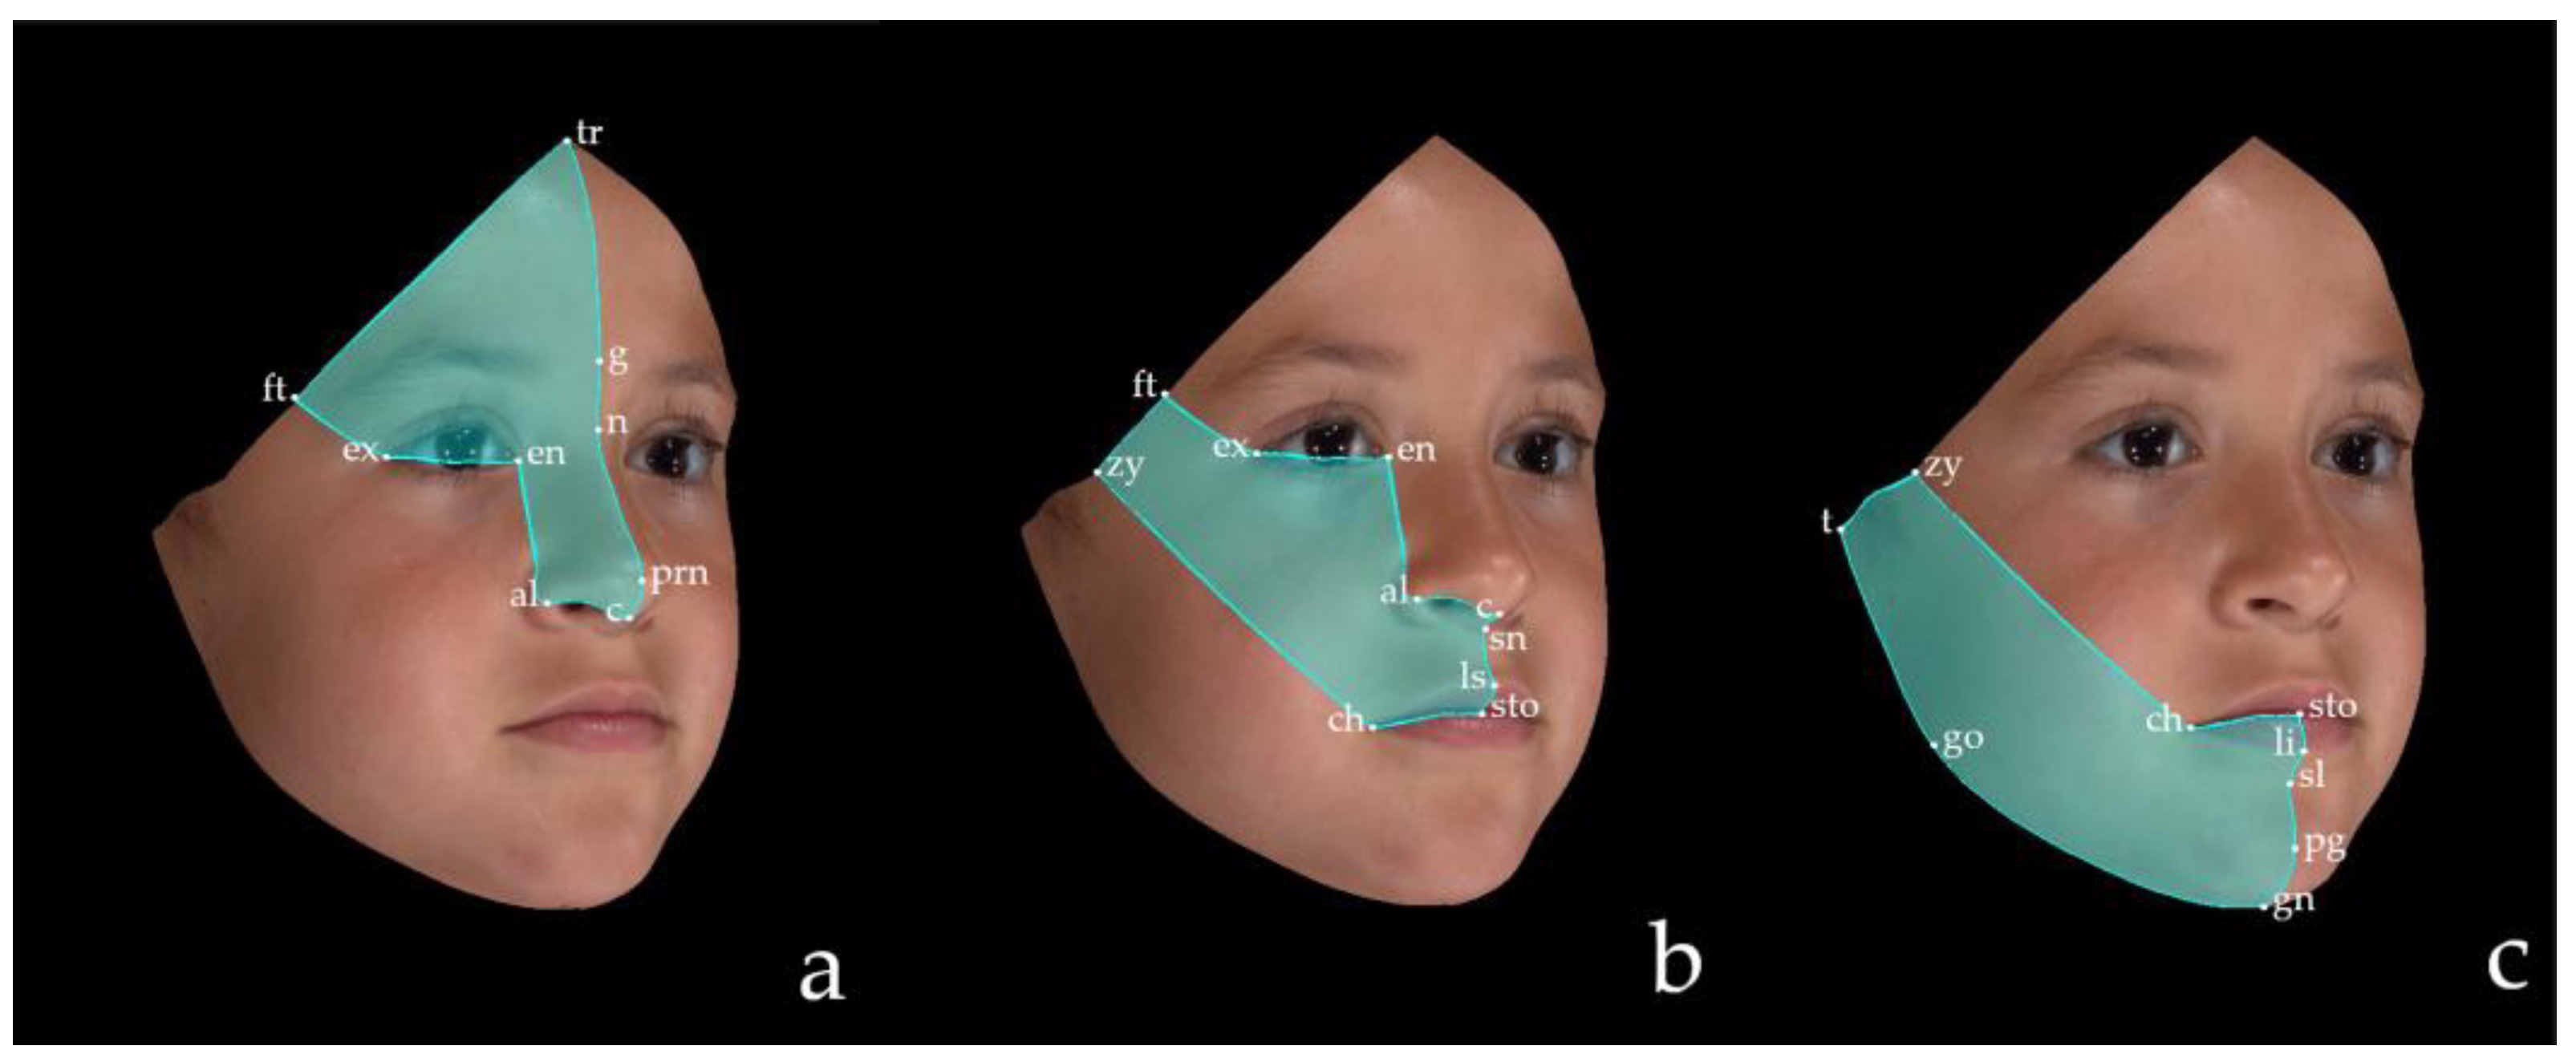
| Upper third (UT) | trichion (tr); glabella (g); nasion (n); pronasale (prn); columella (c); alare (al); endocanthion (en); exocanthion (ex); frontotemporale (ft) |
| Middle third (MT) | columella (c); subnasale (sn); labiale superius (ls); stomion (sto); chelion (ch); zygion (zy); frontotemporale (ft); exocanthion (ex); endocanthion (en); alare (al) |
| Lower third (LT) | stomion (sto); labiale inferius (li); sublabiale (sl); pogonion (pg); gnathion (gn); gonion (go); tragion (t); zygion (zy); cheilion (ch) |
| Facial Thirds | RMS (mm) | Male | Female | ||
|---|---|---|---|---|---|
| 4–8 y (N) | 9–12 y (N) | 4–8 y (N) | 9–12 y (N) | ||
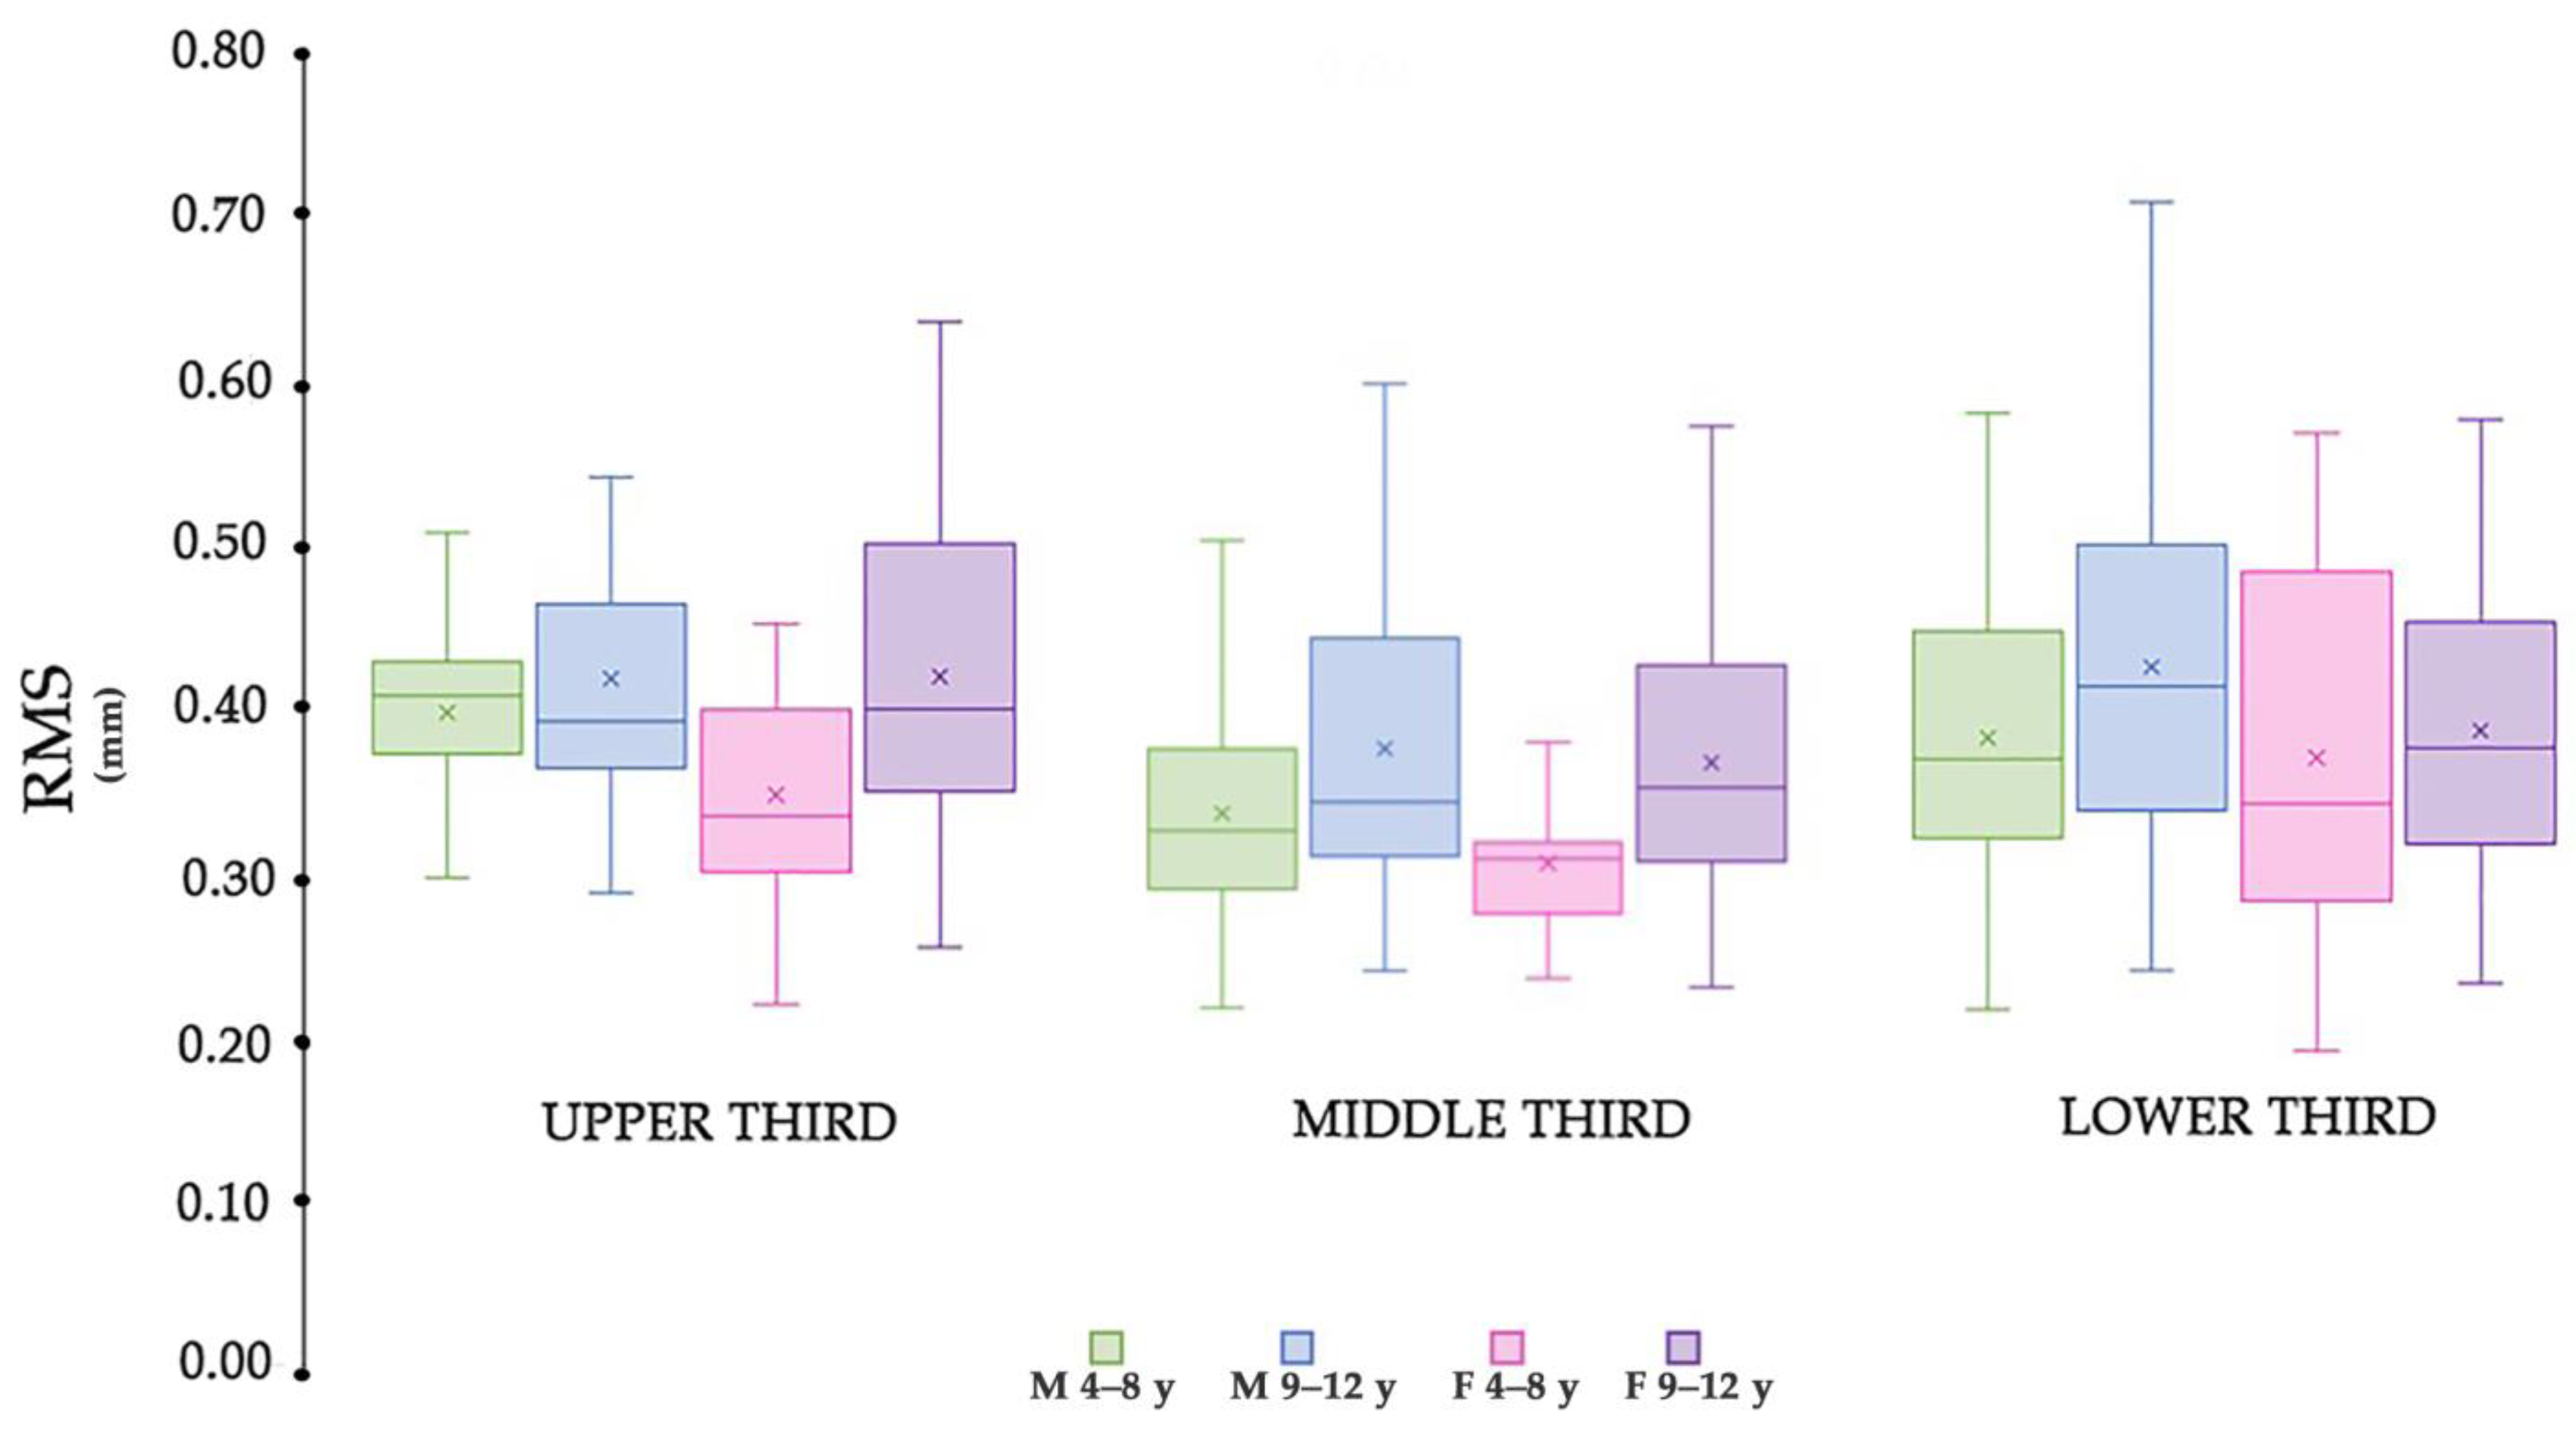
| Upper third (UT) | Mean (mm) | 0.39 (30 *) | 0.41 (35) | 0.34 (24) | 0.41 (35) |
| Standard deviation (mm) | 0.05 | 0.09 | 0.07 | 0.10 | |
| Range (Min–Max) | 0.29–0.50 | 0.28–0.69 | 0.21–0.45 | 0.25–0.63 | |
| Middle third (MT) | Mean (mm) | 0.33 (34) | 0.37 (38) | 0.30 (23) | 0.36 (36) |
| Standard deviation (mm) | 0.07 | 0.10 | 0.05 | 0.08 | |
| Range (Min–Max) | 0.21–0.50 | 0.24–0.59 | 0.23–0.39 | 0.23–0.57 | |
| Lower third (LT) | Mean (mm) | 0.38 (33) | 0.42 (39) | 0.36 (25) | 0.38 (36) |
| Standard deviation (mm) | 0.10 | 0.11 | 0.12 | 0.09 | |
| Range (Min–Max) | 0.21–0.58 | 0.23–0.71 | 0.18–0.56 | 0.23–0.57 | |
| F | p | Partial Eta Squared | |
|---|---|---|---|
| Sex | 8.04 | 0.005 * | 0.021 |
| Age | 23.22 | <0.001 * | 0.058 |
| Facial Thirds | 12.17 | <0.001 * | 0.061 |
| Sex × Age | 1.54 | 0.22 | |
| Sex × Facial Thirds | 0.10 | 0.90 | |
| Age × Facial Thirds | 0.39 | 0.68 | |
| Sex × Age × Facial Thirds | 1.34 | 0.26 |
Disclaimer/Publisher’s Note: The statements, opinions and data contained in all publications are solely those of the individual author(s) and contributor(s) and not of MDPI and/or the editor(s). MDPI and/or the editor(s) disclaim responsibility for any injury to people or property resulting from any ideas, methods, instructions or products referred to in the content. |
© 2023 by the authors. Licensee MDPI, Basel, Switzerland. This article is an open access article distributed under the terms and conditions of the Creative Commons Attribution (CC BY) license (https://creativecommons.org/licenses/by/4.0/).
Share and Cite
Cappella, A.; Solazzo, R.; Yang, J.; Hassan, N.M.; Dolci, C.; Gibelli, D.; Tartaglia, G.; Sforza, C. Facial Asymmetry of Italian Children: A Cross-Sectional Analysis of Three-Dimensional Stereophotogrammetric Reference Values. Symmetry 2023, 15, 792. https://doi.org/10.3390/sym15040792
Cappella A, Solazzo R, Yang J, Hassan NM, Dolci C, Gibelli D, Tartaglia G, Sforza C. Facial Asymmetry of Italian Children: A Cross-Sectional Analysis of Three-Dimensional Stereophotogrammetric Reference Values. Symmetry. 2023; 15(4):792. https://doi.org/10.3390/sym15040792
Chicago/Turabian StyleCappella, Annalisa, Riccardo Solazzo, Joshua Yang, Noha Mohamed Hassan, Claudia Dolci, Daniele Gibelli, Gianluca Tartaglia, and Chiarella Sforza. 2023. "Facial Asymmetry of Italian Children: A Cross-Sectional Analysis of Three-Dimensional Stereophotogrammetric Reference Values" Symmetry 15, no. 4: 792. https://doi.org/10.3390/sym15040792