Article

M6A-BERT-Stacking: A Tissue-Specific Predictor for Identifying RNA N6-Methyladenosine Sites Based on BERT and Stacking Strategy

1
College of Information Technology, Shanghai Ocean University, Shanghai 201306, China
2
College of Marine Sciences, Shanghai Ocean University, Shanghai 201306, China
*
Author to whom correspondence should be addressed.
Symmetry 2023, 15(3), 731; https://doi.org/10.3390/sym15030731
Submission received: 13 February 2023 / Revised: 3 March 2023 / Accepted: 13 March 2023 / Published: 15 March 2023

Abstract

:
As the most abundant RNA methylation modification, N6-methyladenosine (m6A) could regulate asymmetric and symmetric division of hematopoietic stem cells and play an important role in various diseases. Therefore, the precise identification of m6A sites around the genomes of different species is a critical step to further revealing their biological functions and influence on these diseases. However, the traditional wet-lab experimental methods for identifying m6A sites are often laborious and expensive. In this study, we proposed an ensemble deep learning model called m6A-BERT-Stacking, a powerful predictor for the detection of m6A sites in various tissues of three species. First, we utilized two encoding methods, i.e., di ribonucleotide index of RNA (DiNUCindex_RNA) and k-mer word segmentation, to extract RNA sequence features. Second, two encoding matrices together with the original sequences were respectively input into three different deep learning models in parallel to train three sub-models, namely residual networks with convolutional block attention module (Resnet-CBAM), bidirectional long short-term memory with attention (BiLSTM-Attention), and pre-trained bidirectional encoder representations from transformers model for DNA-language (DNABERT). Finally, the outputs of all sub-models were ensembled based on the stacking strategy to obtain the final prediction of m6A sites through the fully connected layer. The experimental results demonstrated that m6A-BERT-Stacking outperformed most of the existing methods based on the same independent datasets.

1. Introduction

Similar to DNA, RNA also undergoes diverse chemical modifications, and such modifications play a pivotal role in various cellular and biological processes [1]. According to the MODOMICS database [2], more than 170 different types of RNA modifications have been identified. Among them, N6-methyladenosine (m6A) refers to the methylation of the N6-position of adenosine, which is the most prevalent internal modification present on eukaryotic mRNA and dynamically regulated by the methyltransferases and demethylases [3]. Recent studies have shown that m6A could occur in different tissues of various species and affect multiple aspects of RNA metabolism such as translation, splicing, export, degradation, and microRNA processing, which is closely associated with numerous types of human cancers [4]. For instance, Cheng et al. discovered that m6A maintains asymmetric and symmetric division of hematopoietic stem cell (HSC) by modulating Myc mRNA abundance and may serve as a guardian in HSC fate decisions [5]. Therefore, the accurate identification of m6A locations is of great importance for the study of the downstream effects of RNA modification in life science and could help to understand disease mechanisms and drug development [6].
Over the past decade, several experimental methods have been developed to detect the precise location of m6A sites on RNA including MeRIP [7], m6A-seq [8], PA-m6A-seq [9], and miCLIP [10]. Despite their efficacy, these experimental techniques are usually time-consuming and laborious, making them insufficient for large-scale genomic data [11]. Therefore, there is an urgent need to explore computational methods that can accurately and efficiently identify m6A sites only based on sequence information. From the machine learning perspective, identification of RNA m6A sites could be formulated as a binary classification problem. To date, a great deal of m6A site prediction algorithms and web servers have been proposed to address this challenge, mainly including machine learning-based algorithms and deep learning-based algorithms. These methods differ in feature encoding schemes and classifiers. For instance, Chen et al. explored the first predictor of m6A sites, called iRNA-Methyl, based on support vector machine (SVM) and pseudo nucleotide composition [12]. Subsequently, many other predictors have been proposed for the identification of m6A sites by utilizing different machine learning algorithms and various sequence features, such as SRAMP [11], TargetM6A [13], RAM-ESVM [14], RFAthM6A [15], M6APred-EL [16], PXGB [17], ERT-m6Apred [18], TL-Methy [19], and so on. Recently, some predictors based on the deep learning framework have also been developed and shown effective performance [20,21,22]. For example, Nazari et al. [23] designed a convolutional neural network (CNN) model to predict m6A sites, named iN6-Methyl, in which the RNA sequences were automatically encoded by the natural language technique word2vec. Similarly, Tahir et al. [24] also introduced a highly discriminative CNN model, called m6A-word2vec, for the identification of m6A sites, which showed better performance compared to existing prediction tools by using the 10-fold cross-validation (CV). Lately, Wang et al. [25] developed a two-stage multi-task deep learning method for predicting RNA m6A sites of Saccharomyces cerevisiae, which integrated CNN and bidirectional long short-term memory (BiLSTM) framework in the first stage and adopted a transfer-learning strategy to build the final prediction model in the second stage. These methods have been reviewed in the articles [26,27].
Additionally, some studies focused on the computational prediction of m6A sites in different tissues and species [28,29,30,31,32,33,34]. For example, Dao et al. [32] explored an SVM-based classifier named iRNA-m6A to identify m6A sites in various tissues of humans, mice, and rats, which utilized three kinds of sequence feature encoding techniques and applied the minimum redundancy maximum relevance (mRMR) algorithm to select the optimal feature subset. Soon afterward, Liu et al. [31] developed a CNN-based model, called im6A-TS-CNN, to improve the recognition of m6A sites in multiple tissues by using the one-hot encoding scheme. Recently, Jia et al. [35] introduced an ensemble deep learning predictor to further enhance the identification of m6A sites in five tissues of mammals based on three hybrid neural networks (hereinafter referred to as m6A-neural-network), including a CNN, a capsule network, and a bidirectional gated recurrent unit (BiGRU) with the self-attention mechanism. Table 1 lists some representative cross-species prediction methods of RNA m6A sites.
Furthermore, the bidirectional encoder representations from the transformers (BERT) model, which is one of the self-attention-based deep learning architectures, have achieved state-of-the-art performance in the field of natural language processing (NLP) [36,37]. As a genomic version of pre-trained BERT models, DNABERT could obtain global and transferrable understanding of DNA sequences based on upstream and downstream nucleotide contexts [38], which has been fine-tuned for the recognition of DNA enhancers [39], identification of DNA methylations [40], and prediction of RNA-protein interactions [41]. Inspired by these previous studies, we put forward an ensemble deep learning framework, named m6A-BERT-Stacking, for further improving the tissue-specific identification of m6A sites in different species. M6A-BERT-Stacking first adopted two feature representation techniques, i.e., di ribonucleotide index of RNA (DiNUCindex_RNA) and k-mer word segmentation, and established three sub-models, including residual networks with convolutional block attention module (Resnet-CBAM), BiLSTM with attention (BiLSTM-Attention), and DNABERT. Then, a fully connected network was constructed to integrate the outputs of these sub-models for the final prediction of m6A sites based on the stacking scheme. In order to objectively evaluate the performance of m6A-BERT-Stacking, five-fold CV and independent test were performed on benchmark datasets of three different species. The comprehensive comparison results suggested that the proposed model achieved competitive performance and could serve as a helpful tool for the precise location of m6A sites. Figure 1 illustrates the workflow diagram of the m6A-BERT-Stacking method. The novelty of our model lies in the two aspects: (1) the knowledge from the pre-trained DNABERT model was extracted as feature embeddings and applied to represent the m6A sites for the first time; and (2) the stacking strategy was adopted to integrate the outputs of three deep learning models for improving the overall prediction accuracy and the robustness of our model.

2. Materials and Methods

2.1. Benchmark Datasets

Constructing a high-quality benchmark dataset is the critical step for establishing a robust and efficient classification model. In the present work, we trained and evaluated the proposed method on the benchmark datasets constructed by Dao et al. [32], which include 11 training datasets and 11 independent datasets in different tissues of human (brain, liver, and kidney), mouse (brain, liver, heart, testis, and kidney), and rat (brain, liver, and kidney). Specifically, each dataset contains the same number of positive and negative samples, where all samples are 41-length RNA sequences with the adenine at the center. To reduce the homology bias, the redundant sequences with sequence similarity above 80% were removed by using the CD-HIT software v4.5.7 [42]. The detailed information on the benchmark datasets is listed in Table 2.

2.2. Feature Encoding Algorithms

Feature encoding plays a key role in improving the performance of a machine learning or deep learning model. In this study, we transformed the RNA sequences into feature matrices by utilizing DiNUCindex_RNA [43] and k-mer word segmentation [44].

2.2.1. DiNUCindex_RNA

The nucleotide is the basic composition of RNA, and its physical and chemical properties can affect the genetic characteristics of RNA sequences to some extent. There are 4 × 4 = 16 different dinucleotides (2-mers) in an RNA sequence. Each dinucleotide has 22 different physical–chemical (PC) properties in the specific databases such as DiProDB [45] and KNIndex [46], including p c 1 : Slide, p c 2 : Adenine content, p c 3 : Hydrophilicity, p c 4 : Stacking energy, and so on.
If the length of an RNA sequence D is L nt, its intuitive expression is
D = R 1 R 2 R 3 R L 1 R L , R i A , C , G , U ,
where R i represents the i -th nucleic acid in the RNA sequence, and L = 41 in this study.
DiNUCindex_RNA replaces dinucleotides in the sequence with their PC properties. Hence, the RNA sequence D can be transformed into a PC matrix of 22 × 40 dimension as follows:
P C = p c 1 R 1 R 2 p c 1 R 2 R 3 p c 1 R 40 R 41 p c 2 R 1 R 2 p c 2 R 2 R 3 p c 2 R 40 R 41 p c 22 R 1 R 2 p c 22 R 2 R 3 p c 22 R 40 R 41 .

2.2.2. K-mer Word Segmentation

The second feature encoding technique is k-mer word segmentation, which could capture the relationship between nucleotides and achieve superior performance compared to one-hot encoding when used for the prediction of DNA m6A sites [44].
For the k-mer word segmentation of RNA sequences, we constructed the word dictionary (RNA_WD) as follows:
R N A W D = W 1 : 0 , W 2 : 1 , W 3 : 2 , , W 4 k 1 : 4 k 2 , W 4 k : 4 k 1 ,
where W i ( 1 i 4 k ) represents the i-th possible k-mer. According to RNA_WD, the RNA sequence with the length of L can be mapped to a numerical vector with the dimension of L − k + 1 by sliding the fixed-length window.
In this study, the value of parameter k was set to 3 based on the prepared test results of Huang et al. [44]. Thus, the 39-dimensional feature vectors were finally obtained to represent the RNA sequence samples.

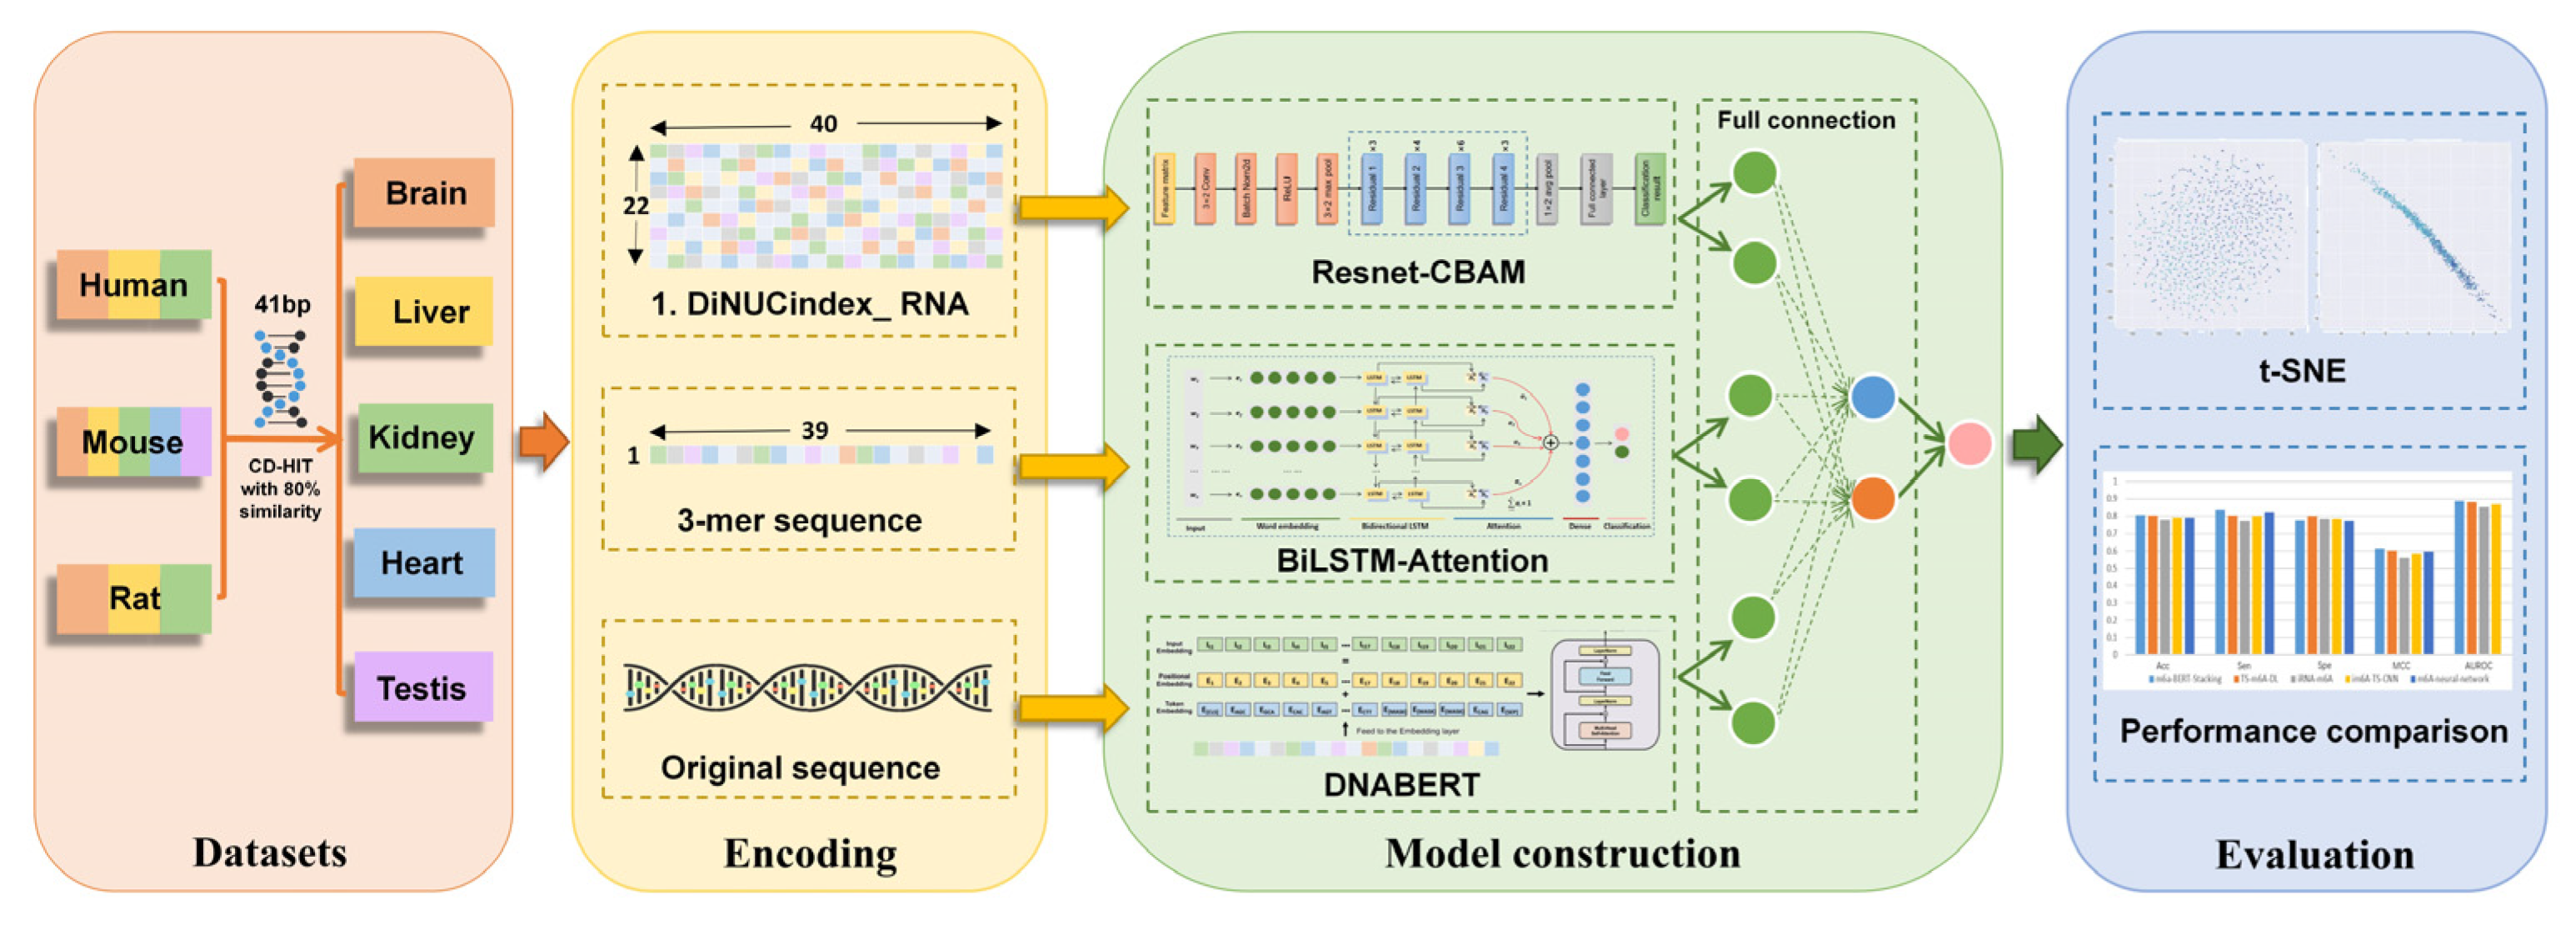
2.3. Deep Learning Model Architecture
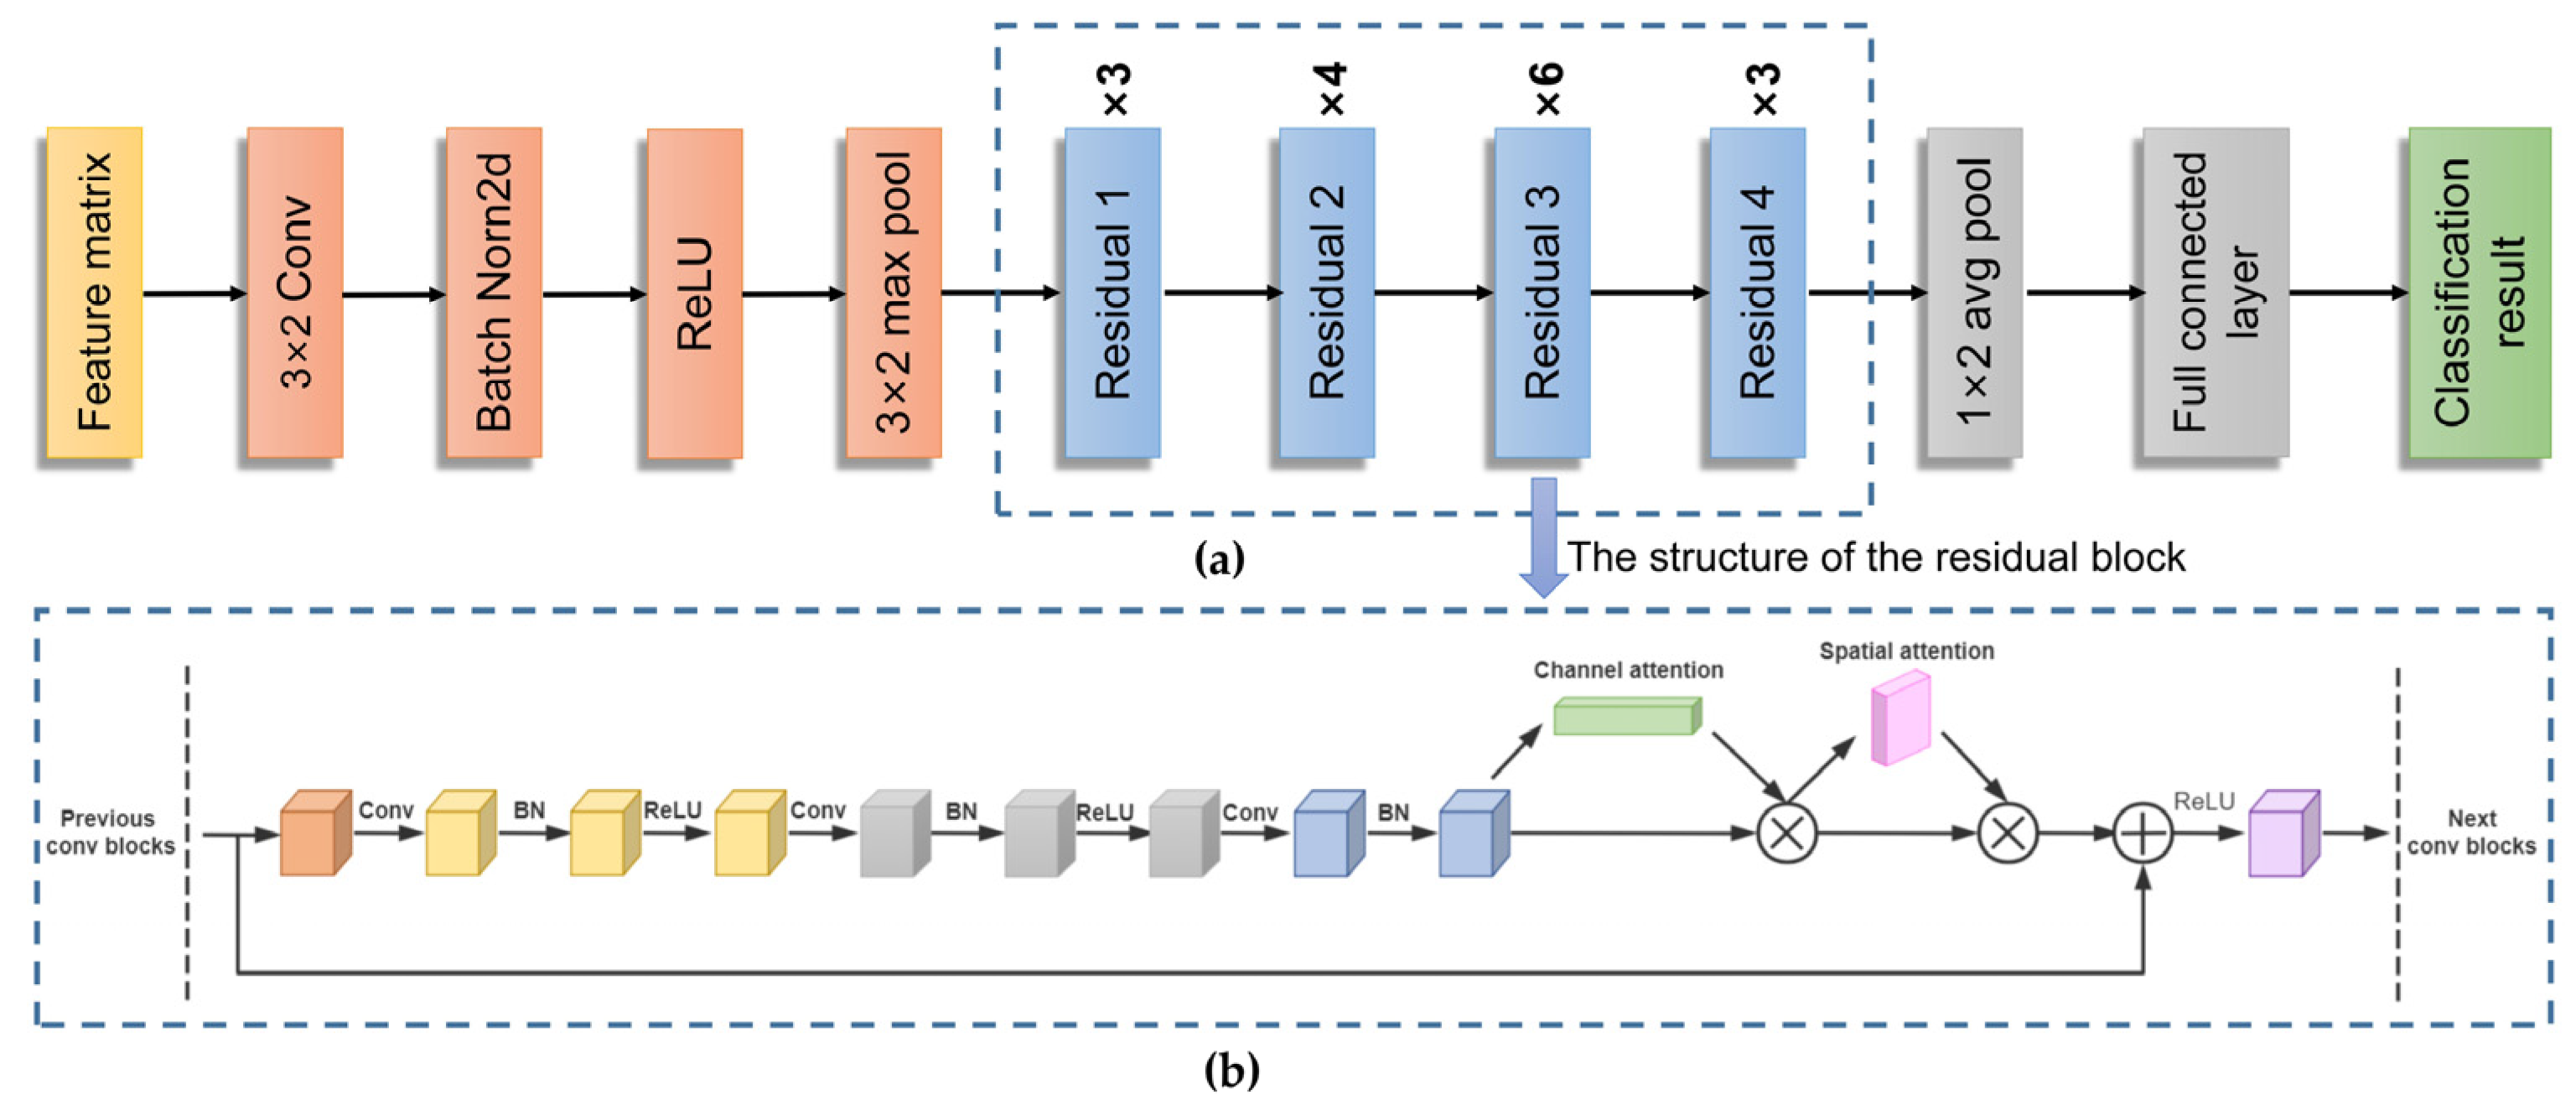
2.3.1. Resnet-CBAM

CNN is one of the widely used deep learning techniques, which can automatically collect all worthwhile information from the features of RNA sequences during the training process. However, when trying to use deeper networks, a degradation problem is likely to emerge: as the depth of the network increases, the accuracy becomes saturated and then degrades rapidly [47]. To avoid this problem and achieve a balance between model accuracy and stability, a 50-layer residual neural network (Resnet) with a convolutional block attention module (CBAM) [48], called Resnet-CBAM, was adopted in the present study.
We redesigned the network structure of Resnet-CBAM according to the size of our input feature matrix. Figure 2 shows the overall network structure of Resnet-CBAM. In Figure 2a, 3 × 2 Conv and Batch Norm2d represent the meaning of the convolution (Conv) layer with kernel size 3 × 2 and 2-dimensional batch normalization (BN) layer. 3 × 2 max pool and 1 × 2 avg pool stand for maximum (max) pooling layer with kernel size 3 × 2 and average (avg) pooling layer with kernel size 1 × 2 , respectively. Further, Residuals 1, 2, 3, and 4 mean diffident structures of residual blocks. The structural details of the individual residual blocks are shown in Figure 2b and the specific parameters of the network structure are available in Supplementary Table S1. As shown in Figure 2b, the residual block module was designed by using two sequential sub-modules, i.e., channel attention and spatial attention, which can adaptively recalibrate the intermediate feature maps.

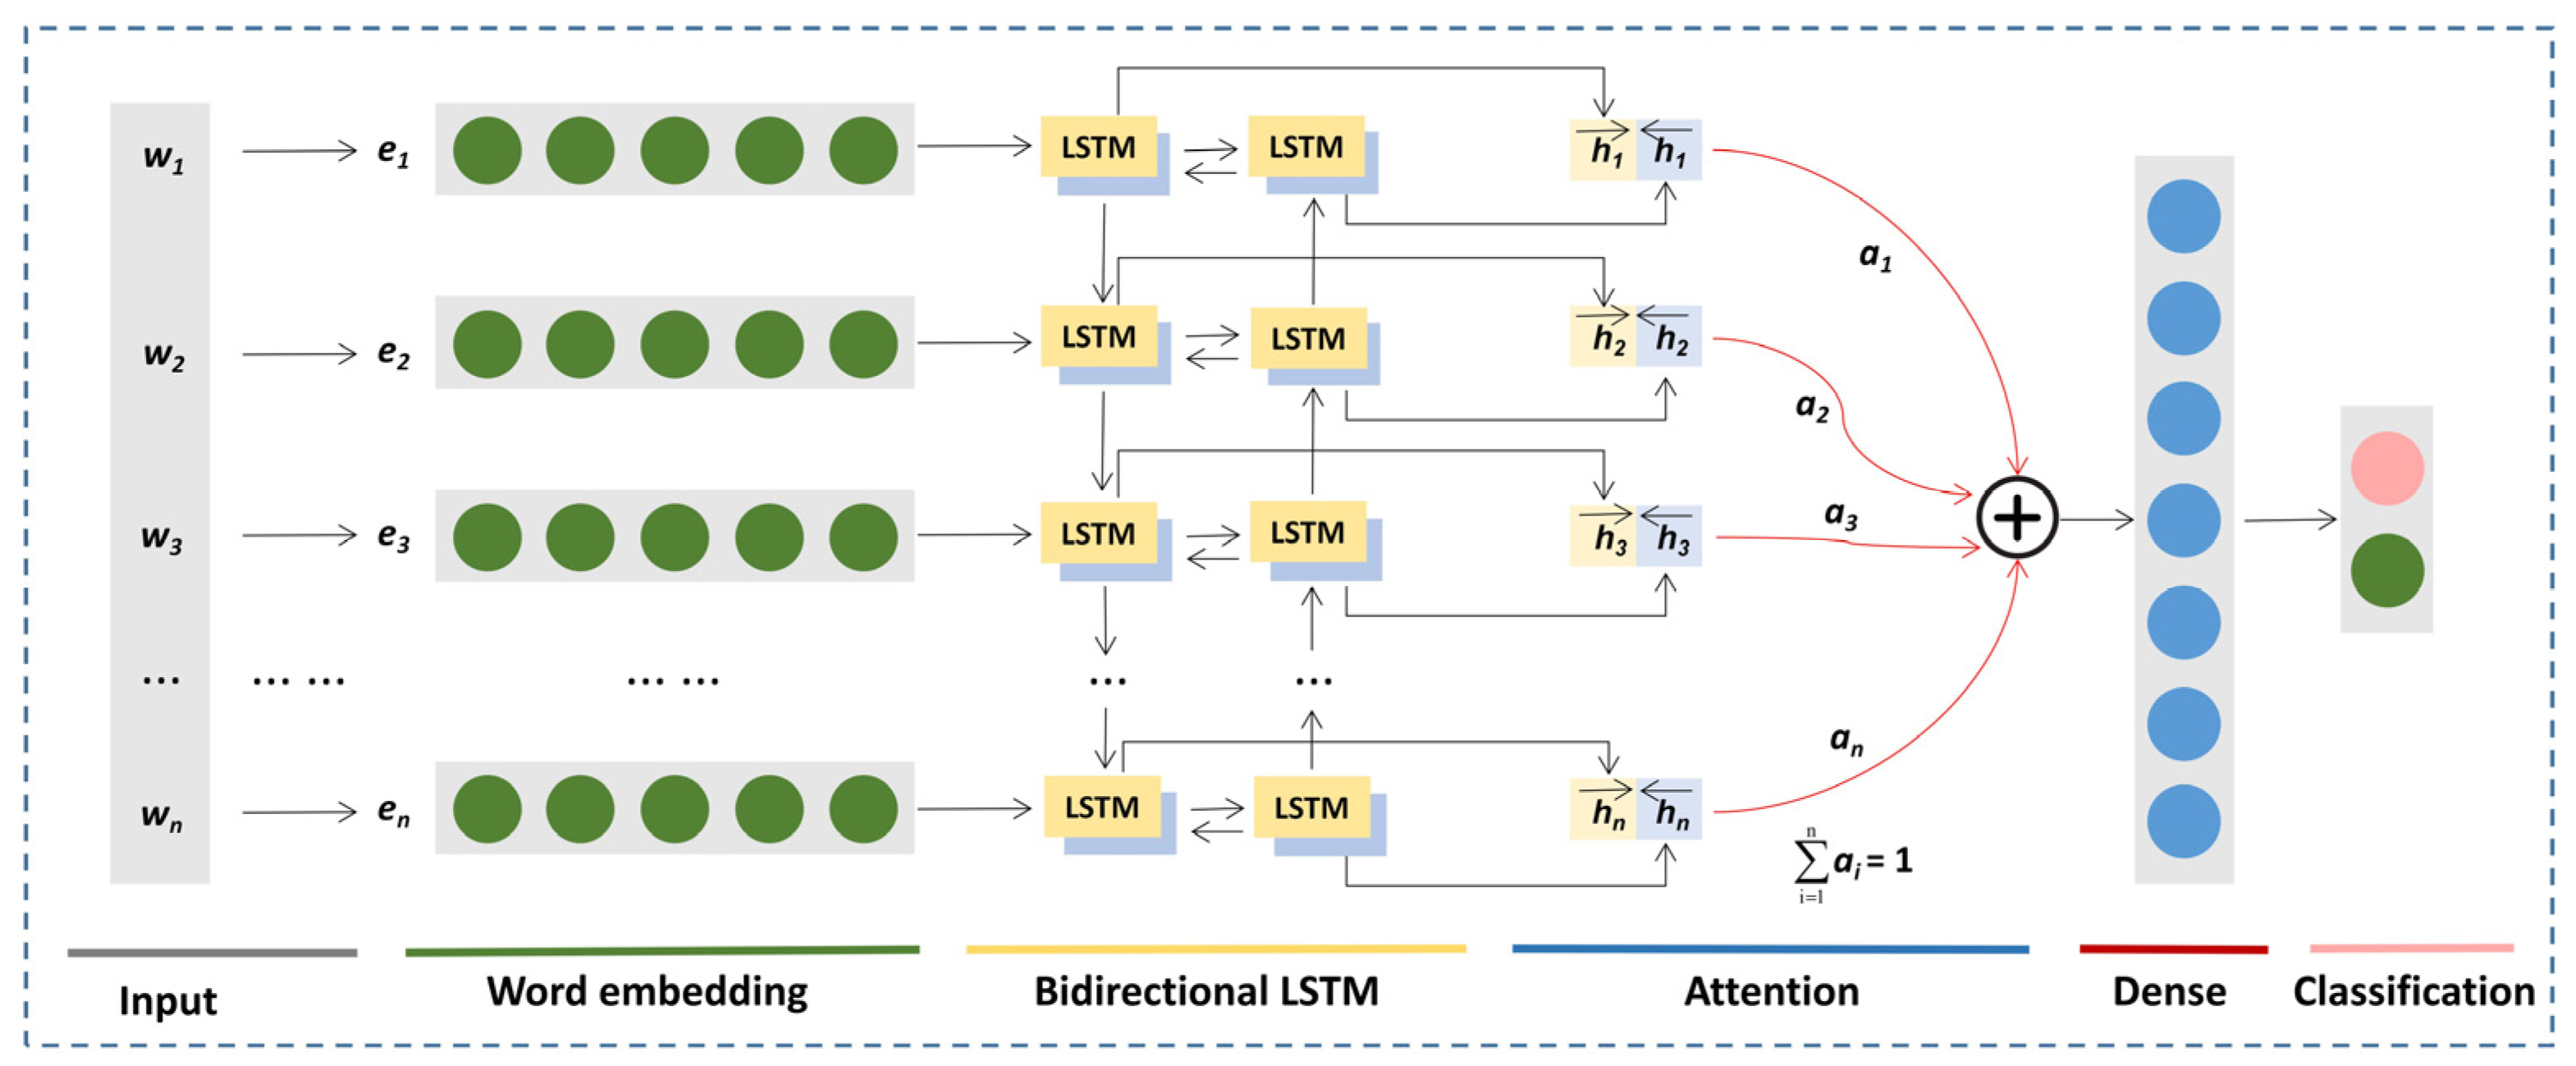
2.3.2. BiLSTM-Attention

LSTM is an architecture of recurrent neural network (RNN), which is suitable for specific tasks related to sequential data, such as NLP and time series [49]. However, the LSTM network processes sequences in chronological order, which ignores connections between contexts. In order to access the future and past context of the current state, BiLSTM extends the unidirectional LSTM network by introducing the second layer, where the hidden-to-hidden connections flow in the opposite temporal order. Therefore, BiLSTM can incorporate forward and backward information in a sequence and capture the interrelation throughout the sequence [49,50].
In this work, BiLSTM combined with attentive neural networks [51] was introduced to address the difficulty of learning a reasonable vector representation for the model. The model structure of BiLSTM-Attention is shown in Figure 3. Specifically, w 1 , w 2 , , w n mean the feature vectors obtained by the k-mer word segmentation and e 1 , e 2 , , e n represent word vectors processed by the word embedding layer, where n is the length of the input. In addition, h 1 , h 2 , , h n and h 1 , h 2 , , h n denote forward and backward values produced by LSTM layers, which are combined with different attention weights a 1 , a 2 , , a n . The dense layer was designed to reduce the dimensionality of the output from the preceding layer and then generate the final classification result.

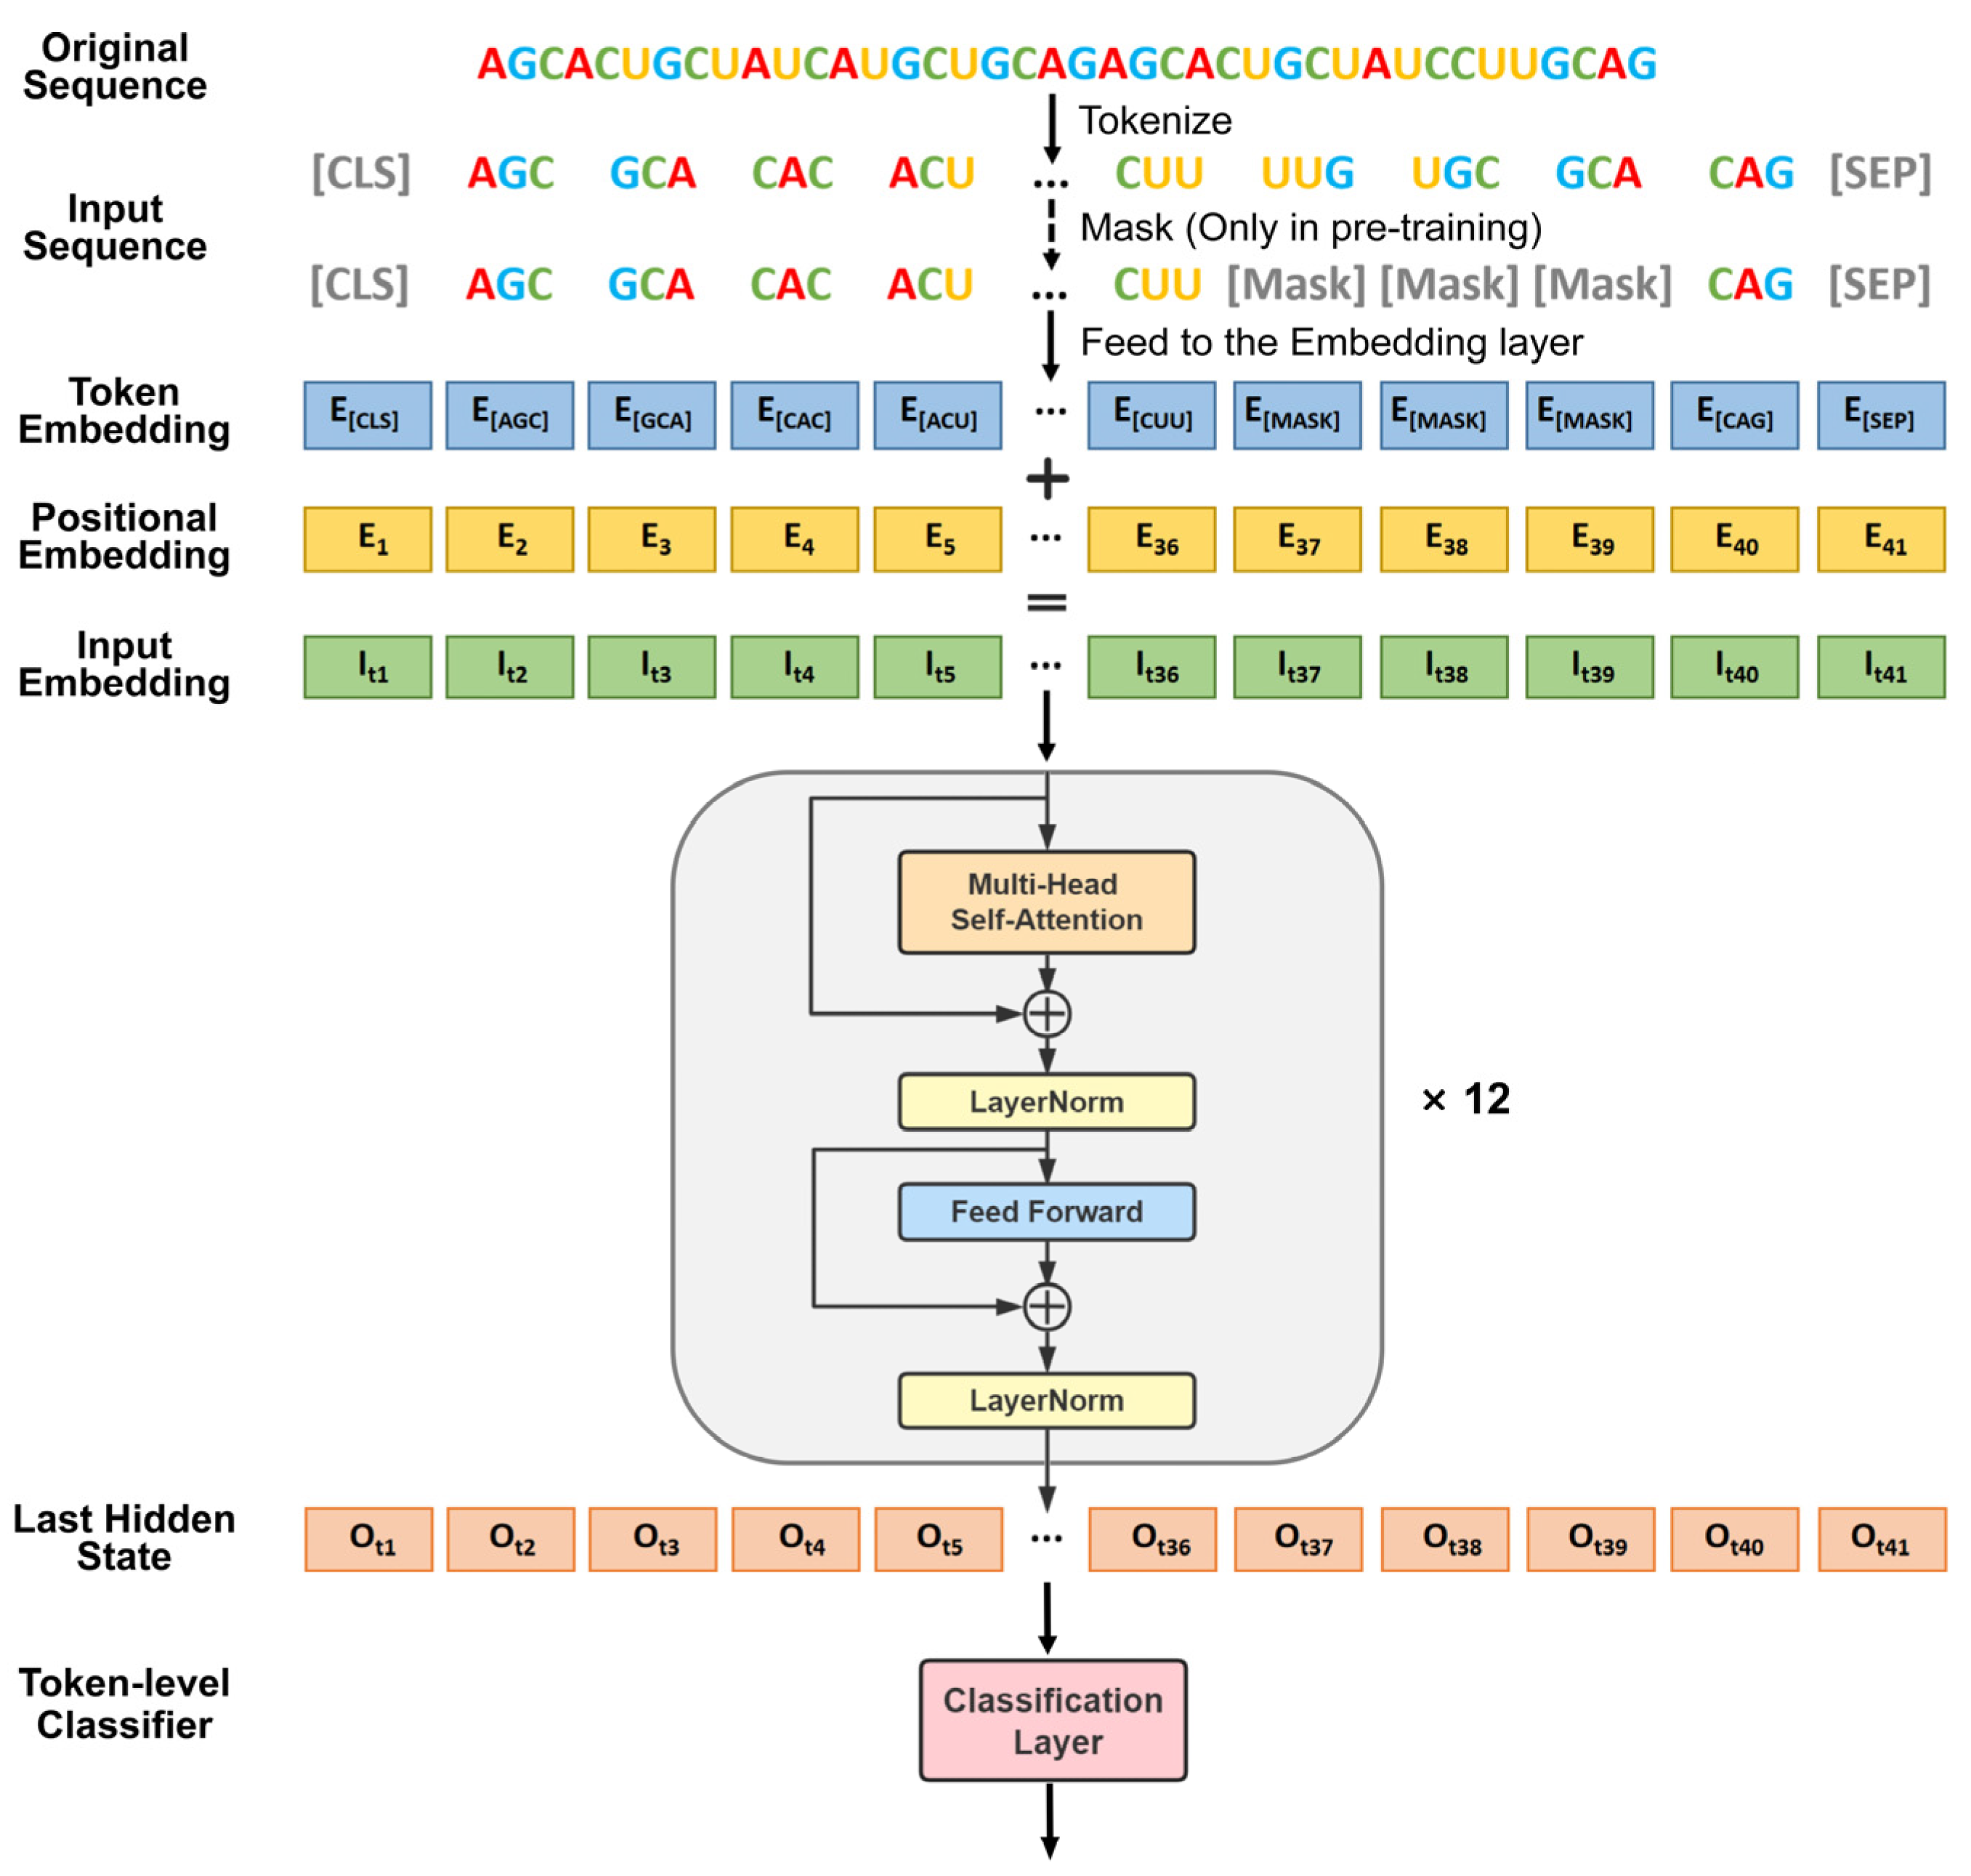
2.3.3. Fine-Tuned DNABERT

BERT has received much attention in recent years because of its superior technology applicable to a wide range of tasks in various fields [52]. Inspired by the excellent performance of BERT, DNABERT was proposed to decipher the language of non-coding DNA by capturing upstream and downstream nucleotide contexts with attention mechanism [38]. More importantly, the pre-trained DNABERT model can be fine-tuned for many other tasks of sequence analysis. Since RNA and DNA sequences have similar base compositions, their syntax and semantics remain largely the same. The only difference is that RNA contains the base uracil (U) instead of the thymine (T) in DNA. The model parameters of DNABERT were transferred and initialized to fit the task of m6A sites prediction in this study.
The certain structure of DNABERT is shown in Figure 4. Specifically, we tokenized an RNA sequence with the k-mer representation and added two special tokens, i.e., [CLS] and [SEP], at both ends, which stand for classification token and separation token, respectively. In the pre-training step, sequential k-length spans of certain k-mers were masked, while the tokenized sequence was directly input into the embedding layer in the fine-tuning step. Furthermore, the same architecture with DNABERT was adopted in our model, which is composed of 12 transformer layers with 12 attention heads in each layer.

2.3.4. Fully Connected Network

The outputs of Resnet-CBAM, BiLSTM-Attention, and fine-tuned DNABERT were fed into a fully connected network with double layers. The first layer consisted of six neurons, and the second layer contained two units for predicting two classes (m6A samples and non-m6A samples). Additionally, the sigmoid activation function was selected to normalize the result of the output layer. Obviously, the performance of three sub-models determined the weights of their influence on the final classification result. This stacking-based ensemble learning often could improve the classification accuracy and generalization capability of the model.

2.4. Performance Assessment

In this study, we adopted the 5-fold CV and the independent test to evaluate the performance of the proposed model. Additionally, four criteria, i.e., sensitivity (Sen), specificity (Spe), accuracy (Acc), and Matthews correlation coefficient (MCC) were used to assess the predictive ability of our method. They are defined as the following equations:
S e n = T p T p + F n ,
S p e = T n T n + F p ,
A c c = T p + T n T p + F p + F n + T n ,
M C C = T p × T n F p × F n ( T p + F p ) ( T p + F n ) ( T n + F p ) ( T n + F n ) ,
where T p ,   F p ,   T n ,   F n denote the numbers of the true positive, false positive, true negative, and false negative samples, respectively.
To better illustrate the classification efficiency of the proposed method, we also drew the receiver operating characteristic (ROC) curves by setting the true positive rate (i.e., Sen) and the false positive rate (i.e., 1-Spe) as the vertical axis and the horizontal axis, respectively. In addition, the area under the ROC curve (AUROC) was concomitantly used as another indicator for evaluating the performance of our model.

3. Results and Discussions

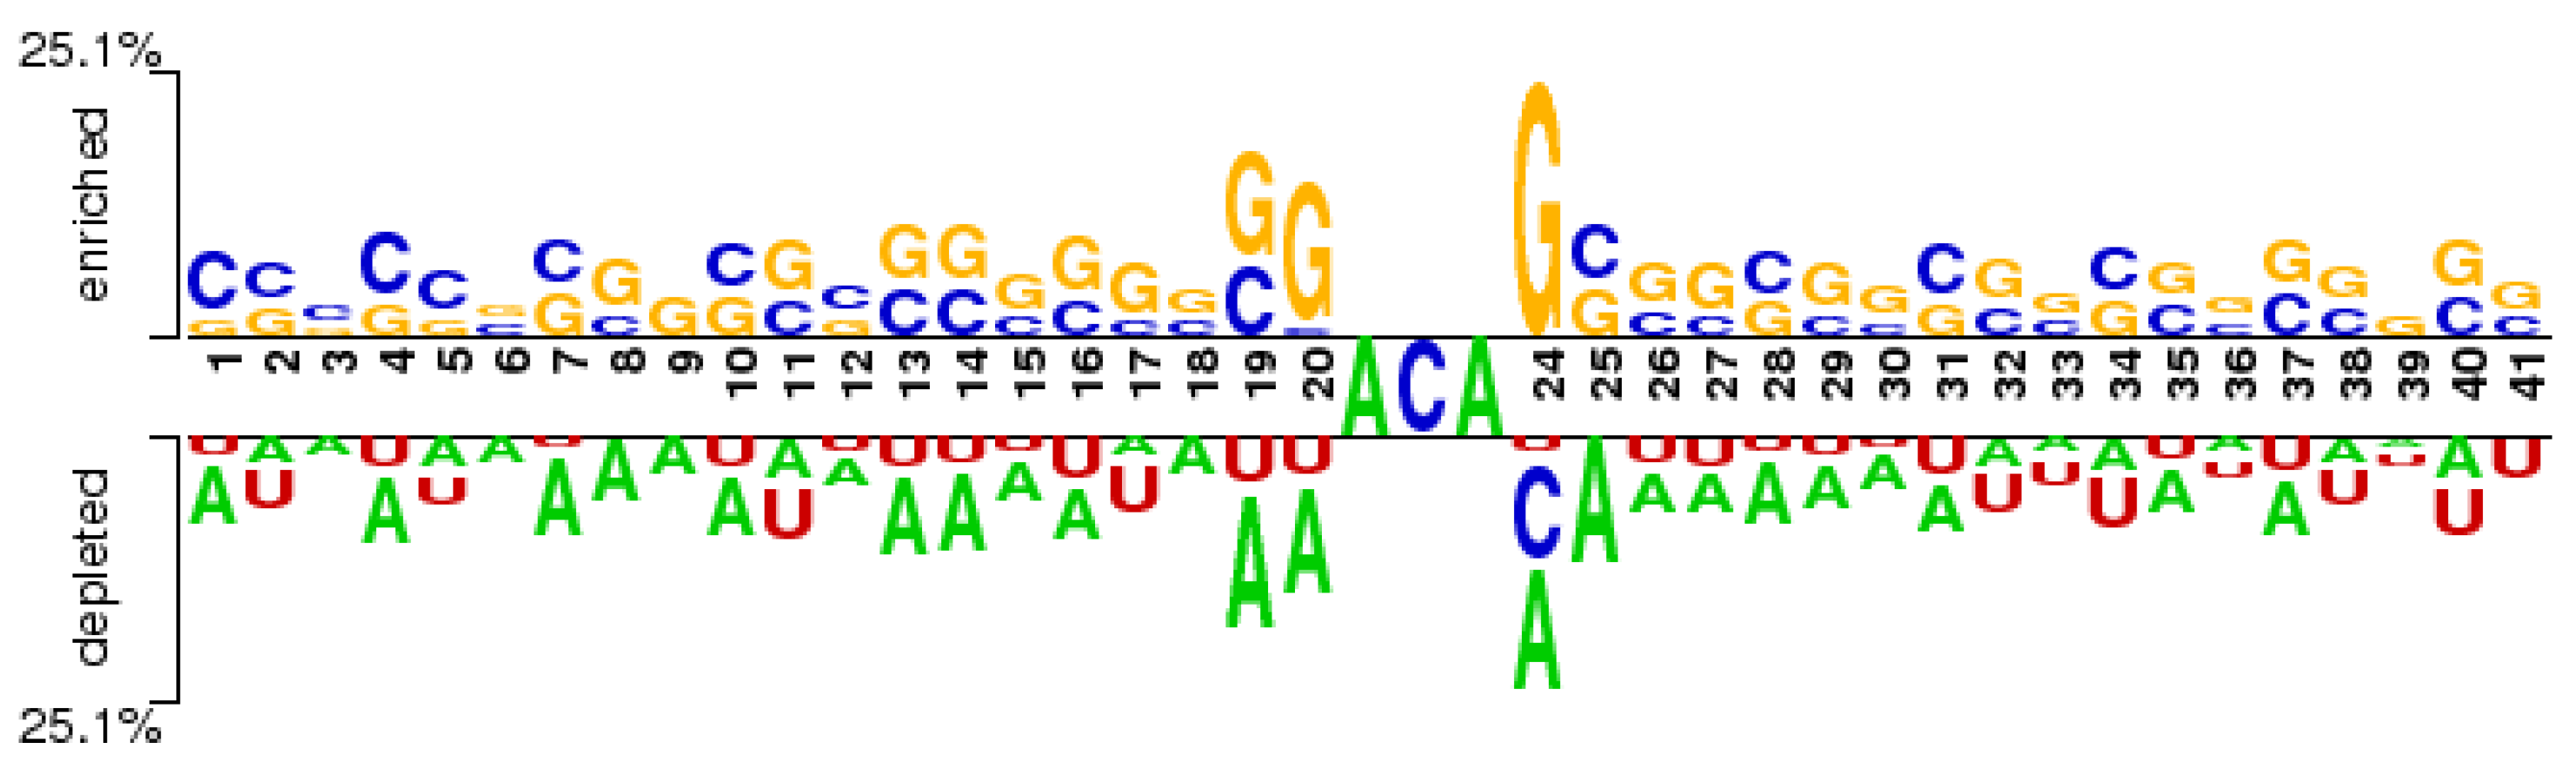
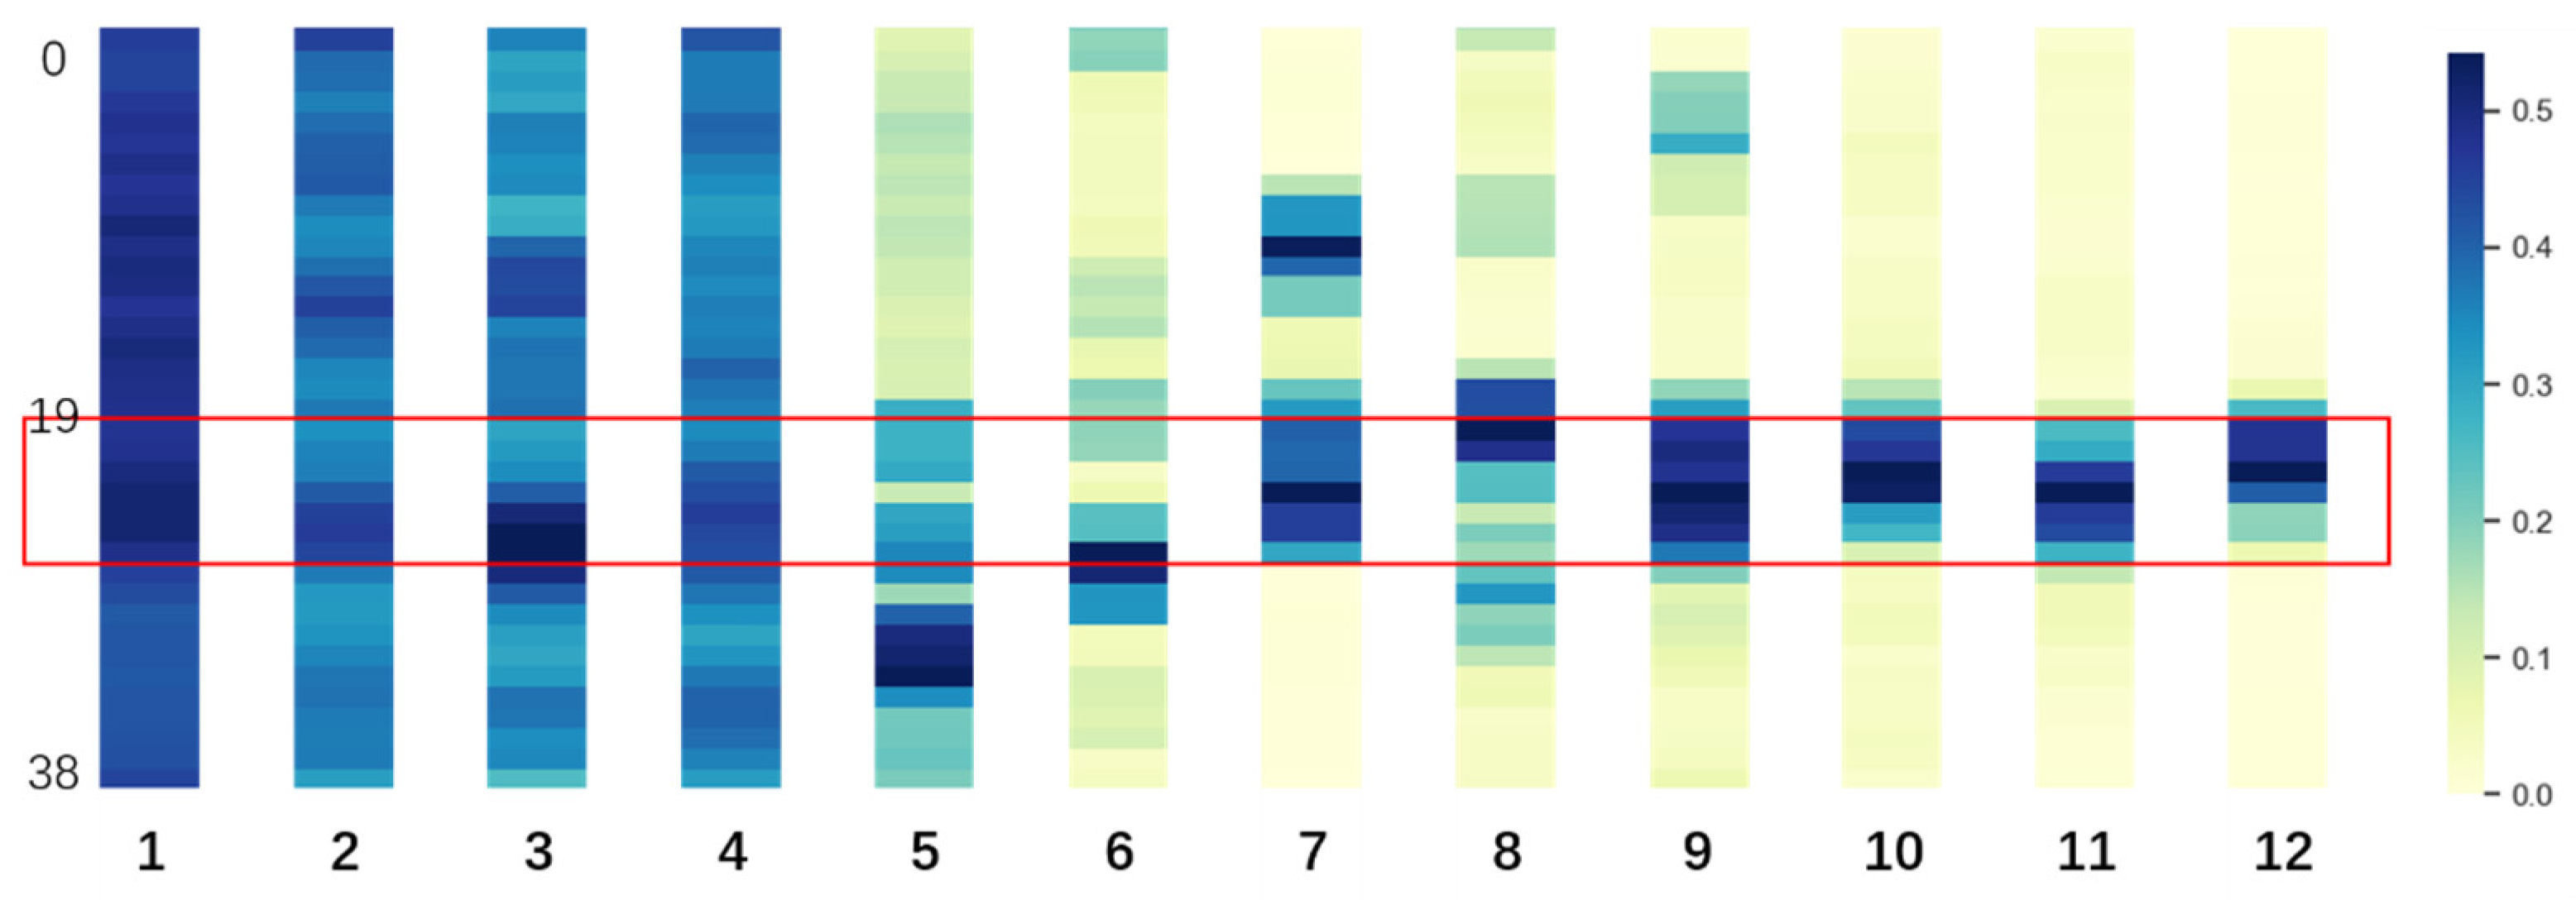
3.1. Fine-Tuned DNABERT Attention Analysis

In this section, we investigated whether the fine-tuned DNABERT can capture important biological information by analyzing the nucleotide distribution of RNA sequences and the region of attention mechanism concern. A popular web-based tool called Two-Sample Logo [53] was performed to illustrate the compositional biases between m6A and non-m6A sites. The result of the H_b dataset was shown in Figure 5, and the ones of other datasets were described in Supplementary Figure S1.
As illustrated in Figure 5, the sequence context around a potential site is represented by a sequence window of 41 nucleotides, with the modification site at the center and the enriched or depleted nucleotides in the positive samples located above or below the horizontal axis. Clearly, the significant differences between m6A samples and non-m6A samples are that guanine (G) and cytosine (C) are relatively enriched around the m6A sites, while U and adenine (A) are prone to gather around the non-m6A sites. Thus, it is feasible to explore a computational method to predict potential m6A sites only based on sequence information.
In addition, we utilized the visualization module of DNABERT to illustrate the important regions that contribute to the model decisions. Figure 6 shows the learned attention maps of the H_b dataset in 12 DNABERT attention layers, where the vertical axis means the locations of the input sequences. As we can see, the locations of 12 multi-head self-attention focus layers happen to appear downstream of the center (boxed regions), which is consistent with the result displayed in Figure 5. It suggests that DNABERT could correctly focus on important regions of known m6A sites and learn informative feature representation from input sequences.

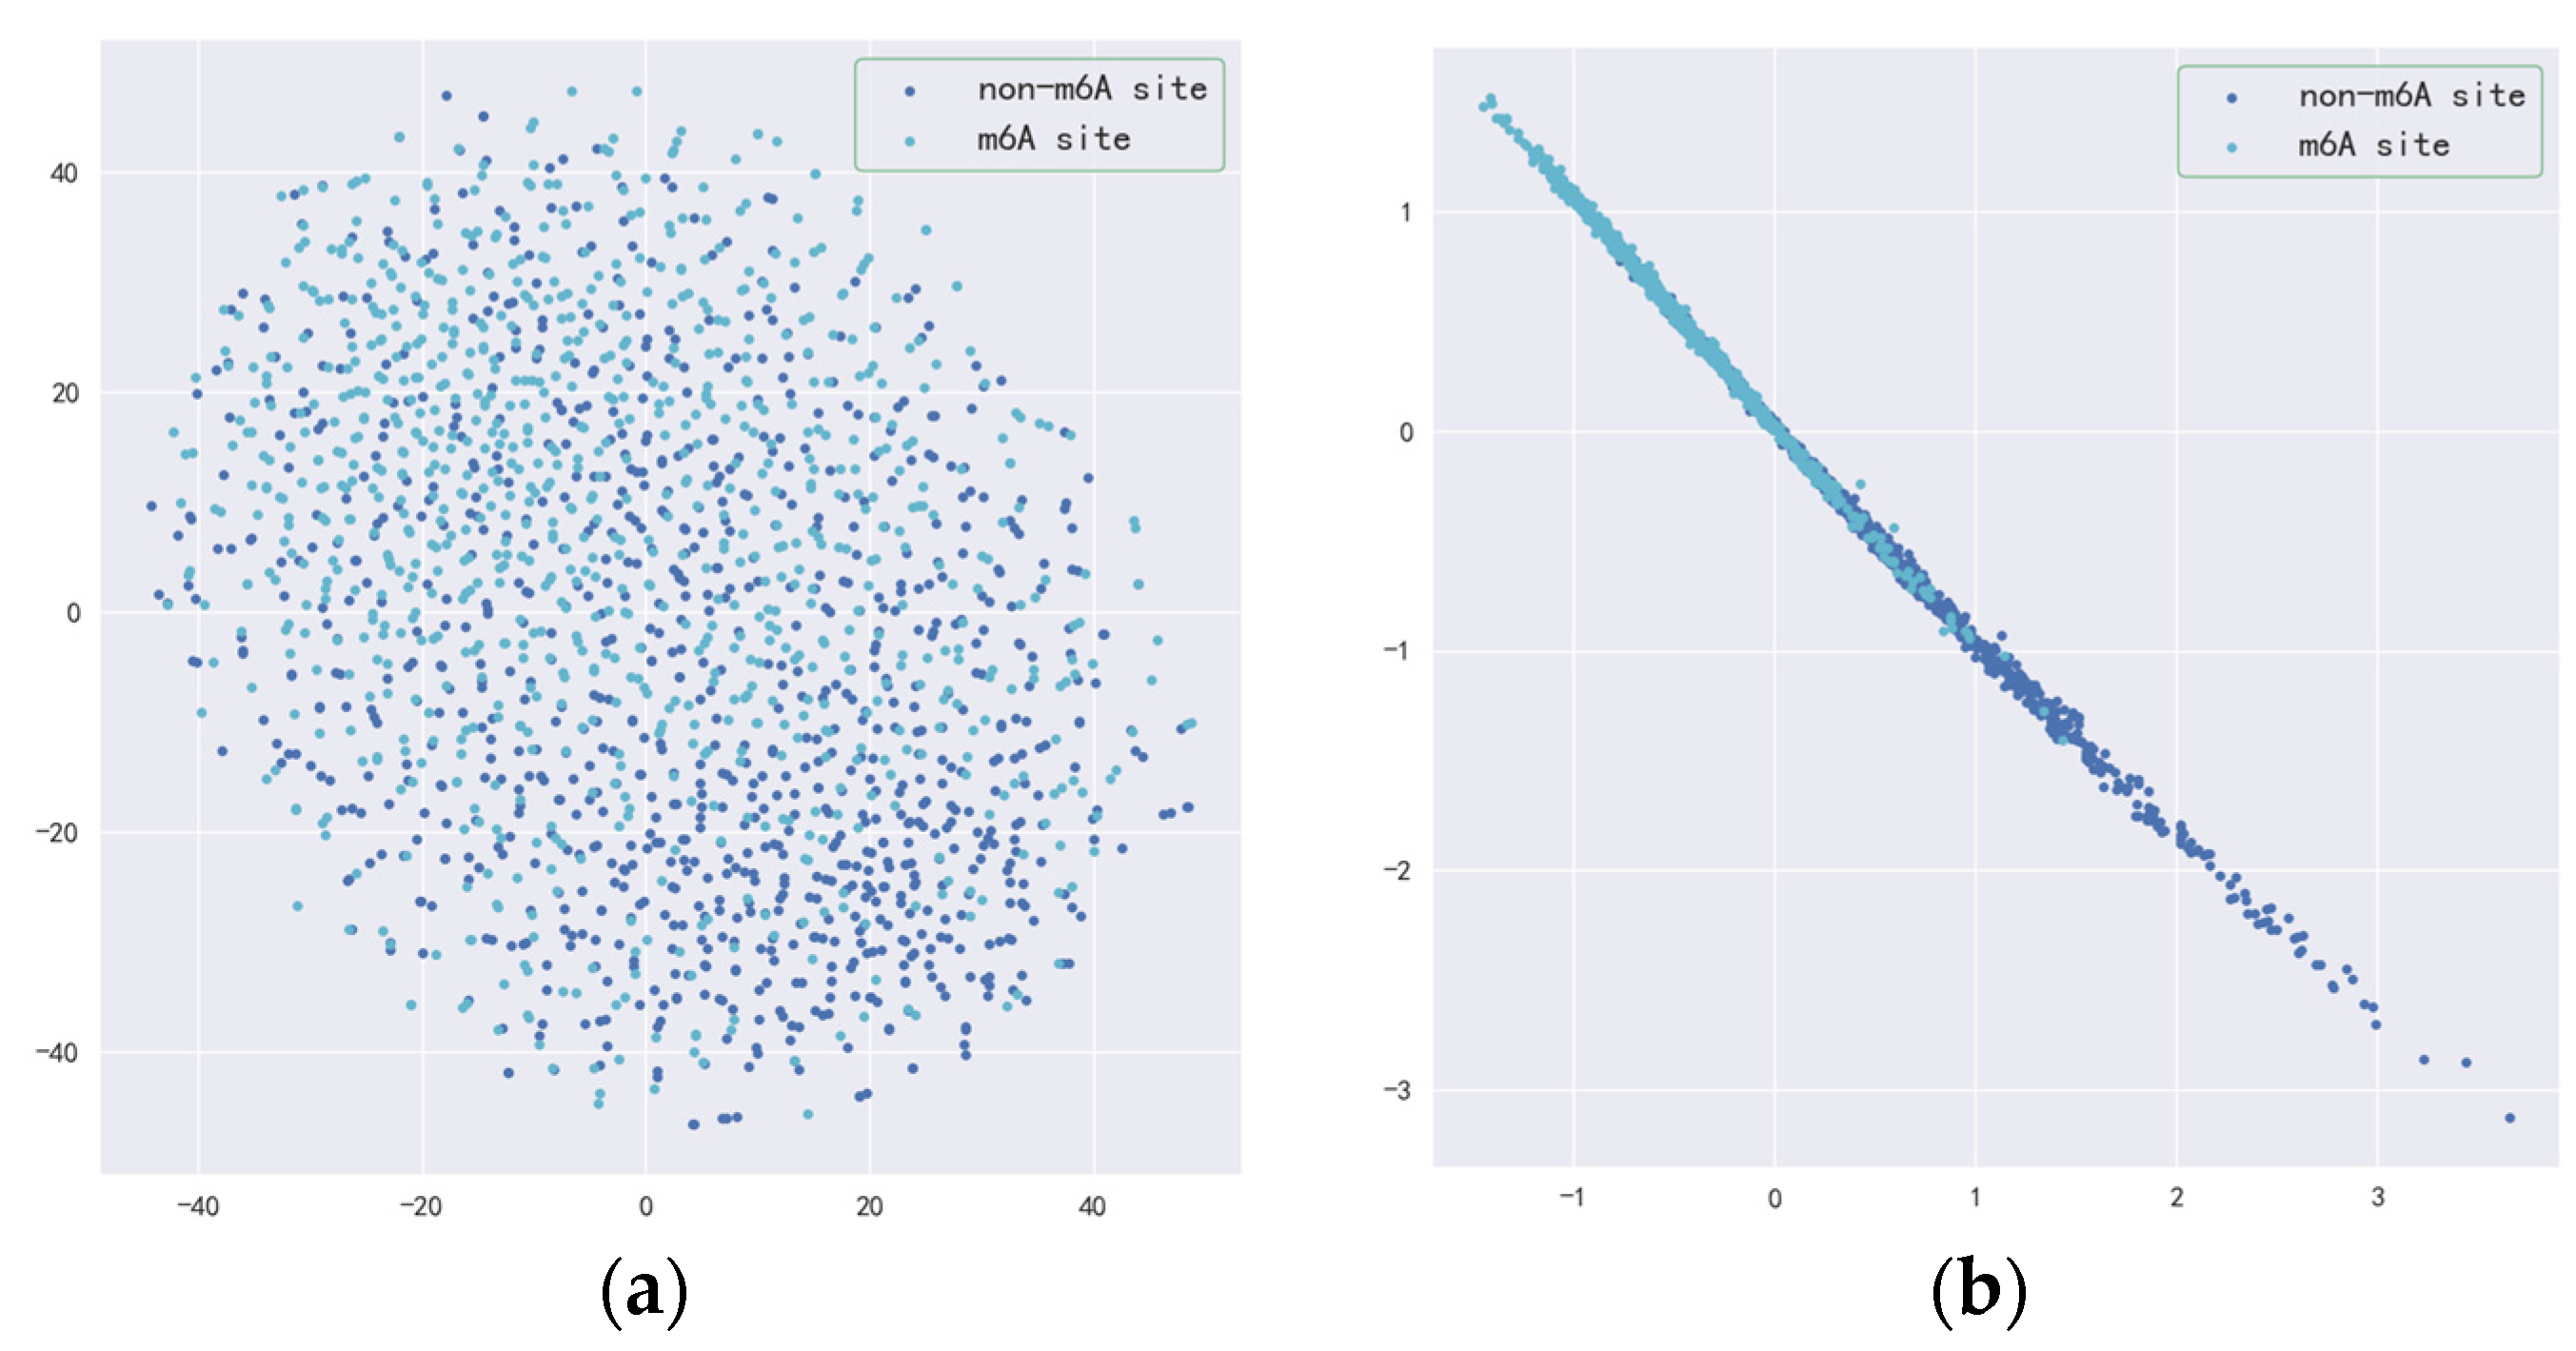
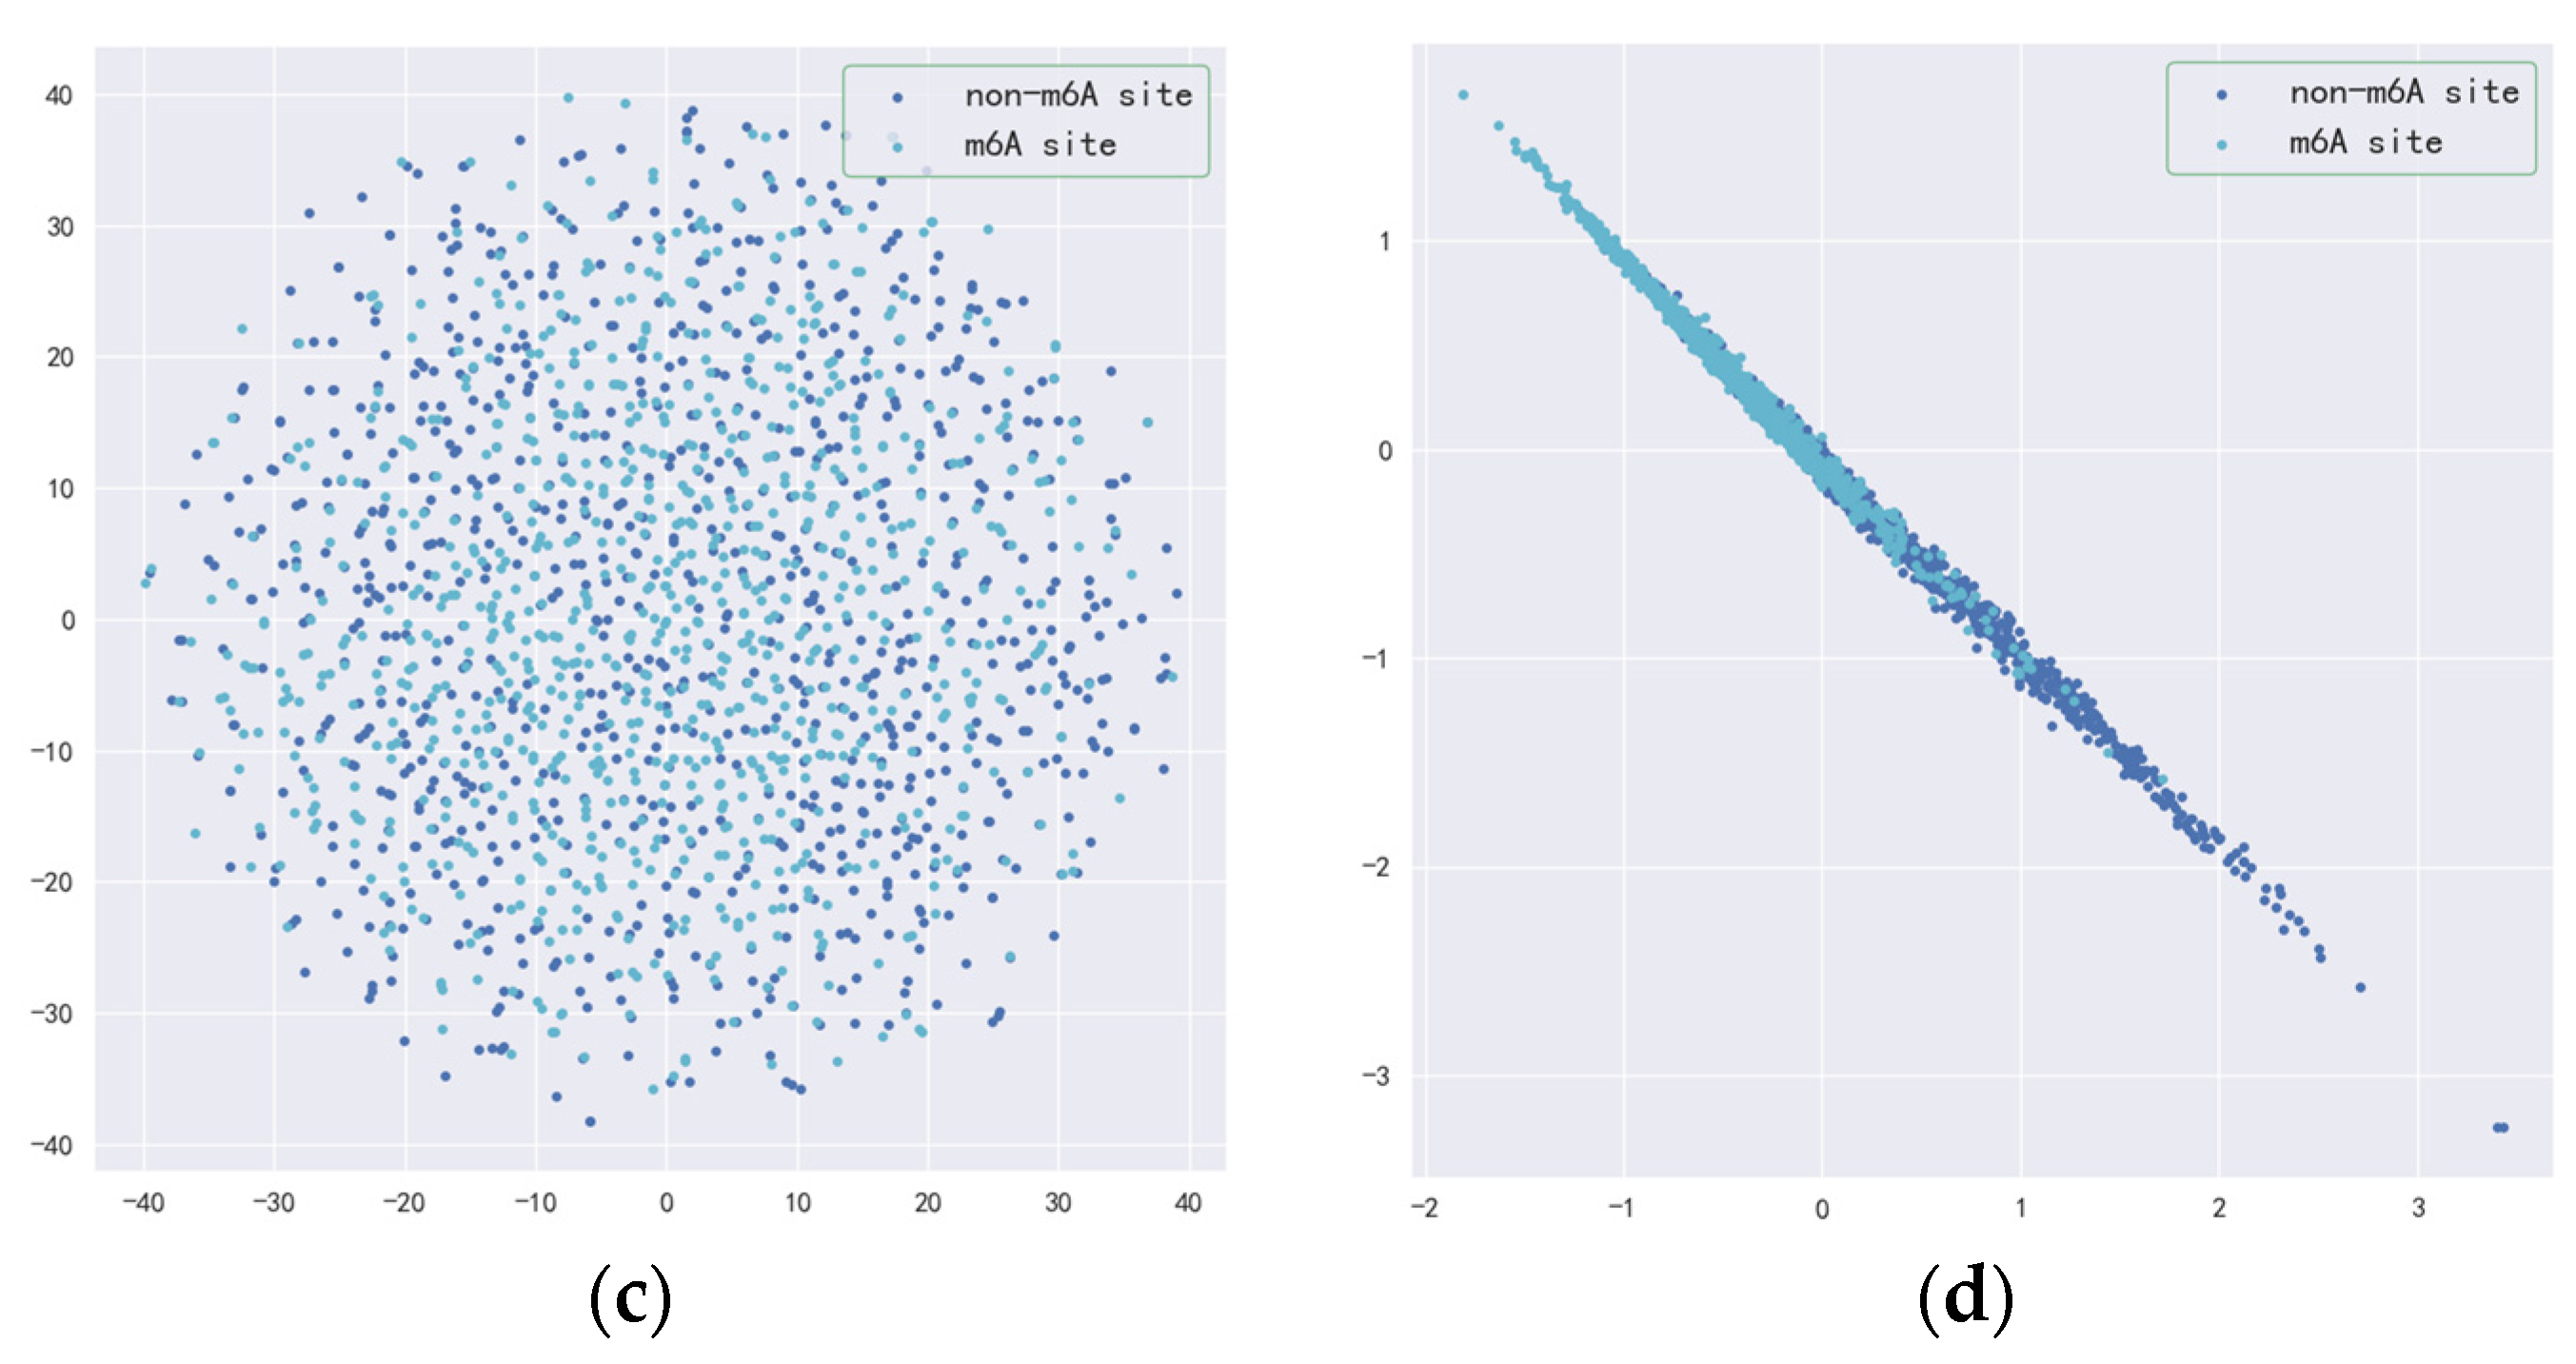
3.2. Validity of Resnet-CBAM and BilSTM-Attention

The traditional machine learning classifiers rely on manual feature processing and extraction, while deep learning models could learn the representation of the data by automatically extracting highly abstracted features. In this section, the t-distributed stochastic neighbor embedding (t-SNE) technique was adopted to illustrate the effectiveness of Resnet-CBAM and BiLSTM-Attention for feature learning by reducing the dimensions of feature spaces.
Figure 7 illustrates the sample distribution of the H_b dataset in a two-dimensional space. As can be seen from Figure 7a,c, it is difficult to visually distinguish m6A sites from non-m6A sites with the original features extracted by DiNUCindex_RNA and k-mer word segmentation. Based on the feature representations learned after the Resnet-CBAM and BiLSTM-Attention models, the margins between m6A sites and non-m6A sites became more clearly separated, as seen in Figure 7b,d. These results indicate that our models could learn feature representations effectively.

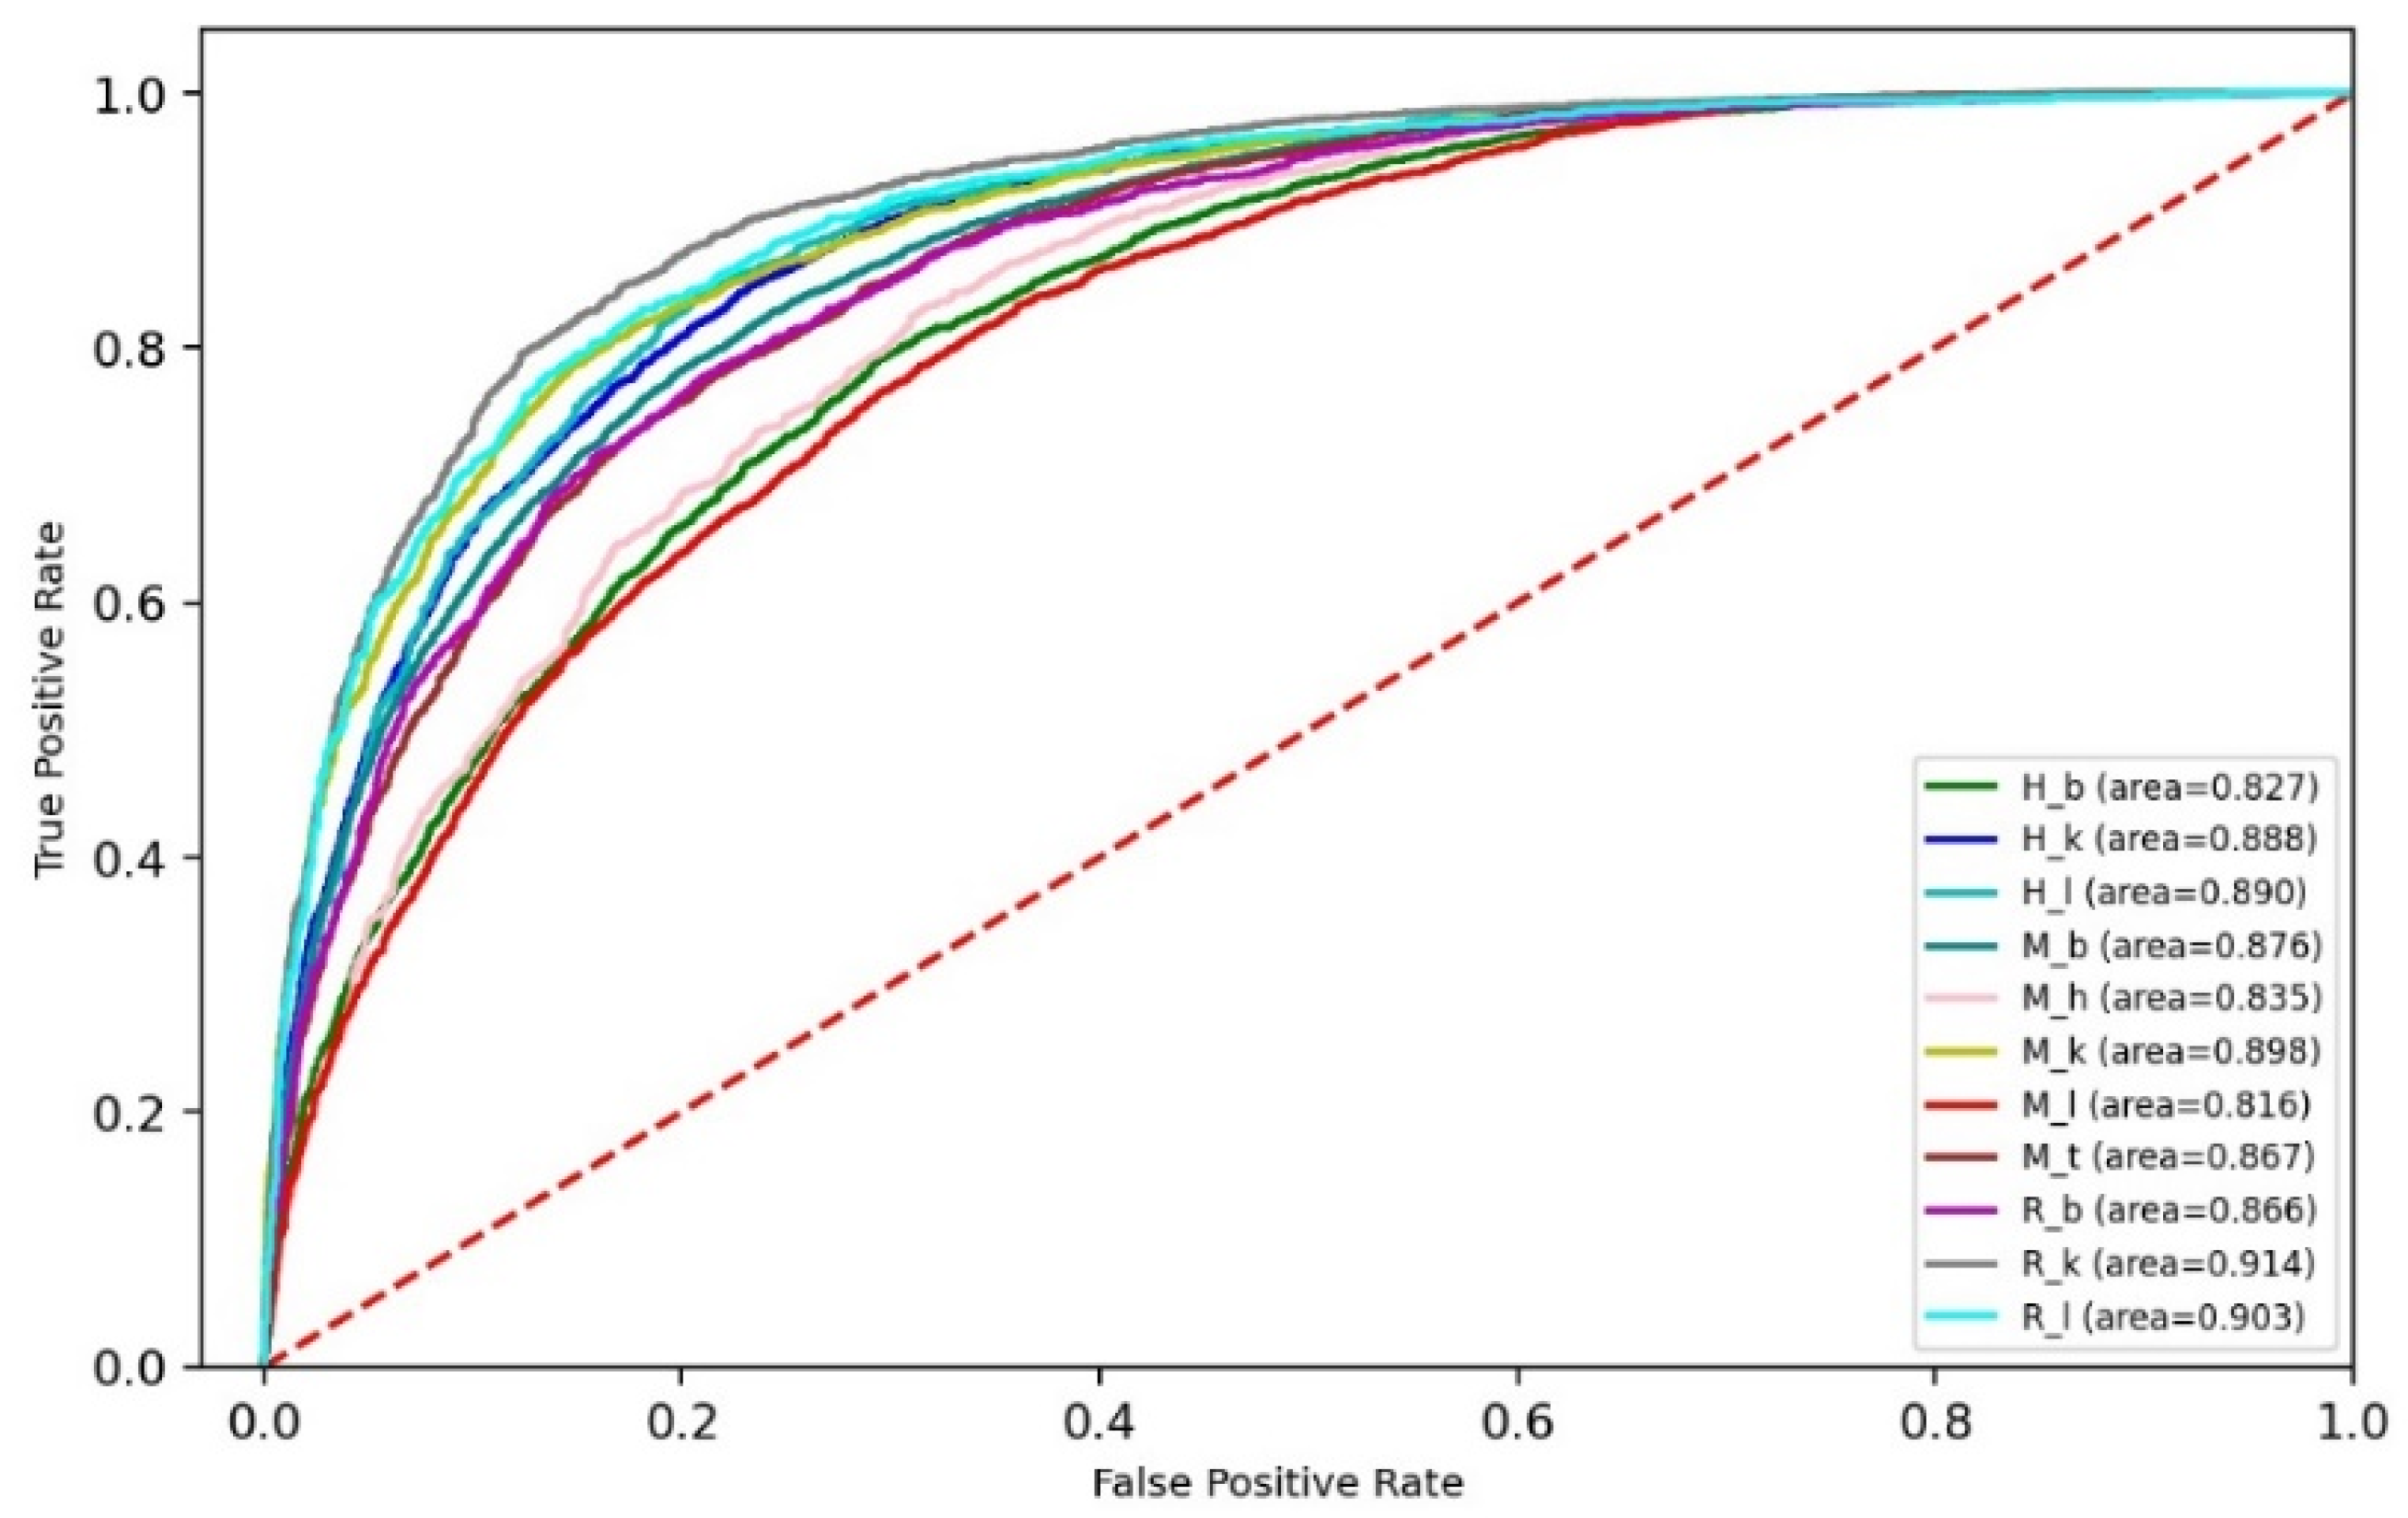
3.3. Performance of Ensemble Models

In this section, we assess the performance of five models on the 11 training datasets by using the five-fold CV, including three individual models (i.e., BiLSTM-Attention, Resnet-CBAM, and fine-tuned DNABERT), and two ensemble models with different integration schemes (i.e., voting and stacking). The Acc metrics of these models are presented in Figure 8.
In Figure 8, three single models have their respective strengths and shortcomings in different datasets. Specifically, the BiLSTM-Attention model achieved the highest Acc values on the H_l, H_k, M_b, M_l, M_k, M_h, and R_b datasets, while the fine-tuned DNABERT model obtained the best Acc values on the H_b, M_t, R_l, and R_k datasets. Two ensemble models outperformed the single models on the most of 11 datasets. By comparison, m6A-BERT-Stacking performed better than other predictors. The ROC curves were also plotted in Figure 9 to further measure the performance of m6A-BERT-Stacking on the independent datasets, with the AUROC values higher than 0.81.

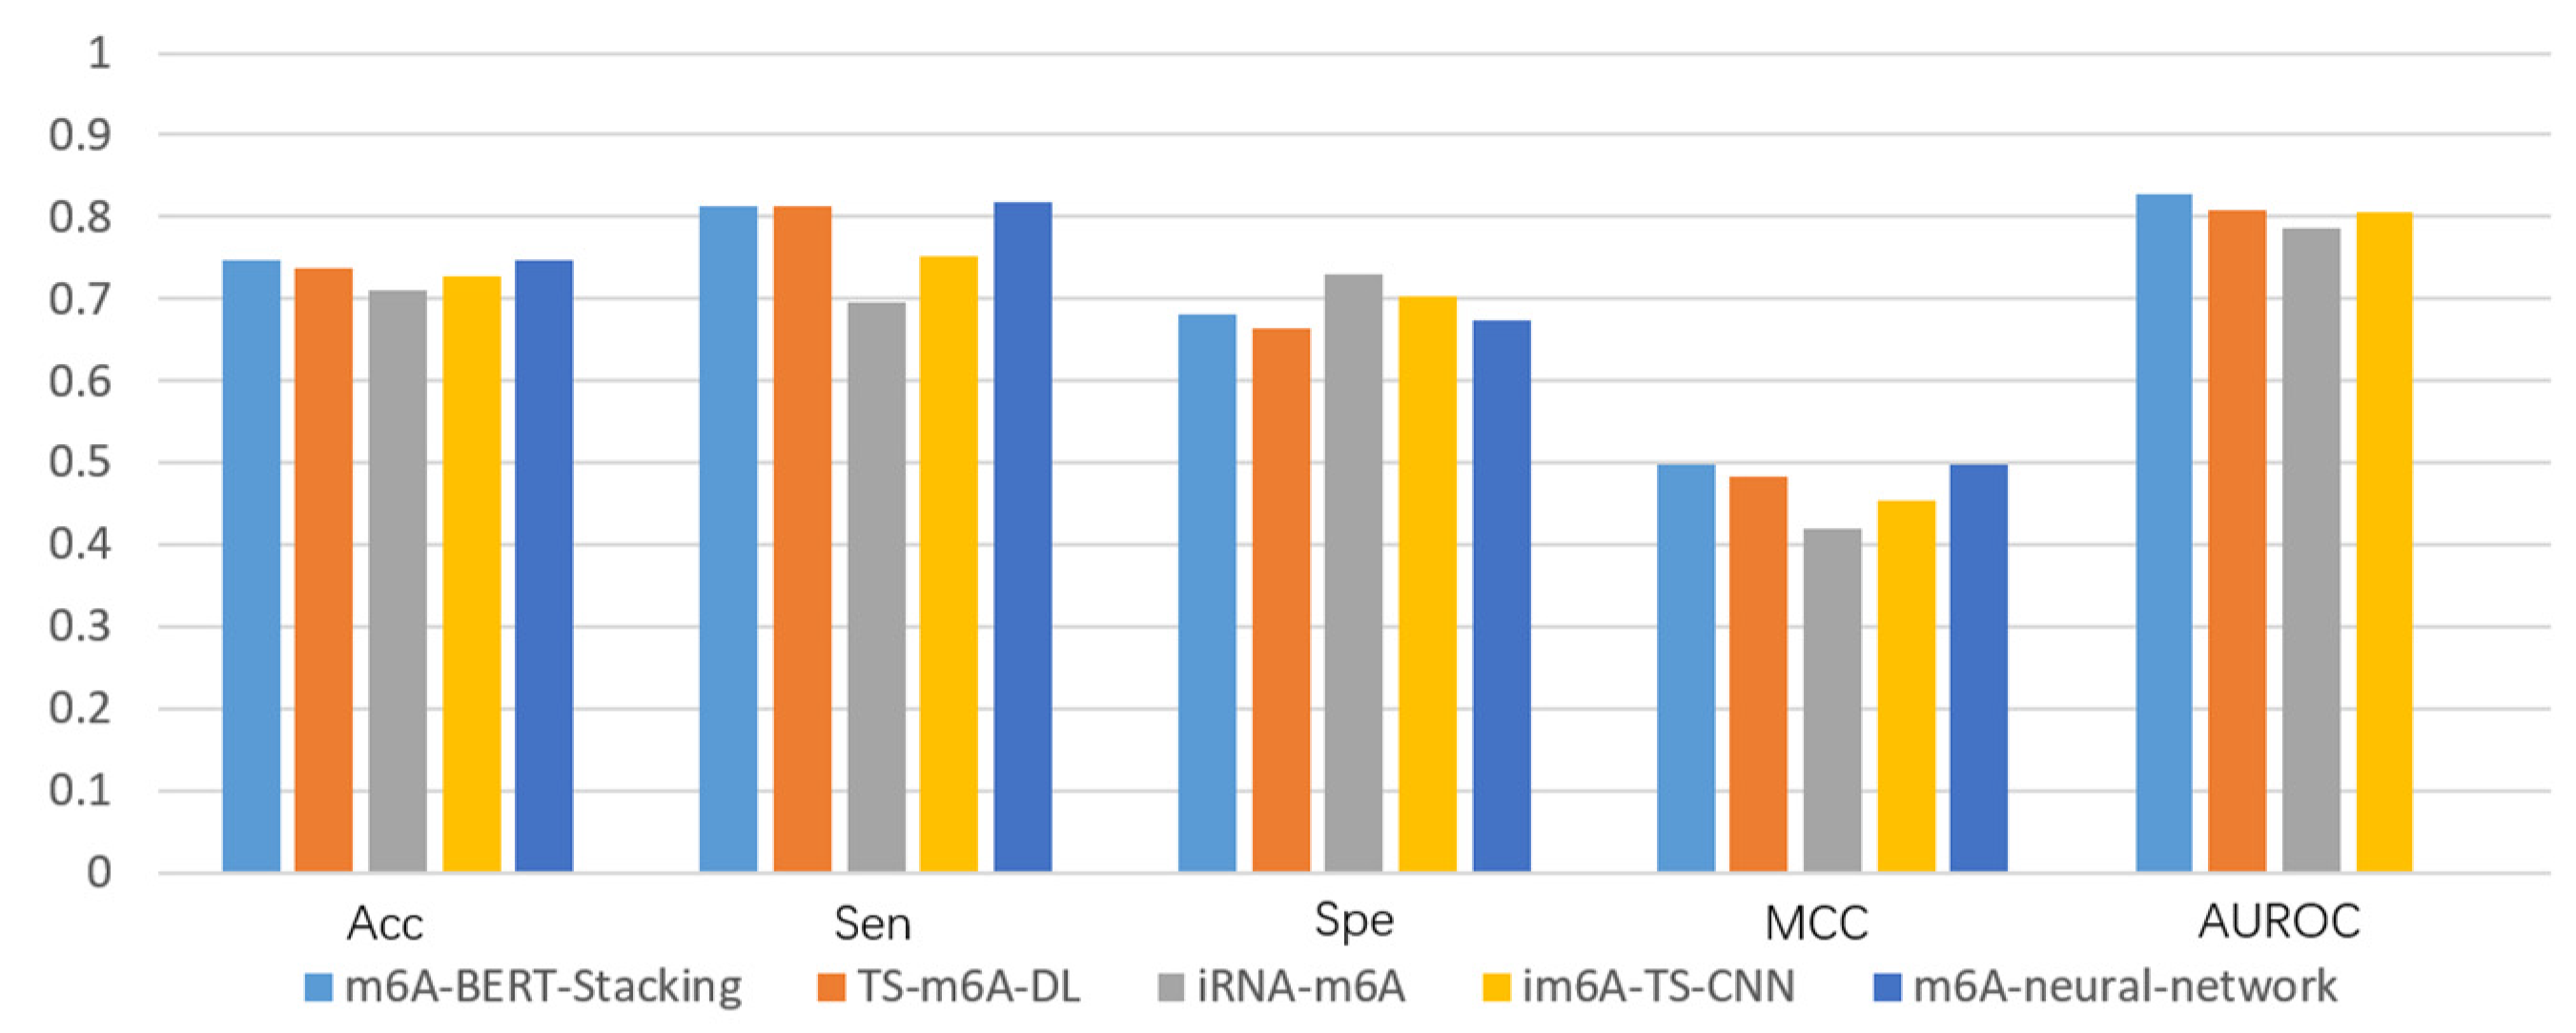
3.4. Performance Comparison with Existing Methods

To the best of our knowledge, there are several computational tools for tissue-specific prediction of m6A sites on the same datasets, including TS-m6A-DL [30], im6A-TS-CNN [31], iRNA-m6A [32], and m6A-neural-network [35]. For the sake of a fair comparison with the state-of-the-art predictors, we adopted the same training datasets and CV methods to objectively evaluate the proposed model. The corresponding comparison results were provided in Table 3 in terms of five common metrics, i.e., Acc, Sen, Spe, MCC, and AUROC by using the five-fold CV.
Referring to Table 3, our model exhibited the best performance in terms of Acc (0.736~0.838) and AUROC (0.816~0.914) on all the datasets. In addition, our model achieved the highest Sen values on the H_k, H_l, M_h, and M_l datasets, the highest Spe values on the M_k, M_t, R_b, and R_k datasets, and the highest MCC values except for the M_b dataset. In terms of the other metrics on some datasets, m6A-BERT-Stacking also showed acceptable performance compared with the other models. Moreover, the results of independent tests on the H_b datasets are shown in Figure 10 and the ones on the other independent datasets are graphically represented in Supplementary Figure S2, which leads to similar conclusions as those in Table 3. These comparisons demonstrate that m6A-BERT-Stacking was efficient, robust, and promising for the annotation of m6A sites and could at least play a complementary role in existing methods.

4. Conclusions

Even though considerable efforts have been made so far, tissue-specific identification of m6A sites solely from sequence information still remains a challenging issue in bioinformatics. In this work, we proposed an ensemble computational tool, called m6A-BERT-Stacking, for further improving the prediction of m6A sites based on three hybrid deep learning models. DiNUCindex_RNA and 3-mer word segmentation were introduced to capture the sequence-order and position-specific information. The five-fold CV and the independent test were performed on the 11 benchmark datasets to comprehensively estimate the predictive efficiency of m6A-BERT-Stacking, respectively. Compared with the existing state-of-the-art predictors, the proposed method exhibited superior performance and could serve as a useful tool for enhancing the annotation levels of m6A sites. In future work, we aim to keep improving our model in three main ways. First, we will collect more m6A sites from the published work and the RNA modification database and construct a larger dataset to train our model, thereby avoiding the risk of overfitting. Second, the cross-species or cross-tissues validation will be expected to demonstrate the nucleotide distribution patterns around the m6A sites among different species or tissues. Third, we will develop a user-friendly web server for the public use, not limited to providing the source code of the model.

Supplementary Materials

The following supporting information can be downloaded at: https://www.mdpi.com/article/10.3390/sym15030731/s1, Table S1: The structural details of the individual residual blocks; Figure S1: The nucleotide composition preferences between positive and negative samples on the remaining 10 datasets; Figure S2: Performance comparison between different models on the remaining 10 datasets.

Author Contributions

Methodology, Q.L.; validation, C.S.; writing—original draft preparation, Q.L.; writing—review and editing, X.C. and T.L. All authors have read and agreed to the published version of the manuscript.

Funding

This research was funded by the National Natural Science Foundation of China (grant number 11601324).

Data Availability Statement

The data and the source code used to support the findings of this study are freely available to the academic community at https://github.com/liqianyue/zeitgeist/tree/master/m6A_BERT_Stacking, accessed on 12 February 2023.

Acknowledgments

We thank the researchers for providing their datasets.

Conflicts of Interest

The authors declare no conflict of interest.

References

  1. Boo, S.H.; Kim, Y.K. The emerging role of RNA modifications in the regulation of mRNA stability. Exp. Mol. Med. 2020, 52, 400–408. [Google Scholar] [CrossRef] [Green Version]
  2. Boccaletto, P.; Stefaniak, F.; Ray, A.; Cappannini, A.; Mukherjee, S.; Purta, E.; Kurkowska, M.; Shirvanizadeh, N.; Destefanis, E.; Groza, P.; et al. MODOMICS: A database of RNA modification pathways. 2021 update. Nucleic Acids Res. 2022, 50, D231–D235. [Google Scholar] [CrossRef] [PubMed]
  3. He, P.C.; He, C. m6A RNA methylation: From mechanisms to therapeutic potential. Embo J. 2021, 40, e105977. [Google Scholar] [CrossRef] [PubMed]
  4. He, L.E.; Li, H.Y.; Wu, A.Q.; Peng, Y.L.; Shu, G.; Yin, G. Functions of N6-methyladenosine and its role in cancer. Mol. Cancer 2019, 18, 176. [Google Scholar] [CrossRef] [PubMed] [Green Version]
  5. Cheng, Y.M.; Luo, H.Z.; Izzo, F.; Pickering, B.F.; Nguyen, D.; Myers, R.; Schurer, A.; Gourkanti, S.; Bruning, J.C.; Vu, L.P.; et al. m6A RNA Methylation Maintains Hematopoietic Stem Cell Identity and Symmetric Commitment. Cell Rep. 2019, 28, 1703–1716. [Google Scholar] [CrossRef] [Green Version]
  6. Chen, K.; Wei, Z.; Zhang, Q.; Wu, X.; Rong, R.; Lu, Z.; Su, J.; de Magalhaes, J.P.; Rigden, D.J.; Meng, J. WHISTLE: A high-accuracy map of the human N6-methyladenosine (m6A) epitranscriptome predicted using a machine learning approach. Nucleic Acids Res. 2019, 47, e41. [Google Scholar] [CrossRef] [Green Version]
  7. Meyer, K.D.; Saletore, Y.; Zumbo, P.; Elemento, O.; Mason, C.E.; Jaffrey, S.R. Comprehensive Analysis of mRNA Methylation Reveals Enrichment in 3 ‘ UTRs and near Stop Codons. Cell 2012, 149, 1635–1646. [Google Scholar] [CrossRef] [Green Version]
  8. Dominissini, D.; Moshitch-Moshkovitz, S.; Schwartz, S.; Salmon-Divon, M.; Ungar, L.; Osenberg, S.; Cesarkas, K.; Jacob-Hirsch, J.; Amariglio, N.; Kupiec, M.; et al. Topology of the human and mouse m6A RNA methylomes revealed by m6A-seq. Nature 2012, 485, 201–206. [Google Scholar] [CrossRef]
  9. Chen, K.; Lu, Z.; Wang, X.; Fu, Y.; Luo, G.-Z.; Liu, N.; Han, D.; Dominissini, D.; Dai, Q.; Pan, T.; et al. High-Resolution N6-Methyladenosine (m6A) Map Using Photo-Crosslinking-Assisted m6A Sequencing. Angew. Chem. Int. Ed. 2015, 54, 1587–1590. [Google Scholar] [CrossRef] [Green Version]
  10. Linder, B.; Grozhik, A.V.; Olarerin-George, A.O.; Meydan, C.; Mason, C.E.; Jaffrey, S.R. Single-nucleotide-resolution mapping of m6A and m6Am throughout the transcriptome. Nat. Methods 2015, 12, 767–772. [Google Scholar] [CrossRef]
  11. Zhou, Y.; Zeng, P.; Li, Y.-H.; Zhang, Z.; Cui, Q. SRAMP: Prediction of mammalian N6-methyladenosine (m6A) sites based on sequence-derived features. Nucleic Acids Res. 2016, 44, e91. [Google Scholar] [CrossRef] [PubMed] [Green Version]
  12. Chen, W.; Feng, P.M.; Ding, H.; Lin, H.; Chou, K.C. iRNA-Methyl: Identifying N6-methyladenosine sites using pseudo nucleotide composition. Anal. Biochem. 2015, 490, 26–33. [Google Scholar] [CrossRef] [PubMed]
  13. Li, G.Q.; Liu, Z.; Shen, H.B.; Yu, D.J. TargetM6A: Identifying N6-Methyladenosine Sites From RNA Sequences via Position-Specific Nucleotide Propensities and a Support Vector Machine. IEEE Trans. Nanobioscience 2016, 15, 674–682. [Google Scholar] [CrossRef] [PubMed]
  14. Chen, W.; Xing, P.W.; Zou, Q. Detecting N6-methyladenosine sites from RNA transcriptomes using ensemble Support Vector Machines. Sci. Rep. 2017, 7, 40242. [Google Scholar] [CrossRef] [Green Version]
  15. Wang, X.F.; Yan, R.X. RFAthM6A: A new tool for predicting m6A sites in Arabidopsis thaliana. Plant Mol. Biol. 2018, 96, 327–337. [Google Scholar] [CrossRef]
  16. Wei, L.Y.; Chen, H.R.; Su, R. M6APred-EL: A Sequence-Based Predictor for Identifying N6-methyladenosine Sites Using Ensemble Learning. Mol. Ther. Nucleic Acids 2018, 12, 635–644. [Google Scholar] [CrossRef] [Green Version]
  17. Zhao, X.W.; Zhang, Y.; Ning, Q.; Zhang, H.R.; Ji, J.C.; Yin, M.H. Identifying N6-methyladenosine sites using extreme gradient boosting system optimized by particle swarm optimizer. J. Theor. Biol. 2019, 467, 39–47. [Google Scholar] [CrossRef]
  18. Govindaraj, R.G.; Subramaniyam, S.; Manavalan, B. Extremely-randomized-tree-based Prediction of N6-Methyladenosine Sites in Saccharomyces cerevisiae. Curr. Genom. 2020, 21, 26–33. [Google Scholar] [CrossRef]
  19. Zhang, Z.W.; Wang, L.D. Using Chou’s 5-steps rule to identify N6-methyladenine sites by ensemble learning combined with multiple feature extraction methods. J. Biomol. Struct. Dyn. 2022, 40, 796–806. [Google Scholar] [CrossRef]
  20. Luo, Z.; Lou, L.; Qiu, W.; Xu, Z.; Xiao, X. Predicting N6-Methyladenosine Sites in Multiple Tissues of Mammals through Ensemble Deep Learning. Int. J. Mol. Sci. 2022, 23, 15490. [Google Scholar] [CrossRef]
  21. Zhang, L.; Qin, X.; Liu, M.; Xu, Z.; Liu, G. DNN-m6A: A Cross-Species Method for Identifying RNA N6-methyladenosine Sites Based on Deep Neural Network with Multi-Information Fusion. Genes 2021, 12, 354. [Google Scholar] [CrossRef] [PubMed]
  22. Zou, Q.; Xing, P.; Wei, L.; Liu, B. Gene2vec: Gene subsequence embedding for prediction of mammalian N6-methyladenosine sites from mRNA. Rna 2019, 25, 205–218. [Google Scholar] [CrossRef] [PubMed] [Green Version]
  23. Nazari, I.; Tahir, M.; Tayara, H.; Chong, K.T. iN6-Methyl (5-step): Identifying RNA N6-methyladenosine sites using deep learning mode via Chou’s 5-step rules and Chou’s general PseKNC. Chemom. Intell. Lab. Syst. 2019, 193, 103811. [Google Scholar] [CrossRef]
  24. Tahir, M.; Hayat, M.; Chong, K.T. Prediction of N6-methyladenosine sites using convolution neural network model based on distributed feature representations. Neural Netw. 2020, 129, 385–391. [Google Scholar] [CrossRef]
  25. Wang, H.; Zhao, S.; Cheng, Y.; Bi, S.; Zhu, X. MTDeepM6A-2S: A two-stage multi-task deep learning method for predicting RNA N6-methyladenosine sites of Saccharomyces cerevisiae. Front. Microbiol. 2022, 13, 999506. [Google Scholar] [CrossRef] [PubMed]
  26. Wang, H.; Wang, S.Y.; Zhang, Y.; Bi, S.D.; Zhu, X.L. A brief review of machine learning methods for RNA methylation sites prediction. Methods 2022, 203, 399–421. [Google Scholar] [CrossRef]
  27. Chen, Z.; Zhao, P.; Li, F.Y.; Wang, Y.N.; Smith, A.I.; Webb, G.I.; Akutsu, T.; Baggag, A.; Bensmail, H.; Song, J.N. Comprehensive review and assessment of computational methods for predicting RNA post-transcriptional modification sites from RNA sequences. Brief. Bioinform. 2020, 21, 1676–1696. [Google Scholar] [CrossRef]
  28. Zhang, Y.Q.; Yu, Z.M.; Yu, B.; Wang, X.; Gao, H.L.; Sun, J.Q.; Li, S.Y. StackRAM: A cross-species method for identifying RNA N6-methyladenosine sites based on stacked ensemble. Chemom. Intell. Lab. Syst. 2022, 222, 104495. [Google Scholar] [CrossRef]
  29. Rehman, M.U.; Hong, K.J.; Tayara, H.; Chong, K.T. m6A-NeuralTool: Convolution Neural Tool for RNA N6-Methyladenosine Site Identification in Different Species. IEEE Access 2021, 9, 17779–17786. [Google Scholar] [CrossRef]
  30. Abbas, Z.; Tayara, H.; Zou, Q.; Chong, K.T. TS-m6A-DL: Tissue-specific identification of N6-methyladenosine sites using a universal deep learning model. Comput. Struct. Biotechnol. J. 2021, 19, 4619–4625. [Google Scholar] [CrossRef]
  31. Liu, K.W.; Cao, L.; Du, P.F.; Chen, W. im6A-TS-CNN: Identifying the N6-Methyladenine Site in Multiple Tissues by Using the Convolutional Neural Network. Mol. Ther. Nucleic Acids 2020, 21, 1044–1049. [Google Scholar] [CrossRef] [PubMed]
  32. Dao, F.Y.; Lv, H.; Yang, Y.H.; Zulfiqar, H.; Gao, H.; Lin, H. Computational identification of N6-methyladenosine sites in multiple tissues of mammals. Comput. Struct. Biotechnol. J. 2020, 18, 1084–1091. [Google Scholar] [CrossRef]
  33. Qiang, X.L.; Chen, H.R.; Ye, X.C.; Su, R.; Wei, L.Y. M6AMRFS: Robust Prediction of N6-Methyladenosine Sites With Sequence-Based Features in Multiple Species. Front. Genet. 2018, 9, 495. [Google Scholar] [CrossRef] [Green Version]
  34. Huang, Y.; He, N.N.; Chen, Y.; Chen, Z.; Li, L. BERMP: A cross-species classifier for predicting m6A sites by integrating a deep learning algorithm and a random forest approach. Int. J. Biol. Sci. 2018, 14, 1669–1677. [Google Scholar] [CrossRef] [PubMed] [Green Version]
  35. Jia, C.; Jin, D.; Wang, X.; Zhao, Q. Tissue specific prediction of N6-methyladenine sites based on an ensemble of multi-input hybrid neural network. Biocell 2022, 46, 1105–1121. [Google Scholar] [CrossRef]
  36. Rogers, A.; Kovaleva, O.; Rumshisky, A. A Primer in BERTology: What We Know About How BERT Works. Trans. Assoc. Comput. Linguist. 2020, 8, 842–866. [Google Scholar] [CrossRef]
  37. Devlin, J.; Chang, M.-W.; Lee, K.; Toutanova, K. Bert: Pre-training of deep bidirectional transformers for language understanding. arXiv 2018, arXiv:1810.04805. [Google Scholar]
  38. Ji, Y.R.; Zhou, Z.H.; Liu, H.; Davuluri, R.V. DNABERT: Pre-trained Bidirectional Encoder Representations from Transformers model for DNA-language in genome. Bioinformatics 2021, 37, 2112–2120. [Google Scholar] [CrossRef]
  39. Wang, Y.; Hou, Z.; Yang, Y.; Wong, K.-C.; Li, X. Genome-wide identification and characterization of DNA enhancers with a stacked multivariate fusion framework. PLoS Comput. Biol. 2022, 18, e1010779. [Google Scholar] [CrossRef]
  40. Jin, J.; Yu, Y.; Wang, R.; Zeng, X.; Pang, C.; Jiang, Y.; Li, Z.; Dai, Y.; Su, R.; Zou, Q.; et al. iDNA-ABF: Multi-scale deep biological language learning model for the interpretable prediction of DNA methylations. Genome Biol. 2022, 23, 219. [Google Scholar] [CrossRef]
  41. Yamada, K.; Hamada, M. Prediction of RNA-protein interactions using a nucleotide language model. Bioinform. Adv. 2022, 2, vbac023. [Google Scholar] [CrossRef]
  42. Li, W.; Godzik, A. Cd-hit: A fast program for clustering and comparing large sets of protein or nucleotide sequences. Bioinformatics 2006, 22, 1658–1659. [Google Scholar] [CrossRef] [Green Version]
  43. Amerifar, S.; Norouzi, M.; Ghandi, M. A tool for feature extraction from biological sequences. Brief. Bioinform. 2022, 23, bbac108. [Google Scholar] [CrossRef] [PubMed]
  44. Huang, Q.; Zhou, W.; Guo, F.; Xu, L.; Zhang, L.J.P. 6mA-Pred: Identifying DNA N6-methyladenine sites based on deep learning. PeerJ 2021, 9, e10813. [Google Scholar] [CrossRef] [PubMed]
  45. Friedel, M.; Nikolajewa, S.; Suehnel, J.; Wilhelm, T. DiProDB: A database for dinucleotide properties. Nucleic Acids Res. 2009, 37, D37–D40. [Google Scholar] [CrossRef] [PubMed] [Green Version]
  46. Zhang, W.-Y.; Xu, J.; Wang, J.; Zhou, Y.-K.; Chen, W.; Du, P.-F. KNIndex: A comprehensive database of physicochemical properties for k-tuple nucleotides. Brief. Bioinform. 2021, 22, bbaa284. [Google Scholar] [CrossRef]
  47. He, K.M.; Zhang, X.Y.; Ren, S.Q.; Sun, J. Deep Residual Learning for Image Recognition. In Proceedings of the 2016 IEEE Conference on Computer Vision and Pattern Recognition (CVPR), Seattle, WA, USA, 27–30 June 2016; pp. 770–778. [Google Scholar]
  48. Woo, S.H.; Park, J.; Lee, J.Y.; Kweon, I.S. CBAM: Convolutional block attention module. In Proceedings of the 15th European Conference on Computer Vision (ECCV), Munich, Germany, 8–14 September 2018; pp. 3–19. [Google Scholar]
  49. Van Houdt, G.; Mosquera, C.; Napoles, G. A review on the long short-term memory model. Artif. Intell. Rev. 2020, 53, 5929–5955. [Google Scholar] [CrossRef]
  50. Schuster, M.; Paliwal, K.K. Bidirectional recurrent neural networks. IEEE Trans. Signal Process. 1997, 45, 2673–2681. [Google Scholar] [CrossRef] [Green Version]
  51. Zhou, P.; Shi, W.; Tian, J.; Qi, Z.Y.; Li, B.C.; Hao, H.W.; Xu, B. Attention-Based Bidirectional Long Short-Term Memory Networks for Relation Classification. In Proceedings of the 54th Annual Meeting of the Association-for-Computational-Linguistics (ACL), Berlin, Germany, 7–12 August 2016; pp. 207–212. [Google Scholar]
  52. Acheampong, F.A.; Nunoo-Mensah, H.; Chen, W. Transformer models for text-based emotion detection: A review of BERT-based approaches. Artif. Intell. Rev. 2021, 54, 5789–5829. [Google Scholar] [CrossRef]
  53. Vacic, V.; Iakoucheva, L.M.; Radivojac, P. Two Sample Logo: A graphical representation of the differences between two sets of sequence alignments. Bioinformatics 2006, 22, 1536–1537. [Google Scholar] [CrossRef] [Green Version]
Figure 1. The workflow of the proposed model.
Symmetry 15 00731 g001
Figure 2. The structure of the Resnet-CBAM framework. (a) The specific structure of Resnet-CBAM; (b) the structure of the residual block.
Symmetry 15 00731 g002
Figure 3. The structure of the BiLSTM-Attention framework.
Symmetry 15 00731 g003
Figure 4. The structure of the DNABERT framework.
Symmetry 15 00731 g004
Figure 5. The nucleotide composition preferences between positive and negative samples on the H_b dataset.
Symmetry 15 00731 g005
Figure 6. Visualization of attention and context.
Symmetry 15 00731 g006
Figure 7. Distribution of m6A sites and non-m6A sites in the two-dimensional feature space. (a) Feature space extracted from DiNUCindex_RNA; (b) feature space after Resnet-CBAM; (c) feature space extracted from k-mer word segmentation; (d) feature space after BiLSTM-Attention.
Symmetry 15 00731 g007aSymmetry 15 00731 g007b
Figure 8. Performance comparison of models before and after ensemble.
Symmetry 15 00731 g008
Figure 9. The ROC curves for identifying m6A sites in multiple tissues of three species.
Symmetry 15 00731 g009
Figure 10. Performance comparison between different models on the H_b independent dataset.
Symmetry 15 00731 g010
Table 1. Summary of representative cross-species predictors for RNA m6A sites.
ToolClassifierFeature Encoding SchemeSpeciesData ScaleURL Accessibility
M6AMRFS [33]XGBoostdinucleotide binary,
localPSDF
S. cerevisiae2614accessible
H. sapiens2260
Musculus1450
A. thaliana2000
BERMP [34]RF, GRU,
LR
ENACMammalian736,023accessible
S. cerevisiae2614
A. thaliana5036
StackRAM [28]LightGBM, SVMbinary encoding,
chemical property,
NF, PSTNP, KNF,
pseDNC
S. cerevisiae2614inaccessible
H. sapiens2260
A. thaliana788
im6A-TS-CNN [31]CNNone-hot-encodingHuman47,248inaccessible
Mouse92,070
Cat30,184
iRNA-m6A [32]SVMphysical–chemical property,
mono-nucleotide binary encoding,
NCP
Human47,248accessible
Mouse92,067
Cat30,184
m6A-NeuralTool [29]CNN, SVM, NBone-hot-encodingS. cerevisiae6540accessible
A. thaliana4200
Mus musculus1450
H. sapiens2260
TS-m6A-DL [30]CNNone-hot-encodingHuman47,248accessible
Mouse92,070
Cat30,184
m6A-neural-network [35]CNN, BiGRUone-hot-encoding,
sequence features,
KNF
Human47,248inaccessible
Mouse92,070
Cat30,184
Abbreviation in Feature encoding scheme: localPSDF, local position-specific dinucleotide frequency; ENAC, enhanced nucleic acid composition; KNF, K-mer nucleotide frequency; NF, nucleotide frequency; PSTNP, position-specific trinucleotide propensity; pseDNC, pseudo dinucleotide composition; NCP, nucleotide chemical property. Abbreviation in Classifier: XGBoost, extreme gradient boosting; RF, random forest; GRU, gated recurrent unit; LR, logistic regression; LightGBM, light gradient boosting machine; SVM, support vector machine; NB, naive bayes. Abbreviation in Species: S. cerevisiae, Saccharomyces cerevisiae; H. sapiens, Homo sapiens; A. thaliana, Arabidopsis thaliana.
Table 2. The information of benchmark datasets adopted in this study.
SpeciesTissuesNameTraining DatasetIndependent Dataset
PositiveNegativePositiveNegative
RatBrainR_b2352235223512351
KidneyR_k3433343334323432
LiverR_l1762176217621762
MouseBrainM_b8025802580258025
HeartM_h2201220122002200
KidneyM_k3953395339523952
LiverM_l4133413341334133
TestisM_t4707470747064706
HumanBrainH_b4605460546044604
KidneyH_k4574457445734573
LiverH_l2634263426342634
Table 3. Performance comparison on the training datasets by using the five-fold CV.
NameMethodsAccSenSpeMCCAUROC
H_bOur model0.7470.8120.6810.4980.827
TS-m6A-DL0.7380.8120.6640.4820.809
iRNA-m6A0.7110.6950.730.420.785
im6A-TS-CNN0.7270.7520.7020.4540.806
m6A-neural-network0.7460.8180.6740.497/
H_kOur model0.8060.8380.7750.6140.888
TS-m6A-DL0.8020.8040.7990.6040.88
iRNA-m6A0.7780.7710.7840.560.857
im6A-TS-CNN0.7920.80.7850.5850.873
m6A-neural-network0.7980.8230.7730.597/
H_lOur model0.8150.8570.7730.6320.89
TS-m6A-DL0.8050.820.790.6110.878
iRNA-m6A0.790.7820.7990.580.868
im6A-TS-CNN0.7990.8480.750.6010.881
m6A-neural-network0.8090.8410.7770.62/
M_bOur model0.7920.8060.7750.5820.876
TS-m6A-DL0.7870.8290.7460.5770.872
iRNA-m6A0.7830.7720.7940.570.861
im6A-TS-CNN0.7850.8620.7070.5770.872
m6A-neural-network0.7920.8290.7580.589/
M_hOur model0.7570.8310.6840.5210.835
TS-m6A-DL0.750.7930.7070.5020.823
iRNA-m6A0.7130.7050.7210.430.788
im6A-TS-CNN0.7360.7580.7140.4720.816
m6A-neural-network0.7530.8030.7030.509/
M_kOur model0.8190.8140.8240.6380.898
TS-m6A-DL0.8070.8420.7730.6160.889
iRNA-m6A0.7930.7840.8030.590.87
im6A-TS-CNN0.8080.8050.810.6150.886
m6A-neural-network0.8140.8420.7860.629/
M_lOur model0.7360.7860.6860.4740.816
TS-m6A-DL0.720.780.660.4430.791
iRNA-m6A0.6880.6780.6990.380.762
im6A-TS-CNN0.7160.7560.6760.4330.793
m6A-neural-network0.730.7530.7070.461/
M_tOur model0.780.7720.7890.5610.867
TS-m6A-DL0.7640.8420.6860.5350.843
iRNA-m6A0.7350.7220.7510.470.818
im6A-TS-CNN0.7620.8350.6890.5290.847
m6A-neural-network0.7690.8160.7220.541/
R_bOur model0.7830.7730.7930.5660.866
TS-m6A-DL0.7720.8130.7320.5470.854
iRNA-m6A0.7510.7390.7650.50.827
im6A-TS-CNN0.770.7810.7580.5390.852
m6A-neural-network0.7750.7970.7520.55/
R_kOur model0.8380.8480.8280.6760.914
TS-m6A-DL0.8320.8520.8130.6660.908
iRNA-m6A0.8140.8020.8280.630.897
im6A-TS-CNN0.8270.8490.8060.6550.908
m6A-neural-network0.8340.8480.820.669/
R_lOur model0.820.8440.7960.640.903
TS-m6A-DL0.810.8540.7650.6220.885
iRNA-m6A0.7990.7770.8230.60.876
im6A-TS-CNN0.8020.8450.7590.6070.885
m6A-neural-network0.8150.8410.7880.63/
Disclaimer/Publisher’s Note: The statements, opinions and data contained in all publications are solely those of the individual author(s) and contributor(s) and not of MDPI and/or the editor(s). MDPI and/or the editor(s) disclaim responsibility for any injury to people or property resulting from any ideas, methods, instructions or products referred to in the content.

