Article

A Coupling Optimization Method of Vehicle Structure and Restraint System for Occupant Injury Protection in Traffic Accidents

1
College of Automobile and Mechanical Engineering, Changsha University of Science and Technology, Changsha 410000, China
2
State Key Laboratory of Automobile Safety and Energy Conservation, Tsinghua University, Beijing 100000, China
3
State Key Laboratory of Automobile Simulation and Control, Jilin University, Changchun 130025, China
4
Key Laboratory of Traffic Safety on Track of Ministry of Education, School of Traffic and Transportation Engineering, Central South University, Changsha 410000, China
*
Author to whom correspondence should be addressed.
Symmetry 2023, 15(2), 558; https://doi.org/10.3390/sym15020558
Submission received: 2 January 2023 / Revised: 3 February 2023 / Accepted: 15 February 2023 / Published: 20 February 2023

Abstract

:
Vehicle front-end structure has the characteristic of symmetry. The damage of occupants in the crash process is determined by the combined effect of the front-end structure and the restraint system of the vehicle. In this paper, the coupling relationship and an optimized method for the vehicle front-end structure and restraint system are studied based on vehicle crash dynamics, to reduce occupant injury. A fast solution algorithm for occupant motion response was established using a crash analytical model. Then, an occupant response database was established using the algorithm, to analyze the coupling relationship between the crash pulse and the restraint specific stiffness, with respect to the curve shape and parameters. The results showed that the combination of the concave crash pulse and upward restraint stiffness curve was the best coupling. Subsequently, a coupled optimization method of a concave pulse and upward restraint stiffness was proposed and combined with a crash analytical model and genetic algorithm (GA). The crash pulse and restraint stiffness of vehicle crash data from the NHTSA databases were optimized, as an example, to verify the effectiveness of the method. The optimal occupant acceleration was reduced by 44%. In addition, the feasibility of the optimal result is discussed, to provide a reference for occupant injury protection in traffic accidents.

1. Introduction

In recent years, with the rapid development of the global economy and science and technology, the automobile industry has been growing and car ownership is constantly increasing [1,2]. The ensuing traffic safety problems are an increasing concerned for society. According to a World Health Organization statistics report, road traffic accidents are the eighth leading cause of death worldwide and about 1.35 million people die in traffic accidents every year [3,4]. In road traffic accidents, the probability of a frontal crash is the highest, accounting for about 40% [5]. Therefore, it is of great significance to reduce occupant injury in vehicle frontal crashes, to improve road traffic safety [6].
In a vehicle frontal crash, occupant injury is determined by the front-end structure and restraint system [7,8]. The front-end structure of a vehicle includes the front anticollision beam, energy absorption box, longitudinal beam, front seats, and sub-frame, etc., which have good symmetry in space. In current engineering design strategies, the design of the front-end structures occurs before the restraint system [9,10]. In recent years, experts have used vehicle structure crashworthiness design to increase the structural energy absorption and stability in the crash process, so as to increase the safety of occupants. Qin et al. proposed a two-level multiple cross-sectional shape optimization of an automotive body frame, to obtain the optimal transfer path of vehicles during a crash [11]. Szlosarek et al. studied the crushing properties of carbon fiber for application to the front-end energy absorption structure of vehicles [12]. Zhang et al. proposed bio-inspired multi-cell tubes with quadrilateral, hexagonal, and octagonal sections, to design a crashworthy body structure [13].
Other studies did not discuss the specific design method of the front-end structure of the vehicle body, but studied the impact of the vehicle crash pulse on occupant injury in the process of a frontal collision [14]. Some computer-based method are also been applied to obtained the influence rule of parameters, e.g., multitask learning network [15]. Crash pulse is the acceleration of a vehicle in the collision process, which can be used as the overall design objective of the front-end structure of an auto-body and also as the basic data to design a restraint system [16]. Iraeus et al. analyzed the effect of the minimum pulse shape on chest injury prediction in real-life frontal crashes [17]. Ito et al. optimized the crash pulse to protect occupants at various impact velocities [18]. Urbina et al. simplified the crash pulse and designed its crashworthiness to reduce occupant injury [19].
The design of a restraint system is usually carried out after the design of the vehicle body structure and crash pulse [20]. Huang et al. optimized airbag parameters for the Chinese body size [21]. Liu et al. conducted multiobjective optimization of the cooperative controls between the autonomous emergency steering (AES) and occupant restraint system (ORS) in a vehicle frontal crash [22]. Wang et al. proposed a multiobjective optimization design for an occupant restraint system considering interval correlation [23]. These restraint system design methods mainly focused on the optimization of the system parameters but ignored a synchronous design with the body structure. This leads to a small design space for the restraint system and difficulties in compensating for defects in the structural design [24]. It is necessary to present design requirements from the perspective of “restraint coupling” in the initial phase of the safety design. How to achieve the best occupant protection effect from the perspective of coupling design is the key problem addressed in this paper.
From the perspective of vehicle dynamics, the occupant response in the crash process is determined by the vibration coupling effect between the front-end structure and the restraint system [25]. As the response parameters related to coupling are numerous and interactional, coupling effect is studied in the theoretical field of crash dynamics. Huang et al. [25] simplified the complex vehicle frontal collision process into a classical mass spring model and proposed that the relationship between the crash pulse and restraint system is vibration coupling. Considering a simplified linear restraint system, Cheng et al. [26] suggested that an optimal coupled design of vehicle structure and ORS can make the occupant response a constant value. Qiu et al. [27] pointed out the importance of the coupling between vehicle structure and ORS. Meanwhile, other researchers carried out relevant studies, in terms of the stiffness characteristics of ORS [28,29] and ride-down energy [30,31,32] and reported a series of coupling research results.
The above literature studied the optimal design of the crash pulse at a theoretical level using a simplified linear restraint stiffness and discussed the division of energy absorption between the vehicle structure and ORS. The existing design methods simplify ORS into a linear system, which is convenient for theoretical calculation, but cannot guide the parameter design of the restraint system, due to the few characteristic parameters involved. In addition, while the existing studies focused on the coupling between crash pulse and restraint systems, they still cannot be designed synchronously. Moreover, specific coupling design strategies or methods with engineering guiding significance have not yet been formulated. Thus, based on a simple vehicle–occupant crash analytical model, this paper established a database of crash pulses–restraint system stiffnesses–occupant responses. Design strategies for the crash pulse and restraint system stiffness curve, regarding shape and parameters were studied through a database analysis. A coupling optimization algorithm is proposed, to design crash pulse and restraint system parameters simultaneously. This coupling method provides a target for the crashworthiness design of complex and symmetrical vehicle front-end structures and avoids the process of repeated trial and error in structural design.
Compared with the existing references, this work makes four contributions: (1) a fast solution algorithm of occupant motion response is derived using a crash analytical model, with the input of crash pulse and restraint stiffness; (2) from a qualitative perspective, the coupling relationship of the curve shape and parameters between the crash pulse and restraint system stiffness are analyzed using an occupant response database; (3) combined with a crash analytical model and GA, a coupled optimization method is established, to design parameters for crash pulse and restraint system stiffness; (4) finally, the feasibility of an optimal design scheme to protect the occupant in traffic accidents is discussed.

2. Fast Solution Algorithm for a Vehicle—Occupant Crash Analytical Model

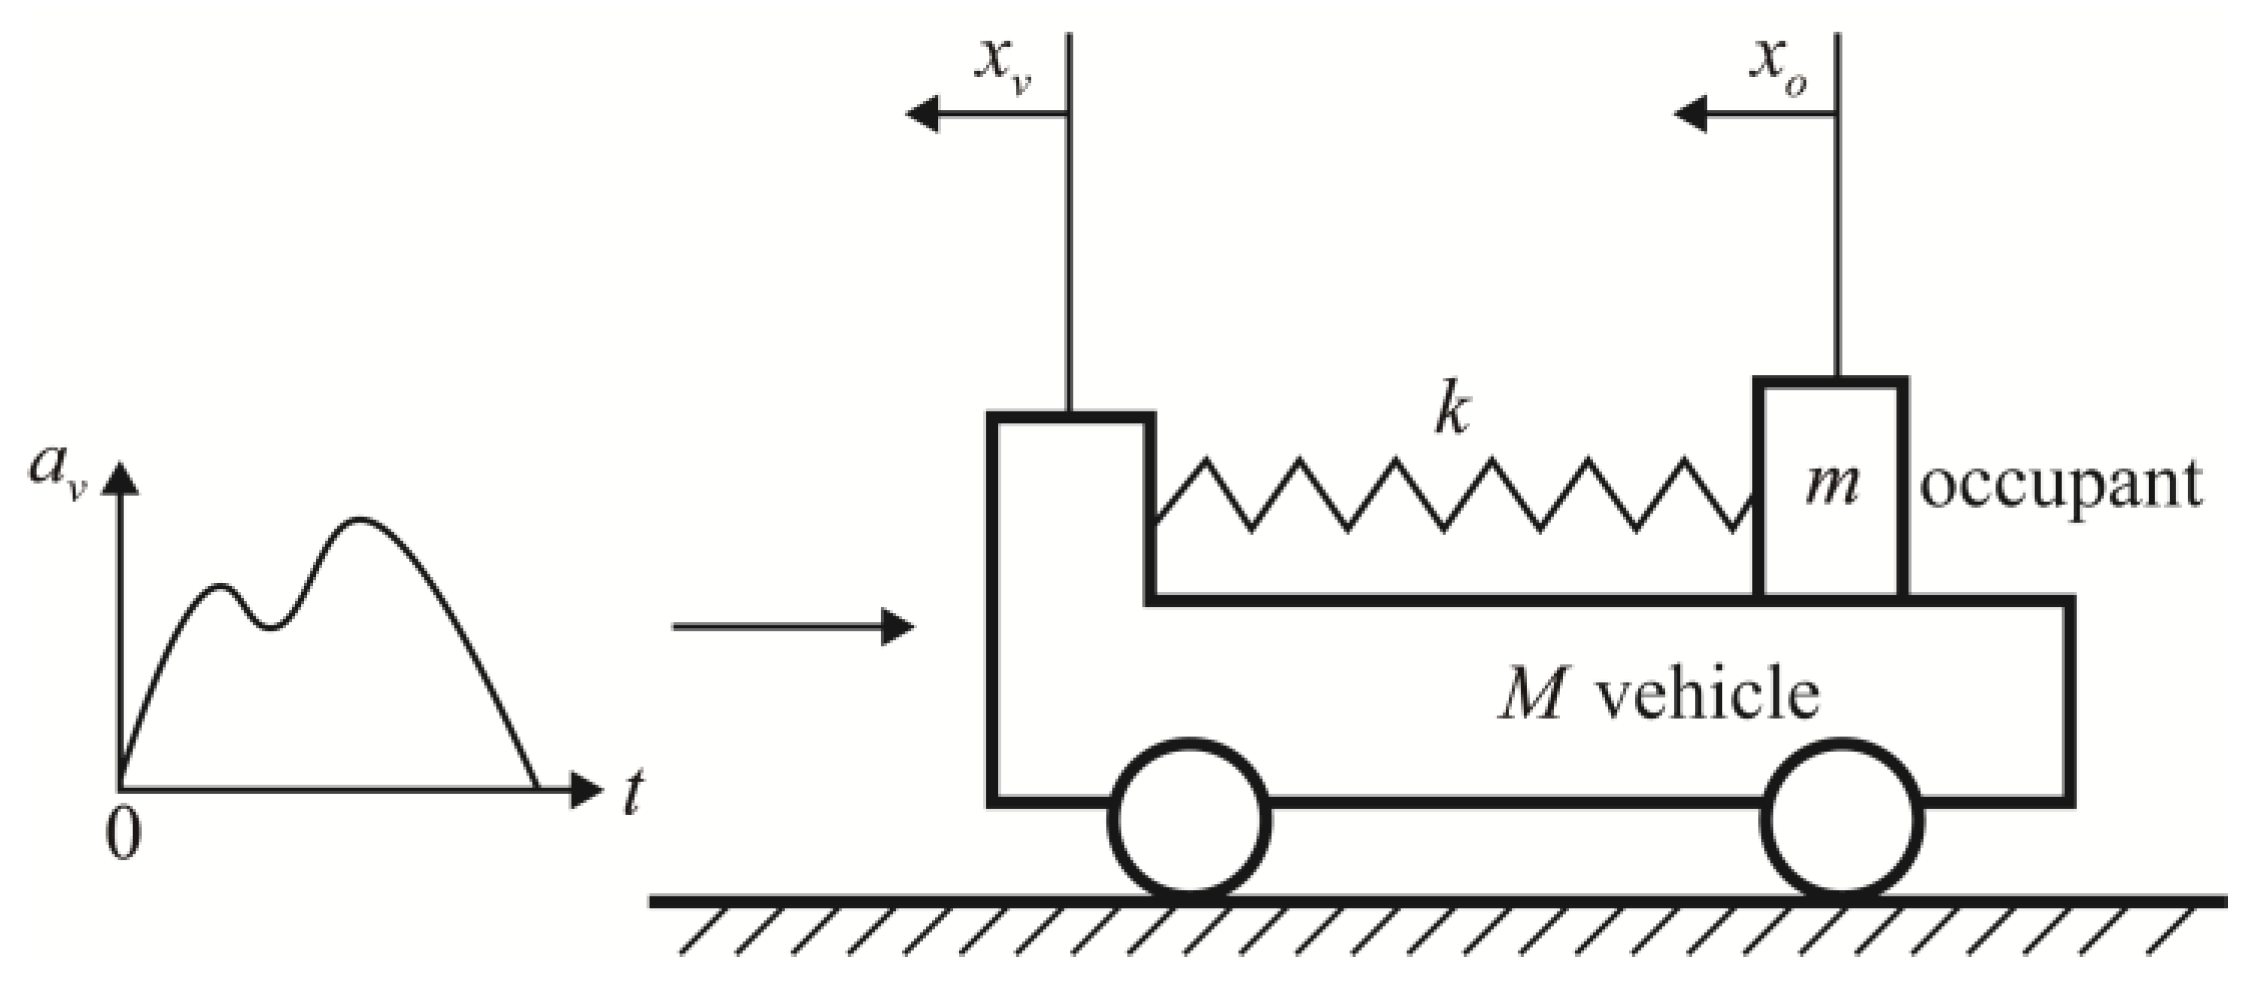
2.1. Vehicle–Occupant Crash Analytical Model

Matthew Huang et al. [25] used a classical simplified vehicle–occupant crash analytical model, which selected appropriate description parameters from the complex nonlinear system, to elaborate the interactions among the vehicle, occupant, and restraint system during the crash process. In the model, the vehicle and the occupant were simplified to mass blocks. The front-end structure and the restraint system were simplified to springs, according to the energy absorption characteristics. The relationship between the front-end structure and the restraint system was essentially vibration coupling. The vibration response of the occupant was solved by the frontal crash model, with the crash pulse as the system excitation and the restraint system characteristics as the system stiffness. This model was verified in the references [33,34,35].
The vehicle–occupant crash analytical model in Figure 1 can be further simplified under the condition that the crash pulse is known. As shown in Figure 1, M and m are the mass of the vehicle and occupant, respectively; xv and xo are the displacement of the vehicle and the occupant, respectively; and k is the equivalent stiffness of ORS. The occupant response is the result of the coupled vibration of the crash pulse a(t) and the equivalent stiffness k of ORS. The vibration equation can be expressed by Equation (1).
x ¨ o / v + k m x o / v = x ¨ v x ¨ o / v + k m x o / v = x ¨ v
where xo/v is the displacement of the occupant relative to the vehicle, and x ¨ o / v is the acceleration of the occupant relative to the vehicle. The motion response of the occupant is calculated as
x o = A sin ( ω n t + φ ) + R ( x ¨ v ) + x v
where A is the amplitude, ω n is the natural frequency of ORS, φ is the phase angle, and R ( x ¨ v ) is the particular solution of the vibration equation.

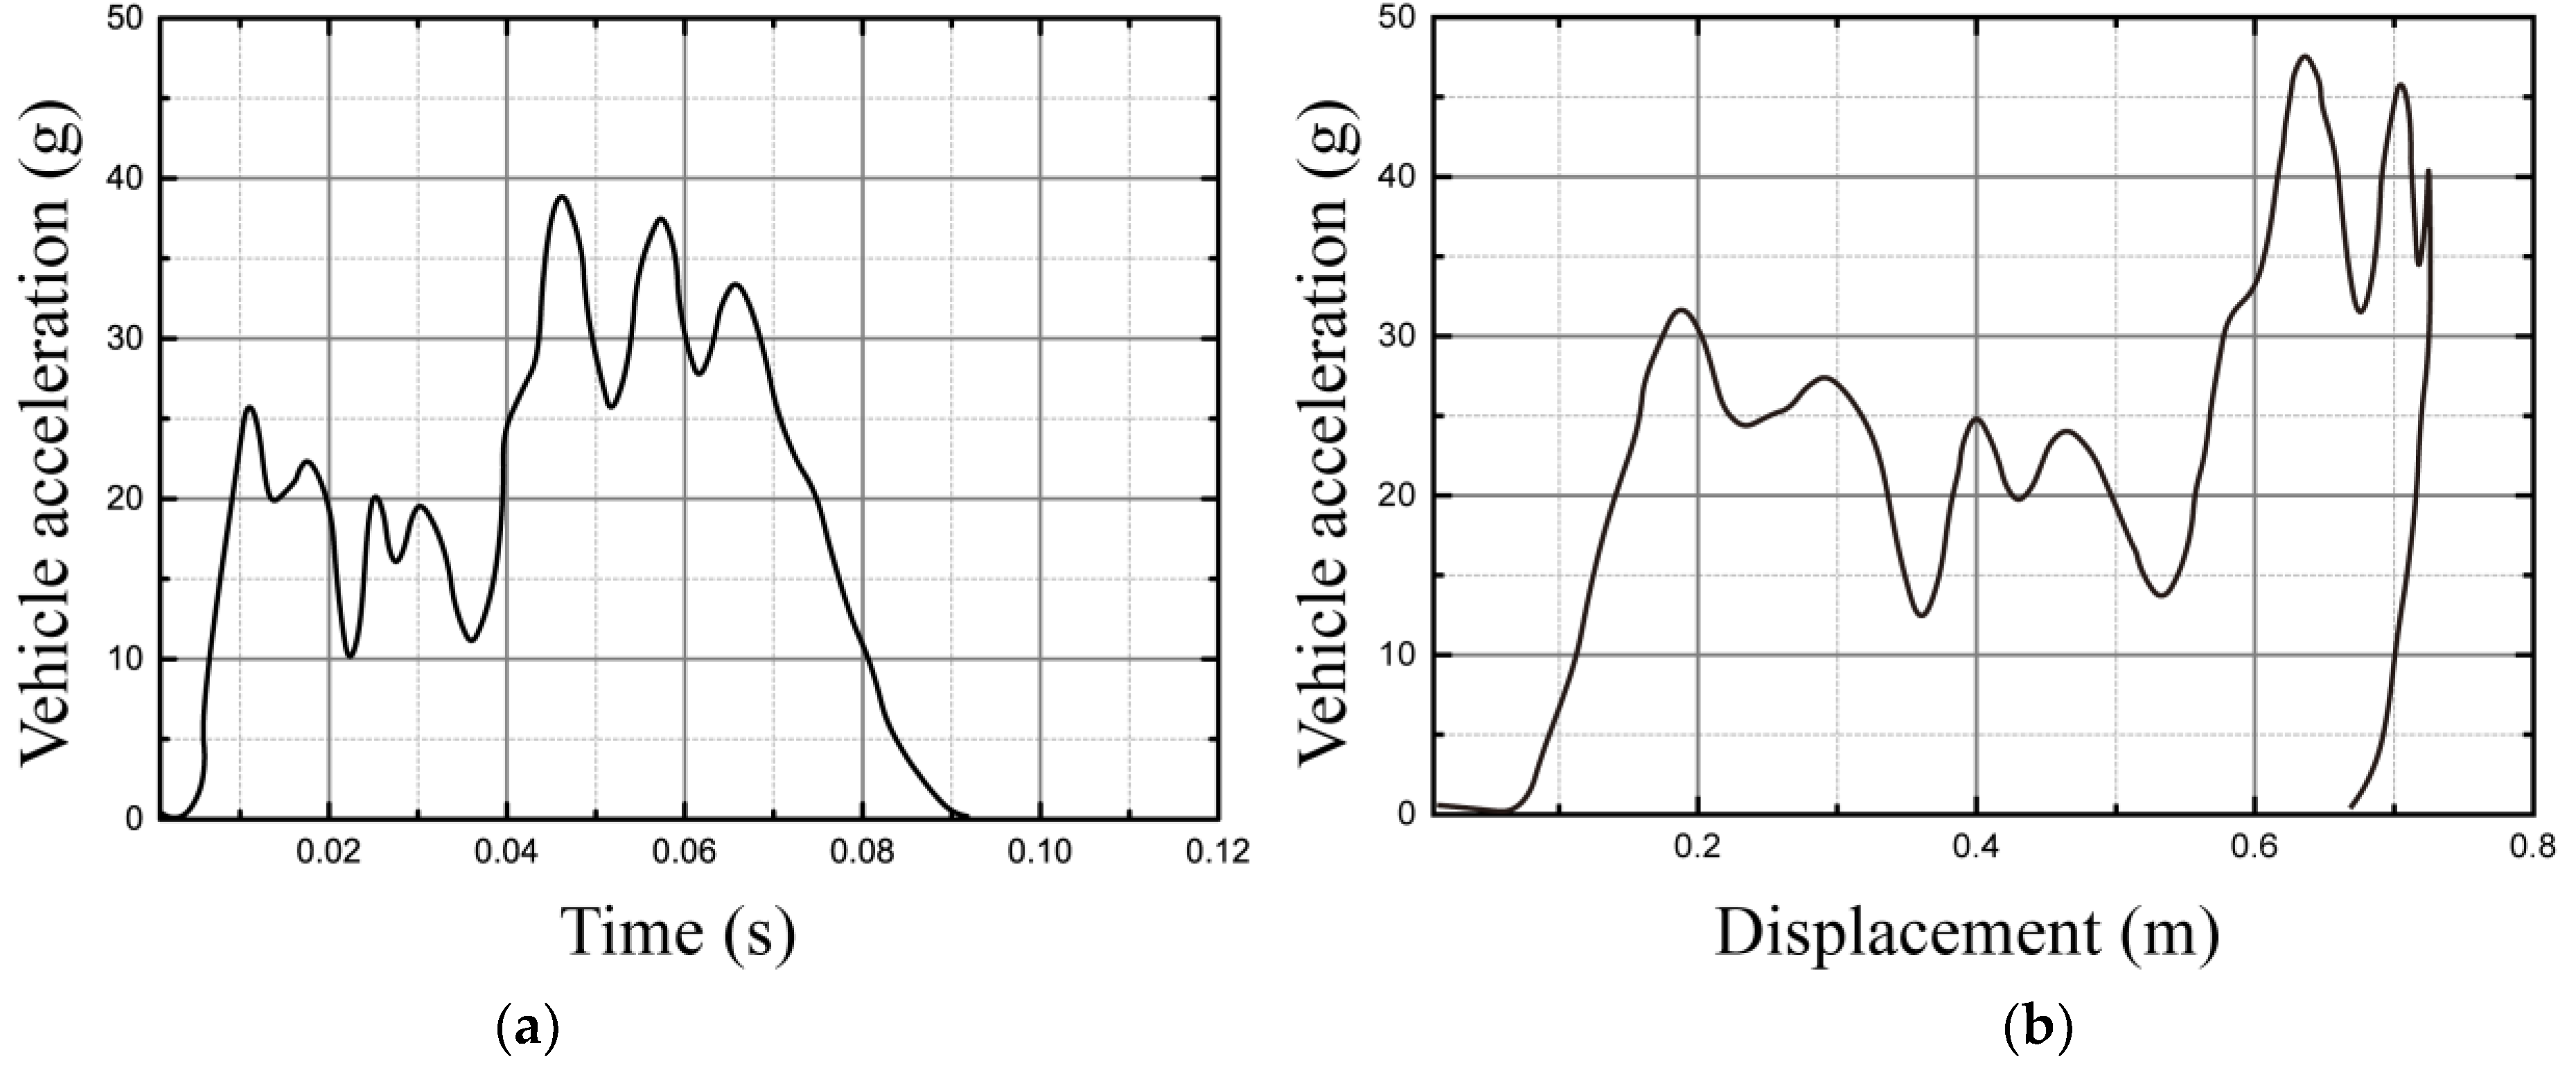
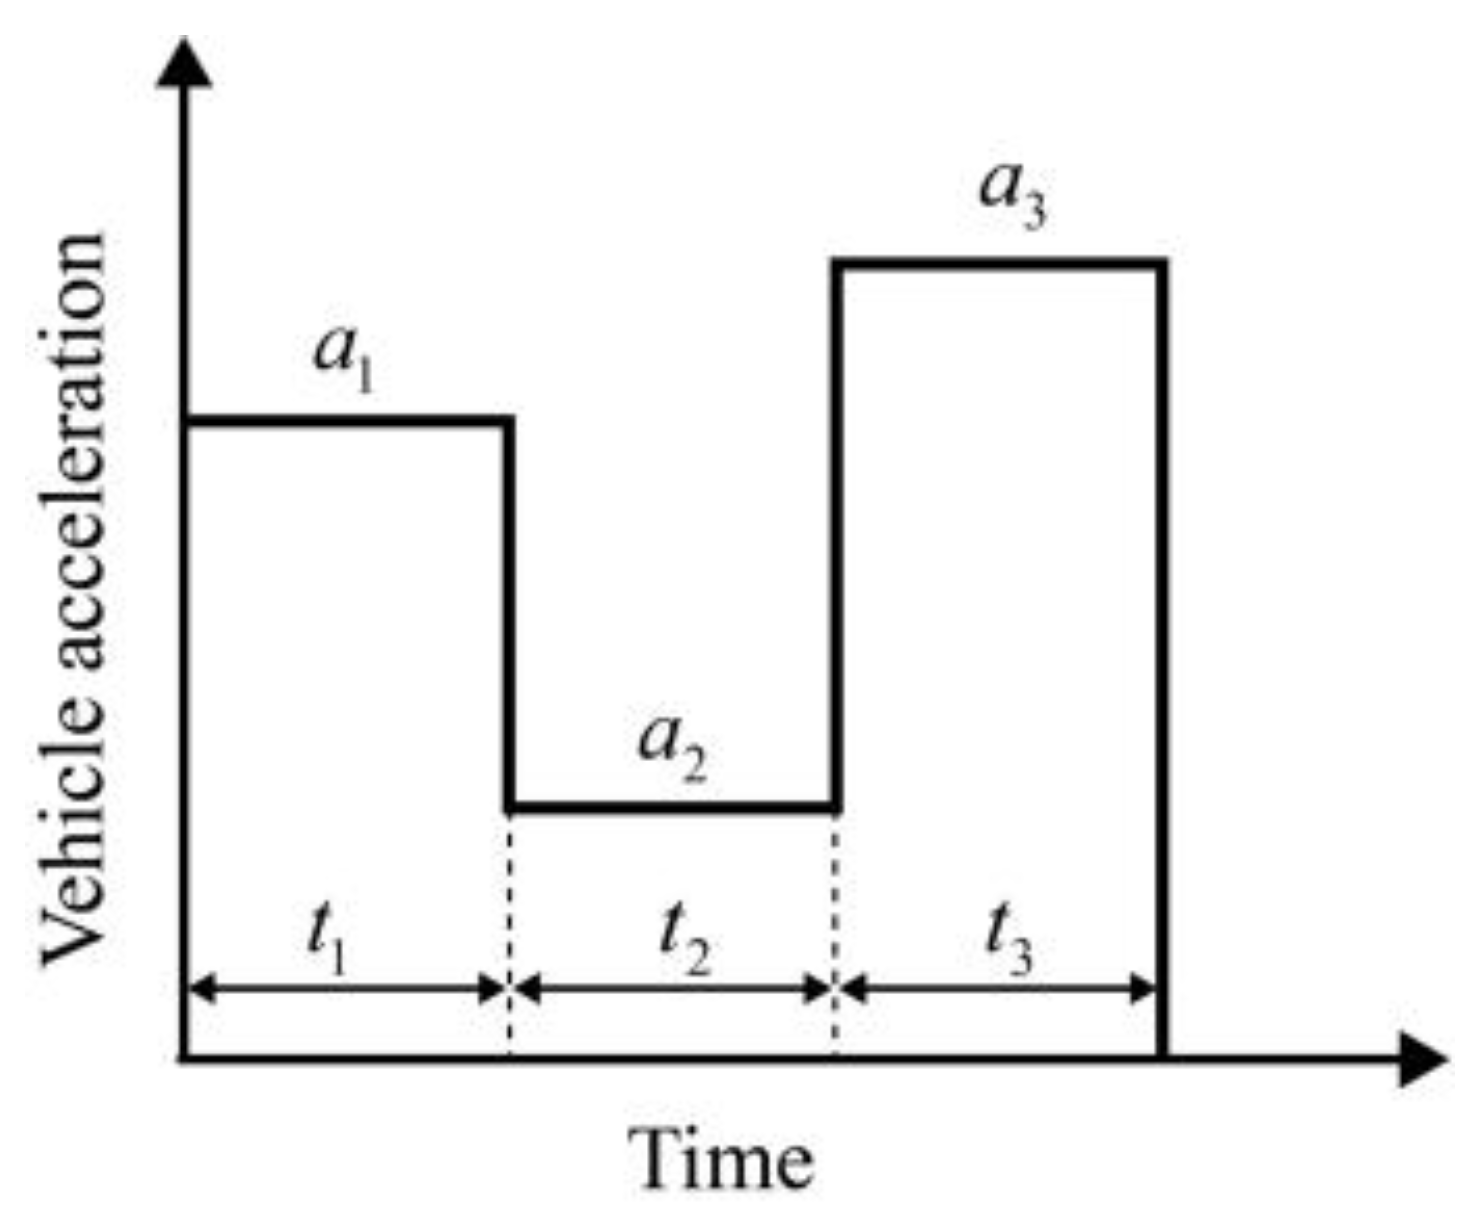
2.2. The Approximation of Vehicle Crash Pulse

The crash pulse is the deceleration history of the vehicle during a crash, which records various physical quantities of the crash. Due to the relative complexity of a crash pulse, it is difficult to establish a direct relationship with the structural parameters of the vehicle. Therefore, a crash pulse often needs to be simplified to support the study of the crashworthiness of a vehicle.
The frequently used simplified crash pulses include an equivalent square pulse, equivalent dual-trapezia pulse, multi-step pulse, and Fourier pulse. These equivalent pulses can reflect a series of important information during the crash, the crash energy, and the moment of maximum deformation. The appropriate equivalent pulse should be selected to meet the specific needs when analyzing different problems.
Theoretically, the crash pulse can be simplified into any form required by the research purpose, but the simplified pulse needs to meet the fundamental criteria of the crash pulse [36], which are detailed as follows:
1.
The integral of the simplified pulse in time domain equals the initial crash velocity of the vehicle.
v 0 = 0 t E a ( t ) d t
2.
The vehicle decelerates from the initial crash speed to zero, the time t E remains unchanged.
3.
The displacement obtained by simplified pulse equals the maximum deformation displacement of the vehicle d max .
d max = 0 t E [ v 0 0 t E a ( t ) d t ] d t
4.
The integral of the simplified crash pulse in the displacement domain equals the total energy absorption of vehicle in the crash, which is the initial kinetic energy of the vehicle.
1 2 v 0 2 = 0 d max a ( d ) d d

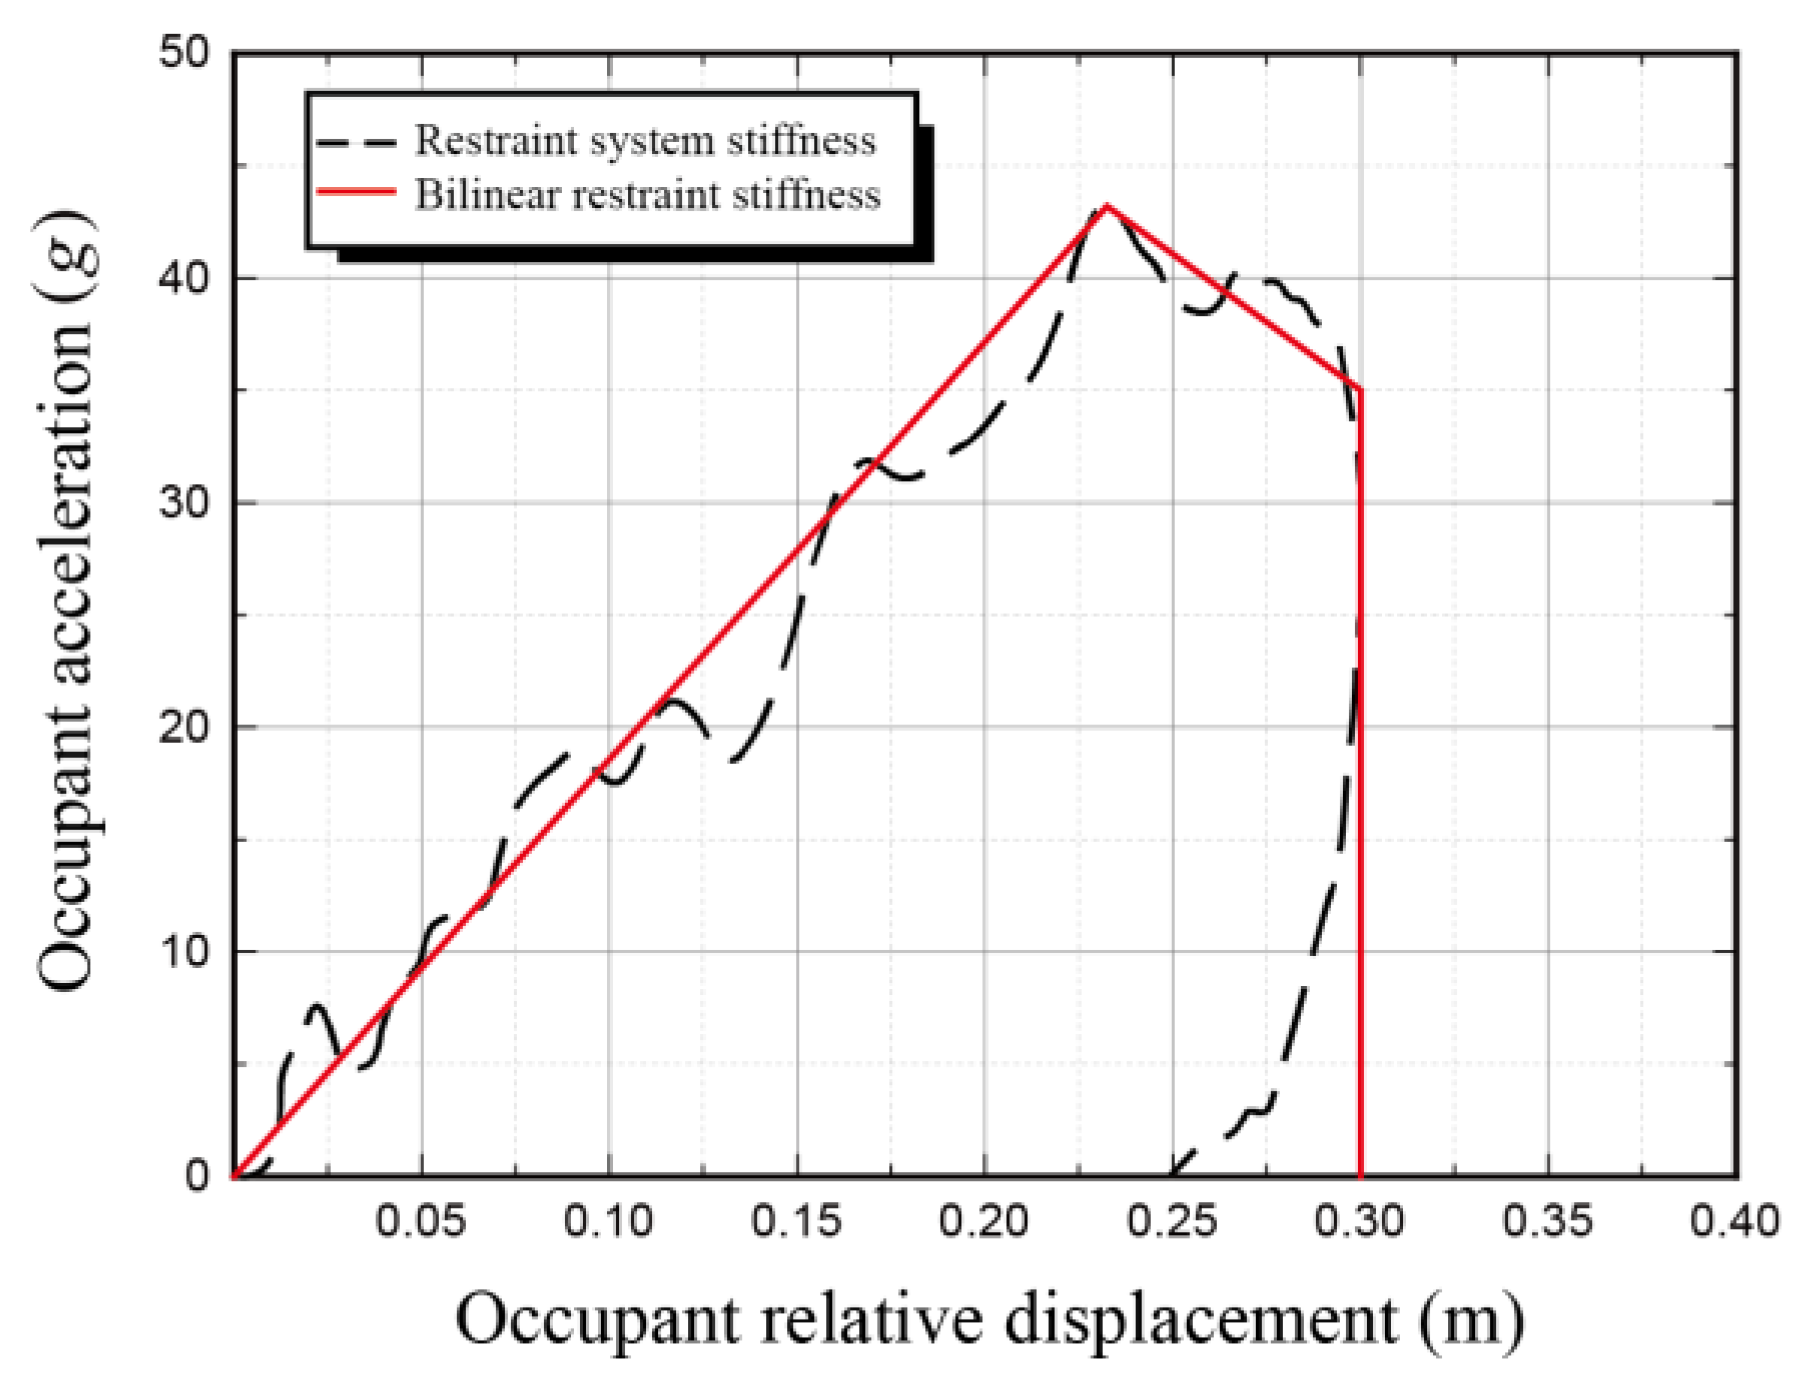
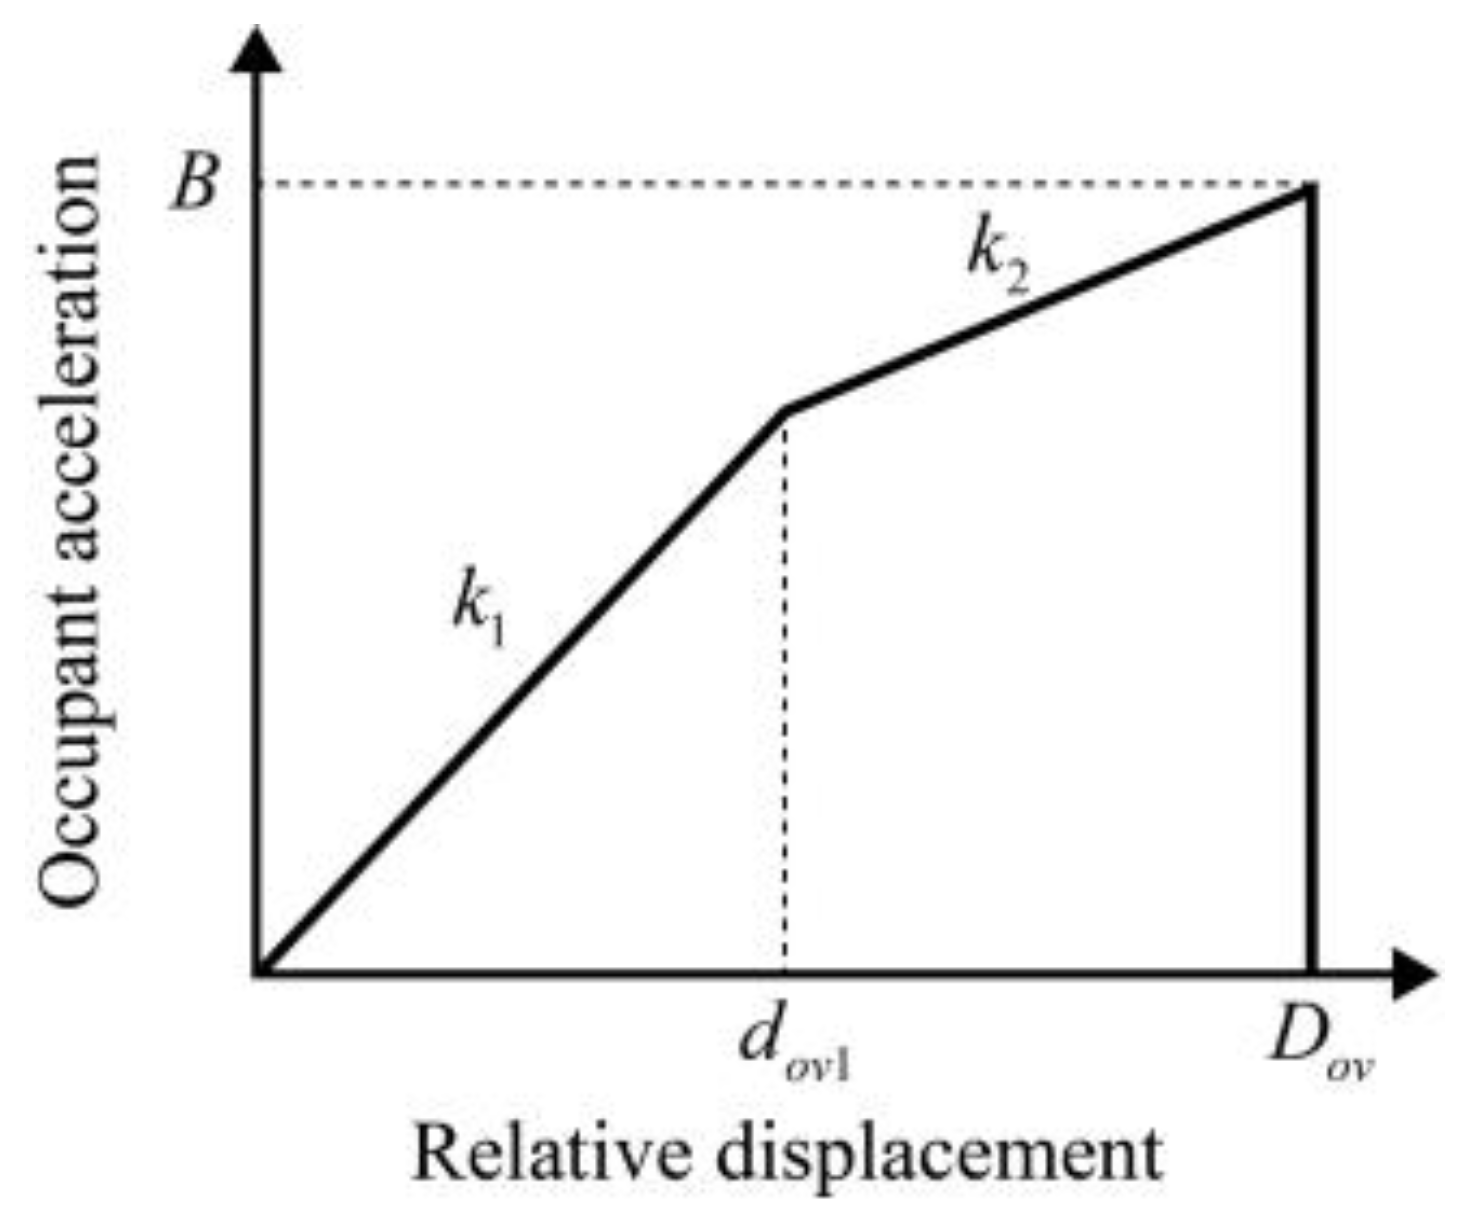
2.3. The Approximation of Occupant Restraint Stiffness

As shown in Figure 2, the ORS is mainly comprised of the seat belts, airbags, seats, and other parts. When a crash occurs, the ORS restricts the occupant motion in the vehicle, by exerting force on the occupant for purpose of occupant protection [37,38,39,40].
The comprehensive response of ORS can be expressed by the stiffness characteristics of the restraint system. To facilitate research and applications in conceptual design, a series of simplified methods can be made using the characteristics of the ORS. The current simplified methods for restraint system stiffness curves include single linear restraint stiffness, bilinear restraint stiffness, trapezoidal restraint stiffness, and double trapezoidal restraint stiffness.
The simplified stiffness characteristics for the restraint system should satisfy the following basic criteria:
(1)
The maximum relative displacement of the occupant Dov remains unchanged.
(2)
The energy absorbed by the ORS remains unchanged.

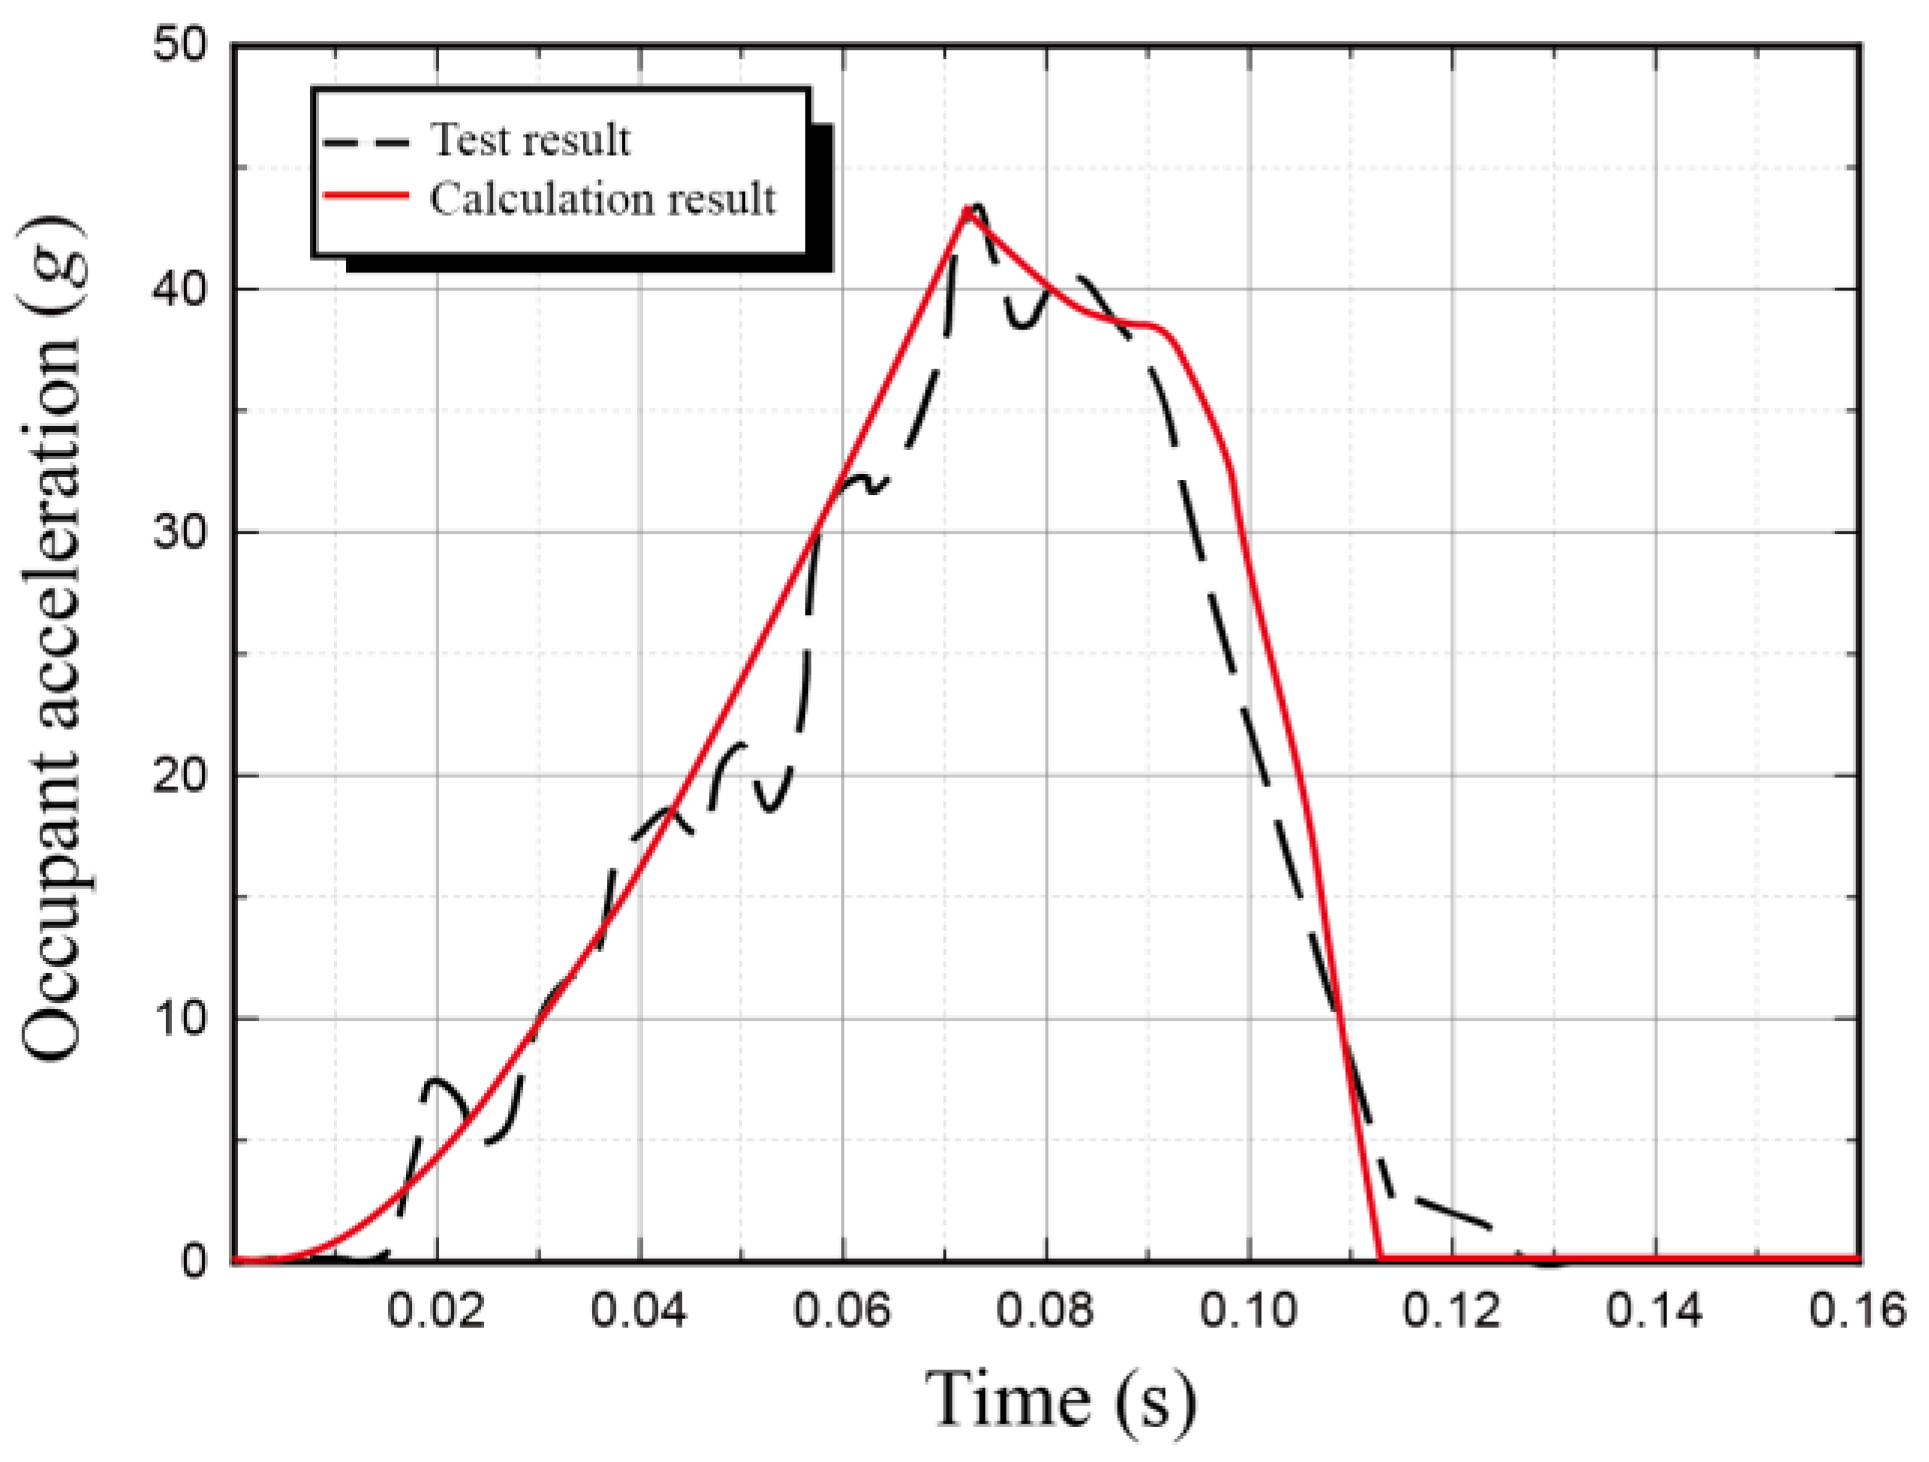
2.4. Fast Solution Algorithm of Occupant Response

The occupant response can be obtained directly by solving the vehicle–occupant crash analytical model. However, the solution process of the differential equation becomes very difficult when the input crash pulse or restraint stiffness is relatively complex. Therefore, based on the definition of ORS, a fast solution algorithm for the vehicle–occupant crash analytical model is introduced in this section [41]. The formulas of the fast solution algorithm are as follows:
x ¨ o ( i ) = k ( i ) [ x o ( i ) x v ( i ) ]
x ˙ o ( i ) = x ˙ o ( i 1 ) x ˙ o ( i ) t
x o ( i ) = x o ( i 1 ) + x ˙ ( i ) t 1 2 x ¨ o ( i ) t 2
The fast solution algorithm can be used as a quick tool to study the coupling relationship between the crash pulse and restraint stiffness.
In a FRB crash experiment, the front-end structure of the vehicle deforms, to absorb the impact energy, and the vehicle is in a deceleration process. However, the lower end of the B-pillar or the position of the seat beam deforms little during a frontal crash. Generally, the acceleration signal measured at the position without deformation in the collision process is taken as the crash pulse of the vehicle. After CFC60 filtering, a crash pulse extracted from the NHTSA database in a FRB condition for a certain vehicle is shown in Figure 3.
A crash pulse can be divided into time domain and displacement domain, according to the direction of its coordinates. A crash pulse in the time domain (shown in Figure 3a), namely the acceleration–time curve, is the kinematic signal that can be directly measured in a collision test. In the vehicle safety development stage, a crash in the time domain can be used as the input condition for the restraint system, to calculate the occupant response. The crash pulse in displacement domain (shown as Figure 3b), namely the acceleration–displacement curve, is obtained by integrating the curve in the time domain twice. The acceleration–displacement curve represents the relationship between the crash force and the longitudinal (collision direction) position of the vehicle body, which can be used to guide the energy absorption design of the structure.
If the occupant is reduced to a particle, the force of the restraint system on the occupant can be made equivalent to a concentrated force, then the overall performance of the restraint system can be expressed using a restraint system characteristic. The curve of the occupant acceleration–relative displacement can approximately represent the force–displacement curve of the restraint system and is defined as a restraint stiffness curve. After CFC120 filtering, the restraint stiffness of a certain vehicle extracted from the NHTSA databases is shown in Figure 4. The shape characteristics of the constraint stiffness curve (black dashed line in Figure 4) were simplified to the bilinear restraint stiffness shown in the red line.
The crash pulse in Figure 3a was discretized, and the unit time after discretization was 0.0001 s. The discrete crash pulse and the simplified bilinear restraint stiffness were put into the vehicle–occupant crash analytical model, and then the model was solved using the proposed algorithm, to obtain the occupant acceleration, as shown by the red line in Figure 5. Compared with the occupant acceleration of the test data (black dotted line in Figure 5), the peak error of the calculated result was less than 1%, and the curve variation trend was basically the same. This indicated that the proposed algorithm has sufficient accuracy and could be used to further study the occupant response.

3. Analysis of the Coupling Relationship between Crash Pulse and Restraint Stiffness

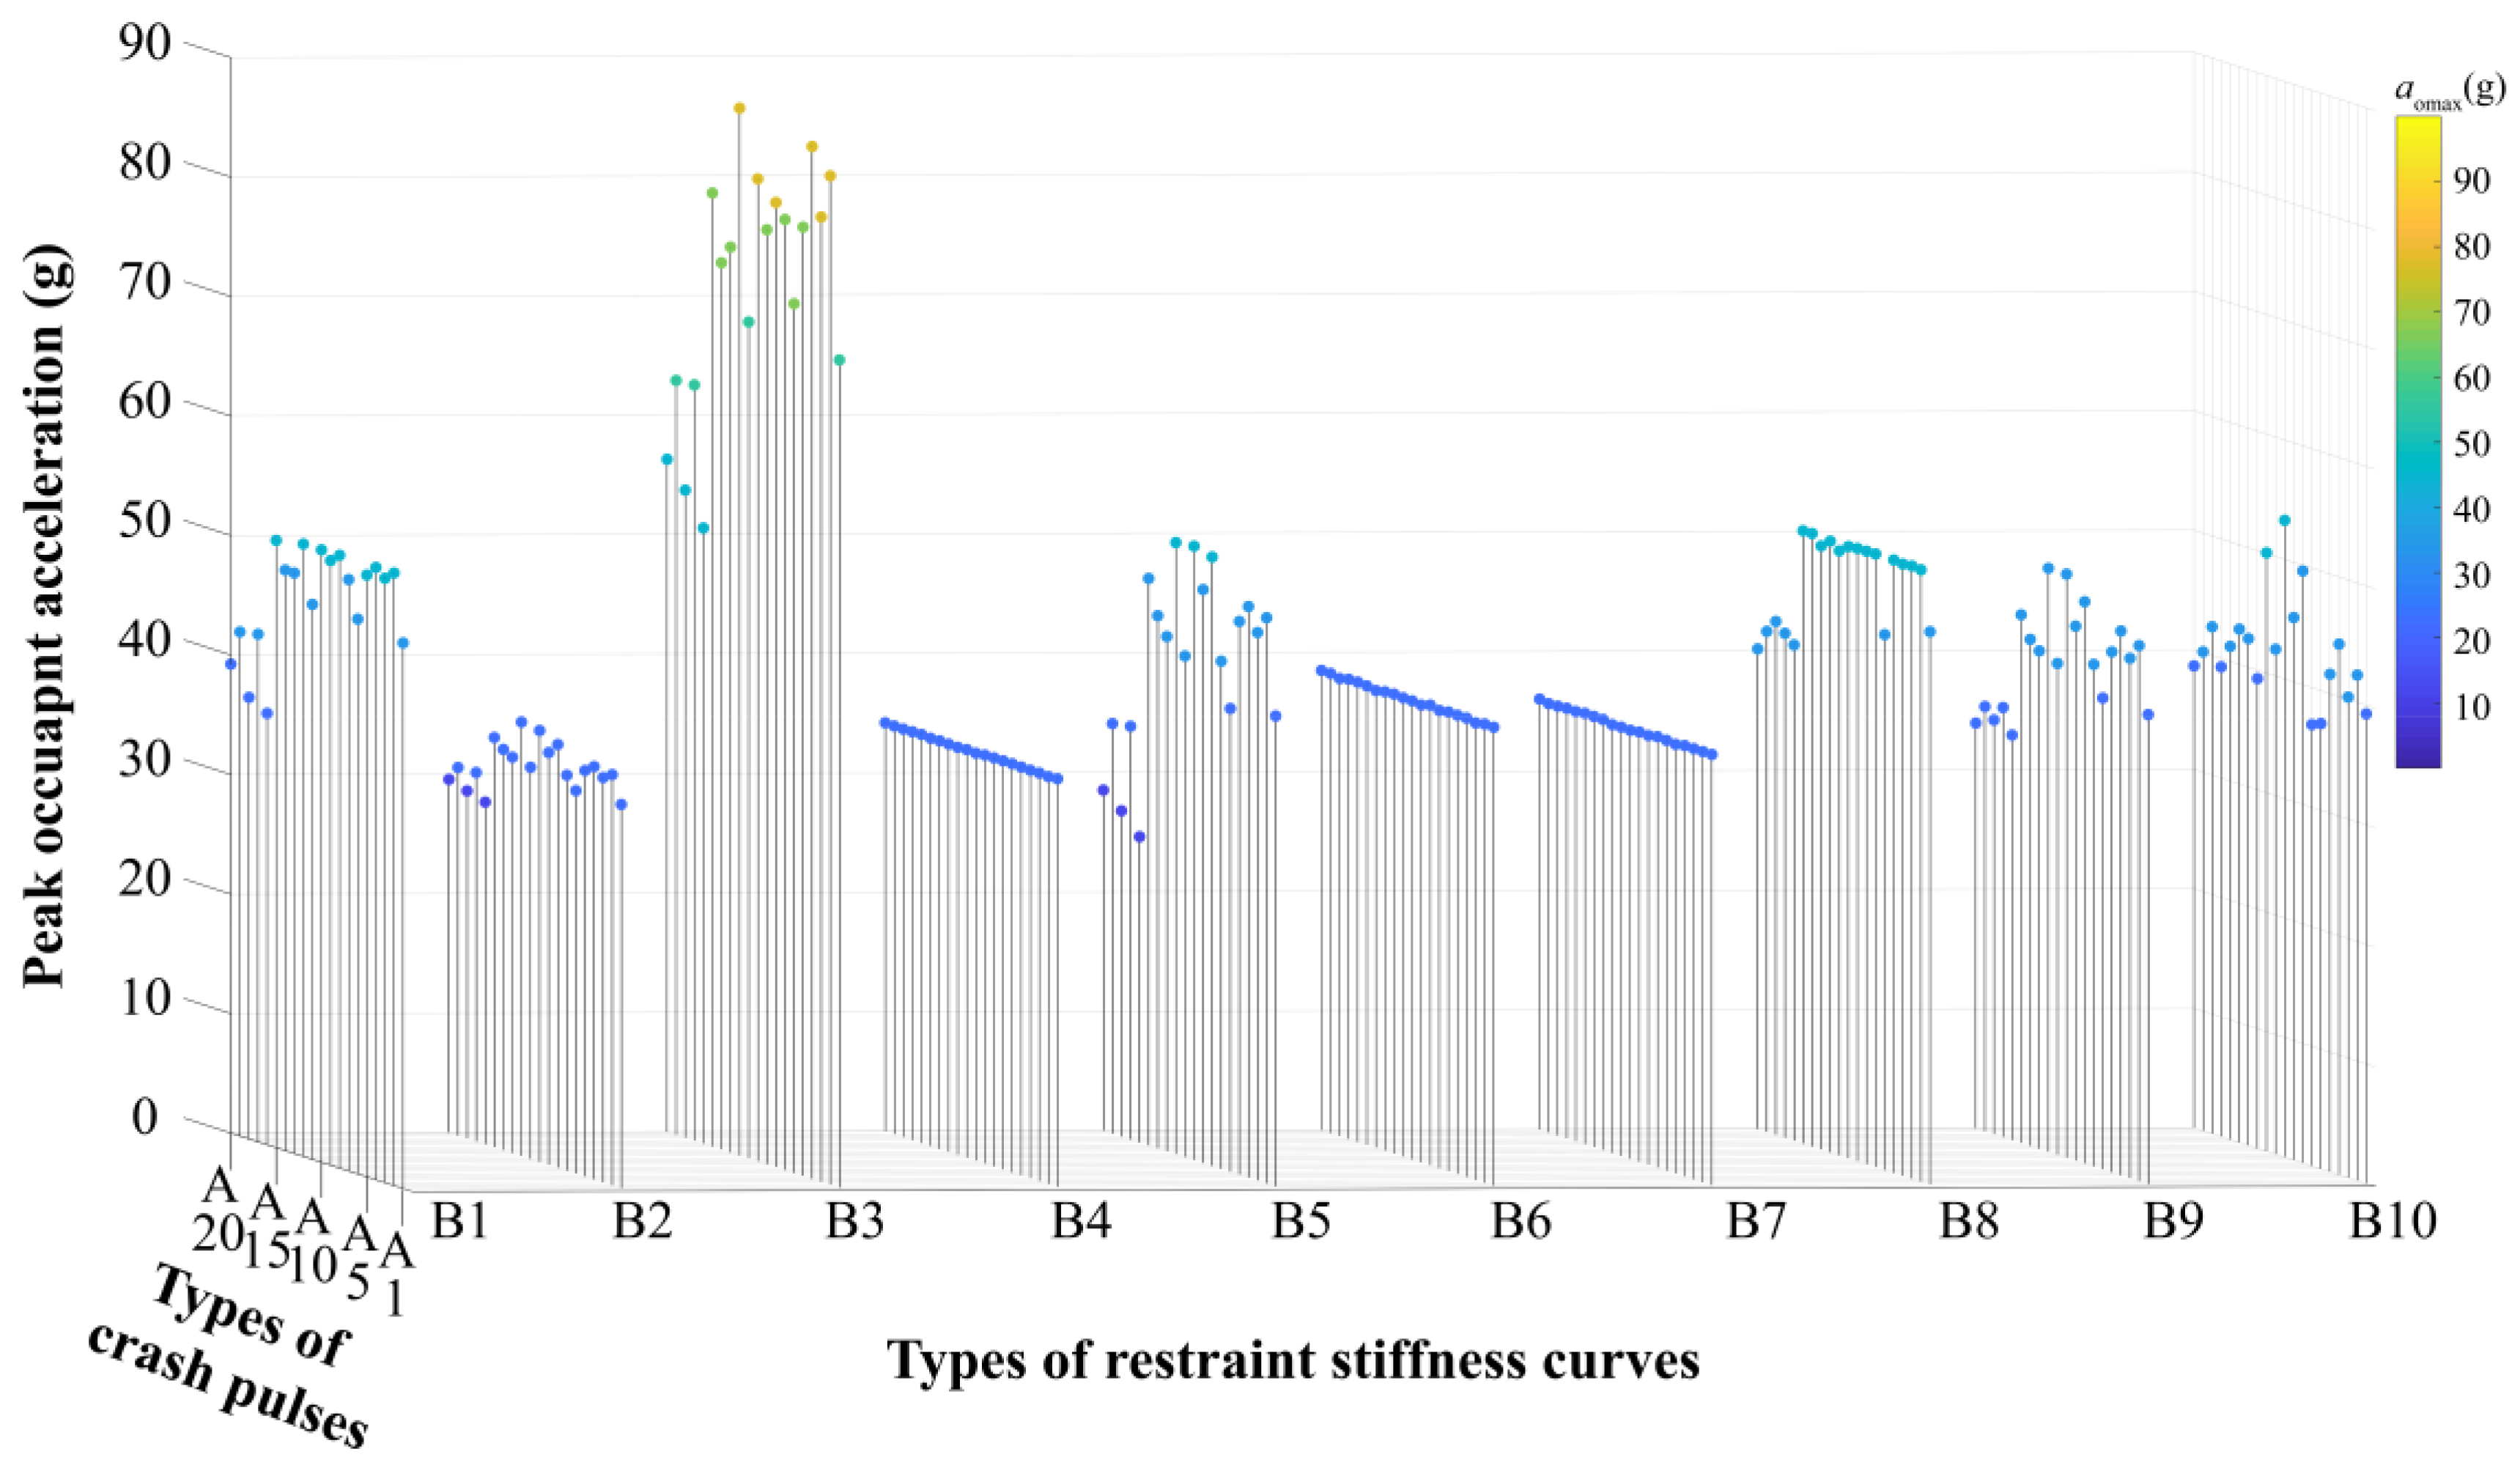
3.1. Occupant Response Database

Based on the crash pulse in Figure 3, a total of twenty simplified crash pulses are proposed. According to the simplification criteria for the crash pulse, the area between each simplified pulse and the time axis is equal to the initial crash speed of the vehicle in the FRB test: v0 = 15.64 m/s. Using the crash pulse to calculate the velocity of the vehicle in the crash process, it can be shown that the velocity of the vehicle is zero at the time of 0.0693 s, and then the total width t of each simplified pulse in the time domain is 0.0693 s. As shown in Table 1, the simplified crash pulses are divided into five categories according to their shape: rectangular pulse, upward pulse, downward pulse, convex pulse, and concave pulse.
Based on the characteristic curve of the ORS in Figure 4, ten simplified restraint stiffness curves are proposed. Through calculation, the energy-absorbing density of the original restraint system is 75.42 (m/s)2 and the maximum relative displacement is 0.3 m. According to the simplification criteria of the stiffness characteristics of the restraint system, the area between each simplified curve and axis of the relative displacement is equal to 75.42 (m/s)2 and the total width Dov of each simplified curve is 0.3 m. As shown in Table 2, the simplified restraint stiffness curves can be divided into three types according to their shape: upward curve, convex curve, and concave curve.
The occupant response database was established using the fast solution algorithm and y combining the simplified crash pulse (Table 1) and the simplified restraint stiffness curve (Table 2). The peak occupant accelerations extracted from the occupant response database are shown in Table 3.

3.2. Qualitative Analysis

To study the influence of the crash pulse shape and restraint stiffness curve on the occupant acceleration, the average peak occupant acceleration corresponding to each group of crash pulses and restraint stiffnesses in the occupant response database was calculated. The sequence number of the pulses, peak value of each set of crash pulses, and restraint stiffness curve, as well as the corresponding average peak occupant acceleration, are recorded in Table 4.
In Table 4, concave pulses (A16, A17, A18, A19, and A20) have a lower average peak occupant acceleration, which indicates that a concave pulse has a better coupling effect with restraint stiffness. In addition, the rectangular pulse A1 is a second-tier pulse, which is worse than the concave pulse. Except for A5, the average peak occupant acceleration of the upward pulses (A2, A3, A4, A6, and A7), downward pulses (A8, A9, A10, and A11), and convex pulses (A12, A13, and A14) increase with the increase of the peak value of the crash pulse. This shows that, for the upward, downward, and convex pulses, the pulses with a higher peak value of crash pulse have a worse quality. In addition, the range of the average peak occupant acceleration in the same category of crash pulse is within 5 g.
By comparing the crash pulses with the same peak value, it can be seen that the of quality of the concave pulse, upward pulse, downward pulse, and convex pulse decreases successively. In addition, the average peak occupant acceleration of the concave pulse is much lower than that of other categories of crash pulse with the same peak value, which again indicates that the quality of the concave pulse is obviously better than the other types of pulse.
According to the average peak occupant acceleration corresponding to the restraint stiffness in Table 4, B2 and B4 with the lowest average peak occupant acceleration also have lower peak values of restraint stiffness. In addition, exception for B10, the average peak occupant acceleration increases with the increase of the peak value of restraint stiffness, which indicates that the peak value of restraint stiffness is closely related to the peak occupant acceleration.
When comparing B7 and B10 that have the same peak value, the average peak occupant acceleration of the convex curve is lower than that of downward curve in the condition where the peak value of restraint stiffness is the same. Under the same conditions, the average peak occupant acceleration of the convex curve is higher than that of upward curve, when comparing B6 with B9, B1, B5, and B8. Therefore, in the case with the same peak value for restraint stiffness, the quality of the upward, convex, and downward waves decreases successively.
To further analyze the coupling relationship between the crash pulse and restraint stiffness, the crash pulse was taken as the X-axis and the restraint stiffness curve as the Y-axis, and the peak occupant acceleration corresponding to the crash pulse and restraint stiffness curve were drawn in a 3D scatter-plot. As shown in Figure 6, in the area where crash pulses A16, A18, and A20 are combined with restraint stiffness B2 and B5, the peak occupant acceleration is the lowest (less than 30 g). It should be noticed that A16, A18, and A20 are concave pulses, while B2 and B5 are upward curves. Therefore, it can be seen that the concave crash pulse and upward restraint stiffness curve have the best coupling effect.
Along the Y-axis direction in Figure 6, the peak occupant acceleration of the areas A16 and A20, and A1 and A6 is smaller than that of the others. In addition, for the other crash pulses, the contours of the peak occupant acceleration have almost no change along the Y-axis direction. This indicates that in the design of a crash pulse, adopting a concave, rectangular, or relatively gentle crash pulse can provide more design space to match the ORS. In the X-axis direction, the peak occupant accelerations of B2, B4, B6, and B7 have no significant changes, which indicates that these restraint stiffnesses have a better tolerance for matching the crash pulses. The choice of these restraint stiffness can leave more space for the design of the crash pulse. Compared with the various groups of restraint stiffness curves mentioned above, other types of restraint stiffness curves are less compatible with the crash pulse. In particular, if the restraint stiffness is of the type B3, it is difficult to match the appropriate crash pulse, due to the high peak occupant acceleration.
In general, the shape of a crash pulse is the main factor affecting the occupant acceleration; and the quality of a concave pulse, rectangular pulse, upward pulse, convex pulse, and downward pulse decreases in turn. The peak value of a crash pulse is the secondary factor affecting occupant acceleration. For the same crash pulse shape, the higher the peak value, the worse the crash pulse quality. Instead, the peak value of restraint stiffness is the main factor affecting occupant acceleration, and the higher the peak value, the worse the quality of restraint stiffness. The shape of the restraint stiffness curve is the secondary factor affecting the occupant acceleration. When the peak value of the restraint stiffness curve is the same, the quality of the upward curve, convex curve, and concave curve decreases progressively. From the perspective of coupling, a concave pulse or nearly rectangular crash pulse should be selected to match a bilinear restraint stiffness, under the premise of controlling the peak value of the restraint stiffness, so that a better coupling effect is obtained. A concave or nearly rectangular crash pulse can be selected to match a single or double trapezoidal restraint stiffness. In this way, a large design space of crash pulse and restraint stiffness can be obtained under a given requirement of peak occupant acceleration.

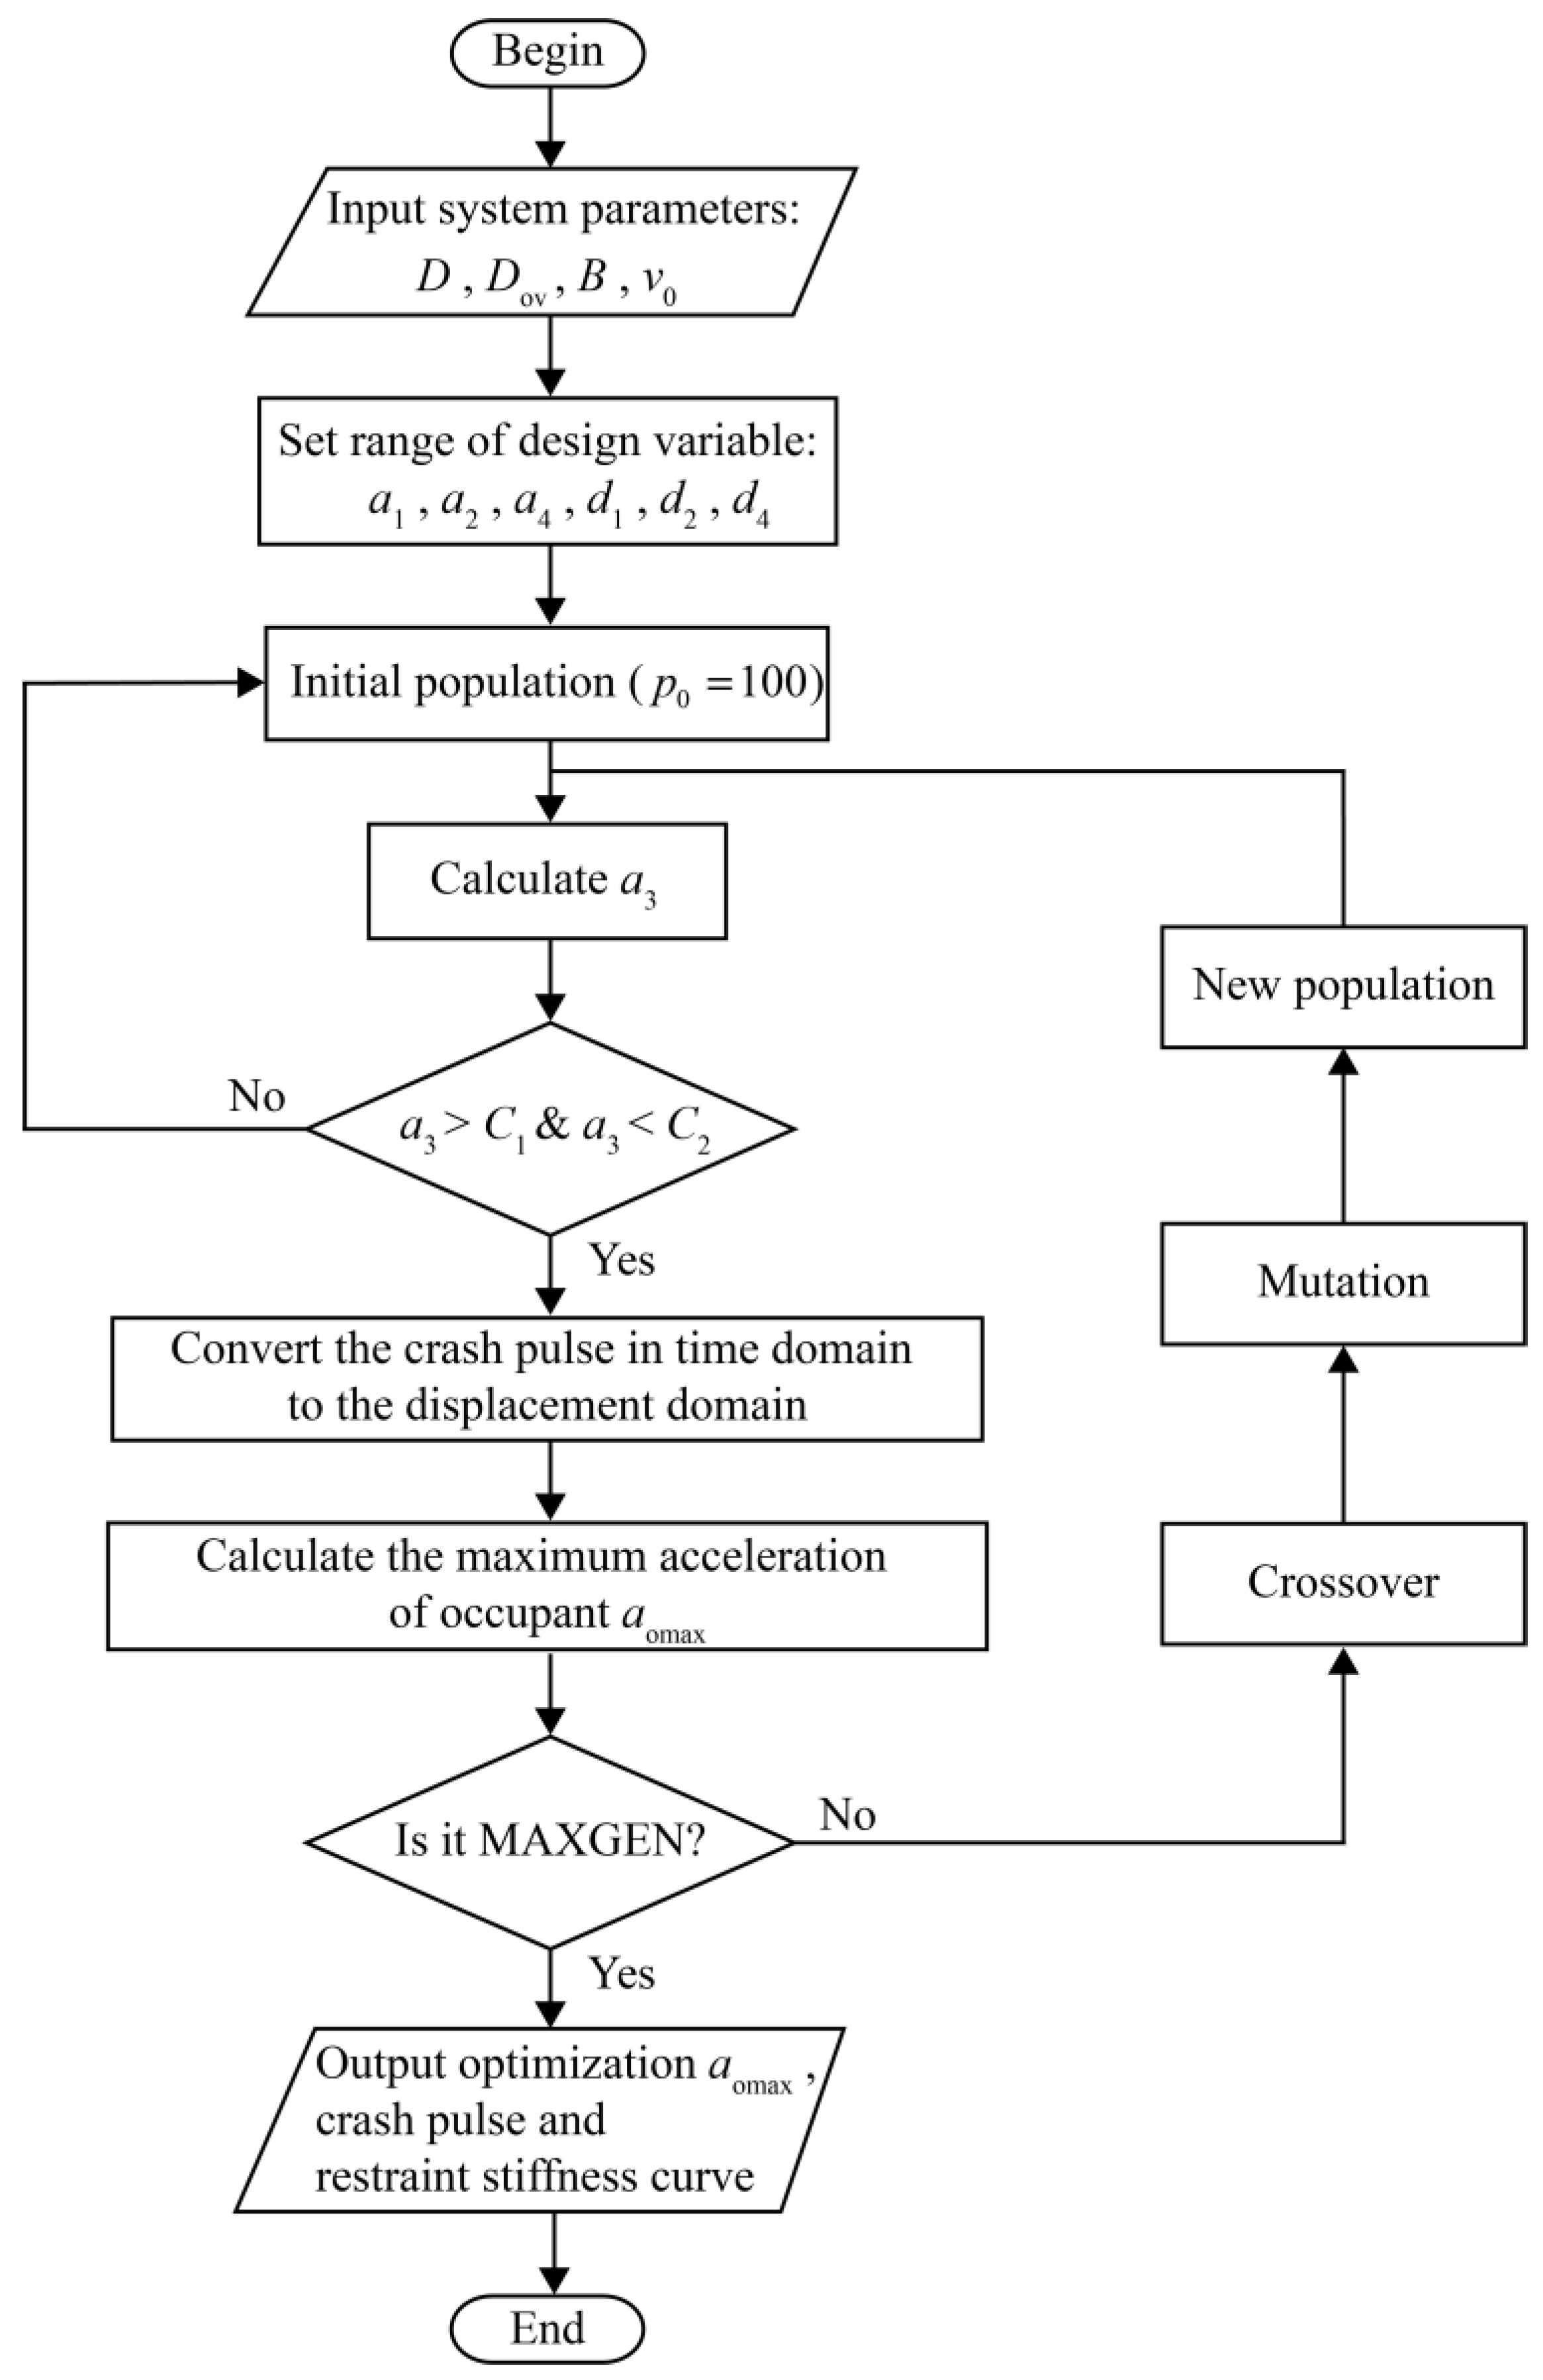
4. Coupling Optimization Design of Crash Pulse and Restraint Stiffness

4.1. Coupling Optimization Method

In this section, the coupling of a concave pulse and bilinear restraint stiffness, which has a good effect, is taken as an example, to study the matching strategy in an FRB test. Based on the fast solution algorithm, a coupling optimization method suitable for the conceptual design was proposed using the variable recognition function of the GA [42,43,44,45,46].
In the conceptual design phase of vehicle safety, the occupant safety requirements are given, and it is assumed that the energy absorption space of the vehicle’s front structure and the available space in the occupant’s cabin are all exhausted. The occupant safety requirements include both the peak occupant acceleration B and the maximum occupant living space Dov. The total width of the crash pulse in the displacement domain D corresponds to the energy absorption space of the front-end of the vehicle. Since the fast solution algorithm is applicable to the coupling solution of the crash pulse in the time domain, a concave pulse in the displacement domain needs to be converted into the time domain in the optimization process.
The parameters defining a concave pulse in the time domain are shown in Figure 7, where a1, a2, and a3 are the heights of the three-stage concave pulse; and t1, t2, and t3 are the widths of the three-stage concave pulse, respectively. According to the physical significance of the crash pulse and the characteristics of the concave pulse, the parameters of a concave pulse should meet the following requirements:
( a 1 t 1 + a 2 t 2 a 3 + a 3 t 3 ) × g = v 0
a 1 , a 3 a 2 0
t 1 + t 2 + t 3 = t
Utilizing Equations (9) and (11), this can be given as:
{ t 3 = t t 1 t 2 a 3 = v 0 / g a 1 t 1 a 2 t 2 t 3
Therefore, t1, t2, a1, and a2 are the design parameters of a concave pulse in the time domain.
The integral of the crash pulse in the displacement domain is the total energy absorption density of the vehicle in the crash process. The total absorbed energy of a vehicle in the FRB test equals the initial kinetic energy of the vehicle:
{ v i = v i 1 t i 1 t i a i d t d i = t i 1 t i ( v i 1 t i 1 t i a i d t ) d t i = 1 ,   2 ,   3
If a1, a2, d1, and d2 are the design variables of the crash pulse in the displacement domain, a3 and d3 should satisfy Equation (14).
{ d 1 + d 2 + d 3 = D a 1 d 1 + a 2 d 2 + a 3 d 3 = 1 2 v 0 2
The widths of the steps t1, t2, and t3 correspond to the displacements d1, d2, and d3, respectively, and the conversion formulas are as follows:
{ t 1 = v 0 v 0 2 2 a 1 d 1 a 1 t 2 = ( v 0 a 1 t 1 ) ( v 0 a 1 t 1 ) 2 2 a 2 d 2 a 2 t 3 = ( v 0 a 1 t 1 a 2 t 2 ) ( v 0 a 1 t 1 a 2 t 2 ) 2 2 a 3 d 3 a 3 d 3 = D d 1 d 2 a 3 = v 0 2 2 a 1 d 1 2 a 2 d 2 2 ( D d 1 d 2 )
The parameters defining the bilinear restraint stiffness curve are shown in Figure 8, k1 and k2 are the two-stage stiffnesses of the bilinear restraint stiffness curve, respectively; Dov is the maximum occupant relative displacement; dov1 is the occupant relative displacement corresponding to the inflection point of the bilinear restraint stiffness curve; and B is the peak occupant acceleration of the bilinear restraint stiffness curve. Dov corresponds to the maximum occupant living space in the conceptual design phase and can be determined in advance. The peak occupant acceleration B represents the safety index of a frontal crash and should also be limited in the conceptual design phase. Hence, the designability of Dov and B is low. Combined with the characteristics of the bilinear restraint stiffness curve, the inflection point (d4, a4) of the bilinear restraint stiffness curve is taken as the design variable, and k1 and k2 can be calculated using
{ k 1 = a 4 d 4 k 2 = B a 4 D o v d 4
A flowchart for coupling optimization is shown in Figure 9. The optimization target is the peak occupant acceleration, and the smaller the better. The design variables are set to the usual range for engineering. The population p0 is 100, the MAXGEN is 300, the fixed crossover probability Pc is 0.7, and the fixed mutation probability Pm is 0.01.

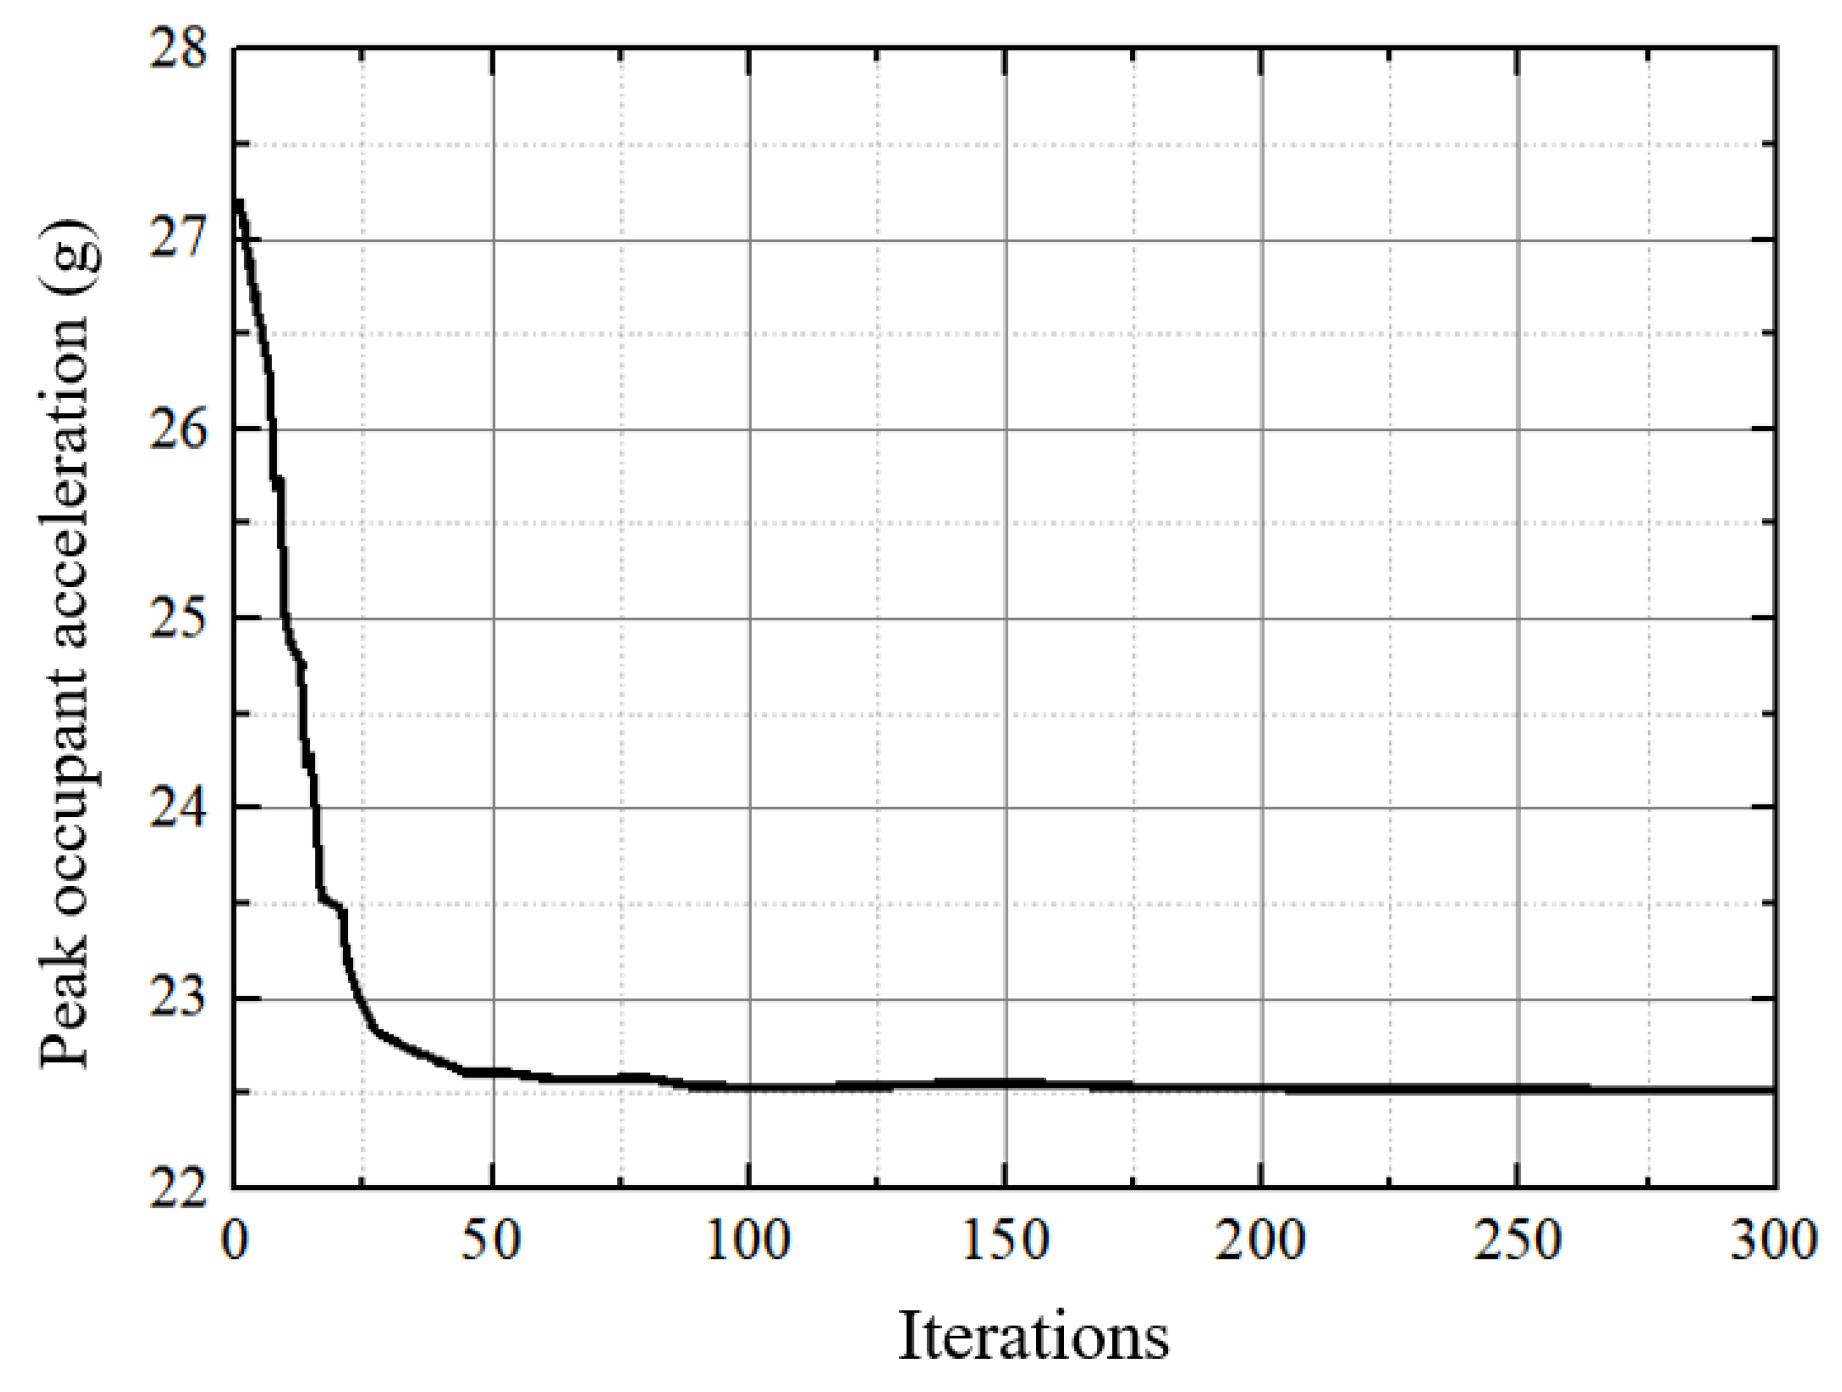
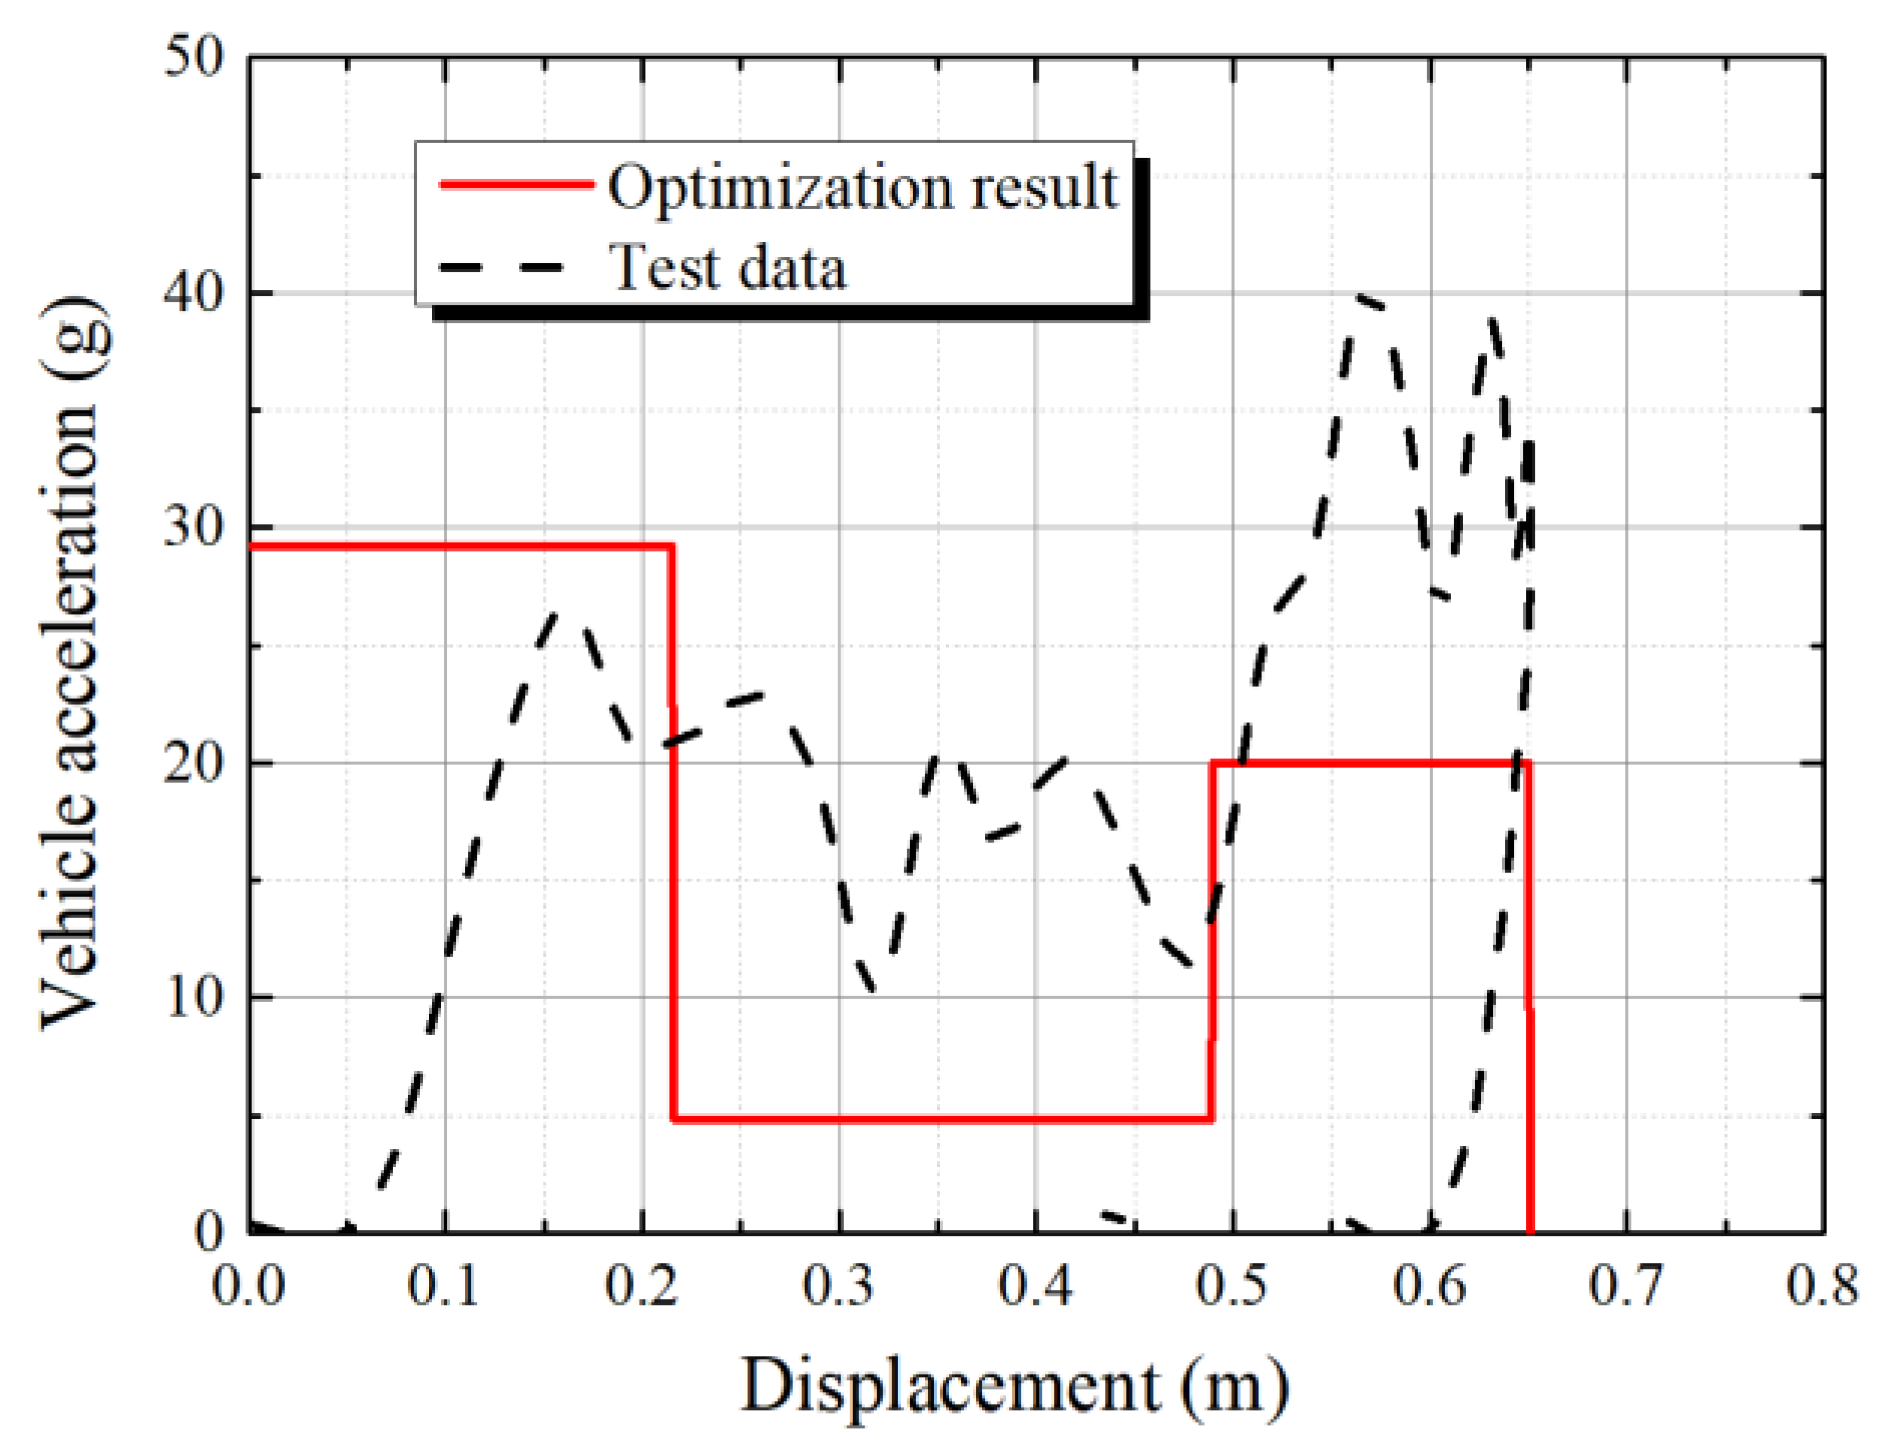
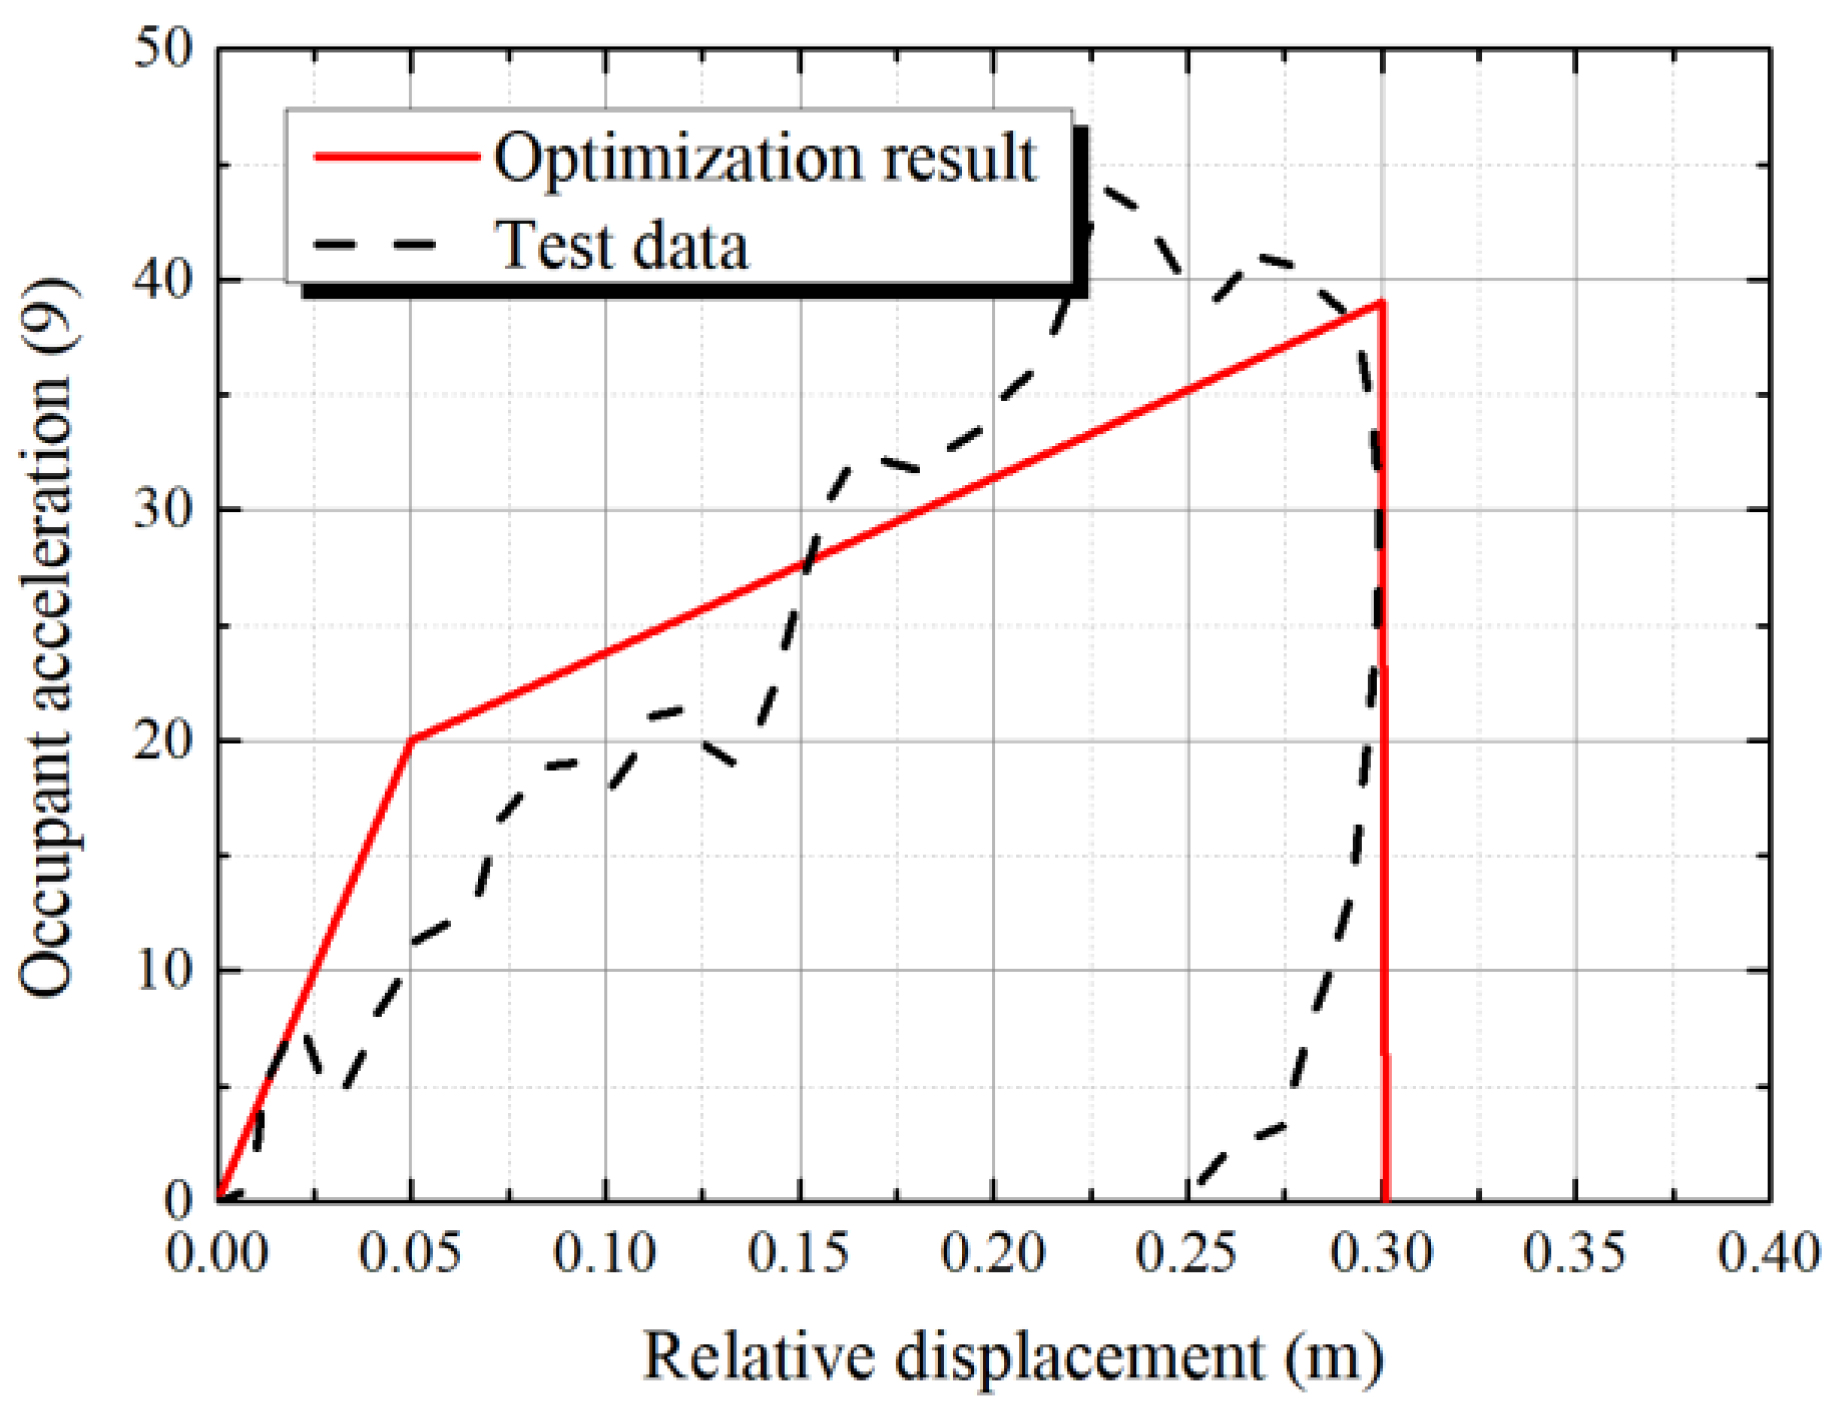
4.2. Optimization Example

Based on the vehicle data mentioned in Section 2.4, the proposed optimization algorithm was used to perform coupling optimization of the crash pulse and restraint stiffness for the vehicle [47]. The parameter formula of the optimization algorithm can be defined as follows:
{ Find :   X = [ a 1 , a 2 , a 4 , d 1 , d 2 , d 4 ] T Min :   a omax s . t .   0 a 1 50 g 0 a 2 50 g 0 < a 3 30 g 0 a 4 38.7 g 0 d 1 0.325   0 d 2 0.325 0 d 4 0.3
After 300 iterations, as shown in Figure 10, the final optimized peak occupant acceleration was 22.5 g, and the peak occupant acceleration had decreased by 44%. The optimized crash pulse and bilinear restraint stiffness curves are shown in Figure 11 and Figure 12, respectively. The optimization result was consistent with the conclusion in Section 3.2 that the coupling effect of a concave crash pulse and convex bilinear restraint stiffness curve is the best option. A comparison of optimization results with the original data is shown in Figure 13. It can be seen that the optimized result was significantly better than the original data. The coupling of the concave crash pulse with bilinear constraint stiffness can bring forward the peak of occupant acceleration and keep the acceleration stable in the medium term.

5. Discussion

Using the coupling optimization algorithm, the final design of the crash pulse was a concave pulse, which could be divided into three phases: high, low, and moderate level, and the restraint stiffness was a bilinear convex curve. In this section, the engineering feasibility of the concave crash pulse and bilinear restraint stiffness will be discussed further.
A crash pulse is the crashworthiness design objective for the vehicle front-end structure, and it is necessary to reasonably design the deformation mode of the structure to obtain the target pulse. Experience suggests that the main deformation modes of the front-end structure in the crash process are crushing and bending. A structure with regular collapse deformation absorbs the most energy and the crash reaction force can be maintained at a higher level, which shows that a regular collapse is the ideal deformation mode. By contrast, local bending of the structure will produce a lower crash force. Thus, a concave crash pulse can be realized by appropriately designing the crushing and bending deformation modes of the structure. Note that the cross-section of the structure designed to bend should be the weakest part in the front rail. This means that, for the front rail, these points deform first. Therefore, in the design process, it is important to address the buckling of the weaker parts before the final collapse.
For the structural design, new material technologies provide methods for realizing the control of the crash force. The tensile, compressive, and shear strength of strain rate-sensitive materials varies significantly under different strain rates. During the initial phase of a crash, the front-end energy-absorbing structure made of a strain-rate-sensitive material deforms rapidly and the crash reaction force is high. As the crash velocity decreases, the strain rate effect weakens rapidly and the reaction force decreases. In the final phase of the crash, the energy-absorbing space of the vehicle front-end decreases, and the reaction force starts to increase as the deformed structures are gradually compacted.
The restraint stiffness curve of an ORS represents the energy-absorbing characteristics of the restraint system and can be used as the performance design objective for the ORS in the conceptual design phase. At present, the matching of a ORS is mainly used to design the performance parameters of the safety belt, airbag, steering string, and other subsystems. Therefore, according to the mechanism of the restraint subsystem and its interaction with occupants, the restraint stiffness can be decomposed into the energy-absorbing goals and stiffness design goals of each subsystem, so that the main parameters of the subsystem can be calculated using the theoretical formula. Restraint stiffness decomposition realizes the performance decoupling of the restraint system by dividing the restraint stiffness curves of the area. For a bilinear restraint stiffness curve, this is usually divided into a seat belt and airbag. The equivalent stiffness of the safety belt, the force limiting acceleration, and the equivalent stiffness of the airbag can be obtained from the restraint stiffness curve after decomposition. By adjusting the seat belt stiffness, force limiting level, airbag vent size, and airbag filling rate, the required bilinear restraint stiffness curve can be achieved.

6. Conclusions

In this paper, a database of crash pulse, restraint system stiffness, and occupant response was established using a vehicle–occupant crash analytical model. According to the database, the coupling relationship of the crash pulse and restraint stiffness was qualitatively analyzed from the perspective of the curve shape and peak value. Then, combing with the GA and crash analytical model, a coupling optimization algorithm was proposed, to design the parameters of the crash pulse and restraint stiffness using a specific shape. Finally, the engineering feasibility of the coupling design was discussed. The main conclusions of this paper are summarized as follows:
(1)
For a crash pulse, the pulse shape is more important than the pulse parameters, and the quality of the concave pulse, rectangular pulse, upward pulse, convex pulse, and downward pulse decreases successively.
(2)
For the restraint stiffness curve, the peak value of the curve is closely related to the peak occupant acceleration. When the peak value is the same, the quality of the restraint stiffness curve for an upward curve, convex curve, and concave curve decreases successively.
(3)
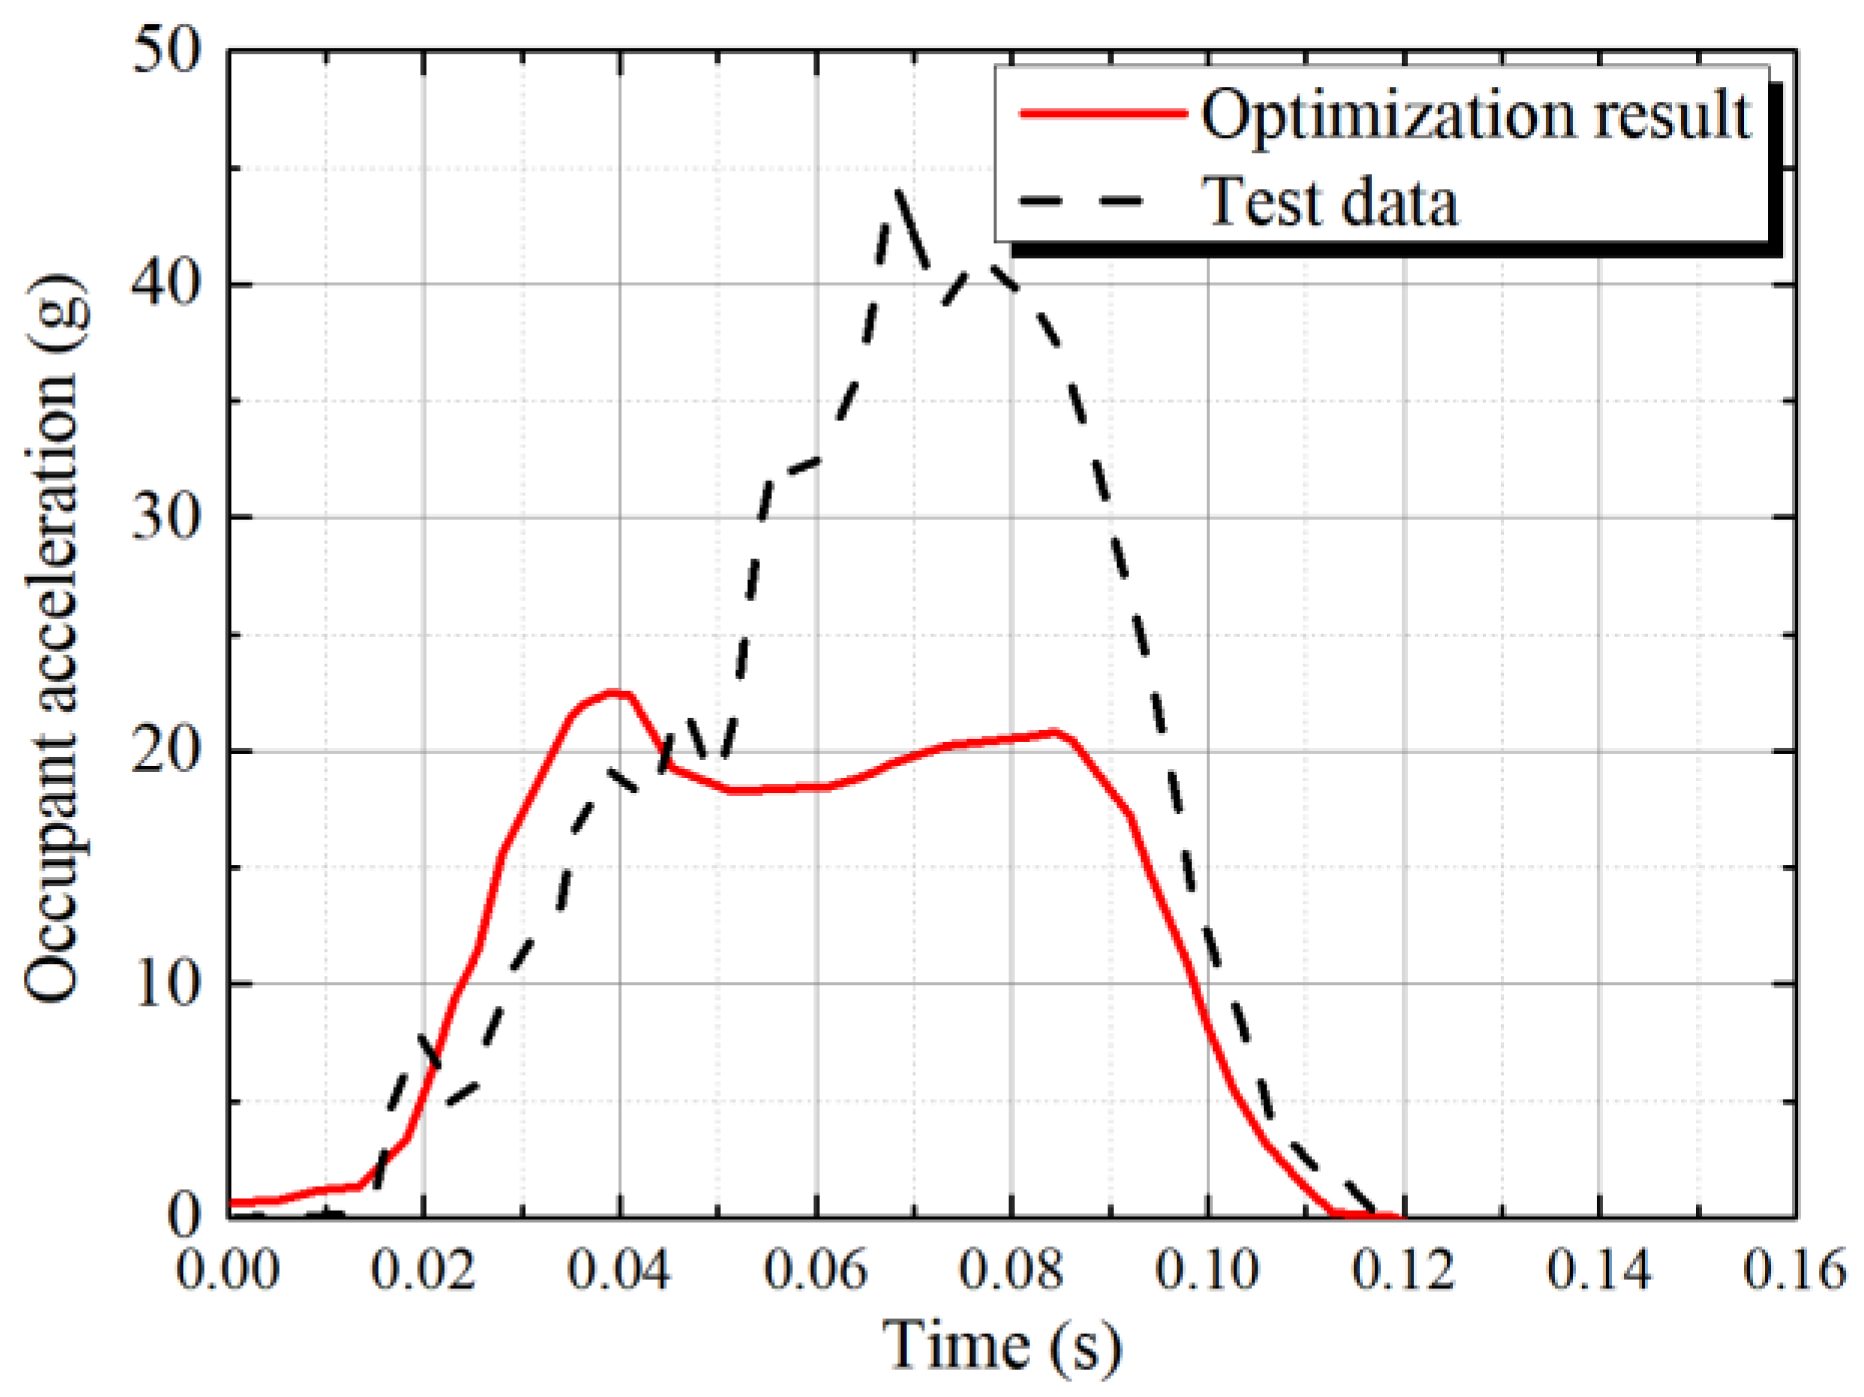
The crash pulse and restraint stiffness curve of a vehicle was optimized using the proposed coupling optimization method, and the peak occupant acceleration was decreased by 44%.
In summary, this paper studied a coupling design strategy for crash pulse and restraint stiffness, which provides an effective method for occupant injury protection in traffic accidents. Follow-up research will focus on the following aspects: (1) the parameters of the symmetrical energy absorption structure of vehicle will be optimized with the target of the crash pulse; (2) taking the crash pulse and restraint stiffness curve as the target, parameter design of the vehicle structure and restraint system will be carried out; (3) the model will be further improved to allow studying the coupling design of a multiple frontal impact test, such as MPDB (mobile progressive deformable barrier) and SOB (small overlap barrier).

Author Contributions

Conceptualization, D.W. and J.Z.; methodology, H.Z. and Y.P.; validation, T.Z.; investigation, D.W. All authors have read and agreed to the published version of the manuscript.

Funding

This work was supported by the State Key Laboratory of Automotive Safety and Energy under Project No. KFY2203, and the China Postdoctoral Science Foundation Funded Project under Grant 2021M703559.

Institutional Review Board Statement

Not applicable.

Informed Consent Statement

Not applicable.

Data Availability Statement

The study did not report any data.

Acknowledgments

Not applicable.

Conflicts of Interest

The authors declare no conflict of interest.

References

  1. Dima, D.; Covaciu, D. Vehicles Frontal Impact Analysis Using Computer Simulation and Crash Test. Int. J. Automot. Technol. 2019, 20, 655–661. [Google Scholar] [CrossRef]
  2. Zhang, H.; Peng, Y.; Hou, L.; Wang, D.; Tian, G.; Li, Z. Multistage impact energy distribution for whole vehicles in high-speed train collisions: Modeling and solution methodology. IEEE Trans. Ind. Inform. 2020, 16, 2486–2499. [Google Scholar] [CrossRef]
  3. Hu, L.; Zhou, X.; Zhang, X.; Wang, F.; Li, Q.; Wu, W. A review on key challenges in intelligent vehicles: Safety and driver-oriented features. IET Intell. Transp. Syst. 2021, 15, 1093–1105. [Google Scholar] [CrossRef]
  4. Zou, T.; Shang, S.; Simms, C. Potential benefits of controlled vehicle braking to reduce pedestrian ground contact injuries. Accid. Anal. Prev. 2019, 129, 94–107. [Google Scholar] [CrossRef] [PubMed]
  5. Hu, L.; Tian, Q.; Zou, C.; Huang, J.; Ye, Y.; Wu, X. A study on energy distribution strategy of electric vehicle hybrid energy storage system considering driving style based on real urban driving data. Renew. Sustain. Energy Rev. 2022, 162, 112416. [Google Scholar] [CrossRef]
  6. Wang, F.; Yin, J.; Hu, L.; Wang, M.; Liu, M.; Miller, K.; Wittek, A. Should anthropometric differences between the commonly used pedestrian computational biomechanics models and Chinese population be taken into account when predicting pedestrian head kinematics and injury in vehicle collisions in China? Accid. Anal. Prev. 2022, 173, 106718. [Google Scholar] [CrossRef]
  7. Wang, F.; Wu, J.; Hu, L.; Yu, C.; Wang, B.; Huang, X.; Miller, K.; Wittek, A. Evaluation of the Head Protection Effectiveness of Cyclist Helmets Using Full-Scale Computational Biomechanics Modelling of Cycling accidents. J. Saf. Res. 2022, 80, 109–134. [Google Scholar] [CrossRef]
  8. Peng, Y.; Li, T.; Bao, C.; Zhang, J.; Xie, G.; Zhang, H. Performance analysis and multi-objective optimization of bionic dendritic furcal energy-absorbing structures for trains. Int. J. Mech. Sci. 2023, 246, 108145. [Google Scholar] [CrossRef]
  9. Khalil, T.B.; Sheh, M.Y. Vehicle crashworthiness and occupant protection in frontal impact by FE analysis—An integrated approach. In Crashworthiness of Transportation Systems: Structural Impact and Occupant Protection; Springer: Cham, Switzerland, 1997; pp. 363–399. [Google Scholar]
  10. Kim, O.S.; Kim, S.T.; Jung, S.B.; Kim, D.S. Sub-structure vehicle test and analysis to predict the frontal crash performances of full-scale vehicle. In Proceedings of the International Congress & Exposition, Detroit, MI, USA, 1–4 March 1999. SAE Technical Paper. [Google Scholar]
  11. Qin, H.; Liu, Z.; Zhong, H.; Liu, Y.; Lv, C. Two-level multiple cross-sectional shape optimization of automotive body frame with exact static and dynamic stiffness constraints. Struct. Multidiscip. Optim. 2018, 58, 2309–2323. [Google Scholar] [CrossRef]
  12. Szlosarek, R.; Bombis, F.; Muhler, M.; Kroger, M.; Karall, T. Development of carbon fibre-reinforced plastic (CFRP) crash absorbers with stable crushing behaviour considering the connection to the bumper system. Mater. Werkst. 2016, 47, 1099–1108. [Google Scholar] [CrossRef]
  13. Zhang, L.; Bai, Z.; Bai, F. Crashworthiness design for bio-inspired multi-cell tubes with quadrilateral, hexagonal and octagonal sections. Thin-Walled Struct. 2018, 122, 42–51. [Google Scholar] [CrossRef]
  14. Teng, T.; Chang, P.; Liang, C.; Fung, D. Application of crash pulse on the car crashworthiness design. Adv. Mech. Eng. 2017, 9, 1–8. [Google Scholar] [CrossRef] [Green Version]
  15. Cheng, B.; Fu, H.; Li, T.; Zhang, H.; Huang, J.; Peng, Y.; Chen, H.; Fan, C. Evolutionary computation-based multitask learning network for railway passenger comfort evaluation from EEG signals. Appl. Soft Comput. 2023, 139, 110079. [Google Scholar] [CrossRef]
  16. Kuznetcov, A.; Telichev, I. Effect of acceleration pulse shape on the safety of unbelted motorcoach passengers in frontal collision under uncertainty of their seating posture. Int. J. Crashworthiness 2020, 25, 231–241. [Google Scholar] [CrossRef]
  17. Iraeus, J.; Lindquist, M. Analysis of minimum pulse shape information needed for accurate chest injury prediction in real life frontal crashes. Int. J. Crashworthiness 2021, 26, 684–691. [Google Scholar] [CrossRef]
  18. Ito, D.; Yokoi, Y.; Mizuno, K. Crash Pulse Optimization for Occupant Protection at Various Impact Velocities. Traffic Inj. Prev. 2015, 16, 260–267. [Google Scholar] [CrossRef]
  19. Urbina, P.; Orta, P.; Ahuett-Garza, H. Crashworthiness design based on a simplified deceleration pulse. Int. J. Automot. Technol. 2014, 15, 909–917. [Google Scholar] [CrossRef]
  20. Boyle, K.; Fanta, A.; Reed, M.; Fischer, K.; Smith, A.; Adler, A.; Hu, J. Restraint systems considering occupant diversity and pre-crash posture. Traffic Inj. Prev. 2020, 21, S31–S36. [Google Scholar] [CrossRef]
  21. Huang, Y.; Ji, P.; Zhou, Q. Re-optimisation of occupant restraint system for Chinese statures by reducing airbag inflator power. Int. J. Veh. Des. 2018, 77, 67–86. [Google Scholar] [CrossRef]
  22. Liufu, K.; Liu, Q.; Lu, Y.; Chen, Z.; Zhang, Z.; Li, Q. Multiobjective optimization on cooperative control of autonomous emergency steering and occupant restraint system for enhancing occupant safety. Accid. Anal. Prev. 2021, 159, 106302. [Google Scholar] [CrossRef]
  23. Wang, Q.; Liu, Z.; Cao, L.; Xiao, Z.; Zhang, Q.; Zhang, S. Multiobjective optimization design for an occupant restraint system considering interval correlation. Struct. Multidiscip. Optim. 2022, 65, 303. [Google Scholar] [CrossRef]
  24. Zhou, D.; Wang, X.; Zheng, Q.; Fu, T.; Wu, M.; Sun, X. A nonlinear occupant-restraint system model for predicting human injuries caused by vertical impact. Nonlinear Dyn. 2021, 105, 3093–3115. [Google Scholar] [CrossRef]
  25. Huang, M. Vehicle Crash Mechanics; CRC Press: Boca Raton, FL, USA, 2002. [Google Scholar]
  26. Motozawa, Y.; Kamei, T. A new concept for occupant deceleration control in a crash. SAE Trans. 2000, 109, 1502–1509. [Google Scholar]
  27. Wu, J.; Bilkhu, S.; Nusholtz, G.S. An impact pulse-restraint energy relationship and its applications. SAE Trans. 2003, 112, 517–532. [Google Scholar]
  28. Cheng, Z.; Pellettiere, J.A.; Crandall, J.R.; Pilkey, W.D. Optimal occupant kinematics and crash pulse for automobile frontal impact. Shock Vib. 2009, 16, 61–73. [Google Scholar] [CrossRef]
  29. Mizuno, K.; Itakura, T.; Hirabayashi, S.; Tanaka, E.; Ito, D. Optimization of vehicle deceleration to reduce occupant injury risks in frontal impact. Traffic Inj. Prev. 2014, 15, 48–55. [Google Scholar] [CrossRef]
  30. Witteman, W. Adaptive frontal structure design to achieve optimal deceleration pulses. In Proceedings of the 19th International Technical Conference on the Enhanced Safety of Vehicles, Washington, DC, USA, 6–9 June 2005. Paper 05-0243. [Google Scholar]
  31. Witteman, W.J.; Kriens, R.F.C. The necessity of an adaptive vehicle structure to optimize deceleration pulses for different crash velocities. In Proceedings of the International Technical Conference on Enhanced Safety of Vehicles, Amsterdam, The Netherlands, June 4–7 2001. SAE Technical Paper. [Google Scholar]
  32. Qiu, S.; Li, H.; Zhang, J.; Ma, Y.; Hao, Y. Optimized ride-down rate control in frontal impact and its application in the energy management of occupant restraint system. In Proceedings of the SAE 2013 World Congress & Exhibition, Detroit, MI, USA, 16–18 April 2013. SAE Technical Paper. [Google Scholar]
  33. Zhang, J.; Wang, D.; Jin, Y.; Wu, L.; Zhou, H. The vehicle frontal impact safety evaluation and design method based on the coupling effect between crash pulse and restraint system characteristic. Int. J. Veh. Des. 2018, 78, 79–107. [Google Scholar] [CrossRef]
  34. Zhang, J.; Ma, Y.; Chen, C.; Zhang, Y. Design and Optimization for the Occupant Restraint System of Vehicle Based on a Single Freedom Model. Chin. J. Mech. Eng. 2013, 26, 492–497. [Google Scholar] [CrossRef]
  35. Zhang, J. Parameters Design Method for Structure and Occupant Restraint System in Vehicle Crash; Science Press: Beijing, China, 2018. [Google Scholar]
  36. Kent, R.W.; Forman, J. Restraint system biomechanics. In Accidental Injury; Springer: Cham, Switzerland, 2015; pp. 113–141. [Google Scholar]
  37. Kuznetcov, A.; Telichev, I.; Wu, C.Q. Numerical parametric study on factors affecting passenger safety in motorcoach frontal collision. Int. J. Crashworthiness 2017, 22, 214–226. [Google Scholar] [CrossRef]
  38. Uenishi, K.; Matsuhisa, H.; Utsuno, H.; Takahashi, Y. Experimental Study of Ride-Down Effect in Automotive Head-on Collisions. J. Environ. Eng. 2010, 5, 498–512. [Google Scholar] [CrossRef] [Green Version]
  39. Wu, J.; Nusholtz, G.S.; Bilkhu, S. Optimization of vehicle crash pulses in relative displacement domain. Int. J. Crashworthiness 2002, 7, 397–414. [Google Scholar]
  40. Liao, X.; Li, Q.; Yang, X.; Li, W.; Zhang, W. A two-stage multi-objective optimisation of vehicle crashworthiness under frontal impact. Int. J. Crashworthiness 2008, 13, 279–288. [Google Scholar] [CrossRef]
  41. Zhang, W.; Ning, H.; Liu, J.; Cho, C. Fast Bayesian approach to model calibration of vehicle occupant restraint systems. Int. J. Crashworthiness 2016, 21, 1–8. [Google Scholar] [CrossRef]
  42. Hu, L.; Bao, X.; Lin, M.; Yu, C.; Wang, F. Research on risky driving behavior evaluation model based on CIDAS real data. Proc. Inst. Mech. Eng. Part D J. Automob. Eng. 2021, 235, 2176–2187. [Google Scholar] [CrossRef]
  43. Razali, N.M.; Geraghty, J. Genetic algorithm performance with different selection strategies in solving TSP. In Proceedings of the World Congress on Engineering, London, UK, 6–8 July 2011; International Association of Engineers: Hong Kong, China, 2011; pp. 1–6. [Google Scholar]
  44. Elhussieny, S.; Oraby, W.; Elkady, M.; Abdelhamid, A.; El-Demerdash, S. Optimisation of crash dynamics for bus cabin structure based on attained intrusion and deceleration during a frontal collision. Int. J. Crashworthiness 2020, 26, 501–514. [Google Scholar] [CrossRef]
  45. Zhang, H.; Peng, Y.; Hou, L.; Tian, G.; Li, Z. A hybrid multi-objective optimization approach for energy-absorbing structures in train collisions. Inf. Sci. 2019, 481, 491–506. [Google Scholar] [CrossRef]
  46. Wang, W.; Tian, G.; Chen, M.; Tao, F.; Zhang, C.; Abdulraham, A.A.; Li, Z.; Jiang, Z. Dual-objective program and improved artificial bee colony for the optimization of energy-conscious milling parameters subject to multiple constraints. J. Clean. Prod. 2020, 245, 118714. [Google Scholar] [CrossRef]
  47. Guohui YU, E.; Xianling, C.; Kai, Z. Case analysis of US NHTSA 2010 version of new car assessment program. J. Automot. Saf. Energy 2012, 3, 129. [Google Scholar]
Figure 1. Vehicle–occupant crash analytical model.
Symmetry 15 00558 g001
Figure 2. Restraint subsystem forces.
Symmetry 15 00558 g002
Figure 3. Crash pulse of a vehicle during a FRB test. (a) Crash pulse in the time domain. (b) Crash pulse in the displacement domain.
Symmetry 15 00558 g003
Figure 4. Restraint stiffness curve of a restraint system.
Symmetry 15 00558 g004
Figure 5. Comparison of test result and calculation result.
Symmetry 15 00558 g005
Figure 6. Three-dimensional scatter-plot of peak occupant acceleration.
Symmetry 15 00558 g006
Figure 7. Parameters of a concave pulse.
Symmetry 15 00558 g007
Figure 8. Parameters of the bilinear restraint stiffness curve.
Symmetry 15 00558 g008
Figure 9. Flowchart of coupling optimization.
Symmetry 15 00558 g009
Figure 10. Evolution of the optimization method.
Symmetry 15 00558 g010
Figure 11. Comparison of optimization results with the test data of crash pulses.
Symmetry 15 00558 g011
Figure 12. Comparison of optimization results with test data of restraint stiffnesses.
Symmetry 15 00558 g012
Figure 13. Comparison of optimization results with the test data of occupant accelerations.
Symmetry 15 00558 g013
Table 1. Simplified crash pulses.
TypeSimplified Crash Pulses
rectangular pulseSymmetry 15 00558 i001
NO.A1
upward pulseSymmetry 15 00558 i002Symmetry 15 00558 i003Symmetry 15 00558 i004
NO.A2A3A4
upward pulseSymmetry 15 00558 i005Symmetry 15 00558 i006Symmetry 15 00558 i007
NO.A5 A6A7
downward pulseSymmetry 15 00558 i008Symmetry 15 00558 i009Symmetry 15 00558 i010Symmetry 15 00558 i011
NO.A8A9A10A11
convex pulseSymmetry 15 00558 i012Symmetry 15 00558 i013Symmetry 15 00558 i014Symmetry 15 00558 i015
NO.A12A13A14A15
concave pulseSymmetry 15 00558 i016Symmetry 15 00558 i017Symmetry 15 00558 i018
NO.A16A17A18
concave pulseSymmetry 15 00558 i019Symmetry 15 00558 i020
NO.A19A20
Table 2. Simplified restraint stiffness curves.
TypeSimplified Restraint Stiffness Curves
upward curveSymmetry 15 00558 i021Symmetry 15 00558 i022Symmetry 15 00558 i023
NO.B1B2B3
upward curveSymmetry 15 00558 i024Symmetry 15 00558 i025Symmetry 15 00558 i026
NO.B4B5B6
convex curveSymmetry 15 00558 i027Symmetry 15 00558 i028Symmetry 15 00558 i029
NO.B7B8B9
concave curveSymmetry 15 00558 i030
NO.B10
Table 3. Peak occupant accelerations.
Peak Occupant
Acceleration (g/m2)
B1B2B3B4B5B6B7B8B9B10
A145.6732.1169.2534.1639.3638.3736.0446.2639.2739.28
A251.2834.3684.4134.0947.3338.3936.0451.1944.8042.28
A350.5933.8780.7334.1545.8538.2436.0451.2743.4940.19
A451.25 34.54 86.38 34.14 47.78 38.40 36.05 51.18 45.53 44.38
A550.37 33.97 79.39 34.16 46.29 38.39 35.91 51.28 43.54 41.62
A646.44 32.04 72.73 34.19 38.75 38.41 36.00 44.79 39.43 37.25
A749.50 33.09 79.53 34.19 42.47 38.29 36.06 51.29 42.00 36.92
A851.29 35.41 80.71 34.19 50.94 38.50 35.91 51.28 47.00 49.52
A950.60 34.49 78.19 34.18 47.97 38.26 35.96 51.26 44.71 45.38
A1051.25 36.09 82.20 34.09 51.36 38.36 35.86 51.18 48.82 53.27
A1146.44 32.77 69.98 34.15 41.92 38.37 35.88 50.57 41.10 42.24
A1251.25 36.31 87.63 34.09 51.17 38.44 35.84 51.14 48.82 50.06
A1348.58 33.12 75.76 34.12 43.06 38.39 36.02 50.49 41.66 39.29
A1448.58 33.53 74.20 34.15 44.56 38.24 36.03 51.29 42.38 42.39
A1550.82 34.28 79.79 34.12 47.43 38.39 36.05 51.27 44.19 42.94
A1636.10 28.63 51.51 34.19 25.58 38.46 35.95 41.48 33.89 41.25
A1742.48 30.86 63.24 34.17 34.58 38.45 35.98 42.20 35.94 39.29
A1836.94 29.08 54.19 34.15 27.26 38.27 35.91 42.95 34.66 42.40
A1942.18 30.79 63.12 34.16 34.31 38.45 35.87 41.87 35.53 40.06
A2039.24 29.55 56.28 34.19 28.50 38.46 36.01 40.16 33.91 38.64
Table 4. Average peak occupant acceleration.
No.Average Peak Occupant Acceleration (g)Peak Value of Crash Pulse (g)No.Average Peak
Occupant Acceleration (g)
Peak Value of Restraint Stiffness (g)
A141.9823B147.0451.3
A246.4246.1B232.9533
A345.4534.6B373.4677
A446.9769.1B434.1534.2
A545.4927.6B541.8351.3
A642.0030.7B638.3838.5
A744.3334.5B735.9736.1
A847.4846.1B848.2251.3
A946.1034.5B941.5338.5
A1048.2569.1B1042.4336.2
A1143.3430.7
A1248.4846.1
A1344.0530.7
A1444.5330.7
A1545.9327.6
A1636.7046.1
A1739.7230.7
A1837.5834.5
A1939.6327.6
A2037.4951.8
Disclaimer/Publisher’s Note: The statements, opinions and data contained in all publications are solely those of the individual author(s) and contributor(s) and not of MDPI and/or the editor(s). MDPI and/or the editor(s) disclaim responsibility for any injury to people or property resulting from any ideas, methods, instructions or products referred to in the content.

