1. Introduction
Fluorides and fluorite-type crystals have received much interest for their intrinsic optical properties and their potential applications in optoelectronic devices, in particular for those operating in the ultraviolet (UV) region of the electromagnetic spectrum. CaF
, e.g., shows a direct band gap at the
point of the first Brillouin zone (1st BZ) of 12.1 eV and an indirect gap of 11.8 eV [
1]. It is a highly ionic system with the cubic (c) fluorite crystal structure with three atoms per unit cell and space group Fm
m [
2]. In the present work, we investigate the compounds rutile MgF
(r-MgF
) and cubic SrF
(c-SrF
), with light and heavy cations belonging to the group IIA, to determine their electronic and optical properties using different theoretical and computational schemes. The calculations are based on state-of-the-art many-body schemes, e.g., perturbative GW (i.e., G
W
), self-consistent, and full GW, the solution of the Bethe–Salpeter equation (BSE), etc., which account for the quasiparticle (QP) band structure and the mutual interaction between excited electrons and holes, [
3], and should start from well-converged ground-state calculations in the framework of DFT [
4,
5].
To consider the strategic roles played by the fluorites in modern applied research, we look at the deep ultra-violet (DUV) technology used for photolithography and the EUV (extreme UV) technique [
4]. Such technologies make the study of the electronic and optical properties of the alkaline earth metal fluorides important, which show transparency in UV energy windows used to build lenses, mirrors, prisms, masks, and cladding surfaces. A better understanding of their optical properties can lead to the development of these materials and allow theoretical and experimental investigations focusing on electronic and optical properties of surfaces, including related problems, e.g., photomolecular contaminations, or the presence and the role of defects in the bulk or at the surfaces. These points have not been completely explored in the literature and will be part of a future research campaign [
5,
6,
7,
8].
Experimental studies on difluorides have been performed for several years. To study optical, structural, and electronic properties of alkaline earth metal fluorides systems, different experimental techniques have been used, such as optical reflectance [
1], discharge tube experiments, [
9] dielectric loss techniques [
10], photoelectron spectrometry measurements [
11], light absorption and spectrophotometry techniques [
12,
13], neutron diffraction [
14], and polarized light schemes [
15,
16].
Another relevant research issue to be considered is the use of ultraviolet radiation (UV) for biological, pharmacological, and medical applications, e.g., the radiation disinfection schemes in relation to the outbreaks caused by SARS-CoV-1 and SARS-CoV-2 viruses [
17]. For this kind of radiation, the use of specific tools and instruments, e.g., mirrors, cuvettes, test tubes, bulbs, container tubes, separation, and cladding surfaces made by materials specific for the UV is requested in relation to the radiation disinfection-antimicrobial/antiviral issues [
18,
19,
20,
21,
22]. As a consequence, there has been a boost in the research on transparent materials that could be produced, controlled, and used in specific UV radiation disinfection devices. The present study contributes to that research field, completing the scenario on the electronic and optical properties of bulk alkaline earth metal fluorides treated within state-of-the-art theoretical–computational methods.
Some bulk cubic fluorides were considered by participants of the present collaboration. They studied the cubic fluorides by means of DFT with the local density approximation (LDA) for the exchange–correlation energy [
23]. The ground-state electronic properties of the bulk cubic structures of CaF
, SrF
, BaF
, CdF
, HgF
, and
-PbF
were studied with the use of a plane wave expansion of the wave functions. General trends of the structural parameters were considered together with electronic energy bands and transition energies. The same authors later faced the calculations of the electronic and optical properties of two of the above-mentioned bulk compounds, namely CdF
and BaF
, using state-of-the-art computational techniques for the quasiparticle band structures and excitonic effects [
24,
25]. The results agreed well with existing experimental data, in particular the absorption spectra in a wide energy range. The scope of the present paper involves extending those methods to r-MgF
and c-SrF
, i.e., to study their electronic excitations and optical properties. This study evaluated the validities of approximate methodological treatments. Fluoride compounds were recently tackled to test efficient quasiparticle–calculation schemes for solid crystalline solids, e.g., the
and the pseudo-self-interaction-corrected DFT method (PSIC) [
26,
27,
28].
On the experimental side, for cubic SrF
, there have been experimental studies performed for decades, i.e., electron energy loss measurements, [
29] dielectric measurements as functions of temperature and pressure [
10], and UPS and XPS spectral analyses [
11,
30]. On the other hand, there have been few theoretical and computational contributions to the study of the electronic properties of cubic SrF
based on different techniques [
31,
32]. c-SrF
shows important features in the V-UV (vacuum-UV) region. Therefore, studies have been performed for decades on its pure form [
29] and doped forms regarding the V-UV energy range [
33]. Recent applications of c-SrF
-based phosphors operating in the V-UV should also be considered [
34]. Regarding the c-SrF
crystal, which shows intermediate electronic and optical properties in the group of cubic alkaline earth metal fluorides, the need for theoretical and computational results after state-of-the-art schemes is timely.
MgF
, whose cation retains in the group-IIA of the alkaline earth metals, the first position, with respect to the metal atomic radii, is an anisotropic wide-band-gap crystalline system. It crystallizes in the rutile (r) structure, with tetragonal
mnm symmetry, and it is a relevant optical material. It is transparent in a very wide range of photon energies. One of its main applications is in the vacuum ultraviolet spectroscopy (VUS), where it is used as a deposited slab placed on aluminum mirrors and gratings. This is to protect aluminum itself from oxidation, maintaining UV transparency. For rutile MgF
, experimental studies have existed for several years, e.g., electron energy loss studies [
11] and a few computational studies [
35]. Recently, ground-state properties of the MgF
and MgF
surfaces were calculated [
36,
37]. For bulk r-MgF
, advanced techniques were used to calculate the one- and two-particle effects in the electronic and optical properties [
37]. However, for bulk r-MgF
, the present study clarifies different fundamental points, i.e., the scheme to calculate the dielectric screening function and essential approximation used to tackle the excitonic effects and address issues not covered by previous studies. For r-MgF
observables as first peak energy positions, exciton binding energy and dielectric constant for the two principal directions of the crystal are reported here for the first time. Moreover, a detailed analysis of how different self-consistency procedures affect the results of self-energy schemes applied to the two materials under study is presented.
Interest in the electronic and optical properties of alkaline earth metal fluoride clusters is an important motivation for the present studies [
38,
39,
40,
41,
42]. In Reference [
38] the authors focused their attention on (MF
)
nanoparticles with
and M = Mg,Ca,Sr,Ba. For the three stable smallest cluster classes, two main facts clearly appeared: a consistent redshift of the onset energy and a corresponding boost of the exciton binding energy. The presence or absence of these strong effects are the selective criteria for optical experiments, to check the creation and existence of such finite-size portions in the target. The present work on bulk r-MgF
and c-SrF
allows for a systematic comparison of structural, electronic, and optical properties, calculated within most modern techniques.
2. Computational Methods and Resulting Ground-State Properties
We present structural data and cohesive properties of the two metal difluorides; technical parameters will be proposed and discussed here. All calculations for the ground state, the excited state, and the optical properties were performed with the VASP simulation package [
43,
44]. All ground-state fits were done employing the Vinet equation of state and the cohesive energy E
is given with respect to the sum of energies of free spin-polarized atoms [
45]. The values were obtained using the PBEsol exchange–correlation (XC) functional [
46]. It delivers the best comparison to the experimental data [
24]. We also present the following tests for each fluoride using different XC functionals.
MgF
crystallizes in the simple tetragonal rutile structure with six atoms per unit cell. Rutile itself is an oxide mineral made of titanium dioxide (
), which is the most common natural form of
with peculiar features as the highest refractive indices in the visible, large birefringence and dispersion. The unit cell of this crystal is characterized by two lattice constants,
a and
c. The simple tetragonal Bravais lattice has the primitive vectors (
a,0,0) and (0,
a,0) and (0,0,
c). An additional structural parameter for r-MgF
, as an internal degree of freedom, is the Wyckoff parameter x [
47]. The six atomic positions are then given as (0,0,0) and (1/2,1/2,1/2) for Mg and (x,x,0), (−x,−x,0), (1/2+x,1/2−x,1/2) and (1/2−x,1/2+x,1/2) for F with x = 0.303326, given in units of lattice vectors.
The SrF
crystal belongs to the space group Fm
m and possesses a face-centered cubic fluorite structure. CaF
, SrF
, and BaF
all possess the face-centered cubic fluorite structure with three atoms per unit cell, with the cation at position (0,0,0) and the two fluorine anions at (lattice) coordinates ±(1/4,1/4,1/4). For them, the only relevant structural parameter is the cubic lattice constant
a. In
Table 1, the ground-state properties from the present calculations for both crystals are listed.
All calculations were performed for the structure obtained with the PBEsol exchange–correlation functional, ref. [
46] with plane-wave cutoffs and k-samplings listed in
Table 2, thereby
is the “soft” cutoff for the non-norm-conserving (partial) wave function and
is the plane-wave cutoff for the plane-wave-expanded “intermediate” PAW augmentation charges.
Concerning the PAW data set, we used for F a rather hard and accurate potential, with a -component as the local potential and non-local , , and projectors. The Mg-potential is a slightly revised version of the Mg “sv” potential supplied with VASP, while for Sr the standard “sv” potential was used. The potentials for Mg and Sr include s and p core states and corresponding (occupied) s and (unoccupied) p valence states (one principal quantum number higher), as well as (unoccupied) states for Mg, and (occupied) and (unoccupied) states for Sr. Local potentials are, in these cases, “cutted”, as well as all-electron potentials, except for Mg, where a potential was used as the local potential (together with a “stabilizing” -like extra non-local f-projector to enhance f-potential transferability).
We calculated the ground-state properties considering different XC potentials. These data are of fundamental importance for the treatment of electronic excitations and optical properties, as we will discuss in the following paragraphs. The different XC functionals considered are as follows: standard-PBE, [
48] AM05, [
49], and LDA (Ceperley–Alder) [
50]. Technical parameters (energy cutoffs, k-samplings) were the same as before. Results for each individual material are reported in
Table 3. For comparison, in the case of r-MgF
2, the experimental values are from Reference [
51], while for c-SrF
2, experimental values were obtained from References [
52,
53].
Overall, from
Table 3, one can state that PBEsol gives the closest results to the experiment. For example, the lattice parameter
a in the case of r-MgF
2, calculated with PBEsol, shows a deviation in the order of 0.1%, while in the case of c-SrF
, the deviation from the experiment for the same observable is of the order of 0.4%. The AM05 results are approximately of the same quality. For the PBE XC scheme (with the typical under-binding effect due to gradient corrections), the results show more significant deviations from the experiment; for LDA calculations (strong over-binding due to the local approximation), the comparison with experiment is worse. For these reasons, structures obtained with PBEsol were used for the present study for the calculation of energy bands and optical properties.
3. Electronic Excitations in r-MF and c-SF
Many-body effects on the electronic and optical spectra of the difluoride compounds are calculated using DFT and several many-body perturbation schemes on top. The GW approximation for the exchange–correlation self-energy is used to describe the single-particle excitations, particularly to calculate the QP electronic energy bands and densities of states of these fluorites. The two-particle effects in optical spectra are included by solving the Bethe—Salpeter equation (BSE) for the two-particle Green function with screened electron–hole attraction and repulsive electron–hole exchange. The optical absorption spectra are compared with existing and previous experimental and theoretical results. The reasons for the agreements or discrepancies are then fully discussed.
The exchange–correlation self-energy
in the Hedin scheme [
54,
55,
56,
57,
58] has the form of the product of a dynamically screened Coulomb interaction W and the single-particle Green function G in real-time space. Using the RPA approximation for W, kept fixed during the iteration of Hedin’s equations (with W = W
), and DFT wave functions in the single-particle Green function G
, the self-energy has the form
=
= G
W
, which is known as the G
W
method. This scheme usually gives excellent results for the GW eigenvalues of solids (band gaps, bandwidths, and band dispersions) [
55,
56]. An improved GW treatment of the QP band structure is the so-called generalized KS (gKS) method [
59,
60]. Nonlocal exchange–correlation potentials with the inclusion of partial or screened exact exchanges in the gKS approximation are applied in the KS equations. These gKS methods are usually efficient, but approximate, GW schemes [
61]. A gKS starting point (leaving a gap error of 3.0 eV for r-MgF
and of 2.4 eV for c-SrF
) can be considered a good starting point for both compounds.
The iteration starts from the gKS equations, with self-energy chosen as the nonlocal HSE06 hybrid potential [
62,
63]. In the second step, the GW corrections are determined with the perturbative G
W
scheme. The frequency dependence of the RPA dielectric function in the screened Coulomb interaction (W
) is taken into account. Neither plasmon pole models [
64] nor model dielectric functions [
56,
65] were used. Several steps arise. The band structure and DOS were first determined within the PBEsol scheme, then the HSE06 method was utilized, and finally, we used the G
W
scheme on top of HSE06.
In this zeroth iteration, the QP gaps are larger by about 0.4 eV for r-MgF
and by 0.2 eV for c-SrF
than the experimental ones. For these materials, the single-shot GW (G
W
) method does not give a definitive result for the true QP energies. For this reason, self-consistent quasiparticle energy calculations within the GW scheme were also performed. We employed the GW
scheme iterating the Green function only, as well as the scQP-GW scheme (also known as the evGW scheme), updating the eigenvalues in both G and W, but maintaining the HSE wave functions in all iteration steps. It was demonstrated that the iterative GW schemes give gap values in better agreement with respect to the experimental values, particularly for the parent compound CdF
[
25,
66,
67].
For HSE06 used as the GW starting point in the GW and BSE schemes, the same cutoffs that were used for the ground-state calculations were kept, but k-samplings had to be reduced (an 8 × 8 × 8 mesh for the c-SrF and an 8 × 8 × 12 mesh for r-MgF).
3.1. Energy Gaps for r-MgF and c-SrF
The r-MgF
crystal possesses a direct gap at
, where the valence band maximum, mainly composed of degenerate F
states, exhibits a crystal-field splitting of. The bottom of the conduction band is composed of Mg
states and hence no crystal-field splitting can occur for the lowest conduction band. We find a non-degenerate highest valence band state with a
-character accompanied by a
-/
based double degenerate second valence band, split off by an amount of
below the top
band. This splitting is also visible later in the optical spectra since, according to the selection rules,
-
s transitions are only allowed for light polarization perpendicular to the
z-axis (being identical to the tetragonal
c-axis) while
/
-
s transitions are only allowed for light polarization parallel to the
z (or
c)-axis. Hence, the absorption onsets for different light polarizations are split as well. The direct QP gap and the crystal-field splitting
obtained with different approximations are listed below in
Table 4.
In contrast to r-MgF
, for c-SrF
, we find an indirect fundamental gap as for the other cubic-earth-alkaline fluorides, i.e., c-CaF
and c-BaF
[
23,
23]. The bottom of the conduction band is also found at
and composed of Sr
states, while the top of the valence bands is composed of F
states that are triple-degenerate at
, without spin-orbit (SO) coupling (and hence we obtain small SO splittings for the F
bands). The maximum of the valence band is located at the
X point and is found approximately 0.1 eV above the valence band at
. The QP values for the direct gap at
and the indirect fundamental gap
obtained with different approximations are reported in
Table 4.
The G
W
results appear to be the closest to the experimental values (see also the discussion on the effects of the use of different XC potentials in References [
24,
25]). However, experimental gap values are always determined indirectly from excitonic spectra, attempting to find some independent particles, such as features that can be extrapolated to zero absorption. The only safe and experimental values are the excitonic gaps (onset energies of absorption in the optical spectra), which are located at 11.6 eV in the case of MgF
and 10.6 eV in the case of c-SrF
[
72,
73].
In the following section, where we present optical absorption spectra, and compare experimental and theoretical excitonic gaps, in the case of MgF
, we find that GW
results are closer to the experiment than G
W
results. For the case of c-SrF
, we find that GW
and scQP-GW results are approximately equally close to the experiment, while GW
results are still marginally closer to the experiment (experimental values are found almost halfway in between these two theoretical results). This follows an interesting chemical trend. In our previous papers on c-BaF
[
24] and CdF
[
25], we found that only scQP-GW gave results close to the experiment [
74]. Now, for c-SrF
, we find that the experimental results are almost halfway between GW
and scQP-GW. For the sake of comparison, an additional calculation was performed for c-CaF
within the same schemes and accuracies used in the r-MgF
/c-SrF
cases. For CaF
, we find that GW
results for the direct fundamental gap (
eV) are closer to the experiment (
eV from Reference [
1]). For r-MgF
, GW
results are the closest to the experiment (where experimental results are somewhat below theoretical results) although G
W
results are only slightly further from the experiment. So, it leaves the impression that going down from Mg to Ba, we have to increase the degree of self-consistency in our GW calculations, at least starting with HSE06 electronic structures. This fact is related to the so-called under-screening problem recently addressed in the literature [
75,
76,
77].
Starting from DFT-PBEsol band structures with 2.1–2.5 eV, smaller gaps tend to underestimate the gaps of difluorides. However, adding scQP-GW corrections obtained with the HSE06 starting points of about 3.5 eV (r-MgF
) of 3.3 eV (c-SrF
) (see
Table 4) would open up the PBEsol gaps.
With respect to the band gap problem, we should also remember the existence of other methods used to tackle that issue, e.g., those based on hybrid exchange–correlation functionals. For example, the band gaps of related ABO3 perovskites, calculated recently by means of the hybrid exchange–correlation functionals B3PW or B3LYP, are found to show good comparison with the experiments [
78].
One should consider that both materials studied here are highly polar; therefore, one can expect that the self-consistent GW energy gaps overestimate the experimental data due to the lack of renormalization effects related to lattice polarization [
79]. Including phonon contributions to the screening would lead to the closure of the gap (due to longitudinal optical phonons), particularly in (highly) polar compounds [
79,
80,
81]. However, the treatment of lattice polarization effects is out of the scope of the present calculations on bulk r-MgF
and c-SrF
electronic properties. We will tackle this point in future work.
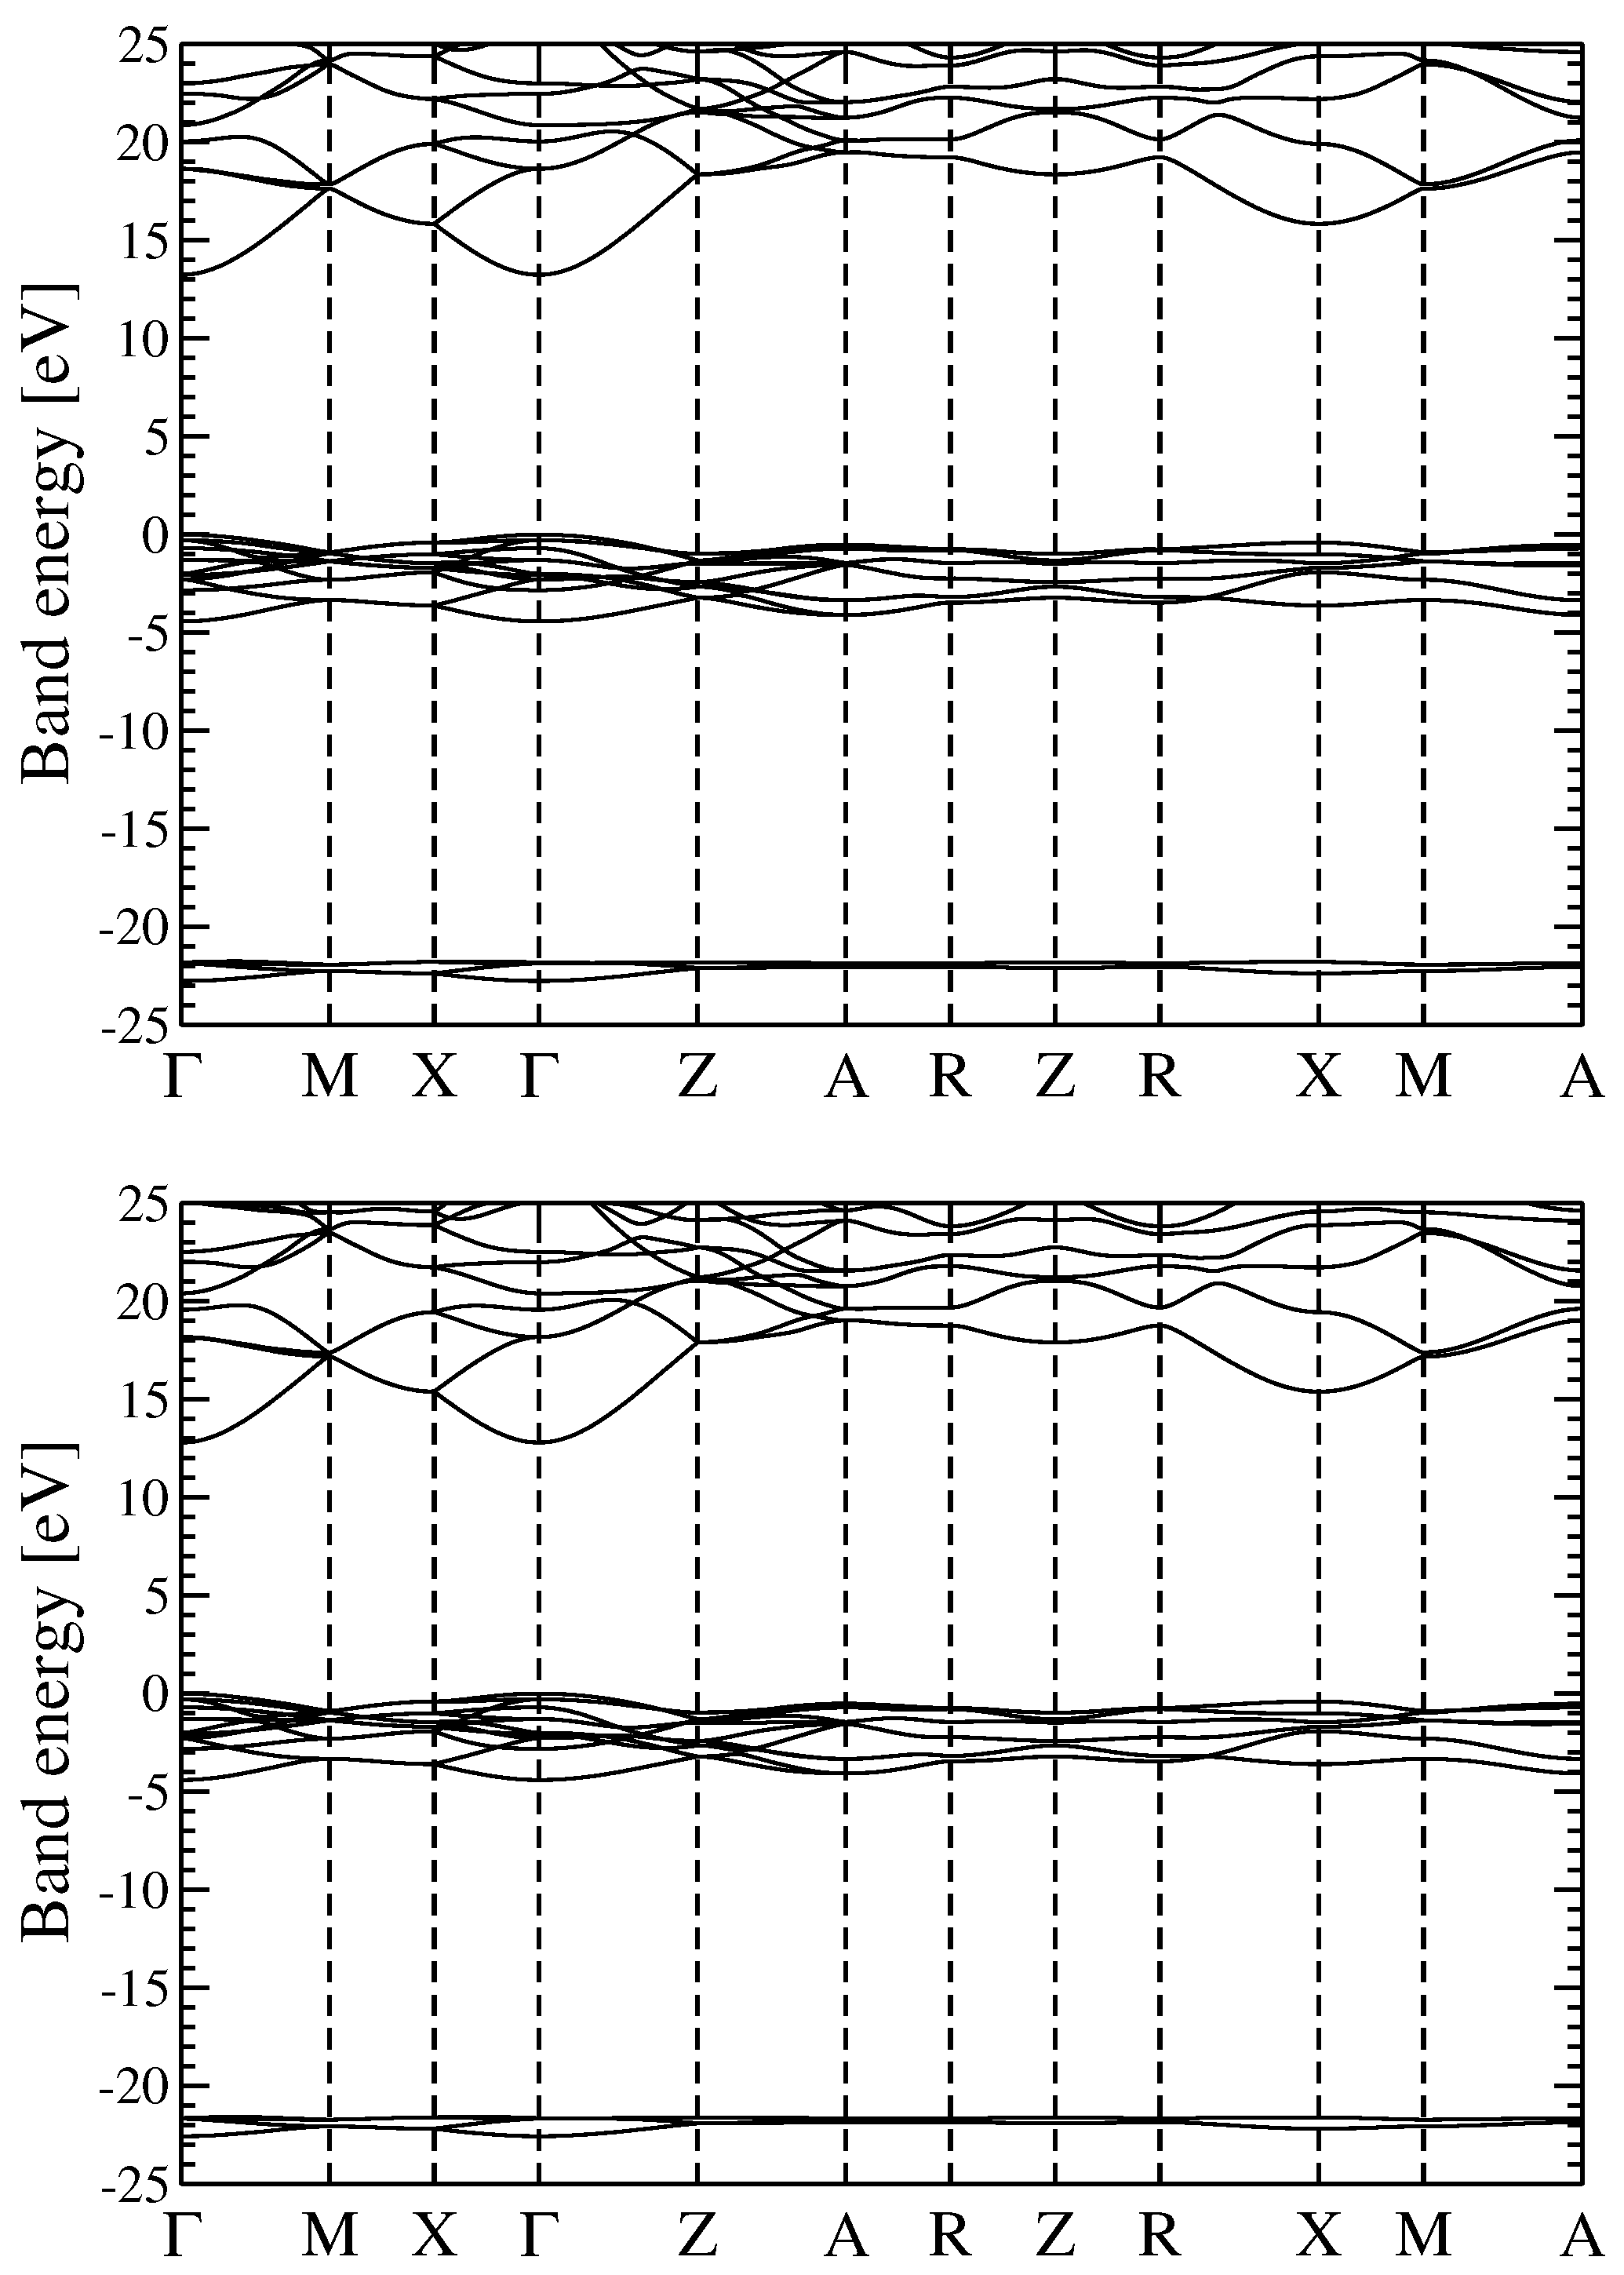
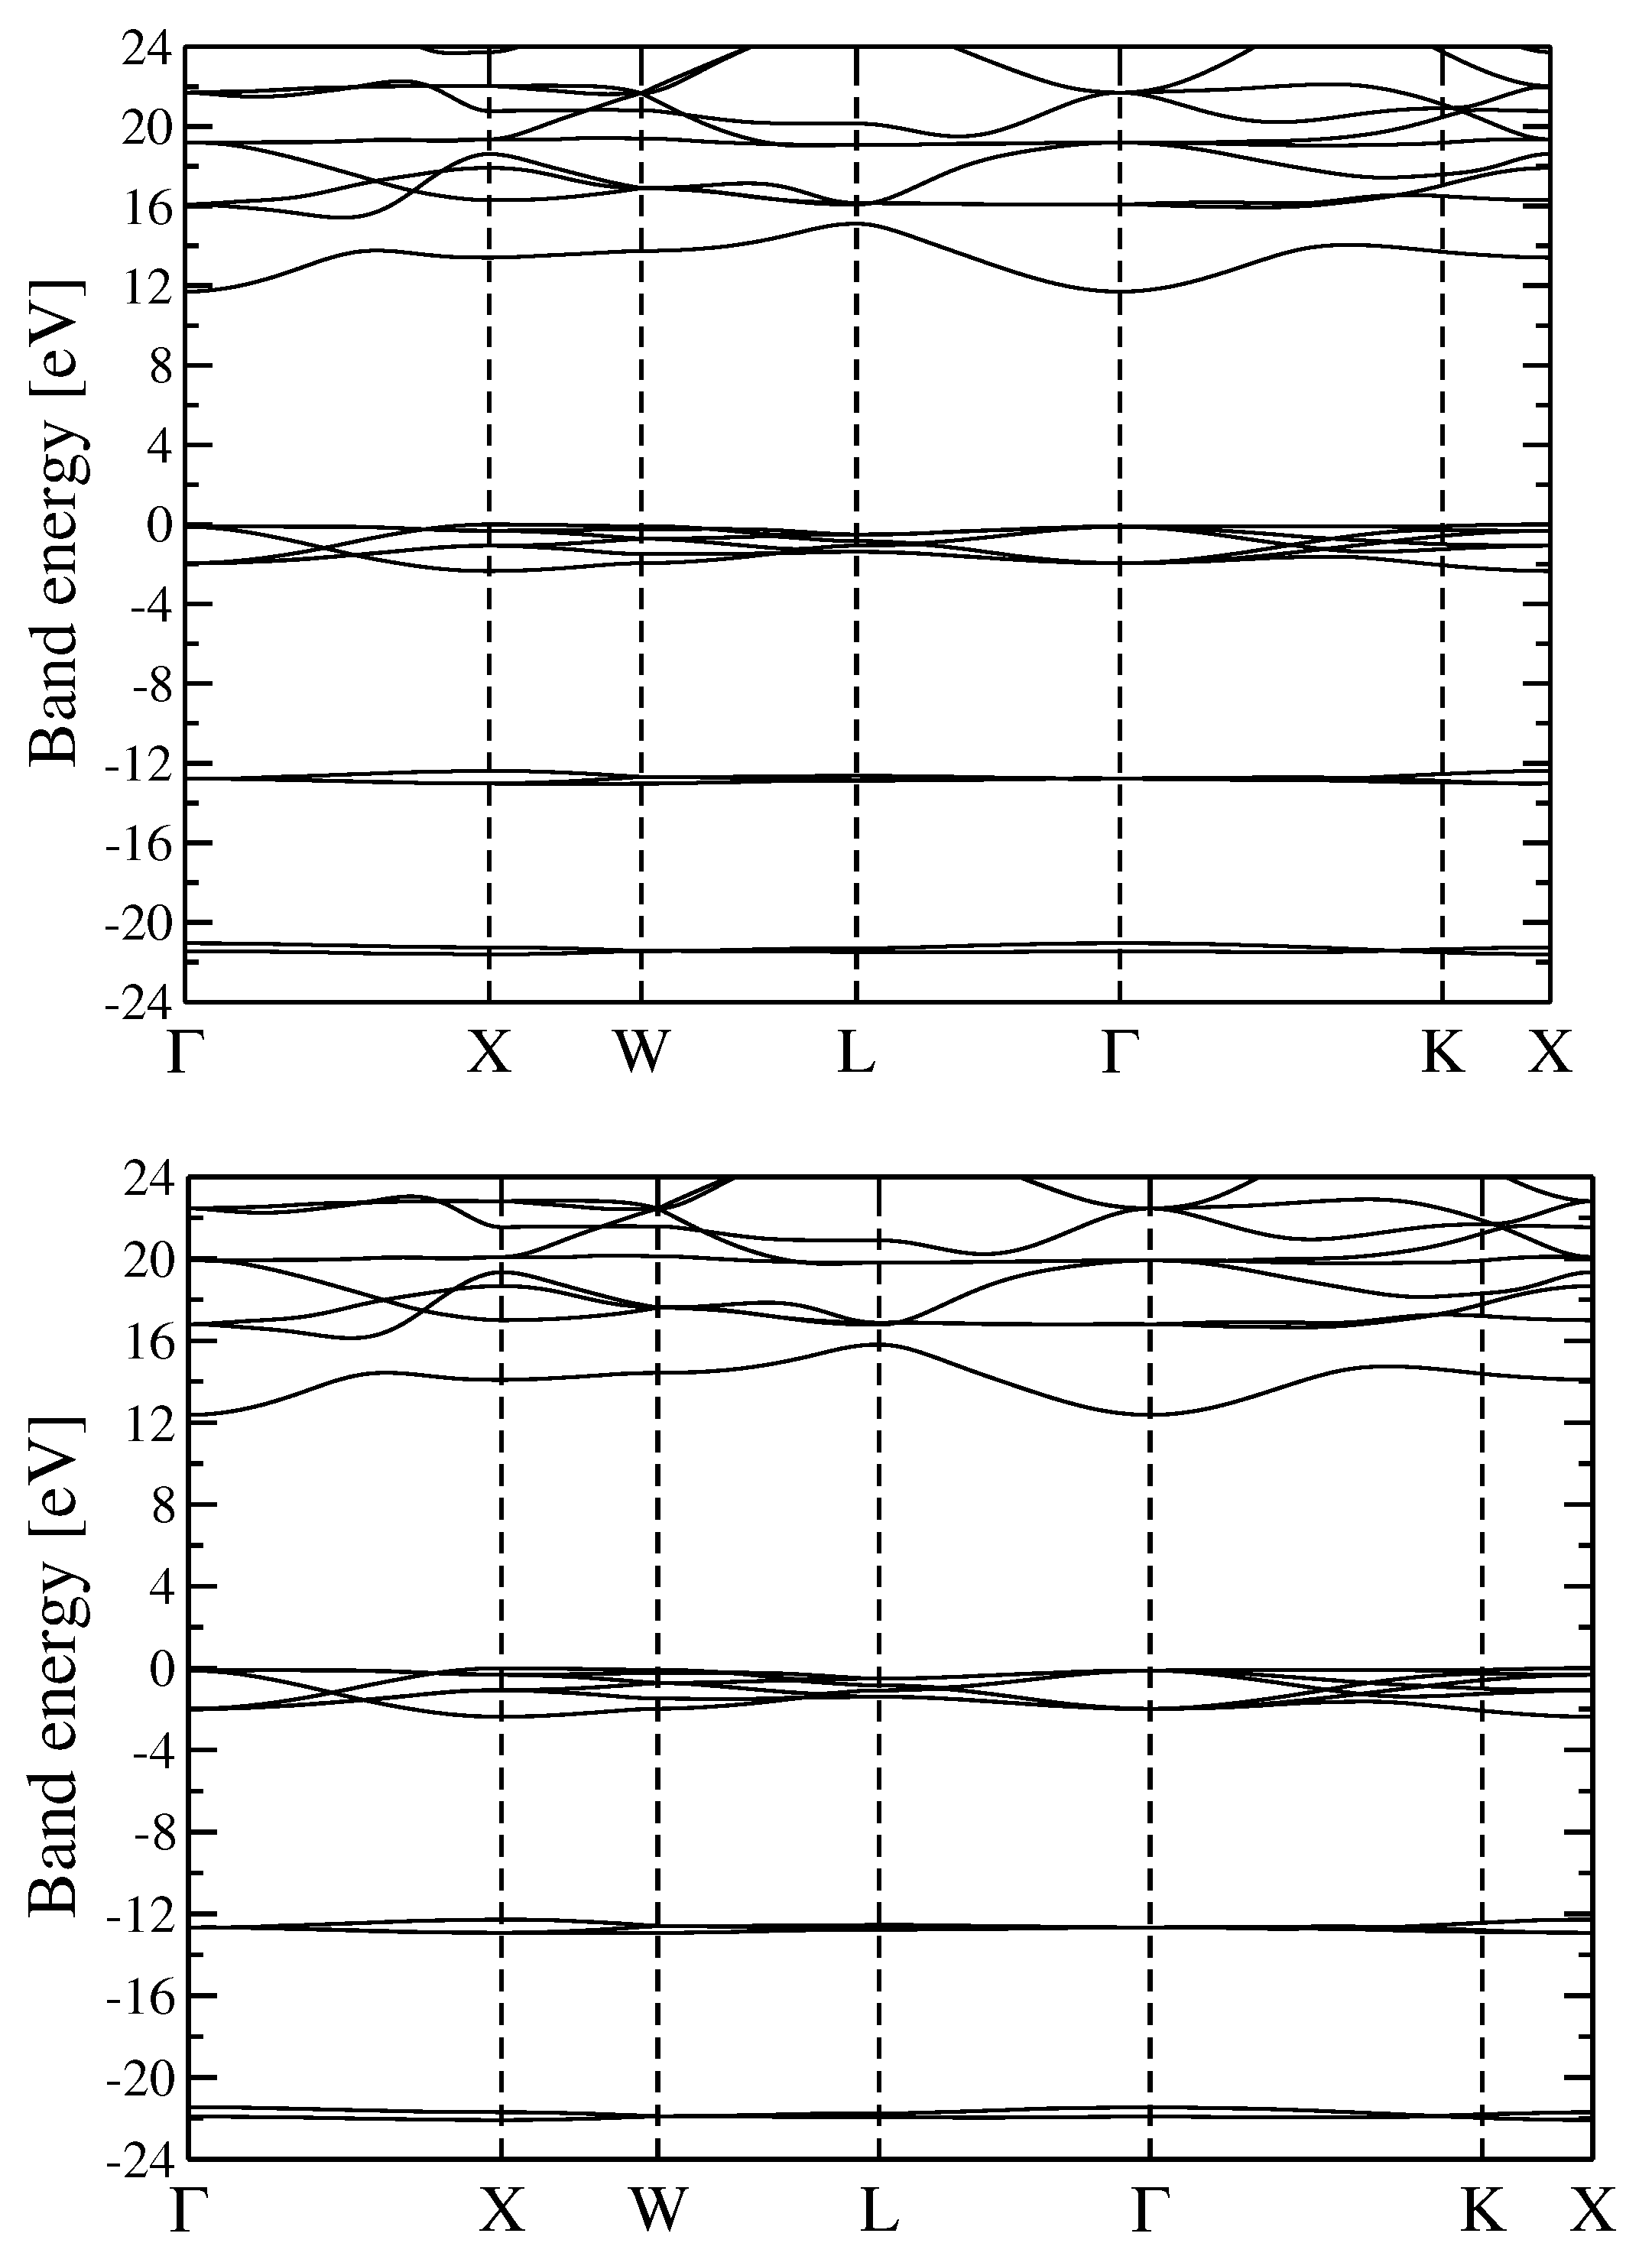
3.2. Quasiparticle Energy Bands for r-MgF and c-SrF
We discuss the QP electronic energy bands of r-MgF
and c-SrF
in the approximation schemes discussed above. The principal results of the calculations described in the present paragraph are reported in
Figure 1 (Energy bands GW
and G
W
for r-MgF
) and
Figure 2 (GW
and scQP-GW for c-SrF
). The analysis of the two figures shows that for both materials the different GW approaches used to calculate the QP energies give rise to similar bands. For r-MgF
(the reported bands were obtained within the GW
and G
W
schemes) the lowest conduction bands lie about 13 eV above the valence band maximum (VBM), while the shallow F
valence bands are found in the range 0 to −5 eV and the deep F
valence bands in the range −22 to −23 eV. The band positions and dispersions obtained within the two GW methods are very similar for r-MgF
. The main effect of adding self-consistency in G is just some small scissor-like extra gap opening, more precisely an almost rigid upward shift of the conduction bands of about 0.4 eV.
On the other hand, for c-SrF (the reported bands were obtained within the GW and the scQP-GW schemes), the conduction bands are found above 12 eV, the shallow F valence bands are found in the range of 0 to −4 eV, additional shallow Sr valence bands are in the range −12 to −13 eV, and the deep F valence bands are in the range −21 to −22 eV in both schemes. Moreover, for c-SrF, the two methods outlined here give very comparable results for the dispersion of bands and scQP-GW adds the approximate extra 0.7 eV scissor shift to the conduction bands over GW.
For the energy bands, it seems that the different theoretical schemes used here produce similar band dispersion paths and variations in the gaps of the order of some hundreds of meV; we will see in the following paragraph that optical absorption spectra may depend (in a more critical way) on the computational scheme used to calculate the QP energies.
4. Dielectric Function and Optical Absorption Spectrum of MF and SF
Excitonic effects play a fundamental role in the correct determination of the optical absorption coefficient and dielectric functions of the materials under study. Excitons may represent two limiting cases. In small dielectric constant materials, the Coulomb attraction between an electron and a hole is strong, and the excitons tend to have a small spatial extent of the same order as the bond lengths. In this case, one speaks about Frenkel excitons, which show binding energy ranging from 0.1 to more than 1 eV. The exciton radius for such a system is a few Å only [
24,
25,
82]. On the other hand, in semiconductors, the dielectric constant is generally quite large. As a consequence, the dielectric screening reduces significantly the Coulomb attraction between electrons and holes, and the corresponding exciton binding energies are much smaller than the band gaps. In this limit, the so-called Wannier—Mott (WM) excitons appear. In the WM case, the strength of the binding is typically of the order of 10 meV [
83,
84].
The study of the excitons and the resulting optical spectra requires the diagonalization of the proper electron–hole Hamiltonian in a Bloch basis to solve the BSE equations [
3,
57,
85]. As the rank of the electron–hole Hamiltonian matrix (determined by the number of k-points and conduction-valence band pairs) is extremely relevant, its direct diagonalization is often hard due to large CPU and memory requirements. Therefore, we apply a numerically more efficient scheme [
25,
66]. This method is founded in the time evolution of the exciton state. It directly delivers optical spectra, but no exciton eigenvalues and eigenfunctions are explicitly produced [
25,
66]. This method generates optical spectra with very good agreement compared to the experimental data and is identical to spectra outputs obtained by the matrix diagonalization scheme.
As it is based on a matrix–vector multiplication, it implies an O(
) dependence on the number of operations and therefore allows efficient allocation of the multiplications on several processors of a parallel calculator [
66,
86]. For the GW and BSE calculations, a
-centered 8 × 8 × 12 (8 × 8 × 8) is used for r-MgF
(c-SrF
). A minimum of fifty unoccupied bands have to be considered in the calculations to tackle the electron–hole pair interaction precisely.
The chosen maximum transition energy cutoff of 60 eV (90 eV) for r-MgF (c-SrF) corresponds to about 59 (83) unoccupied bands for r-MgF (c-SrF). Together with 16 (10) valence bands, the resulting approximate rank of the excitonic Hamiltonian matrix is 580000 (22700 ) for r-MgF (c-SrF). For the representation of the frequency-dependent dielectric function , screened exchange integrals, and four-orbit at integrals in the GW and BSE schemes, a plane-wave cutoff is used of 510 eV (475 eV) for r-MgF (c-SrF).
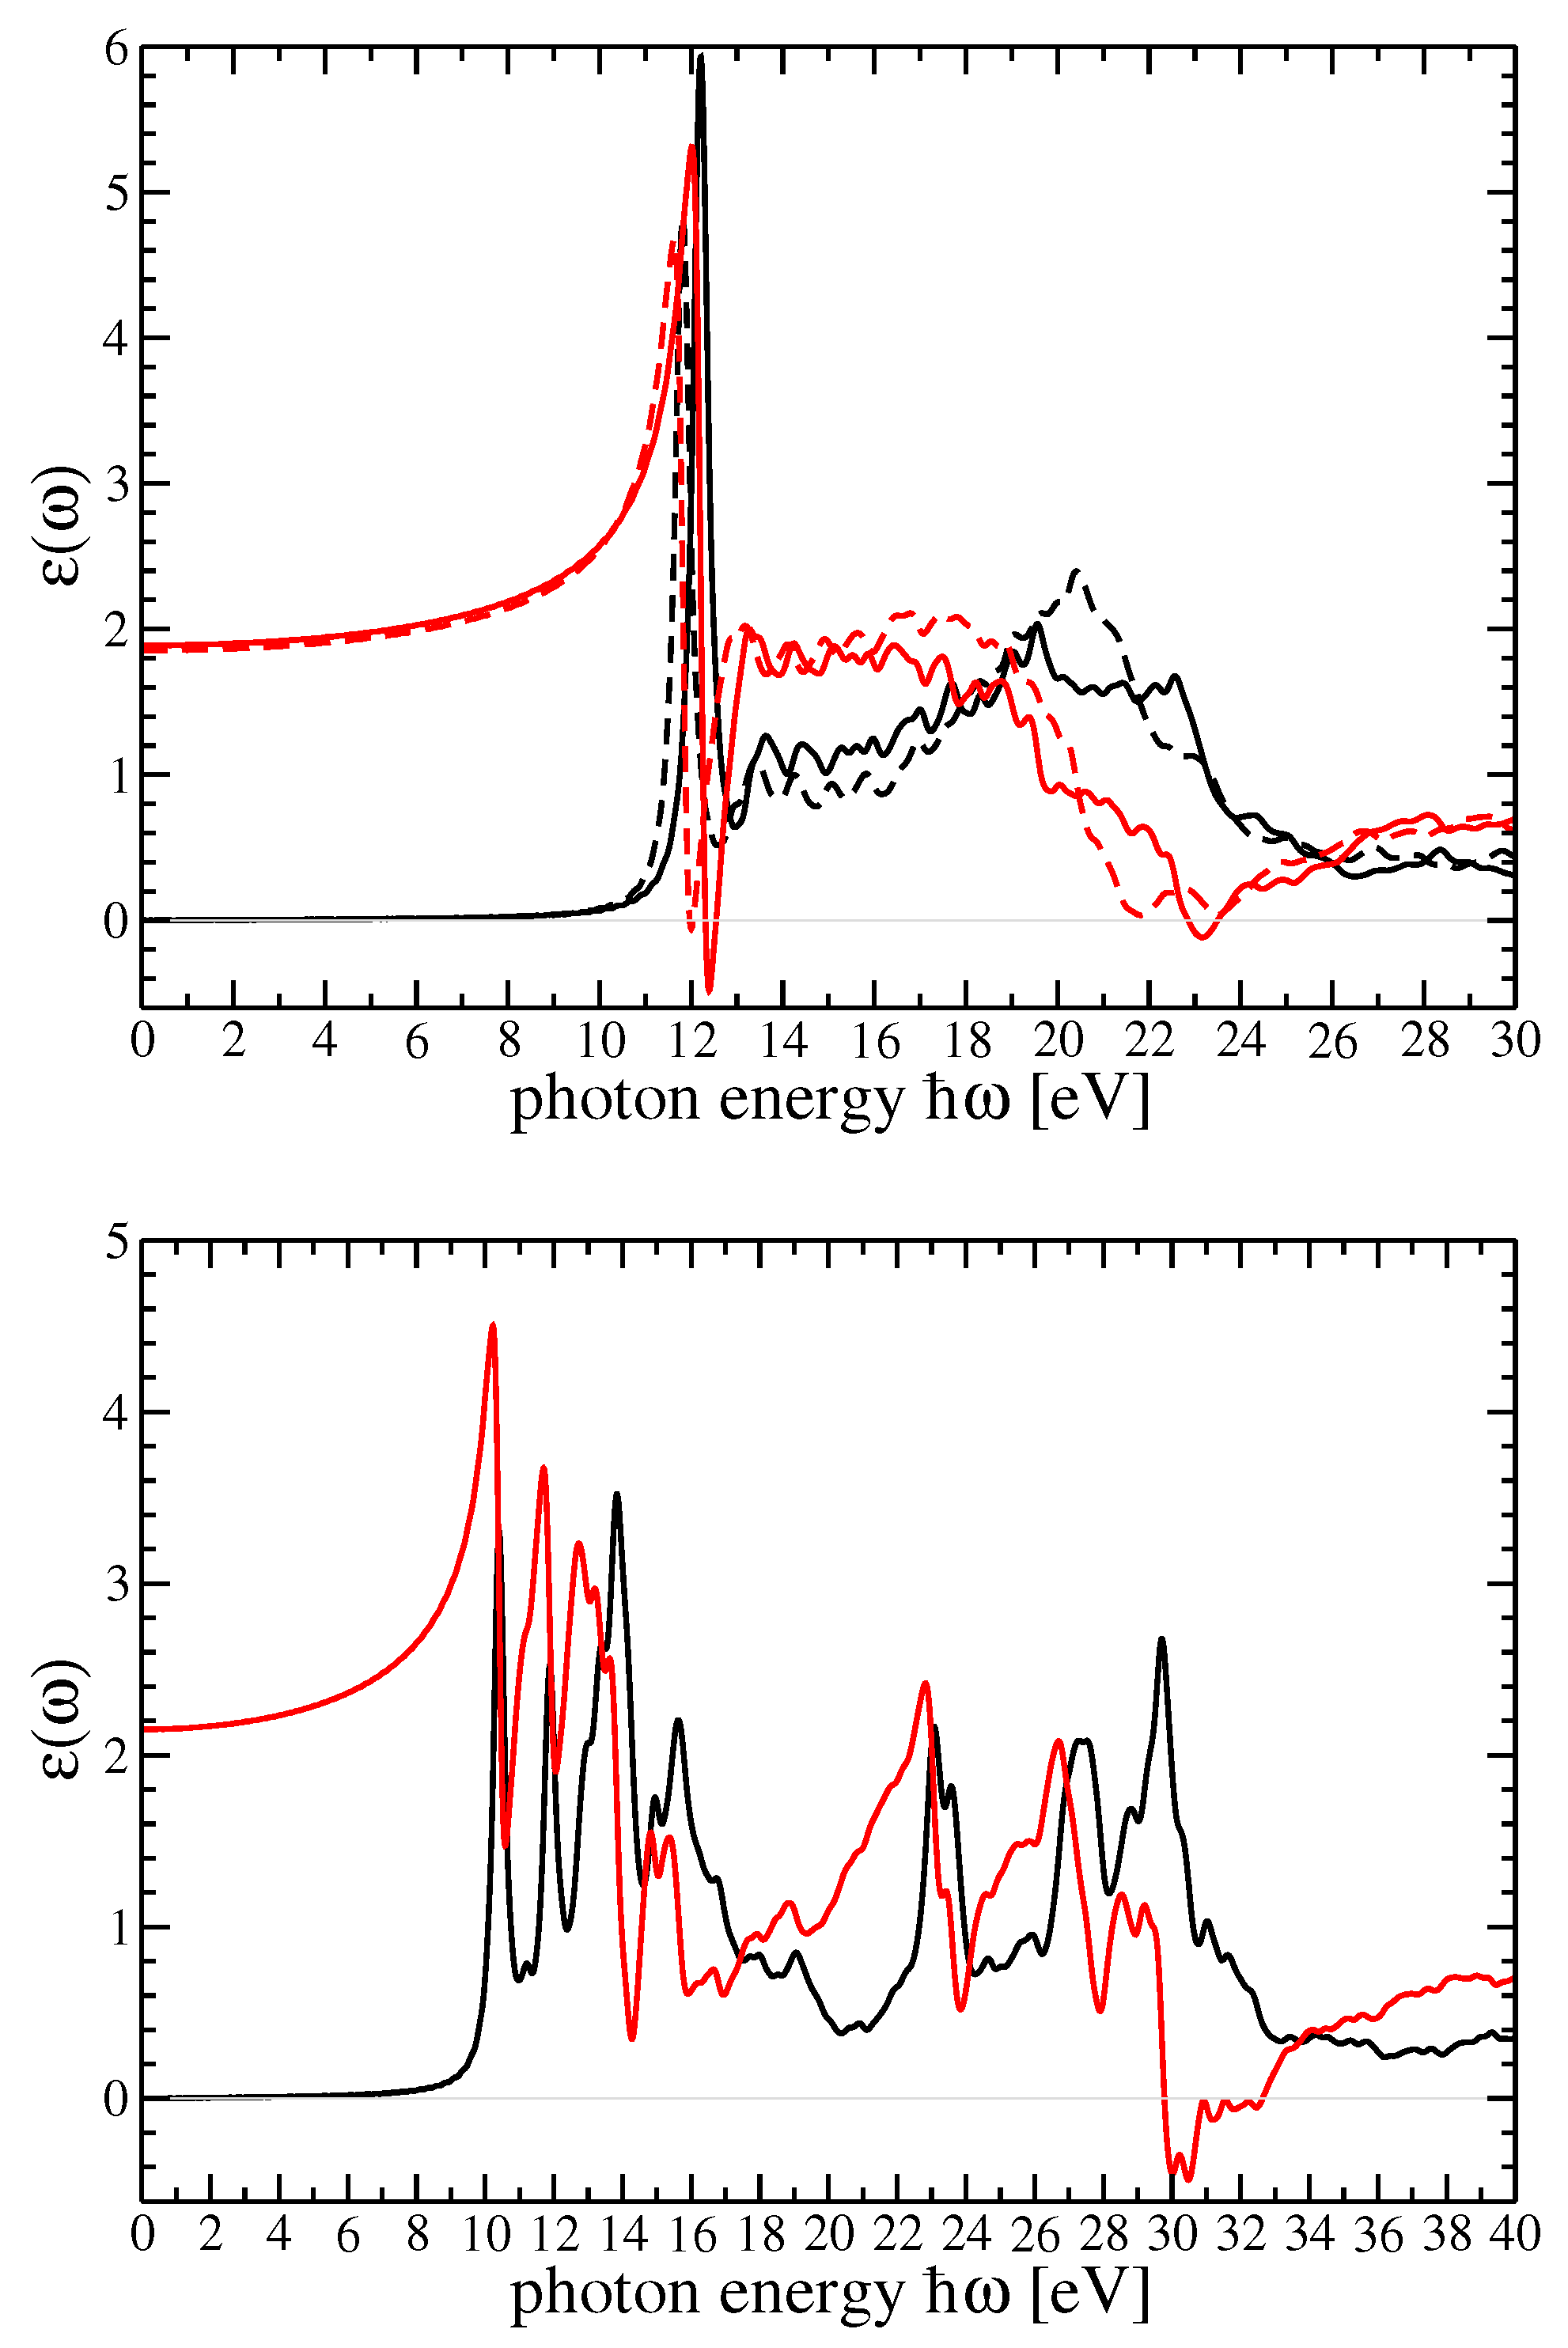
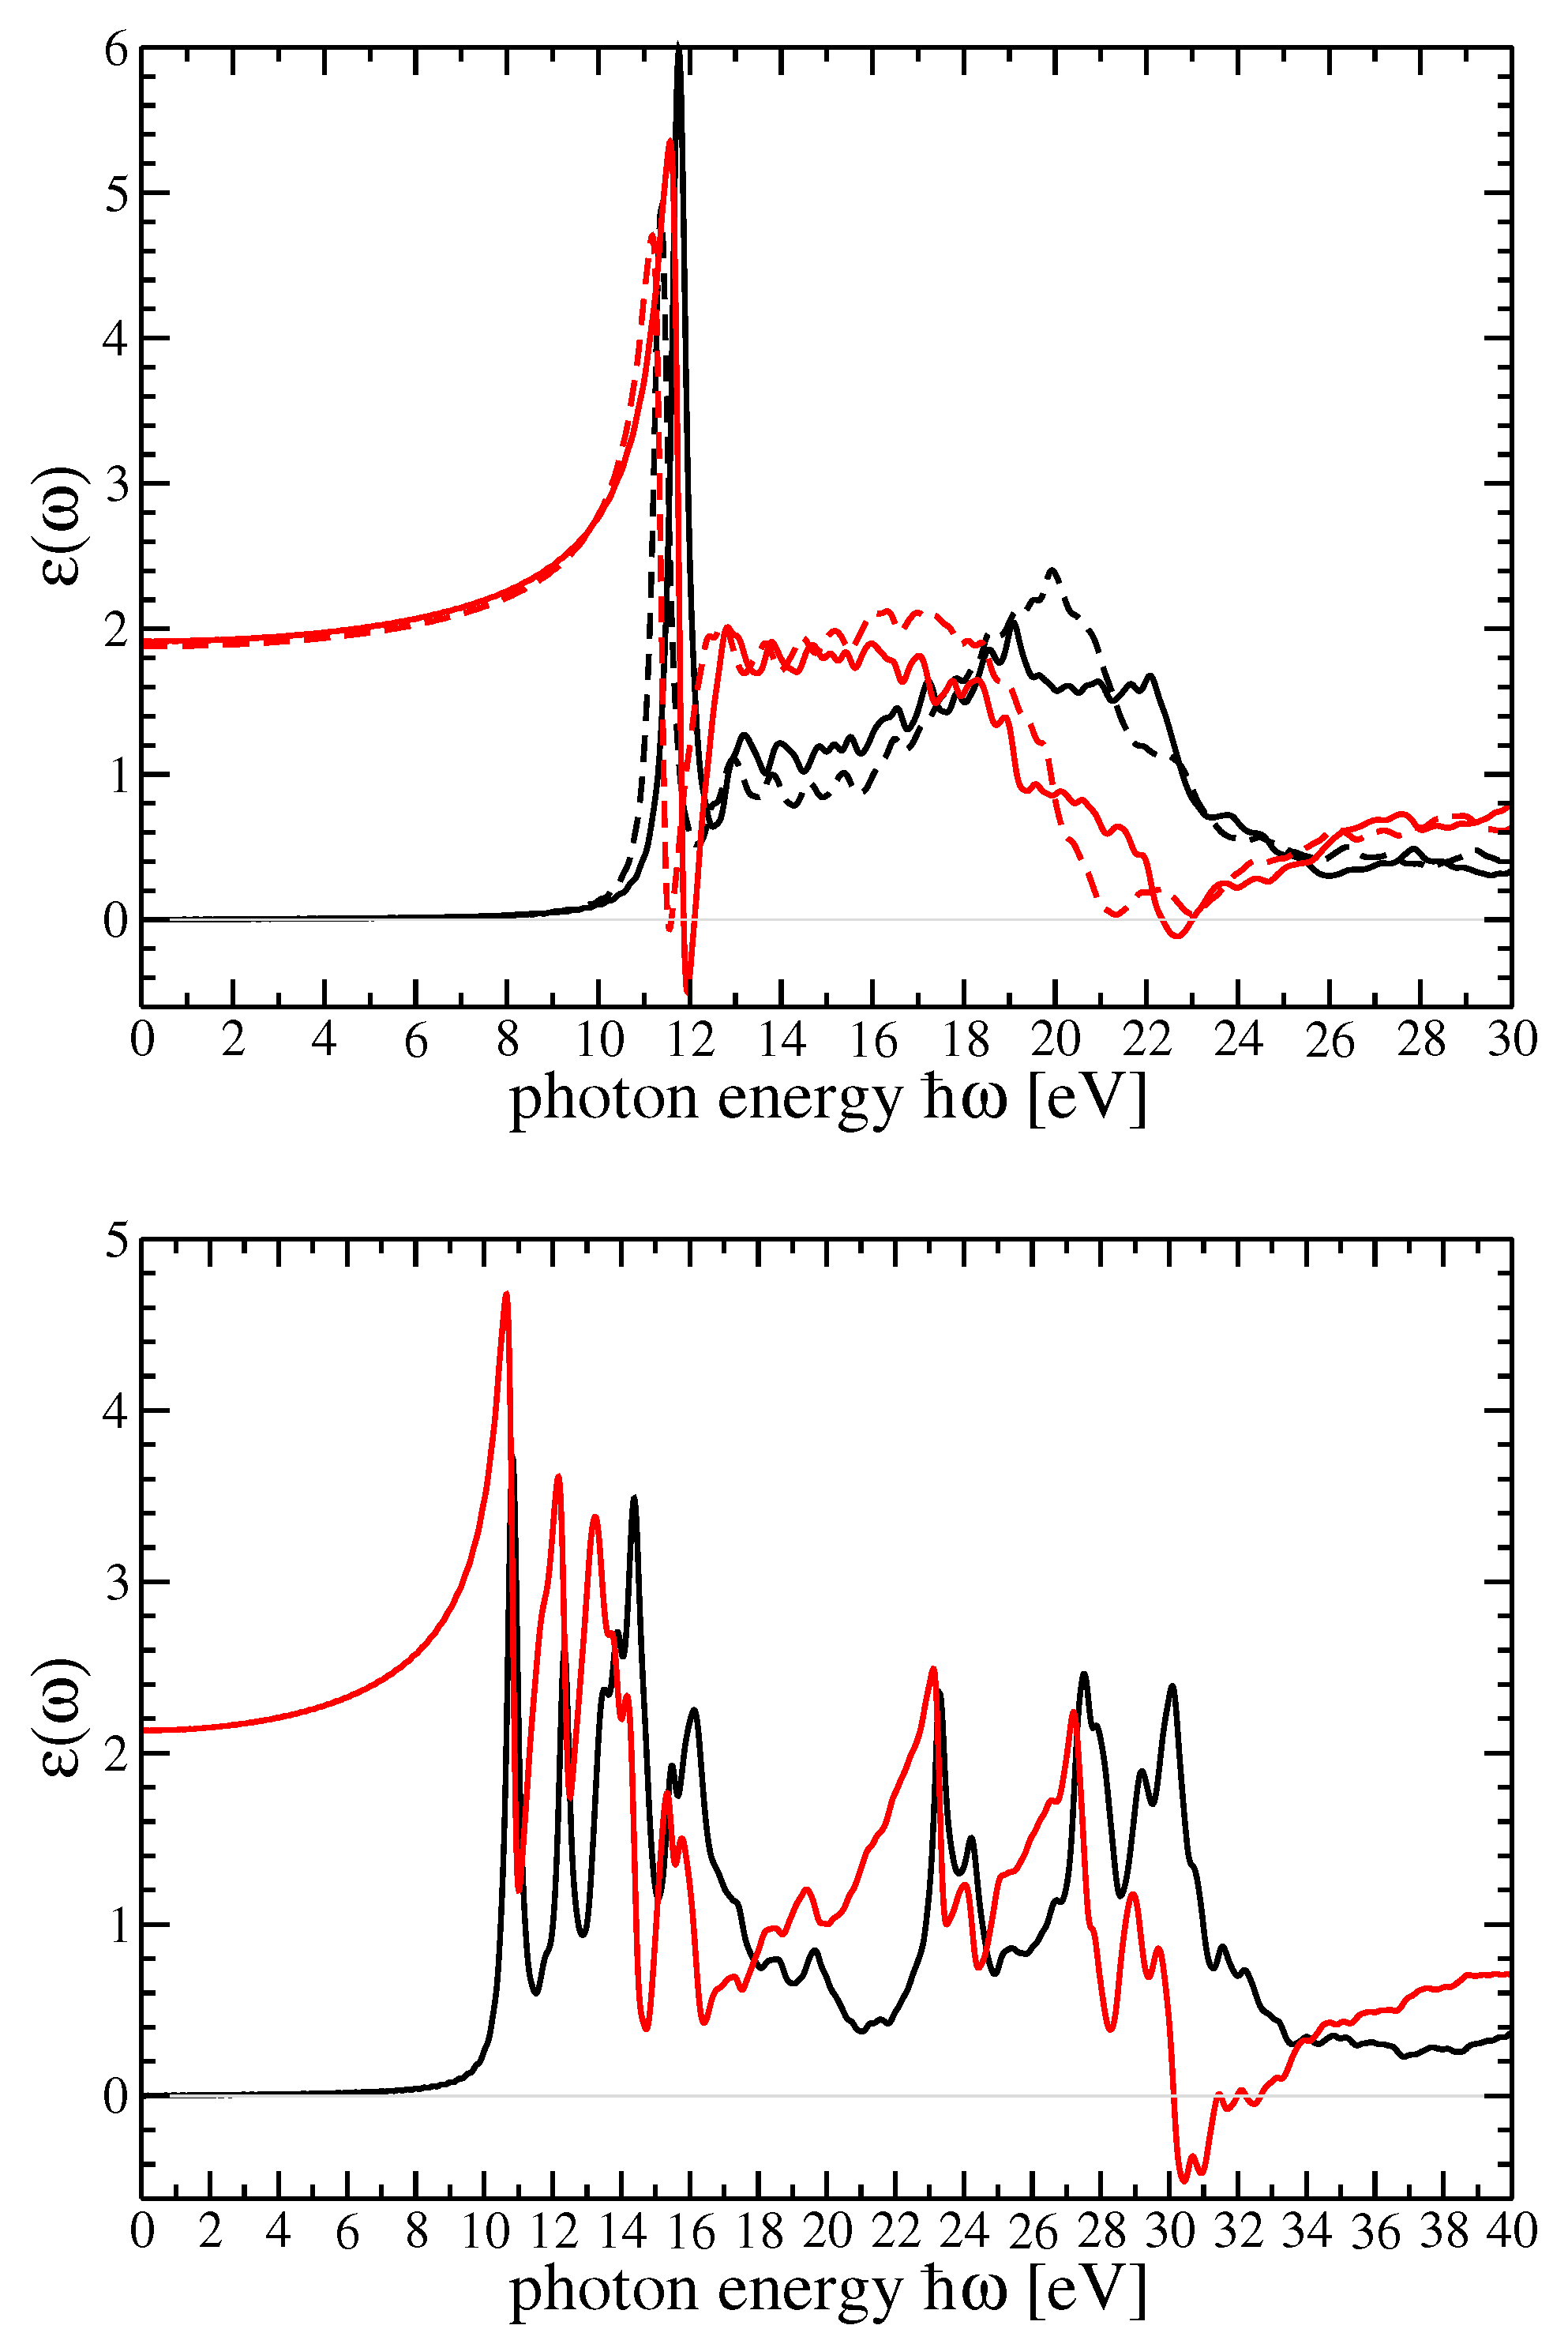
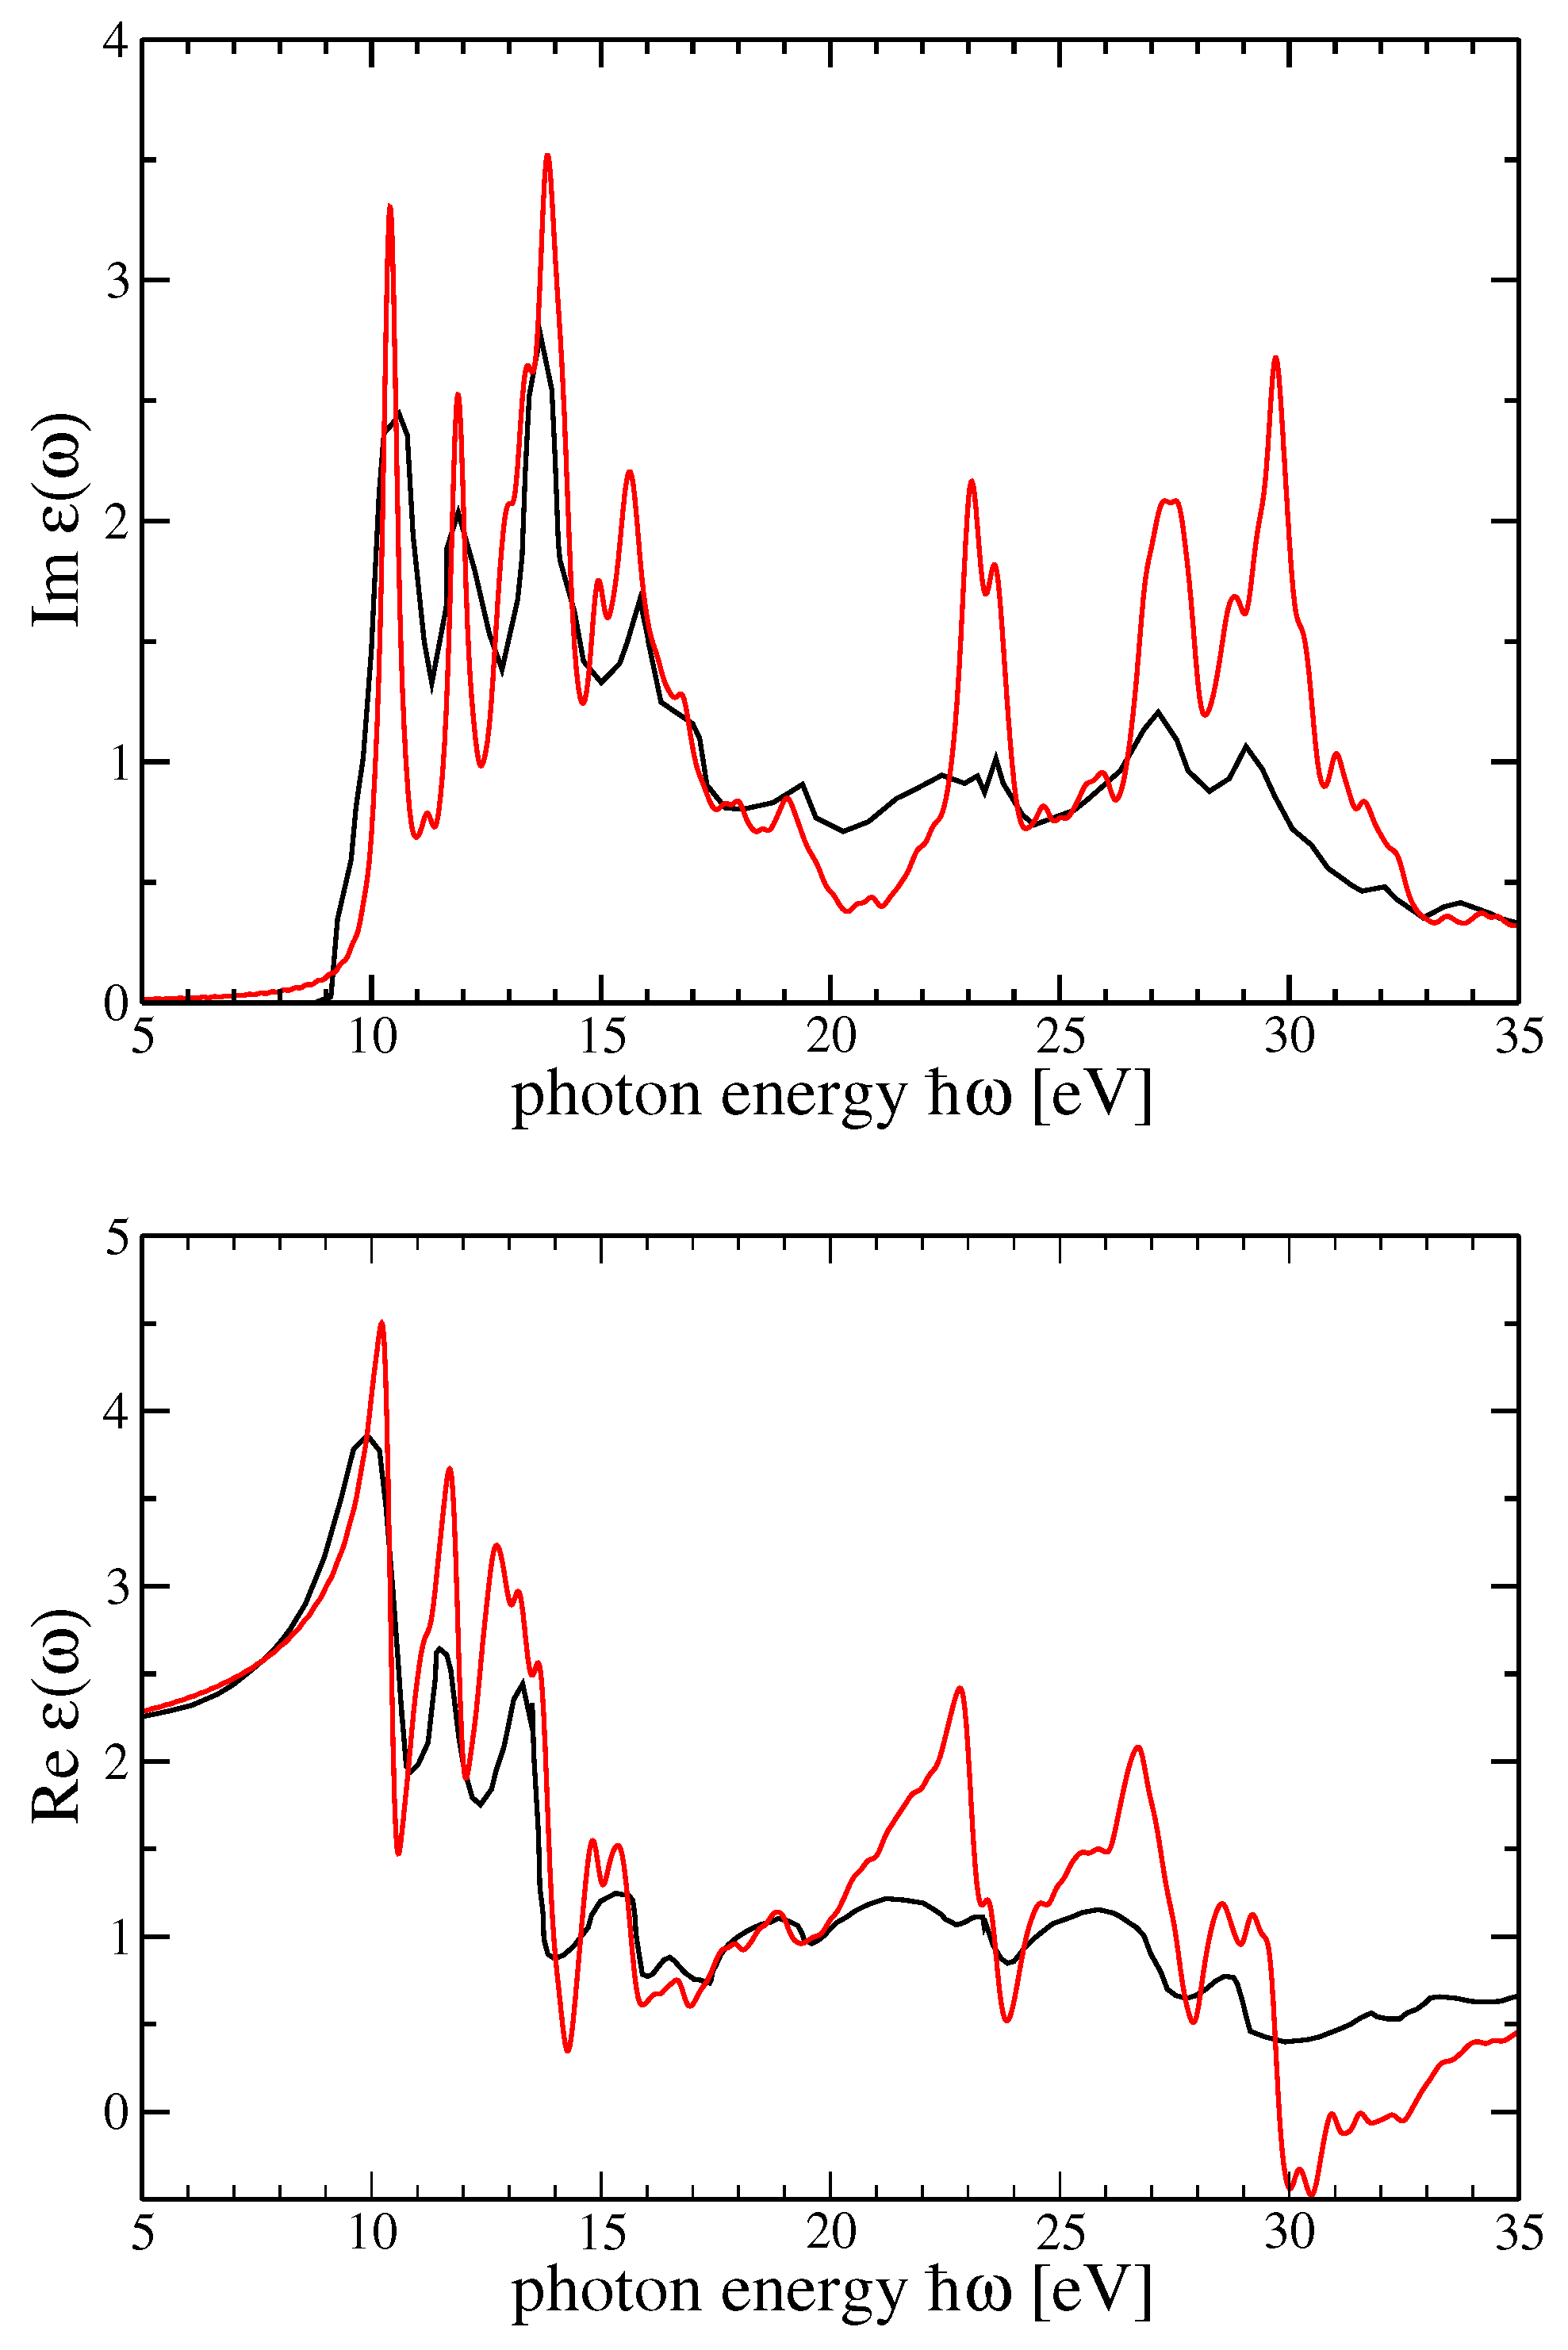
In
Figure 3, dielectric function components for r-MgF
and c-SrF
in the GW
scheme are shown. In
Figure 4, the imaginary part of the dielectric function in
(
) was reported using the method by Schmidt et al. [
25,
66]. In that figure, the BSE dielectric function components for r-MgF
in the BSE scheme (for the two components of the polarization) and c-SrF
were computed on top of the G
W
and scQP-GW, respectively, self-energy calculations. The real parts were derived by a Kramers—Kronig (KK) transformation.
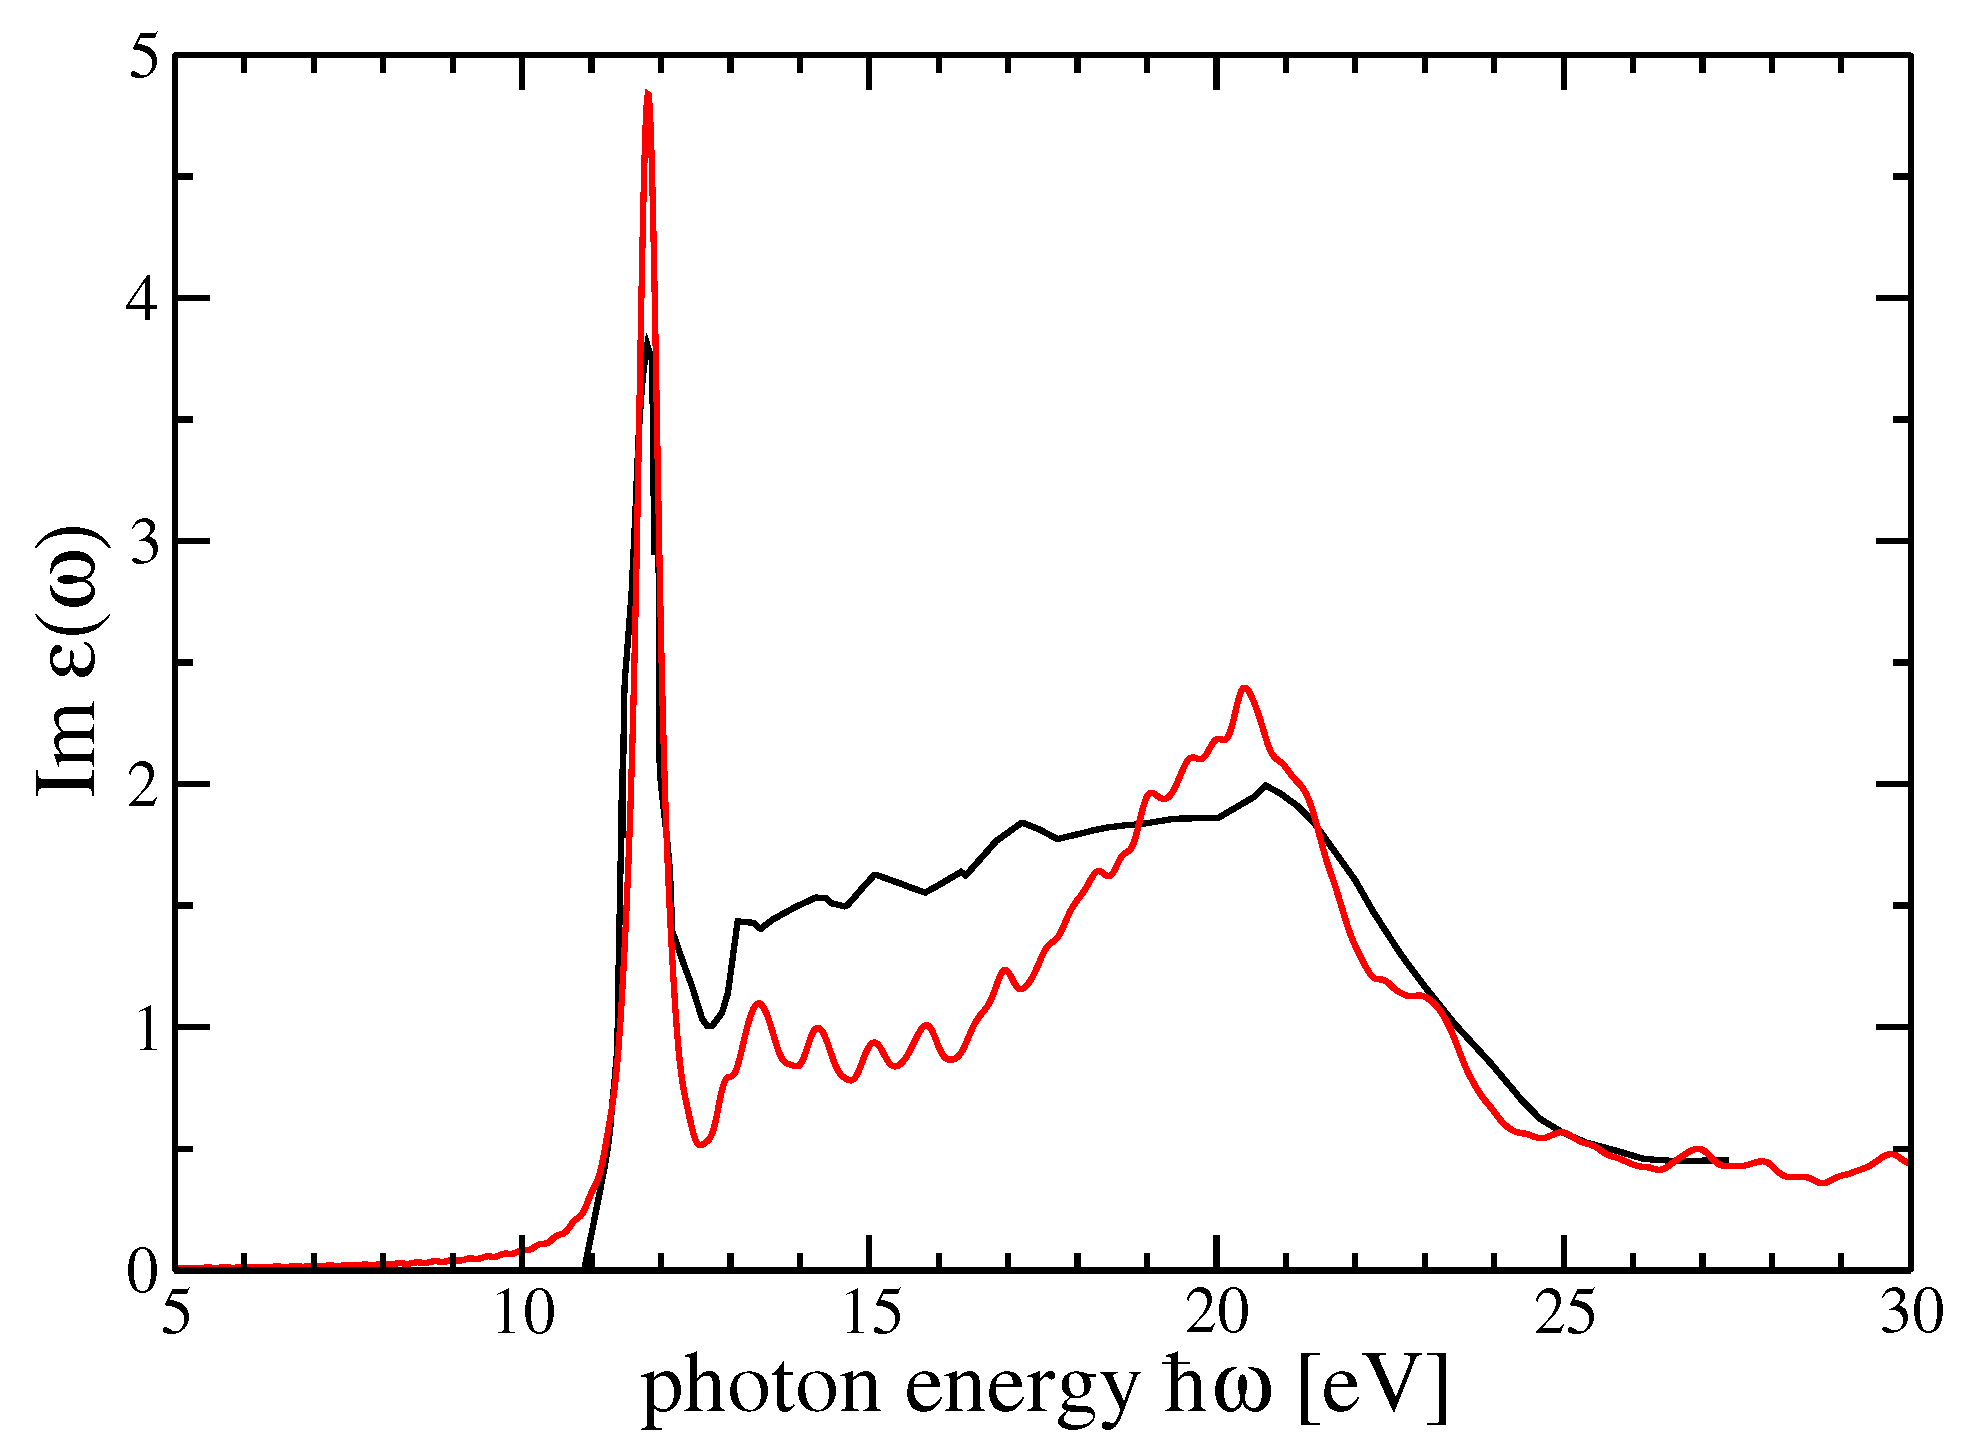
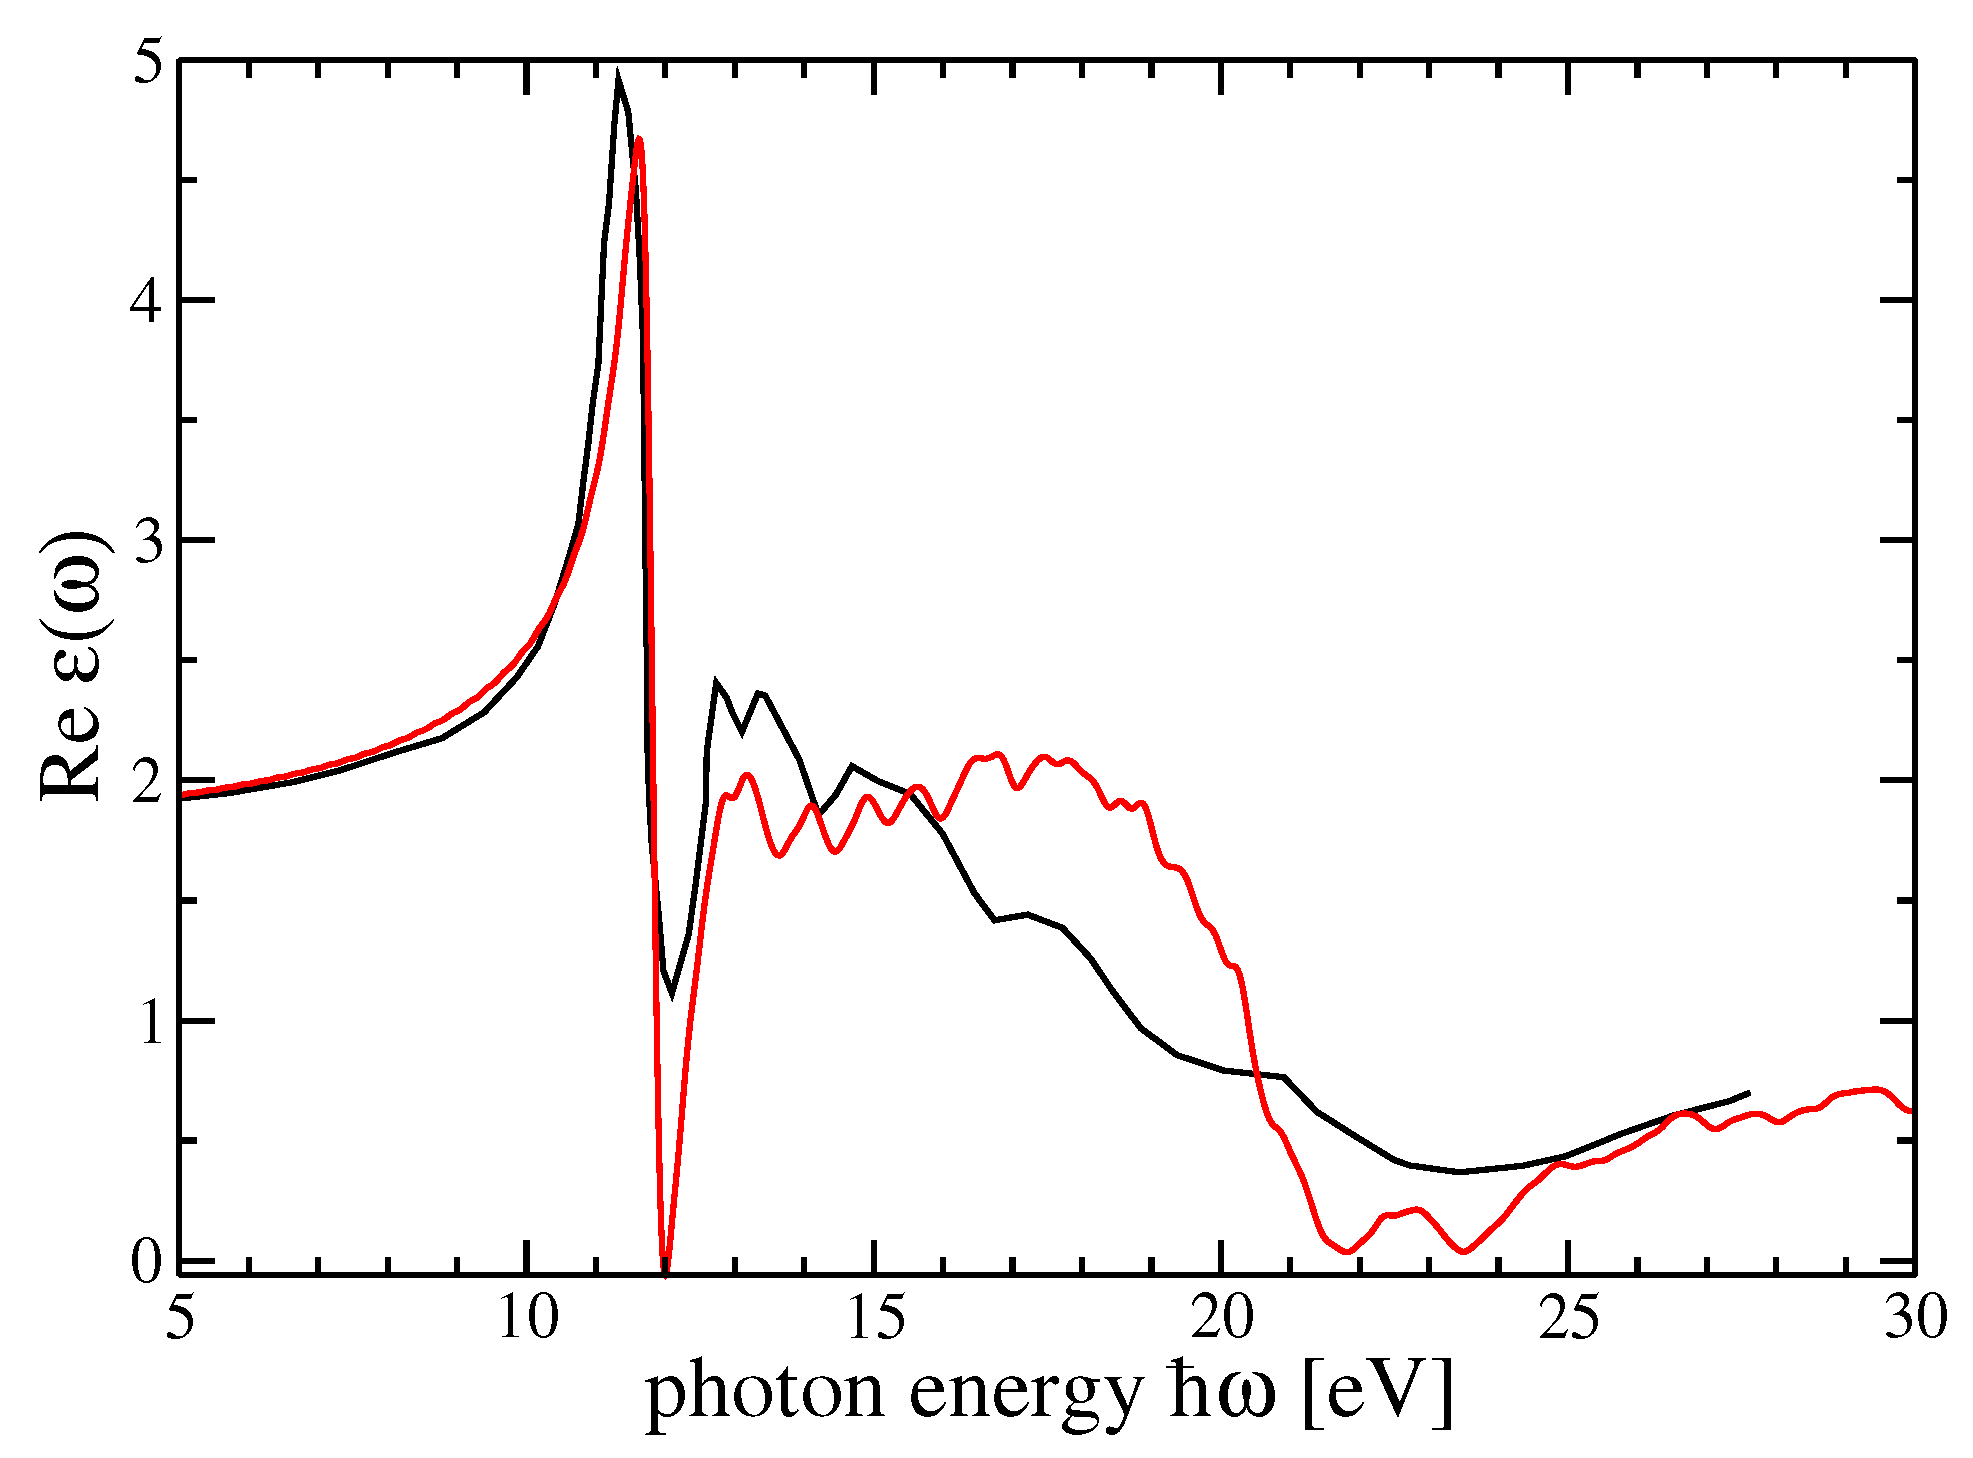
The comparison with the experiments is particularly interesting and important for both materials. The possibility to choose the degree of self-consistency between different QP schemes allow for a very satisfactory comparison between theory and experiment. From
Figure 5 and
Figure 6, for the imaginary and real parts of the dielectric function of r-MgF
, we can find a one-to-one correspondence between the peaks and structures in theory and experiments. Nevertheless, the imaginary parts calculated within the GW
scheme for both crystals show a very good comparison between theory and experiment for the very first peak, which represents a bound exciton with excitation energy below the direct QP gap. The difference defines the exciton binding energy
eV for r-MgF
depending on light polarization or
eV for c-SrF
. In the real part of the dielectric functions, on the other hand, the sequence of the first maximum–minimum–second maximum also coincides with the theory and experiment. An overestimation of the experimental data takes place around 23 eV for r-MgF
and around 32 eV for c-SrF
, but these reduced mismatches do not invalidate the overall theory–experiment agreement for this observable.
In
Table 5, the energies of the relevant optical absorption features were reported for the fluorides r-MgF
and c-SrF
. The first peak energy position at the absorption onset, the excitation energy of the lowest exciton, and the dielectric constant
values are reported using different BSE and GW schemes. These quantities are compared with the corresponding experimental values (fourth column). In the case of r-MgF
both the values for the two principal directions of the crystal are given. The effect of the anisotropy on the computed values gives rise to extremely small differences of the order of 3% for the peak position E
, less than 10% in exciton binding energy E
, and less than 2% in the dielectric constant
. For r-MgF
, the best agreement with experimental data is found with the results from the BSE+GW
scheme which reproduces the experimental value for E
within 2%. Even if the BSE(scQP-GW) value is closer to the experiment for
, its deviation from the BSE(GW
) result is less than 1%. On the other hand for c-SrF
it seems that both schemes BSE(scQP-GW) and BSE(GW
) reproduce the experimental data with almost the same accuracy with a calculated value of E
within 2% from the measured one (+2% for BSE(scQP-GW), −2% for BSE(GW
)). There is a clear tendency for overestimation of the exciton binding energies and dielectric constants in all many-body approaches studied. This fact is related to the use of
without including the phonon contributions in the screening. The discrepancies are much smaller for the position of the first excitonic absorption peak. Indeed, the theoretical (in BSE-GW
quality) and experimental energies only deviate by 0.1–0.2 eV, i.e., by 1–2%.
6. Additional Material: Bulk Systems versus Clusters
Recent studies on the electronic and optical properties and alkaline earth metal fluoride clusters have emerged in recent years [
38,
39,
40,
41,
42]. These studies were motivated by basic research interests and possible applications.
In Reference [
38], some of the authors of the present collaboration focused on the (MF
)
systems with
and M=Mg,Ca,Sr,Ba, i.e., their attention was focused on fluoride clusters, for the (first) smallest three members of each family. The results for bulk crystals r-MgF
and c-SrF
proposed in the present paper allow completing the systematic comparison for excited state and optical properties determined within state-of-the-art techniques with those of the corresponding clusters. The comparison may play an important role in understanding the effects of nanostructuring in the electronic and optical properties of the fluorides under study. In
Table 6, the quasiparticle gap (
), the optical onset (
), and the binding energy of the exciton (
) are reported for the bulk systems and the corresponding clusters. The evaluation of these observables in the case of the clusters was performed using well-tested techniques specific to these systems [
38,
87]. In
Table 6, the ranges of each physical observable relative to the smallest three clusters for MgF
and SrF
were reported. For more details, see Reference [
38].
In the first row, we list the data for the (MgF
)
clusters, in the second, we list the data for solid r-MgF
from Reference [
37], and in the third row, we list the outcomes of the present work for solid r-MgF
with experimental data in parentheses. In the last two rows, the data for (SrF
)
clusters and solid c-SrF
are listed. As far as the excitation properties are concerned, the quasiparticle band-gap energies of the clusters are similar to those of the bulk systems. On the other hand, the comparison of the energies of the optical onset shows large changes from the bulk to clusters.
The onset energy of r-MgF jumps from 10.9 eV, an energy located in the extreme UV (EUV: 10–124 eV) for bulk to an average value of 6.7 eV, and energy belonging to the far UV (FUV: 4.13–10.16 eV) for the clusters. In the case of bulk c-SrF, the onset energy is 10.4 eV (high border of FUV) and the average value for the corresponding clusters is 5.18 eV, with an energy in the middle UV range (MUV: 3.10–4.13 eV). Therefore, the onset energies of the clusters take place in different UV domains with respect to their corresponding bulk systems. This happens because specific molecular transitions take place for the clusters at energies for which the bulk system does not display the allowed electronic transitions.
The large differences in between clusters and bulk have important consequences on the exciton binding energies, which results in strongly enhanced clusters. The interplay between the confinement effects and reduced screening can be considered the main reason for that. Here, it is confirmed that MgF and SrF, if prepared as (small) clusters or as bulk samples, show very different UV properties (e.g., absorption). This can have very different application-related consequences for the design of UV-operating devices.


