Article

Quantifying Shape Variation in an Antisymmetrical Trait in the Tropical Fish Xenophallus umbratilis

by
Mary-Elise Nielsen
1,* and
Jerald B. Johnson
1,2
1
Evolutionary Ecology Laboratories, Department of Biology, Brigham Young University, Provo, UT 84602, USA
2
Bean Life Science Museum, Brigham Young University, Provo, UT 84602, USA
*
Author to whom correspondence should be addressed.
Symmetry 2023, 15(2), 489; https://doi.org/10.3390/sym15020489
Submission received: 14 December 2022 / Revised: 9 January 2023 / Accepted: 2 February 2023 / Published: 13 February 2023
(This article belongs to the Section Life Sciences)

Abstract

:
Antisymmetry is a striking, yet puzzling form of biological asymmetry. The livebearing fish Xenophallus umbratilis exhibits antisymmetry in the male intromittent organ and provides a system that is well-suited for studying the nature of variation in antisymmetrical traits. Using geometric morphometrics, we test the hypothesis that because the gonopodium is critical to fitness there will not be significant differences in gonopodium shape between the two gonopodial morphs in this species. Our results are consistent with this prediction, though we found that gonopodium shape differed with gonopodium size.

1. Introduction

Understanding and explaining morphological variations has long been a topic of interest in evolutionary biology. Some of the most widespread and easily discernable forms of variation are breaks in symmetry, also known as asymmetry. Several types of asymmetries exist. Fluctuating asymmetries are subtle, random deviations from symmetry that are classically associated with parasites, environmental stress, and homozygosity [1,2,3,4,5]. This type of asymmetry typically results from aberrations in development and has been shown to reliably signal genome quality as well [6,7,8]. Directional asymmetries are those where all individuals share the same direction of asymmetry and the direction of asymmetry usually has a genetic basis [9,10]. Finally, antisymmetry is a type of asymmetry wherein “left-handed” and “right-handed” forms are both present within a population [11]. Antisymmetry is sometimes referred to as random asymmetry because the direction of asymmetry in such traits appears to be random and is sometimes not heritable [12].
Some have suggested that traits that are non-heritable, e.g., many asymmetrical and antisymmetrical traits, are evolutionarily unimportant [13,14]. However, such conclusions are not universally accepted [13,15]. One of the challenges in understanding the evolutionary impact of antisymmetrical traits is that researchers often focus on traits that may not be readily linked to fitness. What is needed is a study that examines antisymmetry in a trait that is clearly and directly linked to fitness, such as those used for reproduction or rearing offspring.
We have identified a species of livebearing freshwater fish, Xenophallus umbratilis [16], that fits these criteria. This species exhibits antisymmetry in the male intromittent organ called the gonopodium, a modified anal fin that is used to inseminate females [17,18]. Gonopodia in livebearing fish are often elaborated, featuring barbs, claws, and serrae that presumably help males anchor more securely to the female urogenital pore during copulation [17,19]. The gonopodium in X. umbratilis terminates with a hook-like structure that curves to the left (sinistral) or to the right (dextral) (Figure 1).
Here, we evaluate the extent of shape variation in the degree of curvature in the gonopodium between sinistral and dextral males in X. umbratilis using geometric morphometrics. Because the degree of curvature in the gonopodium likely impacts a male’s ability to successfully transfer sperm (too curved or not curved enough may both inhibit copulation), we predict that curvature will be maintained by common selective pressures regardless of chirality and will therefore be identical between the two morphs.

2. Materials and Methods

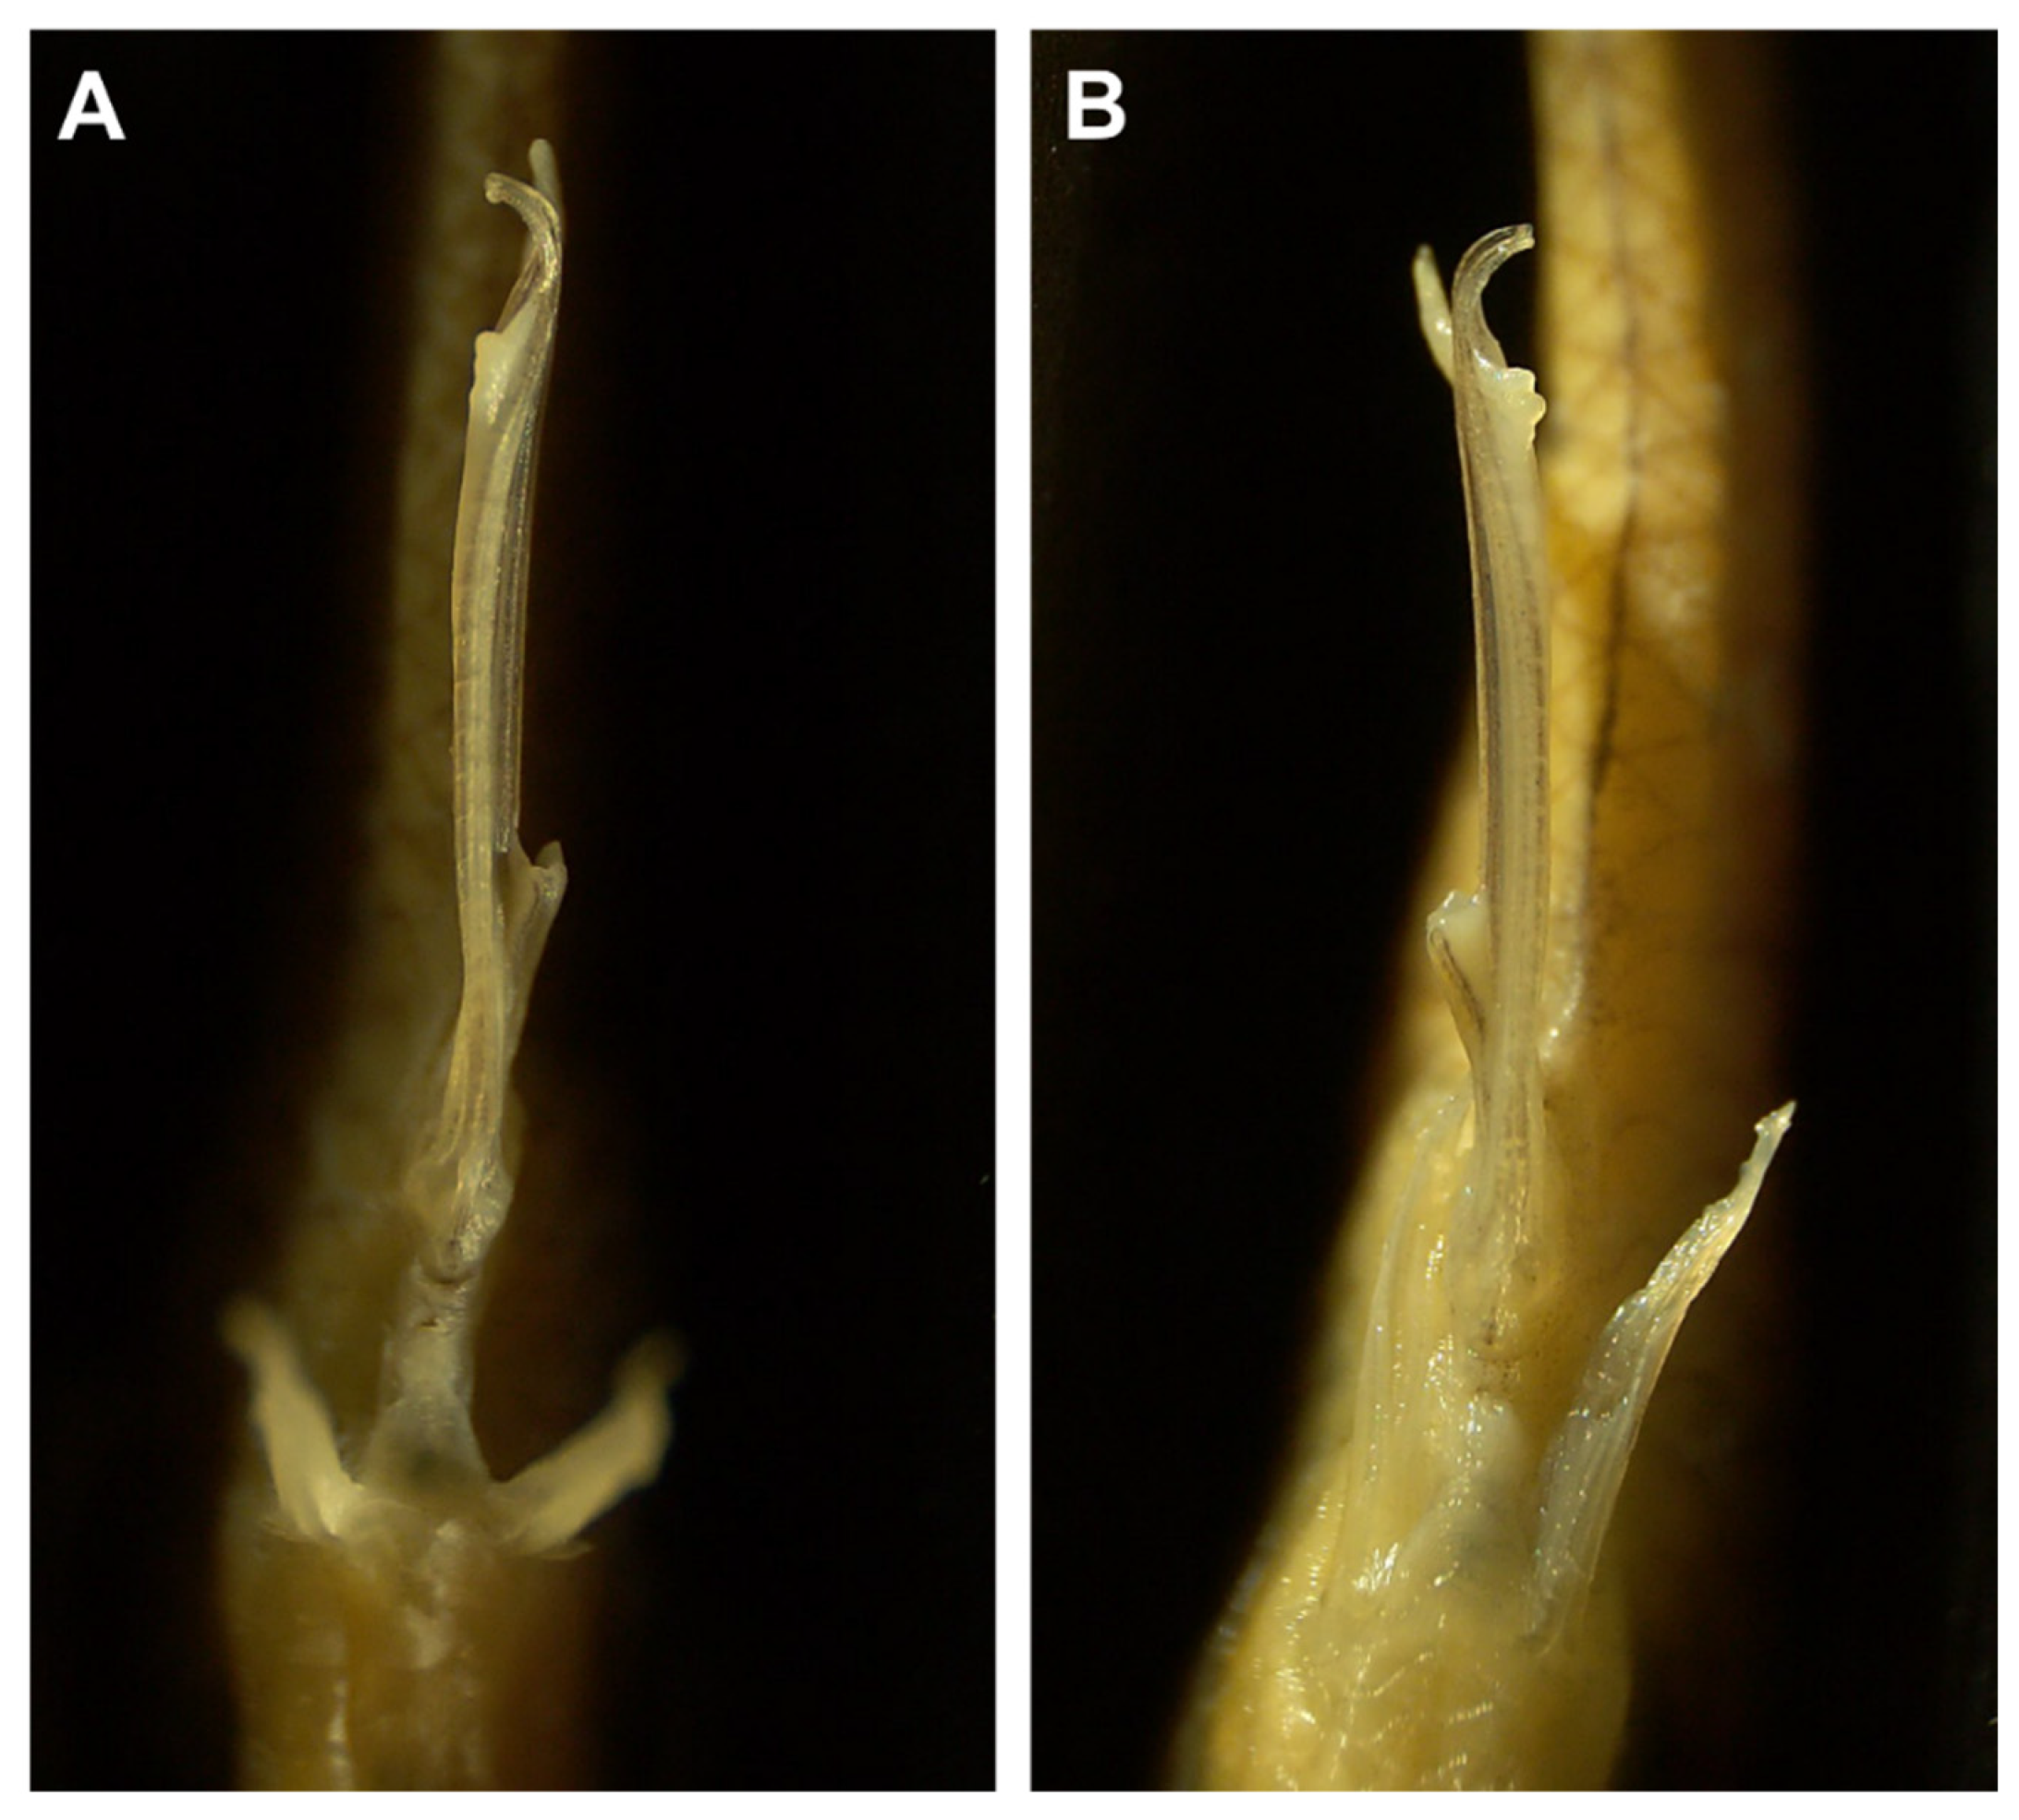
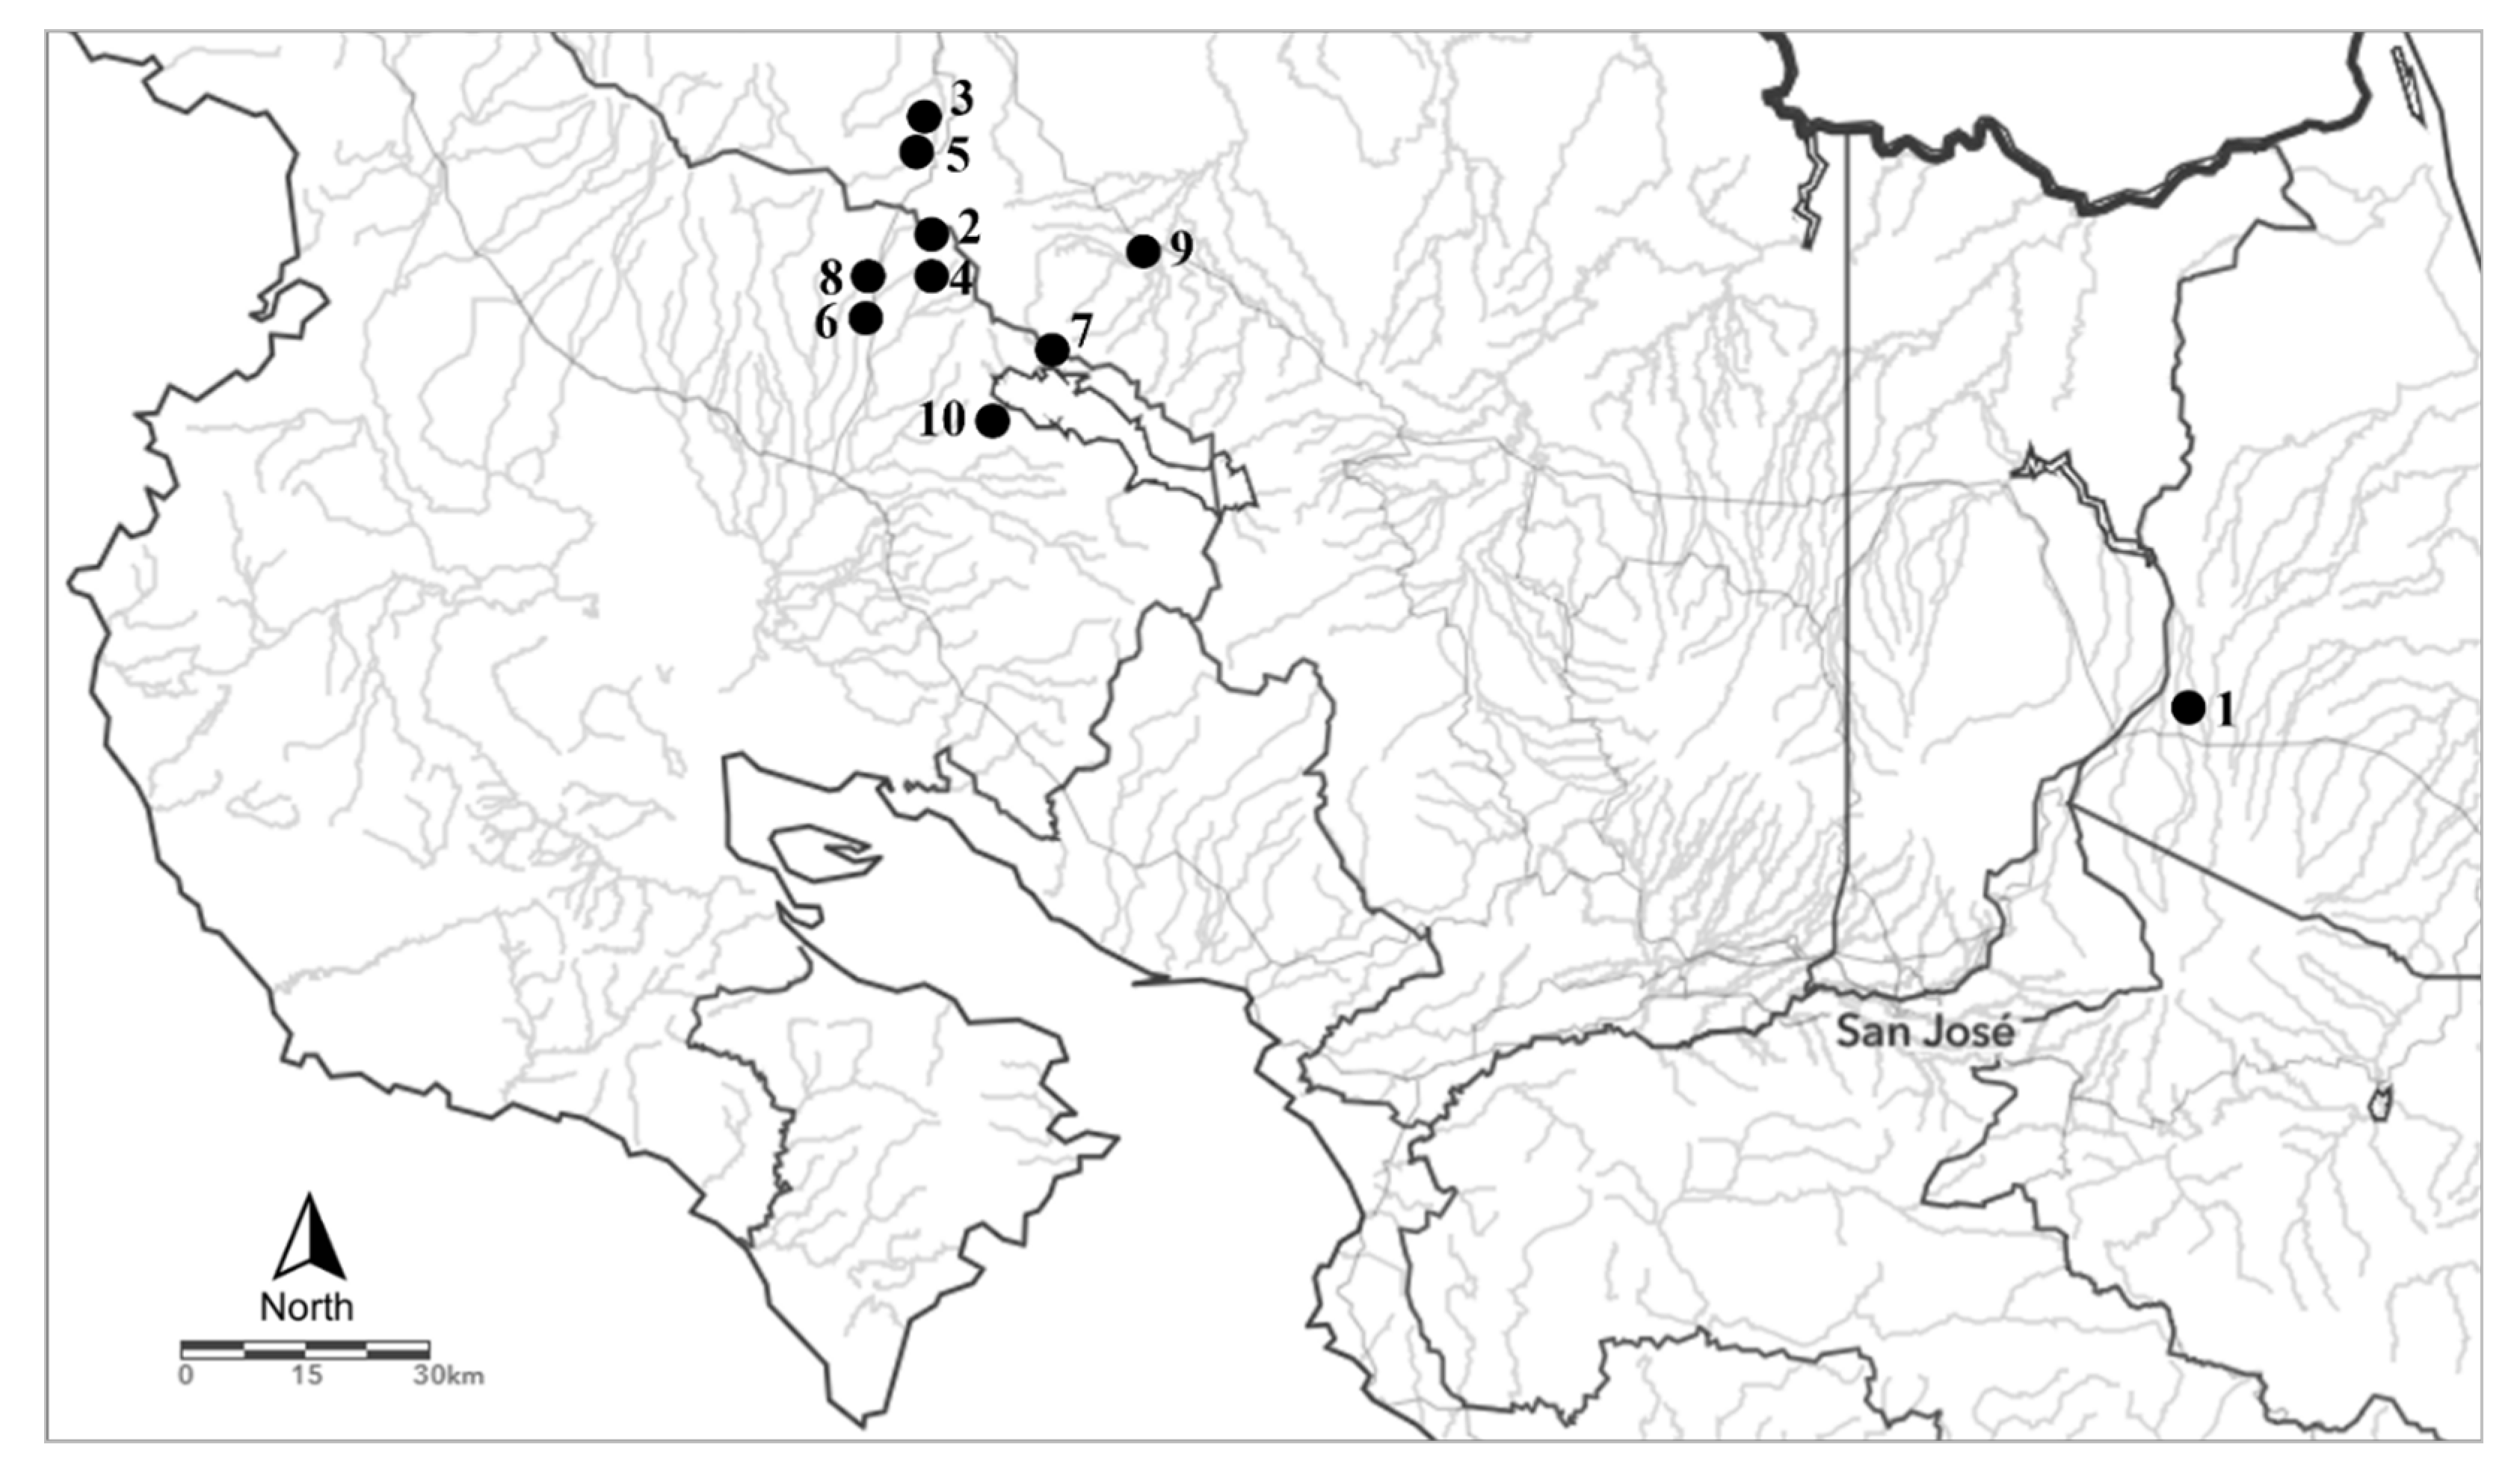
2.1. Study System and Sampling

Xenophallus umbratilis is a livebearing freshwater fish native to northern Costa Rica. The species is typically found in small streams and is most abundant at the headwaters of river drainages at high elevations [20]. As in all other poeciliid fishes, X. umbratilis employs internal fertilization and gives birth to live young. The gonopodium in X. umbratilis is antisymmetrical, exhibiting a sinistral (left-handed) or dextral (right-handed) hook at the terminus. Populations of X. umbratilis are usually composed of a mixture of sinistral and dextral individuals, though several populations that are fixed for either morph have been observed in the wild [21].
We studied X. umbratilis from ten different localities that contained both gonopodium morphs collected from tributaries and streams in Costa Rica between 2005 and 2007 (Figure 2, Table 1). These specimens came from the Brigham Young University Bean Life Science Museum collections. Fish were collected and humanely euthanized in the field with an overdose of the anesthesia tricane methanesulfonate (MS-222) at a concentration of 250 mg/L [22,23]. Fish were preserved in the field in ethyl alcohol and each specimen was assigned a museum ID number.
Populations that were fixed for either the sinistral or dextral morph were excluded from this study. We sorted each of the ten populations to remove females and juveniles, and then sorted the remaining mature males by gonopodium morph. Using an Olympus DP74 camera mounted on an Olympus MVX10 microscope (Tokyo, Japan), we took photographs of males with their ventral side facing up to the camera lens. We placed males in a black, plastic trough for photographing to make their positioning under the lens easier to control and more consistent across images. Following photographing, we returned males to their original museum collection jars.

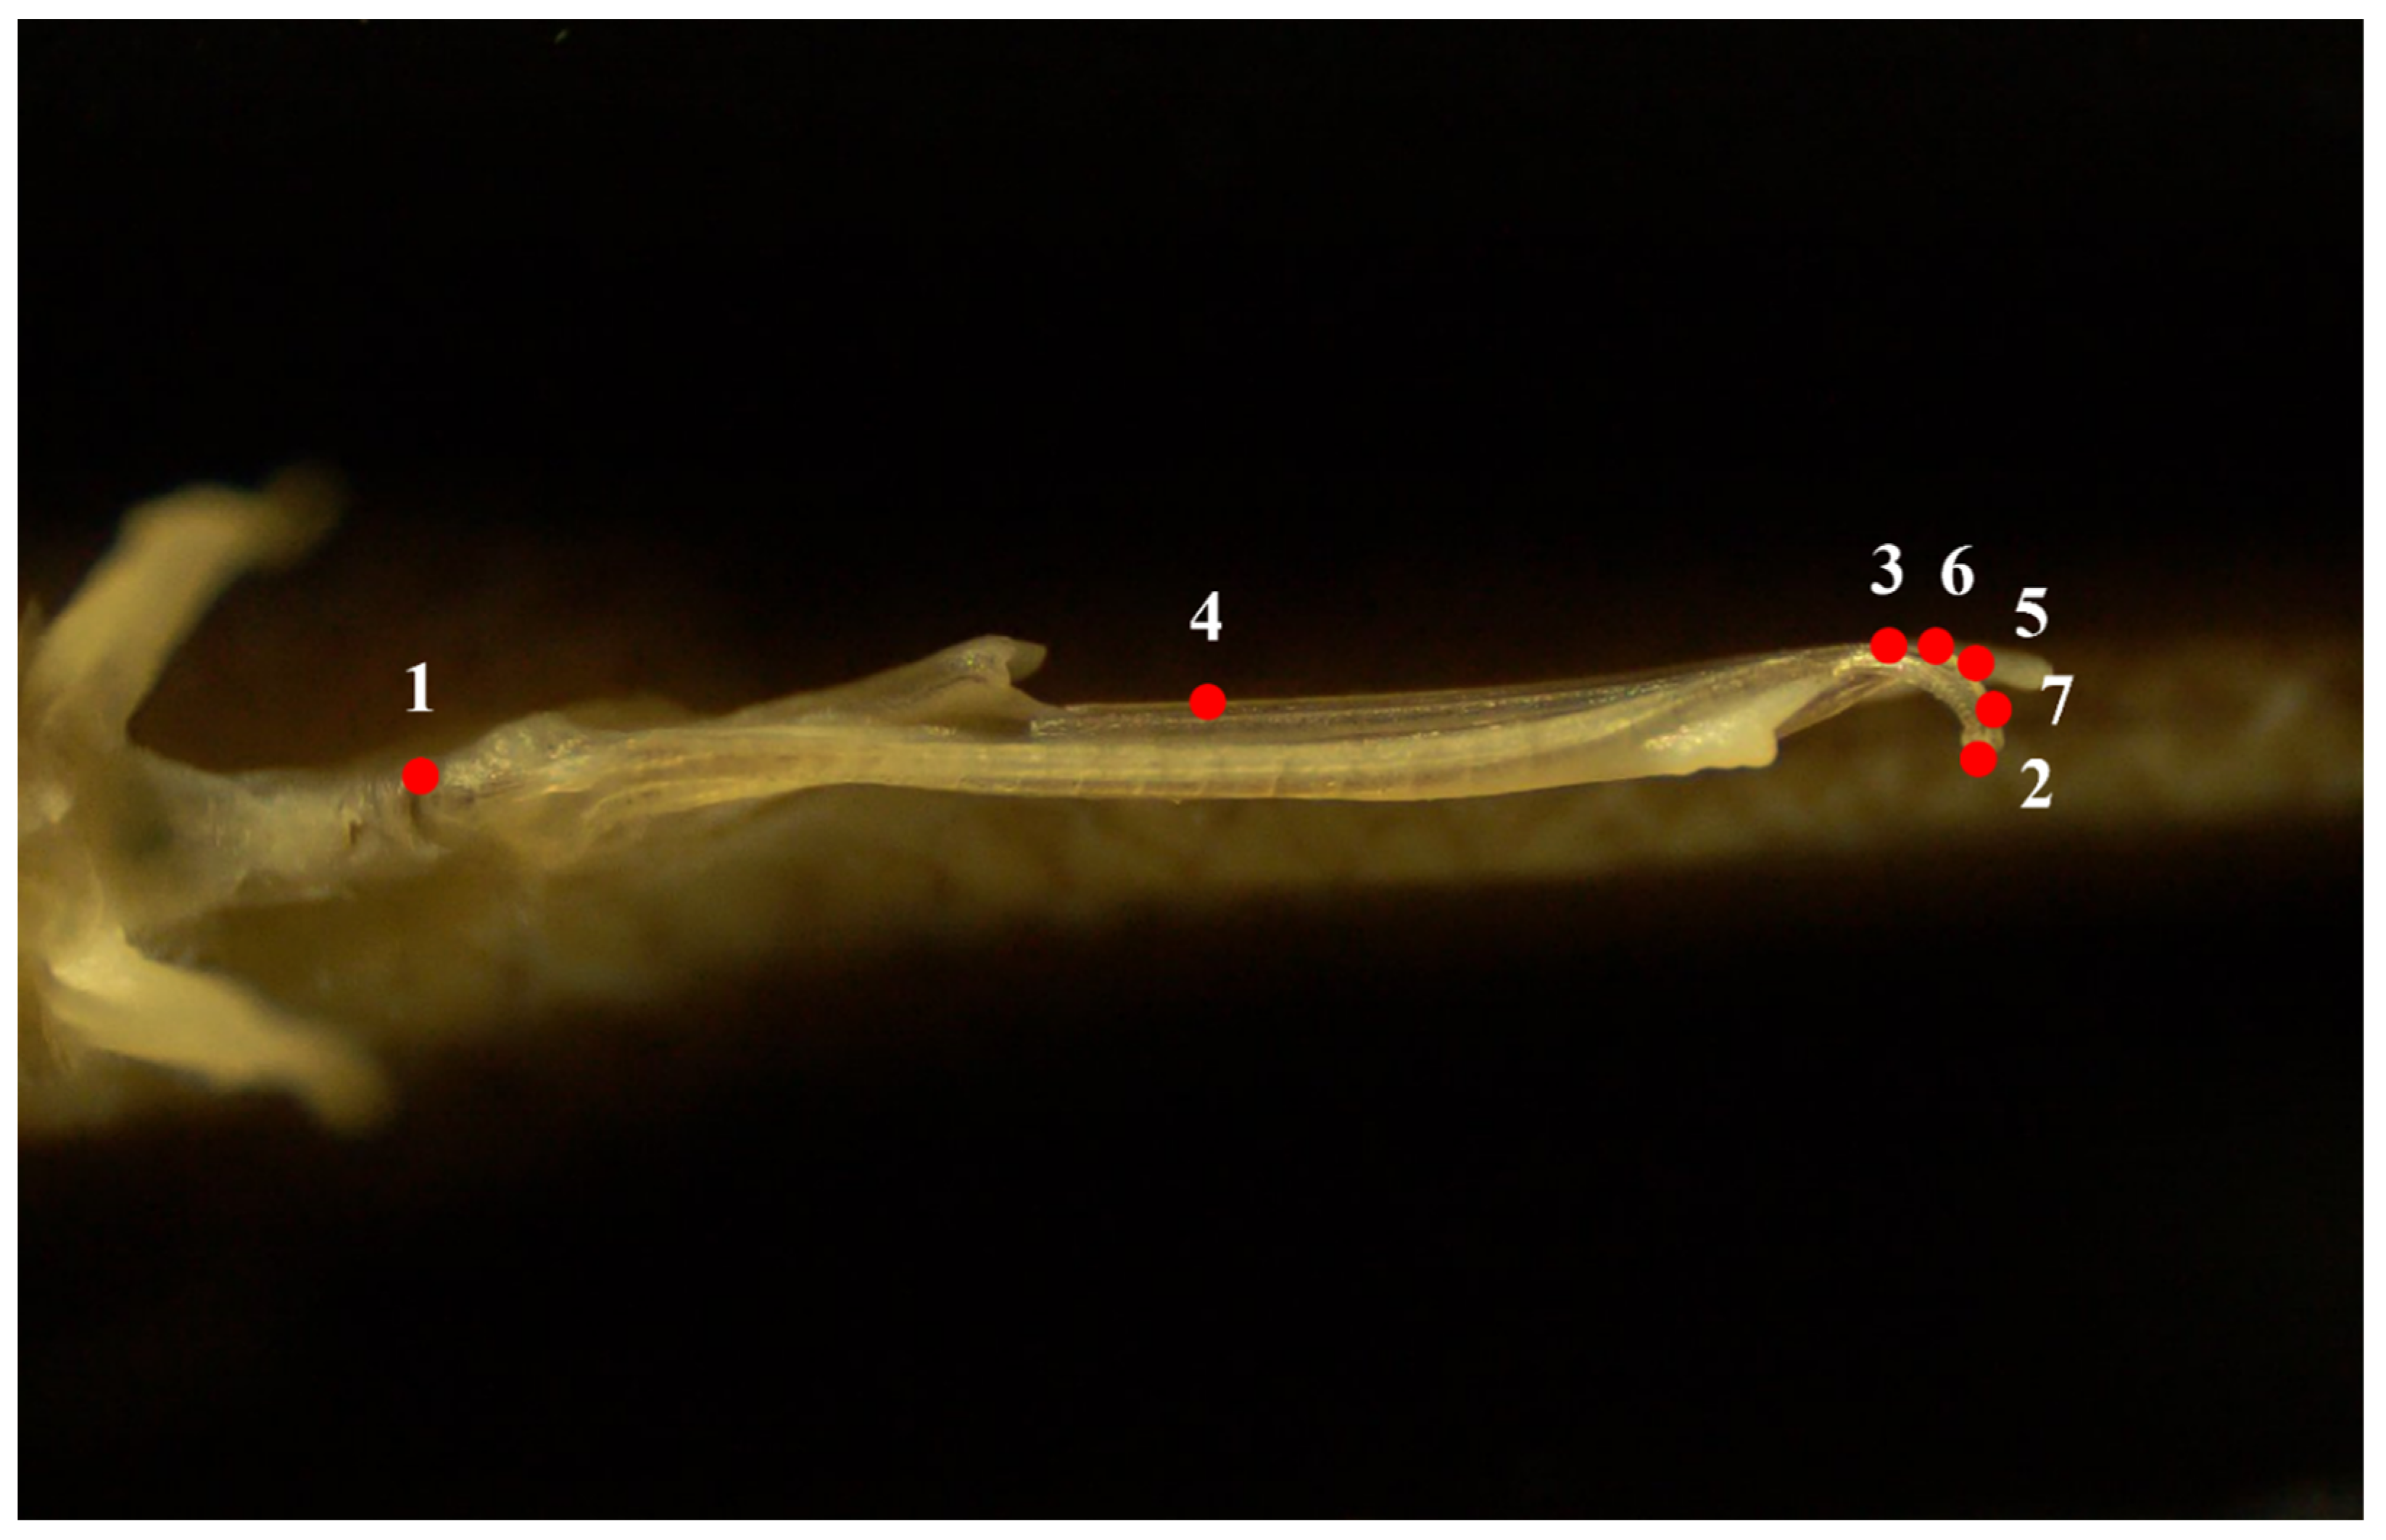
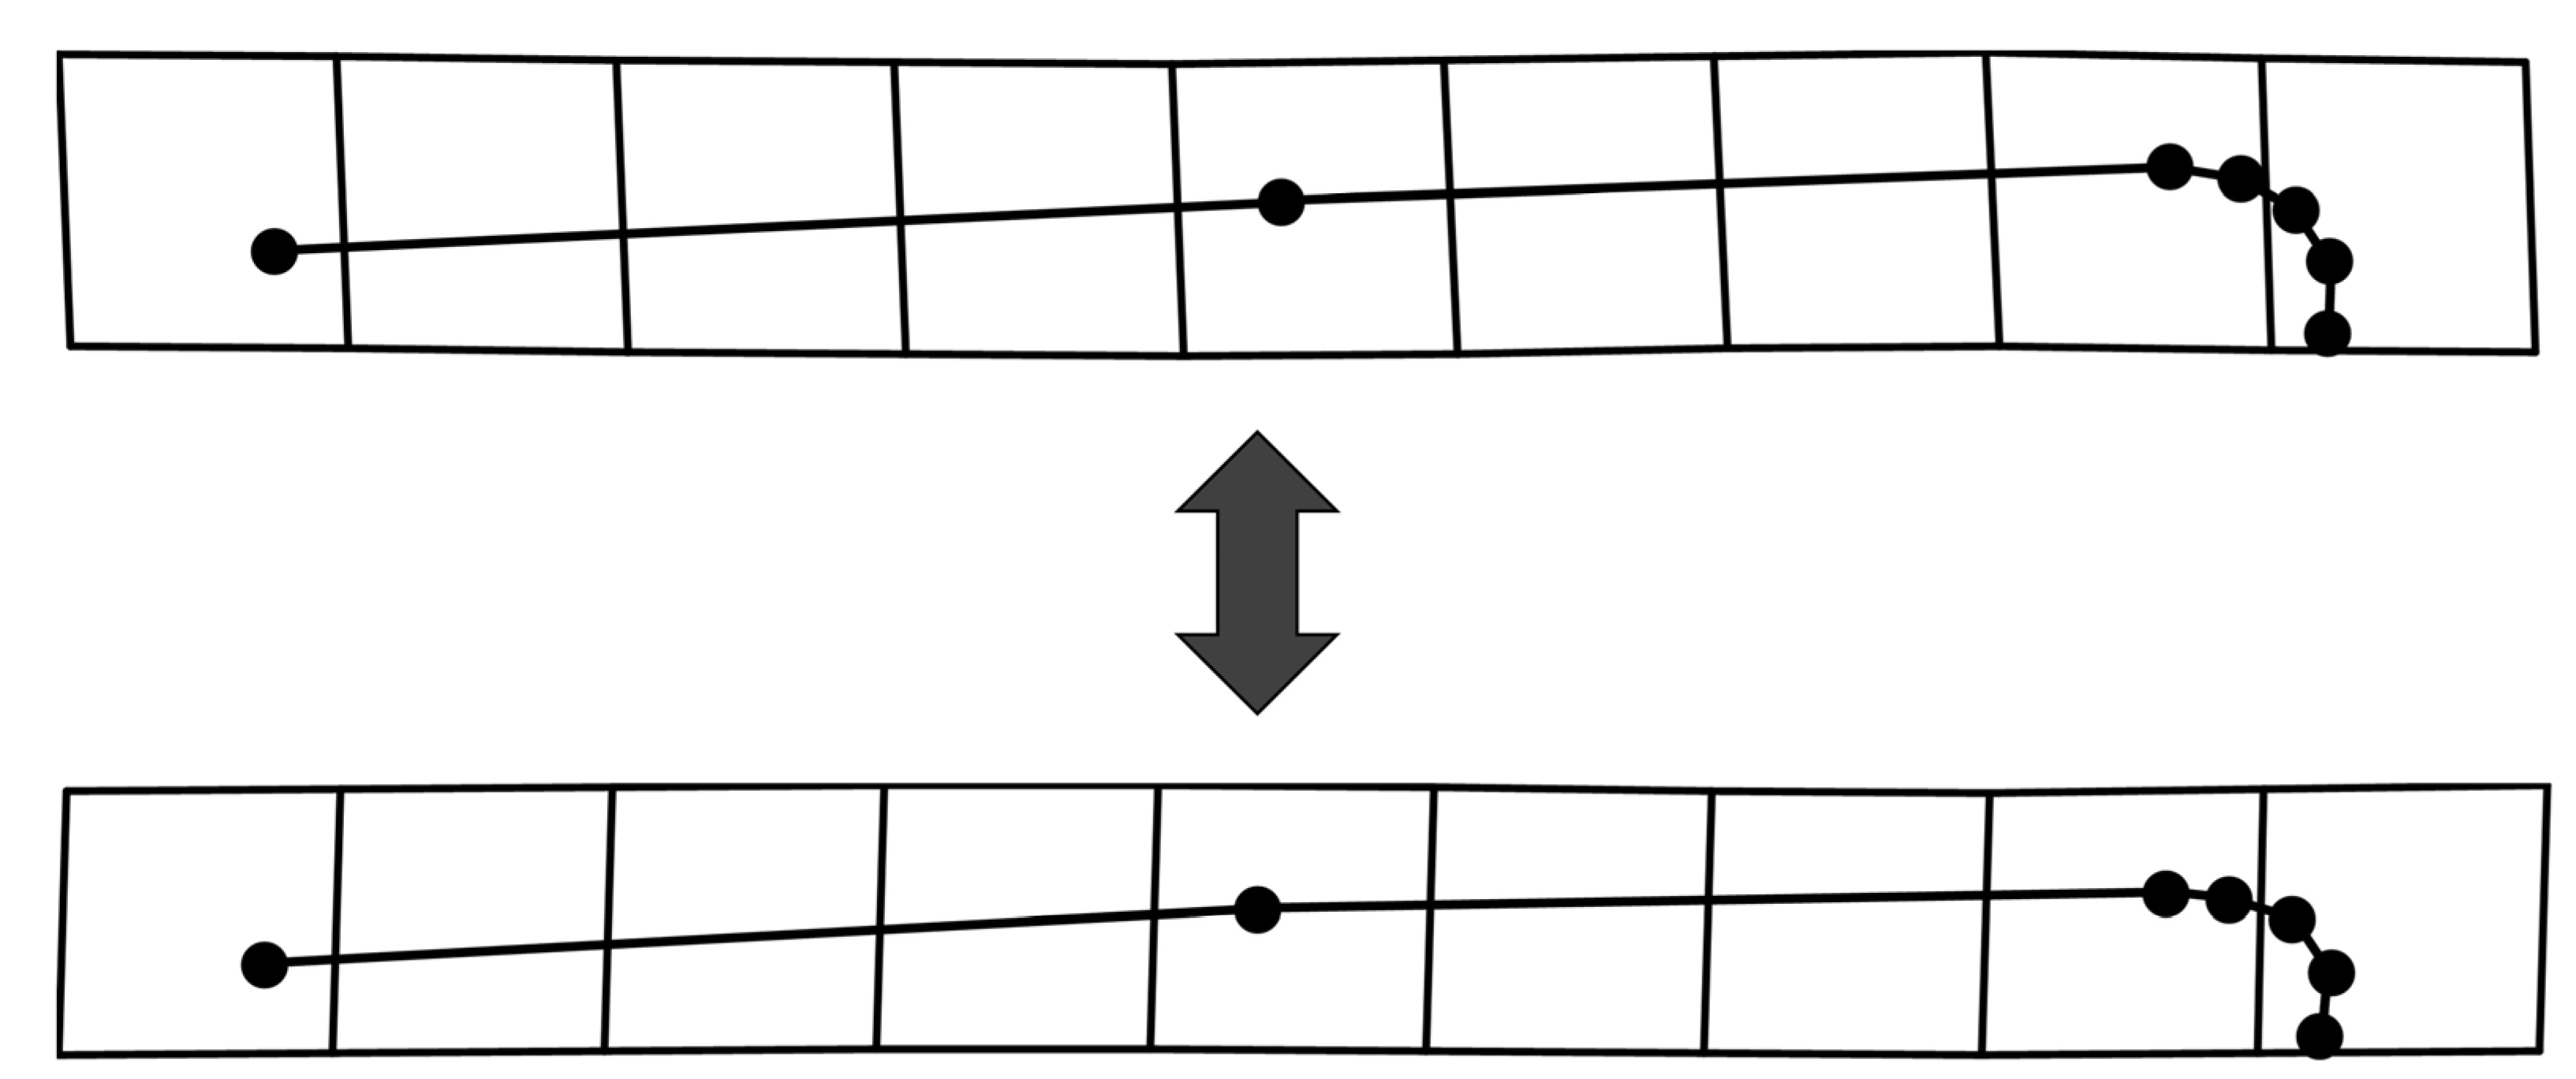
2.2. Geometric Morphometric Analysis

We employed landmark-based geometric morphometrics to quantify gonopodium shape in X. umbratilis [24]. Prior to landmarking, we used Olympus cellSens software [25] to screen images and ensure that specimens were in focus and that the gonopodium was level in the dorso-ventral and anteroposterior axes. We re-photographed specimens to correct any rotation or focus errors and excluded males with damaged or underdeveloped gonopodia from our analysis (n = 3). Additionally, for our analysis, we rotated or flipped images so that all gonopodia were oriented such that they appeared to be dextral. This reduced observer bias by making it impossible to visually distinguish sinistral and dextral gonopodia. In total, 246 males (135 sinistral, 111 dextral) were included in this study.
We used the program tpsDig [26] to digitize landmarks on each specimen and to measure variation in sinistral and dextral gonopodia. We used seven landmarks to outline the shape of the gonopodium (Figure 3). Landmarks were placed by a single researcher on each specimen and specimens were processes in random order.
We generated shape variables from our landmark data in tpsRelw [26]. After producing shape variables using a general Procrustes analysis [27], tpsRelw runs a principal components analysis and calculates relative warps and centroid size. For this analysis, tpsRelw calculated ten relative warps. We used the first six of these relative warps, which accounted for 99.89% of total shape variation, for additional analysis, and excluded four relative warps that accounted for less than 0.5% of variation. Excluding these relative warps allowed us to avoid inflating the degrees of freedom in our shape analysis [28,29].

2.3. Statistical Analysis
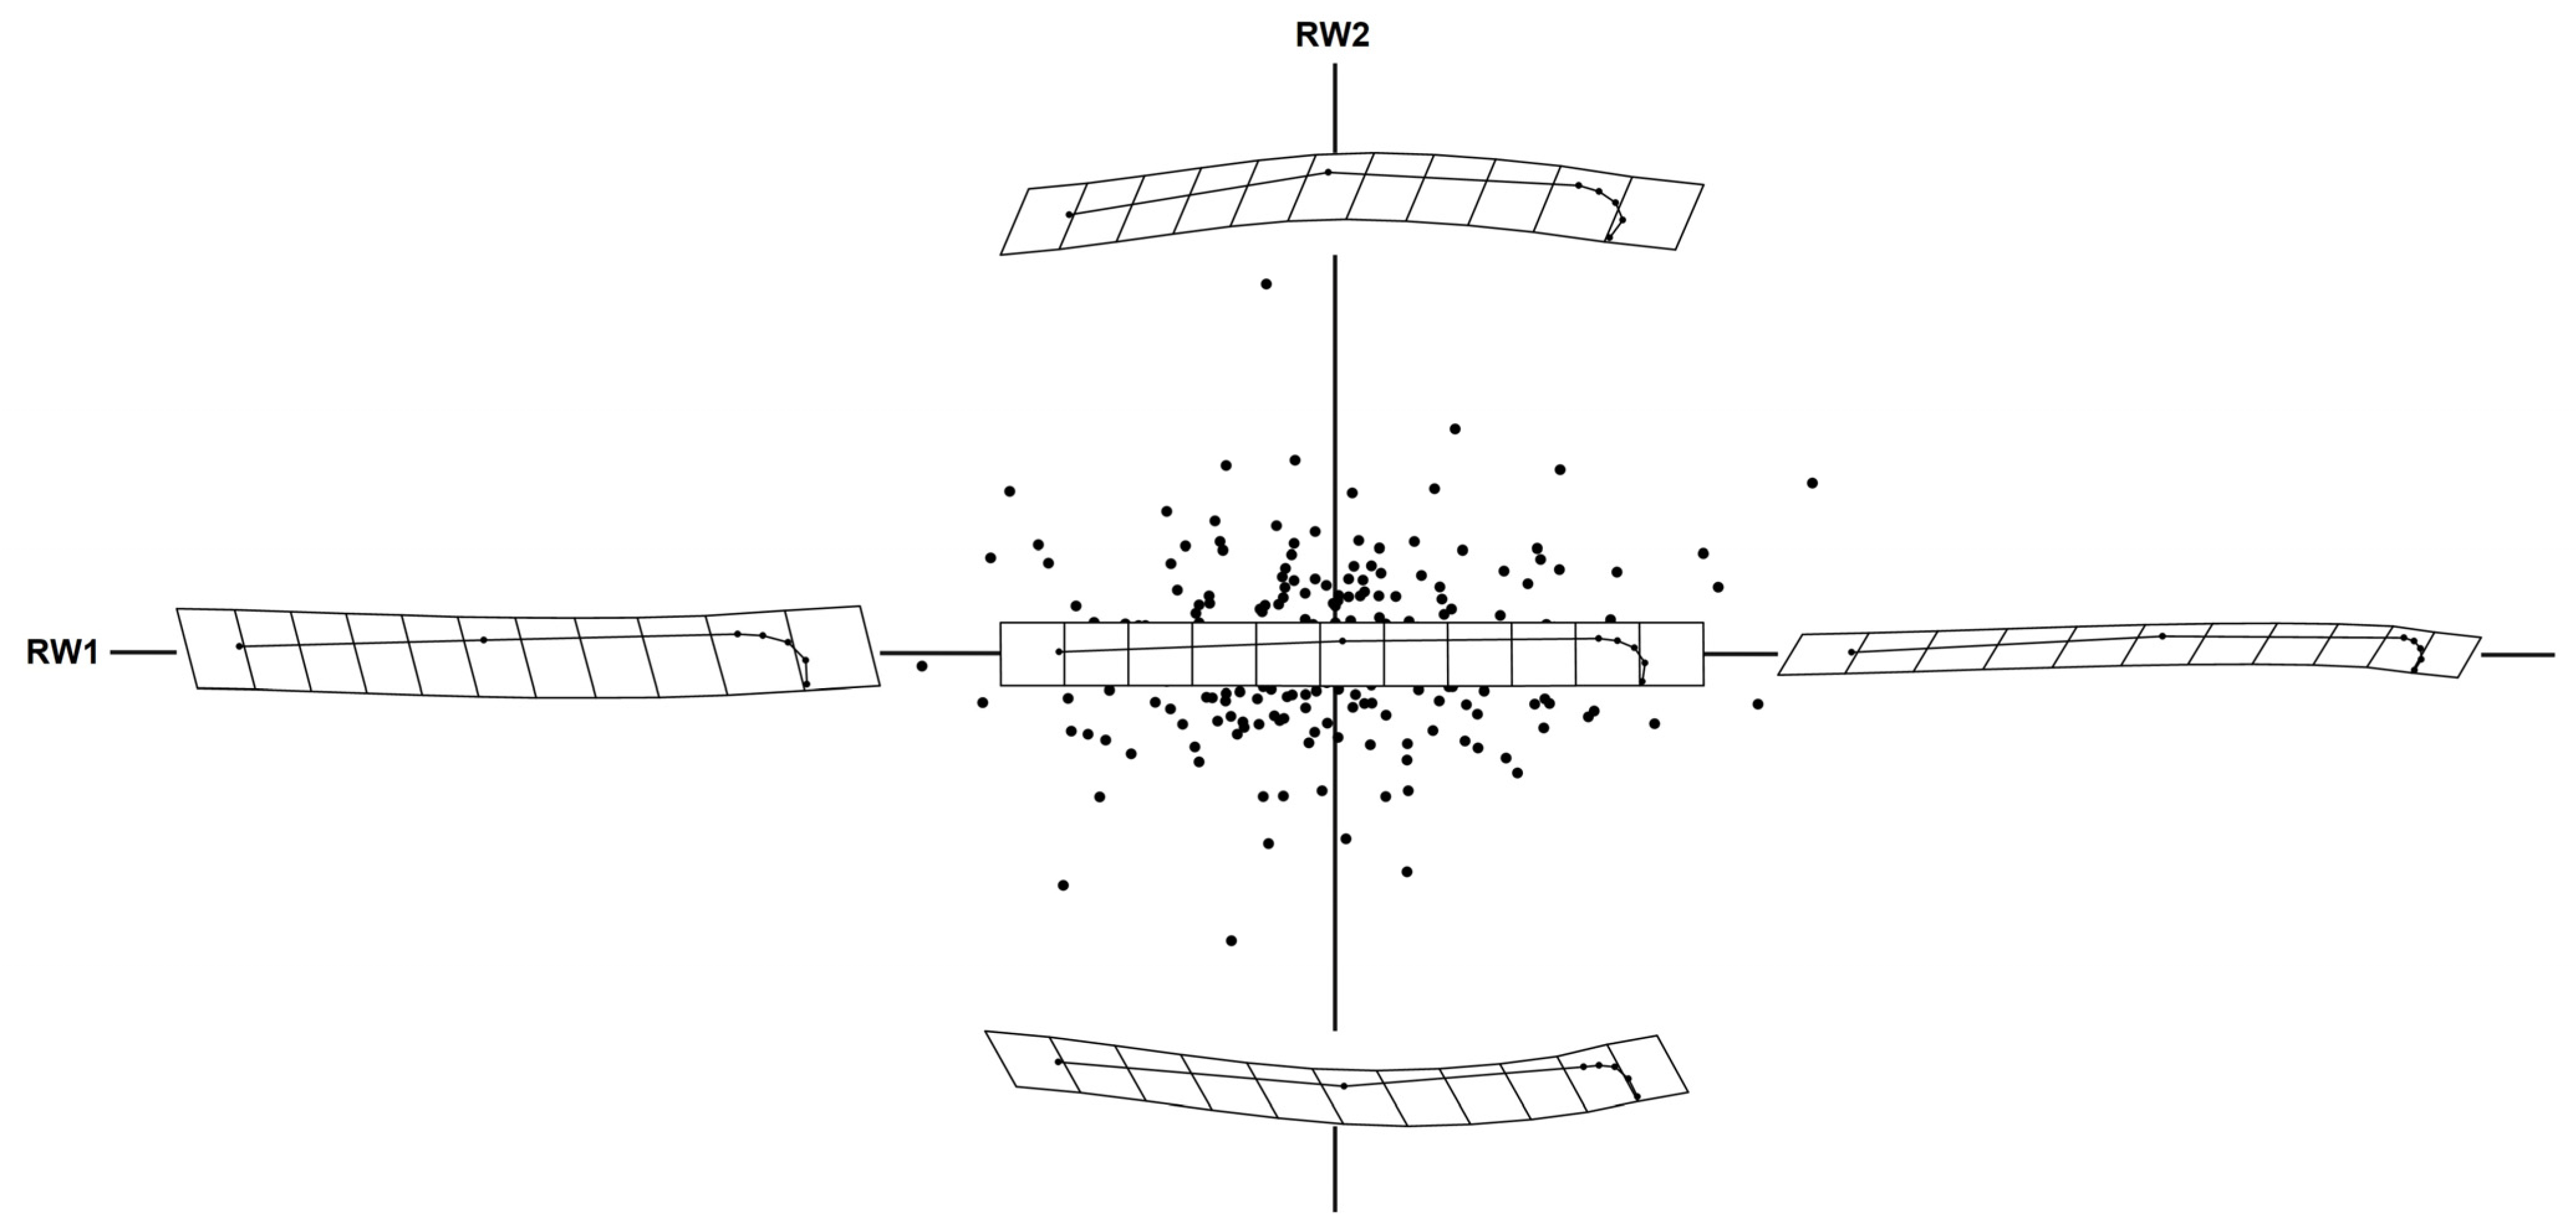
We used a multivariate linear mixed model to evaluate the effects of morph (sinistral or dextral), centroid size (a measure of size commonly used in geometric morphometrics) [30], and locality on shape variation [28,29]. In each analysis, we used relative warps (shape variables) as our response variable. Because relative warps come from a matrix of shape variables, we had to convert the shape variable matrix into columns of vectors to be used in our multivariate linear mixed model. This conversion subsequently required the creation of an index variable that retained individual information for each of the relative warps in our analyses. We included the index variable in our analysis as a predictor variable and it is necessary to meaningfully measure the differences in shape variation between groups. Hence, it is the two-way interactions between morph and the index variable, centroid size and the index variable, locality and the index variable, and the three-way interactions between morph, centroid size and the index variable, and locality, centroid size and the index variable, that allowed us to comprehensively determine what factors significantly influence gonopodium shape variation [31].
To test our hypothesis, we ran three models. We first needed to determine if centroid size and locality were significant predictors of shape variation to inform how we constructed subsequent models that tested for the effect of gonopodial morph on shape. Our first model tested for the impact of centroid size on shape. The second model included centroid size and locality. Our third model tested for the effects of morph and centroid size and included locality as a random effect. Across all three models, relative warps (shape variables) were used as the response variable (see Table 2 for details on each model’s components). We used the Akaike Information Criterion (AIC) to determine which of the three models provided the best fit [32].
We estimated the degrees of freedom in our analyses using the Kenward-Roger method [33] and ran our multivariate linear mixed models in SAS software, using the Proc MIXED protocol (SAS version 9.4, SAS Institute Inc., Cary, NC, USA).

3. Results

Neither morph nor locality were significant predictors of gonopodium shape. That is, we could not reject the hypothesis that the shape of dextral and sinistral gonopodial morphs are the same (Table 3). Gonopodium shape in X. umbratilis did differ significantly by centroid size in both models 1 and 3 (see the two-way interaction between centroid size and the index variable from models 1 and 3 in Table 2). Of the three models, model 2 had the lowest AIC score (−10,768.2) and best fit the data. The terminus of the gonopodium becomes slightly more open moving from the smallest centroid size to the largest (Figure 4). Although a significant predictor, the extent of shape variation that centroid size explains appears to be relatively limited compared to the overall variation in shape captured across Relative Warps 1 and 2 (Figure 5). In other words, the primary difference in gonopodium as a function of centroid size was a slight change at the tip of the gonopodium (Figure 4).

4. Discussion

This study provides insight on variation in antisymmetrical traits. We predicted that the shape of gonopodial curvature would not differ between sinistral and dextral individuals in X. umbratilis and our results support this prediction. We also found that centroid size is a significant predictor of gonopodium shape. Males of many poeciliid species exhibit determinate growth, so this finding suggests that the size at which males mature may affect gonopodium shape [34,35]. However, it seems unlikely that centroid size impacts gonopodium shape in a biologically meaningful way, as the variation due to centroid size is minimal when considered with the overall shape variation in the gonopodium we observed.
Asymmetry is typically considered in a morphological context, though asymmetry can also be demonstrated behaviorally [36]. Previous research in X. umbratilis from Johnson et al. [21] found that gonopodial morphology reliably predicted detour behaviors and eye-bias for potential mates and predators. In that study, dextral (right morph) males detoured to the right to view potential mate and predator stimuli. Sinistral (left morph) males’ behaviors were completely opposite, with males detouring to the left for the same set of stimuli. Our work aligns with these observed patterns. We found that sinistral and dextral gonopodial morphs were essentially mirror images of each other, which is consistent with a specific morph type predicting detour behavior in this species. Another study found that individuals from a fixed sinistral population of X. umbratilis preferentially positioned themselves wherein males were primarily on the left side of a female during mating interactions [37]. However, individuals from fixed dextral populations did not display side-biased positioning behavior. Our results provide some context for the strong side-bias in the sinistral population and the lack of side-bias in the dextral population by ruling out the possibility that unequal degrees of curvature in the gonopodium influenced mating positioning behaviors.
A critical component of studying morphology and its evolutionary implications is tying morphology to function and fitness. Though the gonopodium certainly is important to fitness in X. umbratilis, very little is understood about the actual mechanisms that facilitate insemination in this species and livebearing fish in general. Given that dextral and sinistral gonopodia are essentially mirror images of each other, we might expect that functional behavior associated with fertilization in this species will also reflect antisymmetry in the gonopodium. Future work should focus on understanding the mechanisms involved in copulation and how this compares between gonopodial morphs.

Supplementary Materials

The following supporting information can be downloaded at: https://www.mdpi.com/article/10.3390/sym15020489/s1.

Author Contributions

Conceptualization, M.-E.N., J.B.J.; investigation, M.-E.N.; data curation, M.-E.N.; formal analysis, M.-E.N.; visualization, M.-E.N.; writing—original draft preparation, M.-E.N.; writing—review and editing, M.-E.N. and J.B.J. All authors have read and agreed to the published version of the manuscript.

Funding

This research received no external funding.

Data Availability Statement

The data presented in this study are available in a supplementary material file.

Acknowledgments

We thank Riley Nelson and Tanner Van Orden for providing microscope and imaging software, and for assistance photographing specimens, respectively. We also thank Mark Belk for his help with image screening and data analysis.

Conflicts of Interest

The authors declare no conflict of interest.

References

  1. Møller, A.; Milinski, M.; Slater, P. Stress and Behavior (Advances in the Study of Behavior); Academic Press: London, UK, 1998; Volume 27. [Google Scholar]
  2. Parsons, P. Fluctuating asymmetry: A biological monitor of environmental and genomic stress. Heredity 1992, 68, 361–364. [Google Scholar] [CrossRef] [PubMed]
  3. Møller, A.P. Parasitism and developmental instability of hosts: A review. Oikos 1996, 77, 189–196. [Google Scholar] [CrossRef]
  4. Van Valen, L. A study of fluctuating asymmetry. Evolution 1962, 16, 125–142. [Google Scholar] [CrossRef]
  5. Ludwig, W. Das Rechts-Links-Problem im Tierreich und Beim Menschen: Mit Einem Anhang Rechts-Links-MERKMALE der Pflanzen; Springer: Berlin/Heidelberg, Germany, 2013; Volume 27. [Google Scholar]
  6. Møller, A. Fluctuating asymmetry in male sexual ornaments may reveal male quality. Mammal Rev. 1990, 5, 121–172. [Google Scholar] [CrossRef]
  7. Andersson, M. Sexaul selection, natural selection, and quality advertisement. Biol. J. Linn. Soc. 1982, 17, 375–393. [Google Scholar] [CrossRef]
  8. Roldan, E.R.S.; Cassinello, J.; Abaigar, T.; Gomendio, M. Inbreeding, fluctuating asymmetry, and ejaculate quality in an endangered ungulate. Proc. R. Soc. London. Ser. B Biol. Sci. 1998, 265, 243–248. [Google Scholar] [CrossRef]
  9. Palmer, A.R.; Strobeck, C. Fluctuating asymmetry as a measure of developmental stability: Implications of non-normal distributions and power of statistical tests. Acta Zool. Fenn. 1992, 191, 13. [Google Scholar]
  10. Leamy, L. Morphometric studies in inbred and hybrid house mice. V. Directional and fluctuating asymmetry. Am. Nat. 1984, 123, 579–593. [Google Scholar] [CrossRef]
  11. Graham, J.H.; Freeman, D.C.; Emlen, J.M. Antisymmetry, directional asymmetry, and dynamic morphogenesis. In Developmental instability: Its Origins and Evolutionary Implications; Springer: Berlin/Heidelberg, Germany, 1994; pp. 123–139. [Google Scholar]
  12. Palmer, A.R. Animal asymmetry. Curr. Biol. 2009, 19, R473–R477. [Google Scholar] [CrossRef]
  13. Hansen, T.F.; Pélabon, C.; Houle, D. Heritability is not Evolvability. Evol. Biol. 2011, 38, 258–277. [Google Scholar] [CrossRef]
  14. Falconer, D.S. Introduction to Quantitative Genetics; Pearson Education India: Noida, India, 1996. [Google Scholar]
  15. Houle, D. Comparing evolvability and variability of quantitative traits. Genetics 1992, 130, 195–204. [Google Scholar] [CrossRef]
  16. Meek, S.E. New Species of Fishes from Costa Rica; Field Museum of Natural History: Chicago, IL, USA, 1912. [Google Scholar] [CrossRef]
  17. Rosen, D.E.; Bailey, R.M. The poeciliid fishes (Cyprinodontiformes): Their structure, zoogeography, and systematics. Bull. Am. Mus. Nat. Hist. 1963, 126, 1–17. [Google Scholar]
  18. Langerhans, R.B. Genital evolution. Ecol. Evol. Poeciliid Fishes 2011, 572, 228–240. [Google Scholar]
  19. Rosen, D.E.; Gordon, M. Functional anatomy and evolution of male genitalia in Poeciliid fishes. Zool. Sci. Contrib. N. Y. Zool. Soc. 1953, 38, 1–47. [Google Scholar] [CrossRef]
  20. Bussing, W.A. Freshwater Fishes of Costa Rica/Peces de Las Aguas Continentales de Costa Rica, 2nd ed.; Editorial de la Universidad de Costa Rica: San José, Costa Rica, 1998. [Google Scholar]
  21. Johnson, E.S.; Nielsen, M.-E.; Johnson, J.B. Does asymmetrical gonopodium morphology predict lateralized behavior in the fish Xenophallus umbratilis? Front. Ecol. Evol. 2020, 8, 606856. [Google Scholar] [CrossRef]
  22. AVMA. AVMA Guidelines on Euthanasia, Formerly Report of the AVMA Panel on Euthanasia. 20; AVMA: Washington, DC, USA, 2007. [Google Scholar]
  23. Nickum, J.; Bart, H., Jr.; Bowser, P.; Greer, I.; Hubbs, C.; Jenkins, J.; MacMillan, J.; Rachlin, J.; Rose, J.; Sorensen, P. Guidelines for the Use of Fishes in Research; American Fisheries Society: Bethesda, MD, USA, 2004. [Google Scholar]
  24. Bookstein, F.L. Morphometric Tools for Landmark Data: Geometry and Biology; Cambridge University Press: Cambridge, UK, 1992. [Google Scholar] [CrossRef]
  25. Olympus. Olympus CellSens Software, RRID:SCR_014551; Olympus: Tokyo, Japan, 2016.
  26. Rohlf, F.J. The tps series of software. Hystrix Ital. J. Mammal. 2015, 26, 9–12. [Google Scholar] [CrossRef]
  27. Rohlf, F.J.; Slice, D. Extensions of the Procrustes method for the optimal superimposition of landmarks. Syst. Biol. 1990, 39, 40–59. [Google Scholar] [CrossRef]
  28. Roth-Monzón, A.J.; Belk, M.C.; Zúñiga-Vega, J.J.; Johnson, J.B. Beyond pairwise interactions: Multispecies character displacement in Mexican freshwater fish communities. Am. Nat. 2020, 195, 983–996. [Google Scholar] [CrossRef]
  29. Williams, T.J.; Johnson, J.B.; Belk, M.C. Interaction between predation environment and diet constrains body shape in Utah chub, Gila atraria (Cypriniformes: Cyprinidae). Biol. J. Linn. Soc. 2017, 122, 147–156. [Google Scholar] [CrossRef]
  30. Mosimann, J.E. Size allometry: Size and shape variables with characterizations of the lognormal and generalized gamma distributions. J. Am. Stat. Assoc. 1970, 65, 930–945. [Google Scholar] [CrossRef]
  31. Searle, P.C.; Mercer, M.; Habit, E.; Belk, M.C. Ontogenetic shape trajectory of Trichomycterus areolatus varies in response to water velocity environment. PLoS ONE 2021, 16, e0252780. [Google Scholar] [CrossRef] [PubMed]
  32. Akaike, H. A new look at the statistical model identification. IEEE Trans. Autom. Control 1974, 19, 716–723. [Google Scholar] [CrossRef]
  33. Kenward, M.G.; Roger, J.H. Small sample inference for fixed effects from restricted maximum likelihood. Biometrics 1997, 53, 983–997. [Google Scholar] [CrossRef] [PubMed]
  34. Arendt, J.D.; Reznick, D.N. Evolution of juvenile growth rates in female guppies (Poecilia reticulata): Predator regime or resource level? Proc. R. Soc. B Biol. Sci. 2005, 272, 333–337. [Google Scholar] [CrossRef]
  35. Reznick, D.; Hrbek, T.; Caura, S.; De Greef, J.; Roff, D. Life history of Xenodexia ctenolepis: Implications for life history evolution in the family Poeciliidae. Biol. J. Linn. Soc. 2007, 92, 77–85. [Google Scholar] [CrossRef]
  36. Wiper, M.L. Evolutionary and mechanistic drivers of laterality: A review and new synthesis. Laterality 2017, 22, 740–770. [Google Scholar] [CrossRef]
  37. Nielsen, M.-E.; Johnson, E.S.; Johnson, J.B. Does male gonopodial morphology affect male-female mating positioning in the livebearing fish Xenophallus umbratilis? PLoS ONE 2023, 18, e0281267. [Google Scholar] [CrossRef]
Figure 1. Photographs of ventral view male specimens with sinistral (A) and dextral (B) gonopodia.
Symmetry 15 00489 g001
Figure 2. Map of the ten localities sampled in Costa Rica. Rivers and tributaries are shown in gray and localities are denoted by black dots. Localities were sampled between 2005 and 2007. Image generated with ArcGIS.
Symmetry 15 00489 g002
Figure 3. Landmark placement used to analyze gonopodium shape in X. umbratilis. Landmarks were placed as follows: (1) origin of the gonopodium; (2) terminus of the gonopodium; (3) point of curvature at the tip of the shaft; (4) midpoint between landmarks one and two; (5) midpoint between landmarks two and three on the terminus; (6) midpoint between landmarks three and five; and (7) midpoint between landmarks five and two. Landmarks one and two are homologous; landmark three is a pseudo-landmark; and landmarks four, five, six, and seven are sliding landmarks.
Symmetry 15 00489 g003
Figure 4. Variation in gonopodium shape explained by centroid size. Shape deformation is represented by thin plate splines. The top thin plate spline visualizes shape at the largest centroid in this dataset and the bottom thin plate spline visualizes the shape at the smallest centroid size.
Symmetry 15 00489 g004
Figure 5. Visualization of gonopodium shape variation along Relative Warp 1 (RW1) and Relative Warp 2 (RW2). Thin plate splines along the x-axis represent shape deformation across Relative Warp 1. Moving from left to right, these splines show the terminus of the gonopodium becoming more tightly curved. Thin plate splines along the y-axis represent shape deformation across Relative Warp 2. These splines show some bending in the midpoint of the gonopodium shaft and some changes in the curvature of the gonopodium tip.
Symmetry 15 00489 g005
Table 1. Population identification and location information.
PopulationMuseum IDTributary/RiverCoordinates
1009294cRio Corinto10°12.674′ N 83°53.114′ W
2009301bRio Esquivetto10°41.231′ N 85°04.002′ W
3009302Trib. to Rio Bijagua10°43.887′ N 85°03.318′ W
4009310Rio Tenerio10°41.285′ N 85°04.561′ W
5009320Trib. to Rio Bijagua10°43.453′ N 85°03.982′ W
6009325Quebrada Hormiguero10°41.454′ N 85°05.019′ W
7009338cQuebrada La Palma10°33.614′ N 84°56.442′ W
8009339Quebrada Hormiguero10°41.445′ N 85°05.036′ W
9009340Quebrada Isabel10°38.387′ N 84°50.757′ W
10009354Quebrada Azul10°29.955′ N 84°59.138′ W
Table 2. Variables used in each model of the multivariate linear model analysis.
Response VariableRandom EffectPredictor Variable
Model 1Relative Warps--Centroid Size
Index
Centroid Size × Index
Model 2Relative Warps--Locality
Centroid Size
Centroid Size × Locality
Index
Locality × Index
Centroid Size × Index
Locality × Centroid Size × Index
Model 3Relative WarpsLocalityMorph
Centroid Size
Centroid Size × Morph
Index
Morph × Index
Centroid Size × Index
Morph × Centroid Size × Index
Table 3. Results from the multivariate linear mixed model analysis. We ran three different models with different combinations of predictor variables. Predictor variable terms that include an interaction with the index variable are those that evaluate if/how gonopodium shape changes.
Predictor VariableDegrees of FreedomF-Valuep-Value
Model 1Centroid Size1, 7026.440.0113
Index5, 6574.90.0002
Centroid Size × Index5, 6574.820.0002
Model 2Locality9, 7941.020.4226
Centroid Size1, 7941.250.2365
Centroid Size × Locality9, 7941.040.4092
Index5, 6592.040.0718
Locality × Index45, 11830.980.5024
Centroid Size × Index5, 6592.070.0671
Locality × Centroid Size × Index45, 11830.980.5188
Model 3Morph1, 7040.010.9238
Centroid Size1, 6195.090.0244
Centroid Size × Morph1, 7030.040.8391
Index5, 6533.260.0065
Morph × Index5, 6531.390.2273
Centroid Size × Index5, 6533.070.0095
Morph × Centroid Size × Index5, 6531.230.0095
Disclaimer/Publisher’s Note: The statements, opinions and data contained in all publications are solely those of the individual author(s) and contributor(s) and not of MDPI and/or the editor(s). MDPI and/or the editor(s) disclaim responsibility for any injury to people or property resulting from any ideas, methods, instructions or products referred to in the content.

