Article

Multiwavelength Analysis of the IceCube Neutrino Source Candidate Blazar PKS 1424+240

1
Theoretical Physics IV: Plasma-Astroparticle Physics, Faculty for Physics & Astronomy, Ruhr University Bochum, 44780 Bochum, Germany
2
Faculty for Physics & Astronomy, Astronomical Institute, Ruhr University Bochum, 44780 Bochum, Germany
3
Ruhr Astroparticle and Plasma Physics Center (RAPP Center), Ruhr-Universität Bochum, 44780 Bochum, Germany
4
Konkoly Observatory, ELKH Research Centre for Astronomy and Earth Sciences, Konkoly Thege Miklósút 15-17, H-1121 Budapest, Hungary
5
MTA Centre of Excellence, Konkoly Thege Miklósút 15-17, H-1121 Budapest, Hungary
6
Department of Astronomy, ELTE Eötvös Loránd University, Pázmány Péter sétány 1/A, H-1117 Budapest, Hungary
*
Author to whom correspondence should be addressed.
Symmetry 2023, 15(2), 270; https://doi.org/10.3390/sym15020270
Submission received: 14 December 2022 / Revised: 13 January 2023 / Accepted: 16 January 2023 / Published: 18 January 2023
(This article belongs to the Section Physics)

Abstract

:
The true nature of sources of cosmic neutrinos recorded by the Antarctic IceCube Neutrino Detector is still an enigma of high-energy astrophysics. Time-integrated neutrino source searches with the 10 years of IceCube data unfolded neutrino hot-spots of the sky; among them, one is associated with the blazar PKS 1424+240, which is the third most significant neutrino source candidate in the Northern sky. In this paper, we analyze VLBI radio data of PKS 1424+240 taken with the Very Large Baseline Array at 15 GHz as part of the MOJAVE Survey. We generate the adaptively binned gamma-ray light curve of the source, employing Fermi-LAT data between 100 MeV and 300 GeV. We find that the VLBI jet components maintain quasi-stationary core separations at 15 GHz. We find a quiescence and a perturbed phase of the VLBI core of PKS 1424+240, based on that its Doppler factor increased tenfold after 2016 compared to the quiescence phase. We do not find elevated gamma-ray activity after 2016, while archive Swift-XRT measurements show a highly increased 0.3–10 keV X-ray flux in the beginning of 2017. Substantial increase of the activity of the radio core might help us to identify episodes of particle acceleration in lepto-hadronic blazar jets that eventually lead to the emission of high-energy neutrinos.

1. Introduction

Ultra-high-energy cosmic rays (UHECRs) are energetic subatomic particles with a kinetic energy far beyond anything that can be delivered by an experiment on Earth [1,2,3,4,5]. Their sources still remain an unsolved mystery of high-energy astrophysics. High-energy neutrinos are produced in high-energy (photo-)hadronic interaction processes (e.g., [6]), in the interaction of cosmic rays with either a photon or a gas target. Enhanced gamma-ray emission from the decay of neutral pions accompanies the emission of neutrinos born in charged current pion production. Therefore, UHECRs, high-energy neutrinos, and high-energy gamma photons should be observed together from cosmic particle accelerators, if there were no horizon for the UHECRs and high-energy photons, as we will see later.
Since neutrinos interact only weakly with matter, they are able to pinpoint cosmic high-energy particle accelerators in the sky that would be otherwise hidden, because UHECRs scatter due to the galactic and intergalactic fields (e.g., [7]), while their flux is strongly attenuated beyond the Greisen–Zatsepin–Kuzmin (GZK) horizon (e.g., [8,9,10,11,12,13]). The spatial scale of the GZK horizon is a few 10–100 Mpc at high energies. For example, for particle energies E > 10 20 eV, the survived fraction of protons is only ∼5% at 100 Mpc [14]. High-energy gamma-photons lose also their energy on their way to Earth in interactions with the photons of the cosmic microwave background (CMB). Since neutrino emission is expected to be beamed, and pc-scale radio jets of blazars are pointed toward the observer, the idea naturally comes that blazars, one of the most powerful cosmic accelerators, should be strong sources of high-energy neutrinos. To date, there are two confirmed high-energy neutrino sources: the blazar TXS 0506+056 [15] and the Seyfert-galaxy NGC 1068 [16].
The time-integrated analysis with 10 years of IceCube data covers the time range from 6 April 2008 to 10 July 2018 [17]. The analysis targets astrophysical muon neutrinos and antineutrinos which undergo charged current interactions in the Antarctic ice to produce muons in the IceCube detector. From the population study with the Fermi-LAT (8 years) 4FGL catalog, a post-trial p-value of 4.8 × 10 4 emerged for the Northern catalog of 97 objects, which provides a 3.3 σ inconsistency with a background-only hypothesis for the catalog [17]. The third most significant source, PKS 1424+240, is our target source in this study. The physical motivation to focus on this particular source is that identification and multiwavelength characterization of possible sources of high-energy neutrinos helps to understand the cosmic sources themselves. This enables to pinpoint possible sources of UHECR emission, ultimately helping to understand cosmic acceleration of hadronic particles.
PKS 1424+240 is a BL Lac object, being the third most strong neutrino source candidate in the time-integrated analysis with the ten years of IceCube data. The best-fit number of astrophysical neutrino events for this source is n ^ s = 41.5 , and best-fit astrophysical power-law spectral index is γ ^ = 3.9 , while the local pretrial p-value =  0.00158 . PKS 1424+240 is categorized as an high-synchrotron-peaked (HSP) BL Lac, with a synchrotron peak above 10 15 Hz and an isotropic luminosity above 400 GeV of 1.03 × 10 44 erg s 1 [18]. This TeV source was observed by MAGIC (e.g., [19]) and VERITAS (e.g., [18]). Studies suggest that this source might be one of the most distant VHE sources (e.g., [20]). PKS 1424+240 is similar to TXS 0506+056, in that it is also a masquerading BL Lac object, i.e., intrinsically a flat-spectrum radio quasar with hidden broad lines and a standard accretion disc [21]. The classification of masquerading BL Lacs is based on the location on the radio power–emission line power, radio power P 1.4 GHz > 10 26 W Hz 1 , the Eddington ratio L / L E d d > 0.03 , and  γ -ray Eddington ratio L γ / L E d d > 2 [21,22]. PKS 1424+240 might belong in a rare subclass of blazars that are characterized by combination of proton-loaded jets and efficient particle acceleration processes, favoring neutrino production in these sources [21]. As it was pointed out by [21], PKS 1424+240 and TXS 0506+056 have several similarities: they are powerful IBLs/HBLs, the normalization and shape of their SED are similar, as are their parsec scale properties and their extended radio power. However, they have differences in their radio morphology, TXS 0506+056 being unresolved on kpc-scales, while PKS 1424+240 shows extended, two-sided jet structure [21].
Though a significant connection has not yet unfolded (e.g., [23,24]), studies of particular individual radio-loud samples associated with high-energy cosmic neutrinos (e.g., [25,26,27,28,29,30,31,32,33]), as well as stacked analyses [34] suggest that radio observations should play an important role in the understanding of the sources of astrophysical neutrinos. PKS 1424+240 is a bright, flat-spectrum radio-loud source with flux density 0.35 Jy at 2.7 GHz and 0.31 Jy at 5 GHz radio frequency in the Parkes Catalog [35]. At milliarcsecs(mas)-scales, this radio source appears as a core plus one-sided jet [36]. These findings motivates us to study PKS 1424+240 on radio wavelenghts, utilizing very long baseline interferometry observations about this particular source. Radio astronomical observations can help us in the correct interpretation of the high-energy neutrino candidate sources, and VLBI is proven to be a highly successful technique to observe radio-loud AGN on mas scales which resolution is unprecedented in astronomy.
In blazar environments, the electron Lorentz factor is highly relativistic ( γ > > 1 ), rendering the energy of photons absorbing pionic γ -rays to keV, MeV, or even GeV regime. Hadronic γ -rays produced in photon-rich environments, such as AGN, may lose energy through electromagnetic cascading, which results in a high flux emitted in the hard X-ray to MeV range (e.g., [37,38,39,40,41]). An evolution model for AGN, black holes, and galaxies was developed that fit the X-ray (extending to 100 keV), the FIR, and optical backgrounds [42,43]. The X-ray background is the only part where their model needs blazars. They also did find that half of all AGN are Compton thick, across all luminosities. Compton thick implies a column of 10 24 cm 2 or more, and also implies optically thick medium for gamma–gamma interactions (e.g., [44]). All of these imply that X-rays should be somehow connected to Fermi’s gamma-ray sky and IceCube’s high-energy neutrino sky. These findings motivate us to study PKS 1424+240 on X-ray energies.
In this paper, we study the pc- and kpc-scale radio jet, as well as the gamma-ray variability of PKS 1424+240, all together with archive Swift-XRT observations. The structure of the paper is as follows. In Section 1, we give an introduction of the topic. In Section 2, we present our analysis of multiwavelength data, while in Section 3, Section 4 and Section 5, we present the results in the gamma, radio, and X-rays regimes, respectively. In Section 6, we discuss our results, while in Section 7, we give our conclusions.

2. Analysis of Multiwavelength Data

2.1. Analysis of Fermi-LAT Data

The Fermi Gamma-ray Space Telescope is one of the most successful telescopes in the gamma-ray regime. Its main instrument, the Large Area Telescope (LAT), is most sensitive between 20 MeV and 300 GeV energies [45], and its field of view is an enormous 2 steradians. The telescope surveys the entire sky in about 3 h, with a location accuracy of 1 arcmin for bright objects for LAT.
In this study, we employed one year of Pass8 Fermi-LAT (https://fermi.gsfc.nasa.gov/science/instruments/lat.html, accessed on 17 June 2021) data (https://fermi.gsfc.nasa.gov/ssc/data/analysis/documentation/Pass8_usage.html, accessed on 17 June 2021) of 4FGL J1427.0+2348, associated with PKS 1424+240, between 100 MeV and 300 GeV. The low-energy cutoff is at 100 MeV due to the strong contamination of the galactic background below 100 MeV. The time range was from 4 August 2008 15:43:36.000 UTC (MJD 54682.65527) to 17 June 2021 11:31:38.000 UTC (MJD 59382.48030). We selected event type “front + back” (evtype = 3), which is the recommended type for a point source analysis. The region of interest (ROI) was 15 .
We performed unbinned likelihood analysis of the Fermi-LAT data, employing the fermipy v1.0.1 and ScienceTools v2.0.8 packages, both built in the FermiBottle Docker container and analysis environment provided by the Fermi Science Support Center (FSSC) (https://github.com/fermi-lat/FermiBottle, accessed on 17 June 2021). The analysis was carried out on a cluster of 16 vCPU-s (Intel Skylake 16 × 2.2 GHz) of the ELKH Cloud (https://science.cloud.hu/, accessed on 17 June 2021). We employed the instrument response function P8R3_SOURCE_V2, with templates of the Galactic interstellar emission model (gll_iem_v07.fits) and of the isotropic diffuse emission (iso_P8R3_SOURCE_V2_v1.txt) (https://fermi.gsfc.nasa.gov/ssc/data/access/lat/BackgroundModels.html, accessed on 17 June 2021). We applied the data quality cut (DATA_QUAL > 0) && (LAT_CONFIG==1), and a zenith angle cut as θ < 90 , to eliminate Earth limb events. We filtered out time intervals when the Sun was closer than 15 to our target source, PKS 1424+240.
We measured the detection level of each source in the ROI by calculating the test statistics (TSs) for the specific sources [46]. New sources were identified above the detection limit T S min = 16 (roughly ∼4 σ ). The test statistic T S can be calculated as T S = 2 l n ( L max , 0 / L max , 1 ) , where L m a x , 0 ( L max , 1 ) is the maximum likelihood value without (with) an additional source at a specified location. In our analysis, the the normalization factor of the galactic and isotropic diffuse components and sources with T S > 25 was freed. Additional sources (that were not in the ten-years Fermi-LAT point source catalog, 4FGL-DR2, but were detected in our analysis, see in Table A1) were modeled by power-law flux profiles, as mentioned above, and these were included in the ROI when generating the light curve of PKS 1424+240. The minimum separation allowed between two new individual point sources in the ROI was set to 0.3 deg (roughly one tenth of the point-spread-function (PSF) of Fermi-LAT’s [45].

2.2. Analysis of VLBA/MOJAVE Data

To unfold the morphology and kinematics of the VLBI jet of PKS 1424+240, we reanalyzed calibrated visibilities between 2009.33 and 2020.91 in 28 epochs taken with the Very Large Baseline Array (VLBA) interferometric array at 15 GHz observing frequency, provided by the Monitoring Of Jets in Active galactic nuclei with VLBA Experiments (MOJAVE) program [36]. MOJAVE publishes fully self-calibrated visibilities, and we performed the imaging and model fitting of these data employing the DIFMAP software [47]. All unflagged data were used. A summary of the image parameters of the observing epochs is given in Table A2 in the Appendix A. We list the modelfit results in Table A3.
To minimize the degrees of freedom of the modelfitting, we used circular Gaussian jet components to describe the surface brightness distribution of the jet. Components were added to the model until reaching a reasonably small signal-to-noise ratio (SNR 5 ). The fitted parameters were the total flux density, the position of the peak flux density, and the FWHM size of the jet components. The errors were calculated as in [48,49]. The components were identified by requiring their appearance in at least five subsequent epochs, and smooth changes of their fitted parameters (especially the fitted positions and flux densities). The components are labeled with the letter ‘C’ and a number, such that a larger number denotes a component further from the VLBI core.

2.3. Archive Swift-XRT Observations

To elaborate on the behavior of PKS 1424+240 in the time domain at X-ray energies, we use the public X-ray light curve obtained by the Swift X-ray Telescope (XRT), onboard the Neil Gehrels Swift Observatory (launched in 2004), which covers the energy range of 0.3–10 keV. The Swift-XRT Monitoring of Fermi-LAT Sources of Interest (https://www.swift.psu.edu/monitoring/, accessed on 17 June 2021) monitoring program provides up-to-date X-ray light curves of 255 bright Fermi gamma sources, such that the list is heavily dominated by blazars [50].

3. Results of the Analysis of the Fermi-LAT Observations

3.1. Fermi Light Curve

To obtain more information about variability in the light curves, we applied the adaptive-binning algorithm [51], setting the relative flux uncertainty to be 15%. The algorithm optimizes the accumulation time of photons (i.e., set the bin-width of the light curve) to achieve a constant uncertainty (or constant significance) of the mean photon flux inside the bins. The mean photon flux is estimated through a procedure maximizing the likelihood inside the respective bin. To better understand significant variations in the light curve, we applied the Bayesian block algorithm [52] to them. This algorithm provides a representation of the light curve with a series of blocks, over which the photon flux is constant to within the observational errors. Following Garrappa [53], we set the relative frequency of the algorithm, reporting the presence of a change point in the light curve with no signal present to p = 0.05 .
We show the Fermi-LAT light curve of PKS 1424+240 in the middle panel of Figure 1. The source photon flux exceeds 10 7 ph cm 2 s 1 between 100 MeV–300 GeV, making one of the most bright gamma-sources of the Fermi-sky. Based on the Bayesian blocks, four flares are unfolded by the light curve: one at about 2009, one between 2010.5 and 2012.3, one at the end of 2014, and one at the end of 2016.

3.2. SED Analysis

The spectral energy distribution ( E 2 d N / d E ) of PKS 1424+240 (redshift z = 0.6047 [54]) was derived from the differential flux which is best described by a logparabola shape as:
d N d E = ϕ 0 E E 0 α β ln E / E 0 ,
where ϕ 0 is the prefactor, α is the index, β is the curvature parameter, and E 0 is the scale parameter. The SED of 4FGL J1427.0+2348, associated with PKS 1424+240, was generated in the full time range with best-fit prefactor ϕ 0 = ( 5.8 ± 0.1 ) × 10 12 MeV cm 2 s 1 , index α = 1.67 ± 0.01 , curvature parameter β = 0.06 ± 0.01 , and scale factor E 0 = 1227.46 MeV which was fixed at its value in the 4FGL-DR2 catalog. We present the resulting SED in Figure 2. For comparison, we plotted the SED observed by VERITAS in 2009, 2011, and 2013 [18]. MAGIC measured a similar soft spectrum and also did not detect excess events above 400 GeV in any data sample [19]. The strong cutoff seen at high energies is due to a significantly attenuated gamma-ray flux above 100 GeV which is due to the photon absorption via pair-production with the extragalactic background light [18]. A soft photon field intrinsic to the source may also contribute to this attenuation (e.g., [55,56]).

4. Results of the Analysis of VLBA Data
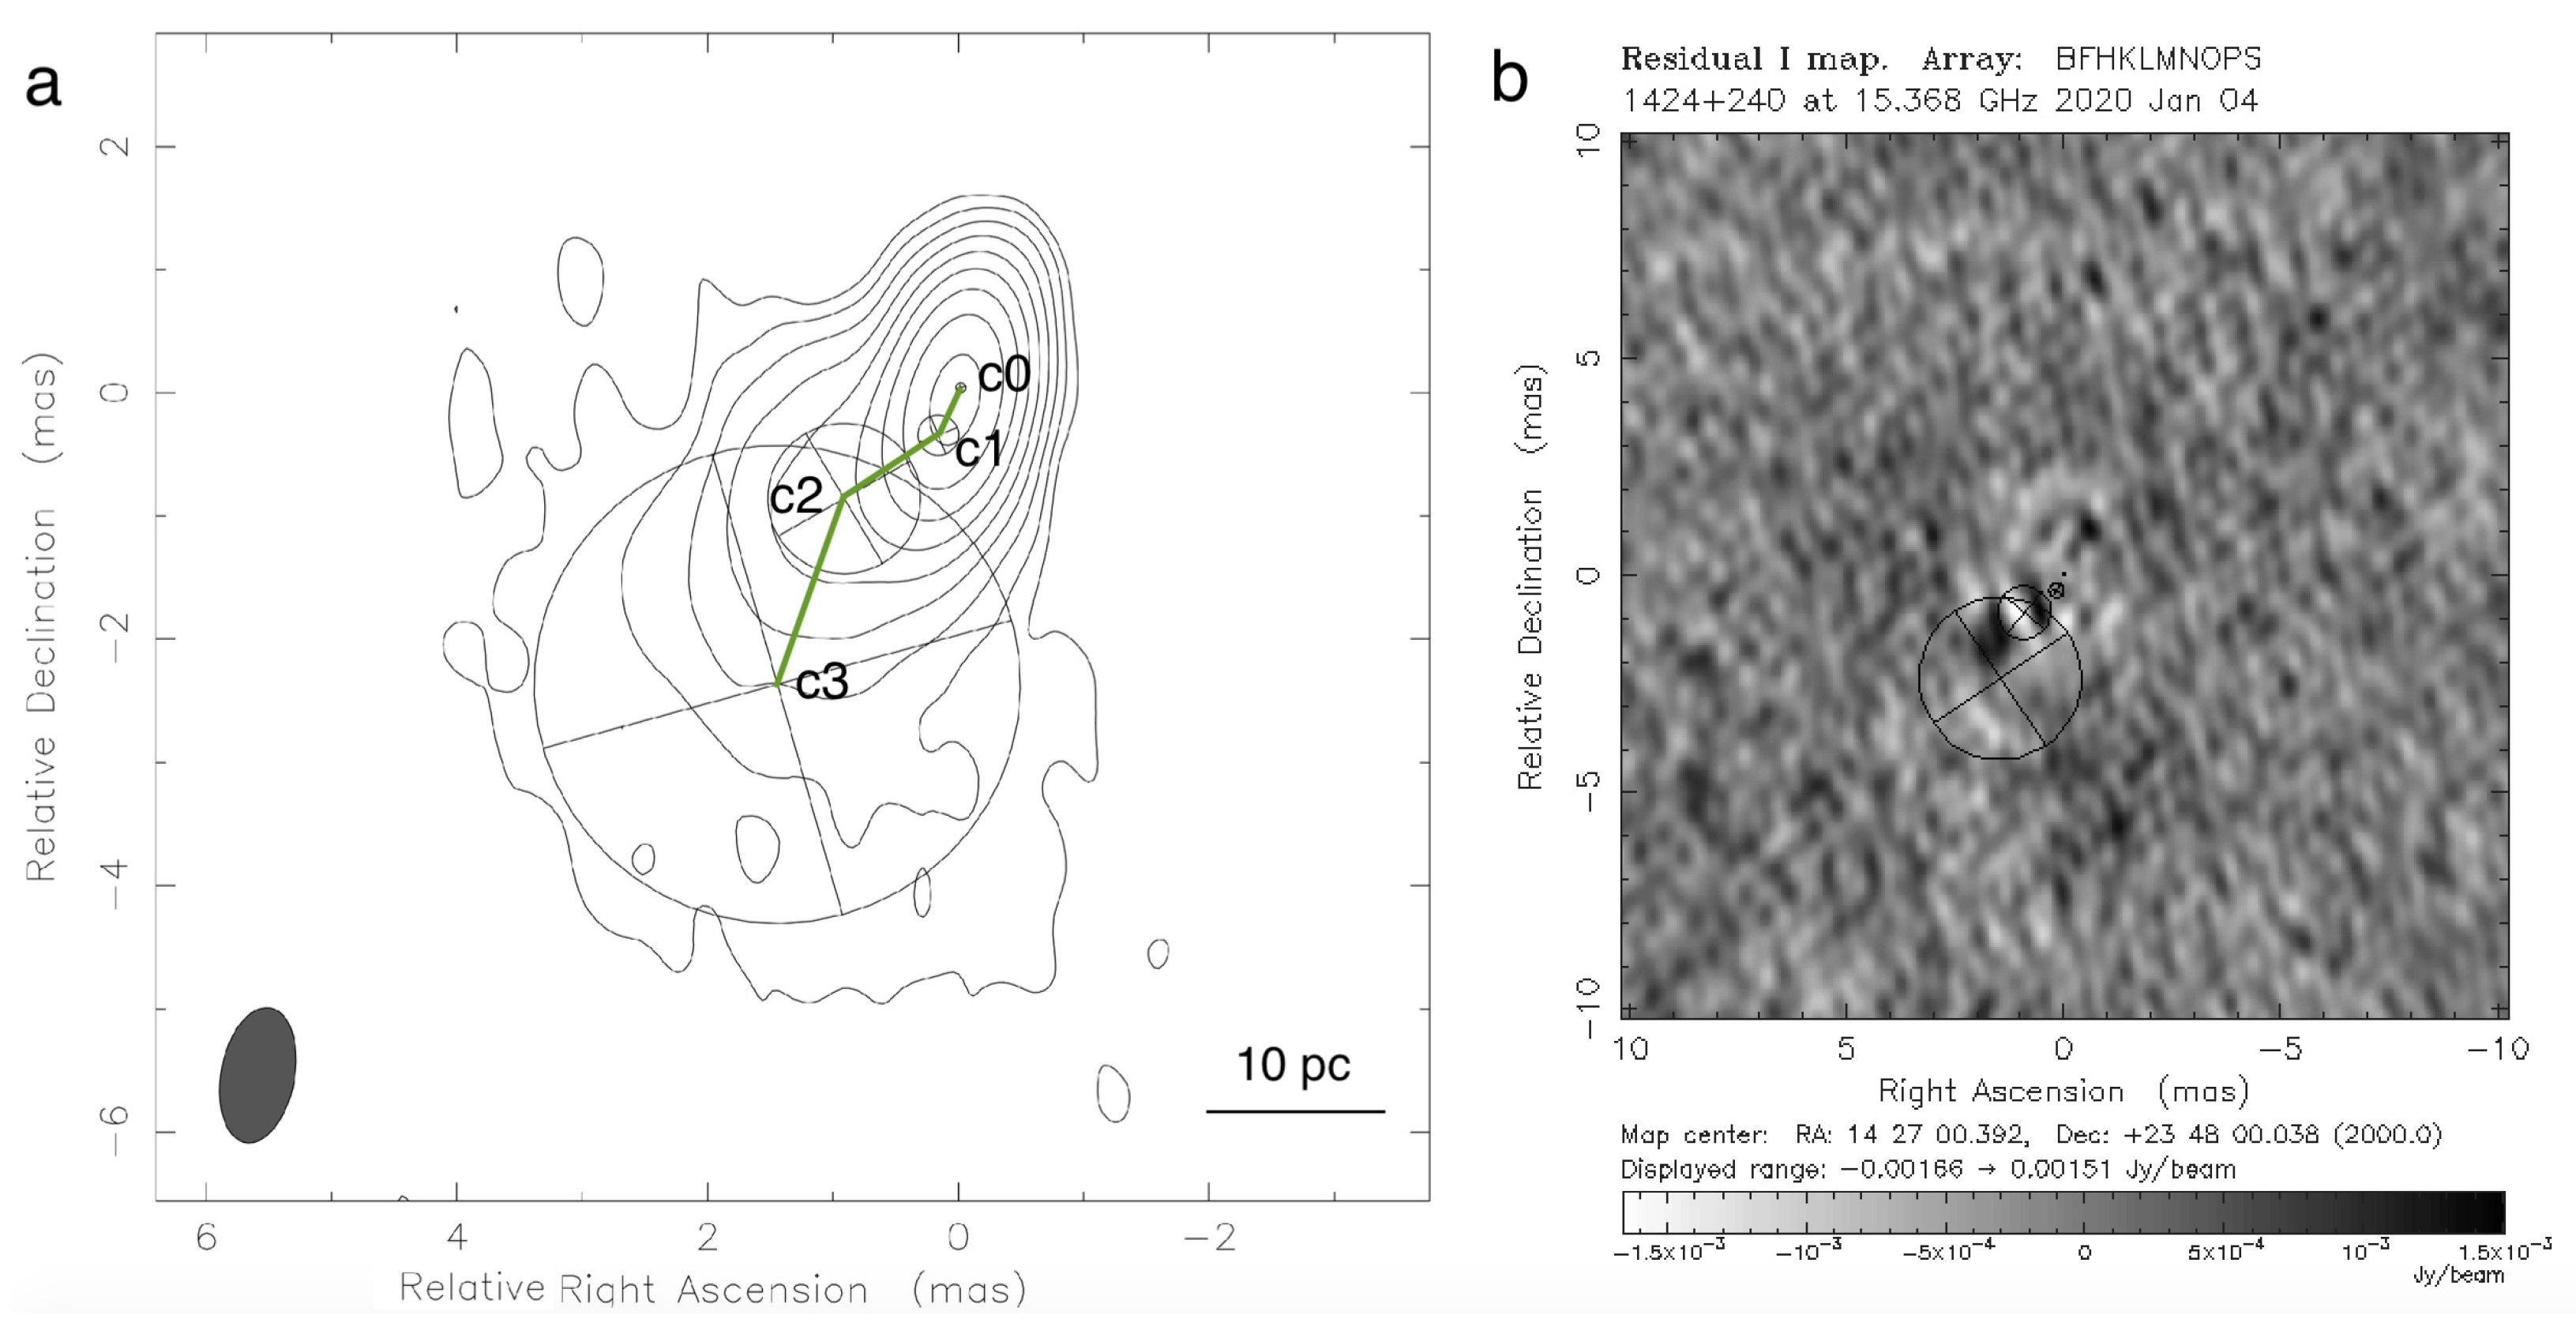
4.1. Morphology

The one-sided VLBI jet of PKS 1424+240 at 15 GHz consists of one VLBI core plus 3–4 jet components, such that the furthermost jet component is significantly more extended compared to the other jet components. The jet extends toward the south, then makes a turn toward the east (see in Figure 3).
The kpc-scale structure of PKS 1424+240 consists of a core and two jet-like extensions [57], one being more or less directed towards the north, and the other one being directed southwest. The appearance of the jet and counter-jet at this scale suggests that the line of sight angle should be moderately large so that the ratio of the Doppler boosting/deboosting should be small, to enable the observation of the two-sided radio source kpc-scale morphology.
At pc-scale, we do not see the counter-jet, and the pc-jet is not parallel with the kpc-scale jets; rather, it points 90 degrees away from the kpc-scale jet to the east. All of these findings support the jet reoriented between kpc- and pc-scales. Similar indication of jet reorientation on pc-scales was found in a number of sources, e.g., J1025+1022 [58], Fermi J1544-0649 [59], J1048+7143 [60].

4.2. Jet Kinematics

In Figure 4, we show the core separation of the identified jet components ( c 1 , c 2 , c 3 ) as a function of time. It seems that the jet components do not move away from the VLBI core; rather, they maintain more or less constant core separation. We calculated the proper motion of the components by fitting linear proper motions as
r l = μ ( t t e j ) ,
where μ is the linear proper motion, and the t e j is the ejection time. The proper motion of the components can be converted to apparent velocity, such that
β a p p = 0.0158 μ D L c ( 1 + z ) ,
where μ the proper motion is in mas/yr, D L luminosity distance is in Mpc, and z is the redshift. Assuming the cosmological model with H 0 = 69.6 km s 1 Mpc 1 , Ω M = 0.286 , and Ω Λ = 0.714 , the scale at the redshift of PKS 1424+240 ( z = 0.6047 ) [54] is 6.787 kpc arcsec 1 . We summarize the linear proper motions and the apparent velocities of the three jet components in the jet of PKS 1424+240 at 15 GHz in Table 1, and show the fitted linear proper motions in Figure 4.
Jet components c 1 and c 2 show subluminal, and jet component c 3 shows slightly superluminal motion. Subluminal motion implies no, or slight, relativistic beaming, which is otherwise a necessary engine to shift the critical frequency of the synchrotron radiation to a frequency range that is accessible by the VLBI interferometers. The apparent velocity can be related to the bulk jet velocity β and the inclination angle ι , as
β a p p = β sin ι 1 β cos ι .
If we assume the jet components appearing in the jet of PKS 1424+240 are, indeed, moving plasmoids more or less with the same bulk velocity, for the maximum apparent velocity β app , max , we obtain the minimum Lorentz factor as
Γ min = 1 + β app , max 2 = 1.81 ± 0.48 ,
and the critical inclination angle ι c = arcsin ( Γ min 1 ) = ( 33 . 5 7 . 6 + 15 . 2 ) . As the intrinsic jet velocity can be expressed as a function of the Lorentz factor such that
β = 1 1 Γ 2 ,
the minimum Lorentz factor we obtained leads to the minimum intrinsic jet velocity β min = 0.834 ± 0.097 in the units of the speed of the light. Then, the Doppler factor emerges as δ = Γ 1 ( 1 β cos ( ι ) ) 1 = 1.8 ± 0.7 for c 3 , if we assume that we see the same plasmoid from epoch to epoch that we label as c 3 . As we mentioned earlier, PKS 1424+240 is a high-synchrotron-peaked BL Lac object, a TeV emitter, one of the most distant VHE emitters, which suggests the presence of high energy cosmic-rays, and that the jet velocity should be highly relativistic for electrons and positrons as well. This is difficult to reconcile with the VLBA observations if we assume that the subluminal motion is real in the jet. As we will show later, it is more reasonable to assume that the labeled jet components represent not-moving plasmoids, rather, regions in the jet, that are more boosted compared to their environment (e.g., jet-bends or standing shocks) and therefore emerge above the sensitivity limit of VLBA.

4.3. Temporal Variation of the Doppler Factor of the VLBI Core

A consequence of the Doppler boosting is that the apparent brightness temperature T b can exceed the limiting intrinsic brightness temperature T int . The Doppler factor δ connects them as T b = δ T int . In the case of VLBI components, the brightness temperature is calculated as (e.g., [61]):
T b , VLBI = 1.22 · 10 12 × ( 1 + z ) S ν d 2 ν 2 ( K ) ,
where S ν is the flux density (in Jy), d is the FWHM of the component (in mas), ν is the observing frequency (in GHz), and z is the red-shift of the source. We calculated the apparent brightness temperature of the VLBI core of the 15 GHz jet of PKS 1424+240 from the integrated flux density and diameter of the respective Gaussian component at each of the 28 epochs of MOJAVE data. Assuming the equipartition brightness temperature T eq 3 × 10 10 K as the intrinsic brightness temperature [62], we obtained Doppler factors for the core as a function of time. We show the results in the upper panel of Figure 1.
It seems that the Doppler factor of the core was more or less steady between 2009 (first epoch in this study) and 2014. Unfortunately, there is a gap in the observations between 2014 and 2016, and we are not able to tell if this more relaxed phase lasted further than 2014. In this phase, which we consider as a quiescence phase (between 2009.333 and 2014.029 ), the median of the Doppler factor of the core was 3.0 in a range 1.2 8.4 .
The Doppler factor of the VLBI core increased tenfold in 2016 compared to its value in 2014. This epoch (2016.422) marks the possible beginning of a perturbed phase. Unfortunately, an observational gap prevents us from studying the 15 GHz jet between 2016.422 and 2019.619. It seems that the Doppler factor of the core was still tenfold increased in the first observational epoch of 2019. Then, the Doppler factor of the core rapidly decreased until the last epoch (2020.912).

5. Findings Based on the Archive Swift-XRT Light Curve

We plot the Swift-XRT light curve of PKS 1424+240 in the lower panel of Figure 1. The Swift data unfold two episodes of high X-ray activity in the source, one in 2009 and one in the beginning 2017.
It is difficult to analyze together the X-ray light curve and the time-dependent Doppler factor of the VLBI core of PKS 1424+240, since in the time period of the first episode of elevated X-ray activity, we only have 1–2 Doppler factors, while the second episode of X-ray activity happened in a gap of VLBA observations. The highly relativistic Doppler factor of the VLBI core might reflect episodes of high acceleration inside the VLBI core, and, as such, the second episode of elevated X-ray activity in 2017 could be physically connected to an episode of high-energy neutrino emission when protons are accelerated together with positrons and electrons in a lepto-hadronic jet.

6. Discussion

6.1. Lantern Regions in the Radio Jet of PKS 1424+240

We found that the pc-scale jet of PKS 1424+240 consists of several quasi-stationary jet components at 15 GHz, with subluminal or slightly superluminal apparent velocities. The lack of the classical outward-directed superluminal motion of the jet components suggests a nontypical jet configuration. Such kind of behavior is expected when the jet inclination angle is small; therefore, we do not physically observe the same blobs from epoch-to-epoch, rather, we see the so-called lantern regions of the jet, regions of the jet that are apparently significantly brighter. Such regions could be bends of a helical jet where the local inclination is smaller, leading to higher Doppler factors, or local acceleration zones where the jet velocity is significantly higher, also leading to higher Doppler factors.
The apparent flux density of the jet, pointing toward the observer, can be written as (with the convention S ( ν ) ν α ):
S a p p = S i n t δ ( n α ) ,
where δ = Γ 1 ( 1 β cos ( ι ) ) 1 is the Doppler factor, β is the jet bulk velocity, ι is the inclination (i.e., the line of sight angle), α is the spectral index, and n is a number between 2 (for continuous jet) and 3 (for spherical shape); see, e.g., [63].
The ratio of the Doppler boosting of two differently inclined regions (R) can be written as:
S a p p ( ι 2 ) S a p p ( ι 1 ) = R = 1 β cos ( ι 1 ) 1 β cos ( ι 2 ) ( 3 α ) .
For VLBI jets, ι 90 ; therefore, for i 1 > i 2 , the ratio becomes R > 1 , when we assume constant jet bulk velocity β .
Considering the VLBA observations in this study, the typical noise level is about 1–2 mJy/beam, and the peak level is usually below 500 mJy/beam. To show a real example, let us pick an epoch, e.g., 2020.912 , for which the noise level is 1.48 mJy/beam, and the peak level is 197 mJy/beam. The peak level is usually reached by the core, while the jet components are more faint. The ratio of the peak level to the noise for this epoch is ∼130. This means that the counter-jet should be at least 130 times fainter compared to the jet, otherwise it would have been observed by VLBA. TELAMON data [64] show that the spectral index of PKS 1424+240 changed between 0.4 (flat) to 0.45 (inverted) with a median value of α m e d 0.055 in the time range of MJD 59232–59476.
We plot the logarithm of ratio R as function of ι 1 and ι 2 for spectral index α = 0.055 and for several choices of highly relativistic jet velocity ( β ) in Figure 5, keeping only inclination pairs for which R > 100 . It seems that the higher the jet velocity, the smaller the difference between the inclination angles that result in R > 100 .
For helical jets with nonzero half-opening angles, the difference between the line-of-sight angle of the most-inclined and less-inclined jet-bends can be several degrees. This means that the jet-bends inclined closer to our line-of-sight are more boosted than the average (average boosting could be measured along the symmetry axis of the helical jet), and the jet-bends inclined further from our line-of-sight are less boosted compared to the average. Whenever the ratio is larger than R min 130 for this epoch in question ( 2020.912 ), we see the more-boosted region and we do not see the less-boosted region of the jet helix, because the latter falls below the sensitivity limit of the VLBA interferometer. From Figure 5, it seems that lantern regions in helical jets with several degrees of half-opening angle can really be formed for highly relativistic jet speeds.
In an earlier work [65], we already showed examples of such boosted regions, identified as “lantern-regions” [65]. The source in this study, S5 1803+784, is a well-studied BL Lac object at a similar redshift (z = 0.679) to PKS 1424+240 (z = 0.6047), which is also a BL Lac, as mentioned earlier. Kinematic analysis of the 15 GHz jet of S5 1803+784 supports the quasi-oscillatory motion of its components about stationary core separations, superposed on a helical jet (see Figures 2, 5, and 8 of [65]). In this scenario, the orbiting motion of a black hole at the jet base shakes up the helical jet, leading to the oscillatory motion of its “lantern regions” seen at a small inclination angle (1–2 ). There is a significant (∼76 ) difference between the direction of the pc- and kpc-scale jet in S5 1803+784 [66], similarly to PKS 1424+240. S5 1803+784 is associated with 4FGL J1800.6+7828 in the Fermi 4FGL-DR2 catalog. Its photon flux, 5.15 × 10 9 ph cm 2 s 1 , is about half of 4FGL J1427.0+2348 between 0.1 GeV and 100 GeV. All this supports that PKS 1424+240 is a similar BL Lac object to S5 1803+784, with regard to the possibility to experience lantern regions.
From all of this, mainly, the quasi-stationarity of the jet-components in PKS 1424+240 supports the scenario of lantern regions, since if we see only certain regions of the jet, not the outward-moving self-consisting bunches of plasma, it is not expected that we would see outward-directed motion, as the jet helix does not change through human timescales. As can be seen in Figure 3, the pc-scale jet structure of PKS 1424+240 resembles that of a helical jet, with bends, supporting the possibility that lantern regions can, in fact, be formed in the jet of PKS 1424+240. All of this also suggests that the inclination of the 15 GHz jet of PKS 1424+240 should be small, up to several degrees.

6.2. No Major Gamma-Ray Flare in PKS 1424+240

Astrophysical (median) muon neutrino energies ( E ν ) between 119 TeV and 4.8 PeV in the eight years of IceCube data [67] correspond to proton energies ( E p ) from 2.4 PeV to 96 PeV (since E p 20 E ν ). Assuming that the meson production is dominated by the Δ -resonance, these protons interact with X-ray and UV target photons (see, e.g., [39]), and constrain the two-photon annihilation depth at E γ 5 200 GeV energies. This energy range is well within the Fermi-LAT sensitivity range of 0.1 300 GeV . This implies that for the highest-energy neutrinos, if these are generated in a medium being optically thin for photon–photon interaction, pionic gamma rays should be observed during neutrino emission.
As we mentioned, from the ten-years time-integrated analysis of IceCube, for PKS 1424+240, the best-fit number of astrophysical neutrino events for this source is n ^ s = 41.5 , and the best-fit astrophysical power-law spectral index is γ ^ = 3.9 , with the local pretrial p-value = 0.00158 . The fact that none of the n ^ s = 41.5 suspected neutrinos triggered the IceCube Detector suggests that if these neutrinos were indeed generated in the source, the peak-energy of their spectrum should be below TeV energies. Considering this with the soft best-fit astrophysical power-law spectral, it might be possible that for PKS 1424+240, assuming there were indeed neutrinos from this source, the two-photon annihilation depth should be constrained even below the low energy sensitivity limit of Fermi-LAT.

7. Conclusions

In this paper, we presented the multiwavelength analysis of the third-strongest (gamma-ray bright) candidate source of the high-energy neutrino sky found in the time-integrated analysis of ten years of IceCube Detector data, the BL Lac object PKS 1424+240. We generated the Fermi-LAT likelihood light curve of this source for energies between 100 MeV and 300 GeV in the time range from 4 August 2008, 15:43:36.000 UTC (MJD 54682.65527) to 17 June 2021, 11:31:38.000 UTC (MJD 59382.48030).
Refitting calibrated VLBA UV–visibilitiesof PKS 1424+240 at 15 GHz provided by the MOJAVE team, we analyzed the pc-scale jet of this source. We fitted linear proper motion of the identified jet components and we unfolded the Doppler activity of the VLBI core. Together with archival Swift-XRT observations, we placed the multimessenger analysis in a physical picture. In the following, we summarize our most important findings about PKS 1424+240.
  • We found three quasi-stationary jet components in the 15 GHz jet of PKS 1424+240. We show that these components might be not moving plasmoids; rather, lantern regions in the jet.
  • Based on the Doppler factor of the core, we unfolded a quiescence and a perturbed phase of the VLBI core of PKS 1424+240 at 15 GHz. Due to gaps in observations, we can only state that the perturbed phase started sometime after 2016.
  • Based on archival Swift-XRT observation, we found two episodes of elevated X-ray activity.
  • Our multiwavelength analysis suggests that if neutrinos were, indeed, generated in the source, these came between 2016 and 2018, between the possible start of the perturbed phase of the VLBI core and the end date of the time-integrated analysis of IceCube.
Time-integrated analysis of ten years of IceCube data acquired between 2008 and 2018 suggests that 41.5 neutrinos might have come from PKS 1424+240. We only have one estimated Doppler factor during the perturbed phase of the VLBI core after 2014, until 2018. An analysis of archival IceCube neutrino data acquired after 2018 would help to elaborate more on the question of if there is indeed a connection between the activity state of the VLBI core and episodes of high-energy neutrino emission in PKS 1424+240. As substantial increase of the activity of the radio core might help us to identify episodes of particle acceleration in lepto-hadronic blazar jets, further investigations of radio-loud sources similar to PKS 1424+240 could shed more light on the connection of radio observations of blazars to their multimessenger physical picture in general.

Author Contributions

Conceptualization, E.K. and A.M.; analysis of Fermi-LAT data, E.K.; modelfitting of VLBA/MOJAVE, A.M.; interpretation of the results, E.K. and A.M.; paper writing, E.K.; final discussions on the paper, E.K. and A.M. All authors have read and agreed to the published version of the manuscript.

Funding

This research received no external funding.

Data Availability Statement

Not applicable.

Acknowledgments

Authors thank the anonymous referee for helpful suggestions about the presentation of this work. E.K. acknowledges support from the German Science Foundation DFG, via the Collaborative Research Center SFB1491: Cosmic Interacting Matters—from Source to Signal. E.K. thanks the Hungarian Academy of Sciences for its Premium Postdoctoral Scholarship. This paper makes use of publicly available Fermi-LAT data provided online by the https://fermi.gsfc.nasa.gov/ssc/data/access/ (accessed on 17 June 2021) Fermi Science Support Center. On behalf of Project ’fermi-agn’, we give thanks for the usage of the ELKH Cloud that significantly helped us achieving the results published in this paper. This research made use of data from the MOJAVE database that is maintained by the MOJAVE team (Lister et al., 2018).

Conflicts of Interest

The authors declare no conflict of interest. The funders had no role in the design of the study; in the collection, analyses, or interpretation of data; in the writing of the manuscript; or in the decision to publish the results.

Appendix A

Table A1. Additional sources in the ROI about PKS 1424+240. Source ID (1), right-ascension J2000 (2), declination J2000 (3), distance between the source and PKS 1424+240 (4), photon flux measured by Fermi between 0.1 GeV and 100 GeV (5), spectral index (6), TS-value of the detection (7), predicted number of photons (8).
Source IDRADEC Δ d F × 10 10 α TS N pred
- ( ) ( ) ( ) ( ph cm 2 s 1 ) ---
PS J1419.7+2532214.92725.5412.405 1.05 ± 0.28 1.8826.25125.96
PS J1412.2+2118213.05321.3064.233 1.17 ± 0.28 2.2627.95205.27
PS J1444.6+1923221.15319.3876.016 1.08 ± 0.28 2.1326.81161.76
PS J1420.9+1650215.24416.8397.105 1.57 ± 0.30 2.5949.45309.78
PS J1421.9+3106215.47831.1147.399 0.95 ± 0.26 3.6099.57490.46
PS J1359.8+1811209.97218.1978.454 1.32 ± 0.29 2.3432.82216.03
PS J1405.3+3057211.34130.9658.624 0.92 ± 0.24 2.1726.11104.30
PS J1353.2+3031208.29330.53310.092 1.30 ± 0.26 3.0367.43276.20
Table A2. Epoch, VLBA code, minor ( B m i n ) and major axis ( B m a x ) of the restoring beam, position angle of its major axis ( B p a ), and the number of fitted components (N) of the VLBA observations analyzed in this work.
EpochVLBA Code B min B maj B pa N
(mas)(mas)( )
2009.333BL149BK0.5811.022−8.14
2009.481BL149BO0.6331.146−14.73
2009.960BL149CE0.5531.107−8.83
2010.114BL149CH0.5891.1750.74
2010.710BL149CP0.5711.158−3.64
2011.619BL149DO0.6351.3313.24
2012.003BL178AE0.5981.025−2.84
2012.326BL178AJ0.6511.045−0.24
2013.161BL178BA0.5851.1390.24
2014.029BL193AD0.5871.034−2.44
2016.422BL193BE0.5941.011−3.64
2019.619BL273AA0.5781.032−7.54
2019.767BL273AB0.591.021−4.84
2019.871BL273AC0.631.042−11.24
2019.953BL273AD0.5691.016−9.74
2019.973BL229BC0.5791.042−0.14
2020.008BL273AE0.5811.026−7.54
2020.159BL273AF0.571.1−6.64
2020.233BL273AG0.6141.022−10.04
2020.331BL273AH0.5961.031−6.84
2020.389BL273AI0.6731.438−28.14
2020.408BL273AJ0.7021.06910.74
2020.452BL273AK0.5921.017−7.04
2020.580BL273AL0.5990.981−3.94
2020.621BL273AM0.5980.972−9.14
2020.674BL273AN0.6021.045−7.74
2020.838BL273AO0.5910.972−10.14
2020.912BL273AP0.6411.045−5.94
Table A3. Modelfit results of the VLBI analysis of the PKS 1424+240. Epoch (1), ID (2), relative right-ascension (3) and declination (4), compared to the VLBI core (that lies in the 0,0 position), integrated flux (5), FWHM width (6) of the fitted components.
EpochID X rel Y rel FluxFWHM
(mas)(mas)(Jy)(mas)
2009.333c00.0 ± 0.0280.0 ± 0.10.113 ± 0.030.118 ± 0.001
c10.208 ± 0.039−0.233 ± 0.1040.022 ± 0.0070.305 ± 0.006
c20.552 ± 0.13−0.782 ± 0.1610.052 ± 0.011.275 ± 0.031
c31.682 ± 0.374−2.47 ± 0.3860.026 ± 0.0063.731 ± 0.189
2009.481c00.0 ± 0.0630.0 ± 0.0980.126 ± 0.0290.168 ± 0.001
c10.398 ± 0.061−0.34 ± 0.0970.008 ± 0.010.064 ± 0.005
c20.614 ± 0.163−0.917 ± 0.180.044 ± 0.0131.512 ± 0.093
2009.960c00.0 ± 0.090.0 ± 0.0660.116 ± 0.0260.1 ± 0.0003
c10.294 ± 0.095−0.33 ± 0.0710.019 ± 0.0060.301 ± 0.006
c20.734 ± 0.196−1.086 ± 0.1860.051 ± 0.0091.745 ± 0.04
2010.114c00.0 ± 0.090.0 ± 0.0760.118 ± 0.0520.073 ± 0.001
c10.178 ± 0.105−0.145 ± 0.0930.04 ± 0.0070.547 ± 0.008
c20.63 ± 0.159−0.789 ± 0.1510.043 ± 0.0111.307 ± 0.054
c31.127 ± 0.385−2.031 ± 0.3820.027 ± 0.0073.745 ± 0.216
2010.710c00.0 ± 0.1040.0 ± 0.0520.122 ± 0.0320.097 ± 0.005
c10.268 ± 0.111−0.31 ± 0.0650.026 ± 0.0060.396 ± 0.005
c20.631 ± 0.173−0.819 ± 0.1480.046 ± 0.0081.387 ± 0.029
c31.163 ± 0.405−2.257 ± 0.3950.023 ± 0.0053.92 ± 0.186
2011.619c00.0 ± 0.1340.0 ± 0.0150.149 ± 0.040.13 ± 0.001
c10.265 ± 0.135−0.418 ± 0.0250.031 ± 0.0080.237 ± 0.004
c20.679 ± 0.184−0.844 ± 0.1280.05 ± 0.0071.279 ± 0.014
c31.42 ± 0.441−2.418 ± 0.4210.03 ± 0.0084.206 ± 0.295
2012.003c00.0 ± 0.0970.0 ± 0.0370.158 ± 0.0360.125 ± 0.001
c10.319 ± 0.108−0.449 ± 0.0590.047 ± 0.0110.477 ± 0.008
c20.931 ± 0.143−0.993 ± 0.1110.008 ± 0.0031.061 ± 0.08
c30.794 ± 0.309−1.576 ± 0.2950.041 ± 0.0112.932 ± 0.179
2012.326c00.0 ± 0.1030.0 ± 0.0230.164 ± 0.0360.089 ± 0.0003
c10.249 ± 0.108−0.272 ± 0.040.037 ± 0.0070.348 ± 0.004
c20.566 ± 0.147−0.771 ± 0.1080.04 ± 0.0071.059 ± 0.017
c31.174 ± 0.38−1.914 ± 0.3670.036 ± 0.0073.661 ± 0.137
2013.161c00.0 ± 0.1120.0 ± 0.0260.178 ± 0.0320.136 ± 0.0005
c10.362 ± 0.134−0.438 ± 0.0770.062 ± 0.0090.734 ± 0.006
c20.39 ± 0.139−1.371 ± 0.0860.006 ± 0.0020.829 ± 0.058
c31.172 ± 0.373−1.801 ± 0.3570.035 ± 0.0083.564 ± 0.173
2014.029c00.0 ± 0.0770.0 ± 0.070.222 ± 0.0230.085 ± 0.00006
c10.207 ± 0.083−0.21 ± 0.0770.055 ± 0.0070.33 ± 0.001
c20.485 ± 0.115−0.682 ± 0.1110.068 ± 0.0050.859 ± 0.002
c31.142 ± 0.416−2.037 ± 0.4150.041 ± 0.0074.086 ± 0.098
2016.422c00.0 ± 0.0910.0 ± 0.0450.253 ± 0.0350.05 ± 0.00003
c10.088 ± 0.093−0.227 ± 0.0490.126 ± 0.0150.191 ± 0.0
c20.562 ± 0.115−0.506 ± 0.0830.083 ± 0.0080.699 ± 0.002
c30.835 ± 0.183−1.309 ± 0.1650.056 ± 0.0081.584 ± 0.024
2019.619c00.0 ± 0.0360.0 ± 0.0970.261 ± 0.0310.05 ± 0.00002
c10.203 ± 0.05−0.391 ± 0.1030.086 ± 0.010.354 ± 0.001
c20.918 ± 0.123−0.887 ± 0.1530.077 ± 0.0131.179 ± 0.022
c31.49 ± 0.348−2.615 ± 0.360.038 ± 0.013.464 ± 0.194
2019.767c00.0 ± 0.0120.0 ± 0.1020.266 ± 0.0260.081 ± 0.00004
c10.194 ± 0.044−0.395 ± 0.110.095 ± 0.0120.428 ± 0.002
c20.945 ± 0.127−0.902 ± 0.1630.079 ± 0.0131.272 ± 0.024
c31.422 ± 0.382−2.459 ± 0.3950.056 ± 0.0123.818 ± 0.155
2019.871c00.0 ± 0.0220.0 ± 0.1020.249 ± 0.0420.05 ± 0.00005
c10.181 ± 0.041−0.392 ± 0.1080.1 ± 0.0110.353 ± 0.001
c20.975 ± 0.122−0.904 ± 0.1580.074 ± 0.0111.205 ± 0.016
c31.425 ± 0.377−2.464 ± 0.390.045 ± 0.0113.76 ± 0.196
2019.953c00.0 ± 0.0980.0 ± 0.0280.234 ± 0.0480.066 ± 0.00012
c10.179 ± 0.103−0.389 ± 0.0420.099 ± 0.0110.323 ± 0.001
c20.921 ± 0.156−0.887 ± 0.1250.07 ± 0.0121.217 ± 0.022
c31.462 ± 0.383−2.298 ± 0.3720.053 ± 0.0123.705 ± 0.156
2019.973c00.0 ± 0.1040.0 ± 0.0130.231 ± 0.0270.072 ± 0.00005
c10.178 ± 0.108−0.381 ± 0.0320.106 ± 0.0190.301 ± 0.002
c20.903 ± 0.162−0.868 ± 0.1240.073 ± 0.0061.239 ± 0.005
c31.442 ± 0.389−2.367 ± 0.3750.052 ± 0.0113.75 ± 0.148
2020.008c00.0 ± 0.0360.0 ± 0.0960.237 ± 0.0380.07 ± 0.00009
c10.181 ± 0.049−0.386 ± 0.1020.112 ± 0.0090.335 ± 0.0
c20.925 ± 0.127−0.894 ± 0.1560.07 ± 0.0111.224 ± 0.018
c31.475 ± 0.375−2.412 ± 0.3850.052 ± 0.0113.728 ± 0.139
2020.159c00.0 ± 0.1050.0 ± 0.0350.225 ± 0.0260.059 ± 0.00003
c10.203 ± 0.111−0.396 ± 0.0510.101 ± 0.0080.383 ± 0.001
c20.935 ± 0.151−0.918 ± 0.1140.057 ± 0.0081.092 ± 0.013
c31.408 ± 0.322−2.252 ± 0.3070.04 ± 0.0093.047 ± 0.124
2020.233c00.0 ± 0.0860.0 ± 0.0560.201 ± 0.0450.05 ± 0.00009
c10.17 ± 0.092−0.377 ± 0.0650.113 ± 0.0120.343 ± 0.001
c20.867 ± 0.145−0.886 ± 0.130.066 ± 0.0091.17 ± 0.013
c31.528 ± 0.34−2.415 ± 0.3340.045 ± 0.0083.289 ± 0.101
2020.331c00.0 ± 0.090.0 ± 0.0510.192 ± 0.040.07 ± 0.00015
c10.185 ± 0.098−0.406 ± 0.0640.104 ± 0.0120.39 ± 0.001
c20.891 ± 0.147−0.89 ± 0.1270.06 ± 0.0061.167 ± 0.008
c31.506 ± 0.363−2.307 ± 0.3560.051 ± 0.0093.52 ± 0.099
2020.389c00.0 ± 0.1420.0 ± 0.0250.184 ± 0.0220.05 ± 0.00004
c10.195 ± 0.147−0.453 ± 0.0470.11 ± 0.0060.398 ± 0.001
c20.926 ± 0.185−0.862 ± 0.1210.06 ± 0.0061.184 ± 0.007
c31.39 ± 0.385−2.382 ± 0.3590.05 ± 0.0093.577 ± 0.103
2020.408c00.0 ± 0.0320.0 ± 0.1030.18 ± 0.0180.083 ± 0.00006
c10.192 ± 0.051−0.439 ± 0.110.097 ± 0.0060.409 ± 0.001
c20.904 ± 0.125−0.866 ± 0.1590.061 ± 0.0081.215 ± 0.014
c31.55 ± 0.37−2.409 ± 0.3830.046 ± 0.0093.688 ± 0.128
2020.452c00.00005 ± 0.0770.0 ± 0.0670.179 ± 0.0170.093 ± 0.0
c10.197 ± 0.087−0.46 ± 0.0790.111 ± 0.010.418 ± 0.001
c20.903 ± 0.14−0.889 ± 0.1350.059 ± 0.0081.177 ± 0.014
c31.422 ± 0.367−2.266 ± 0.3650.054 ± 0.013.591 ± 0.103
2020.580c00.0 ± 0.0720.0 ± 0.0690.179 ± 0.0190.122 ± 0.00012
c10.214 ± 0.082−0.51 ± 0.0790.109 ± 0.0110.41 ± 0.001
c20.861 ± 0.136−0.825 ± 0.1340.057 ± 0.0091.159 ± 0.019
c31.363 ± 0.39−2.146 ± 0.390.066 ± 0.0113.836 ± 0.103
2020.621c00.0 ± 0.0920.0 ± 0.0320.179 ± 0.030.079 ± 0.00011
c10.201 ± 0.099−0.49 ± 0.0480.09 ± 0.0140.372 ± 0.002
c20.807 ± 0.145−0.87 ± 0.1160.059 ± 0.011.115 ± 0.019
c31.601 ± 0.39−2.282 ± 0.380.047 ± 0.013.789 ± 0.151
2020.674c00.0 ± 0.0180.0 ± 0.1040.168 ± 0.0240.076 ± 0.00008
c10.215 ± 0.042−0.493 ± 0.110.096 ± 0.0090.391 ± 0.001
c20.859 ± 0.113−0.883 ± 0.1520.059 ± 0.0081.116 ± 0.011
c31.458 ± 0.388−2.516 ± 0.4010.055 ± 0.013.879 ± 0.11
2020.838c00.0 ± 0.0760.0 ± 0.0610.159 ± 0.040.05 ± 0.0001
c10.236 ± 0.083−0.506 ± 0.070.072 ± 0.0120.349 ± 0.002
c20.785 ± 0.138−0.844 ± 0.130.055 ± 0.0091.154 ± 0.018
c31.825 ± 0.404−2.474 ± 0.4010.055 ± 0.0123.966 ± 0.161
2020.912c00.0 ± 0.0970.0 ± 0.040.153 ± 0.0210.078 ± 0.00009
c10.222 ± 0.103−0.481 ± 0.0530.071 ± 0.0070.353 ± 0.001
c20.841 ± 0.143−0.843 ± 0.1120.054 ± 0.0071.051 ± 0.01
c31.42 ± 0.388−2.377 ± 0.3780.048 ± 0.0093.758 ± 0.113

References

  1. Abraham, J.; Abreu, P.; Aglietta, M.; Ahn, E.J.; Allard, D.; Allen, J.; Alvarez-Muñiz, J.; Ambrosio, M.; Anchordoqui, L.; Andringa, S.; et al. Measurement of the energy spectrum of cosmic rays above 1018 eV using the Pierre Auger Observatory. Phys. Lett. B 2010, 685, 239–246. [Google Scholar] [CrossRef] [Green Version]
  2. Abu-Zayyad, T.; Aida, R.; Allen, M.; Anderson, R.; Azuma, R.; Barcikowski, E.; Belz, J.W.; Bergman, D.R.; Blake, S.A.; Cady, R.; et al. Search for Anisotropy of Ultrahigh Energy Cosmic Rays with the Telescope Array Experiment. Astrophys. J. 2012, 757, 26. [Google Scholar] [CrossRef] [Green Version]
  3. Biermann, P.L.; Becker Tjus, J.; de Boer, W.; Caramete, L.I.; Chieffi, A.; Diehl, R.; Gebauer, I.; Gergely, L.Á.; Haug, E.; Kronberg, P.P.; et al. Supernova explosions of massive stars and cosmic rays. Adv. Space Res. 2018, 62, 2773–2816. [Google Scholar] [CrossRef] [Green Version]
  4. Saftoiu, A.; Pierre Auger Collaboration. Overview of the Pierre Auger observatory dedicated to the study of cosmic rays. In Proceedings of the American Institute of Physics Conference Series, Sinaia, Romania, 1–14 July 2018; AIP Publishing: Long Island, NY, USA, 2019; Volume 2076, p. 030009. [Google Scholar] [CrossRef]
  5. Novotný, V.; The Pierre Auger Collaboration; Abreu, P.; Aglietta, M.; Albury, J.M.; Allekotte, I.; Almela, A.; Alvarez-Muniz, J.; Alves Batista, R.; Anastasi, G.A.; et al. Energy spectrum of cosmic rays measured using the Pierre Auger Observatory. In Proceedings of the 37th International Cosmic Ray Conference, Berlin, Germany, 12–23 July 2021; p. 324. [Google Scholar] [CrossRef]
  6. Becker, J.K. High-energy neutrinos in the context of multimessenger astrophysics. Phys. Rep. 2008, 458, 173–246. [Google Scholar] [CrossRef] [Green Version]
  7. Dermer, C.D.; Razzaque, S.; Finke, J.D.; Atoyan, A. Ultra-high-energy cosmic rays from black hole jets of radio galaxies. New J. Phys. 2009, 11, 065016. [Google Scholar] [CrossRef]
  8. Greisen, K. End to the Cosmic-Ray Spectrum? Phys. Rev. Lett. 1966, 16, 748–750. [Google Scholar] [CrossRef]
  9. Zatsepin, G.T.; Kuz’min, V.A. Upper Limit of the Spectrum of Cosmic Rays. Sov. J. Exp. Theor. Phys. Lett. 1966, 4, 78. [Google Scholar]
  10. Stecker, F.W. Effect of Photomeson Production by the Universal Radiation Field on High-Energy Cosmic Rays. Phys. Rev. Lett. 1968, 21, 1016–1018. [Google Scholar] [CrossRef] [Green Version]
  11. Stanev, T.; Engel, R.; Mücke, A.; Protheroe, R.J.; Rachen, J.P. Propagation of ultrahigh energy protons in the nearby universe. Phys. Rev. D 2000, 62, 093005. [Google Scholar] [CrossRef]
  12. Owen, E.R.; Han, Q.; Wu, K.; Yap, Y.X.J.; Surajbali, P. Ultra-High-energy Cosmic Rays from beyond the Greisen-Zatsepin-Kuz’min Horizon. Astrophys. J. 2021, 922, 32. [Google Scholar] [CrossRef]
  13. Alnussirat, S.T.; Barghouty, A.F.; Webb, G.M.; Biermann, P.L. “Super GZK” Particles in a Classic Kramers’ Diffusion-over-a-barrier Model. I. The Case of Protons. Astrophys. J. 2021, 915, 11. [Google Scholar] [CrossRef]
  14. Kalashev, O.E.; Khrenov, B.A.; Klimov, P.; Sharakin, S.; Troitsky, S.V. Global anisotropy of arrival directions of ultra-high-energy cosmic rays: Capabilities of space-based detectors. J. Cosmol. Astropart. Phys. 2008, 2008, 003. [Google Scholar] [CrossRef]
  15. IceCube Collaboration; Fermi-LAT; MAGIC; AGILE; ASAS-SN; HAWC; HESS; INTEGRAL; KANATA; KISO; et al. Multimessenger observations of a flaring blazar coincident with high-energy neutrino IceCube-170922A. Science 2018, 361, 147. [Google Scholar] [CrossRef] [Green Version]
  16. IceCube Collaboration; Abbasi, R.; Ackermann, M.; Adams, J.; Aguilar, J.A.; Ahlers, M.; Ahrens, M.; Alameddine, J.M.; Alispach, C.; Alves, A.A.J.; et al. Evidence for neutrino emission from the nearby active galaxy NGC 1068. Science 2022, 378, 538–543. [Google Scholar] [CrossRef] [PubMed]
  17. IceCube Collaboration. Time-Integrated Neutrino Source Searches with 10 Years of IceCube Data. Phys. Rev. Lett. 2020, 124, 051103. [Google Scholar] [CrossRef] [Green Version]
  18. Archambault, S.; Aune, T.; Behera, B.; Beilicke, M.; Benbow, W.; Berger, K.; Bird, R.; Biteau, J.; Bugaev, V.; Byrum, K.; et al. Deep Broadband Observations of the Distant Gamma-Ray Blazar PKS 1424+240. Astrophys. J. Lett. 2014, 785, L16. [Google Scholar] [CrossRef] [Green Version]
  19. Aleksić, J.; Ansoldi, S.; Antonelli, L.A.; Antoranz, P.; Babic, A.; Bangale, P.; Barres de Almeida, U.; Barrio, J.A.; Becerra González, J.; Bednarek, W.; et al. MAGIC long-term study of the distant TeV blazar PKS 1424+240 in a multiwavelength context. Astron. Astrophys. 2014, 567, A135. [Google Scholar] [CrossRef] [Green Version]
  20. MAGIC Collaboration; Acciari, V.A.; Ansoldi, S.; Antonelli, L.A.; Arbet Engels, A.; Baack, D.; Babić, A.; Banerjee, B.; Barres de Almeida, U.; Barrio, J.A.; et al. Testing two-component models on very high-energy gamma-ray-emitting BL Lac objects. Astron. Astrophys. 2020, 640, A132. [Google Scholar] [CrossRef]
  21. Padovani, P.; Boccardi, B.; Falomo, R.; Giommi, P. PKS 1424+240: Yet another masquerading BL Lac object as a possible IceCube neutrino source. Mon. Not. R. Astron. Soc. 2022, 511, 4697–4701. [Google Scholar] [CrossRef]
  22. Padovani, P.; Giommi, P.; Falomo, R.; Oikonomou, F.; Petropoulou, M.; Glauch, T.; Resconi, E.; Treves, A.; Paiano, S. The spectra of IceCube neutrino (SIN) candidate sources—II. Source characterization. Mon. Not. R. Astron. Soc. 2022, 510, 2671–2688. [Google Scholar] [CrossRef]
  23. Zhou, B.; Kamionkowski, M.; Liang, Y.f. Search for high-energy neutrino emission from radio-bright AGN. Phys. Rev. D 2021, 103, 123018. [Google Scholar] [CrossRef]
  24. Desai, A.; Vandenbroucke, J.; Pizzuto, A. Testing the AGN Radio and Neutrino correlation using the MOJAVE catalog and 10 years of IceCube Data. arXiv 2021, arXiv:2107.08115. [Google Scholar]
  25. Kadler, M.; Krauß, F.; Mannheim, K.; Ojha, R.; Müller, C.; Schulz, R.; Anton, G.; Baumgartner, W.; Beuchert, T.; Buson, S.; et al. Coincidence of a high-fluence blazar outburst with a PeV-energy neutrino event. Nat. Phys. 2016, 8, 807–814. [Google Scholar] [CrossRef]
  26. Kun, E.; Biermann, P.L.; Gergely, L.Á. Very long baseline interferometry radio structure and radio brightening of the high-energy neutrino emitting blazar TXS 0506+056. Mon. Not. R. Astron. Soc. 2019, 483, L42–L46. [Google Scholar] [CrossRef] [Green Version]
  27. Britzen, S.; Fendt, C.; Böttcher, M.; Zajaček, M.; Jaron, F.; Pashchenko, I.N.; Araudo, A.; Karas, V.; Kurtanidze, O. A cosmic collider: Was the IceCube neutrino generated in a precessing jet-jet interaction in TXS 0506+056? Astron. Astrophys. 2019, 630, A103. [Google Scholar] [CrossRef] [Green Version]
  28. Ros, E.; Kadler, M.; Perucho, M.; Boccardi, B.; Cao, H.M.; Giroletti, M.; Krauß, F.; Ojha, R. Apparent superluminal core expansion and limb brightening in the candidate neutrino blazar TXS 0506+056. Astron. Astrophys. 2020, 633, L1. [Google Scholar] [CrossRef] [Green Version]
  29. Plavin, A.; Kovalev, Y.Y.; Kovalev, Y.A.; Troitsky, S. Observational Evidence for the Origin of High-energy Neutrinos in Parsec-scale Nuclei of Radio-bright Active Galaxies. Astrophys. J. 2020, 894, 101. [Google Scholar] [CrossRef]
  30. Plavin, A.V.; Kovalev, Y.Y.; Kovalev, Y.A.; Troitsky, S.V. Directional Association of TeV to PeV Astrophysical Neutrinos with Radio Blazars. Astrophys. J. 2021, 908, 157. [Google Scholar] [CrossRef]
  31. Britzen, S.; Zajaček, M.; Popović, L.Č.; Fendt, C.; Tramacere, A.; Pashchenko, I.N.; Jaron, F.; Pánis, R.; Petrov, L.; Aller, M.F.; et al. A ring accelerator? Unusual jet dynamics in the IceCube candidate PKS 1502+106. Mon. Not. R. Astron. Soc. 2021, 503, 3145–3178. [Google Scholar] [CrossRef]
  32. Hovatta, T.; Lindfors, E.; Kiehlmann, S.; Max-Moerbeck, W.; Hodges, M.; Liodakis, I.; Lähteemäki, A.; Pearson, T.J.; Readhead, A.C.S.; Reeves, R.A.; et al. Association of IceCube neutrinos with radio sources observed at Owens Valley and Metsähovi Radio Observatories. Astron. Astrophys. 2021, 650, A83. [Google Scholar] [CrossRef]
  33. Rodrigues, X.; Garrappa, S.; Gao, S.; Paliya, V.S.; Franckowiak, A.; Winter, W. Multiwavelength and Neutrino Emission from Blazar PKS 1502 + 106. Astrophys. J. 2021, 912, 54. [Google Scholar] [CrossRef]
  34. Achterberg, A.; Ackermann, M.; Adams, J.; Ahrens, J.; Atlee, D.W.; Bahcall, J.N.; Bai, X.; Baret, B.; Bartelt, M.; Barwick, S.W.; et al. On the selection of AGN neutrino source candidates for a source stacking analysis with neutrino telescopes. Astropart. Phys. 2006, 26, 282–300. [Google Scholar] [CrossRef] [Green Version]
  35. Wright, A.; Otrupcek, R. Parkes Catalog, 1990, Australia telescope national facility. PKS Catalog 1990. Available online: https://heasarc.gsfc.nasa.gov/W3Browse/all/pkscat90.html (accessed on 22 December 2022).
  36. Lister, M.L.; Cohen, M.H.; Homan, D.C.; Kadler, M.; Kellermann, K.I.; Kovalev, Y.Y.; Ros, E.; Savolainen, T.; Zensus, J.A. MOJAVE: Monitoring of Jets in Active Galactic Nuclei with VLBA Experiments. VI. Kinematics Analysis of a Complete Sample of Blazar Jets. Astron. J. 2009, 138, 1874–1892. [Google Scholar] [CrossRef]
  37. Petropoulou, M.; Dimitrakoudis, S.; Padovani, P.; Mastichiadis, A.; Resconi, E. Photohadronic origin of γ-ray BL Lac emission: Implications for IceCube neutrinos. Mon. Not. R. Astron. Soc. 2015, 448, 2412–2429. [Google Scholar] [CrossRef]
  38. Petropoulou, M.; Mastichiadis, A. Bethe-Heitler emission in BL Lacs: Filling the gap between X-rays and γ-rays. Mon. Not. R. Astron. Soc. 2015, 447, 36–48. [Google Scholar] [CrossRef]
  39. Murase, K.; Oikonomou, F.; Petropoulou, M. Blazar Flares as an Origin of High-energy Cosmic Neutrinos? Astrophys. J. 2018, 865, 124. [Google Scholar] [CrossRef]
  40. Rodrigues, X.; Gao, S.; Fedynitch, A.; Palladino, A.; Winter, W. Leptohadronic Blazar Models Applied to the 2014-2015 Flare of TXS 0506+056. Astrophys. J. Lett. 2019, 874, L29. [Google Scholar] [CrossRef] [Green Version]
  41. Halzen, F.; Kheirandish, A. Black holes associated with cosmic neutrino flares. Nat. Phys. 2020, 16, 498–500. [Google Scholar] [CrossRef]
  42. Ananna, T.T.; Treister, E.; Urry, C.M.; Ricci, C.; Kirkpatrick, A.; LaMassa, S.; Buchner, J.; Civano, F.; Tremmel, M.; Marchesi, S. The Accretion History of AGNs. I. Supermassive Black Hole Population Synthesis Model. Astrophys. J. 2019, 871, 240. [Google Scholar] [CrossRef] [Green Version]
  43. Ananna, T.T.; Urry, C.M.; Treister, E.; Hickox, R.C.; Shankar, F.; Ricci, C.; Cappelluti, N.; Marchesi, S.; Turner, T.J. Accretion History of AGNs. III. Radiative Efficiency and AGN Contribution to Reionization. Astrophys. J. 2020, 903, 85. [Google Scholar] [CrossRef]
  44. Treister, E.; Urry, C.M.; Virani, S. The Space Density of Compton-Thick Active Galactic Nucleus and the X-Ray Background. Astrophys. J. 2009, 696, 110–120. [Google Scholar] [CrossRef]
  45. Atwood, W.B.; Abdo, A.A.; Ackermann, M.; Althouse, W.; Anderson, B.; Axelsson, M.; Baldini, L.; Ballet, J.; Band, D.L.; Barbiellini, G.; et al. The Large Area Telescope on the Fermi Gamma-Ray Space Telescope Mission. Astrophys. J. 2009, 697, 1071–1102. [Google Scholar] [CrossRef] [Green Version]
  46. Mattox, J.R.; Bertsch, D.L.; Chiang, J.; Dingus, B.L.; Digel, S.W.; Esposito, J.A.; Fierro, J.M.; Hartman, R.C.; Hunter, S.D.; Kanbach, G.; et al. The Likelihood Analysis of EGRET Data. Astrophys. J. 1996, 461, 396. [Google Scholar] [CrossRef]
  47. Shepherd, M.C. Difmap: An Interactive Program for Synthesis Imaging. In Proceedings of the Astronomical Data Analysis Software and Systems VI, Baltimore, MD, USA, 25–28 September 1994; Hunt, G., Payne, H., Eds.; Astronomical Society of the Pacific: San Francisco, CA, USA, 1997; Volume 125, p. 77. [Google Scholar]
  48. Kun, E.; Gabányi, K.É.; Karouzos, M.; Britzen, S.; Gergely, L.Á. A spinning supermassive black hole binary model consistent with VLBI observations of the S5 1928+738 jet. Mon. Not. R. Astron. Soc. 2014, 445, 1370–1382. [Google Scholar] [CrossRef]
  49. Kun, E.; Frey, S.; Gabányi, K.É.; Britzen, S.; Cseh, D.; Gergely, L.Á. Constraining the parameters of the putative supermassive binary black hole in PG 1302-102 from its radio structure. Mon. Not. R. Astron. Soc. 2015, 454, 1290–1296. [Google Scholar] [CrossRef] [Green Version]
  50. Stroh, M.C.; Falcone, A.D. Swift X-Ray Telescope Monitoring of Fermi-LAT Gamma-Ray Sources of Interest. Astrophys. J. Supp. Ser. 2013, 207, 28. [Google Scholar] [CrossRef] [Green Version]
  51. Lott, B.; Escande, L.; Larsson, S.; Ballet, J. An adaptive-binning method for generating constant-uncertainty/constant-significance light curves with Fermi-LAT data. Astron. Astrophys. 2012, 544, A6. [Google Scholar] [CrossRef] [Green Version]
  52. Scargle, J.D.; Norris, J.P.; Jackson, B.; Chiang, J. Studies in Astronomical Time Series Analysis. VI. Bayesian Block Representations. Astrophys. J. 2013, 764, 167. [Google Scholar] [CrossRef] [Green Version]
  53. Garrappa, E.A. Investigation of Two Fermi-LAT Gamma-Ray Blazars Coincident with High-energy Neutrinos Detected by IceCube. Astrophys. J. 2019, 880, 103. [Google Scholar] [CrossRef] [Green Version]
  54. Paiano, S.; Landoni, M.; Falomo, R.; Treves, A.; Scarpa, R.; Righi, C. On the Redshift of TeV BL Lac Objects. Astrophys. J. 2017, 837, 144. [Google Scholar] [CrossRef]
  55. Kun, E.; Bartos, I.; Tjus, J.B.; Biermann, P.L.; Halzen, F.; Mezo, G. Cosmic Neutrinos from Temporarily Gamma-suppressed Blazars. Astrophys. J. Lett. 2021, 911, L18. [Google Scholar] [CrossRef]
  56. Fang, K.; Gallagher, J.S.; Halzen, F. The TeV Diffuse Cosmic Neutrino Spectrum and the Nature of Astrophysical Neutrino Sources. Astrophys. J. 2022, 933, 190. [Google Scholar] [CrossRef]
  57. Rector, T.A.; Gabuzda, D.C.; Stocke, J.T. The Radio Structure of High-Energy-Peaked BL Lacertae Objects. Astron. J. 2003, 125, 1060–1072. [Google Scholar] [CrossRef] [Green Version]
  58. Cheng, X.; An, T.; Sohn, B.W.; Hong, X.; Wang, A. Parsec-scale properties of eight Fanaroff-Riley type 0 radio galaxies. Mon. Not. R. Astron. Soc. 2021, 506, 1609–1622. [Google Scholar] [CrossRef]
  59. Shao, C.; Cheng, X.; Thomas Tam, P.H.; Yang, L.; Cui, Y.; Pal, P.S.; Zhang, Z.; Sohn, B.W.; Sugiyama, K.; Chen, W.; et al. Is Fermi 1544-0649 a Misaligned Blazar? Discovering the Jet Structure with Very Long Baseline Interferometry. Astrophys. J. 2022, 934, 39. [Google Scholar] [CrossRef]
  60. Kun, E.; Jaroschewski, I.; Ghorbanietemad, A.; Frey, S.; Becker Tjus, J.; Britzen, S.; Gabányi, K.É.; Kiselev, V.; Schlegel, L.; Schroller, M.; et al. Multimessenger Picture of J1048+7143. Astrophys. J. 2022, 940, 163. [Google Scholar] [CrossRef]
  61. Condon, J.J.; Condon, M.A.; Gisler, G.; Puschell, J.J. Strong radio sources in bright spiral galaxies. II - Rapid star formation and galaxy-galaxy interactions. Astrophys. J. 1982, 252, 102–124. [Google Scholar] [CrossRef]
  62. Homan, D.C.; Kovalev, Y.Y.; Lister, M.L.; Ros, E.; Kellermann, K.I.; Cohen, M.H.; Vermeulen, R.C.; Zensus, J.A.; Kadler, M. Intrinsic Brightness Temperatures of AGN Jets. Astrophys. J. Lett. 2006, 642, L115–L118. [Google Scholar] [CrossRef] [Green Version]
  63. Scheuer, P.A.G.; Readhead, A.C.S. Superluminally expanding radio sources and the radio-quiet QSOs. Nature 1979, 277, 182–185. [Google Scholar] [CrossRef]
  64. Kadler, M.; Bach, U.; Berge, D.; Buson, S.; Dorner, D.; Edwards, P.G.; Eppel, F.; Giroletti, M.; Gokus, A.; Hervet, O.; et al. TELAMON: Monitoring of AGN with the Effelsberg 100-m Telescope in the Context of Astroparticle Physics. In Proceedings of the 37th International Cosmic Ray Conference, Berlin, Germany, 12–23 July 2021; p. 974. [Google Scholar] [CrossRef]
  65. Kun, E.; Karouzos, M.; Gabányi, K.É.; Britzen, S.; Kurtanidze, O.M.; Gergely, L.Á. Flaring radio lanterns along the ridge line: Long-term oscillatory motion in the jet of S5 1803+784. Mon. Not. R. Astron. Soc. 2018, 478, 359–370. [Google Scholar] [CrossRef]
  66. Britzen, S.; Witzel, A.; Krichbaum, T.P.; Beckert, T.; Campbell, R.M.; Schalinski, C.; Campbell, J. The radio structure of S5 1803+784. Mon. Not. R. Astron. Soc. 2005, 362, 966–974. [Google Scholar] [CrossRef]
  67. Haack, C.; Wiebusch, C.; IceCube Collaboration. A measurement of the diffuse astrophysical muon neutrino flux using eight years of IceCube data. In Proceedings of the 35th International Cosmic Ray Conference (ICRC2017), Busan, Republic of Korea, 12–20 July 2017; Volume 301, p. 1005. [Google Scholar]
Figure 1. (Upper): The Doppler factor of the 15 GHz VLBI core of PKS 1424+240 as a function of time. (Middle): Likelihood light curve of PKS 1424+240 (100 MeV E 300 GeV, orange dots with errorbars) with Bayesian blocks ( p = 0.05 , blue continous lines). (Lower): X-ray photon counts as a function of time.
Symmetry 15 00270 g001
Figure 2. Spectral energy distribution of PKS 1420+240 between 100 MeV and 400 GeV. The high-energy cut-off is commented on in the text.
Symmetry 15 00270 g002
Figure 3. (a) The jet of PKS 1424+240 on pc-scale (VLBA, 2020.008, present work). Right ascension and declination is measured in milliarcsecs (mas), relative to the VLBI core (that lies in the 0,0 position). The peak brightness is 0.308 Jy beam 1 , the lowest contours are at ± 0.924 mJy beam 1 , and the positive contours increase by a factor of 2. The VLBI core (c0) and the jet components (c1, c2, c3) are labeled. We also show the spatial scale (1 pc = 0.147 mas). The jet ridge line is shown by a green continuous line. (b) Residual (dirty) image of the same epoch. The displayed range is (−1.66:1.51) milliJy/beam, and the maximum signal-to-noise ratio is 4.1. The reduced chi-square is χ 2 = 1.2 .
Symmetry 15 00270 g003
Figure 4. Core separation of the identified jet components in the 15 GHz jet of PKS 1424+240 as a function of time (dots with errorbars), overlaid with fitted linear proper motions (continuous lines).
Symmetry 15 00270 g004
Figure 5. The logarithm of ratio R as function of ι 1 and ι 2 for spectral index α = 0.055 and for several choices of highly relativistic jet velocity ( β ).
Symmetry 15 00270 g005
Table 1. Linear proper motion of the jet components of the 15 GHz VLBI jet of PKS 1424+240 ( μ ) and their apparent velocity β a p p .
Component μ β app
(mas yr 1 )(c)
c 1 0.007 ± 0.004 0.25 ± 0.13
c 2 0.015 ± 0.006 0.54 ± 0.23
c 3 0.043 ± 0.016 1.51 ± 0.57
Disclaimer/Publisher’s Note: The statements, opinions and data contained in all publications are solely those of the individual author(s) and contributor(s) and not of MDPI and/or the editor(s). MDPI and/or the editor(s) disclaim responsibility for any injury to people or property resulting from any ideas, methods, instructions or products referred to in the content.

