
Asymmetry of Structural and Electrophysical Properties of Symmetrical Titania Nanotubes as a Result of Modification with Barium Titanate

 , ,
, ,
Abstract
:1. Introduction
2. Materials and Methods
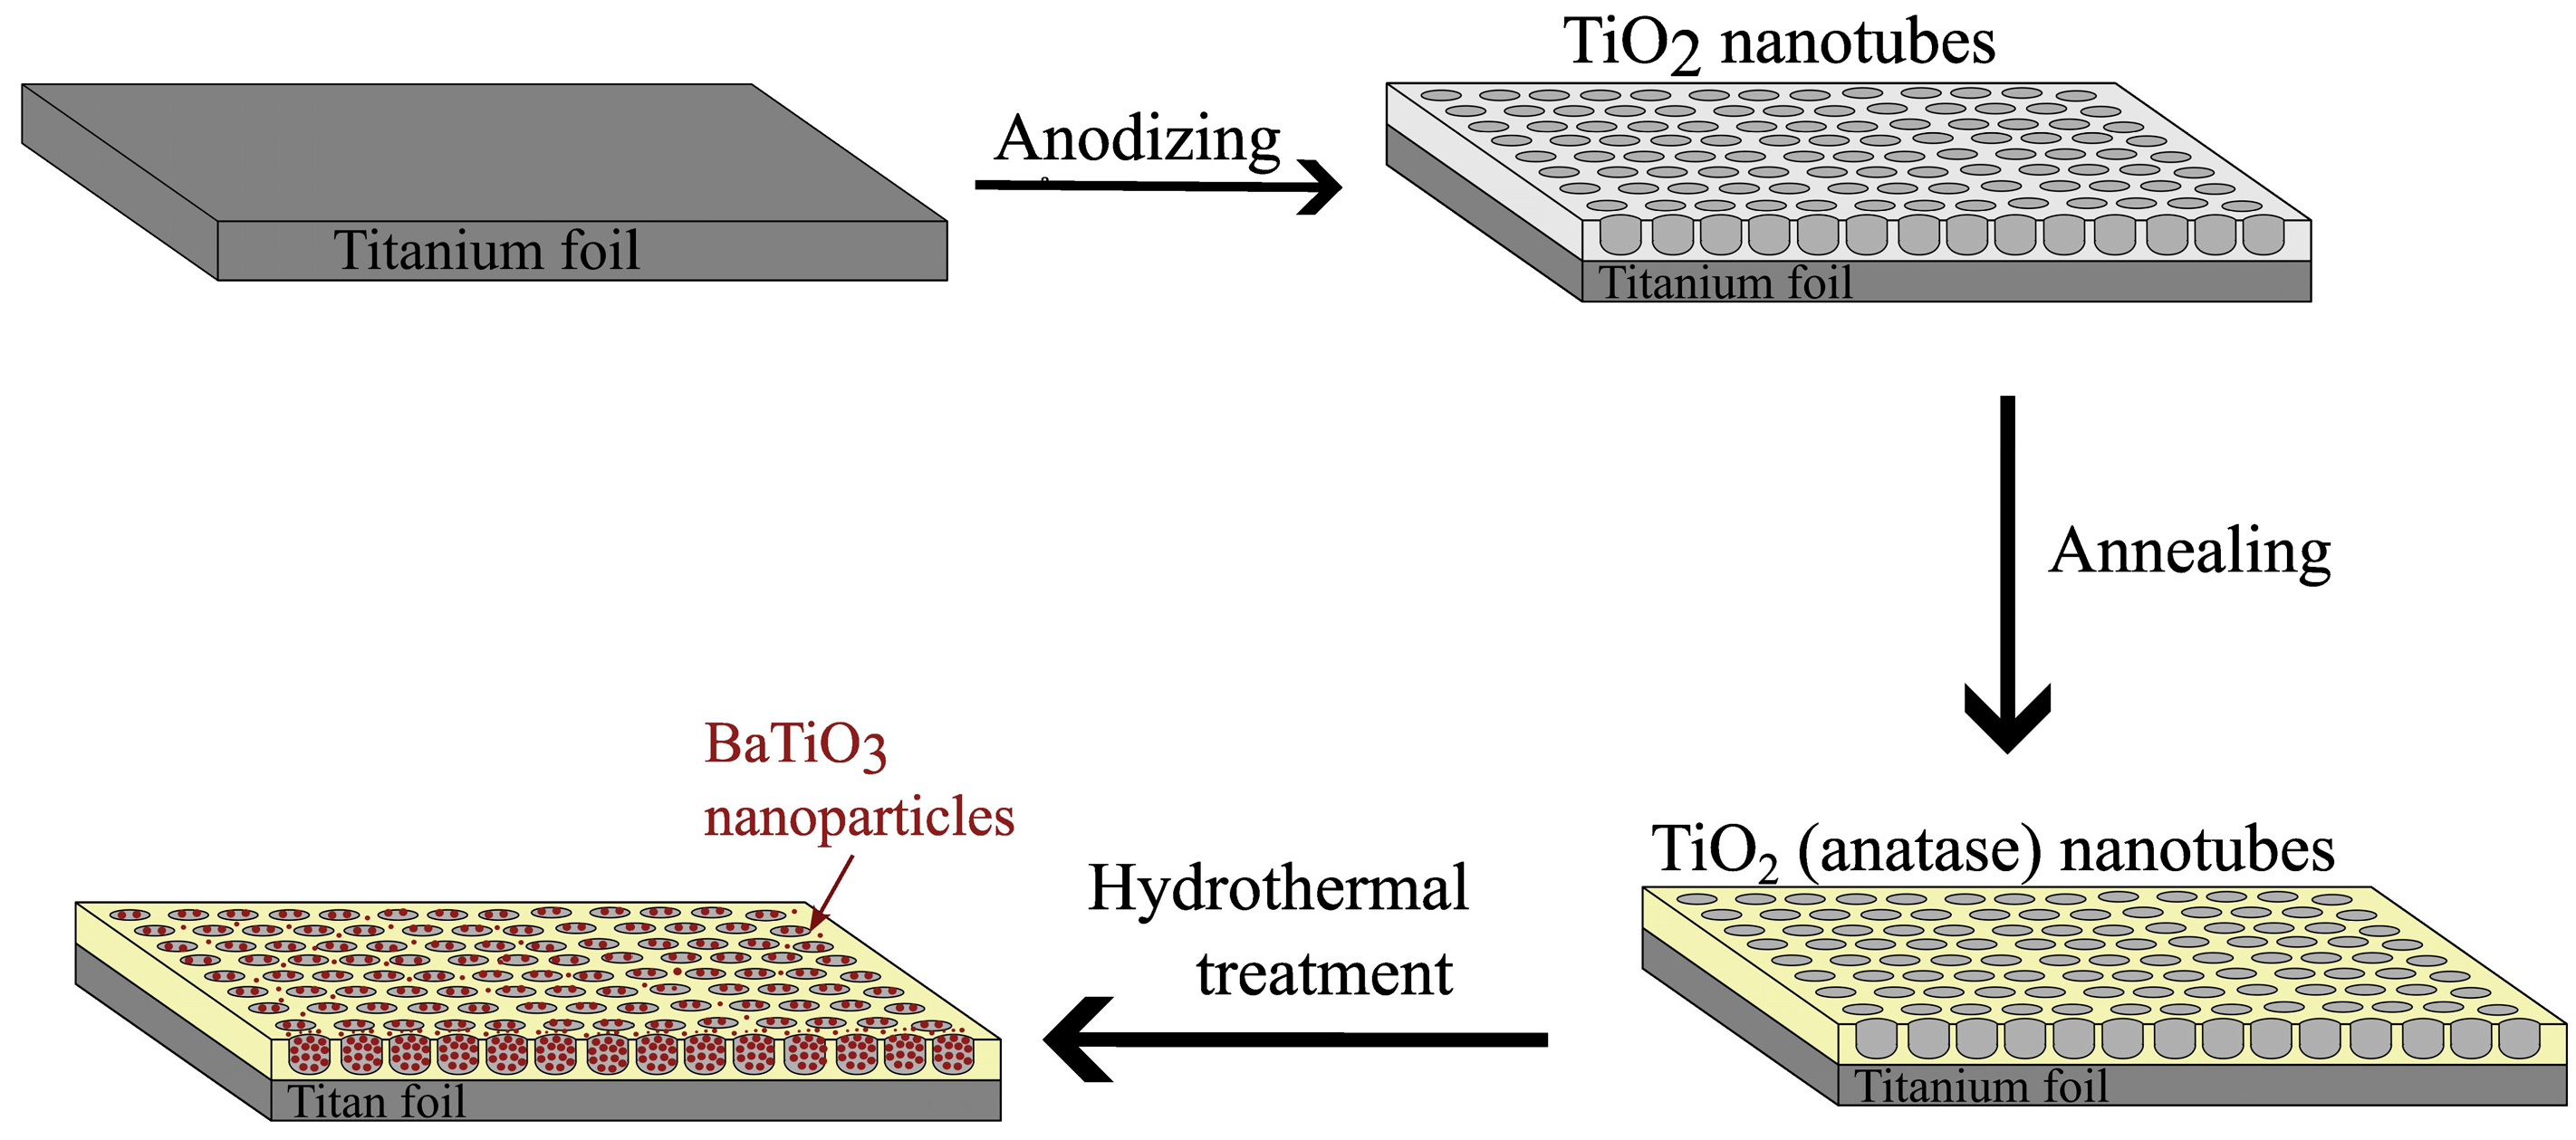
2.1. Nanotube Arrays
2.2. Surface Modification
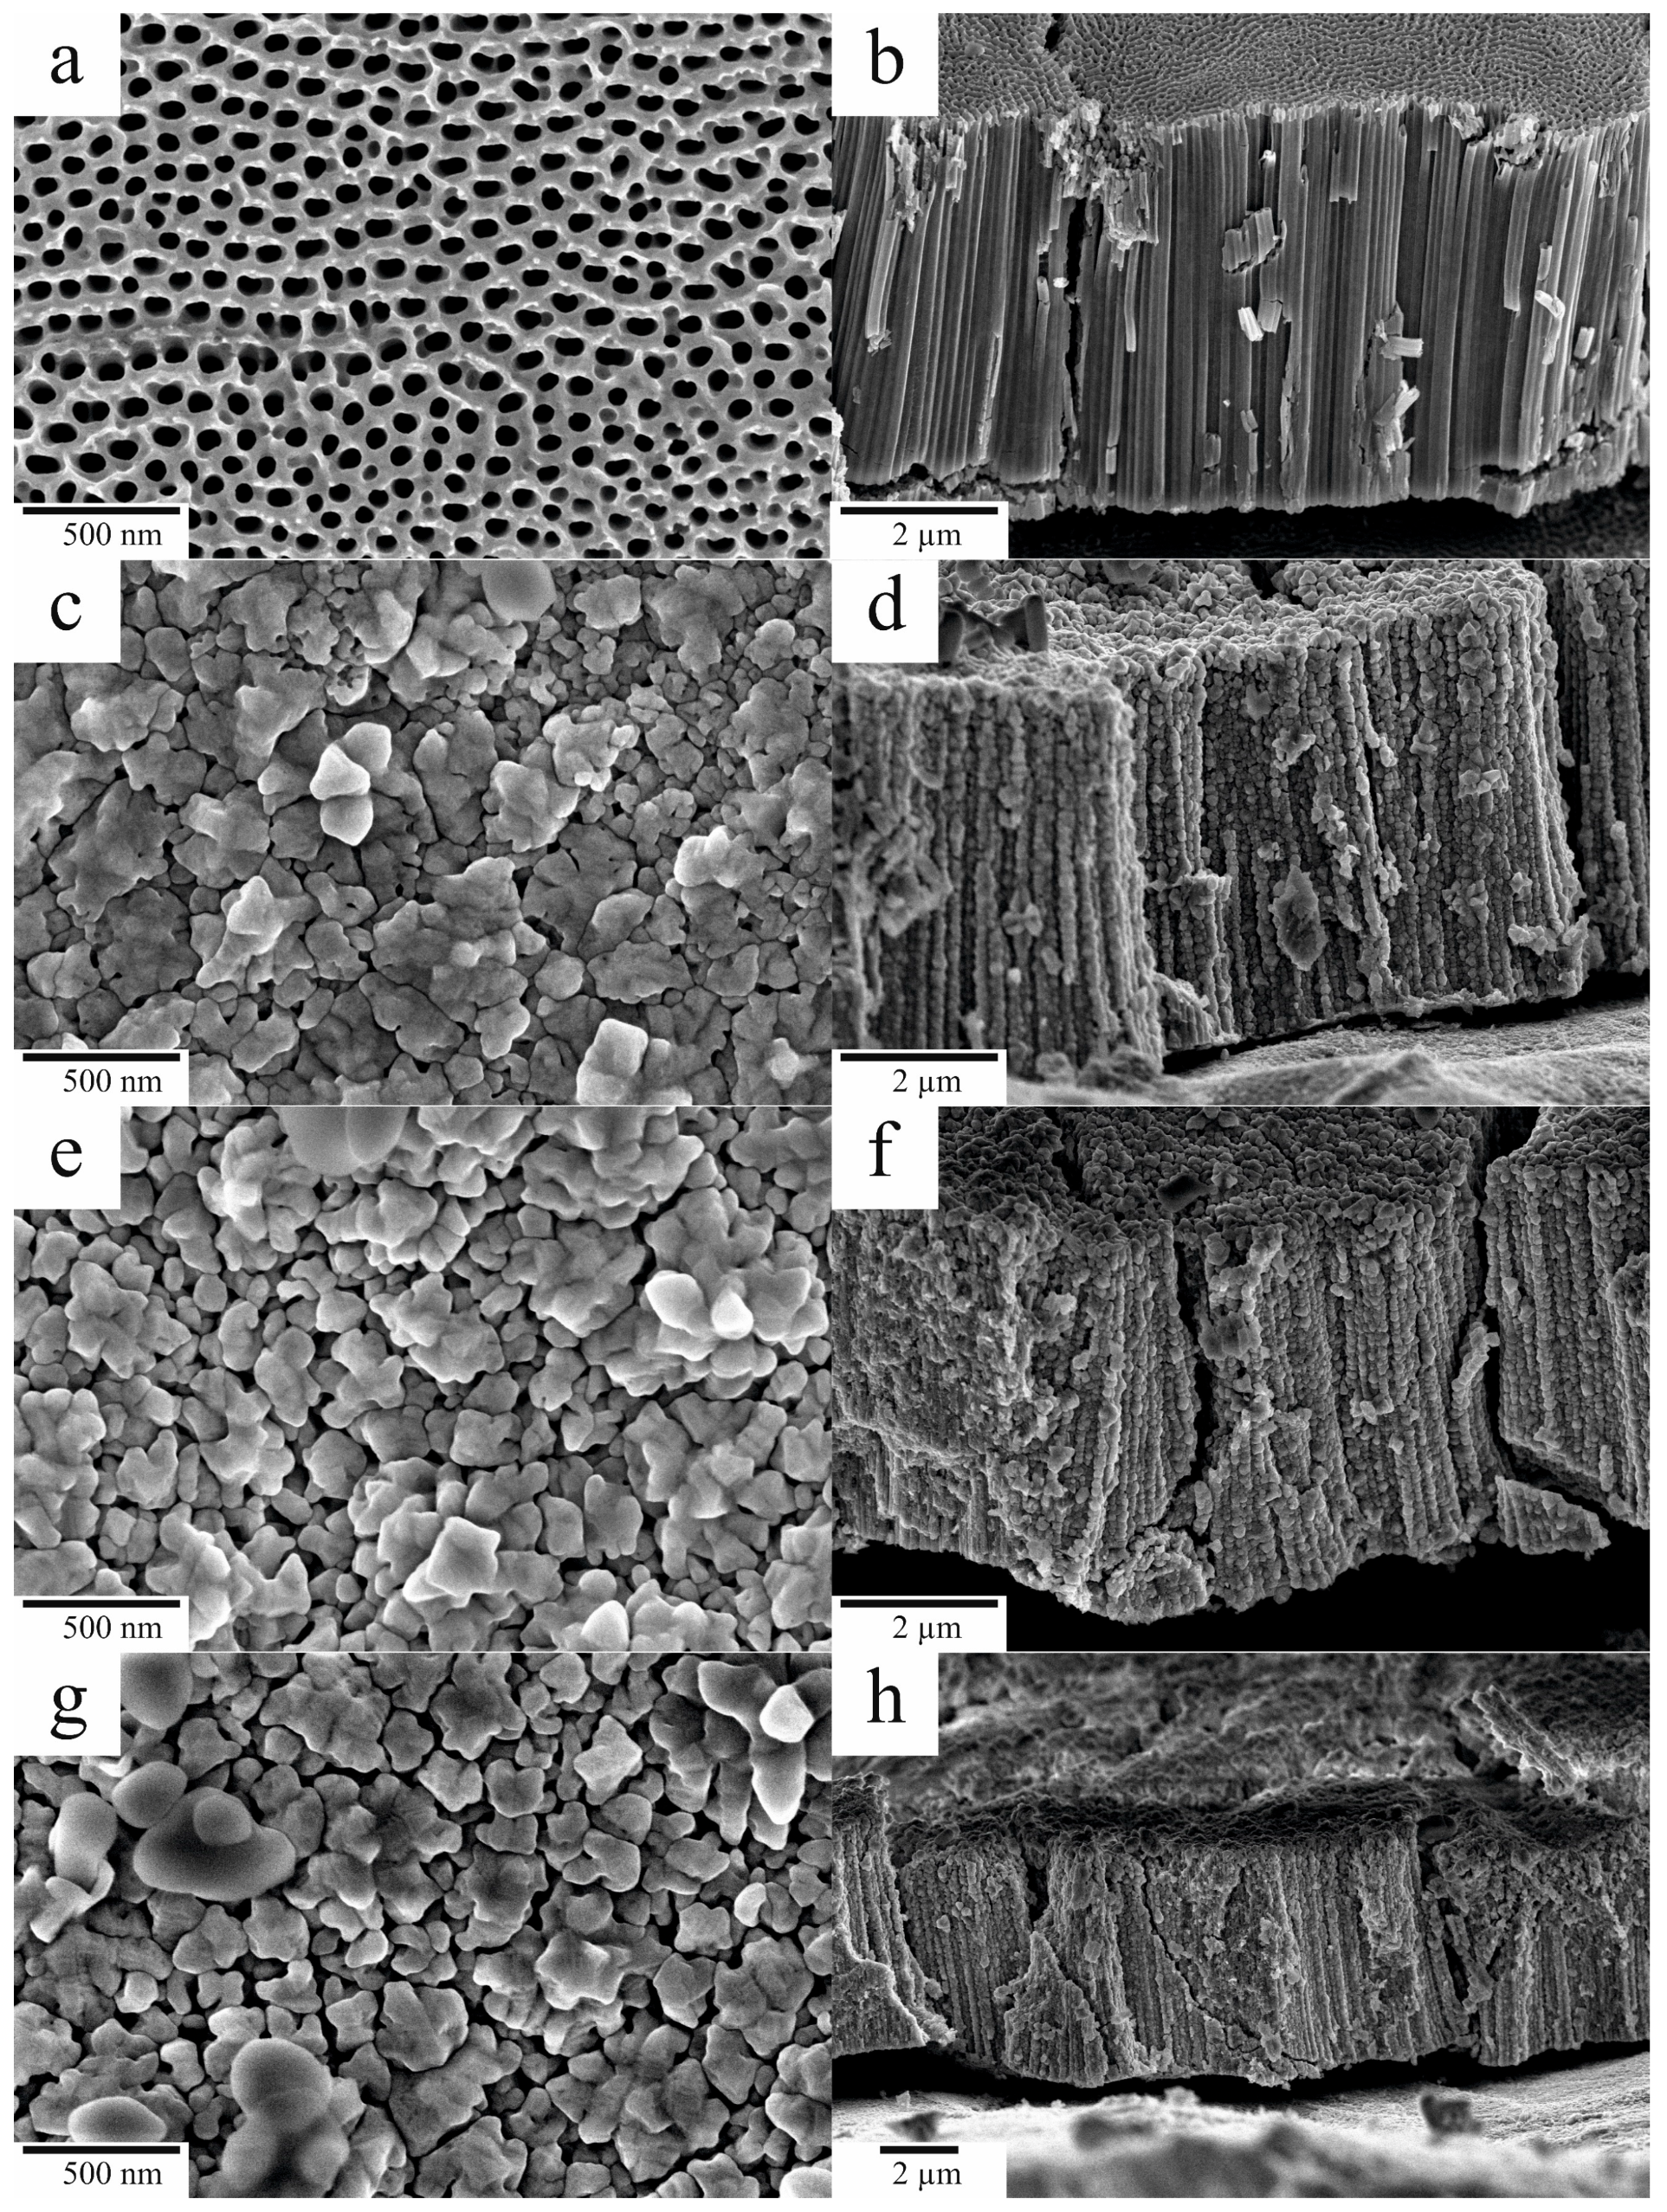
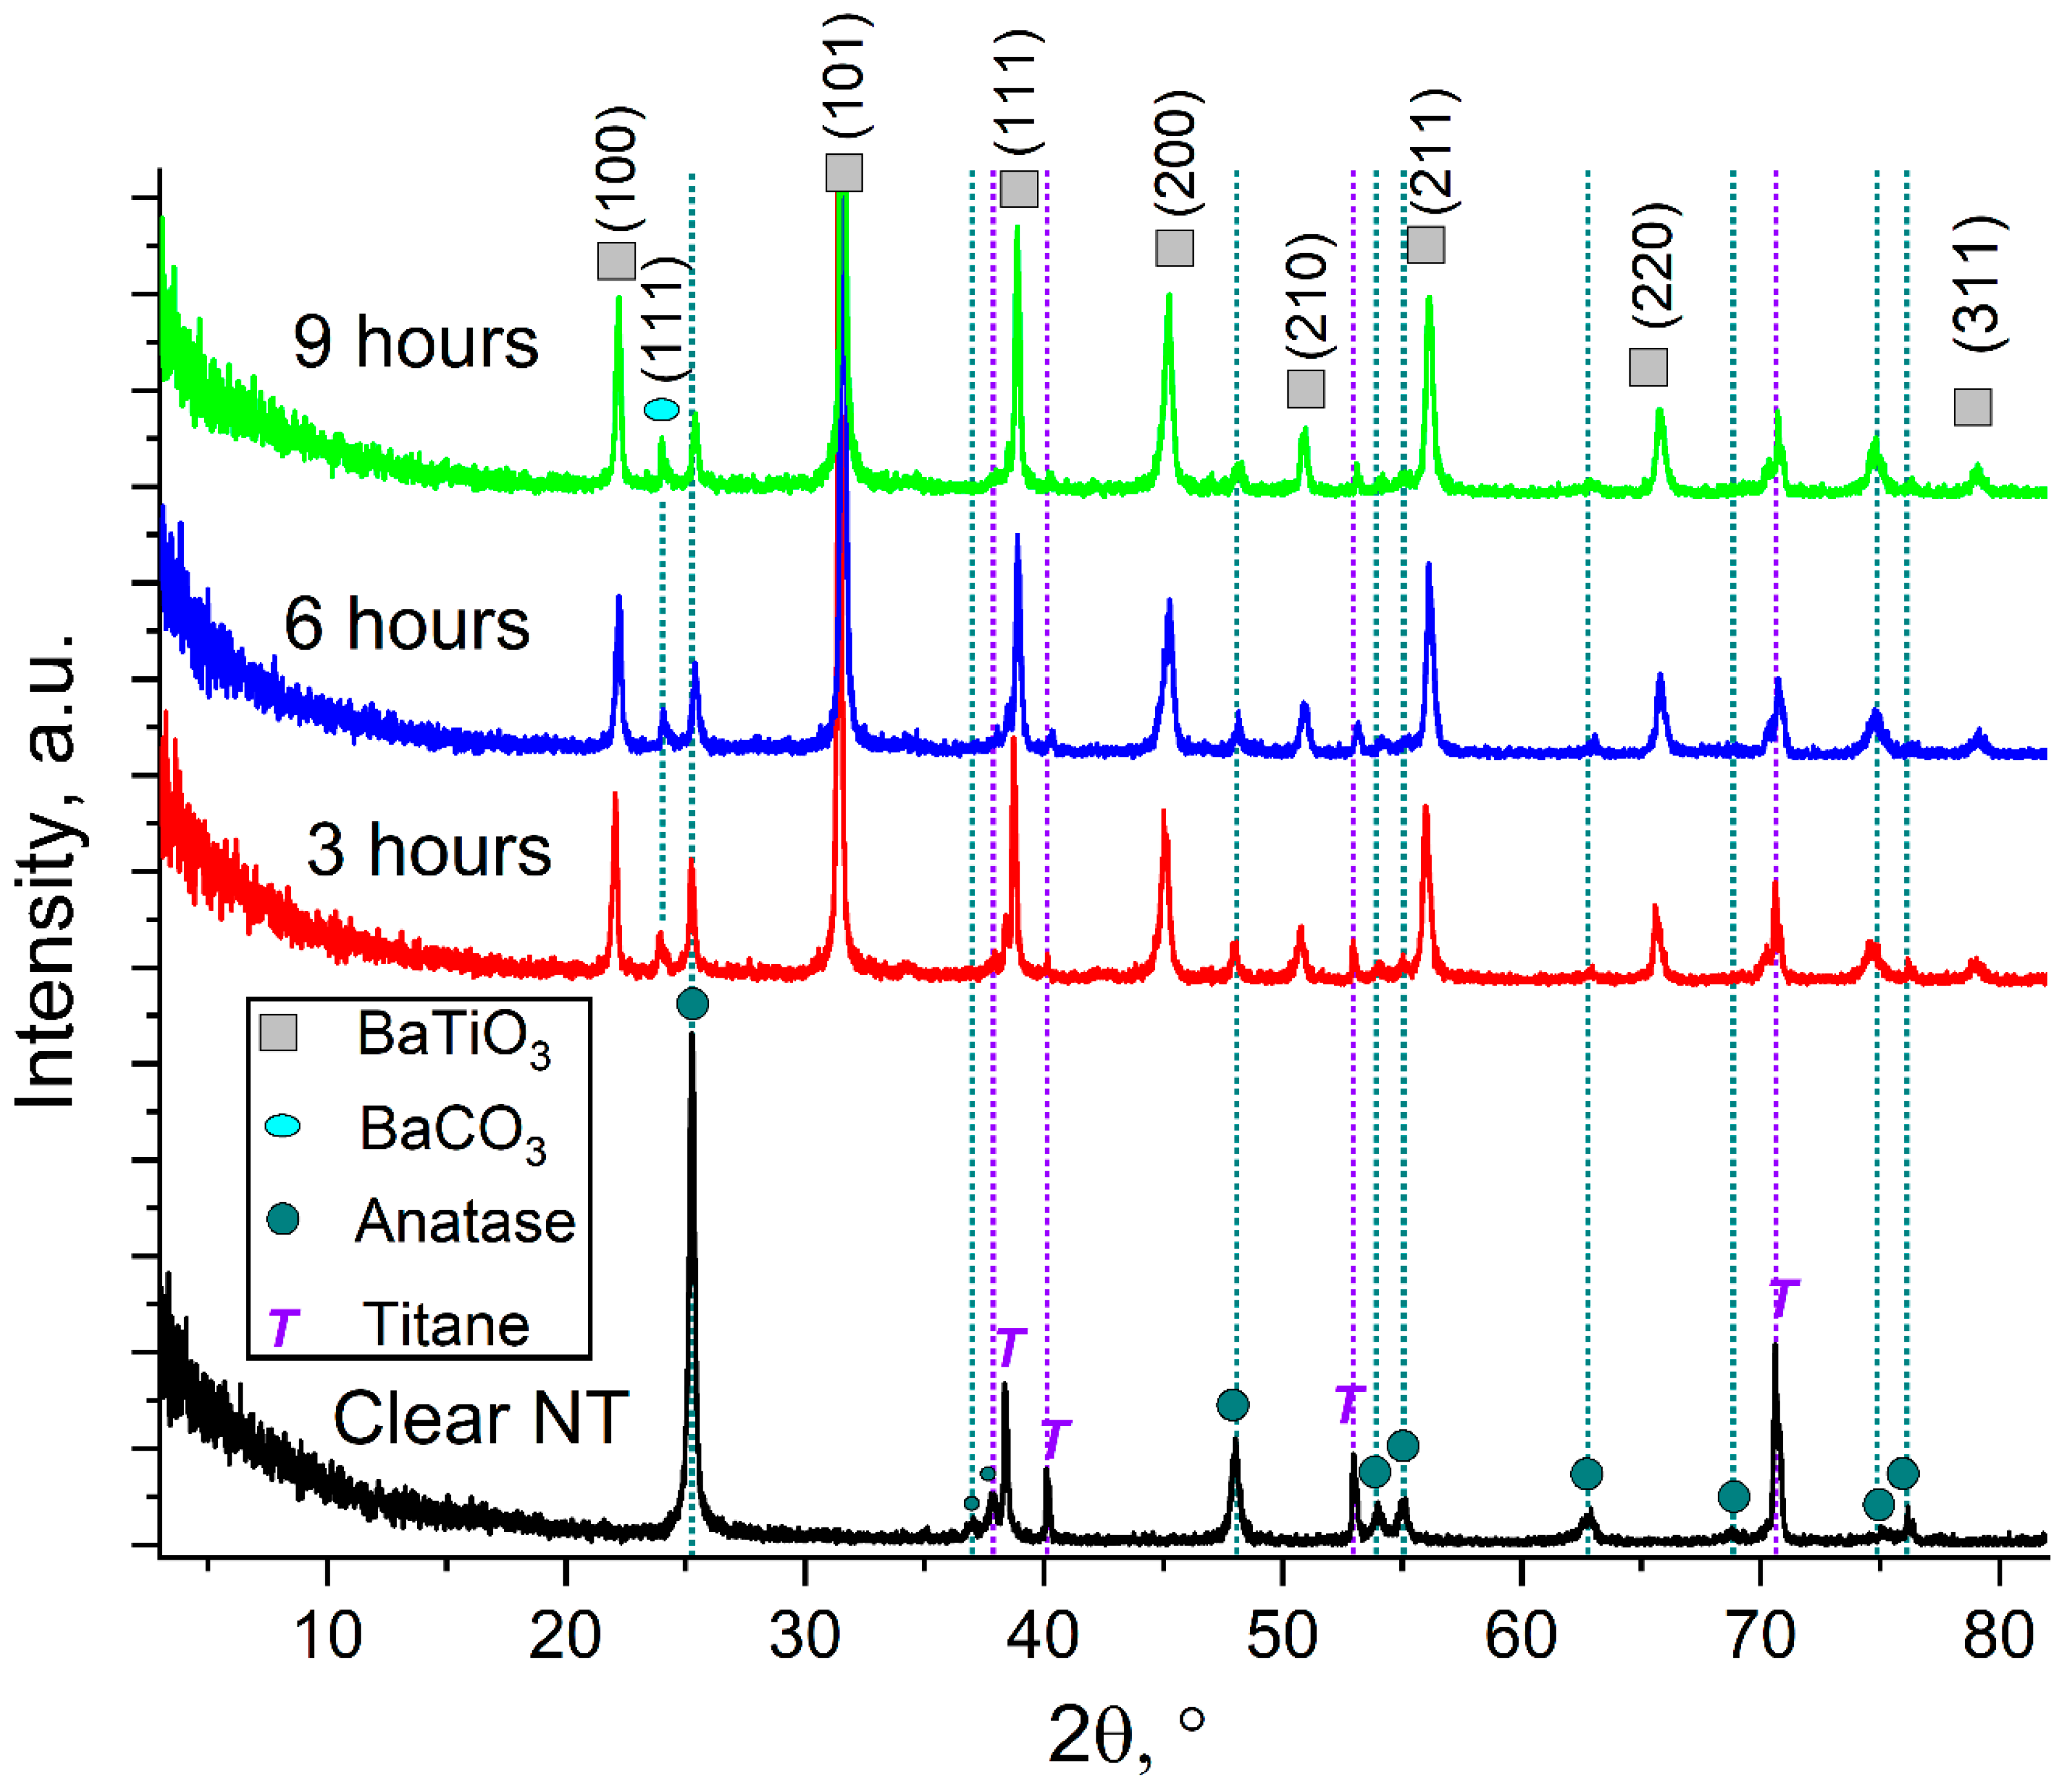
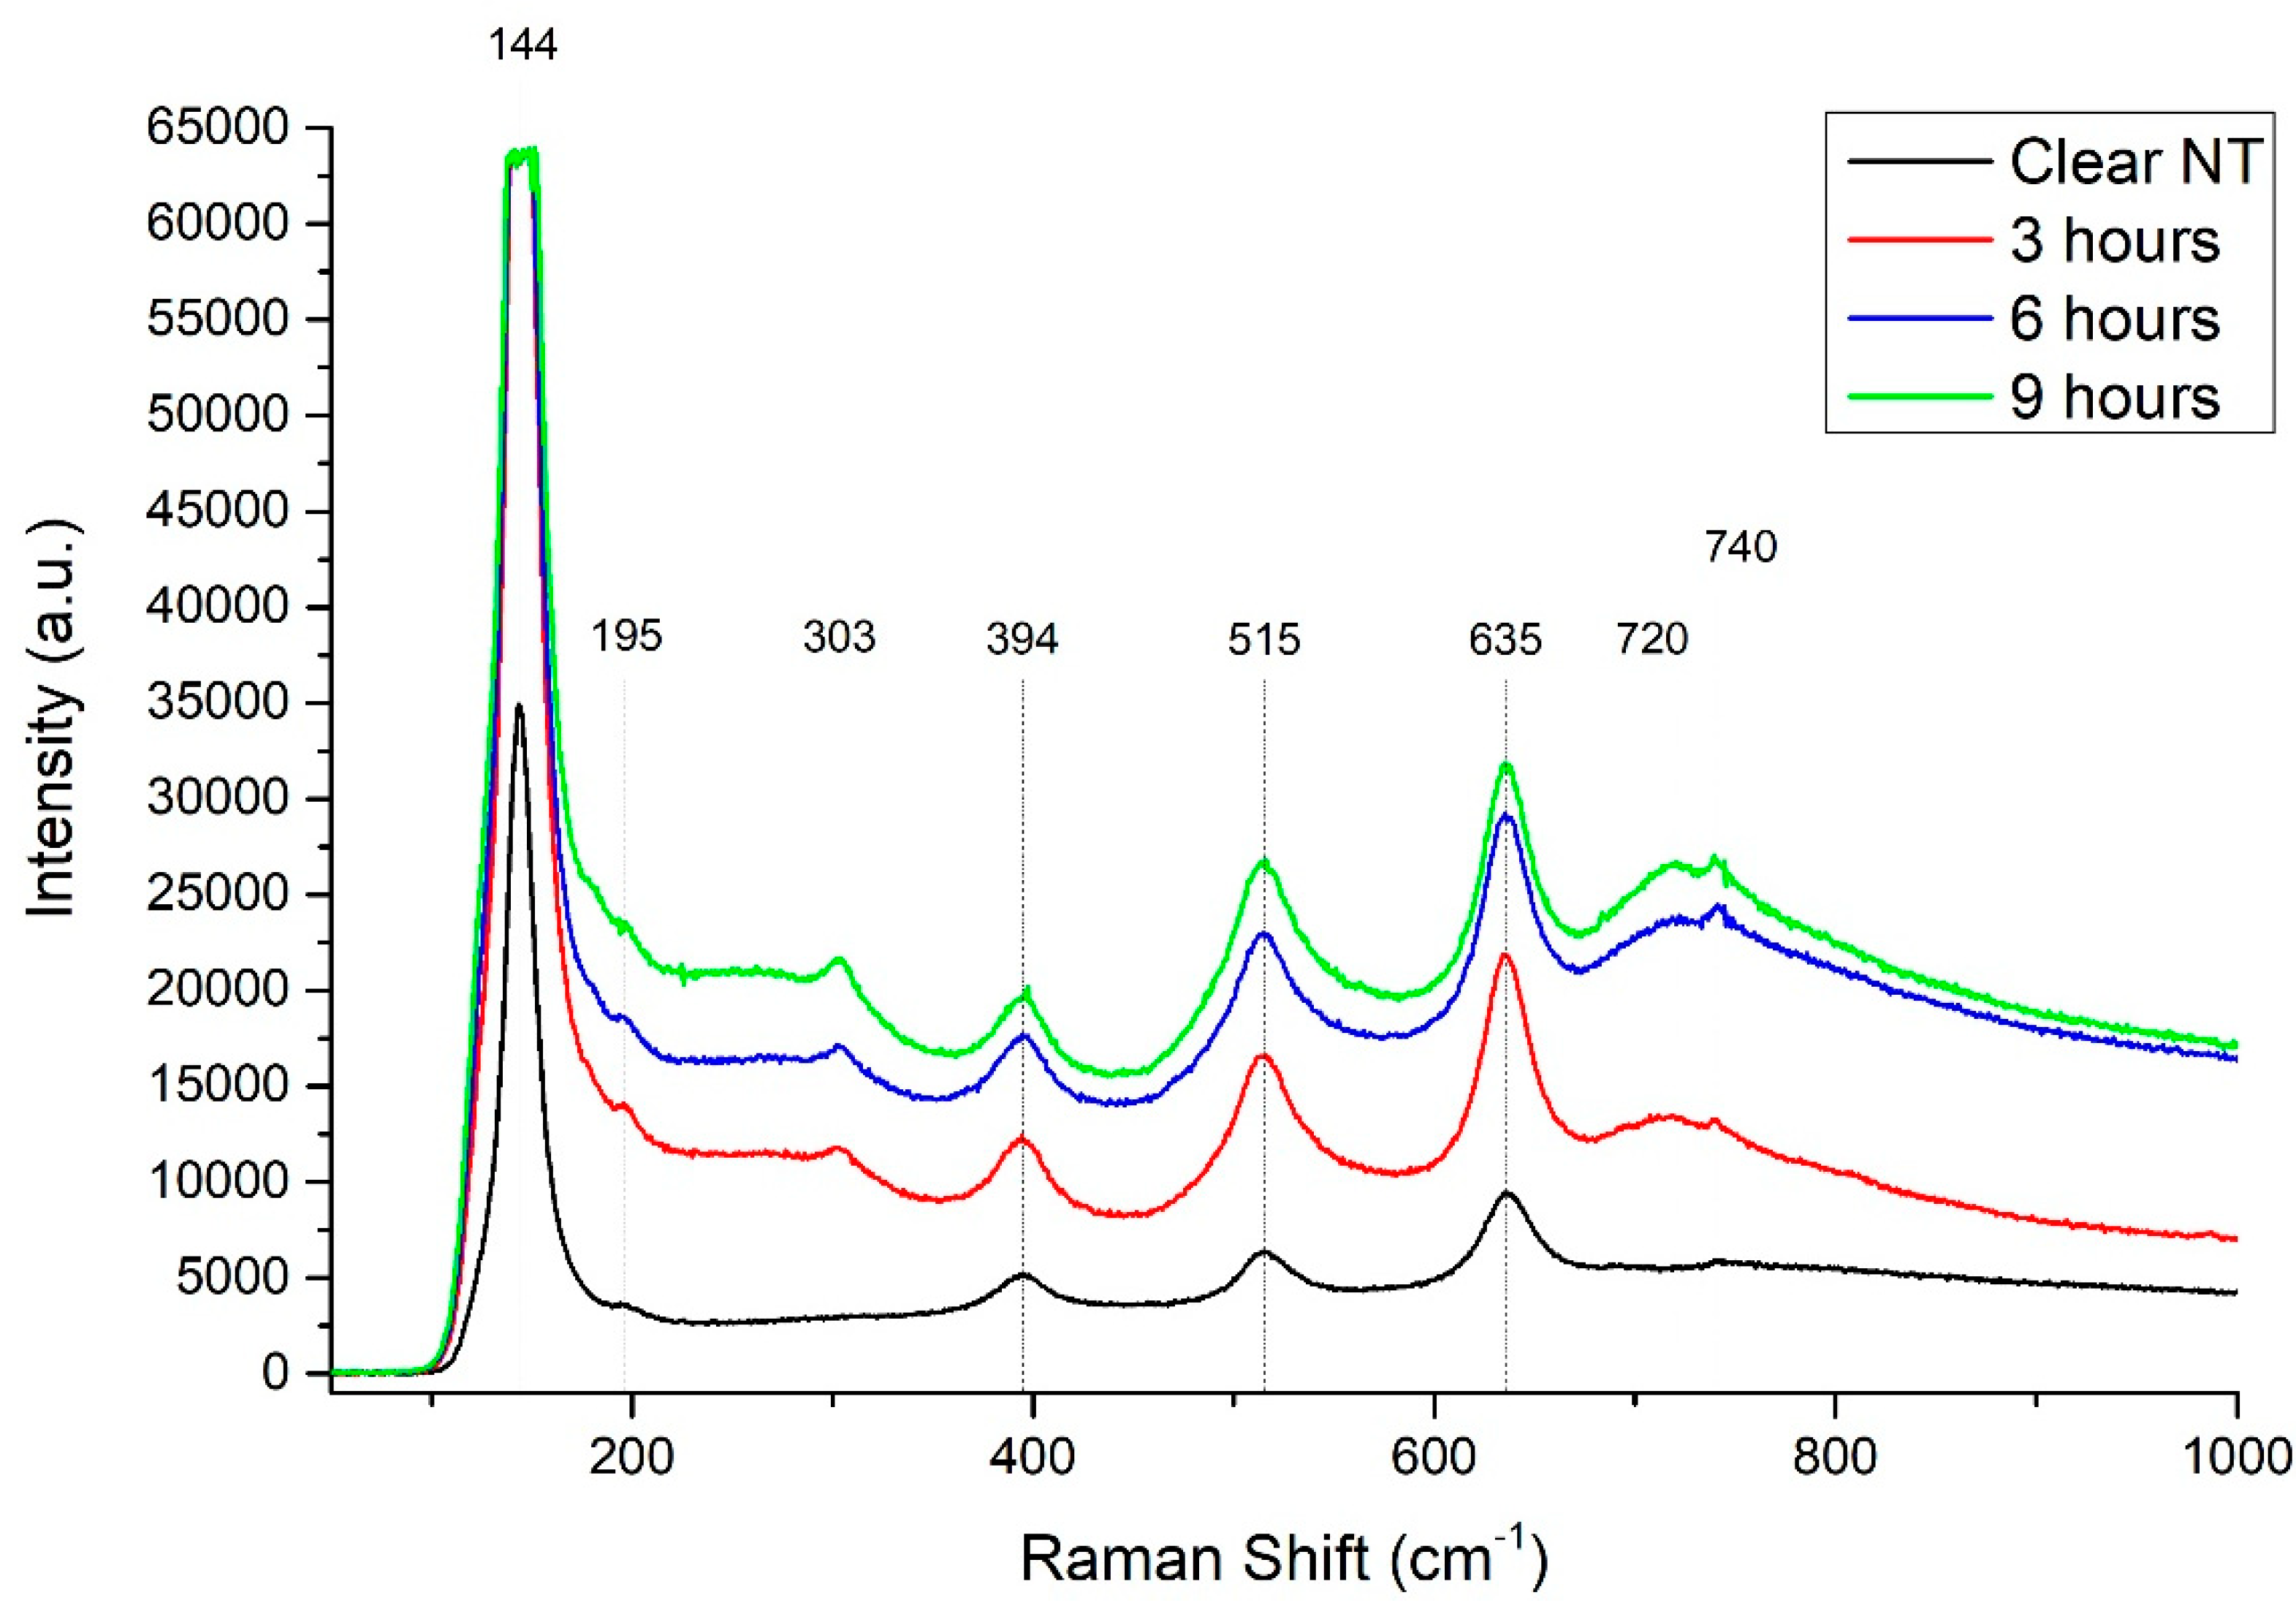
2.3. SEM, EDX, XRD
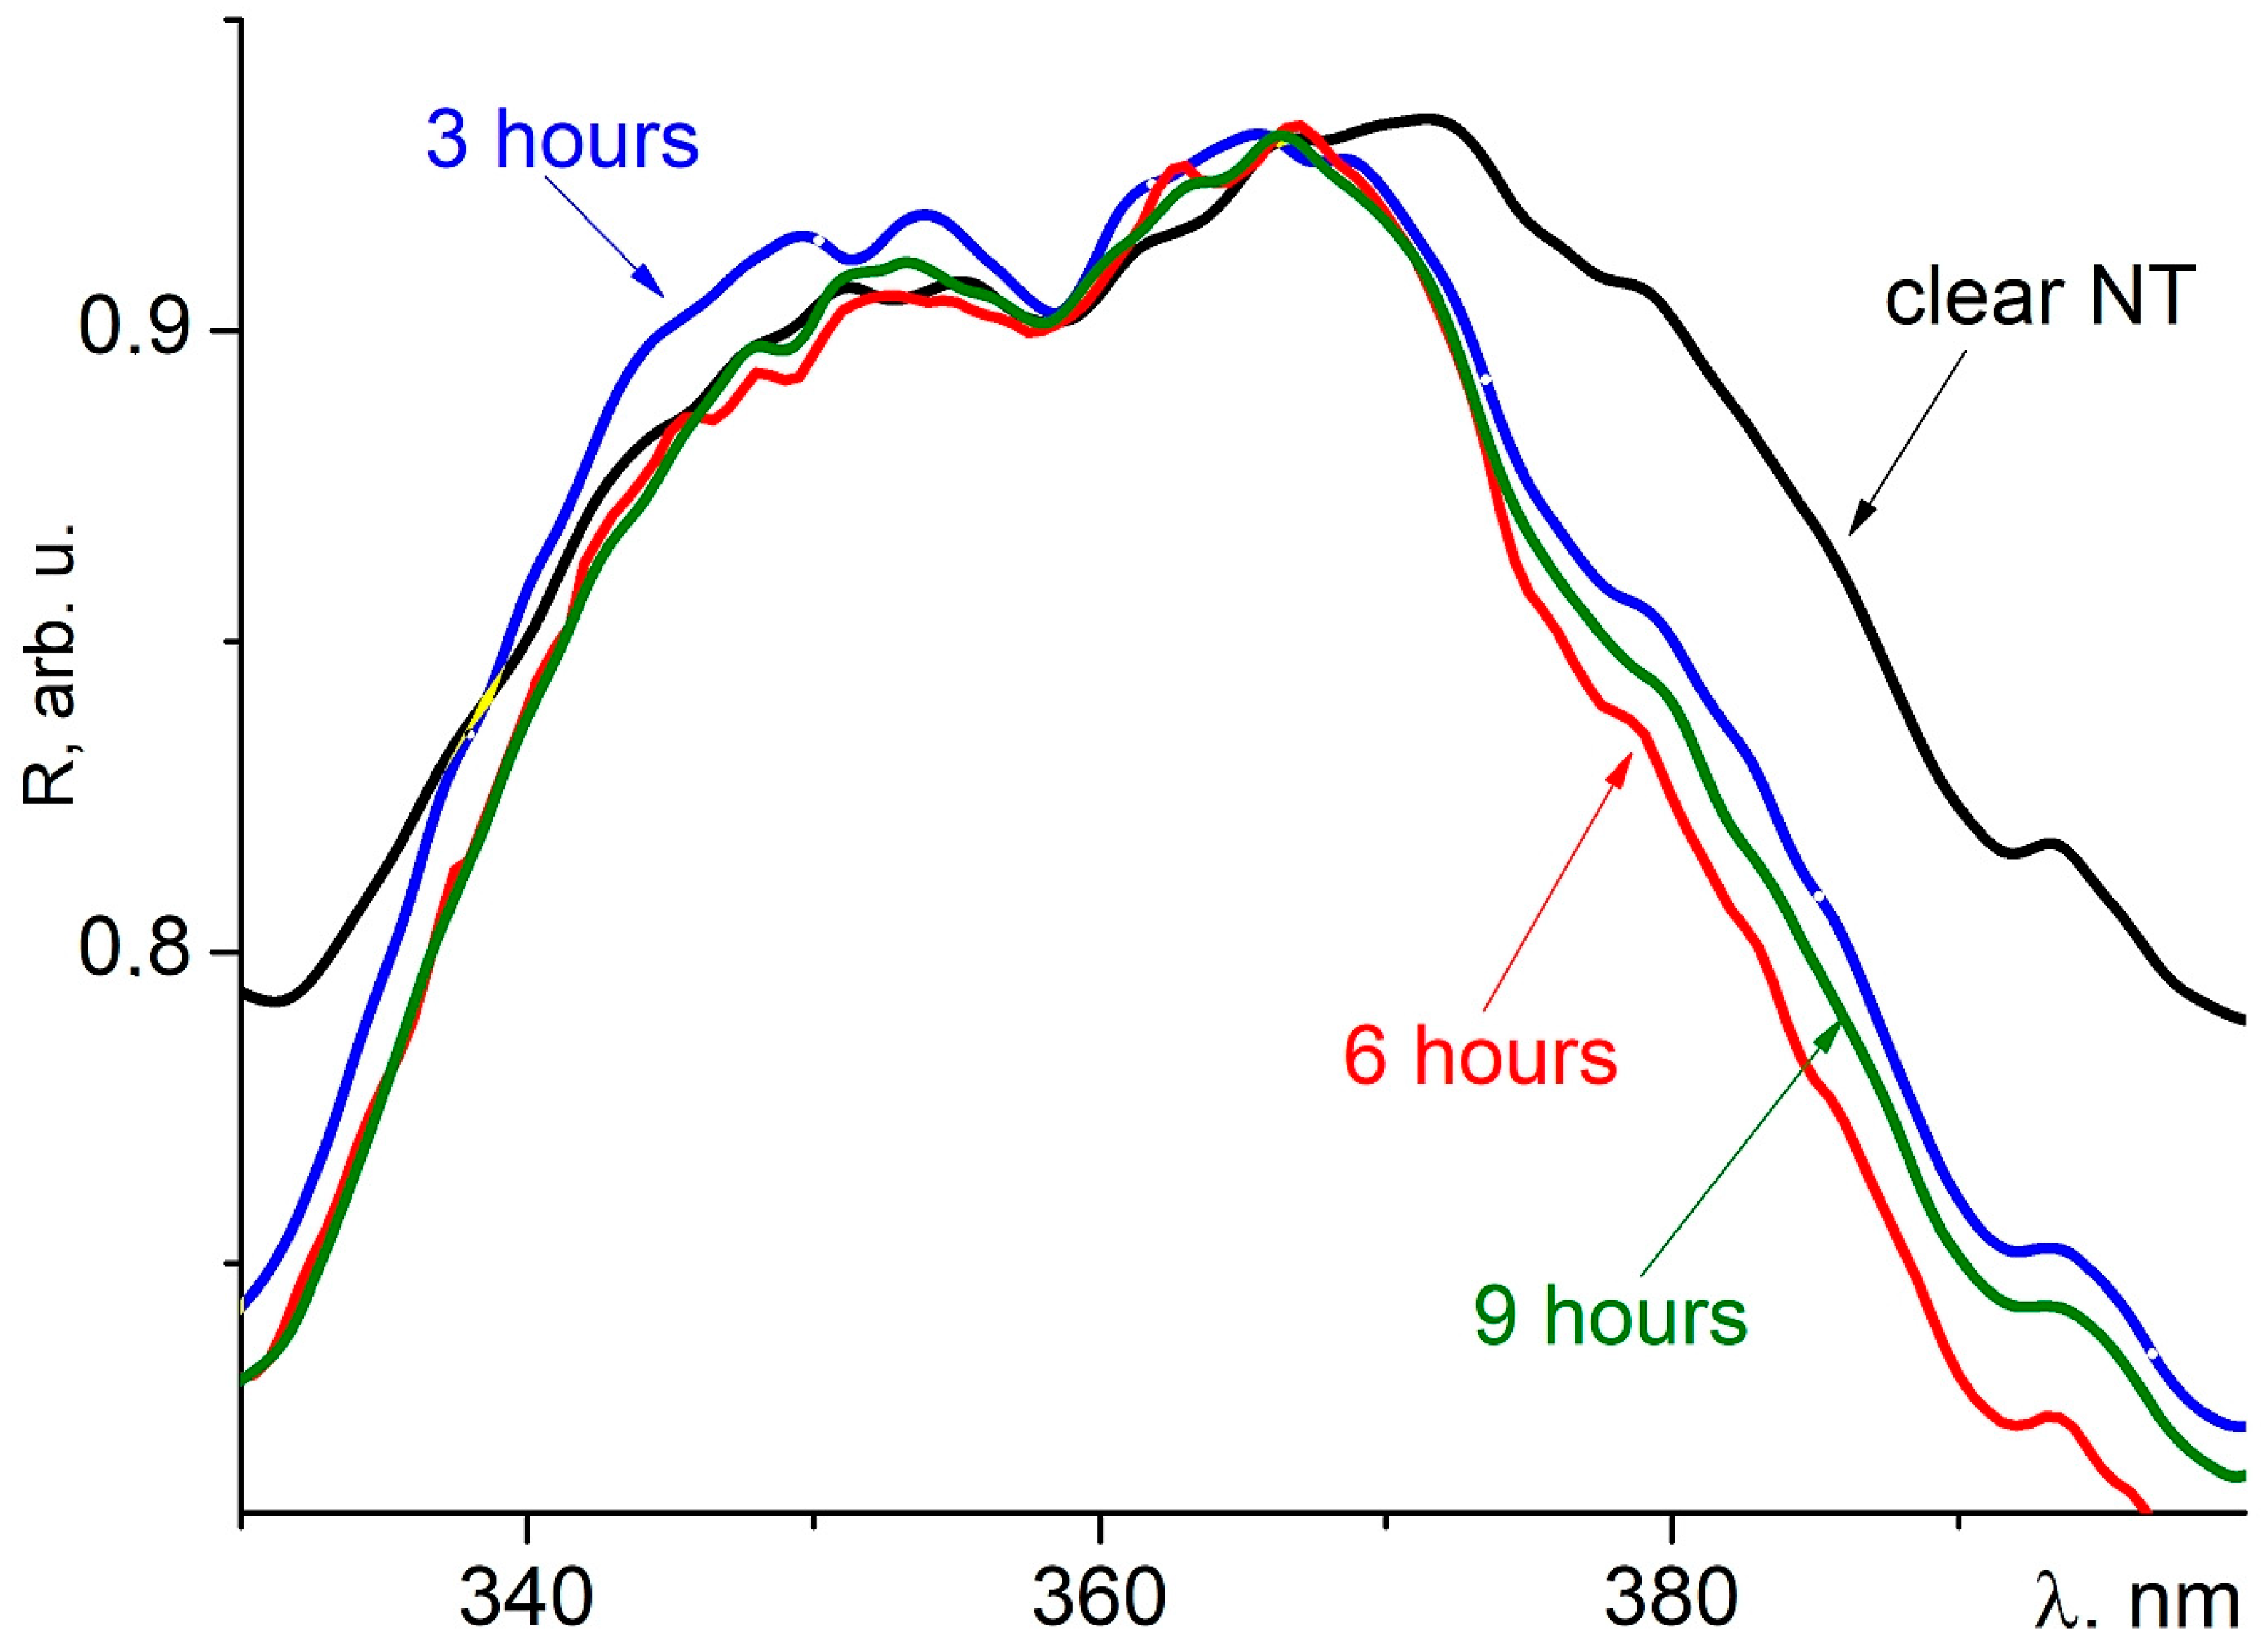
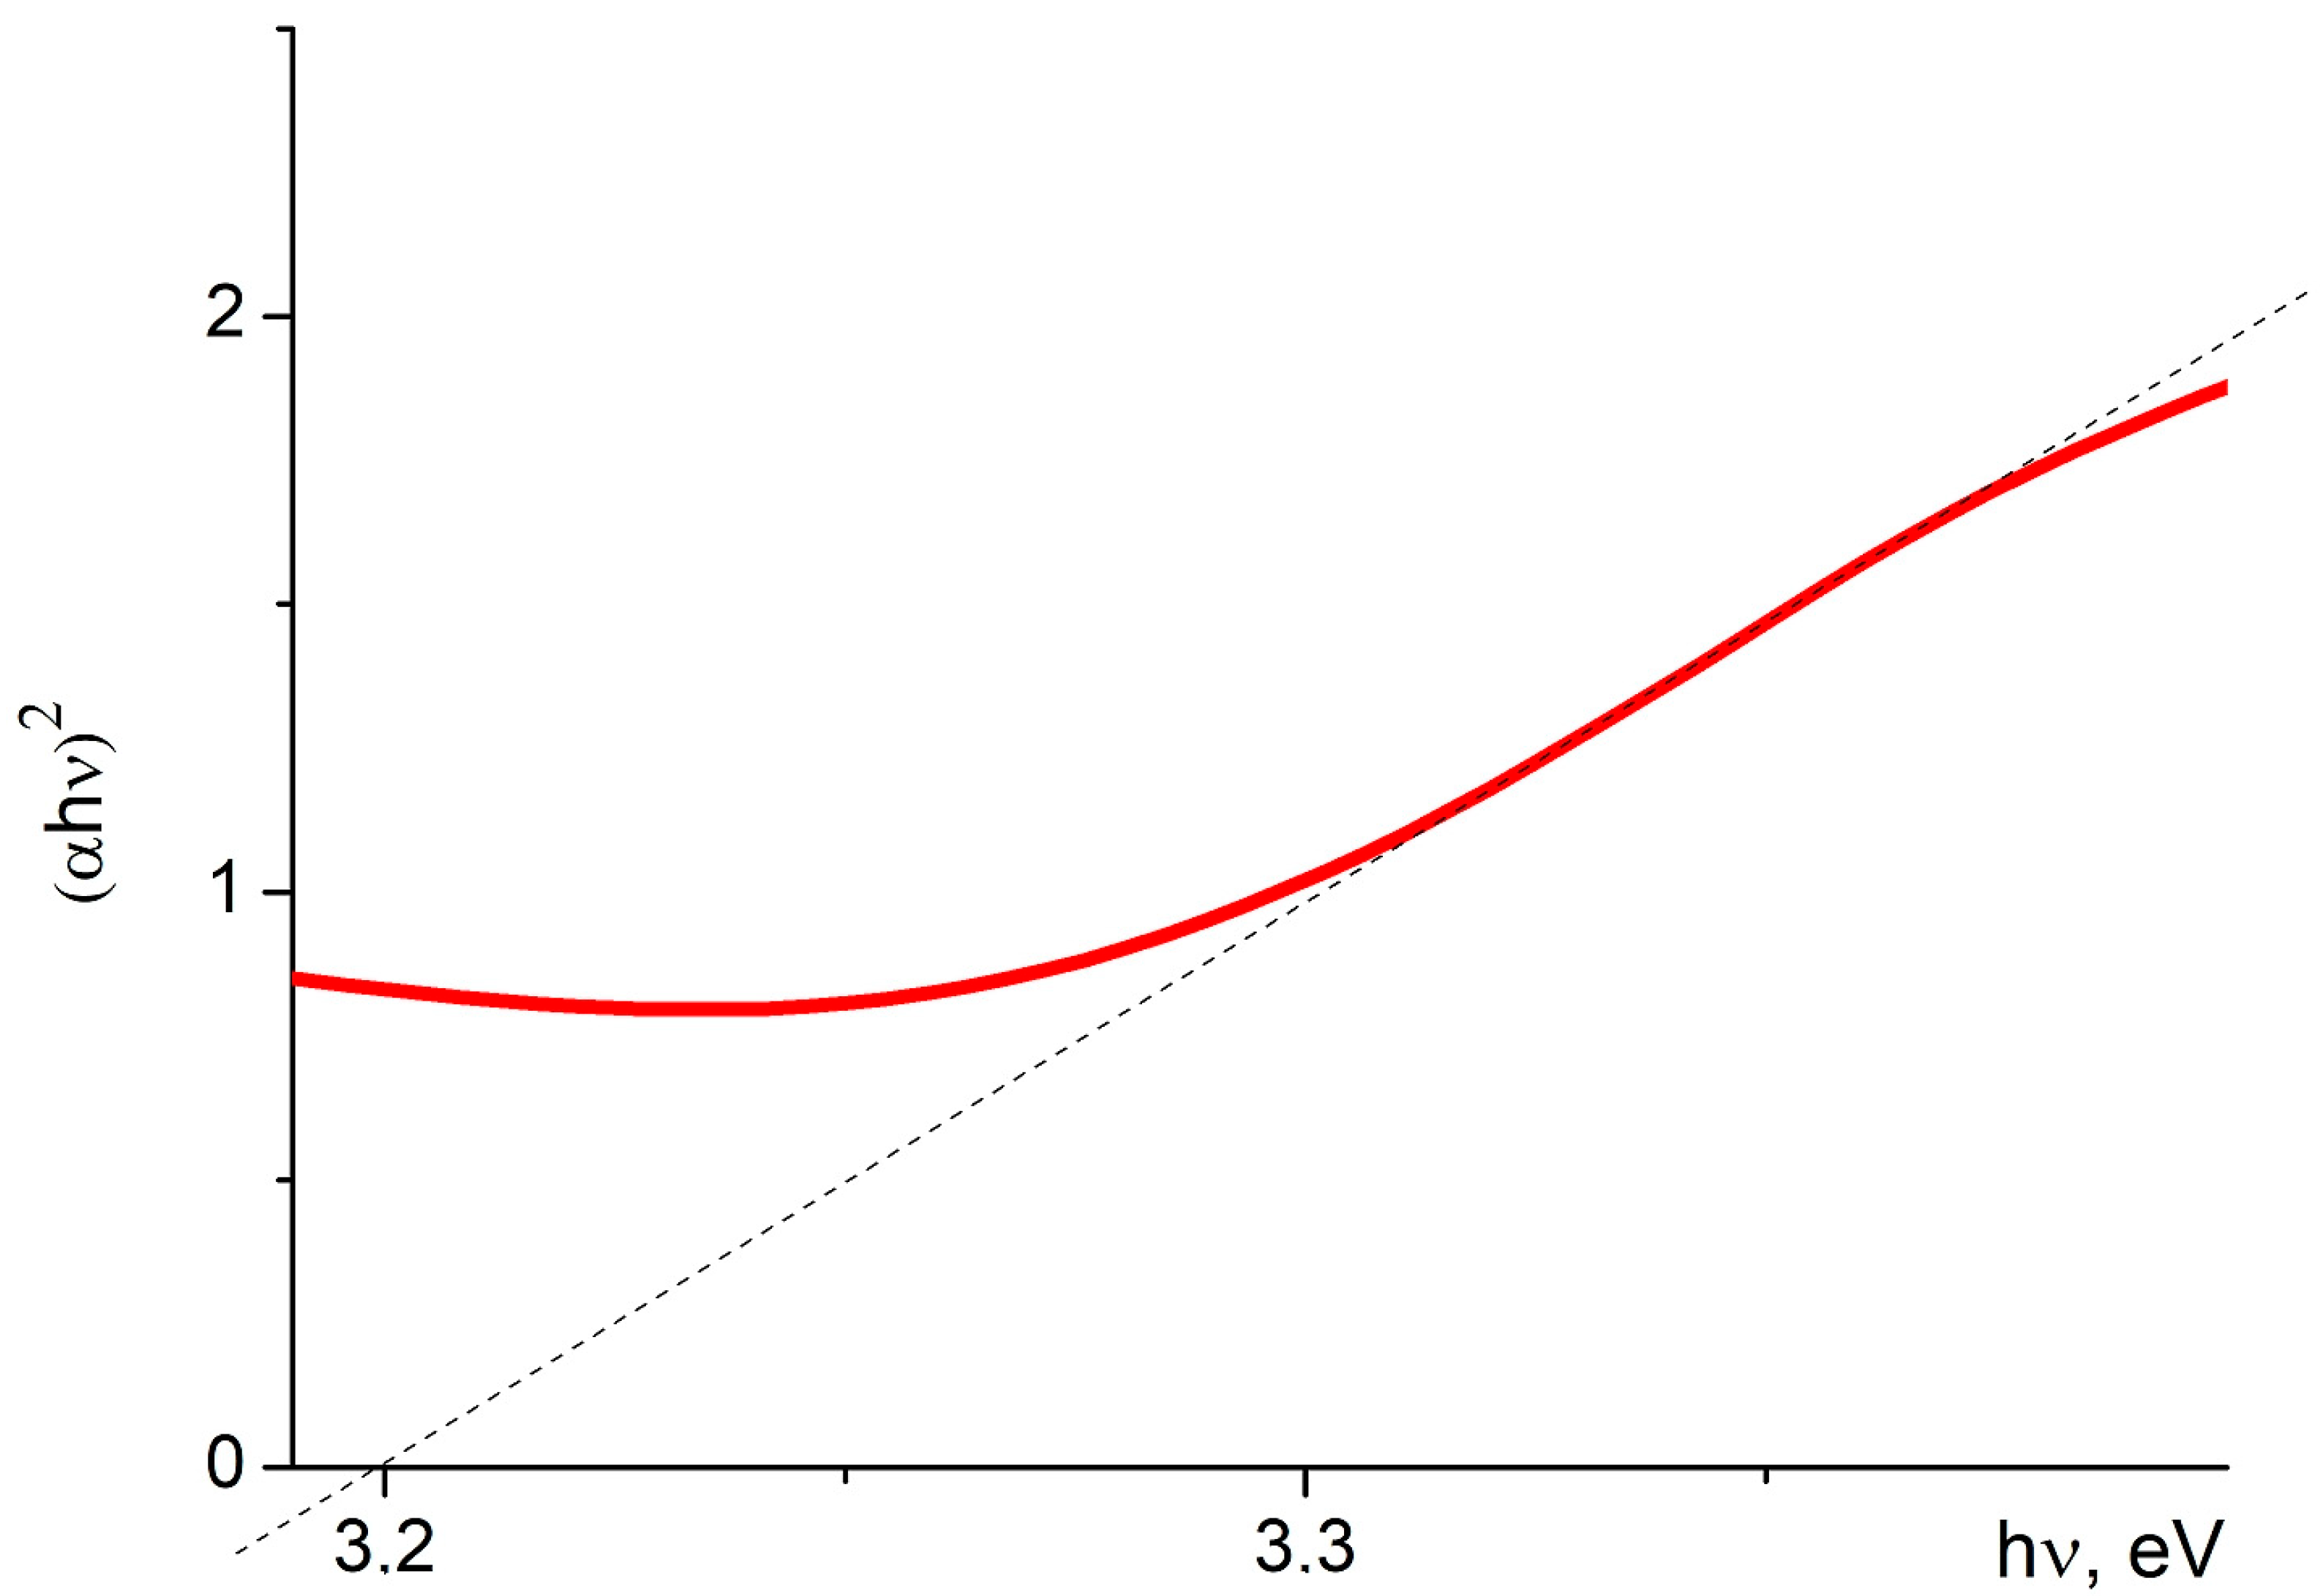
2.4. Optics
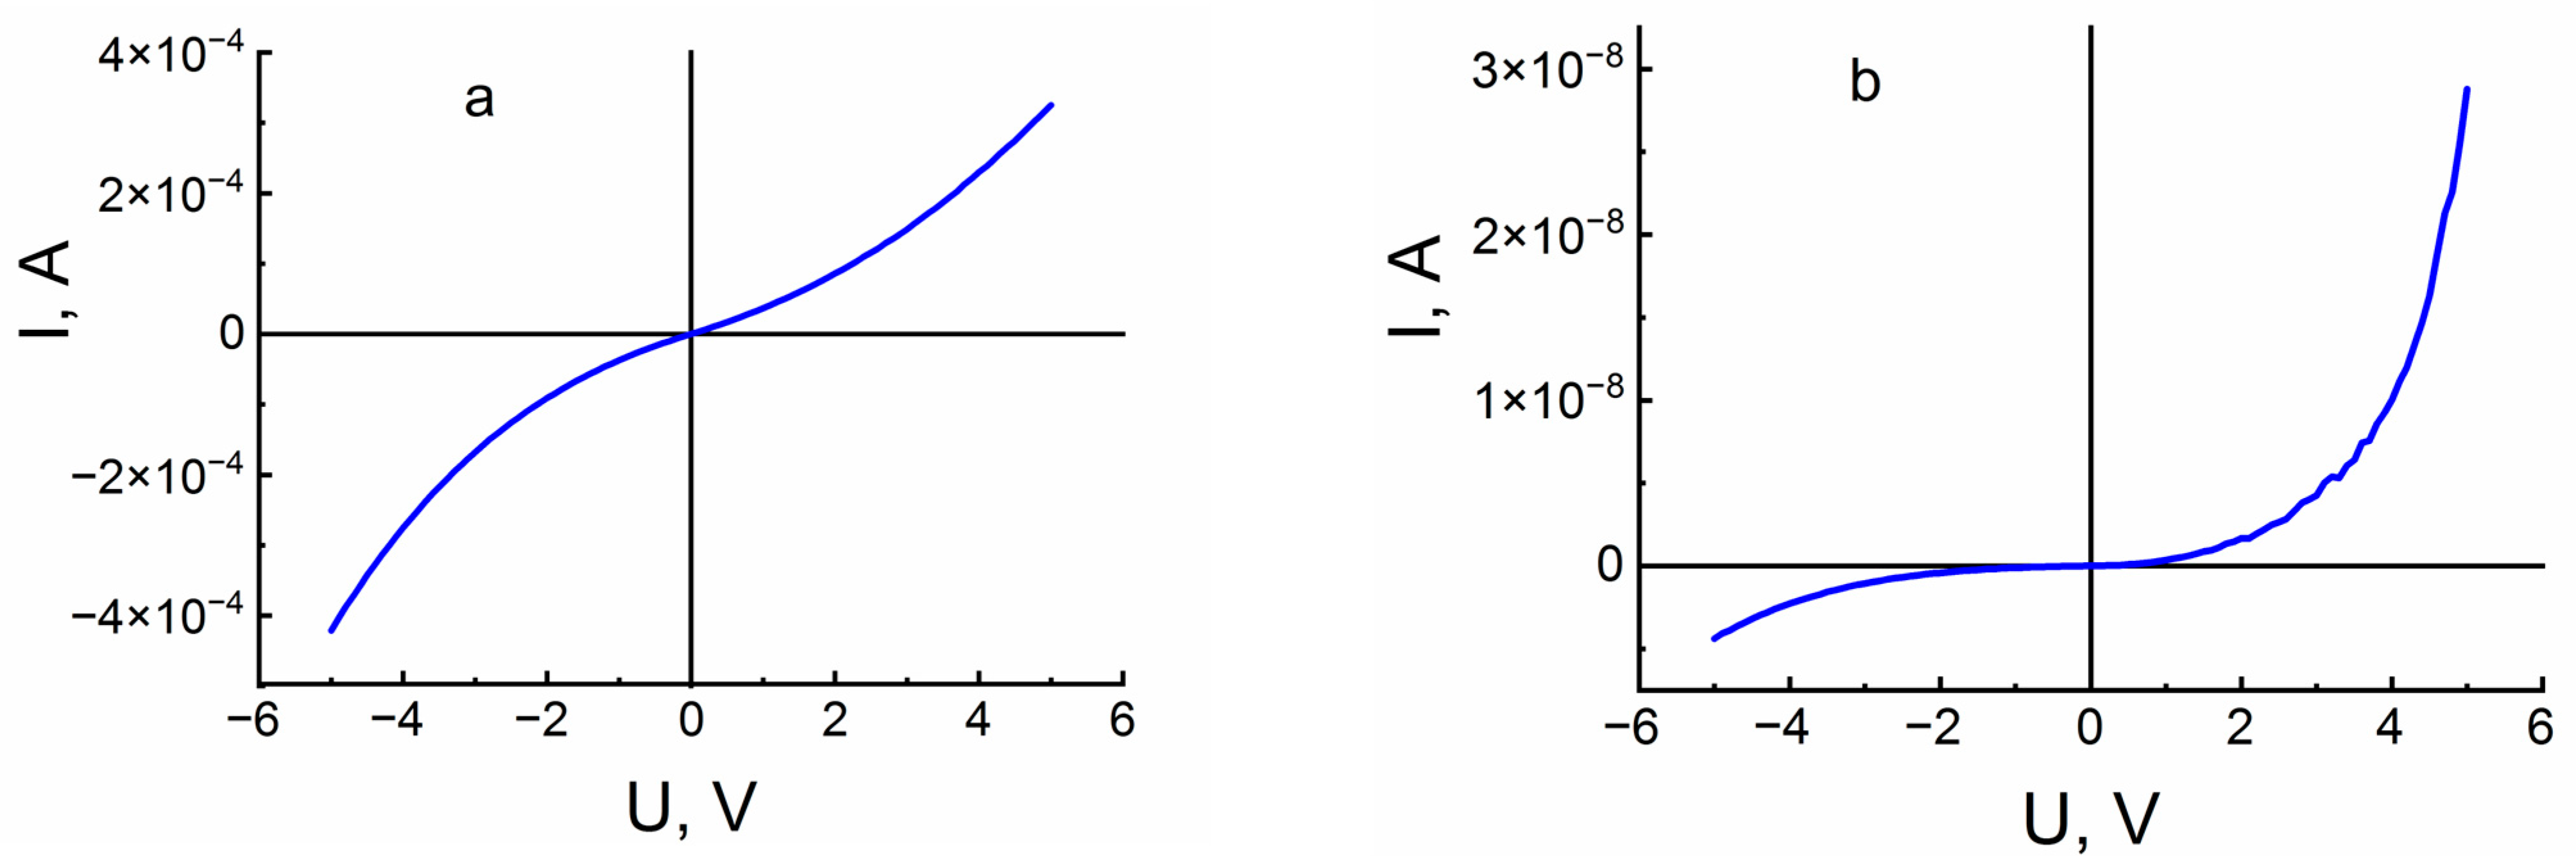
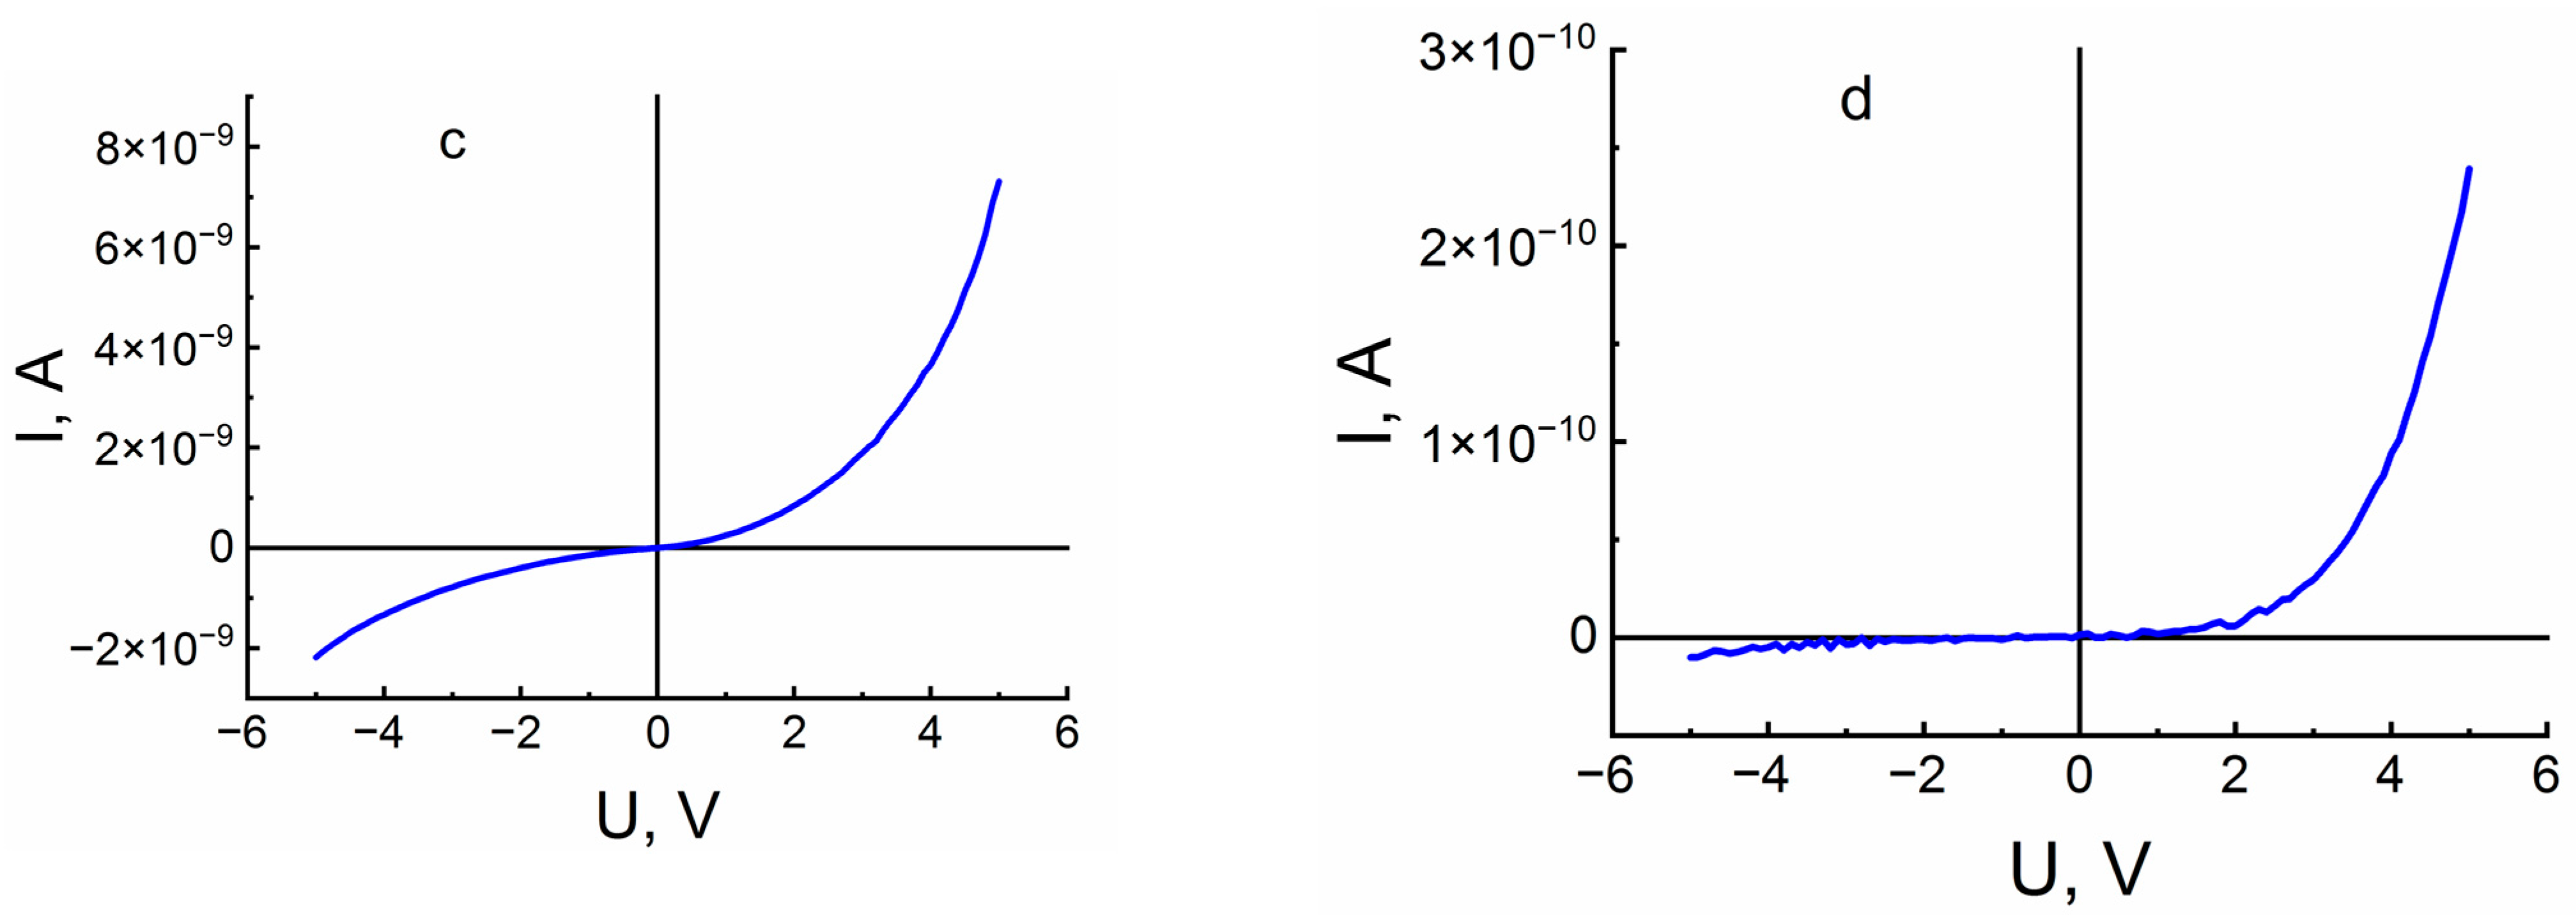
2.5. Electrophysics
2.6. EPR
3. Results
4. Conclusions
Author Contributions
Funding
Data Availability Statement
Acknowledgments
Conflicts of Interest
References
- Chen, S.; Zhou, Y.; Luo, H.; Tang, L.; Guo, R.; Zhang, D. Core-shell TiO2@ HfO2 nanowire arrays with designable shell thicknesses for improved permittivity and energy density in polymer nanocomposites. Compos. Part A Appl. Sci. Manuf. 2020, 137, 106012. [Google Scholar] [CrossRef]
- Choi, J.O.; Kim, T.Y.; Park, S.M.; Seol, W.; Joh, H.; Anoop, G.; Jo, J.Y. Co:BaTiO3/Sn:BaTiO3 Heterostructure Thin-Film Capacitors with Ultrahigh Energy Density and Breakdown Strength. Adv. Electron. Mater. 2023, 9, 2201141. [Google Scholar] [CrossRef]
- Liu, Q.; Li, Z.; Li, J.; Zhan, F.; Zhai, D.; Sun, Q.; Xiao, Z.; Luo, H.; Zhang, D. Three Dimensional BaTiO3 Piezoelectric Ceramics Coated with TiO2 Nanoarray for High Performance of Piezo-Photoelectric Catalysis. Nano Energy 2022, 98, 107267. [Google Scholar] [CrossRef]
- Long, X.; Tan, H.; Sánchez, F.; Fina, I.; Fontcuberta, J. Disentangling Electronic and Thermal Contributions to Light-Induced Resistance Switching in BaTiO3 Ferroelectric Tunnel Junction. J. Appl. Phys. 2022, 132, 214103. [Google Scholar] [CrossRef]
- Fakhar-e-Alam, M.; Saddique, S.; Hossain, N.; Shahzad, A.; Ullah, I.; Sohail, A.; Khan, M.J.I.; Saadullah, M. Synthesis, Characterization, and Application of BaTiO3 Nanoparticles for Anti-Cancer Activity. J. Clust. Sci. 2023, 34, 1745–1755. [Google Scholar] [CrossRef]
- Cho, Y.; Jeong, J.; Choi, M.; Baek, G.; Park, S.; Choi, H.; Ahn, S.; Cha, S.; Kim, T.; Kang, D.-S.; et al. BaTiO3@PVDF-TrFE Nanocomposites with Efficient Orientation Prepared via Phase Separation Nano-Coating Method for Piezoelectric Performance Improvement and Application to 3D-PENG. Chem. Eng. J. 2022, 427, 131030. [Google Scholar] [CrossRef]
- Shihab, N.K.; Acharyya, J.N.; Rasi, U.P.M.; Gangineni, R.B.; Lakshmi, P.A.; Prakash, G.V.; Rao, D.N. Nonlinear Optical Absorption Switching Behavior of BaTiO3 in Asymmetric Microcavity. Opt. Mater. 2020, 101, 109777. [Google Scholar] [CrossRef]
- Varghese, O.K.; Grimes, C.A. Appropriate Strategies for Determining the Photoconversion Efficiency of Water Photoelectrolysis Cells: A Review with Examples Using Titania Nanotube Array Photoanodes. Sol. Energy Mater. Sol. Cells 2008, 92, 374–384. [Google Scholar] [CrossRef]
- Navidpour, A.H.; Abbasi, S.; Li, D.; Mojiri, A.; Zhou, J.L. Investigation of advanced oxidation process in the presence of TiO2 semiconductor as photocatalyst: Property, principle, kinetic analysis, and photocatalytic activity. Catalysts 2023, 13, 232. [Google Scholar] [CrossRef]
- Patel, M.; Hemanth, N.R.; Gosai, J.; Mohili, R.; Solanki, A.; Roy, M.; Chaudhari, N.K. MXenes: Promising 2D memristor materials for neuromorphic computing components. Trends Chem. 2022, 4, 835–849. [Google Scholar] [CrossRef]
- Park, S.; Spetzler, B.; Ivanov, T.; Ziegler, M. Multilayer redox-based HfOx/Al2O3/TiO2 memristive structures for neuromorphic computing. Sci. Rep. 2022, 12, 18266. [Google Scholar] [CrossRef] [PubMed]
- Savchuk, T.; Gavrilin, I.; Savitskiy, A.; Dronov, A.; Dronova, D.; Pereverzeva, S.; Tarhanov, A.; Maniecki, T.; Gavrilov, S.; Konstantinova, E. Effect of Thermal Treatment of Symmetric TiO2 Nanotube Arrays in Argon on Photocatalytic CO2 Conversion. Symmetry 2022, 14, 2678. [Google Scholar] [CrossRef]
- Roy, P.; Berger, S.; Schmuki, P. TiO2 nanotubes: Synthesis and applications. Angew. Chem. Int. Ed. 2011, 50, 2904–2939. [Google Scholar] [CrossRef] [PubMed]
- Savchuk, T.; Gavrilin, I.; Konstantinova, E.; Dronov, A.; Volkov, R.; Borgardt, N.; Zaitsev, V. Anodic TiO2 nanotube arrays for photocatalytic CO2 conversion: Comparative photocatalysis and EPR study. Nanotechnology 2021, 33, 055706. [Google Scholar] [CrossRef] [PubMed]
- Opra, D.P.; Sokolov, A.A.; Sinebryukhov, S.L.; Tkachenko, I.A.; Ziatdinov, A.M.; Gnedenkov, S.V. Electronic Structure, Optical and Magnetic Properties of Oxygen-Deficient Gray TiO2–δ (B). Inorganics 2022, 10, 184. [Google Scholar] [CrossRef]
- Kytina, E.V.; Savchuk, T.P.; Gavrilin, I.M.; Konstantinova, E.A. Photoinduced Dynamics of Spin Centers in Carbon-Modified Titanium Dioxide Nanotubes. Russ. J. Inorg. Chem. 2023, 1, 6. [Google Scholar] [CrossRef]
- Ivanovskaya, M.; Chernyakova, K.; Ovodok, E.; Poznyak, S.K.; Kotsikau, D.; Azarko, I.I. Nature of Paramagnetic Defects in Black Titanium Dioxide Nanotubes. Mater. Chem. Phys. 2022, 278, 125703. [Google Scholar] [CrossRef]
- Konstantinova, E.; Savchuk, T.; Pinchuk, O.; Kytina, E.; Ivanova, E.; Volkova, L.; Elizarova, E. Photoelectron Properties and Organic Molecules Photodegradation Activity of Titania Nanotubes with CuxO Nanoparticles Heat Treated in Air and Argon. Molecules 2022, 27, 8080. [Google Scholar] [CrossRef]
- Li, Z.; Wang, S.; Wu, J.; Zhou, W. Recent progress in defective TiO2 photocatalysts for energy and environmental applications. Renew. Sustain. Energy Rev. 2022, 156, 111980. [Google Scholar] [CrossRef]
- Barrocas, B.T.; Ambrožová, N.; Kočí, K. Photocatalytic reduction of carbon dioxide on TiO2 heterojunction photocatalysts—A review. Materials 2022, 15, 967. [Google Scholar] [CrossRef]
- Lettieri, S.; Pavone, M.; Fioravanti, A.; Santamaria Amato, L.; Maddalena, P. Charge carrier processes and optical properties in TiO2 and TiO2-based heterojunction photocatalysts: A review. Materials 2021, 14, 1645. [Google Scholar] [CrossRef] [PubMed]
- Rawat, J.; Rawat, S.; Juyal, A.; Sharma, H.; Dwivedi, C. Enhancing electrochemical properties of TiO2 nanotube by incorporation of CdSe quantum dots. J. Nanopart. Res. 2023, 25, 82. [Google Scholar] [CrossRef]
- Wang, S.; Yu, C.; Chen, X.; Zhang, K.; Gao, H.; Yu, X.; Zhang, J. Synthesis and characterization of BaTiO3/TiO2 heterojunction photocatalyst for novel application in photocatalytic degradation of TBBPA under simulated sunlight irradiation. ChemistrySelect 2022, 7, e202202764. [Google Scholar] [CrossRef]
- Shcherbina, N.A.; Kazakov, I.V.; Timoshkin, A.Y. Synthesis and Characterization of Barium Amidoborane. Russ. J. Gen. Chem. 2017, 87, 2875–2877. [Google Scholar] [CrossRef]
- Hu, X.; Lu, P.; He, Y.; Wang, C.; Chen, J.; Fu, M. Anionic/cationic synergistic action of insulator BaCO3 enhanced the photocatalytic activities of graphitic carbon nitride. Appl. Surf. Sci. 2020, 528, 146924. [Google Scholar] [CrossRef]
- Vijayalakshmi, R.; Rajendran, V. Synthesis of BaTiO3 and Evaluation of Optical Properties. AZo J. Mater. Online 2010, 6. [Google Scholar] [CrossRef]
- Gavrilin, I.; Dronov, A.; Volkov, R.; Savchuk, T.; Dronova, D.; Borgardt, N.; Gromov, D. Differences in the local structure and composition of anodic TiO2 nanotubes annealed in vacuum and air. Appl. Surf. Sci. 2020, 516, 146120. [Google Scholar] [CrossRef]
- Yanagisawa, K.; Ovenstone, J. Crystallization of Anatase from Amorphous Titania Using the Hydrothermal Technique: Effects of Starting Material and Temperature. J. Phys. Chem. B 1999, 103, 7781–7787. [Google Scholar] [CrossRef]
- Su, W.; Zhang, J.; Feng, Z.; Chen, T.; Ying, P.; Li, C. Surface Phases of TiO2 Nanoparticles Studied by UV Raman Spectroscopy and FT-IR Spectroscopy. J. Phys. Chem. C 2008, 112, 7710–7716. [Google Scholar] [CrossRef]
- Appadurai, T.; Subramaniyam, C.; Kuppusamy, R.; Karazhanov, S.; Subramanian, B. Electrochemical Performance of Nitrogen-Doped TiO2 Nanotubes as Electrode Material for Supercapacitor and Li-Ion Battery. Molecules 2019, 24, 2952. [Google Scholar] [CrossRef]
- Dobal, P.S.; Dixit, A.; Katiyar, R.S.; Yu, Z.; Guo, R.; Bhalla, A.S. Micro-Raman Scattering and Dielectric Investigations of Phase Transition Behavior in the BaTiO3–BaZrO3 System. J. Appl. Phys. 2001, 89, 8085–8091. [Google Scholar] [CrossRef]
- Wada, S.; Suzuki, T.; Osada, M.; Kakihana, M.; Noma, T. Change of Macroscopic and Microscopic Symmetry of Barium Titanate Single Crystal around Curie Temperature. Jpn. J. Appl. Phys. 1998, 37, 5385. [Google Scholar] [CrossRef]
- Perry, C.H.; Hall, D.B. Temperature Dependence of the Raman Spectrum of BaTiO3. Phys. Rev. Lett. 1965, 15, 700–702. [Google Scholar] [CrossRef]
- Busca, G.; Ramis, G.; Amores, J.M.G.; Escribano, V.S.; Piaggio, P. FT Raman and FTIR Studies of Titanias and Metatitanate Powders. J. Chem. Soc. Faraday Trans. 1994, 90, 3181. [Google Scholar] [CrossRef]
- Busca, G.; Buscaglia, V.; Leoni, M.; Nanni, P. Solid-State and Surface Spectroscopic Characterization of BaTiO3 Fine Powders. Chem. Mater. 1994, 6, 955–961. [Google Scholar] [CrossRef]
- Robins, L.H.; Kaiser, D.L.; Rotter, L.D.; Schenck, P.K.; Stauf, G.T.; Rytz, D. Investigation of the Structure of Barium Titanate Thin Films by Raman Spectroscopy. J. Appl. Phys. 1994, 76, 7487–7498. [Google Scholar] [CrossRef]
- Smith, M.B.; Page, K.; Siegrist, T.; Redmond, P.L.; Walter, E.C.; Seshadri, R.; Brus, L.E.; Steigerwald, M.L. Crystal Structure and the Paraelectric-to-Ferroelectric Phase Transition of Nanoscale BaTiO3. J. Am. Chem. Soc. 2008, 130, 6955–6963. [Google Scholar] [CrossRef]
- Shiratori, Y.; Pithan, C.; Dornseiffer, J.; Waser, R. Raman Scattering Studies on Nanocrystalline BaTiO3 Part I—Isolated Particles and Aggregates. J. Raman Spectrosc. 2007, 38, 1288–1299. [Google Scholar] [CrossRef]
- Yuzyuk, Y.I. Raman Scattering Spectra of Ceramics, Films, and Superlattices of Ferroelectric Perovskites: A Review. Phys. Solid State 2012, 54, 1026–1059. [Google Scholar] [CrossRef]
- Boulos, M.; Guillemetfritsch, S.; Mathieu, F.; Durand, B.; Lebey, T.; Bley, V. Hydrothermal Synthesis of Nanosized BaTiO3 Powders and Dielectric Properties of Corresponding Ceramics. Solid State Ion. 2005, 176, 1301–1309. [Google Scholar] [CrossRef]
- Xiao, C.J.; Chi, Z.H.; Zhang, W.W.; Li, F.Y.; Feng, S.M.; Jin, C.Q.; Wang, X.H.; Deng, X.Y.; Li, L.T. The Phase Transitions and Ferroelectric Behavior of Dense Nanocrystalline BaTiO3 Ceramics Fabricated by Pressure Assisted Sintering. J. Phys. Chem. Solids 2007, 68, 311–314. [Google Scholar] [CrossRef]
- Lazarević, Z.; Romčević, N.; Vijatović, M.; Paunović, N.; Romčević, M.; Stojanović, B.; Dohčević-Mitrović, Z. Characterization of Barium Titanate Ceramic Powders by Raman Spectroscopy. Acta Phys. Pol. A 2009, 115, 808–810. [Google Scholar] [CrossRef]
- Wu, X.; Chen, Z.; Cui, Z. Low Temperature Synthesis of Cubic BaTiO3 Nanoparticles. In Proceedings of the The 8th Annual IEEE International Conference on Nano/Micro Engineered and Molecular Systems, Suzhou, China, 7–10 April 2013; pp. 399–402. [Google Scholar]
- Singh, M.; Yadav, B.C.; Ranjan, A.; Kaur, M.; Gupta, S.K. Synthesis and Characterization of Perovskite Barium Titanate Thin Film and Its Application as LPG Sensor. Sens. Actuators B Chem. 2017, 241, 1170–1178. [Google Scholar] [CrossRef]
- Yuan, Y.; Zhang, S.R.; Zhou, X.H.; Tang, B.; Li, B. High-Temperature Capacitor Materials Based on Modified BaTiO3. J. Electron. Mater. 2009, 38, 706–710. [Google Scholar] [CrossRef]
- Venkateswaran, U.D.; Naik, V.M.; Naik, R. High-Pressure Raman Studies of Polycrystalline BaTiO3. Phys. Rev0 B 1998, 58, 14256–14260. [Google Scholar] [CrossRef]
- Madhan, K.; Thiyagarajan, R.; Jagadeeshwaran, C.; Paul Blessington Selvadurai, A.; Pazhanivelu, V.; Aravinth, K.; Yang, W.; Murugaraj, R. Investigations on the Phase Transition of Mn-Doped BaTiO3 Multifunctional Ferroelectric Ceramics through Raman, Dielectric, and Magnetic Studies. J. Solgel Sci. Technol. 2018, 88, 584–592. [Google Scholar] [CrossRef]
- Yang, M.; Huang, D.; Hao, P.; Zhang, F.; Hou, X.; Wang, X. Study of the Raman Peak Shift and the Linewidth of Light-Emitting Porous Silicon. J. Appl. Phys. 1994, 75, 651–653. [Google Scholar] [CrossRef]
- Campbell, I.H.; Fauchet, P.M. The Effects of Microcrystal Size and Shape on the One Phonon Raman Spectra of Crystalline Semiconductors. Solid State Commun. 1986, 58, 739–741. [Google Scholar] [CrossRef]
- Parker, J.C.; Siegel, R.W. Calibration of the Raman Spectrum to the Oxygen Stoichiometry of Nanophase TiO2. Appl. Phys. Lett. 1990, 57, 943–945. [Google Scholar] [CrossRef]
- Chen, S.; Xiao, Y.; Wang, Y.; Hu, Z.; Zhao, H.; Xie, W. A Facile Approach to Prepare Black TiO2 with Oxygen Vacancy for Enhancing Photocatalytic Activity. Nanomaterials 2018, 8, 245. [Google Scholar] [CrossRef]
- Wang, J.; Zhu, W.; Zhang, Y.; Liu, S. An Efficient Two-Step Technique for Nitrogen-Doped Titanium Dioxide Synthesizing: Visible-Light-Induced Photodecomposition of Methylene Blue. J. Phys. Chem. C 2007, 111, 1010–1014. [Google Scholar] [CrossRef]
- Tang, H.; Prasad, K.; Sanjines, R.; Schmid, P.E.; Levy, F. Electrical and optical properties of TiO2 anatase thin films. Appl. Phys. 1994, 75, 2042–2047. [Google Scholar] [CrossRef]
- Byung-Hyun, K.; Mina, P.; Gyubong, K.; Hermansson, K.; Broqvist, P.; Heon-Jin, C.; Kwang-Ryeol, L. Indirect-to-Direct Band Gap Transition of Nanosheets: Effect of Biaxial Strain. J. Phys. Chem. C 2018, 122, 15297–15303. [Google Scholar] [CrossRef]
- Suzuki, K.; Kijima, K. Optical Band Gap of Barium Titanate Nanoparticles Prepared by RF-Plasma Chemical Vapor Deposition. Jpn. J. Appl. Phys. 2005, 44, 2081. [Google Scholar] [CrossRef]
- Kuzmenko, A.P.; Chukhaeva, I.V.; Abakumov, P.V. Features of the Formation and Structure of Barium Titanate Langmuir Films. Tech. Phys. 2019, 64, 1168–1177. [Google Scholar] [CrossRef]
- Brzozowski, E.; Castro, M.S. Grain growth control in Nb-doped BaTiO3. J. Mater. Process. Technol. 2005, 168, 464–470. [Google Scholar] [CrossRef]
- Da-Yong Lu, D.-Y.; Guan, D.-X. Photoluminescence associated with the site occupations of Ho3+ ions in BaTiO3. Sci. Rep. 2017, 7, 6125. [Google Scholar] [CrossRef]


| 0 h | 3 h | 6 h | 9 h | |
|---|---|---|---|---|
| C. at.% | 6.3 | 15.6 | 14.6 | 14.0 |
| N. at.% | 2.1 | 6.7 | 7.8 | 6.9 |
| O. at.% | 61 | 46.6 | 45.6 | 44.1 |
| F. at.% | 0.7 | 0.8 | 0.8 | 0.7 |
| Ba. at.% | 0.0 | 19.1 | 19.6 | 20.7 |
| Ti. at.% | 29.8 | 11.1 | 11.6 | 13.5 |
| BaTiO3 (Cubic) | TiO2 (Anatase) | Ti (Foil) | |||
|---|---|---|---|---|---|
| 2θ, ° | hkl | 2θ, ° | hkl | 2θ, ° | hkl |
| 22.2 | (100) | 25.4 | (101) | 38.4 | (002) |
| 31.6 | (101) | 37.3 | (103) | 40.3 | (101) |
| 38.8 | (111) | 37.8 | (004) | 53.3 | (102) |
| 45.1 | (200) | 47.8 | (200) | 70.5 | (103) |
| 50.7 | (210) | 53.9 | (105) | 76.5 | (112) |
| 56.3 | (211) | 55.1 | (211) | ||
| 65.7 | (220) | 62.3 | (204) | BaCO3 | |
| 79.0 | (311) | 68.6 | (116) | 24.0 | (111) |
| Samples | Eg, eV |
|---|---|
| Pure TiO2-NT | 3.20 |
| Processed within 3 h | 3.37 |
| Processed within 6 h | 3.37 |
| Processed within 9 h | 3.31 |
Disclaimer/Publisher’s Note: The statements, opinions and data contained in all publications are solely those of the individual author(s) and contributor(s) and not of MDPI and/or the editor(s). MDPI and/or the editor(s) disclaim responsibility for any injury to people or property resulting from any ideas, methods, instructions or products referred to in the content. |
© 2023 by the authors. Licensee MDPI, Basel, Switzerland. This article is an open access article distributed under the terms and conditions of the Creative Commons Attribution (CC BY) license (https://creativecommons.org/licenses/by/4.0/).
Share and Cite
Konstantinova, E.; Zaitsev, V.; Kytina, E.; Martyshov, M.; Savchuk, T.; Butmanov, D.; Dronova, D.; Krupanova, D.; Volkova, L.; Tarasov, A. Asymmetry of Structural and Electrophysical Properties of Symmetrical Titania Nanotubes as a Result of Modification with Barium Titanate. Symmetry 2023, 15, 2141. https://doi.org/10.3390/sym15122141
Konstantinova E, Zaitsev V, Kytina E, Martyshov M, Savchuk T, Butmanov D, Dronova D, Krupanova D, Volkova L, Tarasov A. Asymmetry of Structural and Electrophysical Properties of Symmetrical Titania Nanotubes as a Result of Modification with Barium Titanate. Symmetry. 2023; 15(12):2141. https://doi.org/10.3390/sym15122141
Chicago/Turabian StyleKonstantinova, Elizaveta, Vladimir Zaitsev, Ekaterina Kytina, Mikhail Martyshov, Timofey Savchuk, Danil Butmanov, Daria Dronova, Daria Krupanova, Lidiya Volkova, and Andrey Tarasov. 2023. "Asymmetry of Structural and Electrophysical Properties of Symmetrical Titania Nanotubes as a Result of Modification with Barium Titanate" Symmetry 15, no. 12: 2141. https://doi.org/10.3390/sym15122141